cssri.org 6...issn 0976-0806 journal of soil salinity and water quality volume 6 2014 number 1...
TRANSCRIPT

ISSN 0976-0806
Journal of Soil Salinity and Water Quality
Volume 6 2014 Number 1
CONTENTS
1. Soil Fertility Constraint Assessment Using Spatial Nutrient Map at Three Selected Villages … 1-8of Coastal SundarbansTarik Mitran, Pabitra Kumar Mani, Nirmalendu Basak, Biswapati Mandal andSubrata Kumar Mukhopadhyay
2. Ground Water Recharge and its Effective Use Through Micro-irrigation for Crop … 9-15Production in Coastal GujaratG. Gururaja Rao, Sanjay Arora, Anil R. Chinchmalatpure, M.K. Khandelwal,S.K. Kamra and D.K. Sharma
3. Phytoremediation of Brass and Electroplating Industry Effluent through Eichornia crassipes … 16-20Rama Pal, J.P.N. Rai and S.K. Dubey
4. Grouping of Advanced Rice Breeding Lines Based on Grain Yield and Na:K Ratio … 21-27under Alkaline ConditionsY.P. Singh, Dhananjaya Singh and S.L. Krishnamurthy
5. Productive Utilization of Sodic Water for Aquaculture-led Integrated Farming System: … 28-35A Case StudyS.K. Singh, Ranbir Singh, S. Kumar, Bhaskar Narjary, S.K. Kamra and D.K. Sharma
6. Water Management and Usage of Nallamada Drain Water – A Quantitative Assessment … 36-41A. Sambaiah, G.V. Lakshmi, M. Raghu Babu, K. Hema and M. Latha
7. Effect of Salinity on Genetic Architecture of Fruit Yield and Its Contributing Traits in … 42-51Tomato (Lycopersicon esculentum Mill.)Jogendra Singh, E.V.D. Sastry and Vijayata Singh
8. Performance of Fennel (Foeniculum vulgare Mill.) as Influenced by Saline Water Irrigation … 52-58and Organic Input Management in Semi-arid ConditionsR.L. Meena, S.K. Ambast, S.K. Gupta, Anil R. Chinchmalatpure and D.K. Sharma
9. Impact of FYM and Potassium Interactions on Potato Yield Cultivated on Moderate … 59-63Saline SoilsSharif Ahamad, J.C. Dagar and D. Mani
10. Distribution and Characteristics of Salt-affected Soils of Morena District of … 64-69Madhya PradeshY.P. Singh, S.K. Verma, S.K. Dubey and S.C. Tiwari


Soil Fertility Constraint Assessment Using Spatial NutrientMap at Three Selected Villages of Coastal Sundarbans
Tarik Mitran*1, Pabitra Kumar Mani1, Nirmalendu Basak1, Biswapati Mandal1
and Subrata Kumar Mukhopadhyay 2
1Directorate of Research, Bidhan Chandra Krishi Viswavidyalaya, Kalyani-741 252, Nadia, West Bengal, India2National Bureau of Soil Survey and Land Use Planning (NBSS&LUP), Kolkata-700 091, West Bengal, India
*Email: [email protected]
Abstract
Soil fertility constrains were studied in three representative villages i.e. Tushkhali, Duchnikhali and Korakatiwith collecting and interpreting a large number of geo-referenced soil samples of Sundarbans. The GlobalPositioning System (GPS) based soil reaction, salinity and nutrient maps were prepared by Inverse DistanceWeighted (IDW) spatial interpolation method using ArcGIS Ver. 10 software. Soils were mostly heavy in texture(clay > 50%), highly acidic to neutral in reaction and associated with marginal salinity. Although an extremeacidity (< 4.8) or higher salinity level > 4.0 dS m-1 was detected in some of the pockets. Among the threevillages, Tushkhali showed comparatively higher electrical conductivity (EC) with highest value of 5.23 dS m-1.There was a decreasing trend in EC recorded with higher level of organic C with irrespective of sampling sites.On an average, organic C of the studied area was medium to high in nature. Soils were poor in availablenitrogen and medium to low in available P and Zn. Higher availability status of K, Mn, Cu, Fe and S werefound in such soils. Nutrient Index values for all the studied plant nutrients were generated. These valuesrevealed that area is poor in available N; medium in available P and Zn but the native supply of available K, Sand micronutrients are in much pronounced. The available N, P and Zn contents significantly increased withincrease in organic C of soil.
Key words: Acid soil, ArcGIS, Salinity, Soil fertility, Spatial nutrient map, Sundarbans
Introduction
Coastal regions, home to a large and growingproportion of the world’s population, are undergoingenvironmental decline. The problem is particularly acutein developing countries. The reasons for environmentaldecline are complex, but population factors play asignificant role. Today, approximately 3 billion people-about half of the world’s population live within 200kilometres of a coastline. By 2025, figure is likely to bedouble. The Coastal agro-ecosystem occupies vast areaof land in India. About 20% of the population of Indialives in coastal areas. In coastal areas of India, salt affectedsoils stand to be one major challenge in preventingagricultural activities. On global basis salt affected soilsoccupy an estimated area of 952 million ha, nearly 7%of total land area or approximately 33% of the potentialarable land area of the world (Szabolcs, 1979). In India,out of an estimated area of 187.7 million hectares of totaldegraded land, 9.38 million hectares are salt affected soil
(Dagar, 2005) and out of which 3.1 million hectares arein the coastal region (Yadav et al., 1983). Among the statesin India, West Bengal has the largest area (0.82 millionhectares) of the salt affected soils in the coastal region,between 87º25' E and 89º.0' E latitude and longitude21º30' N and 23º15' N covering the district of North andSouth 24-Parganas, Howrah and East Midnapore. Thegreat Sundarbans, the delta region of the river Ganges,occur in the coastal tracts of North and South 24-Parganasconstitute a major portion of coastal region of India withwide variability in climatic, topographical and edaphicconditions. The climate is typical tropical with widevariation in the annual rainfall from 300-3000 mm. Therainfall is mainly concentrated during the South-Westmonsoon from June to September when more than 80%of the rainfall is experienced in the region. The rainfall inthe rest of the period of the year is meagre. Beside thatthe entire area of Sundarbans faces the problem of salinity,waterlogging and drainage congestion. In the absence ofupland water supply the area is exposed to tidal actionmaking the water highly brackish. The soil salinity showswide spatial and seasonal variability, being minimum inthe monsoon season and maximum in the summer season(Bandyopadhyay et al., 2001). The degraded soil and water
Journal of Soil Salinity and Water Quality 6(1), 1-8, 2014
*Corresponding author, Present address: Soil and LandResources Assessment Division, Land Resources, Land useMapping and Monitoring Group, National Remote SensingCentre, Hyderabad, India

2 Mitran et al.
quality together with climatic adversities like cyclone,tsunami, heavy rains, flood etc. contributed to the poorlivelihood security and low agricultural productivity ofthe area. The coastal area is generally mono-cropped withonly rice during the monsoon season. In this region, soilsalinity, imbalance of nutrients, unfavourable pH, lackof good quality irrigation water etc. account for pooryields of crops (Sen and Bandyopadhyay, 2001). Due topresence of brackish water table at a shallow depth thereis always an increase in soil and water salinity in drymonths. The land remains almost fallow throughout theyear after Kharif season (wet season, July-October).During the remaining part of the year (Rabi and Summer),90% of the land remains fallow due to soil and watersalinity and lack of good quality irrigation water. Thus,continuous cropping of the land by almost a single cropalong with non-scientific fertility management has resultedin low soil productivity. A suitable soil managementstrategy is, therefore, required to mitigate the ill effects ofdegraded coastal land for sustained productivity byidentifying the constrains. The present study hasundertaken to make an inventory of nutrients status ofsuch coastal soils to identify the fertility constraints bypreparing spatial nutrient map as Global PositioningSystem (GPS) and Geo-graphical Information System(GIS) help in collecting a systematic set of georeferencedsamples and generating spatial data regarding distributionof nutrients.
Materials and Methods
A total of 150 GPS based soil samples (0-20 cmdepth) containing 50 samples each from the representativevillages such as Tushkhali, Duchnikhali and Korakati of(22°22′ N latitude and 88°54′ E, Longitude) Sandeshkhali-II, North-24-Parganas, West Bengal, were collected duringthe peak summer month during May 2011.
Particle size distributions of the soils were determinedfollowing the Boyoucous hydrometer method (Gee andBouder, 1986). Bulk density was determined by coresampler method following the method of Blake andHartge (1986). The pH of the soil was determined in 1:2.5:: soil: water and 0.02 M CaCl2 solution, respectivelysuspension, by using digital pH meter described byJackson (1973). Electrical conductivity of the soilsaturation extract was determined at room temperaturein a soil water suspension ratio of 1:2.5 with the help ofWheatstone Conductivity Bridge as described by Jackson(1973). Organic C in soil was determined by methodsdescribe by Nelson and Sommers (1982). Estimation ofAvailable N was done by alkaline permanganate method(Subbiah and Asija, 1956). Available phosphorus in soilwas determined calorimetrically following ascorbic acidreluctant method as outlined by Bray and Kurtz (1945).Available potassium of the soil samples was extracted withneutral 1N ammonium acetate solution followed bymeasured by a Flame Photometer as described by Jackson
Fig. 1. Location of the study area
Fig. 2. Location of the observation sites at different villages ofSandeshkhali-II

Soil Fertility Constraint Assessment Using Spatial Nutrient Map 3
(1973). The available DTPA extractable Fe, Mn, Zn andCu of the soil samples were estimated using atomicabsorption spectrophotometer (AAS) following themethod of Lindsay and Norvell (1978). Available sulphur(S) was estimated by turbidmetrically barium chlorideprocedure as described by Chesnin and Yien (1951).Nutrient index values (NIV) calculated from theproportion of soils under low, medium and high availablenutrient categories, as represented by the followingexpression:
Where, NIV is nutrient index value., Nl, Nm and Nh arethe number of soil samples falling in the category of low,medium and high nutrient status and are given weightageof 1, 2 and 3, respectively. Accordingly, areas with nutrientindex value > 2.33 could be considered high, those withNIV between 1.34 and 2.33 or 1.51-2.50 could beconsidered medium, and those with values < 1.5 or <1.33 could be regarded low in native supply of thatnutrient.
Spatial soil nutrient maps were prepared by inversedistance weighted (IDW) interpolation method availablein the sub-mode of interpolation in the spatial analysttools of ArcGIS Ver. 10 by using a linearly weightedcombination of a set of sample points. The IDW methodfor spatial interpolation estimates values of cells byweighting of values (point) of geometric data in theneighbourhood of each processed cell. The points locatedcloser to the cell center have more influence or weight inthe process of weighting. Soil fertility levels were classifiedinto low, medium, or high categories according to existingnorms (Ali, 2005) used for nutrient indexing andpreparation of nutrients map. Ranges of soil salinity (EC),pH and organic C are depicted in Fundamentals of SoilScience (ISSS, 2009) used for map preparation. Simplecorrelation coefficients and regression analysis wereperformed by the windows based SPSS program (ver. 16.0,SPSS Inc.).
Results and Discussion
Physico-chemical properties of soils
The soils were mostly heavy in texture with high claycontent generally more than 50% (Table 1). The claycontent varied marginally from 50.7 to 66.1% that mightbe due to the origin of soil, parent materials and soilvariability. The textural compositions of soils underdifferent villages were more or less similar and fall underclayey class. These finding was corroborated withBandyopadhyay et al. (1998) and Maji et al. (1998) whoreported that coastal soils are mostly heavy textured andvary widely from place to place depending on theirphysiographic locations, climatic conditions and soilparent materials. Among representative villages, bulk Tab
le 1
. P
hysi
co-c
hem
ical
cha
ract
eris
tics
of
soils
Site
sSa
ndSi
ltC
lay
Bul
kpH
WpH
Ca
EC
2.5
Org
anic
Av.
NA
v. P
Av.
KA
v. S
Av.
Fe
Av.
Mn
Av.
Zn
Av.
Cu
%de
nsity
1:2
.5dS
m-1
Ckg
ha-1
mg
kg-1
M
g m
-3g
kg-1
Tus
hkha
li (n
= 5
0)R
ange
3.3-
13.2
28.0
-38.
054
.7-6
2.7
1.26
-1.3
64.
36-7
.53
4.06
-7.1
91.
12-5
.23
4.5-
9.8
104.
5-28
6.4
10.1
-28.
530
3.4-
682.
010
.2-4
6.2
14.1
-87.
88.
36-3
8.2
0.44
-3.6
13.
35-9
.81
Mea
n+SE
m (±
)8.
0±3.
234
.0±
3.7
58.0
±2.
51.
3±0.
035.
54±
0.93
5.25
±0.
913.
16±
1.02
7.3±
1.6
193.
0±52
.717
.3±
4.64
496.
0±94
.221
.3±
8.1
56.5
±21
.320
.9±
8.32
1.4±
0.47
7.1±
1.62
Duc
hnik
hali
(n=
50)
Ran
ge1.
3-13
.326
.4-3
8.0
50.7
-61.
31.
22-1
.36
5.16
-7.1
54.
82-6
.88
1.04
-4.8
92.
1-10
.590
.5-3
23.4
9.6-
27.4
337.
3-66
5.3
10.7
-38.
17.
04-1
24.5
10.9
-42.
20.
56-2
.27
3.5-
9.39
Mea
n+SE
m (±
)9.
0±3.
833
.0±
3.9
58.4
±2.
51.
29±
0.04
6.06
±0.
465.
67±
0.42
2.84
±0.
958.
0±2.
020
8.6±
65.9
19.2
±4.
8654
9.5±
87.8
25.4
±7.
1759
.3±
7.9.
023
.7±
7.38
1.31
±0.
446.
75±
1.37
Kor
akat
i (n=
50)
Ran
ge5.
3-13
.322
.6-3
7.0
52.7
-66.
11.
23-1
.31
4.85
-7.5
84.
65-7
.26
1.1-
4.3
2.8-
9.7
98.3
-330
.98.
8-28
.835
7.1-
709.
110
.1-4
4.2
8.5-
163.
45.
20-3
8.3
0.18
-3.1
82.
9-9.
35M
ean+
SEm
(±)
9.0±
3.3
32.0
±4.
059
.0±
3.6
1.27
±0.
035.
85±
0.75
5.47
±0.
742.
92±
0.90
7.4±
1.9
192.
5±74
.318
.1±
4.65
562.
9±89
.425
.5±
9.05
79.0
0±41
.61
22.8
±8.
421.
76±
0.88
7.06
±1.
49

4 Mitran et al.
densities of the soils under Korakati village werecomparatively lower than the others; this might be due tothe marginally higher clay and organic matter content ofsuch soils. It was found from the correlation study thatthe bulk density was negatively correlated with bothorganic carbon (r= -0.071; p <0.05) and clay content (r=-0.024; p <0.05) under the studied soil. Gulser (2006) andHillel (1998) reported that bulk density had significantnegative correlation with soil organic matter as organicmatter is generally lowers in density. The soil reactionsof the studied areas were highly acidic to neutral in nature.These results are in agreement with Sarkar et al. (2001)who reported the pH of the soils of the Sunderbans deltaranged from 5.3 to 8.1. However, an extreme acidity (pH< 4.8) was observed in some pockets of studied villages,might be due to the occurrence of acid sulphate soils.Kalyan and Sarkar (2009) also reported on nature ofacidity of some coastal acid soils of Sunderbans of WestBengal and found that the soils under study wereextremely acidic in reactions having pH value marginallyabove 4.0. Highly acidic soils with abundance ofappreciable amount of sulphate at surface/ sub-surfacesoil horizons were reported in Coastal areas of Kerala,West Bengal, Orissa and Andaman and Nicobar groupof Islands (Bandyopadhyay and Bandyopadhyay, 1984;Bandyopadhyay and Maji, 1995). Among the threevillages, Tushkhali showed comparatively higher EC withhighest value of 5.23 dS m-1 whereas a lowest value of
EC ~1.04 dS m-1 was detected in soils under Duchnikhalivillage. Some locations showed higher salinity level > 4.0dS m-1 indicated critical condition for crop cultivation.On an average the studied area was marginally saline tosaline in nature. However, a decreasing trend in EC hadrecorded with increment in level of organic C irrespectiveto the sampling sites (Table 2). The correlation studyshowed that EC is negatively correlated with the organicC (r= -0.594; p <0.01). This might be due to the fact thatcarbon content improves soil physical properties i.e. soilstructure, permeability, infiltration rate etc; whichfacilitates the leaching and drainage of soluble salts.Tripathi et al. (2006) reported that the organic C contentof soil decreased by increasing salinity (r= -0.38; p <0.01).Kaur et al. (1998) also reported significant negativerelationship between organic C and EC. It is documentedthat EC of coastal soils of West Bengal mostly variedfrom 0.5 dS m-1 during monsoon to 50 dS m-1; duringsummer months. Bandyopadhyay et al. (1988, 2003) alsoreported similar salinity pattern in coastal areas.. Kalyanand Sarkar (2009) reported that EC of some coastal acidsoils of Sunderbans of West Bengal was high and variedfrom 1.9 to 3.9 d Sm-1. On an average the organic C ofthe studied area was medium to high in nature. However,among the sites soil samples from Duchnikhali showedcomparatively higher organic C compared to others. Theorganic C in the coastal soils are relatively high compared
Fig. 3. Spatial soil reaction (pH) Map of the studied area Fig. 4. Spatial soil salinity (EC dS m-1) Map of the studied area

Soil Fertility Constraint Assessment Using Spatial Nutrient Map 5
with that in similar types of soils located in identicalclimatic zones in non-coastal regions of India(Bandyopadhyay and Bandyopadhyay, 1983). Joshi andKadrekar (1987) reported that organic C in the coastalsoils varied from < 0.5% to > 0.75%. However, we foundlow organic C in some pockets. Available nitrogen contentof the studied sites did not varied significantly. On an averagethe studied area was low in available nitrogen (Fig. 6).
The observed result detected a higher availability ofN in soil is usually associated with the higher level oforganic C (r= 0.776; p <0.01). Mineralization of organicmatter may release plant available N in soil. The availablephosphorus content of the studied soils was low tomedium in range. Soils were high in available potassiumcontent. The available sulphur content under different siteswas more or less similar. The highest value (46.2 mg kg-1)was associated with the soil samples collected fromTushkhali, where the lowest (10.1 kg ha-1) was recordedin soils collected from Korakati. On an average theavailable S content of the studied area was medium tohigh. The available Zn content of soil under different siteswas more or less similar. However, higher Zn content wasrecorded with the samples collected from Korakati.Analytical values described that studied areas weremedium to low in available Zn (Fig. 7). The available Mn
content of the soils under Duchnikhali and Korakati didnot significantly differed and more or less similar; whereas,available Mn content of the soil samples collected fromTushkhali were medium in range (Fig. 8). This might bedue to the lower pH of soils in Tushkhali compared toDuchnikhali and Korakati. Available Cu content of thesoils in different sites did not differed significantly andwas high in status. From the correlation matrix it wasobserved that pH was negatively correlated with availableZn (r = -0.097*; p <0.05), Fe (r = -0.170; p <0.01) and Cu(r = -0.277; p <0.01) among the soils collected fromSandeshkhali-II (Table 2). The available Fe showed anegative correlation (r= -0.194; p <0.01) with EC andpositive correlation (r= 0.156; p <0.05) with organic C.Organic C showed a significant and negative correlationwith EC (r = -0.594; p <0.05) and bulk density (r= -0.071;p <0.05) and positive correlation (r = 0.198; p <0.01) withZn content of soils. The available nitrogen content of thesoil showed a significant and positive correlation withorganic carbon (r= 0.776; p <0.01) and negativecorrelation with EC (r= -0.383; p <0.01). From the resultsit can be inferred that the available P was negativelycorrelated with Zn (r= -0.443; p <0.01) content of soiland positively correlated with the organic carbon (r=0.056; p<0.05) and Fe (r= 0.538; p <0.01).
Fig. 5. Spatial map of organic C (g kg-1) content of the studiedsoil
Fig. 6. Spatial map of available nitrogen (kg ha-1) content ofthe studied soil

6 Mitran et al.
Fig. 7. Spatial map of available Zn (mg kg-1) content of thestudied soil
Fig. 8. Spatial map of available Mn (mg kg-1) content of thestudied soil T
able
2.
Cor
rela
tion
am
ong
the
phys
ico-
chem
ical
cha
ract
eris
tics
of
soils
Par
amet
ers
pHC
aE
C2.
5O
rgan
ic C
Av.
NA
v. P
Av.
Fe
Av.
Mn
Av.
Zn
Av.
Cu
Av.
KA
v. S
BD
Cla
y
pHC
a1.
000
EC
2.5
ns1.
000
Org
anic
C-0
.594
**1.
000
Av.
Nns
-0.3
83**
0.77
6**
1.00
0A
v. P
nsns
0.05
6*ns
1.00
0A
v. F
e-0
.170
**-0
.194
**0.
156*
*0.
114*
*-0
.538
**1.
000
Av.
Mn
0.01
0*-0
.134
*0.
147*
0.06
2-0
.288
**0.
710*
*1.
000
Av.
Zn
-0.0
97*
-0.1
67**
0.19
8**
0.14
6-0
.443
**0.
902*
*0.
785*
*1.
000
Av.
Cu
-0.2
77**
0.02
0*0.
149*
*0.
170*
0.83
9**
-0.4
71**
-0.3
63**
-0.3
88*
1.00
0A
v. K
nsns
nsns
-0.4
85**
-0.3
96**
-0.4
20**
-0.4
49**
-0.4
42**
1.00
0A
v. S
nsns
0.16
0**
0.22
1**
nsns
nsns
0.22
7**
ns1.
000
BD
nsns
-0.0
71*
nsns
nsns
nsns
nsns
1.00
0C
lay
nsns
nsns
nsns
nsns
0.02
1*ns
ns-0
.024
*1.
000
** in
dica
tes
sign
ific
ant a
t 1%
leve
l and
* in
dica
tes
sign
ific
ant a
t 5%
leve
l. (n
=15
0)

Soil Fertility Constraint Assessment Using Spatial Nutrient Map 7
Nutrient index
The Nutrient index value (NIV) of available nitrogenranged from 1.04 to 1.20 for the studied area whichindicated that the area was low in available nitrogen. Onthe other hand the NIV for available P ranged from 1.92to 1.99 which showed a medium status in terms of fertility.The NIV for available K was much (Table 3) higher i.e.3.00 irrespective to the sampling sites which indicatedthat the native supply of K was high in the studied area.NVI for available sulphur ranged from 2.72 to 2.88 whichindicated a higher availability of sulphur in such soil. Thearea was medium in available Zn content with nutrientindex values ranged from 1.64 to 2.04. Among therepresentative sites, soil samples collected from Korakatishowed a higher NIV for available Zn compared to others.The soils of the studied area were high in available Fe,Mn and Cu content with nutrient index value of 2.78 to2.82, 2.60-2.84 and 3.00, respectively. The results indicatedthat the area is poor in available nitrogen content andmedium in available phosphorus and Zn but the nativesupply of K, S and micronutrients except Zn are muchpronounced. However, among the three representativevillages soil samples collected from Tushkhali showed acomparatively lower nutrient index values for all nutrientsfollowed by Korakati and Duchnikhali, respectively.
Conclusions
The unique set of characteristics of a region arisesfrom the location specific variations of the naturalresource base. The sites selected for the present study wasin the Sundarbans region on the Bay of Bengal, WestBengal, India. The soils of this region are naturally salineand agriculture is severely constrained. Rice is theprincipal crop of this area, which is mainly grown duringmonsoon season. Improving productivity of crop byidentifying fertility constrains using spatial nutrients mapfollowed by suitable soil management strategies was theprimary focus of the study. This study produced high-quality spatial soil nutrient maps to apply the site-specificmanagement for crop cultivation in villages of coastalSunderbans. The spatial soil nutrient maps indicated thatmost of the studied soils were marginally saline to salinein nature. In some of the locations soil shows highersalinity level > 4.0 dS m-1 which was critical for cropcultivation. The available N, P and Zn content showedlow content which significantly increased with increasein organic C. On the other hand organic C was negativelycorrelated with the soil salinity level. Nitrogen basedfertilization supplemented with organic inputs should berecommended for the studied area for optimum growthand yield of crops.
Acknowledgements
The Authors would like to thank University GrantCommission (UGC), India for the financial supports forcarried out the research work.
References
Ali SJ (2005). Fertilizer Recommendation for Principle Crops andCropping Sequences in West Bengal. Department ofAgriculture, Govt. of West Bengal.
Bandyopadhyay AK, Bhargava GP, Rao KGK, Sen HS, SinhaTS, Bandyopadhyay BK, Biswas CR, Bal AR, Dutt SKand Mandal RC (1988). Coastal Saline Soils of India andTheir Management, Bull No. 13. Central Soil SalinityResearch Institute, RRS Canning, West Bengal, pp. 158.
Bandyopadhyay BK and Bandyopadhyay AK (1983). Effectof salinity on mineralization and immobilization ofnitrogen in a coastal saline soil of West Bengal. IndianAgriculturist 27: 41-50.
Bandyopadhyay BK and Maji B (1995). Nature of acid soilof Sundarban delta and suitability of classifying themas acid sulphate or potential acid sulphate soils. Journalof Indian Society of Coastal Agricultural Research 43:103-107.
Bandyopadhyay BK and Bandyopadhyay AK (1984). Effectof application of farmyard manure on soil propertiesand yield of crops in coastal saline soil. Journal of IndianSociety of Coastal Agricultural Research 2(3): 63-73.
Bandyopadhyay BK, Maji B, Sen HS and Tyagi NK (2003).Coastal Soils of West Bengal- Their Nature, Distribution andCharacteristics. Bull. No. 1/2003. Central Soil SalinityResearch Institute, Regional Research Station, CanningTown, West Bengal, India, pp 1-62.
Bandyopadhyay BK, Sahu GC and Maji B (1998). Status,nature and composition of organic matter in coastalareas. Journal of the Indian Society of Soil Science 19: 58-67.
Bandyopadhyay BK, Sen HS and Maji B (2001). Saline andAlkali Soils and their Management, Monograph Series 1.Indian Soc. Coastal agric. Res. Central soil salinityResearch Institute, Canning Town, West Bengal, India,1-66.
Blake GR and Hartge KH (1986). Bulk density. In: Klute A(ed.) Methods of Soil Analysis, Part 1. (2nd ed.), Agron.Monogr. 9. ASS, Madison, WI. pp 363–375.
Bray RH and Kurtz LT (1945). Determination of total,organic and available forms of phosphorous in soils. SoilScience 59: 39-45.
Chesnin L, Yien CH (1951). Turbidimetric determinationof available sulphates. Soil Science Society of AmericaProceedings 15: 149-151.
Dagar JC (2005). Salinity research in India: An overview.Bull. National Inst. Eco. 15: 69-80.
Gee GW and Bauder JW (1986). Particle-size analysis. In:Methods of Soil Analysis. Klute, A. (ed.) ASA and SSSA,Madison, WI. Part 1 383–412.
Gulser C (2006). Effect of forage cropping treatments onsoil structure and relationships with fractal dimensions.Geoderma 131: 33-44.
8 Mitran et al.
Hillel D (1998). Environmental Soil Physics. Academic Press,San Diago, pp. 771
ISSS (2009) Fundamentals of Soil Science. Indian Society ofSoil Science (ISSS) 2nd edition, ISBN no 81-903797-4-7.
Jackson ML. (1973). Soil Chemical Analysis. Prentice Hall ofIndia Pvt. Ltd., New Delhi.
Joshi RG and Kadrekar SB (1987). Fertility status of coastalsalt affected soils of Maharashtra. Journal of IndianSociety of Coastal Agricultural Research 5(1):111-116.
Kalyan S and Sarkar D. 2009. Studies on chemical propertiesand nature of acidity of coastal acid soils of West Bengal.Journal of Interacademicia 13(1): 23-27.
Kaur B, Aggarwal AK and Gupta SR (1998). Soil microbialbiomass and nitrogen mineralization in salt affected soils.International Journal of Ecology and Environmental Sciences24: 103-111.
Lindsay WL and Norvell WA (1978). Development of aDTPA soil test for Zinc, iron, manganese and copper.Soil Science Society of America Journal 42:421-428.
Maji B, Bandyopadhyay BK, Sarkar D and Chatterji S (1998).Morphological and chemical characterization of soilsof Sagar Island of the Sundarbans, West Bengal. Journalof the Indian Society of Soil Science 46(1): 99-103.
Nelson DW and Sommers LE. (1982). Total carbon, organiccarbon and organic matter. In: Miller, A.L., Keeney,R.H., DR (eds.) Methods of Soil Analysis, Agron. Monogr.
12, Part 2, 2nd ed., ASA and SSSA, Madison, WI.,pp.101-129.
Sarkar D, Sahoo AK, Sah KD and Gajbhiye KS (2001).Coastal soils of eastern India-their charactersistics,potentials and limitations towards alternate land use.Journal of Indian Society of Coastal Agricultural Research19(1&2): 80-83.
Sen HS and Bandyopadhyay BK.(2001). Problems andprospects of managing coastal ecosystem in India withspecial reference to eastern ecosystem. ProceedingsNational Workshop on “Development and Managementof Problem Soils for Sustainable Agriculture Production”December 21-22, India.
Subbiah BV and Asija GL (1956). A rapid procedure for thedetermination of available nitrogen in soils. CurrentScience 25: 259- 260.
Szabolcs I (1979). Review of research on salt-affected soils.Nat. Resource Res. 15: UNESCO, Paris.
Tripathi S, Kumari S, Chakroborty A, Gupta A, ChakrobortyK and Bandyopadhyay BK.(2006). Microbial biomassand its activity in salt affected coastal soils. Biology andFertility of Soils 42: 273-277.
Yadav JS., Bandyopadhyay AK and Bandyopadhyay BK.(1983). Extent of coastal saline soils of India Journal ofIndian Society of Coastal Agricultural Research 1: 1-6.
Received: November, 2013; Accepted: March, 2014

Ground Water Recharge and its Effective Use ThroughMicro-irrigation for Crop Production in Coastal Gujarat
G. Gururaja Rao1*, Sanjay Arora2, Anil R. Chinchmalatpure3, M.K. Khandelwal1,S.K. Kamra3 and D.K. Sharma3
1Central Soil Salinity Research Institute, Regional Research Station, Bharuch-392 012, Gujarat2Central Soil Salinity Research Institute, Regional Research Station, Lucknow-226 002, Uttar Pradesh
3Central Soil Salinity Research Institute, Karnal-132001, Haryana*E-mail: [email protected]; [email protected]
Abstract
Groundwater, a reliable resource for drinking purpose and agricultural crop production, has become a majornatural resource contributing to the water supply system. Due to its continued withdrawal, it requiresreplenishment through recharge. Artificial recharge of ground water through recharge bores is an importantstrategy that helps in improving both the ground water level and quality. In the absence of assured irrigationsupply, majority of the crops in Bharuch district of Gujarat used to face water shortages leading the crop failureor reduced crop yields. To tackle this problem, Regional Research Station of CSSRI installed artificialgroundwater recharge structures in 15 farmers’ fields in Bharuch, Amod, Valia, Ankleshwar, Netrang andJhagadia Talukas in coastal Gujarat region. The performance of these structures was evaluated in terms of risein groundwater levels, improvement in its quality and enhancement of farmers’ income during 2008 to 2010.Subsequently Micro Irrigation Systems (MIS) were implemented in 10 sites, including five at groundwaterrecharge project sites and the effect of MIS on crop production in divergent crops like sugarcane, cotton, banana,water melon and cotton was studied. Detailed results at two sites indicated that enhanced availability andreduction in groundwater salinity due to recharge interventions resulted in increase in crop yields andconsequently farmers’ income to the tune of 14, 38, 50 and 100 % in papaya, banana, soybean and mango,respectively. The ground water with improved quality, when used with MIS also resulted in substantial increaseof crop yields leading to B/C ratio of 4.35, 2.94, 2.84 and 1.22 in water melon, Bt. Cotton, banana and sugarcane,respectively and more importantly water productivity of more than 12 kg/cum in high water demandingsugarcane.
Key words: Ground water recharge, Micro irrigation system, Water productivity, Watertable decline
Introduction“Water is the Elixir of Life and Cleanser of Sins”.
This is a pivotal component in agriculture and itsconservation and judicious use are of paramountimportance. Water is a renewable resource, to a point.The current population of the world is using water at suchalarming rates with which nature cannot cope up. Waterscarcity, a major problem in most arid regions of theworld, is adversely affecting food security, naturalecosystems, plant and human health (Seckler et al., 1999).Water scarcity is resulting from a number of factors, theforemost being depletion of groundwater, currently themost reliable resource in terms of quantity and qualityfor drinking and agricultural crop production. Thoughgroundwater is an important source of irrigation in India,its availability is non- uniform in space and time.Rainwater harvesting and artificial groundwater rechargeinterventions can play an important role in augmenting
groundwater and also to improve its quality. Rainwaterharvesting is essential considering our increasingdependence on groundwater to meet water demands ofdifferent sectors (irrigation, domestic, industry andrecreation) and diminishing natural recharge due to fallingwatertables and rapid urbanization.
Natural recharge of groundwater occurs byinfiltration of precipitation or excess irrigation water intothe soil and movement in the form of moisture throughthe vadose zone down to the saturated zone. Artificialrecharge is the process by which the groundwater reservoiris augmented at a rate exceeding that under naturalconditions or replenishment (Bhattacharya, 2010). It isaccomplished by constructing simple civil structures,including among others tubewells and open wells(Gururaja Rao et al., 2010) which are getting increasinglyaccepted due to failure or delay in arrival of natural orartificially recharged water to deeper aquifer zones withsurface methods. By demarcating and preserving the
Journal of Soil Salinity and Water Quality 6(1), 9-15, 2014
*Corresponding author

10 Rao et al.
recharging area within the aquifer basin, the groundwaterresources of a region can be sustained to varying degreesof success.
Groundwater recharge stores water during the wetseason for use in the dry season, when demand is highestand improvement in groundwater quality can also helpin improving productivity of crops, in particular of highvalue cash crops through the use do micro- irrigation andeven for drinking purposes (Sivanappan, 2006). Micro-irrigation is another approach to meet the challenges ofwater scarcity since it leads to improving water useefficiency, i.e. maximizing crop production with minimumwater use, arresting salinity build-up, conserving fertilizeruse and reducing labour input substantially.
With this background, the paper presents the featuresand effectiveness of 15 groundwater recharge wells,installed in farmers’ fields, in raising watertable andimproving its quality in Bharuch district of Gujarat. Thesecond part of the paper presents the scope of dripirrigation in improving water productivity and farmers’income through cultivation of sugarcane, cotton, bananaand water melon in 10 farmers’ fields, including at 4recharge well sites. The farmers’ fields were selected indeep watertable areas with less chances of salinity build-up and where progressive farmers were ready for diversecrop interventions with micro- irrigation system usingground water.
Ground water resources of Bharuch district andGujarat state
Gujarat is one of the most water scarce and drought-prone regions in India (IRMA, 2001, Shah and Mistry,2013). Water is identified as one of the fifteen majorindicators for sustainability and it is a major issue for fastgrowing economy of Gujarat. The waterutilization pattern of Gujarat, a predominantly semi-aridstate in western India, is 89% for irrigation, 7% fordomestic and drinking water, and four percent for industryand other uses (IRMA, 2001). The state is characterizedby semi- arid climate with hot and dry pre-monsoonMarch to May summer months followed by south westernmonsoon (June to September). The subsequent period ofOctober to November receives uncertain and infrequentshowers followed by fair, dry and mild winter (Decemberto February). The annual rainfall is highly variable,ranging from 1480 mm in South Gujarat, 700-800 mm inCentral Gujarat to 250-350 mm in North Gujarat andKutch region. The maximum and minimum areas undergroundwater irrigation are low rainfall North Gujarat andhigh rainfall southern districts of the state.
The state often experiences drought during the cropgrowth period and at times crop failure occurs due tolimited availability of irrigation waters. While 9 lakh haarea is irrigated with tube wells, about 19.9 lakh ha areais irrigated with open wells. The agricultural utilizationof groundwater is mainly through open wells (7.8 lakh
wells) followed by tube wells (0.3 lakhs). In Ahmedabad,Bharuch and Narmada districts, tube well irrigation tendto dominate over open wells.
Out of state’s 21.5 lakh ha irrigation potential createdthrough groundwater, the maximum potential of 4.8 lakhha is created in Bharuch district. Due to skewedutilization, the net groundwater balance is positive(recharge more than draft) in all districts of Gujarat exceptBanaskantha, Gandhinagr and Mehsana districts whereoverdraft of groundwater is leading to negative balance.The annual groundwater recharge of Bharuch district hasbeen estimated at 499 million cubic meter (MCM), ofwhich 100 MCM/ year is utilized for domestic andindustrial use, resulting in about 399 MCM/ yearutilizable groundwater recharge. Since the groundwaterdraft is less than that of the groundwater recharge, thelevel of groundwater development is moderate in thisdistrict.
Materials and Method
(a) Groundwater recharge wells
Selection of groundwater recharge sites was basedon local hydrogeology, topography, and types of facilitiesavailable for harvesting of rainwater for recharge purpose.A total of 15 farmers’ field sites (Fig. 1) were chosen forconstructing the recharge wells. At most locations, borewells of 400 mm φ (diameter) were drilled to about 30 m(100ft) depth in middle of which 5 PVC pipes of 6 mlength each and 125 mm (outer φ) were placed. Of the 5pipes, 2 were blind (non- perforated) while 3 wereperforated with 3- 7.5 mm size slits to act as strainer wellsin the sandy zones of aquifer. The space between borehole and pipe was filled gravel aggregates of 8-20 mm φand standard air compression technique was applied toactivate water pathways in strainer zones of aquifer forrecharging.
Fig. 1. Location map of recharge wells constructed in Bharuchdistrict
Ground Water Recharge 11
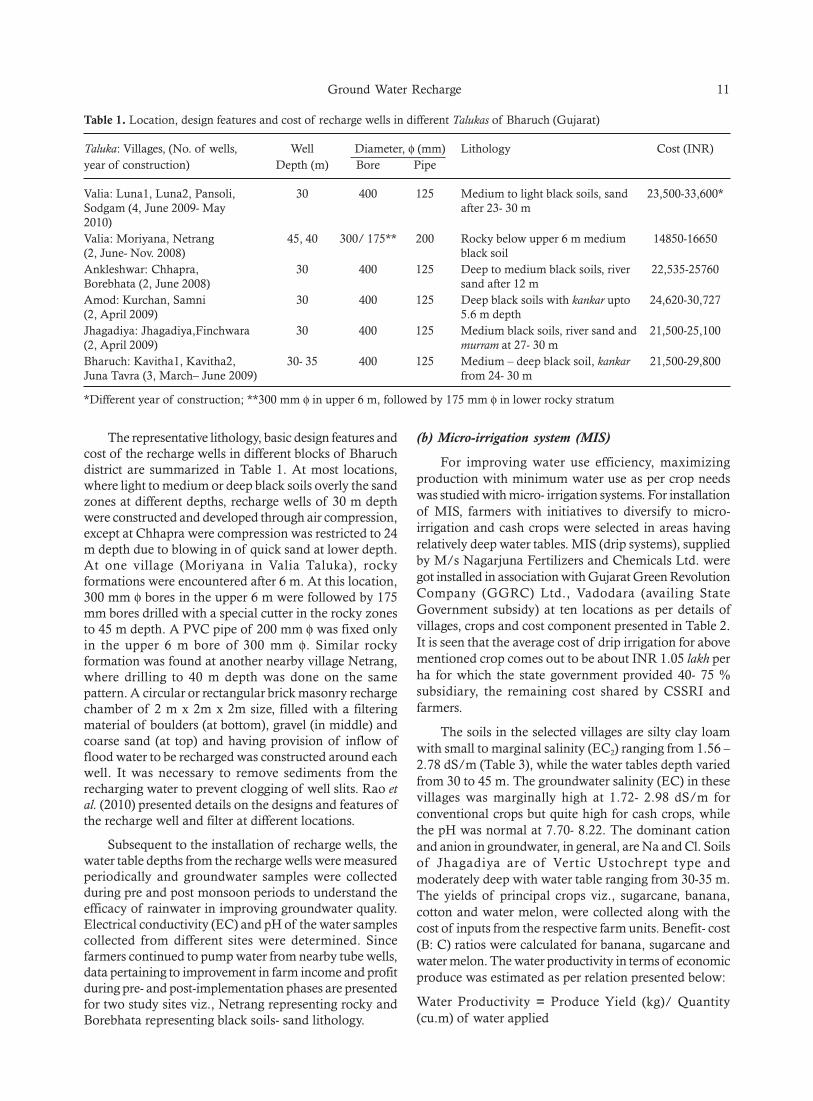
The representative lithology, basic design features andcost of the recharge wells in different blocks of Bharuchdistrict are summarized in Table 1. At most locations,where light to medium or deep black soils overly the sandzones at different depths, recharge wells of 30 m depthwere constructed and developed through air compression,except at Chhapra were compression was restricted to 24m depth due to blowing in of quick sand at lower depth.At one village (Moriyana in Valia Taluka), rockyformations were encountered after 6 m. At this location,300 mm φ bores in the upper 6 m were followed by 175mm bores drilled with a special cutter in the rocky zonesto 45 m depth. A PVC pipe of 200 mm φ was fixed onlyin the upper 6 m bore of 300 mm φ. Similar rockyformation was found at another nearby village Netrang,where drilling to 40 m depth was done on the samepattern. A circular or rectangular brick masonry rechargechamber of 2 m x 2m x 2m size, filled with a filteringmaterial of boulders (at bottom), gravel (in middle) andcoarse sand (at top) and having provision of inflow offlood water to be recharged was constructed around eachwell. It was necessary to remove sediments from therecharging water to prevent clogging of well slits. Rao etal. (2010) presented details on the designs and features ofthe recharge well and filter at different locations.
Subsequent to the installation of recharge wells, thewater table depths from the recharge wells were measuredperiodically and groundwater samples were collectedduring pre and post monsoon periods to understand theefficacy of rainwater in improving groundwater quality.Electrical conductivity (EC) and pH of the water samplescollected from different sites were determined. Sincefarmers continued to pump water from nearby tube wells,data pertaining to improvement in farm income and profitduring pre- and post-implementation phases are presentedfor two study sites viz., Netrang representing rocky andBorebhata representing black soils- sand lithology.
(b) Micro-irrigation system (MIS)
For improving water use efficiency, maximizingproduction with minimum water use as per crop needswas studied with micro- irrigation systems. For installationof MIS, farmers with initiatives to diversify to micro-irrigation and cash crops were selected in areas havingrelatively deep water tables. MIS (drip systems), suppliedby M/s Nagarjuna Fertilizers and Chemicals Ltd. weregot installed in association with Gujarat Green RevolutionCompany (GGRC) Ltd., Vadodara (availing StateGovernment subsidy) at ten locations as per details ofvillages, crops and cost component presented in Table 2.It is seen that the average cost of drip irrigation for abovementioned crop comes out to be about INR 1.05 lakh perha for which the state government provided 40- 75 %subsidiary, the remaining cost shared by CSSRI andfarmers.
The soils in the selected villages are silty clay loamwith small to marginal salinity (EC2) ranging from 1.56 –2.78 dS/m (Table 3), while the water tables depth variedfrom 30 to 45 m. The groundwater salinity (EC) in thesevillages was marginally high at 1.72- 2.98 dS/m forconventional crops but quite high for cash crops, whilethe pH was normal at 7.70- 8.22. The dominant cationand anion in groundwater, in general, are Na and Cl. Soilsof Jhagadiya are of Vertic Ustochrept type andmoderately deep with water table ranging from 30-35 m.The yields of principal crops viz., sugarcane, banana,cotton and water melon, were collected along with thecost of inputs from the respective farm units. Benefit- cost(B: C) ratios were calculated for banana, sugarcane andwater melon. The water productivity in terms of economicproduce was estimated as per relation presented below:
Water Productivity = Produce Yield (kg)/ Quantity(cu.m) of water applied
Table 1. Location, design features and cost of recharge wells in different Talukas of Bharuch (Gujarat)
Taluka: Villages, (No. of wells, Well Diameter, φ (mm) Lithology Cost (INR)year of construction) Depth (m) Bore Pipe
Valia: Luna1, Luna2, Pansoli, 30 400 125 Medium to light black soils, sand 23,500-33,600*Sodgam (4, June 2009- May after 23- 30 m2010)Valia: Moriyana, Netrang 45, 40 300/ 175** 200 Rocky below upper 6 m medium 14850-16650(2, June- Nov. 2008) black soilAnkleshwar: Chhapra, 30 400 125 Deep to medium black soils, river 22,535-25760Borebhata (2, June 2008) sand after 12 mAmod: Kurchan, Samni 30 400 125 Deep black soils with kankar upto 24,620-30,727(2, April 2009) 5.6 m depthJhagadiya: Jhagadiya,Finchwara 30 400 125 Medium black soils, river sand and 21,500-25,100(2, April 2009) murram at 27- 30 mBharuch: Kavitha1, Kavitha2, 30- 35 400 125 Medium – deep black soil, kankar 21,500-29,800Juna Tavra (3, March– June 2009) from 24- 30 m
*Different year of construction; **300 mm φ in upper 6 m, followed by 175 mm φ in lower rocky stratum

12 Rao et al.
Results and Discussion
(a) Effect of groundwater recharge on watertable depthand quality
Recharge of runoff from each event of excess rainfallresulted in rise of watertable at different locations. The
pre and post monsoon watertable depths at differentlocations are presented in Fig. 2. Water table levelsincreased from depth of 8 m during pre-monsoon phase(June) to 2-4 m during post-monsoon period at mostlocations, except Kavitha, Kurchan and Tavra, where theincrease in water table was very marginal due to relativelydeeper depths of groundwater.
Table 2. Details of crops, location and cost of MIS in Bharuch district
Village Taluka Crop Area (ha) Cost of MIS % Contribution of
System (INR) GGRC CSSRI Farmer
Luna Valia Sugarcane 0.80 67558 50 50 0Luna Valia Sugarcane 0.80 87483 50 42 8Fokdi Jhagadiya Cotton 0.80 68807 75 25 0Jhagadiya Jhagadiya Banana 0.80 68807 50 50 0Kambodiya Valia Sugarcane 0.80 85427 65 30 5Luna Valia Sugarcane 0.40 37219 75 25 0Luna Valia Cotton 0.80 87520 43 42 15Rampura Nandod Banana 0.80 113392 41 32 28Luna Valia Cotton 0.80 83969 66 34 0Kavachia Valia Cotton 0.80 92894 59 40 1
7.60 7,93,076 55.4 37.3 6.5
Table 3. Chemical characteristics of soil and groundwater at different MIS locations
Village Crop ECgw, pHgw Ionic composition of Soil salinity SoildS m-1 ground water (meq/l) (EC2), dS m-1 pH
Na+ K+ Cl-
Luna Sugarcane 2.32 7.70 64.35 66.72 74.10 2.62 7.81Luna Sugarcane 2.20 7.82 85.0 22.78 198.20 2.54 8.68Fokdi Cotton 2.98 7.88 95.19 11.42 162.0 2.21 7.88Jhagadiya Banana 1.72 8.12 73.80 45.52 70.20 2.02 8.12Kambodiya Sugarcane 2.32 8.20 98.40 39.43 102.20 1.56 8.12Luna Sugarcane 2.30 8.10 89.42 21.62 95.60 1.68 8.48Luna Cotton 2.50 8.15 94.49 27.25 94.80 1.98 7.95Rampura Banana 1.80 8.22 71.22 21.27 86.20 1.96 7.74Luna Cotton 2.68 8.08 98.12 21.25 108.20 2.78 7.54Kavachia Cotton 2.84 7.98 102.20 23.24 100.20 1.96 8.06
Fig. 2. Effect of groundwater recharge on watertable depth at different locations
Ground Water Recharge 13
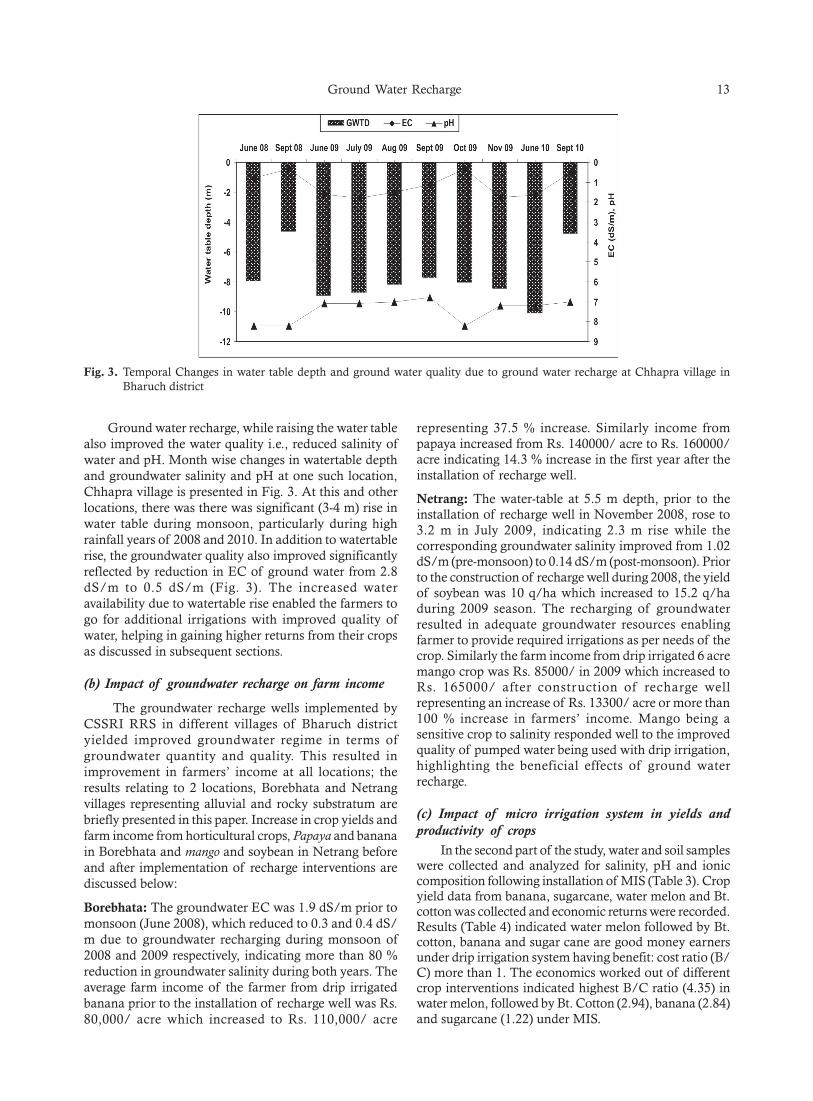
Ground water recharge, while raising the water tablealso improved the water quality i.e., reduced salinity ofwater and pH. Month wise changes in watertable depthand groundwater salinity and pH at one such location,Chhapra village is presented in Fig. 3. At this and otherlocations, there was there was significant (3-4 m) rise inwater table during monsoon, particularly during highrainfall years of 2008 and 2010. In addition to watertablerise, the groundwater quality also improved significantlyreflected by reduction in EC of ground water from 2.8dS/m to 0.5 dS/m (Fig. 3). The increased wateravailability due to watertable rise enabled the farmers togo for additional irrigations with improved quality ofwater, helping in gaining higher returns from their cropsas discussed in subsequent sections.
(b) Impact of groundwater recharge on farm income
The groundwater recharge wells implemented byCSSRI RRS in different villages of Bharuch districtyielded improved groundwater regime in terms ofgroundwater quantity and quality. This resulted inimprovement in farmers’ income at all locations; theresults relating to 2 locations, Borebhata and Netrangvillages representing alluvial and rocky substratum arebriefly presented in this paper. Increase in crop yields andfarm income from horticultural crops, Papaya and bananain Borebhata and mango and soybean in Netrang beforeand after implementation of recharge interventions arediscussed below:
Borebhata: The groundwater EC was 1.9 dS/m prior tomonsoon (June 2008), which reduced to 0.3 and 0.4 dS/m due to groundwater recharging during monsoon of2008 and 2009 respectively, indicating more than 80 %reduction in groundwater salinity during both years. Theaverage farm income of the farmer from drip irrigatedbanana prior to the installation of recharge well was Rs.80,000/ acre which increased to Rs. 110,000/ acre
representing 37.5 % increase. Similarly income frompapaya increased from Rs. 140000/ acre to Rs. 160000/acre indicating 14.3 % increase in the first year after theinstallation of recharge well.
Netrang: The water-table at 5.5 m depth, prior to theinstallation of recharge well in November 2008, rose to3.2 m in July 2009, indicating 2.3 m rise while thecorresponding groundwater salinity improved from 1.02dS/m (pre-monsoon) to 0.14 dS/m (post-monsoon). Priorto the construction of recharge well during 2008, the yieldof soybean was 10 q/ha which increased to 15.2 q/haduring 2009 season. The recharging of groundwaterresulted in adequate groundwater resources enablingfarmer to provide required irrigations as per needs of thecrop. Similarly the farm income from drip irrigated 6 acremango crop was Rs. 85000/ in 2009 which increased toRs. 165000/ after construction of recharge wellrepresenting an increase of Rs. 13300/ acre or more than100 % increase in farmers’ income. Mango being asensitive crop to salinity responded well to the improvedquality of pumped water being used with drip irrigation,highlighting the beneficial effects of ground waterrecharge.
(c) Impact of micro irrigation system in yields andproductivity of crops
In the second part of the study, water and soil sampleswere collected and analyzed for salinity, pH and ioniccomposition following installation of MIS (Table 3). Cropyield data from banana, sugarcane, water melon and Bt.cotton was collected and economic returns were recorded.Results (Table 4) indicated water melon followed by Bt.cotton, banana and sugar cane are good money earnersunder drip irrigation system having benefit: cost ratio (B/C) more than 1. The economics worked out of differentcrop interventions indicated highest B/C ratio (4.35) inwater melon, followed by Bt. Cotton (2.94), banana (2.84)and sugarcane (1.22) under MIS.
Fig. 3. Temporal Changes in water table depth and ground water quality due to ground water recharge at Chhapra village inBharuch district

14 Rao et al.
For calculating the cost of cultivation (Table 4), costof seed, land preparation, weeding, plant protectionchemicals, plucking and transportation to market weretaken into consideration. It is also seen that the cost ofcultivation of sugarcane, banana and watermelon arealmost 2-3 times more than that of Bt. Cotton, while thenet income from banana and water melon crops of morethan Rs. 2 lakh/ ha are significantly higher than sugarcaneand Bt. cotton. The comparable B/C ratios of bananaand Bt. Cotton are achieved because of relatively muchsmaller cost of cultivation of Bt. Cotton.
The irrigation water from the tube well was foundslightly saline with sodium and chloride as the dominantions. Continued use of ground water for irrigation throughMIS did not result in salinity build up in the soil,suggesting the beneficial effects of MIS in these crops.Though not indicated in Table 4, the production and B/C ratio of Bt. Cotton was higher in clay textured soils ofJhagadiya than in loamy soils of Valia Taluka whererelatively easy water losses warranted more frequentirrigations. Water melon, being a short duration crop, itsoverall water requirement is also significantly less whencompared to banana and sugarcane.
The total crop production and water productivity ofdifferent crops under different crops under MIS arepresented in Table 5.
It is seen that 126.8 – 139 t/ha production ofsugarcane, 72.6- 75.4 t/ha of Banana, 32.1 t/h of watermelon and 2.28 t/ha of Bt. Cotton production are quite
Table 4. Crop production and monetary returns under sugarcane, banana, water melon crops and Bt. Cotton under MIS
Crop (No. of locations, Taluka) Average Cost of Gross Net B/Cproduction cultivation income income ratio
(t ha-1) (Rs ha-1) (Rs ha-1) (Rs ha-1)
Sugarcane (4 locations in Valia) 132 56000 124452 68452 1.22Banana (2 locations, Jhagadiya) 74.0 75000 288400 213400 2.84Watermelon(1 location, Valia) 32.12 48000 256960 208960 4.35Bt. Cotton (4 locations, Valia and Jhagadiya) 2.24 26365 104044 77679 2.94
Table 5. Water productivity of sugarcane, banana, water melon and Bt. Cotton under MIS (water applied from rainfall and MIS)
Village/Taluka Crop Total (rain + irrigation) Production, Water productivity,water applied, cm t/ha kg/cu.m
Luna/Valia Sugarcane 101.3 133.6 13.05Luna/Valia* Sugarcane 101.8 128.6 12.63Luna/Valia* Sugarcane 101.6 126.8 12.48Khambodiya/ Valia Sugarcane 100.0 139.0 13.90Jhagadia / Jhagadia* Banana 100.5 75.4 7.50Rampur/ Nandod Banana 99.5 72.6 7.30Luna/Valia* Water melon 100.4 32.1 3.20Luna/Valia* Bt. Cotton 66.8 2.28 2.93
* Sites having both groundwater recharge and MIS interventions
high at different locations in Bharuch district under MISand slightly saline groundwater conditions. Based onpreliminary surveys conducted in flood irrigated adjoiningfarmers fields and experimental results of this study, itcan be reported that MIS in sugarcane can lead to 50- 64% saving of water and 10 % increase in crop yield overflood irrigation practices. Further, the water productivityof sugarcane under MIS at > 12 kg/cum and of bananaat > 7 kg/cum are much higher than other cropshighlighting the high potential of drip irrigation in thesecrops to meet challenges of water scarcity in Gujarat.
Summary and Conclusions
Ever increasing demands of galloping population andurbanization are exerting extreme pressure and challengeson management of on water resources. Due to easy accessand ease of extraction of groundwater through pumping,the water tables are declining very rapidly andaccentuating water scarcity problems. This situation canbe improved by evolving strategies for groundwaterrecharge through artificial recharge wells and by shiftingto micro- irrigation systems. The results of performanceevaluation studies of artificial recharge through bore wellsin 15 farmers’ fields in Bharuch district indicate higheffectiveness of such structures in not only augmentingthe groundwater, improving its quality but alsosignificantly increasing farmers’ income, particularly inhorticultural crops like mango, banana and papaya andalso in soybean. The efficacy of recharging was furtherimproved by adopting drip irrigation (MIS) which can
Ground Water Recharge 15
result in high production, water productivity, income andbenefit cost ratios in crops like banana, sugarcane, watermelon and Bt. cotton. In summary, the results of this studyindicate immense scope of artificial groundwater rechargeand its combination with MIS for water conservation andits economic use in several parts of Gujarat, particularlyin horticultural and commercial crops and moreimportantly in high water demanding sugarcane.
Acknowledgement
The financial support received from Ministry ofWater Resources, GoI, New Delhi in funding of Farmers’Participatory Action Research project (FPARP I and II)to CSSRI during the period 2008- 2012 to undertake abovereported studies is gratefully acknowledged.
References
Bhattacharya AK (2010). Artificial ground water rechargewith special reference to Inida. Int. J. Res. Rev. Appl. Sci.4(2): 214-221.
Gururaja Rao G, Khandelwal MK, Chinchmalatpure AnilR, Arora Sanjay and Kamra SK (2010). GroundwaterRecharging: An Ideal Tool for Harnessing Rainwater inGujarat. CSSRI Technical Brochure 05/2010, Centralsoil Salinity Research Institute, Karnal.
Institute of Rural Management, Anand/UNICEF (2001).White Paper on Water in Gujarat – Report submitted tothe Narmada Water Supplies,Gujarat.
Seckler D, David M and Randolph B (1999). Water Scarcityin the 21st Century, Research Report. International WaterManagement Institute, Colombo, Sri Lanka.
Sivanappan RK (2006) Rainwater Harvesting, Conservation andManagement Strategies for Urban and Rural Sectors.National Seminar on Rainwater Harvesting and WaterManagement, Nagpur
Shah SM and Mistry NJ (2013). Groundwater qualityassessment for irrigation use in Vadodara District,Gujarat, India. World Academy of Science, Engineering andTechnology, 7: 07-23.
Received: December, 2013; Accepted: June, 2014

Phytoremediation of Brass and Electroplating IndustryEffluent through Eichornia crassipes
Rama Pal1*, J.P.N. Rai2 and S.K. Dubey1
1Central Soil and Water Conservation Research and Training Institute, Research center, Chhalesar,Agra-282 006, Uttar Pradesh, India
2Department of Environmental Science, C.B.S.H., GBPAUT, Pantnagar, Uttarakhand*Email: [email protected]
Abstract
An experiment was conducted to evaluate the phytoremediation potential of Eichornia crassipes exposed todifferent dilutions (i.e., 25%, 50% and 75%) of brass and electroplating industry effluent. A supporting experimentwas also conducted in parallel with synthetic binary and single metal solutions of Cd and Cr to assess theirimpact on growth of plants. The maximum removal of heavy metals was observed under 50% dilution effluent(i.e., 89% for Cd and 87% for Cr) followed by 75% (i.e. 81% for Cd and 77% for Cr) and 25% (i.e. 51% for Cdand 50% for Cr) dilutions. Richard’s model fitted to shoot growth data showed highest growth and rate in 50%diluted effluent (k=0.372; Kc=0.49 for Cd and 0.45 for Cr). The study suggested that E. crassipes can be a goodplant species for remediation of water bodies moderately contaminated with brass and electroplating industryeffluent.
Key words: Phytoremediation, Heavy metals, Richard’s model, Industrial effluent, Eichornia crassipes
Introduction
Heavy metal pollution is a global problem, althoughcontamination persists with varying degree from place toplace. Common toxic heavy metals such as cadmium(Cd), lead (Pb), chromium (Cr) etc. are detected inwastewater from mining operations, tanneries, electronics,electroplating, batteries and petrochemical industries aswell as textile mill products (Singh et al., 2011). Theconventional technologies used for their removal fromaquatic bodies include reverse-osmosis, ion-exchange,electro dialysis, adsorption, etc. Most of thesetechnologies are quite costly, energy intensive and metalspecific. Contrary to this, phytoremediation offers a cost-effective and environment friendly technology for heavymetals removal from waste water (Singh et al., 1996;Schwitzguebel, 2000; Miretzky et al., 2004). The impactof heavy metals on growth/yield of plants under differentenvironment has been extensively studied (Liao andChang, 2004; Pal and Rai, 2010; Khandkar et al., 2012).Contaminated water bodies pose a major environmentaland human health problem, which may be partially solvedby phytoremediation.
The hyperaccumulators are slow growing, small anddo not produce large biomass. Biotechnology hasprovided an option to engineer large biomass producingplant species with hyperaccumulating genes in order to
develop an efficient phytoremediator. But the technologyis very cost-expensive and still needs improvement. So,again our focal point is naturally availablehyperaccumulators which can be used efficiently if theplant-metal system specific phytoremediation process canbe optimized in terms of time and metal concentrationusing mathematical model. The most widely used modelfor describing plant growth in terms of dry weight, lengthor volume etc. is Richard’s function (Causton and Venus,1981), which is a modified logistic model.
In the present study, Water-hyacinth (Eicchhorniacrassipes Solms) was used to assess its potential in theremediation of brass and electroplating industry effluentas well as phytoremediation process was optimized withrespect to this plant-effluent specific system usingRichard’s model.
Material and Methods
Sampling site: The mixed effluent of brass andelectroplating industries was collected from Karula nala,situated on old Delhi by-pass road, Moradabad. Theeffluent flowing in this nala finally joins Ramganga River(Fig. 1). On the way, besides being used for irrigation, theeffluent often spreads on the sides and thus affects thesoil and ground water quality of the region.
Collection and analysis of effluent: The effluent wascollected form kaccha (non-bricked) nala in pre-sterilizedplastic containers, brought to the laboratory and analysed
Journal of Soil Salinity and Water Quality 6(1), 16-20, 2014
*Corresponding author

Phytoremediation of Brass and Electroplating Industry Effluent 17
for various physico-chemical parameters followingstandard methods (APHA, 1998).
Water-hyacinth (Eicchhornia crassipes Solms) plantswere collected from a natural stand. The plants werewashed thoroughly with running tap water followed bydistilled water to avoid any surface contamination andblotted with clean blotting paper for any surface moistureavoiding damage to root and leaf apices and weremaintained in a plastic tank for 10 days prior toexperimentation. The order to assess impact of effluenton initial growth parameters of Water-hyacinth, threedilutions of brass and electroplating industry effluent (i.e.25, 50 and 75 %) were prepared with distilled water. Threereplications were maintained for each dilution treatment.For experiment, an average weight (g) was maintainedindividually in 5-L tub (inner diameter 40 cm). Theexperiment was also conducted with Hoagland’s solutioncontaining Cd and Cr binary metal solutions {i.e., 1ppmCd + 1ppm Cr (1Cd+1Cr), 2.5ppm Cd + 3ppm Cr(2.5Cd+3Cr) and 3.5ppm Cd + 4ppm Cr (3.5Cd+4Cr)} andsingle metal solutions {i.e., 1, 2.5 and 3.5 ppm for Cd(1Cd, 2.5Cd and 3.5Cd) and 1, 3 and 4 ppm for Cr (1Cr, 3Cr
and 4Cr)} having concentrations equivalent to theircorresponding effluent dilutions. In order to providedissolved oxygen to the plant roots mechanical aerationwas given by pump at the rate of 10 min/tub at threedays interval throughout the experimental period. Theanalysis of Cd and Cr in the phytoremediated effluentand synthetic metal solutions was done after 2, 5, 10, 15,20, 25, 30, 35, 40 and 45 days through atomic absorptionspectrophotometer. Simultaneously, plants wereharvested, washed with distilled water and cut into rootsand shoot. Both the shoot parts were analyzed for affectedbiomass. One control group of plants was also preparedwhere effluent was not added.
Quantitative analysis of plant growth data usingRichard’s mathematical model
The growth dynamics, considered as a continuousprocess, can be described by the equation,
Eq.1
where y (g) represents shoot biomass, a is the carryingcapacity (g), which in this case represents the final shootbiomass, k is the growth rate and d is the Richardsexponent, adding flexibility to the dynamic responsethrough modulation of the inflexion point, x is time, xc isthe centre of the curve representing time of maximumgrowth.
Results and Discussion
Physico-chemical characteristics of effluent
The physico-chemical characteristics of brass andelectroplating industry effluent before and afterremediation are given as mean ±SE in Table 1. Theeffluent was light grey to brackish gray in appearance andslightly acidic (pH 6.4) in nature. The content of total,suspended and dissolved solids (i.e., 3129, 920 and 2209mg/l, respectively) were substantially higher than theirpermissible limits as recommended by ISI, 1981 foreffluent discharge in surface water bodies. Similarly, theISI recommendation for COD value is 250 mg/l, whereas,the effluent had a COD value of 2456 mg/l whichindicates a high organic and inorganic load. The contentof Cd (4.98 mg/l) and Cr (5.4 mg/l) were also quite higherthan their permissible limits. However, the concentrationsof Zn (3.35 mg/l), Cu (2.04 mg/l) and Ni (1.113 mg/l)were low.
Fig. 1. Sampling site location at Moradabad (Uttar Pradesh)

18 Pal et al.
The dry weights of shoot were inversely related withambient metal concentration and exposure durationexcept for 75% and 50% diluted effluent treatments(wherein dry weights increased or remain equivalent tocontrol which can be explained on the basis thatreplenishing of microelements present in the effluent atoptimum level promoted the growth of plants) andfollowed the order: 50% diluted effluent >75% dilutedeffluent e”Control >(1Cr) >(3Cr) >(4Cr) >25% dilutedeffluent >(1Cd) >(2.5Cd) >(3.5Cd) >(1Cd+1Cr) >(2.5Cd+3Cr)>(3.5Cd+4Cr).
The reduction in dry weights of Water-hyacinth wasobserved due to Cd stress as it was present at super optimallevels. Hasan et al. (2006) have also reported decrease inWater-hyacinth biomass on Cd exposure at 1-6 ppm.However, the dry weight reduction under single metal (Cr)treatment was not severe as the concentration of Cr (1-4ppm) used were below the toxic level. Mishra and Tripathi(2008) also showed that removal of Cr by Water-hyacinthin 1-5 ppm range was harmless showing no symptom oftoxicity.
During the 45 days experiment, the shoot dry weightsincreased till 35 days and thereafter reached acharacteristic maximum value related to metal
Table 1. Physico-chemical characteristics (±SE) of brass and electroplating industry effluent before and after phytoremediationwith E. crassipes
Parameters ISI Standards Effluent (before Effluent dilutions (after phytoremediation)Surface water Land irrigation phytoremediation) 75% 50% 25%
pH 5.5-9.0 5.5-9.0 6.40±0.01 6.85±0.01 6.98±0.02 6.56±0.03EC (dS m-1) - - 1.59±0.01 0.86±0.01 0.54±0.03 1.2±0.05TS (mg l-1) - - 3129±6.33 312±1.23 564±1.86 1643±6.92TSS (mg l-1) 100 200 920±9.53 77±0.24 177±1.64 645±3.54TDS (mg l-1) 500 - 2209±5.24 167±1.14 390±2.34 1005±5.23COD (mg l-1) 250 - 2456±6.86 307±2.5 409±2.68 1228±6.84Na (mg l-1) - - 155.10±1.05 - - -K (mg l-1) - - 725±2.69 - - -Zn(mg l-1) 5.0 - 3.35±0.02 - - -Cu(mg l-1) 3.0 - 2.04±0.03 - - -Cd(mg l-1) 2.0 - 4.98±0.01 0.90±0.03 0.56±0.06 2.43±0.06Cr(mg l-1) 2.0 - 5.4 ±0.03 1.20±0.05 0.70±0.02 2.70±0.07Ni(mg l-1) 3.0 - 1.113±0.01 - - -
The physico-chemical characteristics of effluent wereanalysed after 45 days of phytoremediation with Water-hyacinth. The pH of 75%, 50% and 25% diluted effluentincreased to 6.85, 6.98 and 6.56, respectively, whereas,EC decreased to 0.86, 0.54 and 1.2 dS m-1, respectively.The maximum decrease in content of Cd (89%) and Cr(87%) was observed under 50% diluted effluent treatment.The COD of the effluent also decreased substantially.Other heavy metals like Zn, Cu and Ni became negligible.Total solids decreased by 60%, 64% and 30% in 75%,50% and 25% diluted effluent treatments, respectively.Similarly, TDS and TSS showed maximum decrease in50% diluted effluent treatment. The 50% dilutiontreatment was found to be best because it containsmicroelements like Zn, Cu and Ni at optimum level,which promote plant growth and hence producing largebiomass for accumulating more amounts of heavy metalsat a faster rate.
Plant growth as a function of metal concentration andexposure duration
The growth of E. crassipes at different concentrationsof brass and electroplating industry effluent and syntheticbinary and single metal solutions of Cd and Cr estimatedin terms of shoot dry weight are shown in Fig.2.
Table 2. Richard’s parameter for shoot dry weight of E. crassipes exposed to different heavy metal treatments
Parameters Control Heavy metal treatments
Effluent dilutions Binary metal solutions Single metal solutions
75% 50% 25% 1Cd+1Cr 2.5Cd+3Cr 3.5Cd+4Cr 1Cd 2.5Cd 3.5Cd 1Cr 3Cr 4Cr
a 0.90 0.96 1.86 0.46 0.6 0.49 0.4 0.75 0.6 0.48 0.85 0.86 0.79Xc 22.97 24.35 17.69 18.43 20.2 18.6 18.0 15.8 15.4 15.0 23 22.5 22d 6.50 6.87 4.73 8.148 6.8 6.9 7.1 6.7 6.8 7 6.52 6.54 6.58k 0.332 0.368 0.372 0.185 0.196 0.194 0.19 0.189 0.187 0.182 0.33 0.32 0.3

Phytoremediation of Brass and Electroplating Industry Effluent 19
Fig. 2. Effect of heavy metal treatments on shoot dry weight (g) of E. crassipes in a) effluent-dilution treatment, b) Cd and Crbinary metal treatment, c) Single metal Cd treatment, and d) Single metal Cr treatment.
concentration in the medium. The Richard’s Eq. 1 usingsoftware Origin6 was fitted adequately to shoot growthdata and the varied parameter values obtained are givenin Table 2.
The values of Richard’s parameter k for Water-hyacinth indicate that the growth rate was highest in 50%diluted effluent. Similarly, the highest values of ’factor ‘a’indicates the maximum biomass production in 50%diluted effluent treatment.
Conclusion
It may be concluded that brass and electroplatingindustry effluent collected from Moradabad city possessedcontaminants above the prescribed limit. The 50% dilutedeffluent can be remediated efficiently by E. crassipes.However, 75% diluted effluent can also give satisfactoryresults. However, the phytoremediation process isgoverned by several site specific factors like climate and
soil/water bodies characteristics and also plants to beused, therefore, further research is required to optimizethese factors in order to apply this technology atcommercial scale.
References
APHA, AWW, WEF (1998). Standard Methods for theExamination of Water and Wastewater. 20th ed.Washington DC.
Causton DR and Venus JC (1981). The Biometry of PlantGrowth. Edward Amold London.
Hasan SH, Talat M and Rai S (2007). Sorption of cadmiumand zinc from aqeous solutions by water hyacinth(Eichhornia crassipes). Biores. Technol. 98(4): 918-28.
ISI (Indian standards institution) (1981). Indian standardspecification for wastewater discharge into surface waterbodies, 2490, Part-I.

20 Pal et al.
Khandkar UR, Choyal A and Tiwari SC (2012). Effect ofapllied nitrogen and zinc on mustard (Brassica juncea L.)under sodic soil environment. Journal of Soil Salinity andWater Quality 4: 46-50.
Liao SW and Chang WL (2004). Heavy metalphytoremediation by water hyacinth at constructedwetlands in Taiwan. Journal of Aquatic Plant Management42: 60-68.
Miretzky P, Saralegui A and Fernandez Cirelli A (2004).Aquatic macrophytes potential for the simultaneousremoval of heavy metals (Buenos Aires, Argentina).Chemosphere. 57/8: 997-1005
Mishra VK and Tripathi BD (2008). Accumulation ofchromium and zinc from aqueous solutions using waterhyacinth (Eichhornia crassipes). J. Hazardous Materials 98:123-128.
Rama Pal and Rai JPN (2010). The phytoextraction potentialof water hyacinth (Eichchornia crassipes): removal ofselenium and copper. Chemistry and Ecology. 26(3): 163-172.
Schwitzguebel JP (2000). Potential of pytoremediation, anemerging green technology. Ecosystem Service andSustainable Watershed Management in North China,International Conference, Beijing, P.R.China, August,23-25; pp 350-364.
Singh D, Gupta R and Tiwari A (2011). Phytoremediationof lead from wastewater using aquatic plants.International Journal of Biomedical Research 7: 411-421.
Singh DB, Prasad G and Rupainwar DC (1996). Adsorptiontechnique for the treatment of As (V) rich effluents.Colloids Surf. 111: 49-56
Received: January, 2014; Accepted: March, 2014
Grouping of Advanced Rice Breeding Lines Based on GrainYield and Na:K Ratio under Alkaline Conditions
Y.P. Singh*1, Dhananjaya Singh1 and S.L. Krishnamurthy2
1Central Soil Salinity Research Institute, Regional Research Station, Lucknow- 226 005, Uttar Pradesh, India2Central Soil Salinity Research Institute, Karnal-1320 01, Haryana, India
Abstract
A field experiment was conducted to monitor the performance of rice genotypes for alkalinity tolerance andassess their yield potential under alkaline condition. Forty seven rice genotypes received under InternationalRice Soil Stress Tolerance Screening Nursery Trial (IRSSTN) from International Rice Research Institute (IRRI)were evaluated for yield and physiological traits. On basis of the grain yield and Na: K ratio, the rice genotypeswere grouped in four categories viz. highly tolerant, tolerant, susceptible and highly susceptible. The ricegenotypes from the high salt tolerant and moderate salt tolerant groups reported lower values for the Naaccumulation and Na: K ratio and higher values for grain yield over the susceptible and highly susceptiblegenotypes. The lowest sodium accumulation and sodium and potassium ratio and highest grain yield wasrecorded in rice genotype IR74095-AC 64 as compared to the checks (tolerant and susceptible). The rice genotypeIR 74095-AC 64 is considered potentially tolerant to alkaline stress and could be used for further breedingprogramme
Key words: Rice genotypes, Salt stress tolerance, Physiological traits, Na: K ratio
Introduction
Salt is a key constraint among the abiotic stresseswhich affect the physiological processes of plants and itis the most important factor which severely affects cropgrowth and development, as well as productivity,especially in rice crops. The adverse effects of three majorhazards associated with salt stress are; osmotic (water)stress arising from more negative osmotic potential (higherosmotic pressure) of the root zone, specific ion toxicity,excess of exchangeable sodium which lead to soil swellingand dispersion causing water infiltration, aeration androot penetration problem and nutritional imbalance(Munns and Tester, 2008; Patade et al., 2008). Selectionof highly salt tolerant genotypes within a species can beexpected to provide useful material in comparisons withthe salt sensitive ones. Even the yield of most toleranttraditional varieties reduced to one third. It is intrinsic toa screening procedure that the phenotype should beadequately reflecting the potential of the genotype; andsalt tolerance has been treated as a single factor whichcould include a genetically linked group of factors. Thesalt tolerance in non- halophytes is the product of severalindependent factors. Two important factors play key role.Firstly, the salt resistance in rice can be increased beyondthe present phenotypic range because there is no reasonto expect that, in the absence of selection process, currentvarieties have evolved the optimal combination of
characters for salt resistance. Secondly, such characterswill commonly be cryptic, i.e. the genotype for one maynot on its own influence the phenotype sufficiently forthat phenotype to be selected in a screening process. Thisstudy was undertaken to examine the salt tolerancepotential in rice genotypes on the basis of ionicaccumulation, Na: K ratio and grain yield.
Material and MethodsThe experiment was conducted under sodic soil (pH
9.6-9.7) condition at Central Soil Salinity ResearchInstitute, Regional Research Station, Research Farm,Shivri, Lucknow-Uttar Pradesh. The site is geographicallylocated at 260 47’N latitude and 800 46’E longitude and120 m altitude. Forty seven rice advance breeding linesdeveloped by International Rice Research Institute (IRRI)were evaluated under International Rice Soil StressTolerance Screening Nursery Trial (IRSSTN). Thenursery of these rice genotypes was raised under normalsoil and 30 days old seedlings were transplanted duringkharif 2011 in the field having soil pH 9.6-9.7. Three timesreplicated trial was conducted in randomized blockdesign. Two to three seedlings hill-1 were transplanted ata spacing of 20 cm × 15 cm. The recommended dose offertilizers for sodic soils viz., 150 kg N ha-1, 60 kg P2O5
ha-1, 40 kg K ha-1 and 25kg zinc were applied uniformlyto all the genotypes. Half dose of nitrogen through ureaand diammonium phosphate, full dose of P2O5 throughdiammonium phosphate and full dose of zinc through
Journal of Soil Salinity and Water Quality 6(1), 21-27, 2014
*Corresponding author
22 Singh et al.
zinc sulphate were applied as basal and remaining halfdose of N was applied in two equal splits at 30 and 60days of transplanting. The physical and chemicalproperties of the soils of the experimental field are givenin Table 1. The flag leaf sample was collected from eachgenotype for analysis of ionic accumulation. Requiredamounts of 300 mM glacial acetic acid were subsequentlyadded to the same solution to make final concentrations100 mM. The tissue was re-extracted for 2 h at 90 °C forthe determination of Na+ and K+ content of leaves asdescribed in Yeo and Flowers (1983). The ionicconcentrations of flag leaves was determined followingwet digestion method using flame spectrophotometer asdescribed by Sharma et al. (2011). Ion concentrations werecalculated as m mol g-1 fresh weight in case of leavesample. This Na: K ratio which is balanced between Naand K in shoot is also a valid criterion in measuring saltstresses. Grouping of genotypes was done on the basis ofNa: K ratio and grain yield which are good indicators fortolerance to salt stress (Gregorio et al., 1997). Based onmodified standard evaluation score (SES) of visual saltinjury at vegetative stage as given in Table 2, the genotypeswere grouped in to four categories viz.
Highly salt tolerant: The first group consist of ricegenotypes which gave maximum yield and having tolerantpotential to a salt stress.
Tolerant: The second group consist of the rice genotypeswhich are moderately salt tolerant.
Susceptible: The third group consist of rice genotypeswhich are low yielding and susceptible to salt stress.
Highly susceptible: The fourth group consist of ricegenotypes which are very low yielding and highlysusceptible to salt stress.
Results and discussion
Evaluation of salt stress symptoms at vegetative andreproductive stage
Salt toxicity of rice genotypes were monitored basedon salt injury symptoms. This scoring discriminates thehighly susceptible to highly tolerant genotype. Scoring wasconducted at vegetative and reproductive stage. the firstgroup representing highly tolerant genotypes namely, IR10T107, IR 74095-AC 64,IR 71895-3R-60-3-1, IR 73571-3B-14-2, IR 74099-AC7, IR 72046-B-R-8-3-1-2, IR 72579-B-2R-1-3-2, IR 10T 105, IR 10T 108, IR 10T 101, IR 10T110, IR 10T 103, POKKALI (ACC 108921), NONABOKRA, IR 66946-3R-178-1-1 (FL 478), CSR 28 andCSR 36 was recorded the salt injury score 3, 2, 3, 3, 4, 4,2, 3, 4, 3, 4, 4, 2, 3, 2, 2 and 3 respectively (Table 3).Thesecond group categorized as tolerant consist of genotypesnamely, IR 74095-AC 45, IR 07 T101, IR 59418-7B-21-3, IR 68144-2B-2-2-3-3, IR 58427-5B-15, IR 68144-2B-2-2-3-2, IR 77674-3B-8-2-2-14-4-AJY1, IR 71829-3R-89-1-1, IR 72593-B-13-3-3-1, IR 72593-B-18-2-2-2, IR 72593-B-3-2-3-3, IR 76397-2B-6-1-1-1-1, IR 77674-3B-8-2-2-14-4-AJY 2, IR 10T 109 and AGAMI MI reported 5, 6, 4, 3,3, 5, 6, 5, 6, 6, 4, 4, 5, 4 and 6 salt injury score respectively.The third group i.e. sensitive consist of genotypes namely,IR 77674-3B-8-2-2-12-5-AJY 2, TCCP 266-1-3B-10-2-1,IR 77674-3B-8-2-2-13-4-AJY 2, IR 10T 102, IR 10T 115,IR 55179-3B-11-3, AT 401, IR 45427-2B-2-2B-1-1 and A69-1 had found the salt injury score 7, 7, 5, 7, 5, 5, 7, 6and 7 respectively.The fourth group categorized as highlysensitive consist of rice genotypes namely, IR 07T 113,IR 70870-B-P-2-2, IR 77674-3B-8-2-2-8-3-AJY 4, IR77674-3B-8-2-2-14-1-AJY 5, IR 29 and IR 28 had saltinjury score 7, 8, 7, 8, 8, and 8 respectively (Table 3). Theresults of present findings are in accordance with thereports given by Babu et al (2014) and Krishnamurthy etal. (2014).
Ionic accumulation
The ionic accumulation (Na, K and Na: K ratio) inflag leaves of salt tolerant rice genotypes was significantlydifferent. In first group (highly salt tolerant), the ricegenotype namely, IR 74095-AC 64 recorded lower Naaccumulation (3.28 mg g-1) and lower the Na: K ratio(0.10) in flag leaves (Table 4). This shows that it was notaffected by salt stress as compared to other genotypes.
Table 2. Modified standard evaluation score (SES) of visual salt injury at vegetative stage.
Score Observation Tolerance
1 Normal growth, no leaf symptoms Highly tolerant3 Nearly normal growth, but tips or few leaves whitish/burn and rolled Tolerant5 Growth severely retarded; most leaves roll; only a few are elongating Moderately tolerant7 Complete cessation of growth; most leaves dry; some plants dying Susceptible9 Almost all plants dead or dying Highly Susceptible
Table 1. Soil characteristics of the experimental field
S. No. Property
1. pH 9.72. ECe (dS m-1) 1.333. CEC (meq100-1 g soil) 7.94. ESP (meq100-1 g soil) 505. Organic matter (%) 0.126. Available nitrogen (kg ha-1) 1787. Available phosphorus (kg ha-1) 68. Available potassium (kg ha-1) 160

Grouping of Advanced Rice Breeding Lines 23
Table 3. Salt injury score of 47 genotypes of rice.
Genotype Origin Stress injury score Stress injury score Gradeat vegetative stage at reproductive stage
IR 10T107 IRRI 3 4 Highly tolerant
IR 74095-AC 64 IRRI 2 2 Highly tolerant
IR 71895-3R-60-3-1 IRRI 3 3 Highly tolerant
IR 73571-3B-14-2 IRRI 3 4 Highly tolerant
IR 74099-AC7 IRRI 4 5 Highly tolerant
IR 72046-B-R-8-3-1-2 IRRI 4 5 Highly tolerant
IR 72579-B-2R-1-3-2 IRRI 2 3 Highly tolerant
IR 10T 105 IRRI 3 4 Moderately tolerant
IR 10T 108 IRRI 4 5 Highly tolerant
IR 10T 101 IRRI 3 4 Moderately tolerant
IR 10T 110 IRRI 4 5 Highly tolerant
IR 10T 103 IRRI 4 5 Moderately tolerant
POKKALI (ACC 108921) Sri Lanka 2 4 highly tolerant
NONA BOKRA India 3 5 highly tolerant
IR 66946-3R-178-1-1 (FL 478) IRRI 2 4 highly tolerant
CSR 28 India 2 4 highly tolerant
LOCAL CHECK (CSR 36) India 3 4 Moderately tolerant
IR 74095-AC 45 IRRI 5 6 Moderately tolerant
IR 07 T101 IRRI 6 6 Tolerant
IR 59418-7B-21-3 IRRI 4 5 Moderately tolerant
IR 68144-2B-2-2-3-3 IRRI 3 5 Tolerant
IR 58427-5B-15 IRRI 3 5 Tolerant
IR 68144-2B-2-2-3-2 IRRI 5 5 Tolerant
IR 77674-3B-8-2-2-14-4-AJY 1 IRRI 6 7 Tolerant
IR 71829-3R-89-1-1 IRRI 5 6 Tolerant
IR 72593-B-13-3-3-1 IRRI 6 7 Tolerant
IR 72593-B-18-2-2-2 IRRI 6 7 Tolerant
IR 72593-B-3-2-3-3 IRRI 4 5 Tolerant
IR 76397-2B-6-1-1-1-1 IRRI 4 5 Tolerant
IR 77674-3B-8-2-2-14-4-AJY 2 IRRI 5 6 Tolerant
IR 10T 109 IRRI 4 5 Tolerant
AGAMI MI Egypt 6 6 Tolerant
IR 77674-3B-8-2-2-12-5-AJY 2 IRRI 7 8 Susceptible
TCCP 266-1-3B-10-2-1 IRRI 7 8 Susceptible
IR 77674-3B-8-2-2-13-4-AJY 2 IRRI 5 6 Susceptible
IR 10T 102 IRRI 7 8 Susceptible
IR 10T 115 IRRI 5 7 Susceptible
IR 55179-3B-11-3 IRRI 5 7 Susceptible
AT 401 Sri Lanka 7 7 Susceptible
IR 45427-2B-2-2B-1-1 IRRI 6 8 Susceptible
A 69-1 Sri Lanka 7 8 Susceptible
IR 07T 113 IRRI 7 8 Highly Susceptible
IR 70870-B-P-2-2 IRRI 8 9 Highly Susceptible
IR 77674-3B-8-2-2-8-3-AJY 4 India 7 8 Highly Susceptible
IR 77674-3B-8-2-2-14-1-AJY 5 IRRI 8 9 Highly Susceptible
IR 29 IRRI 8 9 Highly Susceptible
IR 28 IRRI 8 9 Highly Susceptible
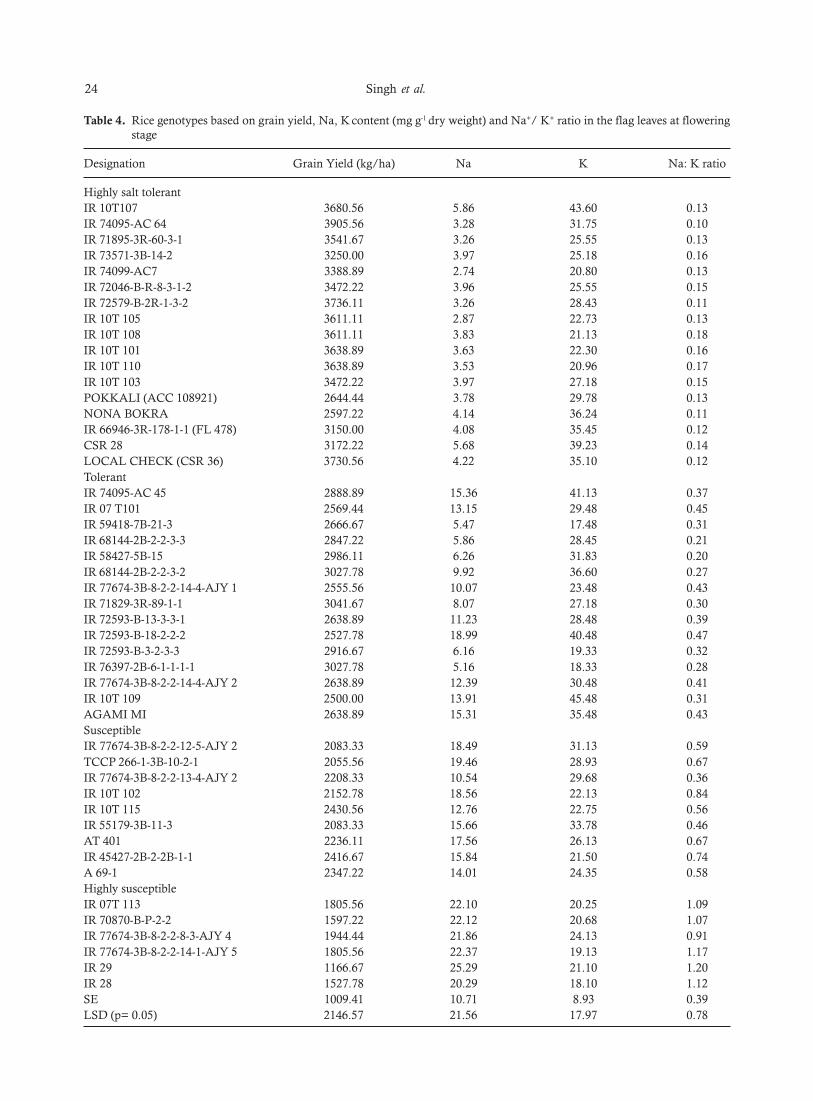
24 Singh et al.
Table 4. Rice genotypes based on grain yield, Na, K content (mg g-1 dry weight) and Na+/ K+ ratio in the flag leaves at floweringstage
Designation Grain Yield (kg/ha) Na K Na: K ratio
Highly salt tolerantIR 10T107 3680.56 5.86 43.60 0.13IR 74095-AC 64 3905.56 3.28 31.75 0.10IR 71895-3R-60-3-1 3541.67 3.26 25.55 0.13IR 73571-3B-14-2 3250.00 3.97 25.18 0.16IR 74099-AC7 3388.89 2.74 20.80 0.13IR 72046-B-R-8-3-1-2 3472.22 3.96 25.55 0.15IR 72579-B-2R-1-3-2 3736.11 3.26 28.43 0.11IR 10T 105 3611.11 2.87 22.73 0.13IR 10T 108 3611.11 3.83 21.13 0.18IR 10T 101 3638.89 3.63 22.30 0.16IR 10T 110 3638.89 3.53 20.96 0.17IR 10T 103 3472.22 3.97 27.18 0.15POKKALI (ACC 108921) 2644.44 3.78 29.78 0.13NONA BOKRA 2597.22 4.14 36.24 0.11IR 66946-3R-178-1-1 (FL 478) 3150.00 4.08 35.45 0.12CSR 28 3172.22 5.68 39.23 0.14LOCAL CHECK (CSR 36) 3730.56 4.22 35.10 0.12TolerantIR 74095-AC 45 2888.89 15.36 41.13 0.37IR 07 T101 2569.44 13.15 29.48 0.45IR 59418-7B-21-3 2666.67 5.47 17.48 0.31IR 68144-2B-2-2-3-3 2847.22 5.86 28.45 0.21IR 58427-5B-15 2986.11 6.26 31.83 0.20IR 68144-2B-2-2-3-2 3027.78 9.92 36.60 0.27IR 77674-3B-8-2-2-14-4-AJY 1 2555.56 10.07 23.48 0.43IR 71829-3R-89-1-1 3041.67 8.07 27.18 0.30IR 72593-B-13-3-3-1 2638.89 11.23 28.48 0.39IR 72593-B-18-2-2-2 2527.78 18.99 40.48 0.47IR 72593-B-3-2-3-3 2916.67 6.16 19.33 0.32IR 76397-2B-6-1-1-1-1 3027.78 5.16 18.33 0.28IR 77674-3B-8-2-2-14-4-AJY 2 2638.89 12.39 30.48 0.41IR 10T 109 2500.00 13.91 45.48 0.31AGAMI MI 2638.89 15.31 35.48 0.43Susceptible IR 77674-3B-8-2-2-12-5-AJY 2 2083.33 18.49 31.13 0.59TCCP 266-1-3B-10-2-1 2055.56 19.46 28.93 0.67IR 77674-3B-8-2-2-13-4-AJY 2 2208.33 10.54 29.68 0.36IR 10T 102 2152.78 18.56 22.13 0.84IR 10T 115 2430.56 12.76 22.75 0.56IR 55179-3B-11-3 2083.33 15.66 33.78 0.46AT 401 2236.11 17.56 26.13 0.67IR 45427-2B-2-2B-1-1 2416.67 15.84 21.50 0.74A 69-1 2347.22 14.01 24.35 0.58Highly susceptible IR 07T 113 1805.56 22.10 20.25 1.09IR 70870-B-P-2-2 1597.22 22.12 20.68 1.07IR 77674-3B-8-2-2-8-3-AJY 4 1944.44 21.86 24.13 0.91IR 77674-3B-8-2-2-14-1-AJY 5 1805.56 22.37 19.13 1.17IR 29 1166.67 25.29 21.10 1.20IR 28 1527.78 20.29 18.10 1.12SE 1009.41 10.71 8.93 0.39LSD (p= 0.05) 2146.57 21.56 17.97 0.78

Grouping of Advanced Rice Breeding Lines 25
The same results are reported by Bajwa (1982) in rice.The second group of rice genotypes ranges Naaccumulation from 5.16-18.99 mg g-1 and Na: K ratio from0.20-0.47 in flag leaves. In this group, the genotype namely,IR 58427-5B-15 recorded lower Na accumulation (6.26mg g-1) and lower the Na: K ratio (0.20) in flag leaves.The genotypes in this group were not affected due saltstress as compared to other genotypes. The third group(susceptible) of genotypes ranges Na accumulation from10.54-19.46 and Na: K ratio from 0.36-0.84. In this groupgenotype namely, IR 77674-3B-8-2-2-13-4-AJY 2 recordedlowest (10.54 mg g-1) ionic accumulation of Na and lowestthe Na: K ratio (0.36). The fourth group representinghighly sensitive group of genotypes ranges 21.86 - 25.29mg g-1 Na and 0.91-1.20 Na: K ratio. In this groupgenotypes namely, IR 66946-3R-178-1-1 recorded higherNa accumulation (25.29 mg g-1) and higher Na: K ratio(1.20) in flag leaves causing a significant decline the grainyield. Genotypes belong to this category were highlyaffected by salt stress as compared to other genotypes.This indicates that rice genotype was highly susceptibleto sodicity during maturity stage because of accumulationof higher Na and higher Na: K ratio in flag leaves. This isin accordance with finding of Islam and Salam (1997),Islam et al. (1998), Hakim et al. (2005), Sen et al. (2004)and Ali et al. (2013).
Grain yield
Classification of salt tolerant potential of ricegenotypes on the basis of average grain yield and Na: Kratio is given in Fig 1. The rice genotypes IR 74095-AC64, IR 72579-B-2R-1-3-2, CSR 36, IR 10T107, IR 71895-3R-60-3-1, IR 74099-AC7, IR 10T 105, IR 72046-B-R-8-3-1-2, IR 10T 103, IR 73571-3B-14-2, IR 10T 101, IR10T 110, POKKALI (ACC 108921), NONA BOKRA,IR 66946-3R-178-1-1 (FL 478), CSR 28 and IR 10T 108grouped as highly salt tolerant recorded higher grain yieldand lower accumulation of Na and lower Na: K ratio inflag leaves (Table 4). They have not affected by salt stress
at pH 9.7 however, other genotypes severely affected atthis level of sodicity. This indicates that they are notsensitive to salt stress during the maturity stage of thecrop growth. The results of present findings are inaccordance with the reports given by Afria and Narnolia(1999) and Gonzales and Ramirez (1998). Grain yieldreduction of rice genotypes due to salt stress is alsoreported by Linghe et al. (2000) and Gain et al. (2004)and Krishnamurthy et al. (2013).
The genotypes namely, IR 74095-AC 45 , IR 07 T101,IR 59418-7B-21-3, IR 68144-2B-2-2-3-3, IR 58427-5B-15,IR 68144-2B-2-2-3-2, IR 77674-3B-8-2-2-14-4-AJY 1, IR71829-3R-89-1-1, IR 72593-B-13-3-3-1, IR 72593-B-18-2-2-2, IR 72593-B-3-2-3-3, IR 76397-2B-6-1-1-1-1,IR77674-3B-8-2-2-14-4-AJY2, IR 10T 109 and AGAMIMI grouped as tolerant recorded lower grain yield ascompared to genotypes grouped under highly tolerant.The accumulation of Na and Na: K in flag leaf wascomparatively higher in these genotypes.
The genotypes namely, IR 77674-3B-8-2-2-12-5-AJY2, TCCP 266-1-3B-10-2-1, IR 77674-3B-8-2-2-13-4-AJY2, IR 10T 102, IR 10T 115, IR 55179-3B-11-3, AT 401,IR 45427-2B-2-2B-1-1 and A 69-1 categorized assusceptible have produced significantly lower yield thanthe genotypes stands under highly tolerant and tolerantcategories. The accumulation of Na and Na: K in flagleaf was also higher in these genotypes.
The genotypes namely, IR 07T 113, IR 70870-B-P-2-2, IR 77674-3B-8-2-2-8-3-AJY 4, IR 77674-3B-8-2-2-14-1-AJY 5, IR 29, and IR 28 found highly susceptible andproduced lowest grain yield. They were severely affectedby salt stress as compared to other genotypes. Trend ofNa: K ratio in the flag leaf showed that, as to increasegrain yield, the accumulation of Na: K ratio wasdecreased. The correlations between grain yield and Na:K ratio of rice genotypes s given in Fig. 2. This indicatesthe sensitivity to salt stress during maturity stage in rice.This is in accordance with the findings of Powar and
Fig.1. Classification of salt tolerant potential of rice genotypes on the basis of average grain yield and Na: K ratio

26 Singh et al.
Mehta (1997) who reported that grain and straw yieldsdecreased with increasing salt stress and similar findingis reported by (Quadar, 1991 and Surekha et al., 2008).
Conclusions
Based upon the grouping of rice genotypes forsodicity tolerance and yield, the rice genotypes fromhighly salt tolerant group recorded a lower value for theNa: K ratio higher grain yield. The lowest Na: K ratioand higher grain yield was recorded by rice genotypenamely, IR 74095-AC 64 as compared with and others inhigh yield and tolerant genotypes. This rice genotypes IR74095-AC 64 could be used in further breedingprogramme to enhance the productivity of salt affectedsoils.
References
Afria BS and Narnolia RK (1999). Effect of cycocel andsaline irrigation on physiological attributes, yield andits components in different varieties of wheat. Indian J.Plant Physiol 4(4): 311-314.
Ali S, Gautam RK, Mahajan R, Krishnamurthy SL, SharmaSK, Singh RK and Ismail AM (2013). Stress indices andselectable traits in SALTOL QTL introgressed ricegenotypes for reproductive stage tolerance to Sodicityand salinity stresses. Field Crops Research 154: 65-73.
Babu NN, Vinod KK, Krishnan SG, Bhowmick PK, VanajaT, Krishnamurthy SL, Nagarajan M, Singh NK, PrabhuKV and Singh AK (2014). Marker based haplotypediversity of Saltol QTL in relation to seedling stagesalinity tolerance in selected genotypes of rice. IndianJournal of Genetics and Plant Breeding 74(1): 16-25.
Bajwa MS (1982). A study on salt and sodium tolerance ofrice. J. Agric. Sci 98(3): 475-482.
Gain P and Mannan MA (2004). Effect of salinity on someyield attributes of rice. Pak. J. Biol. Sci 7(5): 760-762.
Gregorio GB, Dharmawansan S and Mendoza RD (1997).Screening rice for salinity tolerance. IRRI 22: 17-20.
Krishnamurthy SL, Sharma SK, Gautam RK and Kumar V(2013). Path and Association analysis and Stress indicesfor salinity tolerance traits in promising rice (Oryza sativaL.) genotypes. Cereal Research Communications DOI:10.1556/CRC.2013.0067.
Linghe Z and Shannon MC (2000). Salinity effects onseedling growth and yield components of rice. Crop Sci40(4): 996-1003.
Munns R, James RA and Lauchli A (2006). Approaches toincreasing the salt tolerance of wheat and other cereals.J. Exp. Bo 57: 1025-1043.
Munns R and Tester M (2008). Mechanism of salinitytolerance. Annu. Rev. Plant Biol 59: 651-681.
Patade VY, Suprasanna P and Bapat VA (2008). Effects ofsalt stress in relation to osmotic adjustment on sugarcane(Saccharum officinarum L.) callus cultures. Plant GrowthRegul 55: 169-173.
Powar SL and Mehta VB (1997) Integrated nutrientmanagement for rice in coastal saline soil of high rainfallarea. Ann. Agril. Res 18(4): 538-540.
Qadar A (1988). Differential sodicity tolerance of growthand yield parameters in genotypes of rice (O. sativa.L.).Indian Journal of Agricultural Sciences 51: 607-611.
Quadar A (1991). Evaluating the response of rice genotypeson basis of sodicity tolerance. Indian J. Plant Physiol. 34:319-324.
Sharma PC, Sehgal D, Singh D, Singh G and Yadav RS(2011). A major terminal drought tolerance QTL of pearlmillet is also associated with reduced salt uptake and
Fig. 2. Correlations between Grain Yield and Na: K ratio of rice genotypes of salt tolerance

Grouping of Advanced Rice Breeding Lines 27
enhanced growth under salt stress. Molecular Breeding 27:207-222. (DOI 10.1007/s11032-010-9423-3)
Singh RK, Singh KN, Mishra B, Sharma SK and Tyagi NK(2004). Harnessing plant salt tolerance for overcomingsodicity constraints: an Indian experience. In Advancesin Sodic Land Reclamation. International Conference onSustainable Management of Sodic Lands held atLucknow during Feb 9-14, pp 81-120.
Surekha Rao P, Mishra B, Gupta SR and Rathore A (2008).Reproductive stage tolerance to salinity and alkalinitystresses in rice genotypes. Plant Breeding 127: 256-261.
Yeo AR and Flowers TJ (1983). Varietal differences in thetoxicity of sodium ions in rice leaves. PhysiologiaPlantarum 59: 189-195.
Received: December, 2013; Accepted: April, 2014

Productive Utilization of Sodic Water for Aquaculture-ledIntegrated Farming System: A Case Study
S.K. Singh*, Ranbir Singh, S. Kumar, Bhaskar Narjary, S.K. Kamra and D.K. Sharma
Central Soil Salinity Research Institute, Karnal, Haryana, India*Email: [email protected]
Abstract
In many parts of the country there is sodic groundwater with high residual sodium carbonate (RSC), which isconsidered unsuitable for agricultural crops and aquaculture purposes. In present investigation a case studywas undertaken on farmer’s field utilizing high RSC water in a aquaculture based farming system. A pond of0.4ha (water area of 0.3ha and 2.0m depth) having sodic water, along with the adjoining 500 m2 nursery pondlocated in the village Lotani, Kurukshetra District was renovated. A platform of 2.0 m width with an area of0.1 ha was made along the inner periphery of the pond for growing field crops. Gypsum treatment was givenfor neutralizing the RSC effect in the pond water. The pond was filled with pumped water from a 50 m deeptube well that had RSC ranging from 2.5-4.1 meq l-1 and also supplemented with rainwater. Normal pondmanagement practices were followed which included application of raw buffalo dung. Pond water was used forirrigation. Gypsum treatment and application of raw buffalo dung in the pond created RSC neutralizing effect.In general, pond water had an electrical conductivity (EC) of 0.4dS m-1, RSC of < 0.8meq l-1 and dissolvedoxygen of 4.0-8.2 mg l-1 during fish culture operation. Fish growth in the adopted pond was found to be 625-1150g in 12 months, depending on species of Indian major carps and exotic carps. Fish production was recordedto be at the level of 6000 kg ha-1yr-1. Production of field crop per ha were 1000 kg potato, 400 kg onion, 200 kgmaize (bhutta),100 kg garlic, 40 kg pigeon pea and 100 kg turmeric beside considerable quantity of consumablevegetables (cauliflower, chillies, radish, methi, palak, ladies’finger, brinjal, banana) and green fodder from thedyke (inner platform of the pond, during the year of observation. The study demonstrated that sodic water withcertain chemical and organic remediation can be used for aquaculture-led integrated farming practices withsuccess.
Key words: Sodic water, High RSC water, Chemical remediation, Integrated farming system.
Introduction
Water with high proportion of sodium salts in thetotal salt concentration is termed sodic. Sodium is a highlysoluble chemical element and often naturally found inground water. All ground waters contain some sodiumbecause most rocks and soils contain sodium compoundsfrom which sodium is easily dissolved. It is estimated that32 to84 percent of total ground water in the country is ofpoor quality. This is ranging from marginally saline tohighly alkaline (EC <4dS m-1, SAR <10 and RSC >4.0meq l-1 (Gupta, 2010). Alkali water is commonly seen incentral and south-western parts of Punjab covering about25 percent of the total area of state. In Haryana, alkaliwater aquifers are found in almost 21 percent of the totalarea of the state. Utilization of sodic water for agriculturalpurpose containing high sodium compared to calciumand magnesium ion and high carbonate and bi-carbonatesleads to high alkalinity and sodium saturation in the soils.Long term use of residual sodium carbonate (RSC) waterdeteriorates the soil properties and results in soil
conditions similar to sodic /alkali soils. The soilsodification effects are reflected in terms of poor cropstand or bare soil spots due to reduced seedlingestablishment and retardation of crop growth and yieldthat, in turn adversely affects agricultural production.Increased intake of sodium from water medium isproblematic to the animal and fish also. However sodiumis a principal chemical in the body fluids, and it is notconsidered harmful at normal levels of combined intakefrom food and water sources. Inadequate ionicconcentration of hard water (Ca+Mg) and low alkalinity(CO3 + HCO3) pose problem to fish and its growth. Ingeneral, freshwater fish in moderate hard water tend tospend less energy on osmoregulation, resulting in bettergrowth. The very high limit of alkalinity may also berelated to its effect on osmoregulation at high ionconcentrations. As a general rule for fish culture, the mostproductive water should have approximately the samemagnitude of total hardness and total alkalinity values(Boyd, 1984). Introduction of aquaculture practice aloneand in integrated farming mode with and without sodicsoil led pond with good water quality was documented
Journal of Soil Salinity and Water Quality 6(1), 28-35, 2014
*Corresponding author

Productive Utilization of Sodic Water 29
by many authors (Chung, et al., 1995; Rao, et al., 1999;Luu, 2001; Prein, 2002; Sarkar, 2004; Abdullah,2004;Jharendu,et al., 2005; CSSRI, 2008a, 2009; Singh,2012).However, there is no report available on the utilization ofsodic (RSC) water for aquaculture practice alone or incombination of integrated farming system mode(Edwards, 2000; Gopakumar et al.,2000). In the presentstudy where farmer was not able to produce desired fishproduction (above national average) due to adverse effectsof residual sodium carbonate (sodic water) on pond soilcarried forward from ground water supply in the pondand lack of technical know how. Considering theimportance of sodic water problem in aquaculture andcrop productivity, a farmer and scientist-led participatorystudy was conducted at a farmer’s field in the integratedfarming system mode with a view to solve the problemand provide various options with multiple scientificinterventions.
Materials and Methods
Pre adoption scenario: As per mandate of the Institute,the scientists of CSSRI Karnal were in search of saltaffected problem oriented aquaculture practice at farmers’field in the state of Punjab and Haryana. After extensivesurvey in the year 2011, a suitable site was found at villageLotani. After adoption, one study was conducted incollaboration with a farmer Shri Ramchandra on a fieldof 0.7 ha area located in the village Lotani, Kurushetra
District (70 km from Karnal). Farmer’s family was earninglivelihood from a 0.4 ha shallow pond (Fig. 1) at a locationof N-300 4’ 4.7’’; E-760 39’ 27.6’’; MSL 256 m; a small500 m2 nursery pond, and agroforestry plants. He alsoowned a non milking buffalo, a calf, 0.1 ha fodder landand small house.
Post adoption scenario: With the intervention of CSSRIscientists, the main pond area was renovated after soilprofile study. Initially salt affected soil of the shallow pondwas scrapped. Mechanical digging of pond was done andsoil up to 1.0 meter depth was removed. Reshaping ofpond was done. Pond area was made to 0.3ha (60m x50m) water depth of 2.0 meter. An inner platform (0.1ha)was made throughout inner periphery of the main pond(Fig. 2). Farmer’s family size and pond scenario afterrenovation is depicted below.
Total farm area 0.7 haFamily size 06 members (03 adults + 03
minors)Pond number 02Main stocking pond area 0.3ha (2.0 meter depth)Inner platform area 0.1 haOld dyke area 0.1ha (Poplar trees-150,
Eucalyptus-500 trees)Nursery pond area 0.05 ha, depth 1.0 mHouse and cattle (03No) 0.05 ha yard areaFodder land area 0.1 ha
Fig. 1. Pre-adoption survey (a) Location map (Google earth) of study area, (b) Initial soil sampling of salt affected pond bottom,(c) Barren view of pond area
Fig. 2. Various post adoption intervention of pond (a) Pond bottom profile study, (b) Renovation of pond, (c) Pond areapreparation
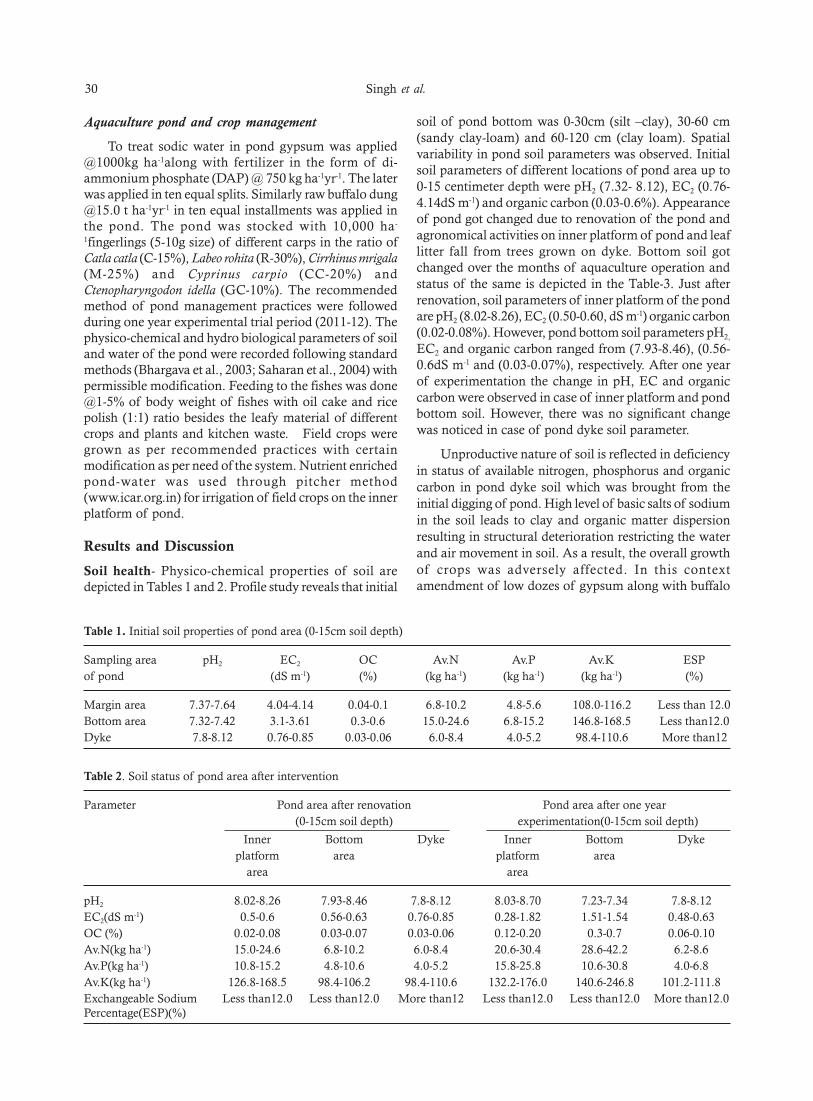
30 Singh et al.
Aquaculture pond and crop management
To treat sodic water in pond gypsum was applied@1000kg ha-1along with fertilizer in the form of di-ammonium phosphate (DAP) @ 750 kg ha-1yr-1. The laterwas applied in ten equal splits. Similarly raw buffalo [email protected] t ha-1yr-1 in ten equal installments was applied inthe pond. The pond was stocked with 10,000 ha-
1fingerlings (5-10g size) of different carps in the ratio ofCatla catla (C-15%), Labeo rohita (R-30%), Cirrhinus mrigala(M-25%) and Cyprinus carpio (CC-20%) andCtenopharyngodon idella (GC-10%). The recommendedmethod of pond management practices were followedduring one year experimental trial period (2011-12). Thephysico-chemical and hydro biological parameters of soiland water of the pond were recorded following standardmethods (Bhargava et al., 2003; Saharan et al., 2004) withpermissible modification. Feeding to the fishes was done@1-5% of body weight of fishes with oil cake and ricepolish (1:1) ratio besides the leafy material of differentcrops and plants and kitchen waste. Field crops weregrown as per recommended practices with certainmodification as per need of the system. Nutrient enrichedpond-water was used through pitcher method(www.icar.org.in) for irrigation of field crops on the innerplatform of pond.
Results and Discussion
Soil health- Physico-chemical properties of soil aredepicted in Tables 1 and 2. Profile study reveals that initial
soil of pond bottom was 0-30cm (silt –clay), 30-60 cm(sandy clay-loam) and 60-120 cm (clay loam). Spatialvariability in pond soil parameters was observed. Initialsoil parameters of different locations of pond area up to0-15 centimeter depth were pH2 (7.32- 8.12), EC2 (0.76-4.14dS m-1) and organic carbon (0.03-0.6%). Appearanceof pond got changed due to renovation of the pond andagronomical activities on inner platform of pond and leaflitter fall from trees grown on dyke. Bottom soil gotchanged over the months of aquaculture operation andstatus of the same is depicted in the Table-3. Just afterrenovation, soil parameters of inner platform of the pondare pH2 (8.02-8.26), EC2 (0.50-0.60, dS m-1) organic carbon(0.02-0.08%). However, pond bottom soil parameters pH2,
EC2 and organic carbon ranged from (7.93-8.46), (0.56-0.6dS m-1 and (0.03-0.07%), respectively. After one yearof experimentation the change in pH, EC and organiccarbon were observed in case of inner platform and pondbottom soil. However, there was no significant changewas noticed in case of pond dyke soil parameter.
Unproductive nature of soil is reflected in deficiencyin status of available nitrogen, phosphorus and organiccarbon in pond dyke soil which was brought from theinitial digging of pond. High level of basic salts of sodiumin the soil leads to clay and organic matter dispersionresulting in structural deterioration restricting the waterand air movement in soil. As a result, the overall growthof crops was adversely affected. In this contextamendment of low dozes of gypsum along with buffalo
Table 1. Initial soil properties of pond area (0-15cm soil depth)
Sampling area pH2 EC2 OC Av.N Av.P Av.K ESPof pond (dS m-1) (%) (kg ha-1) (kg ha-1) (kg ha-1) (%)
Margin area 7.37-7.64 4.04-4.14 0.04-0.1 6.8-10.2 4.8-5.6 108.0-116.2 Less than 12.0Bottom area 7.32-7.42 3.1-3.61 0.3-0.6 15.0-24.6 6.8-15.2 146.8-168.5 Less than12.0Dyke 7.8-8.12 0.76-0.85 0.03-0.06 6.0-8.4 4.0-5.2 98.4-110.6 More than12
Table 2. Soil status of pond area after intervention
Parameter Pond area after renovation Pond area after one year(0-15cm soil depth) experimentation(0-15cm soil depth)
Inner Bottom Dyke Inner Bottom Dykeplatform area platform area
area area
pH2 8.02-8.26 7.93-8.46 7.8-8.12 8.03-8.70 7.23-7.34 7.8-8.12EC2(dS m-1) 0.5-0.6 0.56-0.63 0.76-0.85 0.28-1.82 1.51-1.54 0.48-0.63OC (%) 0.02-0.08 0.03-0.07 0.03-0.06 0.12-0.20 0.3-0.7 0.06-0.10Av.N(kg ha-1) 15.0-24.6 6.8-10.2 6.0-8.4 20.6-30.4 28.6-42.2 6.2-8.6Av.P(kg ha-1) 10.8-15.2 4.8-10.6 4.0-5.2 15.8-25.8 10.6-30.8 4.0-6.8Av.K(kg ha-1) 126.8-168.5 98.4-106.2 98.4-110.6 132.2-176.0 140.6-246.8 101.2-111.8Exchangeable Sodium Less than12.0 Less than12.0 More than12 Less than12.0 Less than12.0 More than12.0Percentage(ESP)(%)

Productive Utilization of Sodic Water 31
Table 3. Physico-chemical and biological parameter adoptedpond water
Parameter Tube Well Pond
Water depth (m) Deep(50m) 2.0Transparency(cm) Clear water 16-24Water temperature(0C) 20-28 10-36pH2 7.5-8.20 7.2-8.3EC2 (dS m-1) 0.4-0.85 < 0.4D.O.(mg l-1) 3.0-3.4 4.0-8.2Free CO2 8.0-10.6 4.2-8.4RSC (meq l-1) 2.5-4.1 < 0.8CO3 (meq l-1) Nil NilHCO3 (meq l-1) 4.2-8.6 3.6-6.2Ca+Mg (meq l-1) 1.7-4.5 3.2-5.4NO3 –N (mg 1-1) 3.0-6.2 3.1-7.3Total Phosphorous (mg 1-1) 0.01-0.04 0.10-0.24Potassium (mg 1-1) 1.6-2.4 1.2-1.8Plankton production (ml/100 l water) - 2.5-3-0Bottom biota (Nos m-2) - 10-12Fish production(kg ha-1yr-1) - 6000
dung was helpful for both soil and water improvement.Obviously for amendment of sodic soils, application ofnitrogen and phosphorus carriers at recommended ratesis necessary. This could only be met by addition of higherdozes of organic waste (raw buffalo dung and DAPfertilizer). The improvement in pH, EC and organiccarbon of the inner platform and bottom soil after oneyear of experimentation was found to be pH2 (8.03-8.70),EC2 (0.28-1.82 dS m-1) and organic carbon (0.12-0.20%)for inner platform and pH2 (7.23-7.34), EC2 (1.51-1.54dS m-1) and organic carbon (0.3-0.7%) for bottom is quiteconsiderable as for as aquaculture is concerned(Banerjea,1967; Rao et al.,1999; Pandey and Kumar,1998;Sarkar, 2004; Singh, 2012). Soil organic carbon affectsthe soil fertility and physical conditions and more so insalt-affected soils. The organic carbon enhancement dueto aquaculture operation in salt affected soils is noticedin the present study, which indicated good fertility statusof pond bottom soil (Masuda and Boyd, 1994; Chatterjeeand Saha, 2000). Leaf litter fall from pigeon pea andagroforestry plants also added soil organic carbonimprovement on the inner platform of the pond (Gill etal., 1987; Singh et al., 1997).
Water use and fish production: Water is of vitalimportance for the existence of aquatic life. Precipitationand ground water are the major sources of water foraquaculture. Pure water is unable to support aquatic lifebut when it is enriched with various substances from bothsoil and air, it can sustain life. The amount of thesedissolved substances depends on their status in soil andalso dissolution in water through physco-chemical andbio-chemical process. Thus, depending on the geologicalformations, most of the minerals present in soil are also
found to be present in varying concentration in water andthe amount of these substances including the gasesdissolved alter the water quality. Some of the water qualityparameters recorded in this study (Table 3) revealed thatwater depth, water transparency, water temperature, waterpH and EC were very much with in the range of optimumvalues as suggested by Boyd (1984), Banerjee (1967), Rao,et al. (1999) and Singh (2012). The RSC of water usedwas neutralized by the application of gypsum and rawbuffalo dung. As we know the RSC is measure of Ca andMg in the water supply which reacts with HCO3 and CO3
to precipitate as insoluble lime. Reaction of the sulfursource gypsum (CaSO4) is beneficial for alleviating sodicconditions if leaching is sufficient to remove the Na inthe form of Na2SO4 (Carrow et al., 2007). Application ofraw buffalo dung with its acidic character helps to evolveCO2 gas plus water from the HCO3 and CO3. It is highlydesirable since it allows any Ca and Mg in the water sourceto remain soluble so that they could displace Na from thesoil and also it allows soil- applied amendments to bemore effective in producing relatively soluble Ca. It isgenerally accepted that addition of organic materialsreduced sodicity both in soil and water and beneficialeffects of this are mainly attributed to improving soilproperties and their role in reducing nitrogen volatilizationlosses and enhancing nitrogen use efficiency (Choudhary,2013). Shading effects of agroforestry trees (Fig.3) andground water temperature (Table 3) help to maintaincongenial temperature regime in the pond water duringwinter and summer as well and ultimately help inenhancing higher fish productivity which corroboratefindings of Halver (1972) and Adrian (2004). Pond’sinherent productive capacity has been enhanced throughmanuring of raw buffalo dung (Table 2). Addition of farmyard manure and pond water also increased productivityof the inner platform of pond (Table 3). However, leachingof salts from the pond dyke especially during monsooncreated higher pH and EC of soil on the inner platform;which also corroborate the findings of Rao et al. (1999)and Singh (2012). Growth of fish in one year of cultureoperation under neutralized unproductive RSC watercondition is found to be 625-1150g (Table 4 and Fig. 3).The fish production in such conditions has been found tobe 6.0 ton/ha/year (Table 4).
The higher fish productivity in sodic soil with goodwater condition has been observed by other workers ( Raoet al., 1999; Singh, 2012). Stocking of adequate size offish resulted higher growth and production during theexperimentation. General checkup of pond water levelmaintenance especially during summer and monsoonwere given due care. It is well known that the preventionis better than cure. So prior to stocking, the fingerlingshave been given bath with 3ppm KMnO4 for 30-60seconds. Feed is the main governing factor in determiningthe growth rate of fish. Natural fish food production waslimited (Table 3), therefore for getting higher production

32 Singh et al.
Table 4. Fish productivity parameters of the pond
Stocking details Harvesting details
Sp. Stocking Nos. Av. wt Total Recovery Recovery Av. wt. Total Net wt. Yield Speciesratio (%) (g) wt(g) (No.) (%) (g) wt.(kg) (g) (kg ha-1yr-1) yield( %)
R 30 900 5 4500 729 70.0 975 614.3 609.7 2045.0 33.73C 15 450 10 4500 351 52.0 1050 245.7 241.2 818.0 13.49CC 20 600 8 4800 534 71.0 625 266.3 261.5 886.6 14.62M 25 750 7.5 5625 660 70.O 850 446.3 440.6 1486.0 24.51GC 10 300 8.5 2550 276 82.0 1150 248.4 245.8 827.2 13.64
Fig. 3. Species wise growth of different type fishes
application of feed from outside in terms of leaves ofvarious seasonal plants, kitchen waste, rice bran and oilcake in the proper ratio was found beneficial. Terrestrialgrasses and forages were useful for the growth of grasscarp. The study also indicated the possibility of higherproductivity of fish after further better management andscientific interventions in terms of species diversificationand balanced supplementary feed. The physico-chemicaland hydrobiological parameters of the pond arecomparable to normal soil and freshwater ponds.However, higher level of nitrate, phosphate and potassiumprovided nutrient enhancement in the pond water whichresulted beneficial effect for plankton production (Table3). The species recovery from the pond after harvest werefound in the order of Catla catla< Ctenopharyngodon idella<Cyprinus carpio< Cirrhinus mrigala < Labeo rohitarespectively (Fig. 4).This indicated proper utilization ofnatural food, plant waste and supplementary feed by thefish. Bottom seepage of pond water provided nutrientenriched water movements towards root zone ofagroforestry plants grown on the pond dyke whichcorroborate the findings of other studies (Muendo et al.,2005; Stone and Boyd, 1989; CSSRI, 2008b). In one otherstudy it was observed that sodic soil having soil pH morethan 10.5 is good source of sealing material of waterseepage of pond (Shah et al., 1986) but in the present studyall the cases of pond area soil pH were below the aboverange (Tables 1- 3). Aquaculture-agro forestry system isgood for utilizing nutrient loss from pond ultimatelyreflected in tree growth in terms of appearance of higher
Fig. 4. Species wise yield contribution (%) in total fishproduction
Table 5. Economics of pond aquaculture
Item Cost (Rs)
Operational cost
Pond value (small farmers own pond) Nil
Renovation of pond 15,000
Water filling charges 5,000
Cost of 300kg Gypsum 250
Cost of buffalo dung/own cattle dung Nil
Cost of feed (Mustard oil cake-1000kg+ 25,000Rice bran1000kg)
Cost of 250kg DAP 3000
Cost of 3000 Nos fingerlings 6,000
Manpower/Family involvement Nil
Netting charges(Adjusted with fish sale Nilto the party
Other expenses 5,700
Total operational cost 60,000
Interest@10%/yr 6,000
Total expenditure 66,000
Output/Return
Cost of per kg fish production 36.30
Income from 1820 kg fish @ Rs 90/kg farm 1,63,800gate price
Benefit cost ratio 2.48
Net profit 97,800
Net return 148%

Productive Utilization of Sodic Water 33
girth compared to near by other places in lesser span oftime. Oxygen production from the plants is added benefitfor pond surrounding environment and emphasize mutualbenefit for agroforestry and aquaculture (Fig. 5).
Crop productivity and profitability
The production of different field crops is depicted inthe Table 6 and Figs. 5 and 6.
Dalai (1989) and Chandra (2012) documented thecultivation of pigeon pea on pond dyke in the normalsoil and water conditions of the eastern parts of thecountry. Importance of cultivation of pigeon pea in thenorth western part of country was a cause of concern(ICAR, 1998). In the present unique venture it has been
grown lateral side of dyke after developing suitable innerplatform where shading of tree and nearby low line pondwater was with in reach without hindering nettingoperation (CSSRI, 2011-12). It was observed that potato,pigeon pea grown on the inner platform had no adverseimpact of winter chill and frost (Fig.5 a,b,c). Whereasthe potato grown on nearby plot outside the study area,was severely damaged. No damage to potato crop on theinner platform was observed mainly due to ambientfloating latent heat generated from the pond water duringwinter which corroborates findings in case of heat transferfrom small cylindrical fish rearing pool by Sarkar et al.,2006 and occurrence of congenial microclimaticconditions in the plant based surrounding. This reflected
Fig 5. Different stages of aquaculture led integrated farming practice (a) cultivation of pigeon pea &vegetable crop on innerplatform,(b) cultivation of potato on inner platform of the pond,(c) Pond netting operation and all integration view includingagroforestry plants, (d) Initial fish sampling, (e) Haul of fish harvest, (f) Growth of fishes and final fish harvest.
Fig. 6.Cropwise production & their benefit cost ratio
Table 6. Multiple production of different crop and their benefitcost ratio
Crop Production Expenditure Income BC(kg) (Rs) (Rs) ratio
Fish 1820 66,000 1,63,800 2.48Potato 1000 3000 10,000 3.33Onion 400 1000 6,000 6.0Garlic 100 500 2000 4.0Turmeric 100 500 2000 4.0Maize 200 500 2000 4.0Pigeon pea 40 500 2000 4.0Total 1,02,000 1,90,000 1.9

34 Singh et al.
the importance of this system as climate smartaquaculture- led integrated farming. The profitabilityanalysis of adopted farmer’s pond is presented in Table5.
The gross and the net return of fish produced fromthe 0.3 ha pond were Rs 1,63,800 and 97,800, respectively.The benefit cost ratio (BCR) is depicted in the Table 5and Fig. 3 and it was 2.48 for fish, 3.33 for potato, 6.0 foronion, 4.0 for garlic, 4.0 for turmeric, 4.0 for maize and4.0 for pigeon pea (Fig. 6). Overall combine BCR for allthe produce was 1.9. Economic profitability analysis offish culture-led integrated farming system showed higherBCR for all the produce in overall perspective. This ismainly due to irrigation on field crops from nutrientenriched pond water. The study revealed that there is scopefor increasing productivity and profitability of aquacultureled integrated farming system in poor ground water supplycondition. It also reflected that pond water has providedbeneficial effects due to its nutrient enriched utility forirrigating field crops. Outcome of this type of farmer-scientist led innovation will provide livelihood option tothe resource poor farmers in problematic areas.
Conclusion
The sodic (high RSC) water with certain amendments(chemical & organic) can be used for productive utilizationof aquaculture-led integrated farming practice. Besidesthe higher income, the family meets the nutritionalrequirement by in-house production of quality nutrient-rich products such as pulses, milk, different type ofvegetables, fruits and fish. Due to the interventions madein the farming systems practice, the family gets additionalemployment besides eco-friendly environments andcooking fuel from branches of trees.
Acknowledgements
The authors sincerely thank Director, CSSRI, Karnalfor providing necessary facilities required for the study.We are also thankful to Dr JC Dagar for critical inputsduring preparation of draft. For renovation of pond,partial financial support of Ministry of Water Resources,Government of India is dually acknowledged.
References
Abdullah M (2004).Technologies on Livestock and Fisheries forPoverty Alleviation in SAARC Countries.SAARCAgricultural Information Centre (SAIC), Dhaka,Bangladesh, pp 232.
Adrian Lawler (2004). Shading to increase water (andoxygen) circulation in ponds during the summer,Aquaarticles: 1-3.Link to http://www.aquarticles.com/
Banerjea SM (1967). Water quality and soil condition of fishponds in some states of India in relation to fishproduction. Ind. J. Fish. 14: 115-144.
Bhargava GP (2003).Training manual for undertaking studieson genesis of sodic/alkali soils. CSSRI, Karnal, India,pp 111.
Boyd CE (1984). Water Quality Management for Pond FishCulture. Elsevier Scientific Publishing Company, U.K,pp 318.
Carrow RN, Duncan RR and Huck M (2007).Treating thecause, not the symptoms, Irrigation water treatment forbetter infiltration. Green Section Record, USGA, pp 12.
Chandra Suresh (2012). Pulse crop-fish integration in Shirhirvillage of Allahabad. In: Aquaculture Success Stories,CIFA, India, pp 104-111.
Chatterjee DK and Saha PK (2000).Effect of organicmanures on organic carbon content of submerged pondsoil. The Israeli Journal of Aquaculture-Bamidgeh 52(3):118-126.
Choudhary OP (2013). Managing sodic ground waters forsustainable crop production. In: Chaudhari SK, ParveenKumar, Singh SK and Thimmappa K (eds), ICARSummer School on Technological Innovations forShaping Future Agriculture in Salt Affected Areas.CSSRI,Karnal,India, pp 100-106.
Chung DK, Demaine H, Trang PV, Dien NQ and Bau P(1995). VAC Integrated Farming Systems in Red RiverDelta: An Overview, Research Institute for AquacultureNo. 1. Ha Bac, Vietnam.
CSSRI (2008a). Integrated Farming System Model forWaterlogged Sodic Soils.Tech.Bull.No.1/2008 CSSRI,Station, Lucknow, India: 12p.
CSSRI (2008b). Biodrainage: Eco-friendly Technique forCombating Waterlogging and Salinity.Tech.Bull.No.9/2008. CSSRI, Karnal and Haryana Forest Department,Panchkula, India pp 24.
CSSRI (2009). Eco-friendly Integrated Multienterprise Model forLivelihood Security in Small Farm Holdings- Tech. Bull. No.05/2009. CSSRI Karnal, India, pp 28
CSSRI (2011-12). Central Soil Salinity Research Institute-Annual Report. CSSRI,Karnal,India, pp 182.
Dalai S (1989). Production of pulses and oilseeds on fishpond embankment.In: Training Compendium No.2,CIFA (KVK), Kausalyagang, India, pp 38-41.
Edwards P (2000). Aquaculture, poverty impacts andlivelihoods. Natural Resource Perspectives 56: 8 p.
Gill HS, Abrol, IP and Samra JS (1987).Natural cyclingthrough litter production in young plantations of Acacianilotica and Eucalyptus tereticornis in highly alkaline soil.Forest Ecology and Management. 22: 57-69.
Gopakumar K, Ayyappan S and Jena JK(2000) Present statusof integrated fish farming in India and wastewatertreatment through aquaculture, In: Kumar MS (ed).Prooceeding of the National Workshop on WastewaterTreatment and Integrated Aquaculture Production,South Australian Research and Development Institute,West Beach, Adelalde, Australia. pp.22-37.

Productive Utilization of Sodic Water 35
Gupta SK (2010). Management of Alkali Water- TechnicalBulletin,01/2010, CSSRI Karnal, India. pp 62.
ICAR (1998). Decline in Crop Productivity in Haryana andPunjab:Myth or Reality?, Indian Council of AgriculturalResearch, New Delhi.
Jharendu P, Demaine Harvey and Edwards Peter (2005). Bio-resource flow in integrated agriculture–aquaculturesystems in a tropical monsoonal climate: a case study inNortheast Thailand. Agricultural Systems 83: 203-219.
Halver JE (1972). Fish Nutrition. Academic Press, London,pp 541.
Luu LT (2001). The VAC system in Northern Vietnam. In:Integrated Agriculture–Aquaculture: A Primer. FAOFisheries Technical Paper 407. FAO/IIRR/World FishCenter.
Masuda K and Boyd CE (1994). Chemistry of sediment porewater in aquaculture ponds built on clayey, Utisols atAuburn, Albama. Journal of the World Aquaculture Society25: 396-404.
Muendo PN, Stoorvogel JJ, Gamal EN and Verdegem MCJ(2005). Rhizons improved estimation of nutrient lossesbecause of seepage in aquaculture ponds. AquacultureResearch 36: 1333-1336.
Pandey AC and Kumar R (1998). A preliminary study onthe soil characteristics of fish ponds located under sodicsoil conditions. Geobios 25: 180-182.
Prein M (2002). Integration of aquaculture into crop-animalsystems in Asia. Agricultural Systems 71(1): 127-146.
Rao AP, Tiwari N and Singh R (1999). Culture of exoticand major carps in alkaline/sodic soils: A case study.
In: Proceedings The Fourth Indian Fisheries Forum,1996 24-28 Nov., Cochin, India, ,pp 223-225
Saharan N, Prakash C and Raizada S (2004). Soil, water andaquatic biota analysis- A Methods Manual. CIFE,Mumbai, India, p 128.
Sarkar Bikash,Tiwari GN and Ayyappan S (2006). Modellingand experimental validation of water temperature in afish rearing tank. Indian J. Fish. 53(3): 237-243.
Sarkar SK (2004). Sodic soil fish ponds: Studies on thefeatures of their ecosystem and management practices.Fishing Chimes 24(3): 52-53
Shah KL, Tyagi BC and Kamra SK (1986). Report on theuse of alkali soil and sodium carbonate as sealants forcontrolling seepage losses in fish ponds- ResearchBulletin No.42. CIFRI, Barrackpore (W.B.), p 9.
Singh Harinder, Singh Gurbachan and Singh Rachhpal(1997). Effect of Eucalyptus tereticornis litter on propertiesof an alkali soil. Journ. Indian Society of Soil Science 45:65-66.
Singh Sharad Kumar (2012). Studies on different mode ofaquaculture operation under three different ageing pondfish culture trails of sodic land. International Journal ofTropical Agriculture 30(3-4): 117-120.
Stone NM and Boyd CE (1989). Seepage from fish ponds.Bull. 599, Alabama AgriculturalExperiment Station,Auburn University, Alabama, USA.
www.googleearth.com
www.icar.org.in. CSSRI pitcher irrigation technology forvegetable production in arid areas. ICAR e-books: 80-82.
Received: January, 2014; Accepted: May, 2014

Water Management and Usage of Nallamada Drain Water –A Quantitative Assessment
A. Sambaiah, G.V. Lakshmi, M. Raghu Babu, K. Hema and M. Latha
AICRP-Saline Water Scheme, Bapatla
Abstract
The Krishna Western Delta is drained naturally by 7 major natural drains, out of which Nallamada drain isvery important source of irrigation, which falls in Guntur and Prakasam districts. It was found that the totalquantity of water flows in Nallamada drain in a year was 49 TMC. Peak outflow in all the years was observedin the month of November. The highest salinity was observed during July to August. Only 6 TMC of water wasused for all the Lift irrigation schemes and for all the crops under Nallamada command in Krishna WesternDelta and the remaining 43 TMC of quantity of water joins sea every year. As the existing cross section isunable to carry the climate change induced impulsive peak discharges, the cross section has to be enhanced.The electrical conductivity of Nallamada drain water below Kommamuru Canal zone during cropping seasonis found well below 1.5 dS/m and during pre-monsoon season, it ranges between 4 dS/m to 14 dS/m from theyear 2008-2013, which is due to back water flow from the sea to the drain till 21.2 km. The enhanced flows ofthe Nallamada drain are causing floods damaging standing crops and nearby habitats, which can be avoided byincreasing the existing cross section, upper catchment soil and water conservation treatment, and strengtheningof the bunds/banks of the drain through making dykes or concrete coring.
Key words: Discharge, Drain cross section, Electrical conductivity, Floods, Nallamada drain, Waterlogging,Drainage water, Yields.
Introduction
Irrigated agriculture is already the largest consumerof developed water resources. At the same time, drainagereturn from irrigated lands is one of the major causes ofwater logging (usually in lower lying regions) and of waterpollution (with respect to salts, nitrates, agriculturalchemicals and certain natural, potentially toxic traceelements).
Drainage water, once thought of as wastewater, isnow used in many countries for irrigation. The salinitylevels vary, but often the salt levels are higher than thoseof conventional primary irrigation water sources. Reuseof drainage effluent is important when the supply of goodquality irrigation water is limited, and it is also an efficientmeans of reducing water pollution.
Drainage water is used for crop production on manyfarms in California, USA. The saline sub-surface drainagewater is blended with Delta-Mendota Canal water in theBroadview Water District of California to form blendedwater of a salinity equivalent to 3.2 dS/m and since 1956is used to grow a variety of crops. Over time, the croppingpattern in this district has changed as the water qualityhas decreased. Crops now grown are mostly cotton, barleyand alfalfa. Representative salinities and potentials for use
as irrigation waters and drainage waters from the majorirrigated areas of the USA are described by Rhoades (1977).
The development of crops with increased salttolerance and the adoption of new crop and watermanagement strategies will further enhance and facilitatethe use of saline waters for irrigation and crop production,while keeping soil salinity from becoming excessive. Thereuse of drainage waters for irrigation will also help toconserve water and to minimize the hazardous effects ofirrigation on the environment and ecology.
The coastal districts of Andhra Pradesh weresubjected to frequent cyclones during the years1990,1994,1997,1998 and heavy floods in 2000 causedirrecoverable damage to the infrastructure in AndhraPradesh, which calls for immediate attention to thedrainage system in the basin. The Krishna Western Deltais drained naturally by 7 major natural drains, out of whichNallamada drain which falls in Guntur and Prakasamdistricts assumes important role in mitigation of floods.
In coastal regions, surface water sources can becomesaline due to the tidal influence of the sea. As the hightide moves into the coastal area, seawater moves intostreams and drainage canals and travels inland. Thisupstream migration of seawater alters the quality ofwater in affected streams and drainage canals significantly.This phenomenon is also observed during times ofdrought.
Journal of Soil Salinity and Water Quality 6(1), 36-41, 2014
*Corresponding author

Groundwater Quality of Kanina Block 37
The water flows from this drain is being used forcultivation on either side using lift irrigation schemes sinceno canal water is available for cultivation in this regionfor upland command. The farmers have been using thisdrain water for ID Crops like Maize, Chillies, Bengalgramand vegetables for the last few years. Hence, it is essentialto carry out further investigations on quantitativeassessment of Nallamada drain water during differentperiods, back water flow influence, quantification of drainwater withdrawal and depth of irrigation for differentcrops at different growth stages and salt accumulation.Further investigations on suitable soil reclamationtechniques and crop management practices as well asdrain water application techniques need to be formulatedby considering the water budgeting and quality underdifferent lift irrigation schemes existing along theNallamada drain.
Study Area
Nallamada drain originates and passes throughKondaveedu Hills, Vinukonda, Narasaraopeta andChilakaluripeta in Guntur district. The total length of theNallamada drain is 77 km, with a bed width of 90 m andmaximum flood depth of 4.5 m with side slopes of 3:1.The maximum flow velocity is 1.35 m/s. The Nallamadadrain has upland catchment of 162227.24 ha and11129.23 ha of lowland (Delta) catchment. During floods,the water from this drain flushes into nearby canals andis damaging the existing irrigation systems. The totallength of the drain can be divided into 5 sections, 0 to -1.3 km into sea, 0 to 8.4 km till Nallamada diversion, 8.4to 21.2 km (Nallamada below Kommamuru Canal), 21.2to 39.6 km (Nallamada above Kommamuru Canal) and39.6 to 77.0 km (Vogeru Vagu). The tidal effect in thisdrain was identified upto 15.5 km upstream.
Gupta (1990) has treated the subject of saline wateruse in India comprehensively. He reported that the salinitylevel of the Ganges river in India is very low and averagetotal dissolved salt concentration is less than 200 mg/l.
Material and Methods
Collected monthly and annual discharges atfortnightly interval both from Nallamada drain aboveKommamuru Canal, Nallamada drain belowKommamuru canal and Kommamuru canal (AppapuramCanal) for time series analysis and comparative studies.The water samples were analysed for the electricalconductivity and pH to study the suitability of Nallamadadrain water for irrigating the crops. The basic data onexisting lift irrigation schemes were collected for liftirrigation scheme LIS) efficiency and conducted cropwater use survey under Pedanandipadu Lift IrrigationScheme and collected information. The lift irrigationscheme field use efficiency is
…(1)
Stream velocity distribution over a cross section
The velocity of a river, stream or channel variesthroughout the cross section and depends upon suchthings as the shape of the cross section, roughness of thestream bed and depth of water. Minimum velocity occursat the bed (surface friction) and maximum velocity a littlebelow the surface well clear of the banks in deepest water.In fast flowing streams the position of maximum velocitymoves from bank to bank. Figure 2 shows a stream crosssection with the dotted curves representing lines of equalvelocity.
Fig. 1. Nallamada drain during rainy season
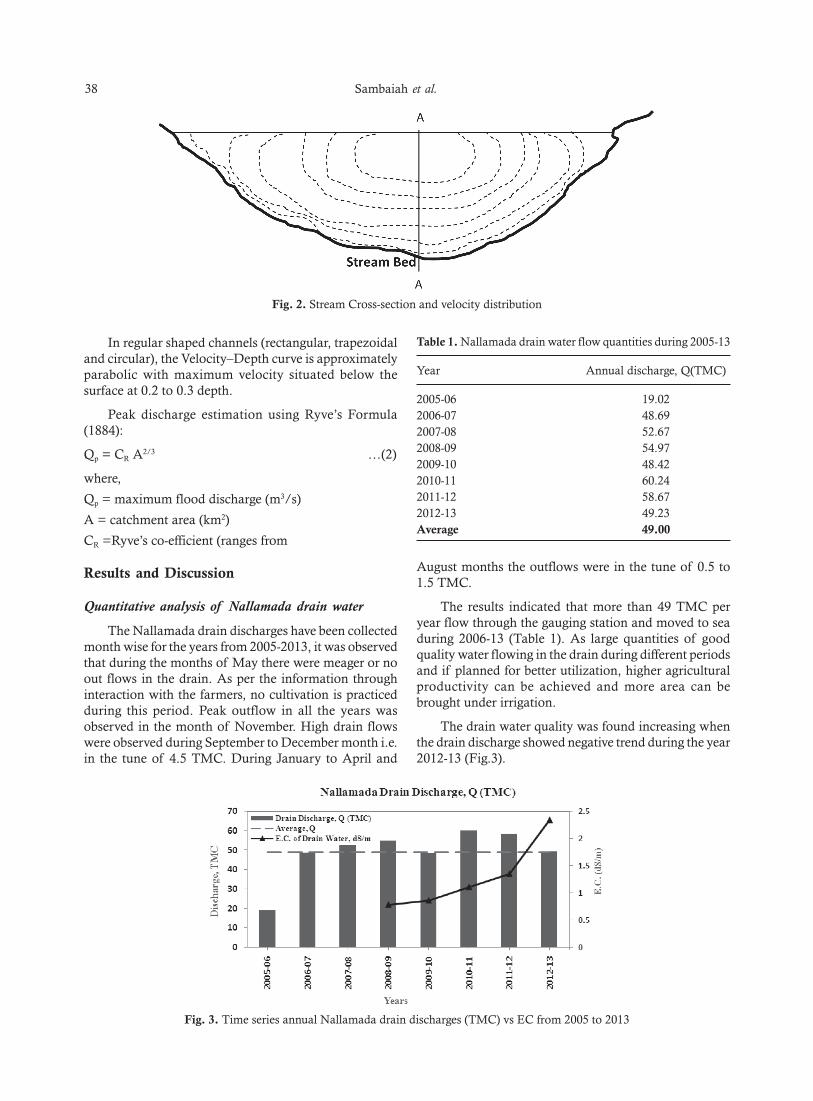
38 Sambaiah et al.
In regular shaped channels (rectangular, trapezoidaland circular), the Velocity–Depth curve is approximatelyparabolic with maximum velocity situated below thesurface at 0.2 to 0.3 depth.
Peak discharge estimation using Ryve’s Formula(1884):
Qp = CR A2/3 …(2)
where,
Qp = maximum flood discharge (m3/s)
A = catchment area (km2)
CR =Ryve’s co-efficient (ranges from
Results and Discussion
Quantitative analysis of Nallamada drain water
The Nallamada drain discharges have been collectedmonth wise for the years from 2005-2013, it was observedthat during the months of May there were meager or noout flows in the drain. As per the information throughinteraction with the farmers, no cultivation is practicedduring this period. Peak outflow in all the years wasobserved in the month of November. High drain flowswere observed during September to December month i.e.in the tune of 4.5 TMC. During January to April and
August months the outflows were in the tune of 0.5 to1.5 TMC.
The results indicated that more than 49 TMC peryear flow through the gauging station and moved to seaduring 2006-13 (Table 1). As large quantities of goodquality water flowing in the drain during different periodsand if planned for better utilization, higher agriculturalproductivity can be achieved and more area can bebrought under irrigation.
The drain water quality was found increasing whenthe drain discharge showed negative trend during the year2012-13 (Fig.3).
Fig. 2. Stream Cross-section and velocity distribution
Table 1. Nallamada drain water flow quantities during 2005-13
Year Annual discharge, Q(TMC)
2005-06 19.022006-07 48.692007-08 52.672008-09 54.972009-10 48.422010-11 60.242011-12 58.672012-13 49.23Average 49.00
Fig. 3. Time series annual Nallamada drain discharges (TMC) vs EC from 2005 to 2013

Groundwater Quality of Kanina Block 39
During 2009-10 despite increase in discharges, thesalinity of drain water continued to increase which mightbe due to sea water back flow into the drain fromNallamada diversion. The discharge of water in the drainfrom 2006-07 is well above the average flow (49.0 TMC)in the drain. During 2005-06 the drain flows are foundvery minimum. As the existing dimensions of the drainare depicted through the following figure. 4.
The drain water flow velocities are in the range of1.35 to 1.56 m/s with a bed slope of 1 in 5280 m to 1 in4125m. The existing free board provided is 1 m. The topwidth of the banks is 5.50 m with a berm width of 5.0 m.
As the existing cross section is unable to carry theincreased peak discharges, the above drain cross sectionhas to be enhanced to carry such impulse responsescausing floods on the neighboring agricultural lands andhabitats. The construction of check dams on this draincan be constructed with adequate consideration of peakdischarges in the climate change scenario. The option ofconstruction of balancing reservoirs is limited by the soiltype i.e., largely black soils which cracks in summer andcakes in winter resulting huge seepage developingwaterlogged and saline soils around. Further, the landacquisition, compensation and cost is a long-term issueand not easily tenable for construction of reservoirsalongside. The upper catchment treatment with soil andwater conservation measures like percolation ponds, farmponds, check dams as a part of watershed developmentis to be taken up immediately for in-situ water harvestingwhich substantially reduces the flood flows and siltationinto the Nallamada drain.
Due to low velocity distribution at the bottom of thedrain, the sediments collected from the catchment areagot deposited in the bed of the Nallamada drain, whichreduced the carrying capacity of flows substantially. Thisresulted into occurrence of floods in the area at a rateone in every alternate year. This can be overcome byenhancing the carrying capacity of the drain by improvingthe cross-section of the drain by increasing the designe.g., Ryve’s co-efficient from the existing.
Irrigation Efficiency of Nallamada drain water in aLIS: Nagulapadu a case study
Andhra Pradesh State Irrigation DevelopmentCorporation has designed and executed the lift irrigation
scheme (LIS) in Nagulapadu command in the year 2005.To assess, whether the LIS was under designed oroverdesigned, the total capacity of the LI scheme withthe design capacity was worked out with practicallyobserved reasonable assumptions with a due feedbackfrom the beneficiary farmers. The system’s water deliveryand farmers’ actual crop consumption in the field werecompared (as follows) for estimation of the lift irrigationscheme efficiency as it is a prerequisite for extendingirrigation benefits to the other tail end of the command.
Designed discharge of LIS Project = 17.60 cusec (Totalfrom 3 pump sets)
1 hour discharge = 101916 l.1 Day (8 hours discharge) = 815328 l.1 month discharge = 24459840 l.1 year (10 months) discharge = 244598400 l.Water pumped for utilization per year = 0.150656 TMCH≈
0.151 TMC
0.135LI Scheme field use efficiency = ––––– × 100=89.4
0.151
% (Say 90%)
It is obvious that remaining 10 % of the pumped waterfrom the scheme may be due to the ground water recharge,canal seepage or for deep percolation losses in all the fieldsor application losses within the fields.
Crop water requirements of various crops in NallamadaDrain command
The crops grown in the nallamada drain commandarea under lift irrigation schemes are cotton, tobacco,chilli, maize and Bengal gram. The choice of cropssometime change due to soil problems (salinity, alkalinityetc.) and rainfall pattern in the region. The waterrequirement by these crops is shown in Table 2.
It was found from the Table 2, the total quantity ofwater flow in Nallamada command in a year was 49TMC. Out of which only 6 TMC of water was used forall the LI schemes and for all the crops under Nallamadacommand in Krishna Western Delta. The remaining 43TMC of quantity of water joins sea every year. Underthe Nallamada command the maximum water wasutilized by Cotton crop and the minimum water wasutilized by Bengal gram. The water quality of Nallamada
Fig. 4. The existing average cross sectional details of Nallamada drain

40 Sambaiah et al.
drain remained useful for irrigation throghout exceptduring July, 2011 & 2012.
Yield patterns in Nallamada Command Area
During 2008-09 to 2010-11, the farmers cultivatedcotton, chillies, tobacco and maize due to availability ofwater from the LIS on Nallamada. But later on, the flowshave increased, but flow is getting drained into sea atimpulse rated due to high intensity rainfalls, which forcedthe farmers to diversify their cropping pattern by addingother crops like Bengal gram, green gram, paddy, blackgram, soyabean, fodder sorghum, white sorghum andcluster bean, as a measure to combat the water and salinestresses on their cropping systems. The yields of differentcrops grown in this area were presented in Table 3.
From the figure 5 and 6, it can be inferred that the asthe EC of drain water increased from the year 2008-09 to2012-13 where the pH remained almost constant, theyields decreased till 2011-12 and started increasing for allthe crops. The maize crop showed substantial toleranceagainst electrical conductivity of drain water used forirrigation. The increase in EC from 1.00 dS/m to 1.5 dS/m, resulted in sharp decrease in the crop productivity of
chillies, tobacco and Bengal gram where as the cottonproductivity increased slightly due to better managementpractices.
The figure 7 reveals that during 2011-12 and 2012-13, the productivity of paddy, green gram, maize, blackgram, Bengal gram, soya bean, tobacco, fodder sorghum,white sorghum, cluster bean, cotton and chillies is almostsame.
Table 2. Estimation of crop water requirements and Nallamada water consumed through LIS
S.No Crops Extent, Water Requirement
ha mm ha.mm ha.m Cu.m Cu.ft TMC
1. Cotton 4528.6 743 3364750 3364.75 33647498 1187337835 1.1873378352. Tobacco 4286.58 505 2164723 2164.72 21647229 763877719 0.7638777193. Chilli 3830.24 486 1861497 1861.5 18614966.4 656876594.8 0.6568765954. Maize 3884.26 374 1452713 1452.71 14527132.4 512626940 0.512626945. Bengal Gram 3394.72 249 845285.3 845.285 8452852.8 298280482.7 0.298280483
Sub-Total 3.620824481 Total 19924.4 Assuming conveyance losses @ 60%, 6.034
command Total estimated water requirement
Table 3. Mean yield of different crops under Nallamada LIS (t ha-1)
Crops/ Year 2008-09 2009-10 2010-11 2011-12 2012-13
Cotton 3.75 3.50 2.25 2.47 4.94Chillies 7.50 8.13 7.50 2.35 4.69Tobbaco 4.75 4.75 4.00 1.98 1.98Maize 10.00 10.00 10.00 9.88 10.25Bengal gram 2.50 2.75 2.50 1.73 2.10Paddy NC* NC NC 5.37 5.00GreenGram NC NC NC 1.11 1.36Blackgram NC NC NC 0.74 0.99Soyabean NC NC NC 0.99 1.24Fodder Jowar NC NC NC 5.93 5.44White jowar NC NC NC 5.56 5.56Cluster Bean NC NC NC 0.99 1.11
* NC – Not Cultivated
Fig. 5. EC (dS/m) of the Nallamada drain water from 2008-2013

Groundwater Quality of Kanina Block 41
dyking or concrete coring. As more water is joining sea,in order to utilize these flows, more number of LiftIrrigation schemes alongside the banks of the drain canbe planned. The human causes like using of individualmotors to lift drain water on the banks cause’s small rills,developing into gullies, later causing breaching of thedrain when maximum flood flows occur.
References
Gupta IC (1990). Use of Saline Water in Agriculture. A Studyof Arid and Semi-arid Zones in India. Revised edition.Oxford and IBH Publishing, New Delhi.
Rhoades JD (1977). Potential for using saline agriculturaldrainage waters for irrigation. Proc. Water Managementfor Irrigation and Drainage, ASCE, Reno, Nevada, July.177: 85-116.
Received: May, 2014; Accepted: July 2014
Fig. 6. pH of the Nallamada drain water from 2008-2013
Fig. 7. Stable crop yields in Nallamada command area during 2010-13
Conclusions
The above study on quantitative and qualitative watermanagement in Nallamada drain revealed that the drainwater flows during cropping season remains between 1to 2 dS/m, which can be used for salinity tolerant varitiesof crops. The adverse affects of vagaries of monsoonresulting in floods and back water flows from the sea,can be avoided by upper catchment treatment using soiland water conservation measures like percolation tanks,farm ponds, checkdams etc. for in-situ water harvestingand avoiding siltation of the nallamada drain. The qualityanalysis of Nallamada water and nearby canal(Kommamuru Canal) revealed that they can be plannedfor conjunctive use for getting assured irrigation withbetter quality throughout the season. The enhanced flowsof the Nallamada drain are causing floods and damagingstanding crops and nearby habitats, which can be avoidedby increasing the existing cross section of the drain andstrengthening of the bunds/banks of the drain through

Effect of Salinity on Genetic Architecture of Fruit Yield and ItsContributing Traits in Tomato (Lycopersicon esculentum Mill.)
Jogendra Singh1*, E.V.D. Sastry2 and Vijayata Singh3
1Central Soil Salinity Research Institute, Karnal-132 001, Haryana, India2Rajasthan Agricultural Research Institute Jaipur, SKN Agriculture University, India
3CCS Haryana Agricultural University, Hisar, Haryana, India*Corresponding author E mail: [email protected]; [email protected]
Abstract
An investigation was conducted using 10 parental lines and their 45 F1s (generated through diallel mating) oftomato in 2010 at Horticultural Research Farm, Jobner for estimating the effects of salinity on genetic architectureof yield and its contributing traits (days to 50% flowering, days to first fruit, plant height, number of fruits perplant, fruit yield per plant, average fruit weight, fruit volume, leaf area and chlorophyll content at 45 days aftersowing) under normal and saline environments. Both additive and dominance gene actions were involved inthe genetic control of characters studied. However, relative magnitudes of dominance were higher than additivefor most traits (except chlorophyll content, where both are equal). Narrow sense heritability estimates were low(chlorophyll content) to high (fruit yield per plant). For improving salinity tolerance of tomato, breeding shouldalso resort to pyramiding the characteristics since, no described traits alone is likely to produce a tolerantgenotype. Threshold limit of salinity for tomato, up to which yield reduces very little or no reduction occur, is2.5-3.0 dS m-1 and after it, every increase of 1.0 dS m-1 in EC results in a yield reduction of about 9-10%. Yieldreduction at moderate salinity is mainly due to reduction in average fruit weight (while, at higher salinity, yieldreduction is due to reduced number of fruit per plant). This in turns is directly proportional to fruit size undernormal environment. Hence cultivation of tomato cultivars with small sized fruits or even cherry type tomatoshould be recommended under saline environment. Both additive and non-additive gene action have to beexploited with trait specific or environment specific breeding by adopting adequate strategies viz. bi-parentalmating, diallel selective mating, wide crossing and reciprocal recurrent selection.
Key words: Tomato, Additive variance, Salinity tolerant genotypes, Dominance, Combining ability, GCA, SCA
IntroductionThere is no separate gene system for yield per se as
being a complex character and the end product ofmultiplicative interaction between its components.Number of fruits per plant and average fruit weight arethe important contributing attributes of fruit yield andtheir significance has been reported by number ofbiometrical studies. The use of diallel analysis has beenmuch helpful in estimating gene action in tomato(Lycopersicon esculantum Mill.) which provide the estimatesof additive and dominance components so that the fixablecomponent could be exploited by using suitable breedingtechniques (Raja et al., 2012; Saeed et al., 2011; Paridaand Das, 2005; Bhatt et al., 2004). Keeping in view, thesefacts, the present study was carried out to investigategenetics of days to 50 % flowering, days to first fruit, plantheight, number of fruits per plant, fruit yield per plant,average fruit weight, fruit volume, leaf area andchlorophyll content at 45 days after sowing of 10 parentallines and their 45 F1s (excluding reciprocals) under normaland saline environments.
Material and Methods
Plant material
Material for the present investigation comprised of10 genetically diverse tomato varieties collected fromDivision of Vegetable Science, IARI, New Delhi, withvarying degree of salt tolerance namely IIVR-Sel-2,ArkaVikas, Sel-7, Azad T-2, PunjabUpma, DARL-64,BSS-368, Himsona, Tom-187 and CO-3.
Development of experimental populations
The parental lines were crossed in all possiblecombinations (diallel mating) excluding reciprocals togenerate 45 F1s during Rabi 2009 at Horticultural ResearchFarm, Jobner.
Field evaluation and data analysis
All crosses along with parents were evaluated inrandomized block design with three replications in eachof two environments viz. normal (E1, pH = 7.6 and ECe
Journal of Soil Salinity and Water Quality 6(1), 42-51, 2014
*Corresponding author

Effect of Salinity on Genetic Architecture of Fruit Yield 43
2.349 dS/m) and saline (E2, pH = 8.3 and ECe = 4.329dS/m) and irrigated with water having pH = 7.7 and ECe3.679 dS/m at Horticultural Research Farm, Jobner inRabi 2010. The salinity of the saline soil and irrigatedwater is above the threshold limit (2.5 dS/m) for tomato,hence considered to be saline. Plot size was single row of3 M long with 50 cm row spacing and 30 cm plant toplant spacing. The observations were recorded on varioustraits. The data were first subjected to analysis of varianceseparately for each environment then, estimation ofgenetic parameters study was done using Hayman’s (1954)method. Combining ability analysis was performedfollowing Griffing’s (1956) Method II Model I.
Results and Discussion
Analysis of variance
Pooled analysis of variance has shown that the MSSdue to environments and genotypes were significant,indicating significant differences among genotypes andthe environments on the genotypes. Differential responseof genotypes to environments as indicated by significantg x e interaction was significant for all the characters (Table1).
Genetic components and graphical analysis
The estimation of components of genetic variancewas done only for those characters where additive-dominance model was fitted (assumptions of diallelmating design were fulfilled) over the environment (Table2) and for rest of characters, where additive-dominancemodel was not fitted (assumptions of diallel mating designwere not fulfilled) the inferences were drawn with the helpof Wr-Vr graphs in specific environment.
Graphical analysis was carried out as given byHayman (1954). A total 9 traits were studied in both theenvironments and Wr-Vr graphs were prepared for eachtrait. The results revealed that different types ofdominance behaviour viz., over dominance, completedominance and partial dominance (based on regressionline intercept behavior) for different characters observesin both the environments. Such variable behaviour maybe partly attributed to the partial failure of diallelassumptions. Scattering of parental array points indicatedthe existence of high genetic diversity among the parentsfor most of the characters. Relative position of parentalarray points from origin showed relative proportion ofdominant and recessive alleles in the parents. The arraypoints that were located below the regression lineindicated complementary gene action.
The intercept being negative indicated overdominance for days to 50% flowering, days to first fruitand chlorophyll content at 45 days after sowing in boththe environments, fruit yield per plant in E2, average fruitweight in E1 and fruit volume in E2 environment. Partial Tab
le 1
. P
oole
d an
alys
is o
f va
rian
ce f
or fr
uit y
ield
and
its
cont
ribu
ting
cha
ract
ers
unde
r no
rmal
(E
1) a
nd s
alin
e (E
2) e
nvir
onm
ent
Sour
ce o
f va
riat
ion
C
hara
cter
s w
ise
mea
n su
m o
f sq
uare
s
D.F
.D
ays
to 5
0%D
ays
toP
lant
Num
ber
ofF
ruit
yie
ldA
vera
geF
ruit
Lea
f ar
eaC
hlor
ophy
llfl
ower
ing
firs
t fru
ithe
ight
frui
ts p
er p
lant
per
plan
tfr
uit w
eigh
tvo
lum
eco
nten
tat
45
days
Env
iron
men
t1
680.
84**
552.
51**
3249
.90*
*19
37.4
6**
1907
144.
15**
1592
.80*
*38
69.3
9**
3192
.98*
*5.
81**
Rep
licat
ion/
env
iron
men
t4
14.9
5**
14.2
042
.69*
*10
.81
2464
.94*
*9.
4926
.07*
*4.
850.
0001
Gen
otyp
es54
22.2
0**
193.
10**
205.
93**
20.1
9**
2142
4.53
**77
.14*
*70
.25*
*12
7.86
**0.
04**
Gen
otyp
e X
env
iron
men
t54
8.87
*15
7.21
**16
8.08
**21
.04*
*15
320.
91**
41.8
0**
44.9
9**
162.
48**
0.05
**P
oole
d E
rror
216
5.93
19.5
412
.16
2.25
516.
332.
652.
651.
940.
0002
*, **=
Sig
nifi
cant
at 5
% a
nd 1
% le
vel o
f si
gnif
ican
ce, r
espe
ctiv
ely.

44 Singh et al.
dominance was evident by positive value of intercept forthe characters like plant height in both the environment,number of fruit per plant, fruit yield per plant and fruitvolume in E1 and leaf area in E2 environment.
Regression line intercepted at origin showed thereby,complete dominance for number of fruits per plant andaverage fruit weight in E2 and leaf area in E1 environment.The results are in agreement with the findings of Saeed etal. (2011) and Bhatt et al. (2004).
Furthermore, the graphical analysis about locationof parental array points from origin revealed that theparents Himsona in E1; Punjab Upma and DARL-64 inE2 for days to 50% flowering, IIVR-Sel-2 DARL-64 andBSS -368 in E1; Azad T-2 in E2 for days to first fruits,IIVR-Sel-2, Himsona and Tom-187 in E1; IIVR-Sel-2,Arka Vikas, Azad T-2 and Punjab Upma E2 for plantheight, Arka Vikas in E1; IIVR Sel-2, Arlka Vikas, AzadT-2, Punjab Upma and CO-3 in E2 for number of fruitsper plant, Arka Vikas in E1; Azad T-2 and CO-3 in E2 forfruit yield per plant, DARL-64 in E1; IIVR-Sel-2 in E-2
for average fruit weight, IIVR Sel-2 and Arka Vikas in E1;Sel-7 and Punjab Upma in E2 for fruit volume, PunjabUpma, Tom-187 and CO-3 in E1; IIVR Sel-2 in E2 forleaf area and IIVR-Sel-2, DARL-64, BSS-368 andHimsona in E1; CO-3 in E2 for chlorophyll content at 45days, possessed more dominant genes as being nearer toorigin. Rest of the parents in respective environment forspecific character possessed more recessive genes as beinglocated farther from origin point.
The parental arrays that fall below regression lineshowed complementary gene action in both theenvironments were IIVR-Sel-2, Azad T-2 and PunjabUpma for days to 50% flowering, IIVR-Sel-2, DARL-64and Tom-187 for days to first fruit, Punjab Upma , Tom-187 and CO-3 for plant height, Sel-7 for number of fruitsper plant, Sel-7 and DARL-64 for fruit yield per plant,Sel-7 for average fruit weight, BSS-368 and Tom-187 forfruit volume, IIVR-Sel-2 and Tom-187 for leaf area andArkaVikas and Sel-7 for chlorophyll content at 45 days.
The study of estimation of component of geneticvariance and Wr-Vr indicated that both additive anddominance gene actions were involved in the expressionof most of the traits under study in normal (E1) and saline(E2) environments except for chlorophyll content, whereonly additive component (D) seemed to be significant (inE1).
It was only in the case of plant height (E1), numberof fruits per plant (E2), fruit yield per plant (E2), fruitvolume (E2) and chlorophyll content (E1 and E2), overdominance effect of heterozygous loci (h2) was found tobe significant. Degree of dominance (H1/D)1/2 impliesover dominance for all the characters under respectiveenvironment. The value of H2/4H1 indicated that for lociexhibiting dominance, frequency of positive alleles waspredominant for all the traits. Positive and significant valueof coefficient of co-variance (F) for all the charactersexcept chlorophyll content (E1), indicated predominanceof dominant genes in parents. Further, prevalence of
Table 2. Regression coefficient of Wr on Vr with their standard error and deviation from zero and unity for different characters inF1 generation under normal (E1) and saline (E2) environment
Characters Environment b SE (b) (b-0) / SE (b) (1-b) / SE (b)
Days 50% flowering E1 0.32 0.35 0.89 1.93E2 0.39 0.14 2.79* 4.35**
Days to first fruit E1 -0.01 0.09 -0.13 11.69**E2 0.16 0.07 2.17 11.82**
Plant height E1 0.69 0.14 4.93** 2.21E2 -0.10 0.06 -1.77 19.30**
Number of fruits per plant E1 -0.24 0.10 -2.40* 12.29**E2 1.37 0.50 -2.74* -0.74
Fruit yield per plant E1 -0.11 0.01 -11.00** 11.10**E2 0.96 0.20 4.80** 0.20
Average fruit weight E1 0.17 0.12 1.31 6.38**E2 0.16 0.13 1.25 6.93**
Fruit volume E1 -0.08 0.08 -1.01 13.02**E2 0.59 0.19 3.11* 2.15
Leaf area E1 0.04 0.03 1.25 31.53**E2 0.18 0.13 1.38 6.71**
Chlorophyll content at 45 days E1 0.55 0.23 2.39* 1.96E2 5.09 2.16 2.36* -1.73
*, **= Significant at 5% and 1% level of significance, respectively.

Effect of Salinity on Genetic Architecture of Fruit Yield 45
dominant genes for majority of the traits could also beseen from the ratio (4DH1)1/2 +F/ (4DH1)1/2 –F (Table3).
Effect of environmental variation associated withindividual means (E) seemed to be significant for mostof the traits except chlorophyll content in bothenvironments. These results showed that both additiveand dominance effects were important in controllingvarious fruit yield contributing traits studies withpreponderance of dominance gene actions (Srivastva etal., 1998; Thakur and Joshi, 2000; Roopa et al., 2001;Bhatt et al., 2004). Narrow sense heritability estimatesobtained in component analysis ranged from low to highfor different traits (Table 3). This was 1.90 for plant height(E1), 1.67 for number of fruits per plant (E2), 1.99 forfruit yield per plant (E2) 1.60 for fruit volume (E2) and0.02 and 0.01 for chlorophyll content (E1 and E2,respectively). The lower values of heritability for abovementioned character clearly indicated the control ofmainly non- additive gene action.
Combining ability: variances and effects
An understanding of the genetic control of thecharacters is the basic requirement for purposefulmanagement of available genetic variability. The choiceof the most suitable breeding method depends mainly onthe combining ability behaviour vis-a-vis nature of geneaction involved in the control of the traits of interest tothe breeder. In the present investigation, the g x einteraction was significant for all the traits; hencecombining ability analysis was done for individualenvironment. Highly significant mean squares due to
GCA and SCA in both the environments indicated thatall the characters were controlled by both additive andnon-additive gene effects (Basihya et al., 2002; Cheema etal., 2003; Bhatt et al., 2004; Raja et al., 2012).
Nature and magnitude of combining ability effectsprovide an idea about the relative role of fixable and non-fixable gene effects in the inheritance of differentcharacters. Thus, it helps in identifying suitable parentsfor crossing programme.
An appreciable progress could be achieved throughconventional breeding method such as pedigree and bulkmethod when GCA effects or additive gene action ispreponderant. But for the traits where non-additive geneeffects are more pronounced, some kind of recurrentselection e.g. diallel selective mating or bi-parental matingin early generations might prove to be effective breedingapproach (Akinci et al., 2004; Saeed et al., 2011; Raja etal., 2012; Hamida and Shaddad, 2010).
The analysis of variance for combining abilityrevealed that GCA as well as SCA effects were highlysignificant for the characters under study in both theenvironments, except chlorophyll content. Mostly themagnitude of GCA variance were observed to be higherthan SCA variance, that indicated the preponderance ofadditive gene effects being fixable and thereby heritable,except fruit volume and chlorophyll content, where, nonadditive gene effects were in preponderance (Table 4).
The success of any plant breeding programmeprimarily depends upon the choice of parent for initiatinga meaningful hybridization programme. The commonapproaches of selecting the parent on the per se
Table 3. Estimates of components of genetic variance for plant height, number of fruits / plant, fruit volume and chlorophyllcontent at 45 days under normal (E1) and saline (E2) environment
Components Plant height Number of fruits Fruit yield Fruit volume Chlorophyll contentper plant per plant at 45 days
E1 E2 E2 E2 E1 E2
D ± SE 118.04**+ 0054 0.51**+ 0.0043 171.61**+0.0043 5.60**+0.0043 0.02**+0.0054 0.05**+0.0113H1 ± SE 360.14**+ 0115 24.11**+ 0.0092 20958.18**+0.0092 77.73**+0.0092 0.02+0.0115 0.07**+0.0092H2 ± SE -4486.05** + 0.0098 -87.32**+0.0079 -17837.75**+00079 -214.22**+0.0079 0.02+0.0098 0.09**+0.0079h2 ± SE -60.09** + 0.0066 1.97**+0.0053 -13853.79**+0.0053 5.86**+0.0053 0.24**+0.0066 0.08**+0.0053F ± SE 240.65**+ 0.0125 5.31**+0.0100 560.22**+0.0100 20.68**+0.0100 0.01+0.0125 0.03**+0.0100E ± SE 4.49**+ 0.0016 0.45**+0.0013 196.81**+0.0013 0.85**+0.0013 0.00+0.0016 0.00+0.0013(H1 / D)1/2 1.75 6.90 11.05 3.01 1.16 1.21H2
/4H1 -3.25 -0.91 -0.21 -0.69 0.27 0.32(4DH1)1/2 + F 1.01 1.24 1.01 1.02 -1.20 -3.09(4DH1)1/2 - Fh2 / H2 -0.04 0.02 -0.17 0.02 2.84 0.29Heritability in 1.90 1.67 1.99 1.60 0.02 0.01narrow sense
*, **= Significant at 5% and 1% level of significance, respectively.

46 Singh et al.
Table 4. Analysis of variance for combining ability of different characters under normal (E1) and saline (E2) environment
Characters Environment Mean sum of squares
GCA (9) SCA (45) Error (108) σ2GCA: σ2
SCA
Days 50% flowering E1 4.39** 2.51** 0.02 0.013E2 8.19** 4.70** 0.02 0.062
Days to first fruit E1 25.88** 25.60** 0.08 0.001E2 201.89** 68.97** 0.05 0.160
Plant height E1 93.14** 80.35** 0.04 0.013E2 67.09** 37.20** 0.03 0.067
Number of fruits per plant E1 15.25** 7.42** 0.01 0.085E2 8.05* 4.42** 0.1 0.066
Fruit yield per plant E1 8825.40** 6684.51** 1.37 0.026E2 8319.77** 4584.64** 1.82 0.065
Average fruit weight E1 23.80** 21.96** 0.01 0.007E2 23.43** 16.17** 0.01 0.036
Fruit volume E1 10.91** 24.56** 0.01 0.045E2 14.18** 16.52** 0.01 0.012
Leaf area E1 124.99** 73.44** 0.01 0.056E2 17.79** 14.14** 0.0013 0.021
Chlorophyll content at 45 days E1 0.0060 0.0068 0.00 0.009E2 0.0227 0.0256 0.00 0.008
*, **= Significant at 5% and 1% level of significance, respectively.
performance and local adaptation does not necessarilylead to the much gainful results, because the ability ofparents to continue well, depends upon the complexinteractions among genes, genotype x environmentinteraction and stability of yield attributes. In general,the GCA estimates of the parents were inconsistence forsome characters in both the environments in the presentinvestigation. This might be attributed to the presence ofGCA x environment interaction. Thus, it is suggested thatbreeding for above said characters would be effective onlywhen material is tested over a wide range of environmentsand selection practiced in target environment. However,some parents showed consistent desirable GCA estimatesfor some characters in both the environments.
In normal environment Sel-7, Azad T-2, Tom-187and DARL-64 found to be better and desirable generalcombiners for fruit yield per plant. Similarly, Sel-7, BSS-368, Himsona and Tom-187 were found to be better anddesirable general combiners for fruit yield in salineenvironment. These above mentioned parents attributedadditive and additive x additive gene action whichsuggested that they have good potentiality for fruit yieldand contributing traits in prospective environment andmay be used in synthesizing lines having more offavourable genes. Sel-7 was also found to be a bettergeneral combiner for days to first, average fruit weightand fruit volume in normal environment, but only foraverage fruit weight besides fruit yield in salineenvironment. Azad T-2 and Tom-187 were found to bedesirable general combiners for number of fruits per plantchlorophyll content and average fruit weight (in case of
Azad T-2) and fruit volume (in case of Tom-187). BSS-368 and Himsona were found desirable general combinersfor number of fruits per plant, average fruit weight, fruitvolume, leaf area as well as for days to first fruit, plantheight and chlorophyll content in case of Himsona insaline environment. Either desirable parents were DARL-64 in normal (for days to 50% flowering, days to first fruit,plant height and number of fruits per plant) and Tom-187 in saline (for plant height, average fruit weight, fruitvolume and leaf area) (Table 5).
Since GCA effects are attributed to additive andadditive x additive gene effects, the above mentionedparents have good potential for the improvement of yieldand contributing traits in respective environment and maybe used in a multiple crossing programme to synthesis adynamic population with most of favourable genesaccumulation (Roopa et al., 2001; Chadha et al., 2002;Sharma et al. ,2002; Bhatt et al., 2004).
In self pollinated crops SCA effects are generally ofless relevance except where commercial exploitation ofheterosis is feasible, as SCA effects are primarily governedby dominances gene effects and cannot be fixed in theend product i.e. pure line. However, if a cross combinationhas high SCA effects along with per se performances withat least one good general combiner parent for a particulartrait, it is expected that this cross combination may providedesirable transgressive segregants in later generations. Inpresent investigation, there was no consistency overenvironment for the ranks of crosses with high SCAeffects. Further more, a number of crosses exhibitedchanges in the magnitude and direction of SCA effects in

Effect of Salinity on Genetic Architecture of Fruit Yield 47
Table 5. Estimates of general combining ability effects for different characters under normal (E1) and saline (E2) environment
Progenies Days to 50% flowering Days to first fruit Plant height
E1 E2 E1 E2 E1 E2
GCA effectsIIVR-Sel-2 0.178 0.672 -0.939 7.550** 3.668** 2.649**Arka Vikas 0.872* 1.700** 1.172 5.106** -2.412** -1.151Sel.-7 0.872* -0.356 -1.883* -1.728* -4.718** -4.937**Azad T-2 -0.156 -0.633 0.839 -5.978** 0.882 -1.817**Punjab Upma -0.433 0.061 -0.606 -0.033 3.368** 0.016DARL-64 -0.878* -0.967* -2.356** -2.839** 1.771** 0.436BSS-368 0.567 -0.717 1.978* -1.228 1.577* 1.074Himsona -0.544 -0.606 -0.411 -3.283** 0.418 3.202**Tom-187 -0.128 0.200 0.617 -0.561 -2.384** 1.397*CO-3 -0.350 0.644 1.589 2.994** -2.171** -0.870SE (gi) 0.397 0.407 0.813 0.636 0.606 0.544
Progenies No. of fruits / plant Fruit yield / plant Average fruit weight
E1 E2 E1 E2 E1 E2
GCA effectsIIVR-Sel-2 -0.271 -1.073** -13.183** -29.367** -2.167** 0.528Arka Vikas -2.071** -0.346 -49.656** -21.033** -1.167** -0.917**Sel.-7 -0.349 0.321 14.678** 29.856** 2.361** 2.722**Azad T-2 1.512** -0.784** 40.872** -24.756** 1.028** -1.250**Punjab Upma -0.532 -0.623* -12.656** -15.783** 0.556 0.083DARL-64 1.129** 0.104 14.067** -8.311* -1.167** -1.528**BSS-368 0.068 1.593** 4.122 44.744** 0.917** 0.667*Himsona 0.668* 0.893** 7.456* 24.300** 0.111 0.667*Tom-187 1.073** 0.349 25.844** 16.300** 0.889** 0.889**CO-3 -1.227** -0.434 -31.544** -15.950** -1.361** -1.861**SE (gi) 0.293 0.192 3.473 4.013 0.291 0.244
Progenies Fruit volume Leaf area Chlorophyll content at 45 days
E1 E2 E1 E2 E1 E2
GCA effectsIIVR-Sel-2 -0.978** 0.217 7.247** -0.878** -0.007** -0.005**Arka Vikas 0.161 -0.561* 1.883** -1.978** 0.004** -0.020**Sel.-7 0.772** -0.033 -1.320** -1.304** 0.019** -0.026**Azad T-2 -0.561* -1.978** 0.445 -0.593 0.021** -0.060**Punjab Upma -0.006 -0.339 -4.529** -0.097 0.023** -0.025**DARL-64 -1.033** -0.006 -0.364 0.415 -0.043** 0.038**BSS-368 -0.728** 0.717** 1.210** 2.124** -0.018** 0.003**Himsona 0.356 2.161** 0.560 0.991** 0.005** 0.039**Tom-187 2.133** 0.633* -2.829** 0.838** 0.019** -0.032**CO-3 -0.117 -0.811** -2.305** 0.481 -0.024** 0.088**SE (gi) 0.273 0.264 0.308 0.105 0.000 0.000
*, **= Significant at 5% and 1% level of significance, respectively.
different environments, which might be consequence ofhigh SCA x environment interaction (Roopa et al., 2001;Chadha et al., 2002; Sharma et al., 2002; Dhaliwal et al.,2003; Saeed et al., 2011; Raja et al., 2012; Hamida andShaddad, 2010).
Sel-7 x Himsona exhibited significant SCA effects inthe desired direction for fruit yield per plant in the normal
environment. This cross also had significant SCA effectsin the desired direction for days to first fruit, plant heightand average fruit weight. Similarly Azad T-2 x CO-3 alsohad positive significant SCA effect for fruit yield besidesdays to first fruit and number of fruits per plant. Crossesworth mentioning are IIVR-Sel-2 x BSS-368 for days to50% flowering, number of fruits per plant and leaf area,ArkaVikas x PunjabUpma for number of fruits per plant,

48 Singh et al.
average fruit weight and fruit volume. In the salineenvironment, Sel-7 x BSS-368, DARL-64 x BSS-368 andHimsona x Tom-187 which had high significant andpositive SCA effects for fruit yield. Among these Sel-7 x
BSS-368 also exhibited significant SCA effects for numberof fruit per plant and average fruit weight; Himsona xTom-187 and DARL-64 x BSS-368 for plant height andnumber of fruit per plant (Table 6).
Table 6. Estimates of specific combining ability effects for for different characters under normal (E1) and saline (E2) environment
Progenies Days to 50% flowering Days to first fruit Plant height
E1 E2 E1 E2 E1 E2
SCA effectsIIVR-Sel-2 x Arka Vikas -5.008** -3.457** 0.136 -9.207** 10.046** -0.921IIVR-Sel-2 x Sel.-7 -3.341** -1.068 -0.475 1.626 6.751** 4.665**IIVR-Sel-2 x Azad T-2 -0.313 -1.124 1.136 -3.124 4.285** 5.079**IIVR-Sel-2 x Punjab Upma -1.369 0.848 3.581 2.265 -4.335** -1.454IIVR-Sel-2 x DARL-64 3.076** -2.124 -0.003 -15.596** -2.604 3.693**IIVR-Sel-2 x BSS-368 -3.369** -2.040 -0.003 6.126** 3.857 0.854IIVR-Sel-2 x Himsona 2.409 2.182 3.386 3.848 -4.585** -2.140IIVR-Sel-2 x Tom-187 -1.008 1.710 -3.975 6.126** -1.715 4.865**IIVR-Sel-2 x CO-3 4.881** 1.265 3.053 2.571 -10.029** 3.732**Arka Vikas x Sel.-7 2.631** 1.237 5.747** 15.404** -4.968** 11.532**Arka Vikas x Azad T-2 2.326 3.848** 11.359** 0.654 2.365 2.846Arka Vikas x Punjab Upma -0.063 -0.179 -1.197 -4.624** -2.654 2.979Arka Vikas x DARL-64 0.715 -1.152 -5.447** -4.818** -3.857 2.960Arka Vikas x BSS-368 -0.063 0.598 -0.780 13.237** -13.463** -2.746Arka Vikas x Himsona -0.285 0.821 -6.391** 14.960** -1.838 -3.607**Arka Vikas x Tom-187 0.631 -3.318** -4.419 -11.096** -2.768 -9.335**Arka Vikas x CO-3 -0.146 -1.429 -1.725 9.015** -10.182** -6.135**Sel.-7 x Azad T-2 -2.008 -1.763 -6.253** -0.513 -3.463 1.199Sel.-7 x Punjab Upma -2.396 -0.790 -0.808 -5.790** -9.082** -4.168**Sel.-7 x DARL-64 0.381 -0.763 -2.058 -2.318 -6.818** -6.454**Sel.-7 x BSS-368 -0.396 -0.346 -2.725 -3.929 -8.290** -9.093**Sel.-7 x Himsona -3.285** -2.124 -8.003** -9.540** 8.668** 1.246Sel.-7 x Tom-187 2.965** 0.071 1.303 3.404 -1.196 0.385Sel.-7 x CO-3 -0.480 0.960 2.997 -2.818 7.990** -8.882**Azad T-2 x Punjab Upma 3.298** 0.487 3.803 3.460 -10.349** -3.287Azad T-2 x DARL-64 1.076 0.515 7.553** 2.932 -7.552** -7.107**Azad T-2 x BSS-368 -1.035 -0.735 3.553 0.987 0.376 -1.146Azad T-2 x Himsona -0.924 3.154** 3.942 3.710 -2.132 -4.740**Azad T-2 x Tom-187 1.326 -1.652 2.247 -2.013 -3.263 1.465Azad T-2 x CO-3 -2.452 -3.763** -10.058** -8.235** -2.277 6.465**Punjab Upma x DARL-64 -1.313 -0.846 -2.003 7.987** -6.304** 2.793Punjab Upma x BSS-368 3.576** 4.237** -0.669 2.376 -7.977** 2.954Punjab Upma x Himsona 1.354 -0.874 0.720 4.432** -3.518 -0.707Punjab Upma x Tom-187 -0.730 0.654 -2.641 16.376** -0.015 -1.301Punjab Upma x CO-3 -0.174 -2.457 2.720 -6.179** -2.496 0.965DARL-64 x BSS-368 3.020** 1.265 -0.919 -1.485 -7.913** 10.135**DARL-64 x Himsona -0.869 -1.179 -0.864 -5.429** -7.088** -1.860DARL-64 x Tom-187 -2.619** 1.682 0.442 -4.485** -1.952 0.546DARL-64 x CO-3 -2.396 -2.429 -0.864 -11.707** -4.899** 8.946**BSS-368 x Himsona -0.646 0.571 -0.864 -7.040** 1.707 -1.632BSS-368 x Tom-187 0.604 -2.568 4.775 3.571 -1.490 0.440BSS-368 x CO-3 1.159 -1.013 -1.197 -4.318** 0.762 -0.226Himsona x Tom-187 1.381 0.321 2.831 -2.374 4.068** 19.446**Himsona x CO-3 0.604 -2.457 12.192** -5.263** -7.946** 7.113**Tom-187 x CO-3 2.854** 5.404** 9.164** 7.348** -1.943 -6.215**SE (Sij) 1.2789 1.3104 2.6179 2.0496 1.9516 1.7528

Effect of Salinity on Genetic Architecture of Fruit Yield 49
Progenies No. of fruits / plant Fruit yield / plant Average fruit weightE1 E2 E1 E2 E1 E2
SCA effects
IIVR-Sel-2 x Arka Vikas 0.186 0.509 21.427 30.364** 1.788 2.904**
IIVR-Sel-2 x Sel.-7 2.397** -0.758 44.093** -46.525** -2.073** -5.068**
IIVR-Sel-2 x Azad T-2 -3.731** 1.547** -110.768** 32.086** -6.407** 1.237
IIVR-Sel-2 x Punjab Upma -1.220 0.453 -78.573** 7.780 -6.268** -1.429
IIVR-Sel-2 x DARL-64 1.253 0.992 3.705 27.308** 0.121 2.515**
IIVR-Sel-2 x BSS-368 4.780** -2.097** 146.316** -58.747** 3.038** -3.013**
IIVR-Sel-2 x Himsona -2.753** -1.330** -84.018** -19.970 -3.490** 3.321**
IIVR-Sel-2 x Tom-187 3.708** -0.853 150.927** -21.303 1.732 0.765
IIVR-Sel-2 x CO-3 -2.725** 0.131 -65.018** 16.947 -0.684 3.848**
Arka Vikas x Sel.-7 0.197 -0.753 8.566 -29.192** 1.593 1.043
Arka Vikas x Azad T-2 -0.864 0.686 -44.295** 41.753** -6.740** 6.348**
Arka Vikas x Punjab Upma 3.780** 0.792 126.566** 30.114** 6.399** 3.015**
Arka Vikas x DARL-64 0.319 0.264 -37.490** 3.975 -3.879** -1.374
Arka Vikas x BSS-368 -0.820 -1.491** -25.212** -56.747** -1.629 -3.902**
Arka Vikas x Himsona 0.047 -0.658 45.121** -34.970** 6.177** -4.568**
Arka Vikas x Tom-187 -2.559** -0.647 -55.934** -26.636** 1.066 -2.457**
Arka Vikas x CO-3 -0.659 0.670 -44.545** 5.947 -5.018** -3.707**
Sel.-7 x Azad T-2 -2.453** 0.220 -8.295 -37.136** -1.934** -6.957**
Sel.-7 x Punjab Upma 0.725 -1.075 14.899 -35.775** 2.205** -1.957**
Sel.-7 x DARL-64 1.597 -1.736** -25.823** -60.914** -4.073** -1.679**
Sel.-7 x BSS-368 -1.209 6.842** 40.455** 314.364** 7.843** 11.460**
Sel.-7 x Himsona 3.391** 2.675** 173.121** 56.475** 10.982** 0.793
Sel.-7 x Tom-187 0.453 -1.114 -12.934 -11.859** -1.462 0.904
Sel.-7 x CO-3 -0.447 -1.064 -1.212 -31.275** 3.455** -0.013
Azad T-2 x Punjab Upma -5.136** 0.564 -122.962** 28.169** -3.462** 5.015**
Azad T-2 x DARL-64 0.469 -0.630 69.649** 0.364 3.593** -0.374
Azad T-2 x BSS-368 1.730 -2.253** -27.407** -64.359** -2.157** -5.235**
Azad T-2 x Himsona 2.197** -1.153 -22.073 -37.581** -1.351 -4.235**
Azad T-2 x Tom-187 2.325** -1.208 -2.462 -40.914** -0.795 -7.457**
Azad T-2 x CO-3 9.425** 1.575** 241.593** 21.336 3.788** -1.707**
Punjab Upma x DARL-64 2.647** -0.525 64.843** -23.609 -0.601 -7.040**
Punjab Upma x BSS-368 -3.225** -2.080** -56.212** -33.331** 2.649** 4.098**
Punjab Upma x Himsona 0.108 -0.580 -66.212** -20.220 -7.879** -2.235**
Punjab Upma x Tom-187 0.436 -0.769 -45.601** -12.553 -3.323** -0.457
Punjab Upma x CO-3 -1.264 1.081 -22.545** 35.030** -1.073 2.960**
DARL-64 x BSS-368 -3.553** 4.459** -87.934** 77.530** -2.295** 1.043
DARL-64 x Himsona -0.486 -1.241** 40.399** 9.641 1.510 4.043**
DARL-64 x Tom-187 -1.292 -0.830 -2.657 -10.692 2.066** 1.154
DARL-64 x CO-3 -2.525** -0.380 -34.268** 11.891 1.316 3.237**
BSS-368 x Himsona 0.575 -2.664** -73.657** -57.414** -8.240** 1.182
BSS-368 x Tom-187 2.836** 3.347** 123.621** 71.253** 5.316** 3.293**
BSS-368 x CO-3 1.069 -0.803 44.677** -11.497 2.232** 0.710
Himsona x Tom-187 -2.764** 6.981** -33.379** 181.697** 0.788 3.626**
Himsona x CO-3 -2.664** 0.431 -53.990** -1.720 -1.629 -2.290**
Tom-187 x CO-3 -2.003** -0.891 -84.045** -13.053 -4.740** -1.513
SE (Sij) 0.9422 0.6177 11.1838 12.9225 0.9372 0.7872

50 Singh et al.
Progenies Fruit volume Leaf area Chlorophyll content at 45 days
E1 E2 E1 E2 E1 E2
SCA effects
IIVR-Sel-2 x Arka Vikas 3.811** 1.187 -12.311** 3.980** -0.050** -0.116**
IIVR-Sel-2 x Sel.-7 -2.134** -4.674** -7.484** 1.173** 0.037** 0.108**
IIVR-Sel-2 x Azad T-2 -1.134 0.937 -1.336 2.685** -0.025** -0.065**
IIVR-Sel-2 x Punjab Upma -2.689** -0.702 -7.686** -1.404** -0.019** -0.188**
IIVR-Sel-2 x DARL-64 -0.662 3.631** 10.936** 0.617 0.011** -0.128**
IIVR-Sel-2 x BSS-368 0.366 -2.424** 28.122** -1.385** 0.020** 0.131**
IIVR-Sel-2 x Himsona -1.384 -4.202** 17.835** 1.448** -0.011** 0.057**
IIVR-Sel-2 x Tom-187 -1.495 5.992** -7.882** -3.629** 0.037** 0.115**
IIVR-Sel-2 x CO-3 4.088** 4.104** -15.219** -1.079** -0.015** -0.026**
Arka Vikas x Sel.-7 -2.606** 0.770 -4.047** 4.232** 0.030** -0.351**
Arka Vikas x Azad T-2 3.727** 3.048** 5.048** -2.719** -0.008** 0.315**
Arka Vikas x Punjab Upma 6.838** 5.076** 2.365** -1.178** -0.042** 0.261**
Arka Vikas x DARL-64 -1.467 -4.591** -0.870 -1.593** -0.009** -0.001**
Arka Vikas x BSS-368 -0.106 1.354 -4.914** -5.482** -0.060** 0.072**
Arka Vikas x Himsona -3.189** 0.909 17.829** -1.689** 0.014** -0.093**
Arka Vikas x Tom-187 1.033 -7.563** 4.655** 4.621** 0.076** -0.179**
Arka Vikas x CO-3 -2.051** -0.119 -5.882** 0.048 0.121** -0.074**
Sel.-7 x Azad T-2 3.783** 4.187* * 6.451** -0.010 -0.026** 0.184**
Sel.-7 x Punjab Upma 4.894** 1.215 -0.329 -4.989** -0.025** 0.061**
Sel.-7 x DARL-64 0.255 3.215** -6.377** -2.101** -0.004** -0.084**
Sel.-7 x BSS-368 -5.051** 2.159** -0.774 5.270** -0.029** -0.027**
Sel.-7 x Himsona 6.533** 2.381** 0.886 6.613** -0.045** -0.098**
Sel.-7 x Tom-187 -5.912** -0.758 -9.532** -1.730** 0.061** -0.122**
Sel.-7 x CO-3 -3.328** -2.313** 4.894** -4.360** 0.105** 0.139**
Azad T-2 x Punjab Upma -0.773 2.826** -2.934** 1.666** 0.143** 0.051**
Azad T-2 x DARL-64 -5.412** -4.508** -7.009** 1.504** -0.016** -0.129**
Azad T-2 x BSS-368 -1.717 -2.896** -5.410** -0.198 0.047** -0.106**
Azad T-2 x Himsona 1.199 0.992 -5.006** 0.909** -0.040** -0.013**
Azad T-2 x Tom-187 3.755** -5.480** -0.994 1.979** -0.037** 0.159**
Azad T-2 x CO-3 -7.662** -3.369** 2.712** 3.319** 0.019** 0.121**
Punjab Upma x DARL-64 -3.967** -2.813** 1.622 0.295 0.009** 0.029**
Punjab Upma x BSS-368 3.727** 3.465** -5.946** 2.526** 0.019** 0.206**
Punjab Upma x Himsona -1.023 -3.980** -2.112** 0.293 -0.037** 0.057**
Punjab Upma x Tom-187 -1.134 -1.785** -1.316 0.976** -0.029** -0.029**
Punjab Upma x CO-3 -4.551** -0.341 2.410** 4.146** 0.188** 0.172**
DARL-64 x BSS-368 -7.578** -3.869** -9.890** 4.381** 0.033** 0.005**
DARL-64 x Himsona 2.338** 3.020** -4.040** -2.319** 0.004** 0.002**
DARL-64 x Tom-187 6.561** 3.215** 3.585** 0.694** -0.074** 0.106**
DARL-64 x CO-3 -2.856** 12.326** -0.258 7.848** 0.054** -0.165**
BSS-368 x Himsona -6.634** 4.631** -0.218 -5.578** -0.003** -0.338**
BSS-368 x Tom-187 3.922** 5.826** 6.291** 6.645** -0.030** 0.101**
BSS-368 x CO-3 15.505** 0.937 -5.759** 0.382 0.008** -0.115**
Himsona x Tom-187 -5.162** -0.285 -5.975** 5.225** -0.045** 0.053**
Himsona x CO-3 -3.245** -5.841** -7.069** 2.885** -0.018** 0.058**
Tom-187 x CO-3 -8.356** -0.980 -1.067 -4.005** 0.193** 0.074**
SE (Sij) 0.8801 0.8511 0.9911 0.3396 0.0003 0.0003
*, **= Significant at 5% and 1% level of significance, respectively.
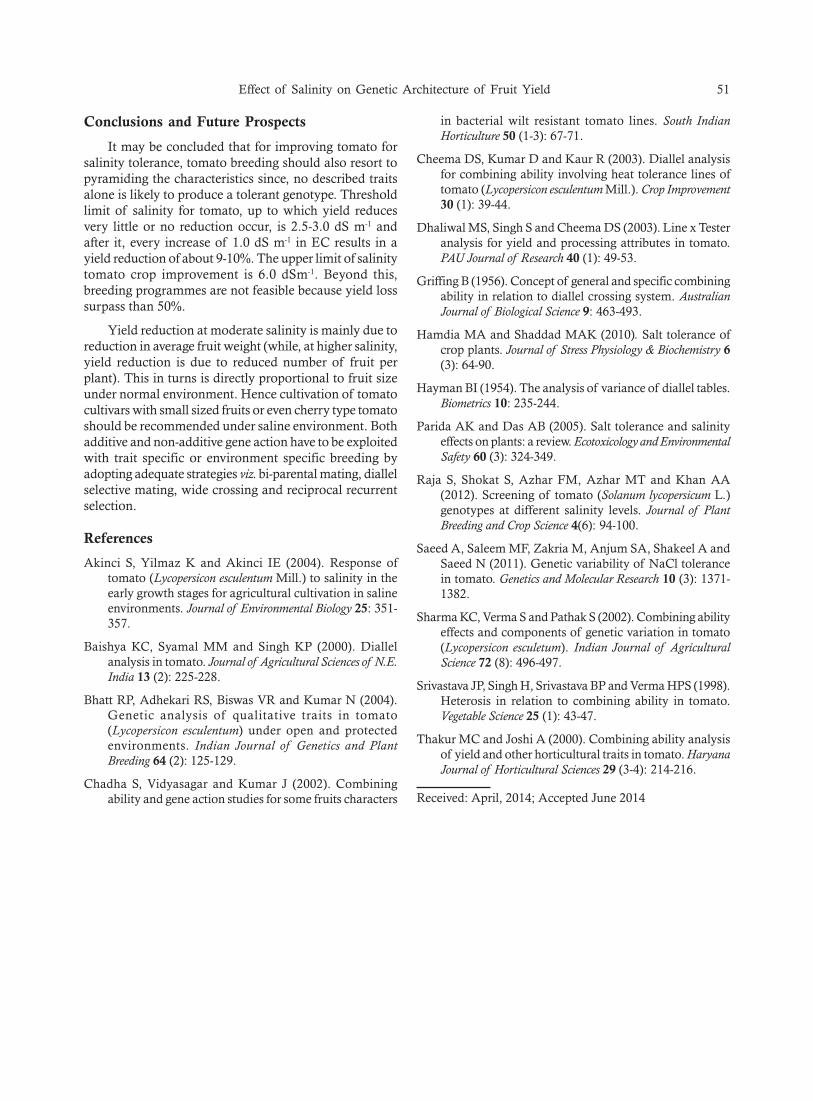
Effect of Salinity on Genetic Architecture of Fruit Yield 51
Conclusions and Future Prospects
It may be concluded that for improving tomato forsalinity tolerance, tomato breeding should also resort topyramiding the characteristics since, no described traitsalone is likely to produce a tolerant genotype. Thresholdlimit of salinity for tomato, up to which yield reducesvery little or no reduction occur, is 2.5-3.0 dS m-1 andafter it, every increase of 1.0 dS m-1 in EC results in ayield reduction of about 9-10%. The upper limit of salinitytomato crop improvement is 6.0 dSm-1. Beyond this,breeding programmes are not feasible because yield losssurpass than 50%.
Yield reduction at moderate salinity is mainly due toreduction in average fruit weight (while, at higher salinity,yield reduction is due to reduced number of fruit perplant). This in turns is directly proportional to fruit sizeunder normal environment. Hence cultivation of tomatocultivars with small sized fruits or even cherry type tomatoshould be recommended under saline environment. Bothadditive and non-additive gene action have to be exploitedwith trait specific or environment specific breeding byadopting adequate strategies viz. bi-parental mating, diallelselective mating, wide crossing and reciprocal recurrentselection.
References
Akinci S, Yilmaz K and Akinci IE (2004). Response oftomato (Lycopersicon esculentum Mill.) to salinity in theearly growth stages for agricultural cultivation in salineenvironments. Journal of Environmental Biology 25: 351-357.
Baishya KC, Syamal MM and Singh KP (2000). Diallelanalysis in tomato. Journal of Agricultural Sciences of N.E.India 13 (2): 225-228.
Bhatt RP, Adhekari RS, Biswas VR and Kumar N (2004).Genetic analysis of qualitative traits in tomato(Lycopersicon esculentum) under open and protectedenvironments. Indian Journal of Genetics and PlantBreeding 64 (2): 125-129.
Chadha S, Vidyasagar and Kumar J (2002). Combiningability and gene action studies for some fruits characters
in bacterial wilt resistant tomato lines. South IndianHorticulture 50 (1-3): 67-71.
Cheema DS, Kumar D and Kaur R (2003). Diallel analysisfor combining ability involving heat tolerance lines oftomato (Lycopersicon esculentum Mill.). Crop Improvement30 (1): 39-44.
Dhaliwal MS, Singh S and Cheema DS (2003). Line x Testeranalysis for yield and processing attributes in tomato.PAU Journal of Research 40 (1): 49-53.
Griffing B (1956). Concept of general and specific combiningability in relation to diallel crossing system. AustralianJournal of Biological Science 9: 463-493.
Hamdia MA and Shaddad MAK (2010). Salt tolerance ofcrop plants. Journal of Stress Physiology & Biochemistry 6(3): 64-90.
Hayman BI (1954). The analysis of variance of diallel tables.Biometrics 10: 235-244.
Parida AK and Das AB (2005). Salt tolerance and salinityeffects on plants: a review. Ecotoxicology and EnvironmentalSafety 60 (3): 324-349.
Raja S, Shokat S, Azhar FM, Azhar MT and Khan AA(2012). Screening of tomato (Solanum lycopersicum L.)genotypes at different salinity levels. Journal of PlantBreeding and Crop Science 4(6): 94-100.
Saeed A, Saleem MF, Zakria M, Anjum SA, Shakeel A andSaeed N (2011). Genetic variability of NaCl tolerancein tomato. Genetics and Molecular Research 10 (3): 1371-1382.
Sharma KC, Verma S and Pathak S (2002). Combining abilityeffects and components of genetic variation in tomato(Lycopersicon esculetum). Indian Journal of AgriculturalScience 72 (8): 496-497.
Srivastava JP, Singh H, Srivastava BP and Verma HPS (1998).Heterosis in relation to combining ability in tomato.Vegetable Science 25 (1): 43-47.
Thakur MC and Joshi A (2000). Combining ability analysisof yield and other horticultural traits in tomato. HaryanaJournal of Horticultural Sciences 29 (3-4): 214-216.
Received: April, 2014; Accepted June 2014

Performance of Fennel (Foeniculum vulgare Mill.) as Influencedby Saline Water Irrigation and Organic Input Management in
Semi-arid Conditions
R.L. Meena*, S.K. Ambast, S.K. Gupta, Anil R. Chinchmalatpure and D.K. Sharma
Central Soil Salinity Research Institute, Karnal-132 001, Haryana, India*Email: [email protected]
Abstract
Irrigation water is one of the scarcest but critical resources for agricultural production and most of the arid andsemi-arid regions are usually underlain by aquifers of poor quality. A field experiment was conducted for fouryears during rabi season to assess the impact of saline water irrigation and organic input management optionsfor sustaining productivity of high value spice crop fennel (var. Hisar Swarup HF-33). Saline water of low(ECiw, 2 dS m-1) and high (ECiw 8.6 dS m-1) salinity were used for irrigation. These types of waters are commonlyencountered in arid and semi-arid regions. Eight inorganic and organic input options were used to verify thehypothesis whether the adverse effect of saline water irrigations can be mitigated through organic inputs.Surprisingly the average seed yield of fennel with low and high saline water use was almost at par (1.56 ± 0.02t ha-1) showing its suitability for saline irrigation. Average seed yield of fennel under inorganic and organicinput treatments ranged from 1.4 to 1.7 t ha-1. The trend in yield over the years reveals that application oforganic inputs in various combinations can play an important role in sustaining the yield through improvementin fertility of salt-affected soils especially when irrigated with poor quality waters. Amongst all the combinations,farmyard manure + vermi-compost (50:50 ratios for equivalent N) produced economically remunerative andsustainable yield over the years with a net income of about Rs 124 thousand per ha.
Key words: Farm yard manure, Fennel, Neem manure, Organic inputs, Saline water, Seed yield, Vermi-compost,Foeniculum vulgare
Introduction
India is a leading producer of spices and condiments;and the seed spices have unique position being thecommodity of economic importance. In India, seed spicefennel (Foeniculum vulgare Mill.) is grown in Gujarat,Rajasthan, Madhya Pradesh, Haryana and Uttar Pradeshcovering an area of about 100 thousand ha withproduction of 143 thousand tones in the year 2012-13(Indian Horticulture Database, 2013). Since the crop iswidely grown in arid and semi-arid regions where soiland water often contain high concentration of salts,farmers resort to irrigate it with saline groundwater(Ashraf and Akhtar, 2004; Qasim et al., 2003). Thoughthe farmers use saline water for irrigation but nosystematic information is available on irrigation watersalinity tolerance limits of this crop particularly whenorganic and inorganic inputs are used. In addition to this,there is growing concern about the adverse impacts ofpesticides and chemical fertilizers on the environment,quality of food and safety of human and animalpopulations. As the people are becoming more qualityconscious, the demand for organically grown spices is
increasing in the global market. Although the benefits oforganic fertilizers are widely documented (Enwall et al.,2005; Lal, 2004; Fliessbach et al., 2009; Pimental et al.,2005), but simultaneously it has also emerged thatapplication of organic inputs may be at the cost of yield-loss over short periods (Mader et al., 2002). However,Mbagwu (1992) advocated that use of organic fertilizerscan be as effective as chemical fertilizers over longerperiods of time. At present; there is limited informationavailable on cultivation of seed spices using saline water;and role of organic fertilizers in mitigating the adverseeffects of saline water. Therefore, the present study wasplanned with the objectives (i) to assess the effect of salinewater irrigations on the yield of fennel and (ii) toinvestigate the mitigation of adverse impacts of salinewater through appropriate combinations of organic inputsunder irrigation using low and high saline water forsustainable production of the crop.
Materials and Methods
A field experiment was initiated during kharif seasonof 2008 with sesame-fennel crop rotation, fennel beingcultivated during the rabi season at Bir Forest Farm, Hisar(29o 10’ N latitude and 75o 44’E longitude at an altitude
Journal of Soil Salinity and Water Quality 6(1), 52-58, 2014
*Corresponding author

Performance of Fennel as Influenced by Saline Water Irrigation 53
of 220 m above mean sea level). The study site iscategorized as semi-arid with an average annual rainfallof about 450 mm. The total average annual rainfallreceived during four years (2008-09 to 2011-12) variedfrom 399.2 mm to 918.8 mm, of which 75% was receivedduring July to September. Only 10 to 15% of the totalannual rainfall was received during the rabi seasons (Table1). The pan evaporation ranged from 1.2-10.3 mm day-1
during November 2008 to May 2012. The lowtemperatures in the area during December and Januaryadversely affected the growth of the fennel but crop growthresumed afterwards with the rise in temperature. The soilof the experimental site is highly calcareous (UsticHaplocambids) sandy loam with ECe 0.80 – 0.86 dS m-1,pHs 8.2 – 8.5 and organic carbon 0.26%. The water qualityof two tube wells available at the farm was analyzed atdifferent intervals following standard methods (Jackson,1973) to keep track of the temporal changes in the waterquality. The average ECiw of two tube wells was 1.9 dS m-
1 and 8.6 dS m-1 and designated as low saline and highsaline water, respectively. Periodic ECiw, pH, RSC andSAR of low saline water were 2.0 dS m-1, 8.4, 4.8 meq l-1
and 12.9 m mol l-1; and of high saline water these valueswere 8.6 dS m-1 , 7.7, nil and 18.5 mmol l-1, respectively(Fig. 1).
The crop was sown in first week of November everyyear and harvested in last week of April to 3rd week ofMay of the next respective years in 3-4 plucking.Irrigations were applied commonly to all the treatmentsbut depending upon the climatic conditions, numbers ofirrigations varied from 5 – 7 during the four years of study.The fennel variety Hisar Swarup (HF-33) was cultivatedfor all the four seasons. The treatments composed ofirrigations with two water qualities of water in main plots.
In sub plots, 8 different treatments comprised of inorganicfertilizer in the recommended dose (60 kg N ha-1 and 30kg P2O5 ha-1); inorganic fertilizer and organic manures incombination; and 6 combinations of organic inputs, viz.,farmyard manure, vermin-compost and non-edible Neemmanure as shown in the following treatments:
T1 : 100% inorganic fertilizer which includes 60 kg Nha-1 through urea and 30 kg P2O5 ha-1 through singlesuper phosphate;
T2 : 50% N through urea and P through SSP (inorganic)+ 50% using organic inputs, for initial three years.This treatment was fully converted to organic inputsin the 4th year applied through FYM+VC+NM @ 8t, 1.74 t and 1.60 t ha-1, respectively;
T3 : 50% of N equivalent each using farmyard manure@ 6 t ha-1 + vermi-compost @ 1.3 t ha-1;
T4 : 50% of N equivalent each using farmyard manure@ 6 t ha-1 + non-edible Neem manure @ 1.2 t/ha;
T5 : 33.3% of N equivalent each using farmyard manure@ 4 t + vermi-compost @ 0.87 t + non-edible Neemmanure @ 0.8 t ha-1;
T6 : 100% N equivalent (200% of treatments 3) eachusing farmyard manure @ 12 t + vermin-compost@ 2.6 t ha-1;
T7 : 100% N equivalent (200% of treatments 4) eachusing farmyard manure @ 12 t + non-edible Neemmanure @ 2.4 t ha-1;
T8 : 66.6% N equivalent (200% of treatments 5) eachusing farmyard manure @ 8 t + vermi-compost @1.74 t + non-edible Neem manure @ 1.60 t ha-1.
Table 1. Rainfall, evaporation and temperature during crop growth period (Nov. 2008-May 2012)
Climatic parameters Years MonthsNov. Dec. Jan. Feb. March April May
Rainfall (mm) 2008-09 3.2 0.8 10.3 6.1 4.1 24.9 38.22009-10 0.0 0.0 11.5 7.6 2.5 0.0 1.92010-11 0.0 43.6 0.0 34.8 12.5 35.2 84.92011-12 0.0 0.0 14.4 0.0 0.0 33.3 29.8
Evaporation (mm/day) 2008-09 2.3 1.5 1.4 2.1 3.7 7.4 9.32009-10 2.1 1.6 0.9 2.3 4.2 8.1 10.32010-11 2.2 1.4 1.2 1.9 3.0 5.5 9.12011-12 2.6 1.4 1.4 2.2 3.8 5.6 8.7
Temperature (0C) (maximum) 2008-09 28.9 23.5 20.1 24.1 29.4 35.8 40.82009-10 27.1 23.1 17.3 25.8 34.9 41.1 42.92010-11 27.7 21.3 16.9 22.7 28.6 34.4 40.12011-12 29.4 22.9 18.4 21.0 28.5 34.2 39.9
Temperature (0C)(minimum) 2008-09 10.6 6.8 5.8 7.3 11.8 17.3 23.72009-10 9.9 4.9 5.9 7.4 16.7 20.4 24.42010-11 11.5 4.6 4.2 8.1 11.4 16.7 23.92011-12 11.0 5.2 4.8 5.3 10.3 18.0 22.3

54 Meena et al.
The treatments were replicated three times. The cropwas sown at row to row spacing of 50 cm in 2 m x 3 mplots. The chemical fertilizers; full dose of phosphorouswas applied as basal while nitrogen was applied in twosplits, half as basal and half at 30 days after sowing. Allthe organic inputs were applied before sowing the cropand mixed well into the soil. Observations on plant height,number of umbels per plant, number of umbellets perumbel and seed weight per umbel were recorded onrandomly selected and tagged 5 plants per plot. Pluckedumbels were kept in shade for drying and seed yield (kgper plot) was recorded after threshing of dried umbels.Soil samples (0-30 cm depth) were collected at the time
of harvesting every year and analyzed for ECe, pHs,organic carbon, available nitrogen and phosphorouscontent after each season. Statistical analysis wasperformed for judging the significance of differenceamong different treatments at 0.95 level of probabilitywith the help of a statistical package (OPSTAT online).An account of the expenses made under each treatmentwas maintained for detailed economic analysis.
Results and Discussion
Effects of use of saline water irrigation and organicfertilizer inputs on growth and yield attributes of thefennel crop are discussed in the following sections.
Fig. 1. Periodic water quality measurement of tube well used for irrigation (2008-2012)

Performance of Fennel as Influenced by Saline Water Irrigation 55
Effect of saline water irrigation on growth parameters
Perusal of data on plant height showed that theaverage plant height (136.4 cm) was highest under lowsaline irrigation although it was not significantly differentto high saline water during 2008-09 and 2010-11 (Table2). The data show that fennel was able to tolerate highsalinity to a great extent without much reduction in plantheight. Number of umbels per plant ranged from 20.1 to28.2 with an average of 23.2 with low saline and 22.7with high saline water. No significant difference in numberof umbels/plant was observed, however, the highestnumber (30.1) of umbels/plant were recorded during firstyear under high saline water irrigation. Number ofumbellets/umbel decreased from 21 to 19.2 during firstthree years although maximum (28.3) were recordedduring fourth year under low saline water irrigation.Number of umbellets/umbels increased from 18 in firstyear to 27 in the fourth year under high saline waterirrigation. It could be attributed to improved physicalcondition of soil under various organic inputs over theyears. Significant difference in number of umbellets wasobserved during first and third years with higher averagenumber of umbellets (22.4) recorded in low saline waterirrigation (Table 2). Similar results have been reported byMangal et al. (1986) and Abou El-Magd et al. (2008).
Effect of saline water irrigation on yield and yieldattributes
Seed weight per umbel varied from 1.16-4.04 g and1.27-3.81 g with low and high saline water, respectivelywith an average of 2.30 and 2.25 g, respectively (Table3). Contrary to the expectation of large differences, onlythe small differences were recorded between two salinitiesof irrigation water. This might be due to several reasons,possibly higher RSC in low saline water and mitigationof the adverse effect of saline water irrigation byapplication of different organic inputs. Seed weight of100 seeds did not differ significantly during the initial threeyears while significant differences were observed only infourth year. Averaged data showed that maximum 100seed weight was recorded under high saline water, maybe due to presence of RSC in low saline irrigation waterwhich might have adversely affected the development ofseeds as compared to high saline water. Similarly, seedyield of fennel showed decreasing trend initially whichgot reversed during third and fourth years. Averaged seedyield showed that the higher yield of 1.57 t ha-1 wasobtained under low saline water which was not muchdifferent than 1.56 t ha-1 with high saline water irrigation(Table 3). The reasons for such minor differences havebeen discussed previously in this section. Similar resultswere obtained by Mangal et al. (1986) and Abou El-Magdet al. (2008).
Effect of organic manures on growth parameters
Application of organic inputs had significant effecton plant height of fennel during all the years. Application
of inorganic fertilizers resulted in significantly lower plantheights of 114.3, 100 and 137.5 cm during first, secondand fourth year, respectively. Among the treatments,application of farmyard manure, vermi-compost andneem manure (Neem shakti) in different combinations (T3-T8) resulted in increased plant height as compared toinorganic fertilizer alone (T1) or combination of inorganicfertilizer + organic manures (T2). Results also showed thateffect of organic manures was quite discernible duringthe fourth year probably because of the fact that few yearsare required to improve and rejuvenate the soil fertility.Average plant height was 122.4 cm with application ofinorganic fertilizer alone while higher values wereobtained in all other treatments. The year-to-yearvariations in plant height might be due to climatevariability, rainfall, impact of saline water irrigation androle of organic manures in mitigating its adverse effects.The role of organic manures in mitigating the adverseeffect resulted in overall good plant growth. Averagenumber of umbels/plant under organic manuresapplication ranged from 21.1 to 24.1. There was nosignificant difference in umbels per plant under differentorganic manures as compared to inorganic fertilizer aloneor their combination (T2). The maximum number ofumbels per plant ranging from 24.3 to 33.3 were recordedduring first year and there was general decline in lateryears. Number of umbellets/umbel has significantvariation only in the first year while remaining non-significant in the following years. Maximum umbelletswere recorded during fourth year with average numberof umbellets per umbel ranging from 19.8 to 23.5 (Table2). Similar findings in plant height and yield of capsicumspice crop were also reported by Gopinath et al. (2008);Jaipaul et al. (2011).
Effect of organic input application on yield and yieldattributes
Perusal of the data presented in Table 3 showed thatseed weight per umbel and seed yield with differentorganic input management options varied significantlyduring first year. Average seed weight per umbel rangedfrom 2.0 g with inorganic treatment to 2.6 g with organicmanure treatment T8. Highest seed weight per umbel wasrecorded during fourth year which ranged from 3.40 to4.40 g. Data on 100 seed weight showed that it differednon-significantly during all the years averaging 0.74 to0.77 g under different treatments.
In first year, the lowest seed yield (1.17 t ha-1) of fennelwas obtained with the application of inorganic + organicinput combination in the ratio of 50:50 while highest 1.63t ha-1was obtained under treatment T8 which was at parwith the seed yield (1.44 t ha-1) obtained in treatment T3.The results of lower yield in treatment T2 (50%inorganic+50% organic) are in line with the resultsavailable in literature on several crops, since the availabilityof nutrients applied through organic inputs needs time to

56 Meena et al.
Tab
le 3
. Se
ed y
ield
and
yie
ld p
aram
eter
s of
fenn
el u
nder
sal
ine
wat
er a
nd o
rgan
ic in
put a
pplic
atio
n du
ring
200
8-09
to 2
011-
12
Tre
atm
ents
Seed
wei
ght/
umbe
l (g)
100
seed
wei
ght (
g)Se
ed y
ield
(t/
ha)
08-0
909
-10
10-1
111
-12
Av.
08-0
909
-10
10-1
111
-12
Av.
08-0
909
-10
10-1
111
-12
Av.
Sali
nity
of
irri
gati
on w
ater
Low
sal
ine
2.46
1.54
1.16
4.04
2.30
0.90
0.55
0.72
0.79
0.74
1.50
1.26
1.50
2.03
1.57
Hig
h sa
line
2.26
1.64
1.27
3.81
2.25
0.90
0.63
0.77
0.76
0.77
1.40
0.85
1.87
2.13
1.56
LSD
(p=
0.05
)0.
07N
SN
S0.
14-
NS
NS
NS
0.01
-N
S0.
410.
06N
S-
Org
anic
inp
ut o
ptio
nsT
12.
201.
311.
103.
402.
000.
900.
540.
750.
790.
751.
370.
971.
531.
781.
41T
21.
951.
451.
273.
372.
010.
890.
560.
710.
790.
741.
171.
011.
552.
161.
47T
32.
321.
590.
943.
922.
190.
870.
620.
740.
780.
751.
441.
201.
652.
101.
60T
42.
201.
531.
324.
022.
270.
880.
640.
780.
760.
771.
341.
111.
612.
171.
56T
52.
231.
581.
254.
112.
290.
850.
600.
750.
770.
741.
551.
171.
632.
011.
59T
62.
551.
841.
254.
092.
430.
900.
570.
740.
750.
741.
440.
881.
971.
971.
57T
72.
471.
691.
294.
062.
380.
930.
570.
740.
780.
761.
601.
051.
562.
171.
60T
82.
951.
741.
294.
402.
600.
970.
600.
750.
770.
771.
631.
031.
982.
211.
71L
SD (p
=0.
05)
0.41
NS
NS
NS
-N
SN
SN
SN
S-
0.03
NS
NS
NS
-
Dep
icti
ons
for
trea
tmen
ts a
re a
s in
Tab
le 2
.
Tab
le 2
. Gro
wth
and
gro
wth
par
amet
ers
of fe
nnel
und
er s
alin
e w
ater
and
org
anic
inpu
t app
licat
ion
duri
ng 2
008-
09 to
201
1-12
Tre
atm
ents
Pla
nt h
eigh
t (cm
)U
mbe
ls/p
lant
Um
belle
ts/u
mbe
l
08-0
909
-10
10-1
111
-12
Av.
08-0
909
-10
10-1
111
-12
Av.
08-0
909
-10
10-1
111
-12
Av.
Sali
nity
of
irri
gati
on w
ater
Low
sal
ine
131.
212
1.0
143.
314
9.9
136.
428
.221
.720
.122
.923
.221
.020
.919
.228
.322
.4H
igh
salin
e12
0.5
98.5
140.
314
3.3
125.
730
.118
.621
.620
.322
.718
.018
.520
.427
.021
.0L
SD (p
=0.
05)
NS
22.2
NS
5.1
-N
SN
SN
SN
S-
1.8
NS
0.8
NS
-O
rgan
ic i
nput
opt
ions
T1
114.
310
0.1
137.
713
7.5
122.
428
.521
.121
.521
.523
.219
.818
.018
.225
.020
.3T
211
5.6
100.
613
4.3
147.
512
4.5
24.3
16.8
20.8
22.5
21.1
17.3
18.5
20.0
23.5
19.8
T3
120.
511
0.4
139.
714
1.6
128.
127
.319
.623
.822
.823
.420
.018
.218
.828
.321
.3T
412
4.7
106.
214
0.5
146.
312
9.4
28.0
19.7
22.2
21.3
22.8
17.8
18.2
21.0
27.0
21.0
T5
133.
010
5.0
139.
714
3.2
130.
229
.819
.819
.720
.522
.520
.320
.520
.028
.722
.4T
613
2.8
113.
913
8.9
146.
713
3.1
32.8
22.5
20.8
20.3
24.1
20.2
21.6
20.2
31.8
23.5
T7
131.
811
9.0
152.
115
7.1
140.
029
.020
.018
.721
.722
.420
.221
.020
.527
.222
.2T
813
4.0
122.
715
1.3
153.
014
0.3
33.3
21.7
19.2
22.0
24.1
20.7
21.5
20.0
29.5
22.9
LSD
(p=
0.05
)10
.914
.411
.19.
2-
NS
NS
NS
NS
-2.
0N
SN
SN
S-
(T1:
100%
Ino
rgan
ic fe
rtili
zer
T2:
Ino
rgan
ic +
org
anic
inpu
ts (5
0:50
)-fu
lly o
rgan
ic a
fter
3 y
ears
, T3:
Far
mya
rd m
anur
e+ V
erm
i-co
mpo
st (5
0:50
), T
4: F
arm
yard
man
ure
+ N
on-e
dibl
e N
eem
man
ure
(50:
50),
T5:
Far
mya
rd m
anur
e +
Ver
mi-
com
post
+ N
on-e
dibl
e N
eem
man
ure
(33.
3:33
.3:3
3.3)
, T
6: F
arm
yard
man
ure
+ V
erm
i-co
mpo
st (
100:
100
), T
7: F
arm
yard
+N
on-e
dibl
e N
eem
man
ure
(100
:100
), T
8: F
arm
yard
man
ure+
Ver
mi-
com
post
+N
on-e
dibl
e N
eem
man
ure
(66.
6:66
.6:6
6.6)
.

Performance of Fennel as Influenced by Saline Water Irrigation 57
build-up for its availability to the plants. As expected underfield conditions, there are year to year variations in cropyield varying from 0.88 to 2.21t ha-1. These can beattributed to initial soil conditions as salinity build-up taketime within the season or over the years, variations inquality of irrigation water and rainfall and its distributionduring the crop growth period.
Averaged seed yield of fennel (ranged from 1.47 to1.71 t ha-1) in various treatments, the highest being intreatment T8 with 200% application on N basis. Mosteconomical combination over the four years periodhowever, was T3, where farmyard manure + vermin-compost was used in 50:50 ratio on N basis with anaverage seed yield of 1.60 t ha-1. It could fetch a net incomeof Rs. 123980 per ha. According to Edwards (1998),vermin-compost contains most of the plant nutrients suchas; nitrate, phosphates, exchangeable calcium, solublepotassium, and microelements. Thus, application ofvermin-compost helps in improving plant growth anddevelopment and is responsible for increased qualitativeand quantitative yield of many crops (Atiyeh et al., 2002;Roy et al., 2010). A cursory look at the results of fouryears revealed that saline water up to 8.5 dS m-1 can beused for irrigation of fennel with application of organicmanures. Later helps in mitigating the adverse effect ofsaline water application and sustaining the productivityof high value crop as compared to application of inorganicfertilizers alone. It can be attributed to improved soilphysical state especially in low saline RSC water andsustained release of macro and micro nutrients. Similarresults were also reported by several workers (Bahadur etal., 2006; Gopinath et al., 2008; Bahadur et al., 2009;Jaipaul et al., 2011; Upadhyay et al., 2012). Resultsobtained by Phogat et al. (2010) also show that synergyof chemical amendments and organic inputs sustainedvegetable production irrigated with high RSC waters. Theresults presented in this paper are of great importance inmanaging saline water in arid and semi-arid regions forcultivation of seed spices in general and fennel inparticular.
Conclusion
Groundwater of poor quality is a general characterof arid and semi-arid ecology where fennel crop iscultivated. Results of four years study reveal thatcultivation of high value seed spices in general and fennelin particular is possible using saline water up to EC 8.5dS m-1 without much yield reduction. The long-termadverse effect of saline water if any can be mitigated byapplication of organic inputs (farmyard manure, vermin-compost and neem manure. The organic inputs in variouscombinations help in improving the soil physico-chemicalproperties that mitigates the adverse effect of saline waterincluding RSC, which is known to cause adverse effectson soil physical properties. Considering the cost andquality of organic inputs, a combination of 6 t ha-1
farmyard manure and 1.3 t ha-1 vermi-compost seems tobe a good combination to achieve the sustainableproduction of fennel crop in saline environment andfetching net income of Rs 124 thousand per ha.
References
Abou EI-Magd MM, Zaki MF and Abou-Hussein SD (2008).Effect of organic manure and different levels of salineirrigation water on growth, yield and chemical contentof fennel. Australian J. Basic and Applied Sci. 2(1): 90-98.
Atiyeh RM, Lee SS, Edwards CA, Arancon NQ, MetzgerJD (2002). The influence of humic acid derived fromearthworm processed organic wastes on plant growth.Bioresour. Technol., 84: 7-14.
Ashraf M and Akhtar N (2004). Influence of salt stress ongrowth, ion accumulation and seed oil content in sweetfennel. Biologia Plantrum, 48(3): 461-464.
Bahadur A, Singh J, Singh KP, Upadhyay AK and Rai M(2006). Effect of organic amendments and biofertilizerson growth, yield and quality attributes of Chinesecabbage (Brassica pekinensis). Indian Journal of AgriculturalSciences 76: 596–598.
Bahadur A, Singh J, Singh KP, Upadhyay AK and Rai M(2009). Morpho-physiological, yield and quality traitsin lettuce (Lactuca sativa) as influenced by use of organicmanures and biofertilizers. Indian Journal of AgriculturalSciences 79(4): 282–5.
Edwards CA (1998). The use of earthworms in thebreakdown and management of organic wastes. In:Earthworm Ecology. CRC Press LLC, Boca Raton, pp.327-354.
Enwall K, Laurent P and Sara H (2005). Activity andcomposition of the denitrifying bacterial communityrespond differently to long-term fertilization. Applied andEnvironmental Microbiology (American Society forMicrobiology) 71(2): 8335-8343.
Fliessbach A, Maeder P, Diop A, Luttikholt LWM.,Scialabba N, Niggli U, Paul H and La Salle T (2009)Climate change: Global Risks, Challenges and Decisions.P24.17 Earthand Environmental Science, 6 242025: IOPPublishing.
Gopinath KA, Saha S, Mina BL, Kundu S, Selvakumar Gand Gupta HS. (2008). Effect of organic manures andintegrated nutrient management on yield potential ofbell pepper (Capsicum annuum) varieties and on soilproperties. Archives of Agronomy and Soil Science, 54: 127-137.
Indian Horticulture Database 2013. Crop-wise area,production and productivity of major spice crops inIndia. National Horticulture Board, Government ofIndia. pp 6-7.
Jackson ML (1973) Soil Chemical Analysis.Prentice Hall ofIndia, Pvt. Ltd, New Delhi.
Jaipaul, Sharma S, Dixit AK and Sharma AK (2011). Growthand yield of capsicum (Capsicum annum) and garden

58 Meena et al.
pea (Pisum sativum) as influenced by organic manuresand biofertlizers. Indian Journal of Agricultural Sciences,81(7): 637-642.
Lal R (2004). Soil carbon sequestration impacts on globalclimate change and food security. Science J. 304(5677):1623-7.
Mader PF, Andreas D, David G, Lucie F, Padruot and Niggli1. (2002) Soil fertility and biodiversity in organicfarming. Science, 296. 5573: 1694-1697.
Mangal JL, Yadav A and Singh GP (1986). Effect of differentlevels of soil salinity on the growth, yield and quality ofcoriander and fennel. South Indian Horticulture. 34(1):26-31.
Mbagwu JSC (1992). Improving the productivity of adegraded Ultisol in Nigeria using organic and inorganicamendments. Bioresource Technology, 42(2): 149-154.
Phogat V, Sharma SK, Kumar S, Satyavan and Gupta SK(2010). Vegetable Cultivation with Poor Quality Water. CCSHaryana Agricultural University, AICRP Hisar. 72p.
Pimentel D, Paul H, James H, David D and Rita S (2005).Environmental, energetic, and economic comparisonsof organic and conventional farming systems. BioScience,55(7): 573-582.
Qasim M, Ashraf M, Ashraf MY, Rehman SU and Rha ES(2003). Salt-induced changes in two canola cultivarsdiffering in salt tolerance. Biologia Plantrum, 46: 629-632.
Roy S, Arunachalam K, Kumar DB, Arunachalam A. (2010).Effect of organic amendments of soil on growth andproductivity of three common crops viz. Zea mays,Phaseolus vulgaris and Abelmoschus esculentus. Appl. Soil.Ecol., 45: 78-84.
Upadhyay AK, Bahadur A and Singh J (2012). Effect oforganic manures and biofertilizers on yield, dry matterpartitionaing and quality traits of cabbage (Brassicaoleracea var. capitata). Indian Journal of Agricultural Sciences,82(1): 31-14.
Received: January, 2014; Accepted: May, 2014

Impact of FYM and Potassium Interactions on PotatoYield Cultivated on Moderate Saline Soils
Sharif Ahamad1*, J.C. Dagar1 and D. Mani2
1Central Soil Salinity Research Institite, Zarifa Farm, Kachhwa Road, Karnal-132 001, Haryana, India2Sheila Dhar Institute of Soil Science, Department of Chemistry, Central University of Allahabad,
Allahabad-211 001, Uttar Pradesh, India*Email: [email protected]
Abstract
Potato is very important food crop of India and needs attention to increase its production. One experiment wasconducted to evaluate the effect of farm yard manure (FYM) in interaction with and without potassium fertilizerapplication on potato (Solanum tuberosum) yield. The yield improved with addition of K fertilizer along withFYM and it was highest at 100 kg K2O ha-1 when applied along with 30 t ha-1 of FYM. Application of bothFYM and K fertilizer resulted significantly increase in above ground and tuber yield as compared to control.The yield increased by 19 % over control with application of 100 kg ha-1 potash alone and the same increasedby 56 and 87 % when FYM was applied at the rate of 15 and 30 t ha-1 with 100 kg K2O ha-1. Potassium balancewas positive only when FYM was applied. The aboveground biomass of the plant was found significantly(p=0.01) correlated with tuber production and in turn the later (due to application of K) was found significantly(p=0.01) correlated with K accumulation in tubers. These studies suggest that it is advantageous to apply FYMin combination with K as it improves tuber yield significantly by way of improving soil physical properties andalso maintaining a positive nutrient balance and also helps in keeping quality of the tubers.
Key words: Farm yard manure (FYM), Nutrient management, Potassium, Potato yield, Above ground biomass(AGB), Solanum tuberosum
IntroductionPotato is one of the most important crops worldwide
and ranks fourth in annual production (Fernie andWillmitzer, 2001). In India, it is cultivated on 1.84 m haarea with a production of 36.6 m tones at the rate ofabout 20 t ha-1 (Mo A, 2011). More than 80 per cent ofthe potato crop in India is cultivated on the Indo-Gangeticplains during the winter season. The three major statesof the country producing potato are Uttar Pradesh, WestBengal and Bihar contributing almost 68 per cent of thetotal area and 78 per cent of the production (Trehan etal., 2009; Mo A, 2011). High efficiency in nutrientmanagement of the potato crop, therefore, assumes specialsignificance. As compared with other crops, potato hasshallow root system which limits its foraging capacity inthe soil. On the other hand, uptake of fertilizer nutrients(NPK) by potato per unit area and time is quite highbecause of the rapid rate of early growth and tuber bulking(Singh and Trehan, 1997). A healthy crop of potatoremoves about 170-230 kg K2O ha-1 indicating higherrequirement for K as compared to cereals. As such potatoinvariably responds to potassium application in thevarious kinds of soils and agro-climatic conditions inwhich it is grown.
Organic and mineral fertilizations improve physicalproperties of light-textured soils and also water andwarmth regime. Systematic fertilization not only increasespotato yield but also alters its quality, and results in thehigher build up of nutrients in the yield (Bagdoniene etal., 1998). It has been found that nutrients present inmineral fertilizers are more effective than the equivalentamount of these nutrients present in FYM (Bagdonieneet al., 1998), therefore, mineral fertilizer efficacy forpotatoes was noticeably higher than that of organicfertilizer (Antanaitis and Svedas, 2000). Depending onthe mineral fertilizer forms, rates and nutrient ratios, thecontents of dry matter, starch, protein and othersubstances may either increase or decrease. Excessivenitrogen fertilization reduces starch, dry matter and sugarcontents in tubers of potato, which lead to get spoiledmore rapidly during storage (Simanaviciene et al., 1996).Dry matter content is affected by various factors, amongwhich the most significant include: tuber maturity, growthcharacter, plant nutrient and water uptake (Haris, 1992).As the fertilizers both organic and inorganic playimportant role in potato cultivation, but little informationis available on interaction of FYM and potassiumtherefore, the present experiment was conducted toobserve the impact of FYM and potassium on yield andquality of potato tubers.
Journal of Soil Salinity and Water Quality 6(1), 59-63, 2014
*Corresponding author
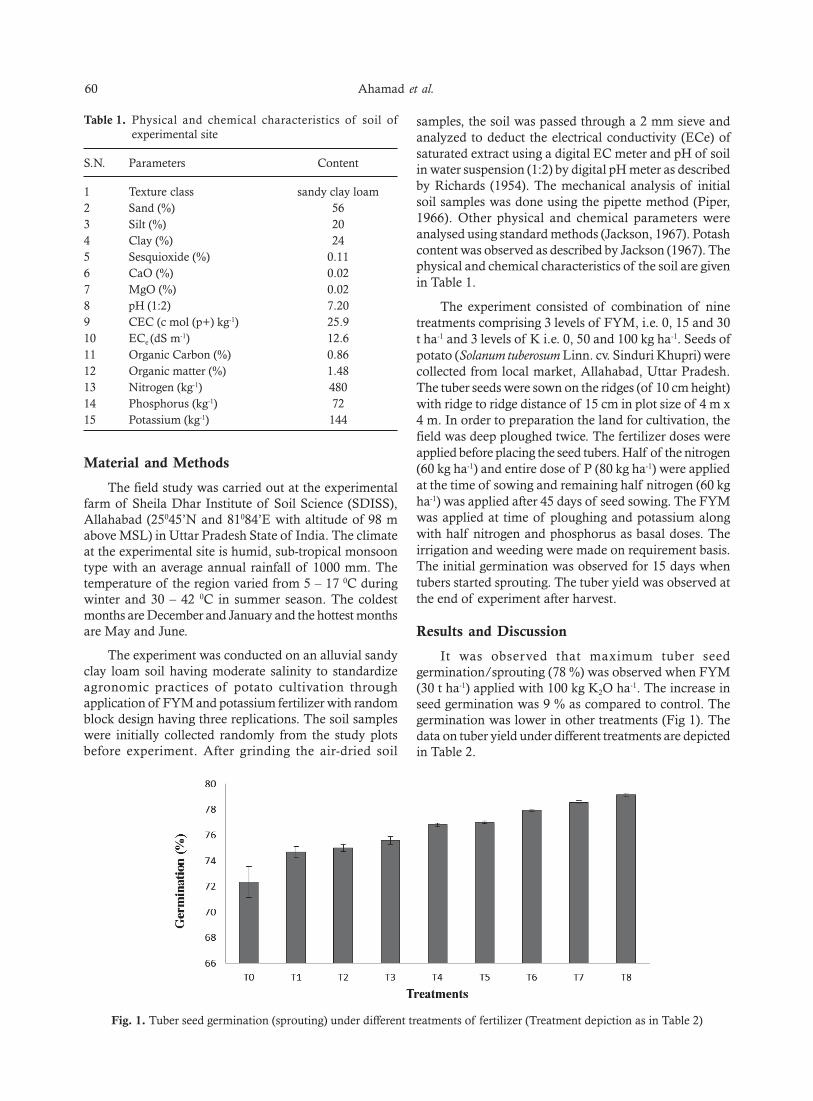
60 Ahamad et al.
Material and Methods
The field study was carried out at the experimentalfarm of Sheila Dhar Institute of Soil Science (SDISS),Allahabad (25045’N and 81084’E with altitude of 98 mabove MSL) in Uttar Pradesh State of India. The climateat the experimental site is humid, sub-tropical monsoontype with an average annual rainfall of 1000 mm. Thetemperature of the region varied from 5 – 17 0C duringwinter and 30 – 42 0C in summer season. The coldestmonths are December and January and the hottest monthsare May and June.
The experiment was conducted on an alluvial sandyclay loam soil having moderate salinity to standardizeagronomic practices of potato cultivation throughapplication of FYM and potassium fertilizer with randomblock design having three replications. The soil sampleswere initially collected randomly from the study plotsbefore experiment. After grinding the air-dried soil
samples, the soil was passed through a 2 mm sieve andanalyzed to deduct the electrical conductivity (ECe) ofsaturated extract using a digital EC meter and pH of soilin water suspension (1:2) by digital pH meter as describedby Richards (1954). The mechanical analysis of initialsoil samples was done using the pipette method (Piper,1966). Other physical and chemical parameters wereanalysed using standard methods (Jackson, 1967). Potashcontent was observed as described by Jackson (1967). Thephysical and chemical characteristics of the soil are givenin Table 1.
The experiment consisted of combination of ninetreatments comprising 3 levels of FYM, i.e. 0, 15 and 30t ha-1 and 3 levels of K i.e. 0, 50 and 100 kg ha-1. Seeds ofpotato (Solanum tuberosum Linn. cv. Sinduri Khupri) werecollected from local market, Allahabad, Uttar Pradesh.The tuber seeds were sown on the ridges (of 10 cm height)with ridge to ridge distance of 15 cm in plot size of 4 m x4 m. In order to preparation the land for cultivation, thefield was deep ploughed twice. The fertilizer doses wereapplied before placing the seed tubers. Half of the nitrogen(60 kg ha-1) and entire dose of P (80 kg ha-1) were appliedat the time of sowing and remaining half nitrogen (60 kgha-1) was applied after 45 days of seed sowing. The FYMwas applied at time of ploughing and potassium alongwith half nitrogen and phosphorus as basal doses. Theirrigation and weeding were made on requirement basis.The initial germination was observed for 15 days whentubers started sprouting. The tuber yield was observed atthe end of experiment after harvest.
Results and Discussion
It was observed that maximum tuber seedgermination/sprouting (78 %) was observed when FYM(30 t ha-1) applied with 100 kg K2O ha-1. The increase inseed germination was 9 % as compared to control. Thegermination was lower in other treatments (Fig 1). Thedata on tuber yield under different treatments are depictedin Table 2.
Table 1. Physical and chemical characteristics of soil ofexperimental site
S.N. Parameters Content
1 Texture class sandy clay loam2 Sand (%) 563 Silt (%) 204 Clay (%) 245 Sesquioxide (%) 0.116 CaO (%) 0.027 MgO (%) 0.028 pH (1:2) 7.209 CEC (c mol (p+) kg-1) 25.910 ECe (dS m-1) 12.611 Organic Carbon (%) 0.8612 Organic matter (%) 1.4813 Nitrogen (kg-1) 48014 Phosphorus (kg-1) 7215 Potassium (kg-1) 144
Fig. 1. Tuber seed germination (sprouting) under different treatments of fertilizer (Treatment depiction as in Table 2)

Impact of FYM and Potassium Interactions on Potato Yield 61
The results of variance analysis of fresh potato tuberyield were consistent and statistically significant (p<0.05)among the different combination of FYM and Kfertilization treatments. Under all the treatmentcombinations the yield increased significantly overcontrol. The highest mean potato tuber yield (47 t ha-1)was achieved at treatment T8 (30 t ha-1 FYM and 100 kgK2O ha-1) followed by T7 (30 t ha-1 FYM and 50 kg K2Oha-1). Application of K alone had significant effect on yieldincrease. The increase was 16 and 20 % when potassiumalone was applied at the rate of 50 and 100 kg ha-1,respectively. When FYM at the rate of 15 t ha-1 alone wasapplied the increase in yield was 40 % over control. Thesame increased to 52 and 56 % over control when K wasapplied at the rate of 50 and 100 kg h-1 respectively with15 kg ha-1 FYM but there was no significant increasebetween treatment T4 and T5 i.e. 50 and 100 kg ha-1
application of K with 15 t ha-1 FYM. At the same timethe impact of K at the rate of 50 and 100 kg ha-1 withapplication of FYM (15 t ha-1) was only 9 and 3 %,respectively. Combined application of 30 t ha-1 FYM withK (50 and 100 kg ha-1) significantly increased the tuberyield as compared to the application of organic orinorganic fertilizers when applied alone. The applicationof 30 t ha-1 FYM alone increased the yield to 60 % overcontrol and the same also increased to 72 and 88 % overthe control with combination of K at the rate of 50 and100 kg ha-1, respectively. The higher benefits fromcombined applications might be attributed, in part, toenhanced fertilizer recovery (increased uptake) due toincreased soil physical and chemical properties as a result
of increased soil organic matter. Besides increasing soilphysical and chemical properties, by providing macro andmicronutrient organic manure improved crop production.The results are in partial agreement with reports of Bereezet al. (2005); Alam et al. (2007); Daniel et al. (2008); andJohnston (2008), who reported higher yields of potatofrom manure application along with inorganic fertilizers.Exclusion of K from either inorganic or from combinedinorganic-organic treatments significantly decreased thetuber yield, suggesting K as a major yield limiting factorfor optimum production of potatoes. These results are inline with reports of several workers mentioned above, whosuggested the balanced management of inorganicfertilizers in production of potato and other differentcrops. Significantly higher tuber yield by application ofK along with 30 t FYM was probably due to nutrientssupply of manure and releasing of already bonded P fromthe soil due to the release of acids by decomposition ofFYM. However, Rutunga and Neel (2006), reported thatapplication of high rate of nutrient rich farmyard manure(35 t ha-1) alone was sufficient to increase potato yieldand no supplemental P and lime were required after fourregular seasonal applications in Alisols of Mata, Rwanda.From laboratory incubation results of 40 g animal manurekg-1 soil, Whalen et al. (2000), observed highly significantpH increase and high concentration of available P and Kin labile forms. Moreover, from the present investigationsit is clear that besides application of FYM and nitrogenand phosphorus, potassium plays as a limiting factor forenhancing tuber yield.
Above ground biomass (AGB) production
The observations clearly showed that the plant aboveground biomass was higher (19 t ha-1) in T8 (30 t FYM +100 kg K2O ha-1) treatment followed by T7 (30 t FYM +50 kg K2O ha-1). However, the application of FYM aloneat the rate of both 15 and 30 t ha-1 significantly increasedthe AGB to 13 % over the control. The increase was 16and 20 % when potassium was applied at the rate of 50and 100 kg ha-1, respectively. Usually the growth of aboveground foliage is indicator of tuber yield also as thephotosynthetic biomass helps in tuber growth and thecarbohydrates accumulated in foliage are translocated intubers. This is evident from Figure 2 where tuber yield issignificantly correlated (p=0.01) with AGB (Fig. 2).Trehan et al. (2001) also reported almost similar results.
K content in potato tuber
K application had showed the statistically significant(p = 0.05) among the different combinations of FYM andK fertilizer treatments in respect of K content in potatotuber. It is observed that the K content significantlyincreased to 7 and 11 % over the control with increasingdose of 50 and 100 kg ha-1 K fertilizer alone, respectively.However, FYM alone also increased the K content in tuberto 11 and 17 % with application of 15 and 30t ha-1,
Table 2. Effect of different levels of FYM and potassiumtreatments on potato yield parameters and Kaccumulation in tubers
Treatments Tuber Above ground K contentyield biomass in tuber
(t ha-1) (t ha-1) (%)
T0 25f 15cb 0.70d
T1 29e 15cb 0.75dc
T2 30e 15c 0.78cb
T3 35d 17cba 0.78cb
T4 38c 16cba 0.79cb
T5 39c 17cba 0.79cba
T6 40c 17cba 0.82ba
T7 43b 18ba 0.84ba
T8 47a 19a 0.87a
LSD (p=0.05) 2.04 2.90 0.06
Depiction: T0 (FYM 0 + K 0), T1 (FYM 0 + K 50), T2 (FYM 0+ K 100), T3 (FYM 15 + K 0), T4 (FYM 15 + K 50), T5 (FYM 15+ K 100), T6 (FYM 30 + K 0), T7 (FYM 30 + K 50), T8 (FYM30 + K 100) and (FYM values in tones ha-1 and K in kg ha-1).The same superscripts in a column are statistically notsignificant.

62 Ahamad et al.
Fig. 2. Correlation between above ground biomass and tuber yield
Fig. 3. Correlation between potato tuber yield and K accumulation in tuber
respectively. Although, the FYM at the dose of 30 t ha-1
expressed the significant higher K content to 6 % in tuberwhen applied with 100 kg K ha-1. The interaction of FYMand K application helps in increase of tuber yield, whichin turn is significantly correlated (p=0.01) with Kaccumulation in tuber (Fig. 3).
This has significance because K in tubers helps inkeeping quality as well as frost tolerance during winter.Application of K increases plant height, crop vigour andimparts resistance against drought, frost and diseases.Potassium increases leaf expansion particularly at earlystages of growth and extends leaf area duration bydelaying leaf shedding near maturity. It increases boththe rate and duration of tuber bulking. Its applicationactivates a number of enzymes involved in photosynthesis,carbohydrate and protein metabolism; and assists in thetranslocation of carbohydrates from leaves to tubers. It isobserved that potassium increases the size but not thetotal number of tubers (Grewal and Singh, 1980; Trehanet al., 2001). Potassium application thus increases yieldby the formation of larger size tubers. In the north-westernplain, potassium plays an active role in protecting thisrather sensitive crop to frost damage. In the north-westernhills, under long day and rainfed conditions, K application
prevents the crop suffering from moisture stress duringthe early stages of growth (Trehan et al., 2009).
Wilkerso and Grunes (2000) reported that under highK availability, increasing N supply will increase Kconcentration and uptake, whereas without K applicationK concentration decrease in high rates because of growthdilution. This suggested that continuous application ofNP without K depletes soil K and may pose problem incrop production.
ConclusionThe results of the present study indicate that it is
advantageous to apply FYM along with K application asit increases potato yield by way of improving soil physicalproperties. FYM also supplies macro and micro nutrientsand maintains healthy positive nutrient balance besidesbeing a source of organic matter; and further it emphasizesthe need for integrated and balance nutrient managementin potato in irrigated alluvial sandy loam moderate salinesoils. It is concluded that application of 30 tones FYMand 100 kg K ha-1 is sufficient to meet the croprequirements of potato cultivars. Further, application ofpotassium also helps in reducing the frost injury and alsoin the keeping quality of the tubers for longer period.

Impact of FYM and Potassium Interactions on Potato Yield 63
References
Alam MN, Jahan MS, Ali MK, Ashraf MA and Ialam MK(2007). Effect of vermicompost and chemical fertilizerson growth, yield and coponents of potato in barind soilof Bangladesh. Appl. Sci. Res. 3: 1879-1888.
Amberger A (1997). Dungung der kartofel. Kartoffelbau 1 (2):26-29.
Antanaitis S and Svedas A (2000). Bulviu derliaus ir cheminiuelemeniu koncentracijos rysys su dirvozemioagrocheminemis savybemis. Zemdirbyste Mokslo darbai.LZI, LZUU 70: 29-40.
Bagdoniene V, Arlauskiene EL and Slepetiene (1998). Mesloir meneraliniu trasu efektyvumas sejomainoje.Zemdirbyste Mokslo darbai. Akademija 63: 70-81.
Bereez K, Kismanyott T and Debreczeni K (2005). Effectsof organic matter recycling in long term fertilizationtrials and model pot experiments. Commun. Soil Sci. PlantAnalysis 36: 192-202.
Daniel M, Pant LM and Nigussie D (2008). Effect ofintegrated nutrient management on yield of potato andsoil nutrient status of Bako, West Shoa. EthiopianJournal of Natural Resources 10: 85-101.
Fernie AR and Willmitzer L (2001). Molecular andbiochemical trigger of potato tuber development. PlantPhysiol 127: 1459-1465.
Grewal JS and Singh SN (1980). Effect of K nutrition onfrost damage and yield of potato on alluvial soils ofPanjab. Plant and Soil 57: 105-110.
Haris P (1992). The Potato Crops: The Scientific Basis forImprovement. Chapman & Hall. pp 902.
Jackson ML (1967). Soil Chemical Analysis. Asia PublishingHouse, New Delhi.
Johnston AE (2008). Soil organic matter, effects on soil andcrops. Birtish Soc. Soil Sci. 2: 97-105.
Mo A (2011). Agricultural Statistics at a Glance. Departmentof Agriculture and Cooperation, Directorate ofEconomics and Statistics, Ministry of Agriculture(MoA), Government of India, New Delhi, pp 367.
Piper CS (1966). Soil and Plant Analysis. Waite AgricultureResearch Institute, Univ. Of Adelaide, Australia.
Rechards LA (1954). Diagnosis and Improvement of Saline andAlkali Soils. USDA, Washington DC.
Rutunga V and Neel H (2006). Yield trends in long-termcrop rotation with organic and inorganic fertilizers onAlisol in Mata, Rwanda. Biotechnol. Agron. Soc. Environ.10: 217-228.
Simanaviciene O, Staugaitis G and Antanaitis A (1996).Dirvozemioagrocheminiu savybiu itaka bulviu irlaukodarzoviu derliui ir kokybei. Zemes ukio mokslai 2: 60-67.
Singh JP and Trehan SP (1997). Balance fertilization toincrease the yield of potato. In: Brar MS and Bansal SK(eds) Balance Fertilizer in Panjab Agriculture, IPI-PRII-PAUWorkshop. Proceeding (15-16 December 1997), PAU,Ludhiana, India, pp 129-139.
Trehan SP, Pandey SK and Bansal SK (2009). Potassiumnutrietion of the potato crop – the Indian scenario.Optimizing Crop Nutrition 19: 2-9.
Trehan SP, Roy SK and Sharma RC (2001). Potato varietydifferences in nutrition deficiency symptoms andresponse to NPK. Batter Crop International. Potash andPhosphorus Institute of Canada 15: 18-21.
Whalen JK, Chang C, Clayton GW and Carefoot JP (2000).Cattle manure and lime amendment improve cropproduction of acidic soil in Northern Alberta. CanadianJournal of Soil Science 82: 227-238.
Wilkerso SR and Grunes DL (2000). Nutrient interaction insoil and plant nutrition In: Sumner M (ed) Handbook ofSoil Science. CRS Press.
Received: April, 2014; Accepted: June, 2014

Distribution and Characteristics of Salt-affected Soils ofMorena District of Madhya Pradesh
Y.P. Singh1, S.K. Verma2, S.K. Dubey3 and S.C. Tiwari4
1RVS Krishi Viswa Vidyalaya, Zonal Agricultural Research Station, Morena-476 001, Madhya Pradesh, India2College of Agriculture, RVS Krishi Viswa Vidyalaya, Gwalior, Madhya Pradesh, India
3Regional Research Station, CSWCRTI, Chhalesar, Agra, Uttar Pradesh4AICRP on Management of Salt Affected Soils and Use of Saline Water in Agriculture, Indore, Madhya Pradesh, India
Abstract
Soil samples were identified using RS software on digital satellite data and analyzed for different physico-chemical properties and characterized for different classes of salinity and alkalinity. Three types of texture ofsurface soils i.e. sandy loam, sandy clay loam and clayey were observed. Soil colour varies from brownishyellow to yellowish brown and light yellowish brown. All soil samples were neutral to alkaline in reaction andtheir mean values of pH of saturation paste (pHs) and electrical conductivity of saturation extract (ECe) were8.55 and 3.93 dS m-1, respectively. The average values of infiltration rate, saturation percentage and bulk densitywere 5.4 mm hr-1, 30.95 and 1.51 Mg m-3, respectively. These salt-affected soils were non-calcareous in naturewith 97% deficient in organic carbon (OC) content. Similarly the mean values of cation exchange capacity(CEC) in cmol (p+) kg-1 and exchangeable sodium percentage (ESP) were found to be 34.5 and 38.4, respectively.The mean values of cations and anions in cmol (p+) kg-1 of saturation extract were containing 21.1 of calcium,13.25 of sodium, 0.27 of potassium and 0.63 of carbonate, 14.71 of bicarbonate, 23.64 of chloride and 2.45 ofsulphate, respectively. Saturation extract analysis revealed that the cations and anions followed decreasingorder calcium > sodium > potassium and chloride > bicarbonate > sulphate > carbonate, respectively. Thevalues of sodium adsorption ratio (SAR) were ranged from 2.2 to 5.8, with mean value of SAR was 3.87. It wasobserved that, out of total 782 villages of Morena District, 167 villages are having saline and alkaline nature ofsoil. Out of total cultivated area of the district, 8.59% area was affected either by salinity or alkalinity. A mapsowing distribution of salt -affected soils of Morena district was also generated.
Key words: Anions, Cations, Cation exchange capacity, Exchangeable sodium percentage (ESP), Salt-affectedsoils, Sodium adsorption ratio (SAR)
IntroductionOut of an estimated area of 173.64 million hectare
(M ha) of total degraded land approximately 7 M ha areaffected by soil salinity/sodicity in India (Abrol andBhumbla, 1971). During the last decade several agencieshave given divergent estimates of extent of salt-affectedsoils. For example, the National Commission ofAgriculture indicated the extent as 7.16 M ha, theNational Remote Sensing Agency as 3.9 M ha, theNational Wasteland Development Board as 1.5 M ha andthe National Bureau of Soil Survey and Land UsePlanning as 6.02 M ha. Singh (1992) estimated the extentof these soils to be 9.8 M ha. The data from varioussources were critically evaluated at Central Soil SalinityResearch Institute, Karnal (Haryana) and figure has nowbeen updated to 6.7 M ha. An area of more than 2.5 lakhha affected by salinity and alkalinity is estimated to beexisting in the Chambal Command area of MadhyaPradesh. These soils extent in 23 districts spreading over
two soil regions i.e. black soil region and the alluvial soilregion in Chambal Command area (Raghuwanshi, 2011).High water table in irrigation commands like Chambal,Kunwari, Asan, Sankh, Tawa and Barna had inflicted awide spread secondary salinization. Soil salinity andalkalinity problems in Chambal division occur primarilydue to use of poor quality waters for irrigation, over-irrigation in canal command area, imbalanced use ofnutrients coupled with limited use of organic manures,less recycling and burning of crop residues in soil, soilerosion, undulated topography, water logging in canalcommand area, improper drainage, and presence ofnatural salt in sub surface, etc. The distribution of waterquality in Madhya Pradesh state was observed as 75%good, 10% marginal and 15% poor quality undergroundwater (Yadav and Kumar, 1995). Keeping above pointsin view, the present study was undertaken to determinethe detail information about quality of soil and itsproperties with respect to their suitability for crops andmanagement of soil for sustainable production system.
Journal of Soil Salinity and Water Quality 6(1), 64-69, 2014
*Corresponding author
Distribution and Characteristics of Salt-affected Soils 65
Material and Methods
The present investigation was carried out in differentblocks in Morena district which is situated in the northernpart of Madhya Pradesh and the agro-ecological regionof investigation area is N8D2 (Sehgal, 1996). The studyarea is located in between 23o 15’ to 26o 45’ N – latitudeand 70o 30’ E – longitude with an altitude ranging from150 to 240 m. The agro-climatic region of MadhyaPradesh state of India is under Central Plateau and HillsRegion and state is further divided into 11 sub agro-climatic zone. The Morena district falls under Gird Agro-climatic zone. The climate of this zone is characterizedas semi-arid and extremely hot during May-June (up to49°C) and extremely cold during end of December toJanuary (up to 00C). Only 90 % of the rainfall is receivedfrom south-west monsoon during July to September andrest in winter. The mean annual rainfall of the district isless than 700 mm. Total geographical area of Morenadistrict is 5.67 lakh ha. Out of this total area 2.39 lakh isunder cultivation consisting of alluvial and 0.24 lakh hamedium black soils (Tomar et al., 1995). Their texture isvariable ranging from very coarse to fine. However thesoils of the area are deep, alluvium derived soils withmedium AWC (available water retention capacity). Themajor crops of the area of investigation are paddy, sesame,pearl millet and sorghum in Kharif, whereas mustard andwheat in Rabi.
A salt affected soils map was prepared using data ofsoil analysis; features identified showing salinity/sodicityproblem on digital satellite data of Resourcesat-1 LISS-III through visual interpretation of the digital image usingRemote Sensing Software (ERDAS IMAGINE 8.7) andgeographical position of the identified points of salinity/sodicity. Digital satellite data were procured from theNRSA, Hyderabad. Geographical position of theidentified points was recorded using RS software and soilsamples were collected from these identified points.During the traversing of the area, soil samples were alsocollected from locations other than identified one,showing problem of salinity/sodicity. The morphologicalfeatures of the area studied and were described in thefield as per soil survey manual of USDA (Soil SurveyStaff, 1998). The collected soil profile samples wereanalyzed for different physico-chemical properties in thelaboratory as per standard methods of Richards (1954).On the basis of degree of salinity and sodicity, the soilswere classified and map of the district was generated.According to salinity and sodicity hazards, the soil wasclassified in to three different categories viz, for salinity[Slight (ECe 4-8 dS m-1), Moderate (ECe 8-15 dS m-1)and High (ECe > 15 dS m-1)] and for alkalinity [Slight(ESP 15-25), Moderate (ESP 25-40) and High, (ESP >40)] as suggested by Verma et al. (2014).
Results and Discussion
Physico-chemical properties of soil
The soil textures of surface soils were sandy loam,sandy clay loam and clayey (Table 1). The colour variedfrom brownish yellow to yellowish brown and lightyellowish brown. Soils were slight to highly erodible, welldrained and infiltration rate ranged from 2.8 to 7.9 mmhr-1 with mean value of 5.4 mm hr-1. The saturationpercentages of soils were from 24.7 to 42.7 and with meanvalue 30.95. The bulk density ranged from 1.48 to 1.56Mg m-3 with mean value of 1.51 Mg m-3. The calciumcarbonate (CaCO3) content varied from 0.63 to 2.3% withmean value of 0.83%. As per rating limit proposed byFAO (1973), none of the soil samples were found incalcareous (CaCO3 content <5%). Organic carboncontents ranged from 0.22 to 0.51% having an averagevalue 0.35%.
According to Muhr et al. (1965) rating limit, 97% soilsamples were found in low carbon content (<0.50 %)whereas, 3% were medium (0.50 to 0.75 %) in range andnone of the soil samples were found in high (>0.75 %) inorganic carbon content. All soil samples were foundneutral to alkaline in reaction and pH values of saturationpaste varied from 8.0 to 9.1 having mean value of 8.55.The higher value of pH could be due to increase inaccumulation of bicarbonate, sodium and calciumcarbonate in soil. The electrical conductivity of saturationpaste ranged from 2.50 to 8.62 dS m-1 with the mean valuesof 3.93 dS m-1. Cation exchange capacity (CEC) andexchangeable sodium percentage (ESP) ranged from 19.2to 46.2 cmol (p+) kg-1 and 18.1 to 56.2%, respectively andmean of CEC and ESP values were 34.5 and 38.4,respectively. In most of the soil samples ESP was observedgreater than 15, and pH values were also higher than 8.5indicating severe alkaline conditions in soil.
The calcium content of saturation extract was 9.1 to46.2 cmol (p+) kg-1 and recorded mean value 21.1 cmol(p+) kg-1 of calcium (Table 1). The sodium content ofsaturation extract ranged from 8.4 to 18.8 cmol (p+) kg-1
and with mean value of 13.25 cmol (p+) kg-1. Thepotassium content of saturation extract ranged from 0.10to 1.25 cmol (p+) kg-1 with mean value 0.27 cmol (p+) kg-
1. Saturation extract analysis of cations revealed that thedominating cations was calcium followed by sodium andpotassium, respectively.
The anion content of saturation extract varied from0.40 to 0.80 cmol (p+) kg-1 with mean value 0.63 cmol(p+) kg-1 of carbonate (Table 1). The values of bicarbonatecontent of saturation extract ranged from 4.5 to 38.1 cmol(p+) kg-1, with mean value of 14.71 cmol (p+) kg-1. Thechloride content of saturation extract was 14.4 to 48.5cmol (p+) kg-1 with mean value 23.64 cmol (p+) kg-1. Thesulphate contents in saturation extract ranged from 1.2to 3.1 cmol (p+) kg-1 with mean value of 2.45 cmol (p+)

66 Singh et al.
Table 1. Physico-chemical characteristics of soils
Soil Characteristics Range Mean
Sand (%) 52.40 to 80.24 60.53Silt (%) 14.10 to 25.72 20.15Clay (%) 6.56 to 32.95 19.63Soil texture Sandy loam, Sandy clay loam and ClayDry soil colour (Munsell) 10YR 6/8M, 5 5/4M, 6/4DSoil colour Brownish yellow, Yellowish brown, Light yellowish brownErosion Slight to severeDrainage Well drainedIR (mm hr-1) 2.8-7.9 5.4Saturation (%) 24.7 to 42.7 30.95BD (Mg m-3) 1.48-1.56 1.51CaCO3 (%) 0.61-2.3 0.83Organic Carbon (%) 0. 20 – 0. 31 0. 27pHs 8.0 to 9.1 8.55ECe (dS m-1) 2.50 to 8.62 3.93ESP (%) 18.1 to 56.2 38.4CEC [cmol (p+) kg-1] 19.2 to 46.2 34.5Cations of saturation extractCa [cmol(p+) kg-1] 9.1 to 46.2 21.1Na [cmol(p+) kg-1] 8.4 to 18.8 13.3K [cmol(p+) kg-1] 0.10 to 1.25 0.27Anions of saturation extractCO3 [cmol(p+) kg-1] 0.40 to 0.80 0.63HCO3 [cmol(p+) kg-1] 4.5 to 38.1 14.71Cl [cmol(p+) kg-1] 14.4 to 48.5 23.64SO4 [cmol(p+) kg-1] 1.2 to 3.1 2.45SAR (mmol1/2 L-1/2) 2.2 to 5.8 3.87
IR-infiltration rate, BD-bulk density, pHs-pH of saturation paste, ECe-electrical conductivity of saturation extract, ESP-exchangeablesodium percentage. CEC-cation exchange capacity, SAR-sodium adsorption ratio
Table 2. Area of salt affected soils in different categories of Morena district
Category Area (ha)
Slight salinity and slight alkalinity (EC 4-8 dS m-1 and ESP 15-25) 9920Slight salinity and Moderate alkalinity (EC 4-8 dS m-1 and ESP 25-40) 1263Slight salinity and High alkalinity (EC 4-8 dS m-1 and ESP > 40) 1647Moderate salinity and slight alkalinity (EC 8-15 dS m-1 and ESP 15-25) 5548Moderate salinity and Moderate alkalinity (EC 8-15 dS m-1 and ESP 25-40) 4106Moderate salinity and High alkalinity (EC 8-15 dS m-1 and ESP > 40) 108High salinity and slight alkalinity (EC > 15 dS m-1 and ESP 15-25) -High salinity and Moderate alkalinity (EC > 15 dS m-1 and ESP 25- 40) -High salinity and High alkalinity (EC > 15 dS m-1 and ESP > 40) -
Total 22592
kg-1. Saturation extract analysis reveals that thedominating anions was chloride followed by bicarbonate,sulphate and carbonate, respectively. The values of sodiumadsorption ratio (SAR) ranged from 2.2 to 5.8 mmol1/2 L-
1/2 with mean value of SAR 3.87 mmol1/2 L-1/2.
Extent of salt affected soils
According to salinity and sodicity hazards, the soilwas classified in to three different categories as suggested
by Verma et al., (2014). Out of the total cultivated area(262.7 thousand ha) of Morena district, salt-affected soilsare distributed in 22.59 thousand ha (Table. 2) with about8.6 % of total cultivated area of the district. The maximumarea of the salt-affected soils of Morena district falls underthe categories of slight salinity and slight alkalinity (9920ha) followed by moderate salinity and slight alkalinity(5548 ha), moderate salinity and moderate alkalinity (4106ha), slight salinity and high alkalinity (1647 ha), slight

Distribution and Characteristics of Salt-affected Soils 67
Fig. 1. Distribution of salt affected soils in Morena District of Madhya Pradesh
Table 3. Distribution of salt affected soils in different villages of Morena district
Category Villages
Morena TehsilSlight salinity and slight alkalinity(ECe 4-8 dS m-1 Navali, Badagaon, Karari, Kheria Kalan, Herang, Nawla, Getwal, Biseda,and ESP 15-25) Indurkha, Shanipur, Basapur, Urhan, BanpuraSlight salinity and high alkalinity(ECe 4-8 dS m-1 Bijolipura, Dawar, Dogarpur Lodhi, Khadagpur, Bharrad, Khuti, Endraj,and ESP > 40) GaupuraSlight salinity and moderate alkalinity(ECe 4-8 Padawali, Paroli, Bhatera, Manjar, Churola, BarendadS m-1 and ESP 25-40)Moderate salinity and high alkalinity(ECe 8-15 UsrethadS m-1 and ESP > 40)Moderate salinity and Moderate alkalinity (ECe Karola, Godhara, Kankata pura, Nayagaon, Mahtoli, Jhulap, Bharard,8-15 dS m-1 and ESP 25-40) Khuti, Jaynagar, Nurabad, Gawra, Jireshwar, Tikri, Mavai, Bhidrad,
Vijayath, Lakheta pura, Jaipur, BagerModerate salinity and slight alkalinity(ECe 8-15 Basapur, Badwari, Mavai, RitarakdS m-1 and ESP 15-25)Joura TehsilSlight salinity and slight alkalinity(ECe 4-8 dS m-1 Bhopatpur, Sakra, Kemra, Bachoura, Bisnouri, Simroda, Niwas, Jounara,and ESP 15-25) SikrodaModerate salinity and Slight alkalinity(ECe 8-15 Parsoda, Narholi, Dhadore, Gajra, Jaura, Akbarpur-Nidhan, ManpurdS m-1 and ESP 15-25) Balla, Amroutha, GapraModerate salinity and Moderate alkalinity (ECe Dhadore, Gajra, Barawali8-15 dS m-1 and ESP 25-40)Kailaras TehsilSlight salinity and slight alkalinity(ECe 4-8 Mahema, Uchad, Bhilampur, Saipura, Haripura, Kirawali Jadid, KhedadS m-1 and ESP 15-25) Kala, Kheda Taur, TodaSlight salinity and High alkalinity(ECe 4-8 dS m-1 Madhopur, Piparraua, Chamargawa, Kheda Mangarh, Mali Bajna, Bamanand ESP > 40) Bajna, Pandoli, Gastoli, Risoni, Bastoli, Dogarpur Mangarh

68 Singh et al.
Moderate salinity and Slight alkalinity(ECe 8-15 Samai, Uchad, Hirawali, Rahadpur, Etora, Galpura, Butrawali, Pancholi,dS m-1 and ESP 15-25) Suhas, Kiraich, Damezer, Fuloda, Chak-Sirwanda, Birawali, Padoli,
Baman Bajna, Kirawali, Bhangarh, Kemra Cham, Pipronia, KisloliModerate salinity and Moderate alkalinity Badroli, Auroda, Baman Bajna, Damezer, Tilojari, Sahri, Kodera,(ECe 8-15 dS m-1 and ESP 25-40) Chodera, Sigachouli, Jillowa, Devkachcha, SagoriyaSabalgarh TehsilSlight salinity and slight alkalinity(ECe 4-8 dS m-1 Bitchpuri, Niwadi, Kemara Kala, Konara, Gadula, Chawadi Pura,and ESP 15-25) Shivlalpur, ItawaSlight salinity and Moderate alkalinity(ECe 4-8 Dubhra, KurawalidS m-1 and ESP 25-40)Moderate salinity and Slight alkalinity (ECe 8-15 Bewarkhedi, Palri, Ganjikhera, Rahuka Gaon, Sunhera, Sabalgarh,dS m-1 and ESP 15-25) Bhurwai, KurawaliModerate salinity and Moderate alkalinity (ECe Kurawali, Murwai8-15 dS m-1 and ESP 25-40)Ambah TehsilSlight salinity and slight alkalinity(ECe 4-8 dS m-1 Bareh, Madkar, Banakpur, Ambah, Inanki, Thara, Jalkandara, Pali,and ESP 15-25) Tiktoli, Manpur Rajputi, Arusi, Sangoli, Lepa, Bhidosa, Kolaua,
Ranipura, SwargpuraPorsa TehsilSlight salinity and slight alkalinity(ECe 4-8 Mihroda, BudharadS m-1 and ESP 15-25)
salinity and moderate alkalinity (1263 ha) and moderatesalinity and high alkalinity (108 ha).
Distribution of salt affected soils
Out of total 782 villages of Morena District, 167 werehaving the problem of salinity and alkalinity (Table 3).On the basis of degree of salinity and sodicity, the soilmap of the district was generated (Fig. 1).
Fifty two villages of Morena Tehsil of the districtwere affected by slight salinity to moderate salinity andslight alkalinity to high alkalinity. Similarly in Joura Tehsilof Morena District, 21 villages were affected by slightsalinity to moderate salinity and slight alkalinity tomoderate alkalinity and 56 villages of Kailarash Tehsilof Morena District were having slight salinity to moderatesalinity and slight alkalinity to high alkalinity problems.In Sabalgarh Tehsil, total 20 villages were having slightsalinity to moderate salinity and slight alkalinity tomoderate alkalinity problematic soils; whereas 16 villagesof Ambah Tehsil were having slight salinity and slightalkalinity and in Porsa Tehsil of the District only 2 villageswere affected with slight salinity and slight alkalinityproblem. The salinity and alkalinity affected maximumvillages in Kailarash followed by Morena, Joura,Sabalgarh, Ambah and Porsa Tehsil of the District,respectively.
Conclusions
Major factors of soil salinity and alkalinity problemswere found due to irrigation with poor quality waters,over-irrigation in canal command area, undulatedtopography, water logging in canal command area, andimproper drainage. The survey indicated that 21.36%
villages representing 8.6% cultivated area were affectedby salinity or alkalinity problem. In rest of the area cropssuch as pearlmillet, sesame, green gram, black gram,cluster bean, pigeon pea, chick pea, mustard, and wheatcan be cultivated safely. The slight or moderate saline oralkali soils can be recommended to grow Sesbania,mustard and barley in area of coarse textured soil; whereaspaddy and wheat can be grown in heavy textured soilunder good quality irrigation water management. Foreffectively management of high alkali soils, these mustbe reclaimed before cultivation of crops throughapplication of gypsum or pyrite as per requirement anduse of Sesbania as green manure crop.
References
Abrol IP and Bhumbla DR (1971) Saline alkali soils in India:their occurrence and management. F.A.O. World SoilResource Report 41: 42-51.
FAO (1973). Calcareous Soils. FAO Soil Bulletin No. 21.
Muhr GR, Datta NP, Sankara Subramoney H, Liley VK andDonahue RR (1965). Soil Testing in India. US Agencyfor International Development, New Delhi pp. 120.
Raghuwanshi SRS, Tiwari SC, Prabha S, Raghuwanshi OPS,Sasode DS and Umat R (2011). Characterization of salt-affected soils of Bhind district of Madhya Pradesh.Journal of the Indian Society Soil Science 59: 388-391.
Richards LA (1954). Diagnosis and Improvement of Saline andAlkali Soils. USDA Handbook No.60.
Sehgal J (1996). Pedology, Concepts and Applications. KalyaniPublication, pp 590-593.
Singh NT (1992). Land degrdation and remedial measureswith reference to salinity, alkalinity, water logging and
Distribution and Characteristics of Salt-affected Soils 69
acidity. In: Deb DL (ed). Natural Resource Managementfor Sustainable Agriculture and Environment. Pub. NewDelhi, p. 42.
Soil Survey Staff (1998). Keys to Soil Taxonomy. Edition, 8.USDA, Washington DC, USA.326P.
Tomar VS, Gupta GP and Kaushal GS (1995). Soil Resourcesand Agro-climatic Zones of Madhya Pradesh. Published byProfessor and Head, Department of Soil Science andAgricultural Chemistry, JNKVV, Jabalpur, MadhyaPradesh, India. P. 132.
Verma SK, Tiwari SC, Bangar KS, Yadav SS, Tomar PS,Bansal KN and Raghuwanshi SRS (2014). Soil and WaterSalinity Prolems in Grid Zone of M. P. Tech. Bulletin/DI/48/2014. R. V. S Krishi Vihswa Vidyalaya, Gwalior (M.P.), p. 238.
Yadav HD and Kumar Vinod (1995) Management of sodicwater in light textured soil. In: Rao KVGK, AgrawalMC, Singh OP and Osterbaan RJ (eds) Reclamation andManagement of Waterlogged Soils. CSSRI, Karnal, pp. 226-241.
Received: June, 2014; Accepted: July, 2014

Guidelines for authors for submitting manuscript for publication in the“Journal of Soil Salinity and Water Quality”
The authors are advised to follow the guidelines given in latest issue of journal for preparation of manuscript.The authors are required to submit one electronic copy in the form of CD or email ([email protected];[email protected]) and one hard copy completed in all respects to General Secretary, Journal of Soil Salinity andWater Quality, Central Soil Salinity Research Institute, Kachhwa Road, Karnal-132001, Haryana, India. The receiptof manuscript as well as subsequent correspondences regarding the manuscript will be done electronically only.
Manuscript
• The article should be as concise as possible. All the full length papers should comprise of Short title, Title,Author(s)’ name(s), Affiliations, email ID of corresponding author, Abstract, Key words, Introduction, Materialand Methods, Results and Discussion, Conclusions, Acknowledgement (if any), References, Tables and Figures(if any). The text under each section should throughout have 12 fonts in MSW, Times New Roman, justifiedwith 1.5 line spacing. However in the Abstract part, text should be 11 font with 1.5 line spacing and should notexceeds 250 words.
• The total length of article should not exceed 15 typed pages (2.5 cm. margin on each side of A4 paper) includingTables and Figures.
• All headings should be bold in capital letters with 12 fonts except Title which should be in Title Case and have 14fonts. However, the subheadings within each section wherever necessary should be in title case bold in 14 font,further headings should be in Sentence case and bold; whereas further sob-sub titles should be bold italic. Allmain and subheadings should be aligned left.
Title Page
It should be a separate page and comprise of following:
Short Title : It should have a short title (not exceeding five words in italics) on the top of right hand corner.
Title : It should not exceed 15 words and should reflect the contents of paper. It should be in title case like“Alleviation of Sodicity Stress on Rice Genotypes by Phosphorous Fertilization”.
Author(s) : Name of author(s) should be 12 font bold (without their official designations), aligned in center and inthe title case like “A.K. Aggarwal and M.K. Tiwari”.
Address : Each author’s name should have number as superscript to indicate the address. The correspondingauthor’s name should have number as superscript to indicate more than one address. The correspondingauthor’s name should have asterisk (*) mark as superscript e.g. A.K. Aggarwal*1 and M.K. Tiwari2. Theaddress should be written in italics as shown below:
*1: Central Soil Salinity Research Institute, Zarifa Farm, Kachhwa Road, Karnal-132001, Haryana, India
2: Indian Institute of Soil Science, Nabibagh,, Berasia Road, Bhopal-462038, Madhya Pradesh, India.
All addresses should be complete indicating state/ province, PIN/ postal code and country etc. Theemail ID of corresponding author should be given after the address. The total number of pages, tablesand figures of the manuscript should also be mentioned on title page.
First Page
Actual paging (on right lower corner) of the manuscript should start from this page. It should have full title ofpaper followed by Abstract, Keywords and Introduction, etc. To ensure anonymity of the author(s), author’s namesand addresses should not be indicated on this page.
Abstract : Its contents should be in 11 font, single space and single paragraph with justified alignment.
Key words : Key words should appear just after the abstract and to be written as key words (11 fonts). These may beup to 7 in alphabetic order each separated by a comma and in title case. The scientific names (if any)should be italicized. e.g.
Key words : Agroforestry model, Biodrainage, Gypsum, Oryza sativa L., Salt tolerance,
Tables and figures
Each table and figure should have 12 font and be given on separate page after References part. Table 1 and Figure1 should be written as Table 1 (bold) and Fig. 1 (bold), respectively. Table caption should appear on the top of tablewhereas figure caption should be just below the figure. Figures captions and matter should be legible with 8-12 fontsize. Maximum size of tables and figures should be such that these can be conveniently accommodated in A4 sizepage. Approximate position of the tables and figures should be indicated in the text of the manuscript.
References
References should be in alphabetic and chronological order and should not be serial numbered. The author(s)names should start with surname, comma after initials. If first author has two publications in a year, single authorpaper should appear first. Year should be bracketed. The journal names should be in full without abbreviation andshould be italicized. Volume No. should be in bold. Few examples are given below:
Journal : Dagar JC, Tomar OS, Minhas PS and Kumar M (2013). Lemon grass productivity as affected by salinity ofirrigation water, planting methods and fertilizer doses on a calcareous soil in a semi-arid region of northwestIndia. Indian Journal of Agricultural Sciences 83(7): 734-738.
Book : Singh NT (2005). Irrigation and Soil Salinity in the Indian Subcontinent- Past and Present. Lehigh UniversityPress, Bethlehem, USA, pp 404.
Book Chapter: Tyagi NK (1998) Management of salt-affected soils. In: Singh GB and Sharma BR (eds) 50 Years ofNatural Resource Management Research. Indian Council of Agricultural Research, New Delhi, India,pp 363-401.
Online Reference: Rhoades JD, Kandiah A and Mashali AM (1992). The use of saline waters for crop production-FAO irrigation and drainage paper 48. Food and Agriculture Organization, Rome. (http://www.fao.org/docrep/t0667e00.HTM.)
Conference/Symposium Proceedings: Suarez DL and Lebron I (1993) Water quality criteria for irrigation withhighly saline water. In: Lieth H and Al Masoom AA (eds) Towards the Rational Use of High SalinityTolerant Plants, Vol 2-Agriculture and Forestry under Marginal Soil Water Conditions. Proceedings ofthe first ASWAS Conference (December 8-15, 1990), United Arab Emirates University Al Ain,UAE. Kluwer Academic Publishers, Dordrecht, the Netherlands, pp 389-397.
M.Sc/ Ph.D. Thesis: Ammer MHM (2004). Molecular Mapping of Salt Tolerance in Rice. Ph.D. Thesis, IndianAgricultural Research Institute, New Delhi, India.
Bulletin: Abrol IP, Dargan KS and Bhumbla DR (1973) Reclaiming Alkali Soils. Bulletin No. 2. Central Soil SalinityResearch Institute, Karnal, 58p.
Short communication: While writing Short Communication one should focus on studies of limited scope, preliminarydata, unique observations or research technique and apparatus. The length of short communication shouldnot exceed 3 published pages. Short communication should comprise of short title, title, names withaffiliations and text dealing with material and methods, results and discussion and references but thereshould not be any main head except of references. It should not have abstract and keywords.
Book review: These are generally invited, however, one may send critical Book Review along with one original bookfor consideration by editorial board.
Units to be followed
The international system of units (SI units) should be used throughout. Authors may consult Clark’s Tables:Science Data Book by Orient Longman, New Delhi (1982) for guidance.
The terms like Nitrogen, Phosphorous, Potassium and Zinc may be denoted as N, P, K and Zn, respectively anddose expressed as kg ha-1 for field experiments. For pot studies, units like mg kg-1 should be followed.
Common units and symbols
time=t, metre=m, second=s, centimeter=cm, cubic centimeter=cm3, cubic metre=m3, degree Celsius=ÚC, day=d,gram=g, hectare= ha (104m2), Hour=h, Kilometer=km, Kilogram=kg, litre=l, Megagram=Mg (tons to be given inMg), Microgram=µg, Micron=µm, milimole=mmol, milliequivalent=meq, micromol=µmol, milligram=mg,milliliter=ml, minute=min, nanometer=nm, square centimeter=cm2, square kilometer=km2,electrical conductivity=(EC)=dS m-1 (deci Siemens m-1), gas diffusion=g m2 s-1, water flow=m3 m2s-1, ion uptake= mol kg-1 of dried plant

material, leaf area=m2kg-1, nutrient content in plants= mg g-1 (dry matter basis), root density or root length density=m m-3, soil bulk density= g cm-3, transpiration rate=mg m2 s-1, water content of soil=kg kg-1, water tension=kPa, yield(grain or forage)= Mg ha-1, organic carbon content of soil= percent (%), cation exchange capacity of soil= cmol (p+)kg-1
Style Guidelines
All soils discussed in the manuscript should be identified according to the U.S Soil Taxonomic System at firstmention. The Latin binomial or trinomial and authority must be must be shown for all plants, insects, pathogens,microorganisms and animals when first mentioned. Both the accepted common name and the chemical name of anychemicals mentioned (including pesticides) must be provided. SI units must be used throughout the manuscript.Corresponding metric or English units may be added in parentheses at the discretion of the author. For spelling,Webster’s New Collegiate Dictionary should be used as reference. If a commonly available product is mentioned, thename and the location of manufacturer should be included in parentheses after first mention. Responsibility of thefacts and opinions expressed in the articles rests entirely with the author(s) and not with the journal.