ct equipment, operations, capacity and planning in the nhs · ct equipment, operations, capacity...
TRANSCRIPT

Page 1 of 25
CT Equipment, Operations, Capacity and Planning
in the NHS
Report from the Clinical Imaging Board
June 2015

Page 2 of 25
Foreword
This report was commissioned by the Clinical Imaging Board, an intercollegiate Board
representing The Royal College of Radiologists (RCR), the Society and College of
Radiographers (SCoR) and the Institute of Physics and Engineering in Medicine (IPEM).
This report has been compiled collaboratively, by a small multidisciplinary working group
comprising of Dr Nicholas Spencer, Clinical Radiologist and working party lead, Mrs Pam
Black, Ex-officio SCoR President July 2013 – July 2014, Ms Maria Lewis, Physicist and Ms
Paula Cunningham Lally, CT Radiographer, with essential input from Kim Cyrus, RCR
Executive Officer, and Karl Drinkwater, RCR Audit Officer.
We would like to thank Dr Spencer and all those involved in the production of this report.
The Clinical Imaging Board accepted the recommendations of the working group, and these
are set out in this report.
Dr Giles Maskell President of The Royal College of Radiologists
Mrs Karen Smith President of the Society and College of Radiographers
Professor Stephen Keevil President of the Institute of Physics and Engineering in Medicine
Page 3 of 25
1. Introduction and background
The increasing use of advanced imaging continues across the UK and throughout the world.
Within the NHS, computed tomography (CT), is long established as the mainstay of
emergency and routine diagnostic cross-sectional imaging. The applications for CT are
widespread, both for critically ill and ambulant patients, with all body parts being evaluated.
The rapid development of CT technologies and of new specialist applications, combined with
the post-processing powers of modality workstations and other tools within picture archiving
and communication systems (PACS), continue to drive the pressure on CT services.
Multidisciplinary teamworking, especially in the arena of cancer diagnosis, treatment, follow-
up and survivorship, is also significantly affecting CT service growth, which continues to
increase by over 10% per annum1 for the last decade.
However, there is anecdotal evidence that in the UK, investment in CT equipment is
declining, which may be due to NHS funding restrictions. There is much pressure to “sweat
the assets”, operating services for longer hours and increasing throughput, to help make
access to diagnostic tests ever more speedy. While all of these goals are clinically
imperative, the UK operates CT scanning from a very low installed base of less than 9
scanners per million population2.
Against this background, the Clinical Imaging Board, representing The Royal College of
Radiologists (RCR), the Society and College of Radiographers (SCoR) and the Institute of
Physics and Engineering in Medicine (IPEM), requested that a working group be convened to
evaluate the installed equipment and operations of CT services within the NHS across the
UK. The purpose of this work has been to provide information about equipment specification
and its utilisation, details of operational aspects of services, and to ascertain the planning
intentions of NHS radiology services to maintain and develop CT capacity (see Appendix 1.
Terms of reference).
This report builds upon the work of the National Audit Office (NAO) (England), which
published a report2 assessing the management of high-value capital equipment in the NHS in
England. The NAO publication focused on a number of areas, around planning, acquisition
and maintenance of high-value machines, plus meeting demand for services, and improving
the management of such equipment. The NAO report also included magnetic resonance
imaging (MRI) and linear accelerators, as well as CT. The work that furnished the NAO
report was undertaken by a combination of survey and selected site visits, and took place
following the conclusion of a centrally funded Department of Health “Cancer Equipment
Programme developed as part of the NHS Cancer Plan”3 That programme in turn, through
significant investment, had increased the replacement and overall numbers of CT and MRI

Page 4 of 25
machines, as well as linear accelerators, with the prime purpose of improved provision of
cancer diagnostic and treatment capability in the NHS. From 2000 to 2007, that programme
accounted for almost three-quarters of new and replacement machines purchased for the
NHS in England.
2. Objectives
2.1 To produce a report detailing installed equipment and operations of CT services in
the NHS across the whole UK.
2.2 To establish an overview of service forward planning intentions, in order to consider
if sufficient future CT capacity will be available and to help quantify any shortfall.
2.3 To develop guidance that may be used by providers to assist in maintaining and
updating CT equipment as well as those considering increasing their capacity.
2.4 To promote self-assessment by providers, through delivery of suitable audit
template/s to the RCR’s Clinical Radiology Audit Live(www.rcr.ac.uk/AuditLive).
3. Methodology
3.1 All 183 NHS radiology departments were surveyed. A questionnaire was developed
and distributed electronically (see Appendix 2), requesting the local CT lead
radiographer respond to a series of questions and provide data about each installed
diagnostic CT scanner at their NHS institution.
3.2 The survey was promoted through the Society and College of Radiographers’
National Conference for Radiology managers meeting in May 2014. Clearly this
targeted radiology service managers and CT superintendents. In addition, the
survey was promoted through the SCoR Synergy News to all members and an
online link to a survey questionnaire included.
3.3 After initial distribution of the survey, follow-up messages and reminders were sent
before the survey closed to encourage response rates.
3.4 After the survey closed, a non-responders e-survey using an online tool was
undertaken to identify any possible reasons for non-participation. This was directed
at the lead radiologists in each of the institutions that did not participate initially.
3.5 The data generated has been subject to statistical analysis and those results are
embedded within this report.

Page 5 of 25
3.6 117 (64%) NHS organisations from across the UK and Channel Islands responded
to the survey.
4. Data returns
The questionnaire structure enabled responses per CT machine within any NHS radiology
service, the aim being to have a rich dataset by piece of equipment rather than by trust or
service. Analysis of the data has been undertaken supported by the Audit Officer at the RCR.
4.1 Scanner numbers and locations
4.1.1 117 organisations from across the UK and Channel Islands NHS responded to the
survey detailing information about 298 CT scanners. The information provided by
these respondents alone forms the basis of the content of the remainder of this
report.
4.1.2 This represents a response rate of 63.9% by NHS radiology services.
4.1.3 From English respondents, this represents approximately 59% of total CT installed
base.3
4.1.4 Responses by region, shown in Table 1, show participation from all devolved nations.
Table 1. Regional profile of respondents and number of scanners installed
Region London Midlands
and East
of
England
North of
England
South of
England
Scotland Wales Northern
Ireland
Other
(Channel
Isles)
Total
Organisations 19 25 29 17 13 8 4 2 117
Scanners 41 68 78 52 32 15 10 2 298
4.1.5 Scanners range in ages from zero, ie, recently installed, to more than 15 years old.
Ten per cent of scanners in the UK are more than ten years old.
4.1.6 Table 2 shows the number of scanners by age from within the survey respondents
departments.

Page 6 of 25
Table 2. Age of equipment in years and scanner numbers
Age in
years
0 1 2 3 4 5 6 7 8 9
Number
of
scanners
21 27 29 29 39 22 29 31 22 15
Age in
years
10 11 12 13 >15 DK
Number
of
scanners
10 10 6 5 2 1
4.1.7 The mean age of CT equipment is 4.8 years (mode = 4 years, median = 5 years).
This suggests that average equipment age has improved in the last three years since
the NAO survey in 2011. By contrast, a report published by the European
Coordination Committee of the Radiological, Electromedical and Healthcare IT
industry (COCIR) shows the age profile of CT in UK in 2013 to be worse than the
average compared to all European countries.4
4.1.8 Previous data for England only from the National Audit Office shows that:4.
A total of 406 CT scanners were installed across the NHS in England, as of
March 20125
The NAO survey also reported that the average purchase price of a CT scanner
was £579,000, and that the lifespan of a CT scanner was expected to be 7–10
years†
The average age of existing CT equipment at the time of the NAO survey in
2011 was 6.2 years.†
† It is not specified in the NAO survey report whether the average purchase price or age of the CT machine relates to the mean,
median or mode.
4.2 CT equipment purchase method
4.2.1 Of 298 responses, 208 machines were declared to be owned by the NHS
organisations, 30 were leased, 54 obtained as part of a managed equipment
service, see 4.2.3, and there were six “don’t know” responses (see Table 3).

Page 7 of 25
4.2.2 Capital purchase remains the most common funding methodology in the NHS at
present for CT equipment, with two-thirds of CT scanners being owned and
operated by NHS organisations.
4.2.3 The managed equipment service is a contractual model of partnership with a private
sector partner to procure, manage and dispose of medical equipment over an
agreed period, typically ten or 15 years. Some commentators believe that in the
NHS, this can assist in managing maintenance and refreshment of medical
equipment and is designed to offer financial benefits to the institution. Relative costs
of ownership have not been compared within this paper.
Table 3. The funding methodology and numbers of scanners
Owned Leased Managed equipment
service
Don’t know how
funded
208 (70%) 30 (10%) 54 (18%) 6 (2%)
4.2.4 The age profile outlined in Section 4.1 indicates a steady purchase rate of
approximately 30 scanners per year, among responding organisations, which
implies that if purchase plans are completed as planned in the future, that a typical
CT scanner will have an expected clinical use of approximately ten years.
4.3 Replacement planning
4.3.1 Replacement of high-value capital equipment is complex. Typically, NHS trusts
function independently and hence group procurement is not the norm. The use of
NHS Supply Chain has increased significantly over the last four years, with 147 CT
orders being processed through them during this period.
4.3.2 In Scotland, funding is carried out through Health Boards, who determine the needs
for replacement or additional equipment across the country. Procurement in
Scotland is managed by NHS National Procurement.7
4.3.3 Many (62%) NHS organisations have replacement plans in place – some of which
include funds already committed. Where used, managed equipment services also
provide clear timelines for future replacement procurement.
4.3.4 NHS Supply Chain6 can assist with procurement and have agreed framework prices
with the major manufacturers for equipment and optional extras.

Page 8 of 25
4.3.5 With regards to group procurement, there remains the opportunity for collaboration
between organisations, which may further leverage purchasing power between NHS
organisations in the future.
Table 4. Replacement plans by scanner within each region
Region Yes,
replacement
plan in place
No
replacement
plan in place
Respondent
did not
know
If yes &
replacement
is also in
organisation’s
financial
planning
If yes &
replacement
NOT in
organisation’s
financial
planning or
don’t know
Wales 3 5 - 1 2
South of
England
11 6 - 9 2
Scotland 9 3 1 7 2
Northern
Ireland
3 1 - 2 1
North of
England
19 9 1 19 -
Midlands
and East of
England
13 10 2 13 -
London 12 6 1 10 2
Other 2 0 - 2 0
Total 72 40 5 63 9
Number of
scanners
this affects
189 (60%) 112 (36%) 13 (4%) 164 (52%) 25 (8%)
4.3.6 Survey respondents reported that there are no replacement plans in place for 112
scanners potentially, plus 13 don’t knows (40% of scanners).
4.3.7 For a small group of organisations plans for replacements exist, but these are
unfunded or will require a future business case; this affects up to 25 scanners.
4.3.8 There are no current or future planned central funding schemes for high-capital
diagnostic equipment. Most CT scanners are now procured from local institutional
capital funding, which accounts for 70% of scanners detailed in this survey’s
responses.

Page 9 of 25
4.3.9 The survey also sought an indication for when each CT scanner might be replaced
in the future. This mixes those with certain business plans with others less confident,
to profile possible future NHS procurement needs. Figure 1, below, demonstrates
that, where known, the procurement planning suggests a continued steady
procurement rate of about 30 machines per year, from the survey respondent NHS
organisations. There appears from the chart below, to be a decline in replacement in
later years, although this is suspected to be due to less certain planning further into
the future.
Figure 1. Future replacement CT numbers planned by year

Page 10 of 25
4.4 Meeting demand
4.4.1 Both the National Audit Office data of 20112 and more recent data from the
Diagnostic Imaging Data Set1 clearly demonstrate that growth in CT activity
continues apace. Average annual CT growth is 10.3% per annum since 2003.
Overall, the diagnostic imaging modalities growth rate is 3.3%. Only MRI, growing at
an average of 12.0% per annum since 2003, is increasing at a rate faster than CT.
4.4.2 CT use increased in England by 13.0% to 3,780,405 examinations in 2013–14.1
Unusually, this growth outstripped MRI demand during this particular period. Based
on annual mid-year population statistics published by the Office for National
Statistics,9 this equates to 71.3 CT studies per 1,000 population.
4.4.3 Comparing with the most recent Organisation for Economic Cooperation and
Development (OECD) data available,10 CT exams per 1,000 population elsewhere in
the world range from 29.1 (Finland 2012), to 240.2 (USA, 2013). Across a basket of
18 OECD participant countries, mean CT usage rates in 2012 were 125.1 per 1,000
population. UK use is only 57% compared with the other countries.
4.4.4 There are a number of ways of increasing CT capacity, from a growth in the
absolute numbers of pieces of equipment, to different staffing skillsmix and workload
models, through to extending hours of operation both during a five-day week, and
extending to seven-day working as well. The latter is already increasingly
commonplace in the NHS, due to clinical demands and the requirement for 24-hour
rapid availability for emergency CT scanning, such as trauma and stroke
assessment.
4.4.5 To ascertain information about these, the survey asked for information about hours
of routine operation by the scanner and the average patient throughput per day by
scanner (see Figure 2 and Table 5).
4.4.6 The average hours of operation, excluding on-call emergencies = 48.8 hours per
week.
4.4.7 The average number of patients scanned = 32 per day.
4.4.8 The survey did not specifically ask about emergency activity, nor out-of-hours
standby availability.

Page 11 of 25
Figure 2. Weekly hours of operation and frequency
Table 5. Average patient numbers scanned per day and frequency by scanner
Daily throughput Numbers of scanners Percentage of total
<10 patients per day 12 4%
10-19 31 10%
20-29 85 29%
30-39 95 32%
40-49 43 14%
≥ than 50 26 9%
Don’t know or no response 6 2%
Total 298 100%

Page 12 of 25
Figure 3. Average daily throughput by frequency, with additional colour coding for
patients per day
4.4.9 Figure 3 shows that there is a wide variation in throughput, not directly related to
hours of operation. A small proportion of scanners appear to be used much less than
others. This may relate to a particular case-mix, or to patient referral patterns, and so
is a finding which must be viewed with caution.
4.4.10 It should be noted that ‘sweating the CT asset’ through the overuse of CT equipment
will shorten its lifespan by several years, as this is typically measured in tube
rotations.
4.5 Technical issues
4.5.1 Scanner acquisition technology
CT scanners operate by acquiring a volume of imaging data as the scan gantry
rotates. Scanner models are usually classified in terms of number of slices and this
is assumed to give an indication of the scanner’s capability in terms of speed of
coverage. However, for technical reasons, some manufacturers ‘double sample’
each detector row resulting in a doubling of the number of slices, but not doubling of
volume coverage. Therefore, some scanners classified as ‘64-slice’ have half the
volume coverage of other ‘64-slice’ models. In this report, the conventional
classification of scanners by ‘number of slices’ has been adopted. However, users

Page 13 of 25
and prospective purchasers should be aware of the distinction between ‘numbers of
detector rows’ and ‘number of slices’ on a CT scanner.
For complex applications including cardiac CT, ‘higher slice’ technology is required
so that a larger volume is acquired in a shorter scan time. This is, however, not the
rate-limiting factor for overall scanner capacity in terms of patient throughput.
Figure 4. CT scanners by frequency and slice technology
Further technical note - Readers to be advised that some technologies achieve higher slices by
“double-sampling”. The maximum number of detector banks on a CT is currently 160. Both
256- and 320-slice technologies achieve this by double sampling.
4.5.2 CT uses X-rays as the fundamental physical “tool” to enable image creation. X-
radiation exposure for patients undergoing CT is relatively high, and in modern CT
practice, accounts for a significant proportion of the radiation exposure for all
patients.
4.5.3 There are a number of dose reduction methods in practice and the survey asked
about the two most common of these, namely automatic tube current modulation
(ATCM), and iterative reconstruction (IR) capability.
Table 6. Frequency of dose reduction capabilities for CT scanners surveyed
ATCM IR Both Neither No response
110 (37%) 24 (8%) 120 (40%) 36 (12%) 8 (3%)

Page 14 of 25
4.5.4 The working group believe that it is likely that few responders were aware of the
dose reduction terminology used in the questionnaire and may have given incorrect
replies. The great majority of the installed CT base in the UK will have ATCM
technology. Certainly all scanners with IR (which is a fairly recent development) will
also have ATCM capability. Further work would need to be undertaken to show this.
4.5.5 Alongside the technical questions about scanner slice capability and dose reduction
techniques, the survey also sought to ascertain case-mix and specialist applications,
shown in Table 7.
Table 7. Use of CT scanners for specific specialist applications
Used for Yes No Don’t know
Cancer staging 282 (95%) 15 (5%) 1 (0%)
CT angiogram 263 (88%) 33 (11%) 2 (1%)
Lung nodules 223 (75%) 66 (22%) 9 (3%)
CT colonography 197 (66%) 101 (34%) -
Cardiac 98 (33%) 200 (67%) -
5. Discussion of findings
5.1 Participation and scanner numbers
5.1.1 The response rate for this particular survey, given its methodology, is considered to
be very good. This survey method was adopted, as being most likely to be the best
at giving the widest opportunity to participate from services across the NHS.
5.1.2 The follow-up survey to non-responder institutions was directed at radiologist
service leads. The prime reason given for non-participation was lack of awareness
of the survey by the lead radiologist.
5.1.3 There is broad representation in the responses and data generated from across
England and the devolved nations.

Page 15 of 25
5.1.4 Recent OECD data shows the United Kingdom to have the lowest number of CT
scanners related to population, at 8.95 CT scanners/million. (Range 8.95–53.65
(Australia), and mean of 25.53 CT scanners/million.11
5.2 Equipment procurement specification and replacement
5.2.1 The specification of installed CT equipment is high, with only 26% of equipment
being below 64-slice capability.
5.2.2 This may be due to procurement exercises ensuring future proofing of technology
when the rare purchasing opportunities present themselves, or procurement
decisions related to buying current technology.
5.2.3 It is encouraging that replacement plans are in place for more than 50% of CT
scanners and that in the main, the survey respondents believe that the replacement
plan is already funded or funding plans are established. It is more concerning that
for as many as 40% of scanners in use, there is no replacement plan in place. The
median age of scanners at anticipated year of replacement is nine years, inter-
quartile range of four to 14 years.
5.2.4 The European Society of Radiology (ESR) published a statement about renewal of
radiological equipment in 2014.12 It reported that radiological equipment has a
definite lifespan. It recommended replacement of equipment more than ten years
old, citing obsolescence and reduced image quality. Older equipment has higher risk
of breakdown and increased operating costs.
5.2.5 The same ESR publication also gave clear recommendations about life expectancy
of CT scanners based on high, medium and low usage.12
5.2.6 ESR also clearly recommends that every healthcare institution or authority should
have a plan for medical imaging equipment upgrade or replacement, which should
look forward a minimum of five years and be updated annually.
5.2.7 The ESR also strongly promotes the use of up-to-date equipment in the context of
the EuroSafe Imaging Campaign.13
5.2.8 The Canadian Associations of Radiologists (CAR) has also recently published
updated life cycle guidance for medical imaging equipment.14 This indicates the CT
equipment life cycle to be eight years.

Page 16 of 25
5.3 Developing capacity
5.3.1 The utilisation rates of CT in the UK, measured both by hours per week of operation
and by patient throughput per day, are widely variable. The link between hours of
operation and patient throughput is non-linear.
5.3.2 Capacity can be increased significantly by growing equipment use, although this will
be constrained by radiographic and other clinical staffing recruitment and retention
issues. It may also be affected significantly by an individual institution’s approach to
the adoption of skills mix, teamworking,15 complexity of the examination and patient
condition, together with patient referral patterns. Further work is recommended in
sharing best practice in terms of optimising patient throughput.
5.3.3 With the low numbers of scanners per head of population and CT workload growing
at an average of 10% per annum, increased use alone is unlikely to bridge the
capacity gap in the medium term.
5.3.4 With wide variations of usage within regions, opportunities to share capacity could
be explored through radiology networks, although the complexities of patient travel,
data sharing and varied protocols would need to be overcome. The report team is
aware of a few examples of scan-only services being provided between selected
trusts in England to assist with capacity provision at neighbouring institutions.
5.3.5 One of the challenges in any NHS institution when faced with the challenge of
procuring a new or additional (as opposed to replacement) CT scanner to meet
growing demands is finding suitable estate space on a trust site near the existing
radiology facilities. This clearly requires significant forward planning, which needs to
be recognised at an organisational and board level.
5.3.6 Where services are delivered across a wider geographic area, as happens in the
devolved nations, even more challenges over location and patient travelling times
may be faced. A co-ordinated country-wide approach to equipment replacement and
additional capacity planning may be beneficial.
5.4 Horizon scanning and future work
5.4.1 CT technology is mature, and it is unlikely that there will be any major new advances
in the near future. However, technical aids to improve clinical interpretation/reporting
and display continue to emerge. Some interventional procedures, such as biopsy or
tumour ablation, using CT guidance, and new applications, such as cardiac CT are
increasing significantly, and these can reduce throughput on individual machines
due to longer study or procedure times.
Page 17 of 25
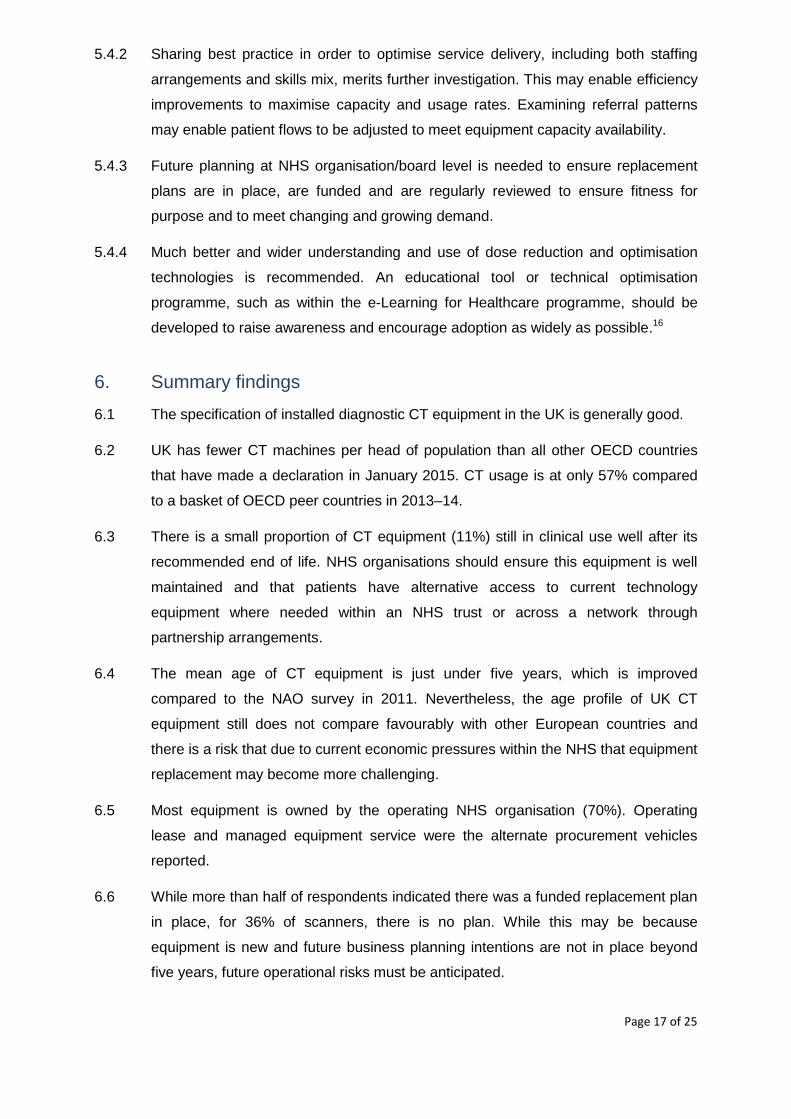
5.4.2 Sharing best practice in order to optimise service delivery, including both staffing
arrangements and skills mix, merits further investigation. This may enable efficiency
improvements to maximise capacity and usage rates. Examining referral patterns
may enable patient flows to be adjusted to meet equipment capacity availability.
5.4.3 Future planning at NHS organisation/board level is needed to ensure replacement
plans are in place, are funded and are regularly reviewed to ensure fitness for
purpose and to meet changing and growing demand.
5.4.4 Much better and wider understanding and use of dose reduction and optimisation
technologies is recommended. An educational tool or technical optimisation
programme, such as within the e-Learning for Healthcare programme, should be
developed to raise awareness and encourage adoption as widely as possible.16
6. Summary findings
6.1 The specification of installed diagnostic CT equipment in the UK is generally good.
6.2 UK has fewer CT machines per head of population than all other OECD countries
that have made a declaration in January 2015. CT usage is at only 57% compared
to a basket of OECD peer countries in 2013–14.
6.3 There is a small proportion of CT equipment (11%) still in clinical use well after its
recommended end of life. NHS organisations should ensure this equipment is well
maintained and that patients have alternative access to current technology
equipment where needed within an NHS trust or across a network through
partnership arrangements.
6.4 The mean age of CT equipment is just under five years, which is improved
compared to the NAO survey in 2011. Nevertheless, the age profile of UK CT
equipment still does not compare favourably with other European countries and
there is a risk that due to current economic pressures within the NHS that equipment
replacement may become more challenging.
6.5 Most equipment is owned by the operating NHS organisation (70%). Operating
lease and managed equipment service were the alternate procurement vehicles
reported.
6.6 While more than half of respondents indicated there was a funded replacement plan
in place, for 36% of scanners, there is no plan. While this may be because
equipment is new and future business planning intentions are not in place beyond
five years, future operational risks must be anticipated.

Page 18 of 25
6.7 The rate of CT activity growth continues at 10% per annum, but was higher in 2013.
Weekly hours of operation and patient throughput varies widely between machines
and organisations. This will demand additional equipment or working longer clinical
hours. Additional staff will be required to support this both to undertake the imaging
and to provide the requisite reporting.
6.8 Understanding of dose reduction technologies appears to be poor, and application
of these important techniques may be incomplete.
6.9 Most scanners are used for a wide range of “specialist” applications from cancer
scanning, through to angiographic and cardiac applications as well as virtual
colonography. Utilisation of CT equipment to acquire cardiac imaging is lowest at
only 33%.
6.10 CT is a mature technology, with developments now acting to refine the display and
assessment of disease processes.
6.11 Readers should note that this report has only considered access to CT equipment
and has not considered the workforce issues related to driving acquisition and
delivering the required reporting of studies, nor the impact of increasing workload for
referrers to receive radiological reports.
7. Recommendations
7.1 The Clinical Imaging Board believes that valuable overview information about CT
services in the NHS has been gathered through this exercise, and that there may be
value repeating this for other high-value diagnostic and therapeutic radiology
equipment.
7.2 The CIB believes there is a need to raise awareness of the low numbers of CT
scanners per million population compared to many other similar countries.
7.3 While many NHS radiology services clearly have future CT replacement plans in
place, it is very concerning that a significant number do not. This requires action by
NHS radiology services and all stakeholders.
7.4 All NHS radiology departments need a future equipment plan, looking forward at
least five years. Professional bodies working together could produce a template or
framework to assist these to be developed.
7.5 Education about dose optimisation and reduction technologies is needed. Formal
programmes to ensure maximum adoption throughout the NHS may be needed and
would help to address public concerns about radiation dosages.

Page 19 of 25
7.6 The CIB notes that, with more than 10% of CT equipment being more than ten years
old and not having dose optimisation capability, this creates inequity for patients and
the Board recommends that this action is taken to address this.
Approved by the Faculty of Clinical Radiology of The Royal College of Radiologists (charity no.
211540): 27 February 2015
Approved by IPEM (charity no. 1047999): 20 April 2015
Approved by SCOR (charity no. 272505): March 2015

Page 20 of 25
8. References
1. NHS England. Diagnostic Imaging Dataset Annual Statistical Release 2013/14.November
2014 (formerly KH12 Report). http://www.england.nhs.uk/statistics/statistical-work-
areas/diagnostic-imaging-dataset/diagnostic-imaging-datasetdiagnostic-imaging-dataset-
2013-14-data/
2. OECD/European Union. Health at a Glance: Europe 2014. Paris: OECD Publishing, 2014.
http://ec.europa.eu/health/reports/european/health_glance_2014_en.htm
3. Department of Health. The NHS Cancer Plan. A plan for investment. A plan for reform. London: DoH, 2000.
4. National Audit Office. Department of Health. Managing high value capital equipment in
the NHS in England. A report by the comptroller and auditor general National Audit
Office, HC822 Session 2010–11. London: The Stationery Office, 2011.
5. NHS England. CT Installed Base (England) as at March 2012. Personal communication.
6. Medical Imaging Equipment – Age profile & density. COCIR Executive Summary Edition.
European Coordination Committee of the Radiological, Electromedical and Healthcare IT
Industry (COCIR) , 2014
7. http://www.nhsscotlandprocurement.scot.nhs.uk/home.aspx
8. http://www.supplychain.nhs.uk/
9. http://www.ons.gov.uk/ons/rel/pop-estimate/population-estimates-for-uk--england-and-
wales--scotland-and-northern-ireland/2013/stb---mid-2013-uk-population-estimates.html
10. OECD (2014). Computed tomography (CT) exams, total. Health: Key Tables from OECD,
No. 49. http://www.oecd-ilibrary.org/social-issues-migration-health/computed-
tomography-ct-exams-total_ct-exams-tot-table-en
11. OECD (2015). CT numbers per million population 2013, OECD: 2015
http://data.oecd.org/healtheqt/computed-tomography-ct-scanners.htm
12. Renewal of radiological equipment. Statement from European Society of Radiology.
Insights Imaging 2014; 5: 543–546.
13. European Society of Radiology: Eurosafe Imaging: http://www.eurosafeimaging.org/
14. Lifecycle guidance for medical imaging equipment in Canada, Canadian Association of
Radiologists, 2013. http://www.car.ca/uploads/standards%20guidelines/CAR-LifecycleGuidance-
MainReport-e_20131127.pdf
15. Team Working in Clinical Imaging. A Joint Document from the Royal College of Radiologists and
College of Radiographers, 2012. www.rcr.ac.uk/docs/radiology/pdf/BFCR (12)9_Team.pdf
16. Committee on Medical Aspects of Radiation in the Environment (COMARE).Sixteenth Report.
Public Health England, 2014. https://gov.uk/government/publications/review-of-radiation-
dose-issues-from-the-use-of-ct-in-the-uk

Page 21 of 25
Appendix 1. Clinical Imaging Board Terms of Reference for Report working party
Purpose
To produce a report for the RCR, SCOR and IPEM on the installed equipment base and operations of
CT services within the NHS in the UK. To establish forward planning intentions of NHS providers to
maintain and develop CT capacity in line with demand, including equipment replacement or increased
provision; a collective review of those plans will be incorporated into the report.
The working party is to provide an overview of current services, and provide guidance to provider organizations on the importance of maintaining and updating existing CT equipment as well as considering increasing capacity to ensure services will continue to meet the needs of patients and referrers, whilst balancing radiation dose, image acquisition and capital and revenue costs optimally.
The working party is to establish current data in a number of key areas for NHS CT equipment and services:
Scanner numbers
Scanner ages
Scanner specification
Service operational hours for each scanner, and rationale for this
Applications and case mix
Anticipated replacement plans
Horizon scan for key areas of future service development, applications and possible technology developments
The working party is to develop an understanding of provider organisations’ anticipated plans for acquiring repalcement and additional CT equipment to meet volume demand and developing applications; the possible impact on the replacement and maintenance cycles of, for example, extending operational hours.
This work will also build on the work of the National Audit Office in England in 2011 (http://www.nao.org.uk/report/managing-high-value-capital-equipment-in-the-nhs-in-england/) and reflect on the changes since that report, particularly from the perspective of the professions involved in delivery of CT services.
Services delivered in the independent sector are considered beyond scope, and only diagnostic CT services will be evaluated. Radiotherapy planning CT and PET-CT are also beyond scope.
Objectives
This small, expert, tri-partite group will:
develop and agree with the Clinical Imaging Board the detailed scope for the above work
set out the necesary methodology
carry out the work
produce a final report for publication by the three organisations.
Specific tasks The Working Party is to convene an initial meeting at the RCR. Subsequent work will be via teleconference or email. A final meeting at the RCR may be required. Administrative support to be provided by Kim Cyrus (CR Executive Officer at the RCR). It may be necessary during the development of this publication for the Chair of the working group to
co-opt/appoint additional members as the group’s work evolves. These may include representatives of
other professional groups with whom the Clinical Radiology specialty works in close association – for
example, radiographers, medical physicists, medical oncologists, clinical nurse specialists.

Page 22 of 25
Nominations from the relevant professional body will need to be sought at this stage. If the working
party are of the opinion that the document should become a joint document with another professional
body, this would require formal ratification through CR Officers, with notification to the CR Professional
Support and Standards Board.
The lead author should consider submitting an audit template, (if appropriate to the standard they
have authored) to CR AuditLive either before or soon after the publication of the standard.
Membership The Working Party membership will include:
Nicholas Spencer, Clinical Radiologist
Maria Lewis, Physicist
Paula Cunningham Lally, CT Radiographer
Pam Black, Ex Officio SCOR President
Product The new guidance will be produced by the RCR, IPEM and the SCOR, and will be the property of, the “RCR, IPEM and the SCOR”. The guidance will be available in electronic format and available on the RCR, IPEM and SCOR websites. Costs
Any meeting expenses and travel costs will be met by the RCR (Faculty of Radiology), IPEM (Institute
of Physics and Engineering in Medicine) and the SCOR (Society and College of Radiographers)
respectively for each member. All direct costs (for example, editorial and/or design costs) related to
the production of the guidance will be met by the RCR, IPEM and SCOR equally.
Proposed circulation
The guidance will be published on the RCR, IPEM and SCOR website(s). Members and Fellows will
be notified when the publication becomes available.
Copyright
The guidance will be published under the copyright of the RCR, IPEM and SCOR in all media now
known or in future existing.
Timescale
The work is expected to be presented in summary form to RCR and CIB by September 2014. Once
the draft output is approved, final report will be completed by November 2014.

Page 23 of 25
Appendix 2: CT Equipment Survey Questionnaire
CT Equipment Survey RCR/SCoR/IPEM Clinical Imaging Board
Notes:
1. Drop-down lists appear in some cells when the cells are selected. Click the arrow to the right of a selected cell to display the drop-down list.
2. Take care if copying and pasting or using the fill handle as these shortcuts overwrite rules that prevent invalid data being entered. If a cell contains a drop-down list, invalid data is anything you type in the cell that is not an item in the drop-down list. If invalid data are entered, the results for your department may be incorrect.
3. You may wish to contact your Medical Physics department for responses to Q7f. Examples of automatic tube current modulation (ATCM) are AutomA/SmartmA, CAREDose, DoseRight, SureExposure. Examples of iterative reconstruction (IR) software are ASIR/Veo, iDose/IMR, IRIS/SAFIRE, AIDR.
4. Check you have entered the data correctly before submitting them.
5. Please email completed questionnaire to [email protected] by 30th June 2014.
Thank you for participating in this survey.
Q1. Home nation/ NHS region
Q2a. NHS Trust/ Health Board
Q2b. If 'other', please specify
Q3a. Hospital (Scotland, Wales, Northern Ireland only)
Q3b. If 'other', please specify
Q4. Email address in case of query
Q5. How many CT scanners in your Trust (Eng)/ hospital (Scot, Wal, NI)?

Page 24 of 25
Scanner 1 Scanner 2
Scanner 3
Scanner 4
Scanner 5
Scanner 6
Q6a. Locally allocated name (e.g. A&E CT1)/ Reference no.
Q6b. Manufacturer
Q6c. Model
Q6d. No. of slices
Q6e. Age of scanner (years)
Q6f. What year do you anticipate replacing this scanner?
Q6g. How many hours does this machine operate in a typical week?
Q6h. Average daily patient throughput on this machine
Q6i. Is this machine:
Q6j. Is this machine:
Is the scanner used for the following:
Q7a. CT colonography
Q7b. Cardiac CT
Q7c. Cancer staging
Q7d. CT angiography
Q7e. Lung nodule monitoring
7f. Does the scanner have the following dose optimisation features:

Page 25 of 25
Q8a. Does your trust/ hospital have a regular plan to replace high value capital equipment?
Q8b. If 'yes', does this include replacements for these machines?
Q8c. If 'no' to Q8a, will your radiology department have to build a successful business case to progress
replacements?
Q9. Text box for clarification