ct measurements of two-phase flow in fractured porous media supri
TRANSCRIPT

CT MEASUREMENTS OF TWO-PHASE FLOW
IN FRACTURED POROUS MEDIA
SUPRI TR{104
By
Richard G. Hughes, William E. Brigham,
and Louis M. Castanier
June 1997
Performed Under Contract No. DE{FG22{96BC14994
Stanford University
Stanford, California

Contents
Tables iv
Figures v
Acknowledgments vi
Abstract vii
1 Introduction 1
2 Literature Review 5
2.1 Graham and Richardson (1950) : : : : : : : : : : : : : : : : : : 5
2.2 Mattax and Kyte (1962) : : : : : : : : : : : : : : : : : : : : : : 6
2.3 Parsons and Chaney (1966) : : : : : : : : : : : : : : : : : : : : 9
2.4 Kyte (1970) : : : : : : : : : : : : : : : : : : : : : : : : : : : : : : 11
2.5 I�y et al (1972) : : : : : : : : : : : : : : : : : : : : : : : : : : : : 11
2.6 Kleppe and Morse (1974) : : : : : : : : : : : : : : : : : : : : : : 13
2.7 Lefebvre du Prey (1978) : : : : : : : : : : : : : : : : : : : : : : 14
2.8 Kazemi and Merrill (1979) : : : : : : : : : : : : : : : : : : : : : 15
2.9 Horie et al (1988) : : : : : : : : : : : : : : : : : : : : : : : : : : : 16
2.10 Firoozabadi and Hauge (1990) : : : : : : : : : : : : : : : : : : : 18
2.11 Labastie (1990) : : : : : : : : : : : : : : : : : : : : : : : : : : : : 18
2.12 Firoozabadi and Markeset (1992a, 1992b) : : : : : : : : : : : 19
2.13 Babadagli and Ershaghi (1992) : : : : : : : : : : : : : : : : : : 21
ii

2.14 Summary : : : : : : : : : : : : : : : : : : : : : : : : : : : : : : : : 22
3 Core Holder and Flow Equipment Construction 23
3.1 Core Holder : : : : : : : : : : : : : : : : : : : : : : : : : : : : : : 23
3.2 Flow System : : : : : : : : : : : : : : : : : : : : : : : : : : : : : : 26
3.2.1 Injection System : : : : : : : : : : : : : : : : : : : : : : : 26
3.2.2 Distribution System : : : : : : : : : : : : : : : : : : : : 28
3.2.3 Production Measurement System : : : : : : : : : : : : 28
3.2.4 Pressure Measurement System : : : : : : : : : : : : : : 29
3.2.5 Data Collection System : : : : : : : : : : : : : : : : : : 30
3.2.6 Saturation Measurement System : : : : : : : : : : : : 30
4 Experimental Results 32
4.1 Water Imbibition into a Dry Fractured Core : : : : : : : : : : 32
5 Discussion and Recommendations 42
A Epoxy Speci�cations 45
B List of Equipment 47
C Graphic Files 50
Nomenclature 52
Bibliography 54
iii

List of Tables
3.1 Scanner settings. : : : : : : : : : : : : : : : : : : : : : : : : : : 31
iv

List of Figures
3.1 The Core Holder. : : : : : : : : : : : : : : : : : : : : : : : : : : 24
3.2 Core Holder After Curing. : : : : : : : : : : : : : : : : : : : : : 26
3.3 Experimental Flow Schematic. : : : : : : : : : : : : : : : : : : : 27
3.4 Production Measurement System. : : : : : : : : : : : : : : : : 29
4.1 CT Scan Locations. : : : : : : : : : : : : : : : : : : : : : : : : : 33
4.2 CT Scans at Early Times. Darker Shades Indicate Higher
Water Saturation. : : : : : : : : : : : : : : : : : : : : : : : : : : 34
4.3 CT Scan at a.)+40 mm and b.)+60 mm From Inlet End at
0.09 PV Injected. Lighter Shades Indicate Higher Water
Saturation. : : : : : : : : : : : : : : : : : : : : : : : : : : : : : : : 35
4.4 CT Scans as Experiment Progresses. Darker Shades Indi-
cate Higher Water Saturation. : : : : : : : : : : : : : : : : : : : 36
4.5 CT Scans at Water Breakthrough and Beyond. Darker
Shades Indicate Higher Water Saturation. : : : : : : : : : : : 37
4.6 CT Scan at +260 mm From Inlet End at Breakthrough.
Lighter Shades Indicate Higher Water Saturation. : : : : : : 38
4.7 CT Scans Showing Fluid Movement Over 3 Months. Darker
Shades Indicate Higher Water Saturation. : : : : : : : : : : : 39
4.8 CT Scans at +170 mm From Inlet End a.) at End of Dis-
placement and b.) After 3 Month Wait. Lighter Shades
Indicate Higher Water Saturation. : : : : : : : : : : : : : : : : 40
4.9 CT Scans at +170 mm From Inlet End Through Time.
Lighter Shades Indicate Higher Water Saturation. : : : : : : 41
v

Acknowledgments
Financial support during the course of this work was provided by the De-
partment of Energy through the Stanford University Petroleum Research
Institute, under Contract No. DE-FG-22-93BC14899, and the SUPRI-A
Industrial A�liates.
vi

Abstract
The simulation of ow in naturally fractured reservoirs commonly di-
vides the reservoir into two continua { the matrix system and the fracture
system. Flow equations are written presuming that the primary ow be-
tween grid blocks occurs through the fracture system and that the primary
uid storage is in the matrix system. The dual porosity formulation of
the equations assumes that there is no ow between matrix blocks while
the dual permeability formulation allows uid movement between matrix
blocks. Since most of the uid storage is contained in the matrix, recovery
is dominated by the transfer of uid from the matrix to the high conduc-
tivity fractures. The physical mechanisms in uencing this transfer have
been evaluated primarily through numerical studies. Relatively few exper-
imental studies have investigated the transfer mechanisms. Early studies
focused on the prediction of reservoir recoveries from the results of scaled
experiments on single reservoir blocks. Recent experiments have inves-
tigated some of the mechanisms that are dominant in gravity drainage
situations and in small block imbibition displacements. The mechanisms
active in multiphase ow in fractured media need to be further illuminated,
since some of the experimental results appear to be contradictory.
This report describes the design, construction, and preliminary results
of an experiment that studies imbibition displacement in two fracture
blocks. Multiphase (oil/water) displacements will be conducted at the
same rate on three core con�gurations. The con�gurations are a compact
core, a two-block system with a 1 mm spacer between the blocks, and
vii

a two-block system with no spacer. The blocks are sealed in epoxy so
that saturation measurements can be made throughout the displacement
experiments using a Computed Tomography (CT) scanner.
Preliminary results are presented from a water/air experiment. These
results suggest that it is incorrect to assume negligible capillary continuity
between matrix blocks as is often done.
viii

Section 1
Introduction
One of the more di�cult problems in petroleum, geothermal and environmental en-
gineering is modeling the ow of uids through naturally fractured porous media.
Typically, for computational purposes, fractured media are broken into two continua.
The matrix is considered to be that part of the medium which contains the majority
of the solid rock. This portion is assumed to have most of the uid storage capacity
of the system, but little conductivity. The fractures are considered to be an inter-
connected network of high conductivity channels. The fractures are assumed to have
negligible storage capacity.
In a dual porosity formulation of the problem, transport between matrix blocks is
not allowed. The system of fractures is rapidly drained due to the high conductivity.
Transfer of the matrix uid to the fracture system is through the pressure di�erence
between the systems in the area around each matrix block.
A dual permeability formulation of the fractured ow problem allows the transfer
of uids from one matrix block to another as well as the transfer from matrix blocks
to the fracture system. The �nite di�erence form of the dual permeability formulation
is given by Kazemi, (1990):
Fracture Equation:
� [Tpf (�ppf � pf�Df )]� �pmf + qpf =V
�t�t
�S
B
!pf
(1.1)
1

SECTION 1. INTRODUCTION 2
Where:
Tpf = the transmissibility of phase p in the fracture system
�ppf = the change in the phase pressure between grid blocks in the
fracture system for phase p
pf = the density of phase p in the fracture system
�Df = the change in the depth between grid blocks in the fracture system
�pmf = the matrix{fracture transfer function for phase p
qpf = source term for phase p in the fracture system
V = the grid block volume
�t = the time step size for the simulation
�t
��S
B
�pf= the change over the time step of the porosity, phase saturation,
and formation volume factor of phase p for the fracture system
Matrix Equation:
� [Tpm (�ppm � pm�Dm)] + �pmf + qpm =V
�t�t
�S
B
!pm
(1.2)
All terms are as de�ned in the fracture equations with the subscript \m" signifying a
matrix property, replacing the subscript \f" which signi�es a fracture property. The
transmissibility terms are given by:
Tpf =A�
Lkf
kr
�B
!pf
(1.3)
Tpm =A�
Lkm
kr
�B
!pm
(1.4)
Where the new term de�nitions are:

SECTION 1. INTRODUCTION 3
A = the grid block area in the direction of ow
L = the grid block length in the direction of ow
kf = the grid block permeability of the fracture system
km = the grid block permeability of the matrix system
kr = the grid block relative permeability of phase p
� = the viscosity of phase p
The matrix-fracture interaction is modeled as a source function given by:
�p = �V km
kr
�B
!pmf
[ppf � ppm � p (Df �Dm)] (1.5)
Where � is the shape factor and has dimensions of 1/L2, V is the grid block volume
and Df and Dm are the fracture and matrix depths.
Note that for the dual porosity formulation of these equations, the Tpm term is set
to 0 and, for grid blocks with no source terms, the matrix-fracture transfer function
in the matrix equation simpli�es to:
�p =V
�t�t
�S
B
!pm
(1.6)
The objective of this study is to obtain additional data on the physical mechanisms
that e�ect the ow of uids in these dual systems. The motivation to collect this
information lies in the uncertainty associated with many of the primary variables
both in the transfer function and in the general equations. As will be shown in
Section 2, much of the early work on dual systems assumed that the fracture capillary
pressure was negligible and that fracture relative permeability was equal to the phase
saturation. Recent research on these systems has concentrated on modifying the
matrix-fracture transfer functions to better account for the capillary, viscous, and
gravitational forces present in real fractured media. Much of this work has been
numerical matching of the sparse experimental data that exists in the literature,

SECTION 1. INTRODUCTION 4
however, there is a dilemma. Many of the experimental researchers have commented
that some of their results are either contradictory to, or di�cult to explain with
existing theory. Part of the problem lies in the lack of information on how the uids
are moving in the experiments.
By contrast, the work reported here tracks the movement of the phases with a
Computed Tomographic (CT) scanner. It can also include detailed rate and pressure
measurements throughout the experiment. The experimental setup is detailed in Sec-
tion 3. As this is the �rst stage in the development of this experimental process, only
preliminary experimental results are presented in Section 4. Finally, some discussion
of the results and recommendations for further work in this area are presented in
Section 5.

Section 2
Literature Review
Knowledge advancement in the area of two-phase ow in fractured porous media
has largely been done through numerical simulation studies. Numerical researchers
perform �ne grid simulations to determine the relative e�ects of various parameters
to come up with better ways to represent the physical ow processes in dual porosity
simulators. Usually these studies have returned to the sparse experimental data in
the literature to verify their models. This section will review the references most
commonly cited as well as some of the other experimental work done in support of
the dual porosity/dual permeability formulation of fractured systems. This discussion
concentrates on answering the questions \what was done" and \what results were
presented" (as opposed to \what did the authors conclude").
2.1 Graham and Richardson (1950)
Graham and Richardson (1950) used a single block of fused quartz in their exper-
iments. The block was in the shape of a right isosceles triangle. The sides with
equal length were 1 foot long and 1.5 inches thick. Permeability of the block was 27
Darcies and porosity was 45%. The block was sealed with plastic coating except on
the two equal length sides which represented the fracture faces. Stainless steel bars
were �tted to the fracture faces and positioning screws allowed the bars to simulate
fracture widths from 0 to 0.05 inches. Fluid entry and exit ports were located in the
5

SECTION 2. LITERATURE REVIEW 6
space between the stainless steel bars and the fracture faces adjacent to the two ends
of the long side of the triangle. Distilled water and kerosene were the uids used in
the experiments. Pressure drop across the experiment and oil and water production
were measured for various con�gurations of fracture width and water injection rates.
The experiments were terminated when oil production had \almost ceased." Then
ooding was stopped, the fracture was closed and the model was weighed. Injection
rates reported were from 1.15 cm3/sec to 6.31 cm3/sec.
Reported results were graphs of water-oil ratio (WOR) versus (vs) water saturation
(Sw) for a constant fracture size at various injection rates and WOR vs Sw for a
constant injection rate at various fracture widths. The authors also used scaling
procedures to determine reservoir-scale production estimates from their experiments.
They provided graphs of oil rate vs injection rate and WOR vs Sw for these estimates.
These researchers found that oil production from their model was rate sensitive
(higher injection rates required more water to recover a given amount of oil). They
also found that increasing the fracture/matrix permeability ratio by increasing the
fracture width caused an increase in the amount of water required to recover oil from
the block; however, this increase was less than proportional to the increase in fracture
width.
2.2 Mattax and Kyte (1962)
Mattax and Kyte (1962) derived a scaling law to allow the use of imbibition tests
performed on small reservoir core samples to predict �eld performance during imbibi-
tion dominated water oods. To verify their derivation, the authors performed several
experiments.
Linear experiments were performed where cylindrical alundum samples of various
lengths and permeabilities were encased in plastic with a single, at face left open.
The samples were saturated with oil, and then immersed in water, allowing water to
imbibe into the sample through the open face. Three dimensional (3D) experiments
were also conducted. Cylindrical Weiler sandstone cores of various sizes were used
for these experiments. The cores were saturated with oil and then immersed in water
SECTION 2. LITERATURE REVIEW 7
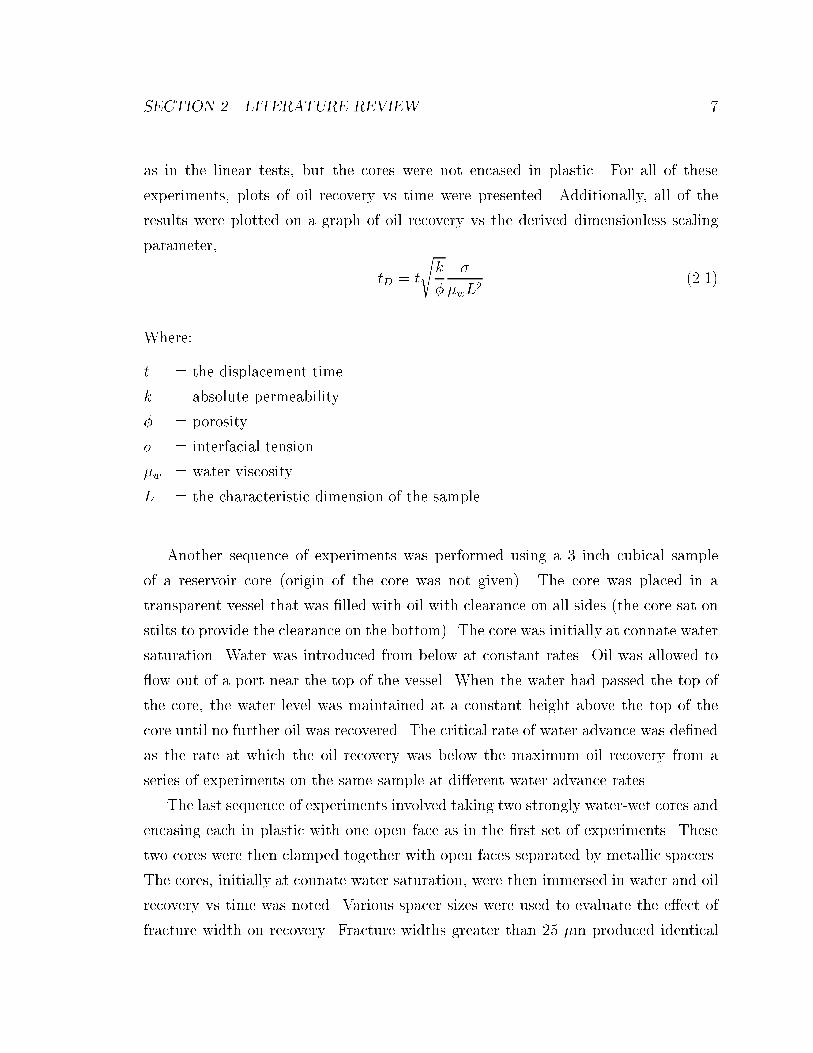
as in the linear tests, but the cores were not encased in plastic. For all of these
experiments, plots of oil recovery vs time were presented. Additionally, all of the
results were plotted on a graph of oil recovery vs the derived dimensionless scaling
parameter,
tD = t
sk
�
�
�wL2(2.1)
Where:
t = the displacement time
k = absolute permeability
� = porosity
� = interfacial tension
�w = water viscosity
L = the characteristic dimension of the sample
Another sequence of experiments was performed using a 3 inch cubical sample
of a reservoir core (origin of the core was not given). The core was placed in a
transparent vessel that was �lled with oil with clearance on all sides (the core sat on
stilts to provide the clearance on the bottom). The core was initially at connate water
saturation. Water was introduced from below at constant rates. Oil was allowed to
ow out of a port near the top of the vessel. When the water had passed the top of
the core, the water level was maintained at a constant height above the top of the
core until no further oil was recovered. The critical rate of water advance was de�ned
as the rate at which the oil recovery was below the maximum oil recovery from a
series of experiments on the same sample at di�erent water advance rates.
The last sequence of experiments involved taking two strongly water-wet cores and
encasing each in plastic with one open face as in the �rst set of experiments. These
two cores were then clamped together with open faces separated by metallic spacers.
The cores, initially at connate water saturation, were then immersed in water and oil
recovery vs time was noted. Various spacer sizes were used to evaluate the e�ect of
fracture width on recovery. Fracture widths greater than 25 �m produced identical

SECTION 2. LITERATURE REVIEW 8
recovery curves. An experiment conducted with a spacer size of 10 �m provided the
same cumulative recovery but the rate of the recovery was much slower.
Scaling of this experimental data has been done by other authors. Using a form
proposed by Aronofsky et al (1958), De Swaan (1978) presented a comparison between
the data from one of the 3D immersion experiments and the equation:
r = R�1� e��t
�(2.2)
Where:
r = the recovery at time, t
R = the limit toward which recovery converges
� = a constant giving the rate of convergence to R
The lambda value that was found to match the data was 2:7.
Kazemi et al (1992) were able to scale the data for all of the experiments without
spacers into the form:
r = R�1� e��DtD
�(2.3)
The tD and �D terms are given by the following expressions:
tD =
"sk
�
�Fs
�w
!#� t (2.4)
�D =
24s�
k
��w
�Fs
�35 � � (2.5)
Fs is the matrix block shape factor and was de�ned as:
Fs =1
Vma
�
Xs
Ama
dma
(2.6)

SECTION 2. LITERATURE REVIEW 9
Where:
Vma = the volume of the matrix block
Ama = the area of a surface open to ow in a given ow direction
dma = the distance from the open surface to the center of the matrix block
The sum is taken over all the open surfaces of the matrix blocks.
No mention is made in either of these scaling studies of the experimental data with
the spacers, although Kazemi et al (1992) suggest that in Eq. 2.2, � is a constant
that is equal to the reciprocal of the time required to recover 63% of the recoverable
oil. This scaling does seem to hold for the experiments with spacers.
2.3 Parsons and Chaney (1966)
Parsons and Chaney (1966) used outcrop and subsurface samples of the Madison
formation in Wyoming for their experiments. These carbonate samples were made
water wet either by heat treatment or by solvent cleaning. It was noted that heat
treating produced stronger imbibition characteristics than solvent cleaning. The oil
phase was a white mineral oil and distilled water was the displacing uid. Two types
of experiments were conducted. The �rst was an immersion experiment where an oil
saturated sample was submerged in a water bath. Submerged weight was recorded vs
time. Blocks measuring 2 � 2 � 1 inch were tested initially. These blocks were then
split into four 1 � 1 � 1 inch cubes and retested. Pore volumes of oil recovered vs the
Mattax and Kyte (1962) dimensionless scaling parameter (Eq. 2.1) were presented.
The plots for each of the tests did not overlay one another. The authors suggest
that this was due to the heterogeneity of the rock. This suggestion could have been
evaluated by summing the results of the small block experiments and dividing by the
number of blocks, but was not reported.
The second type of experiment used either 1 � 1 � 12 inch or 4 � 4 � 12 inch
blocks of the rock samples. In these experiments, an oil saturated sample was placed

SECTION 2. LITERATURE REVIEW 10
into a Plexiglas cell that was inside a constant temperature cabinet. The cell for
the one inch sample had a 1/8 inch clearance between the cell and the rock, and
the cell for the four inch samples had a 1/4 inch clearance between the cell and the
rock. The space between the cell and the sample was �lled with oil. A constant
water head inlet tube was connected to the bottom of the cell. The outlet at the top
of the cell was connected by tubing to a collection beaker that was also inside the
constant temperature cabinet. The height of the outlet tubing could be adjusted by
a motorized pulley system connected to the collection beaker.
The experiments began by adjusting the height of the outlet tubing such that water
was allowed into the Plexiglas cell to a level just below the bottom of the rock sample.
The oil-water interface inside the cell was then allowed to rise at a predetermined rate
by lowering the outlet tubing. The height of the oil-water interface, the volume of oil
displaced and the height of the outlet tubing were noted as functions of time.
In some of the experiments a zone of discoloration advanced ahead of the oil-water
interface. The authors felt that this discoloration zone was due to water imbibing
ahead of the oil-water interface. When this zone occurred, its height was also noted.
The experiments terminated after the oil-water interface passed the top of the sample
and after oil production had stopped.
Graphs were presented on the heights of the oil-water interface vs elapsed time
and the heights of the oil-water interface vs oil recovery. The data suggest that
higher rates of rise in the oil-water interface produce lower recovery rates. Part of the
di�culty in interpreting the results of these experiments is that the reported rates
of rise were measured late in the experiment. The confusion lies in the fact that on
one of the graphs of height vs time, the highest of the reported rates of rise takes the
second longest time to reach the top of the cell.
In these experiments, it was also noted that the size and shape of the zone of
discoloration varied greatly. In some experiments the zone was uniform and piston-
like, while in others the zone was highly irregular.

SECTION 2. LITERATURE REVIEW 11
2.4 Kyte (1970)
Kyte (1970) noted that in cases where gravity segregation is as important as imbi-
bition, experiments performed in a centrifuge can be used to predict recoveries. The
procedure that was suggested was to obtain a preserved core and cut a sample from
the core to simulate the reservoir matrix block geometry. The sample should then be
saturated with oil and connate water. The sample can then be placed into a centrifuge
cup containing the displacement water, and centrifuge experiments can be conducted
at speeds which are derived through scaling arguments.
Cylindrical cores 1.88 cm diameter � 4.9 cm length and 3.76 cm diameter � 9.8
cm length were used for these experiments (origin of the cores was not given). The
results of the experiments were scaled to a reservoir whose matrix blocks were 69.8 cm
diameter � 1.82 m in length. The scaled results, with experimental scatter, agreed
with the theory the author derived. He also scaled some immersion experiments
and showed that recoveries, with gravity considered, were considerably higher than
recoveries for imbibition alone.
2.5 I�y et al (1972)
I�y et al (1972) performed experiments on a variety of reservoir samples from an
unnamed ELF �eld. Some of the samples were consolidated cores but most were
unconsolidated. The samples were described as a clayey silt with porosities ranging
from 10 to 35%, and with permeabilities ranging from 30 to 2000 md. Each sample
had a di�erent mix of primary constituents: carbonate, clay, and silica. The samples
were placed in a tube apparatus which allowed a variety of inlet and outlet boundary
conditions to be tested.
The boundary conditions tested were water at constant potential above and below
the sample (Type A tests), water on the bottom surface of the sample with a no ow
boundary on the top surface of the sample (Type B tests), water on the top surface
of the sample with a no ow boundary on the bottom surface of the sample (Type C
tests), water on the top surface of the sample with oil on the bottom surface of the

SECTION 2. LITERATURE REVIEW 12
sample (Type D tests), and water on the bottom surface of the sample with oil on
the top surface of the sample (Type E tests). Type E tests proved to be the most
favorable con�guration for recovery of oil from the system, while Type B tests proved
to be the most unfavorable con�guration.
Reservoir oil, reservoir water, and sea water from near the �eld were used for
most of the experiments, since it was found that using substitute uids caused results
that were signi�cantly di�erent from what would be predicted from scaling laws. The
authors attributed this discrepancy to smaller interfacial tension decline rates with
�eld uids compared to rates with substitute uids. This was a qualitative observation
found by mixing the uids in a closed tester. Phase segregation occurred faster in the
actual uids than in the arti�cial uids. Once the phases were segregated, surface
tension of the water phase was measured. The surface tensions of the �eld waters
were greater than the surface tensions of the arti�cial waters.
Experimental results were presented as normalized recovery (Np/N) vs reduced
time. This reduced time was de�ned as:
�t = t �� cos �
�oh2
sk
�(2.7)
Where:
t = the displacement time
k = absolute permeability
� = porosity
� = interfacial tension
�o = oil viscosity
h = sample thickness
� = the oil/water contact angle
Note the similarity to Eq. 2.1. Since the characteristic dimension for these experi-
ments is h, the two equations di�er only in the viscosity term and in the treatment
of the contact angle.

SECTION 2. LITERATURE REVIEW 13
Three of the experimental results were matched with a simulator. One experiment
required an adjustment to the upper portion of the capillary pressure curve to match.
The other two experiments required an increase in the curvature of the oil relative
permeability curve in addition to the capillary pressure curve adjustment to obtain a
match. One of the tests had a graph of saturations measured by gammagraphy and
one sample had saturations reported that were determined by solvent extraction.
Three primary conclusions from this work were: lithology matters in predicting
recovery from fractured media (samples with high carbonate content showed lower
recoveries), using substitute uids can result in erroneous predictions of recovery,
and contaminated uids or poorly chosen chemical treatments for �eld uids can
have an adverse e�ect on recovery. Additionally, this research showed that boundary
conditions for the blocks must be considered. When gravity forces are aligned to aid
imbibition, recoveries can be greatly increased.
2.6 Kleppe and Morse (1974)
In support of the construction of a numerical model for simulating ow in fractured
systems, Kleppe and Morse (1974) performed ow experiments similar to those by
Mattax and Kyte (1962). A four foot long, four inch diameter, cylindrical Berea
sandstone core was placed in a Plexiglas tube with a 2.5 mm annular space between
the core and the tube. Narrow strips of conductive paint were applied directly to the
core to measure saturations through resistivity measurements. Brine and kerosene
were the uids used in the experiments. The core was evacuated, saturated with
brine, ooded with kerosene until the oil-water ratio (OWR) exceeded 100, and placed
in the Plexiglas tube �lled with kerosene. Brine was injected into a port at the
bottom of the tube and displaced uid was allowed to leave through a port, open to
the atmosphere, at the top of the tube. Cumulative oil and water production and
height of the oil/water interface were recorded as functions of time. The experiments
terminated when the WOR exceeded 30.
The authors found that, at low injection rates, the displacement of oil from the
core was \almost piston-like." Essentially no oil was produced after the water level

SECTION 2. LITERATURE REVIEW 14
was at the top of the core. At high rates, water breaks through earlier, but oil
production continues after the interface has reached the outlet. The de�nition of low
and high rates was not given in the paper, but Beckner (1990) says that the low rate
reported in this work was 3.3 cm3/min, while the high rate was 35 cm3/min.
2.7 Lefebvre du Prey (1978)
Two types of experiments were conducted by Lefebvre du Prey (1978). The �rst was
the imbibition displacement of oil by water in the presence of additional gravitational
forces exerted by the use of a centrifuge much like the experiments by Kyte (1970).
Various block dimensions were used to test scaling rules. Fountainebleau sandstone
was the rock used, uid phases were distilled water and a 50-50 mixture of Bayol 50
para�n oil and aromatic free kerosene.
Results were presented as recovery plots vs a dimensionless time. The dimen-
sionless time was either scaled with respect to capillarity or with respect to gravity.
These scaling arguments were de�ned by the author as:
Capillary Scaling
tDc = t �Pct � (ko)max
h2 � � ��S � �o(2.8)
Gravity Scaling
tDg = t ��� � g � (ko)max
h � � ��S � �o(2.9)
Where:
(ko)max = maximum e�ective permeability to oil
�S = change in saturation
Pct = displacement pressure at the time of the �rst oil recovery
�� = density di�erence
g = acceleration of gravity

SECTION 2. LITERATURE REVIEW 15
Scaled recovery curves were also presented. These scaled curves were for an as-
sumed set of reservoir scale block parameters. Permeability, porosity, initial satu-
ration, and \displacement pressure at the time of the �rst oil recovery" (Pct) were
de�ned as constants for the reservoir scale blocks, and the reservoir scale block height
was calculated from the gravitational forces placed on the experimental block in the
centrifuge. The author concludes from these experiments that scaling small sam-
ple recovery data to predict reservoir recoveries warrants further study, due to the
deviation of his results from theory.
The second type of experiment performed used parallelepiped Fountainebleau
sandstone blocks that were sealed on all but one large face. The open face was
placed opposite a glass plate that was attached to the block to serve as the fracture
(no mention is made as to how the plate was attached to the block nor the width
of the opening that was created between the plate and the open block face). The
blocks were initially saturated with oil (a variety of oil phases were used). Water was
then injected into the bottom of the fracture with out ow at the top of the fracture.
Fluid ow in the fracture was observed visually and several of the experiments had
saturation measurements made by gamma-ray absorption.
The author presented one �gure that attempted to show the seemingly random
manner with which oil evolved from the blocks. An additional �gure showed several
saturation maps from gamma-ray absorption of one of the experiments. When in-
jection rates were small, the author reported that water entered the lower portion of
the block, moved to the center of the block and then migrated in all directions. At
high rates, the water reportedly entered the block in a front across the surface of the
fracture. The water slowly advanced laterally into the block.
2.8 Kazemi and Merrill (1979)
The work by Kazemi and Merrill (1979) was performed on Berea sandstone cores.
Both cylindrical cores and rectangular block cores were used in the experiments.
The cylindrical cores were one inch in diameter and three inches in length. The
rectangular blocks were either four inches tall, two inches wide, and four inches in

SECTION 2. LITERATURE REVIEW 16
length or the blocks were two inches tall, two inches wide, and four inches in length.
One experiment was conducted on an unfractured, cylindrical core. The rest of the
experiments were conducted on cores that were cut in half, lengthwise and glued back
together with epoxy with no spacers between the halves.
For the fractured systems, injection and production were constrained to the frac-
tures. For the cylindrical cores, this was accomplished by the construction of a rubber
end piece with a hole cut in the center. For the rectangular blocks, a piece of tubing
had a channel cut on one side. A piece of this tubing was then glued with epoxy
to each end face at the fracture. The remainder of the block was then sealed with
epoxy. The injection line was connected to the tubing with the channel. A similar
connection was made to the production end. The only mention made of the uid
distribution system for the unfractured core was that a Hassler core holder was used.
A 2000 ppm NaCl solution was the aqueous phase used and either diesel fuel
or n-decane was used as the oil phase. In all but one test, the cores were initially
saturated with the oil phase and brine was injected at various rates. That one test
had an initial brine saturation of 43%.
Results of these experiments were presented through graphs of pore volume (PV)
oil recovered vs PV water injected and water-oil ratio vs PV water injected. Low rate
(� 1 cm3/hr) injection performed in an expected manner. When rates were increased
to around 6 cm3/hr, breakthrough was immediate. Water-oil ratio was initially high
(� 2-3), then fell to approximately one and stabilized. After an additional 0.5 PV of
water had been injected, the WOR began rising in an exponential fashion, which was
similar to the climb at breakthrough in the low rate experiments. The immediate
breakthrough in the higher rate experiment did not occur in the experiment run with
an initial water saturation.
2.9 Horie et al (1988)
Horie et al (1988) performed stacked block experiments using cylindrical Berea sand-
stone cores that were approximately 10 cm in diameter and 30 cm in length. Three
of these cores were stacked vertically and placed into a transparent core holder. The

SECTION 2. LITERATURE REVIEW 17
cores were stacked face-to-face either with, or without, spacers between the blocks.
Three di�erent con�gurations were used for the spacers. The �rst con�guration was
to use four square aluminum shims that were 0.012 in. thick. The second used
coarse sand grains approximately 0.014{0.017 in. in diameter. These sand grains
were sparsely distributed in the space between the blocks. The third con�guration
used �ne (0.0059{0.0083 in. diameter) sand grains that covered the space between
the blocks with a single layer. The �ne sand grains were said to be about the same
size as the grains of the Berea sandstone.
N-decane was the oil phase used and air was used as the displacing uid. The
blocks were saturated with the n-decane and were stacked in a core holder that was
�lled with oil. The oil was allowed to drain out of the holder until the space between
the core holder and the blocks was produced. Once this occurred, production vs
time was recorded. When the oil production rate had \nearly ceased," an overburden
pressure was applied to the stacked blocks. After the experiments terminated, the
blocks were weighed to determine the block saturations. The authors noted that the
oil that was produced from their experiments did not ow along the vertical space
between the blocks and the core holder. The supposition was that the oil owed out
the lower block. The authors also suggested that oil was owing across the fractures
and was rein�ltrating the lower blocks.
Results from this work suggest that capillary continuity between the blocks has a
signi�cant e�ect on total recovery. Only about 3% of the pore volume was produced
for the case where the aluminum spacers were used, whereas 23% of the pore volume
was produced when the blocks were in direct contact with no overburden. In the
experiment where the blocks were separated by the aluminum spacers, no additional
recovery was obtained upon addition of the overburden pressure. The use of the �ne
grained sand as a spacer resulted in approximately 17% PV recovery before applica-
tion of the overburden pressure, and recovery increased to 23% once the overburden
pressure was added.
The coarse grained sand spacer experiment was even more interesting. This ex-
periment had a recovery that was a bit more than the aluminum spacer test before
the application of the overburden pressure (about 3.5% recovery), but increased to

SECTION 2. LITERATURE REVIEW 18
23% once the overburden pressure was applied. Note that this was the same as the
result with other spacer con�gurations. Once the experiment was terminated it was
noted that the coarse sand grains had been crushed due to the overburden.
2.10 Firoozabadi and Hauge (1990)
Firoozabadi and Hauge proposed modeling fracture capillary pressure by assuming
that the fracture faces are made up of a sequence of cones. They assumed that the
apex of a cone on one side of the fracture face touches the apex of a cone on the
adjacent face. To support their model, mineral oil/air experiments were conducted in
a centrifuge on rock samples from a chalk outcrop from Denmark. A single cylindrical
block experiment was run on a rock sample by placing a mineral oil saturated sample
into a core holder with spacers on the bottom and on the sides. Once the single block
experiment was completed, it was cut into several di�erent block con�gurations which
are described in detail by the authors. These blocks were then stacked and placed into
the core holder with the same spacer con�guration between the blocks and the core
holder as in the single block experiment. No spacer was placed between the blocks.
The experiments were run at 2036 rpm. The volume of drained liquid was recorded
vs time and, upon completion of the experiments, block saturations were measured
by weighing the blocks.
The results of these experiments again indicate that capillary continuity is a sig-
ni�cant factor in the recovery of oil from stacked blocks. In general, it was found that
the more blocks that are stacked, the lower the recovery. In one of the experiments
the results could not be correlated to known mechanisms and were attributed to a
\more complicated ow process than the reimbibition mechanism" that was assumed.
With the exception of the one case, the results showed agreement with their model.
2.11 Labastie (1990)
Labastie used two 35 cm homogeneous sintered ceramic matrix blocks with 5 mm
spacers made of di�ering materials to study capillary continuity in gravity drainage

SECTION 2. LITERATURE REVIEW 19
experiments. The matrix blocks had high permeability (4.6 Darcies) and high porosity
(44%). The experiments were performed with spacers that had the same permeability
as the matrix blocks, spacers that had a much smaller permeability (5 md), and
spacers that had no permeability (either stainless steel or glass beads). The block
faces had an area of 45.36 cm2 and the spacers occupied approximately 16.7% of the
block face area. The oil phase was ISOPAR M and air was the gas phase used in the
experiments.
Experimental results were presented in recovery vs time curves. The 4.6 Darcy
bridge showed signi�cantly higher recoveries in a shorter time than the other types of
spacers. The 5 md spacer provided the next highest recovery curve. The glass bead
spacer and the stainless steel spacer had almost the same recovery curves; however,
it should be noted that the stainless steel spacer size was actually 0.3 mm, rather
than the 5 mm size for the glass beads. The 5 mm stainless steel spacer experiment
provided no recovery. Labastie suggested that one reason for the lack of recovery
may have been that the spacers may not have provided a clean contact on either
of the matrix block faces. Contact area then may have been too small to provide
the necessary capillary continuity. An additional possibility for explaining the poor
performance of the square spacers could be that the contact was clean, but that ow
was in a thin �lm along the spacer. The area available for ow would be limited to a
thin square shell around the spacer.
2.12 Firoozabadi and Markeset (1992a, 1992b)
In a series of papers, Firoozabadi and Markeset (1992a, 1992b) extended the stacked
block work of Horie et al (1990). The �rst sequence of experiments (Firoozabadi and
Markeset, 1992b) was to show the e�ects of block height on recovery. Experiments
were run on a stack of four Berea sandstone blocks that were 45.5 cm tall and on a
stack of three Berea blocks that were 60.5 cm tall. The 45.5 cm experiments were run
with six con�gurations of metallic spacers separating the blocks. These con�gurations
were: no spacers between the blocks; three, 1.2 mm spacers between the blocks; three,
0.25 mm spacers; 49, 0.25 mm spacers; �ve, 0.1 mm spacers; and nine, 0.1 mm spacers.

SECTION 2. LITERATURE REVIEW 20
The 60.5 cm experiments also had several spacer con�gurations. These were:
four, 50 �m spacers between the blocks; 16, 50 �m spacers; and a con�guration that
consisted of four, 100 �m spacers for 3 weeks; four 50 �m spacers for four weeks; and
blocks in direct contact for a week and a half. Results were presented in semi-log
plots of cumulative production vs time and log-log plots of production rate vs time.
Block saturations, obtained by weighing, were also presented.
These experiments showed that stacked blocks in direct contact produced the same
recovery as an equal height single block experiment. Additionally, the experiments
showed a marked reduction in recovery depending on spacer size and number of
spacers. The more even the fracture width for a given spacer size, the lower the
recovery. This led the authors to conclude that fracture-liquid transmissibility may
not be strongly in uenced by contact area or the number of contact points, but is
strongly in uenced by fracture aperture. These authors also feel that the fracture-
liquid ow in gas/oil gravity processes occurs mainly by �lm ow.
The second sequence (Firoozabadi and Markeset, 1992a) was to show the e�ects
of capillary and gravity cross ow. This work started with stacked block experiments
where the stack could be tilted at various angles. Two such experiments were con-
ducted. The �rst used four, 0.25 mm metallic spacers between the blocks and the
blocks were tilted at a 30� angle from vertical. The second used no spacers between
the blocks with a tilt angle of 45�.
The next phase was to run similar experiments with a matrix of stacked slabs. The
matrix consisted of four rows of three slabs each. Unlike the previous experiments,
the stacked slab experiments were run with the outer faces in direct contact with the
walls of the core holder. No spacers were used between the slabs or the rows. Tilt
angles were 0�, 30�, and 45� from vertical.
This work showed that gravitational e�ects can dramatically alter recoveries and
that capillary cross ow can enhance recoveries. When compared to the vertical stack
results, the 30� tilt caused a 33% reduction in recovery for a given time, and the
direct contact, 45 � angle, data showed more than a factor of three increase in the
amount of time required to recover equal volumes of oil. A comparison of the stacked
block experiment at a 45� angle with the stacked slabs at a 45 � angle indicates that
SECTION 2. LITERATURE REVIEW 21
the stacked slab con�guration recovered approximately the same amount of oil as the
stacked block con�guration in 20% less time.
2.13 Babadagli and Ershaghi (1992)
Three rock types were used in this work. Two low permeability rocks, Colton Sand-
stone (k = 0.05-0.1 md) and Austin Chalk (k = 3-4 md), and one higher permeability
rock, Berea Sandstone (k = 280-300 md). Cylindrical core samples one inch in diam-
eter and four inches in length were used. Some of the experiments were run on cores
that were cut into two hemispherical pieces that were held together by epoxy and heat
shrinkable Te on with no spacers between the halves. Other experiments were run
on cores cut into hemispheres and further subdivided lengthwise into one inch pieces.
The eight resulting pieces were then held together with epoxy and the heat shrinkable
Te on. After cutting, the samples were placed either into a Hassler sleeve equipped
core holder, or into a core holder that was constructed of a plastic acrylic tube with
end plugs that directed the ow into the core. The samples were then saturated with
kerosene. A 3% KCl solution was the displacing uid. The experiments using the
acrylic tube core holder used a CT scanner to determine water front locations with
time. Some of the experiments on the four inch long samples were run in the vertical
direction.
Results were presented in plots of PV recovery vs time, PV oil produced vs PV
water injected, and water-oil ratio vs PV oil produced. Five schematics were also
presented from the CT scans of water front position at various pore volumes injected.
These results indicated that breakthrough times are highly rate dependent, even at
very low injection rates. For all of the cases presented, breakthrough occurred earlier
for increasing ow rates; consequently recovery of equivalent volumes of oil required
more injected water. For the tighter samples, higher rates decreased ultimate recovery
once a threshold injection rate was surpassed. For the very tight Colton sandstone
experiments, oil recovery was only 10% of the pore volume and occurred almost
immediately after injection at a rate of only 0.75 cm3/min.
SECTION 2. LITERATURE REVIEW 22
CT information indicated that for lower rates (0.2 cm3/min), displacement pro-
gressed in the matrix faster than in the fracture. At a higher rate of 1 cm3/min, the
displacement advances rapidly through the fracture. In two of the cases shown, the
water appeared to be advancing faster into the upper blocks than the lower blocks.
One of the �gures was for a displacement experiment run vertically. Water was in-
jected into the bottom of the core holder with production out the top. This �gure
indicated that the water front moved much more rapidly in the matrix than in the
fracture.
2.14 Summary
As the discussion above indicates, a more fundamental study of two-phase ow in
fractured media is needed. One of the primary drawbacks to many of the experiments
is the lack of understanding of the saturation distributions in the rock matrices.
Work sponsored under this program (Guzman and Aziz, 1993) was initiated to
study two-phase ow in fractured porous media. The initial purpose for this work
was to attempt to measure relative permeabilities in the fracture. An experiment was
designed to measure saturation distribution in two cores of identical material. One
core would be a control while the other would be cut in half and propped open with
inert material to simulate a fracture. Oil and water would be injected into the cores
at varying rates. Saturations would be measured by CT scanning the core at various
stages of the injection process. Fine grid simulations would then be used to history
match the experimental results. Fine grid simulations were performed to help in the
design of the experimental procedure (Guzman and Aziz, 1991).
An experiment was built but, unfortunately, problems which developed during
single phase injection testing, precluded obtaining results. The work reported here
is a modi�cation and extension of the Guzman and Aziz study. The focus will be
on obtaining both qualitative and quantitative data on the movement of uids in
fractured blocks.

Section 3
Core Holder and Flow Equipment
Construction
Three rectangular blocks of Boise sandstone were prepared for use in this work. The
�rst is a compact (solid) core measuring 3 1/8 � 3 1/16 � 11 inches. The second and
third cores are constructed from two 2 15/16 � 1 1/2 � 11 inch blocks. The second
core system has a 1 mm thick spacer fastened in place with Epoxy 907 to provide
a separation between the blocks to simulate a fracture. The third core system is
constructed similarly but has no spacer between the blocks. The following sections
will describe the materials and methods used to build the core holders and ow system
for these experiments.
3.1 Core Holder
Due to the rectangular shape and the desire to measure in-situ saturations through
the use of the CT scanner, conventional core holders could not be used. A core holder
similar to the original design by Guzman (Guzman and Aziz, 1993) was developed for
each of the cores. It consists of an epoxy resin surrounding the core. The resin system
used was Tap Plastics Marine Grade Resin #314 with Tap Plastics #143 Hardener.
Plexiglas end plates were constructed for the core holders with a piece of 3/8 inch
Viton acting as a gasket surrounding the core and held in place with automotive
23

SECTION 3. CORE HOLDER AND FLOW EQUIPMENT CONSTRUCTION 24
Plexiglas Rod
Epoxy
Boise Core
Viton Gasket
Plexiglas Plate
Figure 3.1: The Core Holder.
gasket material (Permatex Ultra Blue RTV Silicone Gasket) and Plexiglas rods as
shown in Fig. 3.1.
The original design had six pressure taps all on the top of the core holder. The
new design has two pressure taps on the top and two on the bottom. In addition, a
Plexiglas plate that was epoxied to the top surface of the core was removed in the
new design. The plate was found to be unnecessary and a potential source for leaks.
Several di�erent epoxy systems were tested in addition to the system chosen.
Among these were Tap Plastics `One to One' General Purpose Epoxy, Tap Plastics
`Super Hard' Four to One Epoxy, and Evercoat Laminating Resin. All of these epoxies
were extremely exothermic when reacting to become solid. The Tap Plastics Marine
Grade Epoxy system selected uses the #314 resin in combination with various hard-
eners to provide di�erent cure times with similar chemical resistances and strengths.
The #143 Hardener was chosen because it provides a slower cure, yet retains its chem-
ical resistance properties. This system is slightly less viscous so penetration is a bit
deeper into the core than it was for some of the other systems we observed; however,
for this experiment the added control the slow cure time provided was deemed to be
a more important issue than penetration depth. Speci�cations for the epoxy system

SECTION 3. CORE HOLDER AND FLOW EQUIPMENT CONSTRUCTION 25
chosen are given in Appendix A.
In addition to using a slower curing epoxy system, an aluminum mold was con-
structed to allow better heat dissipation. The mold was built so that there would be
a 1/2 inch border of epoxy around the bottom and sides of the core. It had an open
top with sides which were six inches taller than the estimated top of the epoxy. This
allowed the heat to radiate out of the mold and helped to prevent cracking of the
epoxy.
To construct the core holders, Plexiglas end plates were attached to the core with
GE White RTV 102 Silicon Rubber Adhesive Sealant and held in place with clamps.
Epoxy was layered on with a paintbrush and allowed to sit for one hour. The core was
then placed into the mold. The mold was tilted at a 45 degree angle and the epoxy
was poured in. Tilting the mold reduced the number of air bubbles which can form
along the bottom of the core. Once the liquid resin covered the core, the mold was
returned to level and additional resin was added to reach the desired height. During
the construction of the compact core holder, heat expansion of the air inside the core
caused air bubbles to form and rise to the surface of the epoxy at one of the ends. For
the two subsequent cores, holes were drilled in the Plexiglas end plates. This action
alleviated the problem. Figure 3.2 shows an oblique view of the core holder after the
epoxy has cured.
Once the epoxy had cured, the cores were removed from the mold and taken to
Donohoe and Carroll Memorials in Colma, CA where the ends were trimmed with a
water-cooled diamond circular saw to provide an 11 inch length. A piece of 3/8 inch
Viton was then cut for each end face of the core holder. A hole was cut in the Viton
so that the core face would be exposed. Automotive gasket material was then used to
glue the Viton to the epoxy and the Viton to the Plexiglas end plates. Plexiglas rods
were bolted into place through holes that had been drilled into each end plate. This
provided added support and also allowed the gasket material/Viton to be compressed
to eliminate leaks.

SECTION 3. CORE HOLDER AND FLOW EQUIPMENT CONSTRUCTION 26
Figure 3.2: Core Holder After Curing.
3.2 Flow System
The ow system for this experiment is an adaptation of several previous researchers'
work here at Stanford. Figure 3.3 shows the ow schema for this work. Squares
with a T-x label denote pressure transducers. Circles with right angles inside denote
three-way valves. Two-way valves are labeled to allow easier description of the layout
in this report. Each major branch of the ow system will be discussed in detail in the
next six sections. A listing of the major pieces of equipment is given in Appendix B,
including their source of supply.
3.2.1 Injection System
The injection system consists of two LDC Analytical, Inc. model constaMetric 3200
pumps. Each pump has the capability to deliver 0.01 to 9.99 cm3/min in 0.01 cm3/min
increments. The pumps use a dual plunger system that has been designed to provide
constant uid discharge rates at outlet pressures from 100-6000 psi. To use the
pumps the user sets the desired discharge rate, the minimum allowable pressure, and

SECTION 3. CORE HOLDER AND FLOW EQUIPMENT CONSTRUCTION 27
4-1
To
Atmosphere
MeasurementSystem
CO
Boise CoreCI
OilPump
WaterPump
FromMeasurementSystem
ToAtmosphere
From
MeasurementTo
System
T-4T-3T-1 T-2
T-6T-5
5-15-2 6-1
C5 C6
3-2 3-1
C3 C4
From
W1
GuageTest
O1
I2
I3I1
A1
M1
Source
X-Ray
X-Ray
Detector
N2/CO2
Figure 3.3: Experimental Flow Schematic.
SECTION 3. CORE HOLDER AND FLOW EQUIPMENT CONSTRUCTION 28
the maximum allowable pressure. Plumbing downstream of the pumps allows mixing
of the uids being discharged by each pump. This setup allows injection pressure
to be monitored with a test gauge and recirculation to measure pump output rates.
This con�guration also is a convenient way to use nitrogen in the calibration of the
pressure transducers, or to use CO2 to help in the saturation of the core. Pump
inlet can be from an extra \make up" container or from the measured uids being
discharged from the core.
3.2.2 Distribution System
All piping used for the experiment was Para ex 1/8 inch diameter, 500 psi working
pressure plastic tubing with Swagelok �ttings. The distribution of uids throughout
the experiment is controlled by Whitey B-43F2 ball valves. This system allows uids
to be directed to any port or combination of ports in the experiment. It can be
directed to test the calibration of the pressure transducers, inject from one end and
produce from the opposite end (the primary con�guration), inject into one or more
of the ports on the top and bottom of the core holder (which are normally used for
monitoring pressures), or to bypass the core holder completely. The ability to direct
uids to any port in the experiment allows charging the core with uids readily,
testing various ow con�gurations, and cleaning the core more easily.
3.2.3 Production Measurement System
The production measurement system is an adaptation of a design �rst proposed by
Ameri and Wang (1985) and modi�ed by Qadeer (1994). Figure 3.4 shows the system.
The key element of the measurement system is the separator. It consists of two
glass vessels, one inside the other. The inner vessel has an open bottom and a closed
top. It hangs inside the outer vessel, suspended from an electronic balance by a
hooked wire. Produced uids enter this inner vessel and separate due to density
di�erences. The lighter uid (in this case, oil) rises and collects at the top of the
inner vessel and the more dense uid (water) exits from the bottom. The outer vessel
is initially �lled with water. When production begins, water from the inner vessel
SECTION 3. CORE HOLDER AND FLOW EQUIPMENT CONSTRUCTION 29
Overflow
Electronic Balance
Water
Electronic Balance
GasketRubber
From
Core
Outlet
Container
Container
System
Oil
Water
PumpPumpOil
InletTo
(Valve M1) Oil
Water
Water
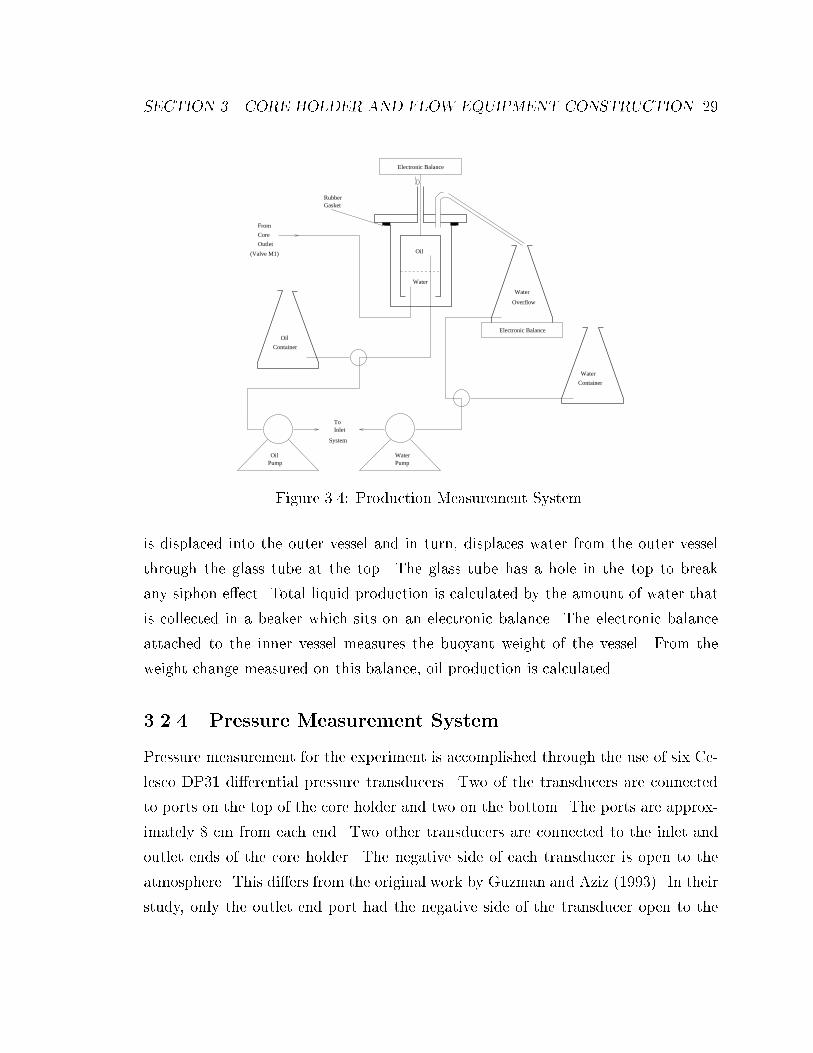
Figure 3.4: Production Measurement System.
is displaced into the outer vessel and in turn, displaces water from the outer vessel
through the glass tube at the top. The glass tube has a hole in the top to break
any siphon e�ect. Total liquid production is calculated by the amount of water that
is collected in a beaker which sits on an electronic balance. The electronic balance
attached to the inner vessel measures the buoyant weight of the vessel. From the
weight change measured on this balance, oil production is calculated.
3.2.4 Pressure Measurement System
Pressure measurement for the experiment is accomplished through the use of six Ce-
lesco DP31 di�erential pressure transducers. Two of the transducers are connected
to ports on the top of the core holder and two on the bottom. The ports are approx-
imately 8 cm from each end. Two other transducers are connected to the inlet and
outlet ends of the core holder. The negative side of each transducer is open to the
atmosphere. This di�ers from the original work by Guzman and Aziz (1993). In their
study, only the outlet end port had the negative side of the transducer open to the
SECTION 3. CORE HOLDER AND FLOW EQUIPMENT CONSTRUCTION 30
atmosphere. The remaining ports had their negative side connected to the core outlet
end. All the stainless steel diaphragms for the transducers are the 5 psi type. The
Celesco transducers work in combination with carrier demodulators, either Celesco
model CD10A, CD10D, or CD25A demodulators. The demodulators take the output
from the transducers and produce a DC signal in the range -10 to +10 volts.
Calibration of the transducers is fairly straightforward and can be described best
through example. Referring to Fig. 3.3, and focusing on the transducer labeled T-1,
the three way valve is in the \loop back" position. Valves CI, 3-2 and 5-2 are closed
and 5 psi of nitrogen pressure is applied by opening valves I1 and I3 and closing valves
O1 and W1. Since the pressure is equally applied to both sides of the transducer,
the transducer can be calibrated to zero pressure di�erential. Once the zero has been
obtained, the three way valve is opened so that the negative side of the transducer
is open to the atmosphere. The entire 5 psi of applied pressure is then being applied
only to the positive side of the transducer. Since 5 psi diaphragms are being used, the
output from the demodulator is adjusted to read +10 volts. This type of procedure
is used on all pressure transducers.
3.2.5 Data Collection System
Output signals for the carrier demodulators can be collected by a set of Soltec Trans-
ducer Products, Inc. 1243 Chart Recorders, or the signals can be fed into an HP3497A
data logger. If the data logger is used, the digital signal from the data logger is sent
to an IBM compatible personal computer (PC) through a HP-IB interface card in
the PC. Output signals from the two electronic balances are sent directly to serial
communication ports in the PC.
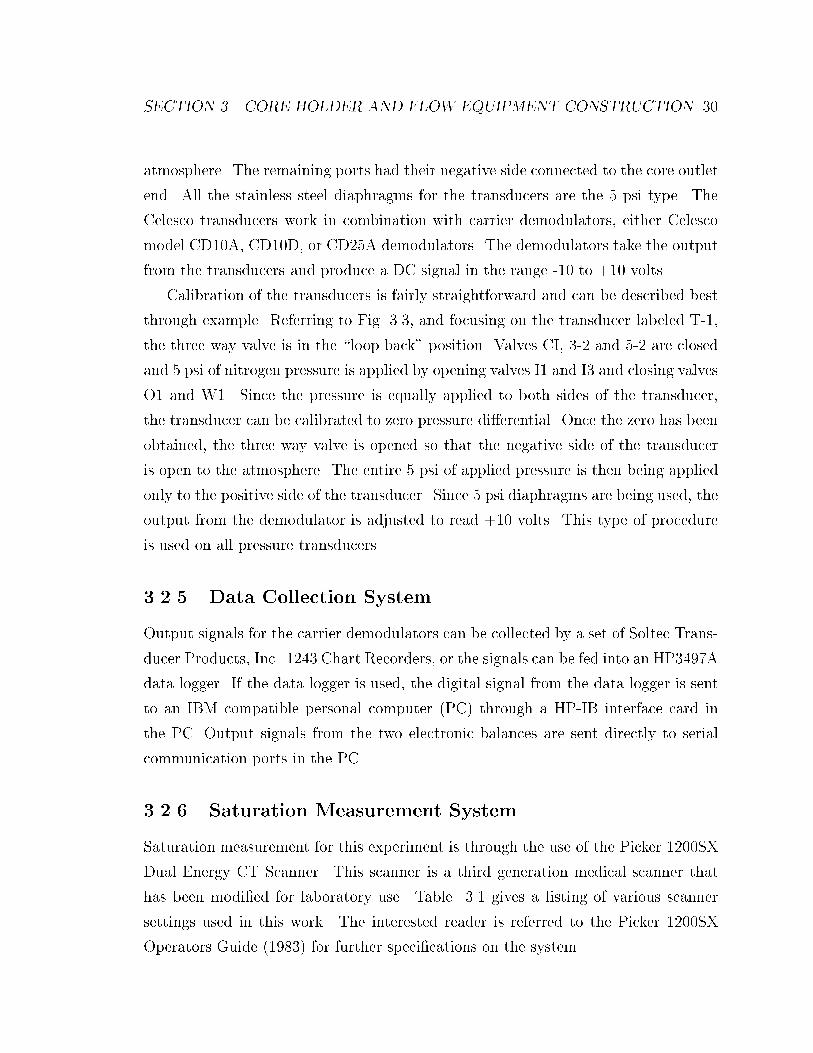
3.2.6 Saturation Measurement System
Saturation measurement for this experiment is through the use of the Picker 1200SX
Dual Energy CT Scanner. This scanner is a third generation medical scanner that
has been modi�ed for laboratory use. Table 3.1 gives a listing of various scanner
settings used in this work. The interested reader is referred to the Picker 1200SX
Operators Guide (1983) for further speci�cations on the system.
SECTION 3. CORE HOLDER AND FLOW EQUIPMENT CONSTRUCTION 31
Table 3.1: Scanner settings.
Parameter Setting
Field of View 30 cmImage Matrix 512�512Sampling 1024Scan Rotation 398�
Scan Speed 3 secSlice Thickness 3 mmAlgorithm 14 (Spine)Resolution HighkV 100mA 80Focal Spot SmallAnode Speed LowX-Ray Filter CFast Process O�Dynamic Calibration OnDynamic Reference On

Section 4
Experimental Results
Once the experiment had been designed and constructed, the equipment needed to
be tested and evaluated for its ability to obtain meaningful results. This section
describes and presents the results of experiments conducted in this e�ort.
4.1 Water Imbibition into a Dry Fractured Core
Guzman and Aziz (1993) presented a �gure in their work which showed how the CT
scanner can indicate unsaturated conditions within the rock matrix. For this study it
was decided to evaluate how water imbibed into an unsaturated core. The �rst core
that was used had the 1 mm fracture. Figure 4.1 shows the locations that were chosen
for the CT scans. Two items prevented a regular sequence of scan locations. The �rst
was that stainless steel �ttings were used for the ports on the top and bottom of the
core holder. These �ttings caused artifacts and prevented scan locations from 70 mm
to 85 mm and from 190 mm to 205 mm. These are distances measured from the inlet
face. The second item that caused an irregular spacing of the scan locations was a
large vug located 170 mm from the inlet face which we wanted to monitor throughout
the experiment.
As noted in Section 3, the core holder had a gap corresponding to the width of
the Viton gasket at both the inlet and outlet face of the core. At an injection rate of
1 cm3/min, the injected water simply dribbled down the inside of the Plexiglas inlet
32

SECTION 4. EXPERIMENTAL RESULTS 33
40 mm
INLET
OUTLET
20mm
240 mm280 mm
260 mm220 mm
170 mm120 mm
60 mm
140 mm180 mm
100 mm
Figure 4.1: CT Scan Locations.
face plate and was imbibed into the bottom block. As the experiment progressed, the
water began �lling the gap between the Plexiglas plate and the core; however, it was
very late in the experiment before the water got above the level of the fracture. The
outlet condition was initially open to the atmosphere. After approximately 1.75 PV
had been injected, the outlet was directed to the separation system and the injection
rate was increased. Outlet pressure was 0.51 psi, while inlet pressure was 0.75 psi, at
a ow rate of approximately 2 cm3/min.
CT scans over time are shown in Fig. 4.2. This �gure shows the uid migration
from approximately 0.03 pore volumes (PV) injected to 0.13 PV injected. Note that
the scans indicate a hint that water is jumping across the fracture, at a position 60
mm from the inlet face after only 0.06 PV injected. There is a slight change in the
lower right corner of the upper block. Figure 4.3 shows the 40 mm and 60 mm scans
for 0.09 PV injected in slightly more detail. This �gure has a di�erent shading scheme
than in Fig. 4.2. The reasons for the shading change and the methods for creating
the �gures are described in Appendix C. Of note in Fig. 4.3 is that there appears to
be continuity across the fracture on the right edge of the blocks at these locations.
The conclusion drawn from these �gures is that the water crosses at these locations

SECTION 4. EXPERIMENTAL RESULTS 34
Figure 4.2: CT Scans at Early Times. Darker Shades Indicate Higher Water Satura-tion.

SECTION 4. EXPERIMENTAL RESULTS 35
a.) b.)
Figure 4.3: CT Scan at a.)+40 mm and b.)+60 mm From Inlet End at 0.09 PVInjected. Lighter Shades Indicate Higher Water Saturation.
and then migrates towards the outlet face in the top and bottom blocks. The water
also migrates back towards the inlet face in the top block. Presumably, this is due
to capillary imbibition. Note also that water appears to be along the entire width of
the fracture face on the top block in both the scan at 40 mm and the scan at 60 mm,
but that the fracture seems to be �lled with air (except on the right edge as noted
above).
Figure 4.4 shows that, as the experiment progresses, the water continues to ad-
vance through the lower block at a faster rate than in the upper block. The water has
found two streaks in the lower block which allow faster migration. One is adjacent to
the fracture face in the center of the block. The other is in the lower right corner of
the block. These can best be seen in the scans at 0.35 PV injected in the +220 mm
location. Even though the water has advanced farther in the lower block, the upper
block is achieving a higher saturation. The higher saturation is di�cult to see on the
�gures, but can be seen when analyzing the raw CT numbers from the scans.
Water breaks through and begins collecting on the bottom of the outlet face plate
at approximately 0.47 PV injected. Figure 4.5 shows that the upper block has water
spread fairly evenly throughout, while the lower block still has areas not contacted.
Figure 4.6 is the scan at 260 mm from the inlet face at the time of water breakthrough.
It clearly shows areas where water has not contacted the rock pores.
The experiment was run over the course of four days. Approximately 4.26 PV
of water passed through the core. Once the experiment was terminated, the valves

SECTION 4. EXPERIMENTAL RESULTS 36
Figure 4.4: CT Scans as Experiment Progresses. Darker Shades Indicate HigherWater Saturation.

SECTION 4. EXPERIMENTAL RESULTS 37
Figure 4.5: CT Scans at Water Breakthrough and Beyond. Darker Shades IndicateHigher Water Saturation.

SECTION 4. EXPERIMENTAL RESULTS 38
Figure 4.6: CT Scan at +260 mm From Inlet End at Breakthrough. Lighter ShadesIndicate Higher Water Saturation.
leading to the core were closed and the core was allowed to sit for three months. The
core was then scanned again. Figure 4.7 shows the scans at the end of the experiment,
scans three months later, and the di�erence between them . The changes that occur
seem to be most noticeable along the edges of blocks and the edges of the vug. These
alterations could be caused by positioning errors, since the core holder was removed
from the scanning table during the three month wait. A closer view of the scan at
+170 mm from the inlet (the vug) is seen in Fig. 4.8. This view shows that the
entire scan area has added water and that a pocket of air has formed on the top of
the fracture adjacent to the top block. Note that the vug has �lled considerably with
water but that there continues to be a small area in the upper left side of the vug that
contains air. This would suggest that, at least some of the changes seen in Fig. 4.7
are real, and not positioning di�erences. This �gure also emphasizes the slow nature
of the approach to equilibrium in porous media.
It is interesting to observe the changes that occur in the slice associated with the
vug 170 mm from the inlet end. Figure 4.9 is the set of scans which shows these
changes. In these �gures, the lighter shades indicate higher water saturation values.
The white spot in the upper right corner of the vug �lls with water very early in the
displacement process. Then more of the vug �lls in as time goes on; however, the vug
never becomes completely �lled with water during the displacement.
One additional item on these experimental results is noteworthy. Withjack (1988)
has shown that porosity can be calculated from the matrix of CT numbers obtained

SECTION 4. EXPERIMENTAL RESULTS 39
Figure 4.7: CT Scans Showing Fluid Movement Over 3 Months. Darker ShadesIndicate Higher Water Saturation.

SECTION 4. EXPERIMENTAL RESULTS 40
a.) b.)
Figure 4.8: CT Scans at +170 mm From Inlet End a.) at End of Displacement andb.) After 3 Month Wait. Lighter Shades Indicate Higher Water Saturation.
when scanning by using the equation:
� =CTw � CTd
CTwater � CTair(4.1)
where:
CTw = the CT number for a water saturated core at a matrix location
CTd = the CT number for a dry core at a matrix location
CTwater = the CT number for water
CTair = the CT number for air
The CT number for water is 0, while the CT number for air is -1000.
Despite passing more than 4 PV of water through the core, the average value for
\porosity" calculated from the scans at the end of the displacement experiment using
Eqn. 4.1 was 14.35%. This di�ers from the average porosity measurements of 25.4%
obtained by Guzman and Aziz (1993), 29.3% obtained by Sumnu (1995), and the 32%
obtained by Sanyal (1972). Addition of CO2 and injecting water into the pressure
measurement ports raised the value calculated to an average of 20%. There continue
to be areas (mainly in the lower block) that either have lower porosity or that have
di�culty being saturated at the rates and pressures used in the experiment.

SECTION 4. EXPERIMENTAL RESULTS 41
Figure 4.9: CT Scans at +170 mm From Inlet End Through Time. Lighter ShadesIndicate Higher Water Saturation.
Section 5
Discussion and Recommendations
This report has presented the description of an apparatus to conduct experiments
to investigate ow in fractured porous media. Preliminary experiments testing the
equipment produced some interesting results. This section will evaluate the designed
apparatus, suggest areas where improvements can be made, and provide insight into
the results obtained thus far.
The experiments conducted thus far have shown that the system can obtain mean-
ingful results in the e�ort to understand the physics of ow in fractured media. Flow
in the experiment is across the blocks with gravity segregation possible at low rates.
Thus, experiments can be run which mimic ow between wells (across the block) with
water rising from below on one side. The ow con�guration can be easily altered to
accommodate other possible boundary conditions. Filter paper or �ne grained sand
could be used to �ll the space between the Plexiglas plate and the core if a more
even distribution inlet or outlet condition is desired. A tubing con�guration could be
devised similar to those in the Kazemi and Merrill (1979) study, if injection is to be
limited to the fracture space. Experimental pressures have been as high as 16 psi and
ow rates up to 10 cm3/min have been recorded. The preliminary experiments have
also shown areas in the rock which have lower permeability. These areas will need
special attention when charging the core with oil, during displacement experiments,
and also during cleaning operations. We would not have been aware of these problems
if we had not had the useful additional information provided by the CT scanner.
42

SECTION 5. DISCUSSION AND RECOMMENDATIONS 43
As with any experimental apparatus, several areas needing improvement can be
identi�ed. Currently the pressure transducers are mounted on the edge of the top level
of the cart being used for the experiment, while the three-way valves are mounted
on a Plexiglas plate along an adjacent side of the cart. This allows easy access to
the transducers for changing plates but it creates a web of lines which is di�cult to
decipher when lines are leaking or when changes to the system are needed. A taller
cart would allow the transducers to be mounted on the Plexiglas plate next to the
valves, and would still allow easy access should the plates need to be replaced. This
would also considerably reduce the amount of tubing needed and also reduce the
confusion caused by the existing lines.
To use the CT scanner to monitor the migration of uids when the core is being
charged with oil, or when the core is being cleaned, the stainless steel Swagelok �ttings
should be replaced with equivalent plastic �ttings. Artifacts in the CT numbers will
still occur due to the �ttings, but these artifacts would be minor and would allow
observation of saturation changes around the injection ports. These observations are
not possible with the stainless steel �ttings.
Several authors (Kazemi and Merrill (1979), Beckner (1990), Gilman, et al (1994))
have assumed that fracture capillary pressures are negligible. Others have shown
experimentally that capillary continuity becomes important when gravity provides
a driving force (Horie et al (1988), Firoozabadi and Hauge (1990), Labastie (1990),
Firoozabadi and Markeset (1992a, 1992b)). Kazemi (1990) states his belief that
capillary continuity is prevalent in the vertical direction and has suggested that, to
reduce the number of equations to solve, fractured reservoir simulations should use the
dual permeability formulation for the z direction, while the dual porosity formulation
should be used for the x and y directions.
The CT scans shown in this report con�rm that capillary continuity can occur in
the vertical direction and also in the horizontal direction opposite to the pressure gra-
dient. This continuity pulls uid in the opposite direction of gravity. The continuity
works in any direction depending on the relative strengths of the capillary and Darcy
terms in the ow equations. Thus, the simulation engineer should evaluate the forces
present in the system being simulated to decide which directions should be evaluated

SECTION 5. DISCUSSION AND RECOMMENDATIONS 44
by dual permeability equations, and which by dual porosity.
It should be noted that it remains unclear as to what has caused the continuity
between blocks in this experiment. The most likely explanation is that �ne grained
material from cutting the end pieces may not have been thoroughly cleaned from
the fracture. Some �ne grained material was observed in the space between the rock
and the Plexiglas end plates once the core had been �lled with water. A repeat of
this experiment should reveal whether this material caused the continuity across the
fracture, or if there is some other mechanism.

Appendix A
Epoxy Speci�cations
Property Speci�cation
Resin System Tap Plastics Marine Grade #314
Hardener Tap Plastics Marine Grade #143
Resin/Hardener Ratio (by Volume) 2:1
Mixed Viscosity (cp) 780
Pot Life (minutes at 77� F, 25� C) 35{40
Recoat time (hours) 6.0{6.5
Recommended Minimum Use Temperature (� F) 40
Heat Distortion Temperature (� F) 110
Flexural Strength (psi) 10,500
45

APPENDIX A. EPOXY SPECIFICATIONS 46
Tensile Strength (psi) 7,000
Flexural Modulus (psi) 400,000
Tensile Modulus (psi) 360,000
Elongation % 6.0

Appendix B
List of Equipment
Equipment Speci�cation Manufacturer or Distributor
Back pressure regulator SD-91LW Grove Valve & Regulator Co.
400-25 psi 6529 Hollis St.
Oakland, CA 94608
Balance PE1600 Mettler Instrument Corp.
Princeton-Hightstown Road
Hightstown, NJ 08520
PE360 Mettler Instrument Corp.
Princeton-Hightstown Road
Hightstown, NJ 08520
Ball valve Whitey B-43F2 Sunnyvale Valve & Fitting Co.
929 Weddell Court
Sunnyvale, CA 94089
Connectors Swagelock Sunnyvale Valve & Fitting Co.
929 Weddell Court
Sunnyvale, CA 94089
47
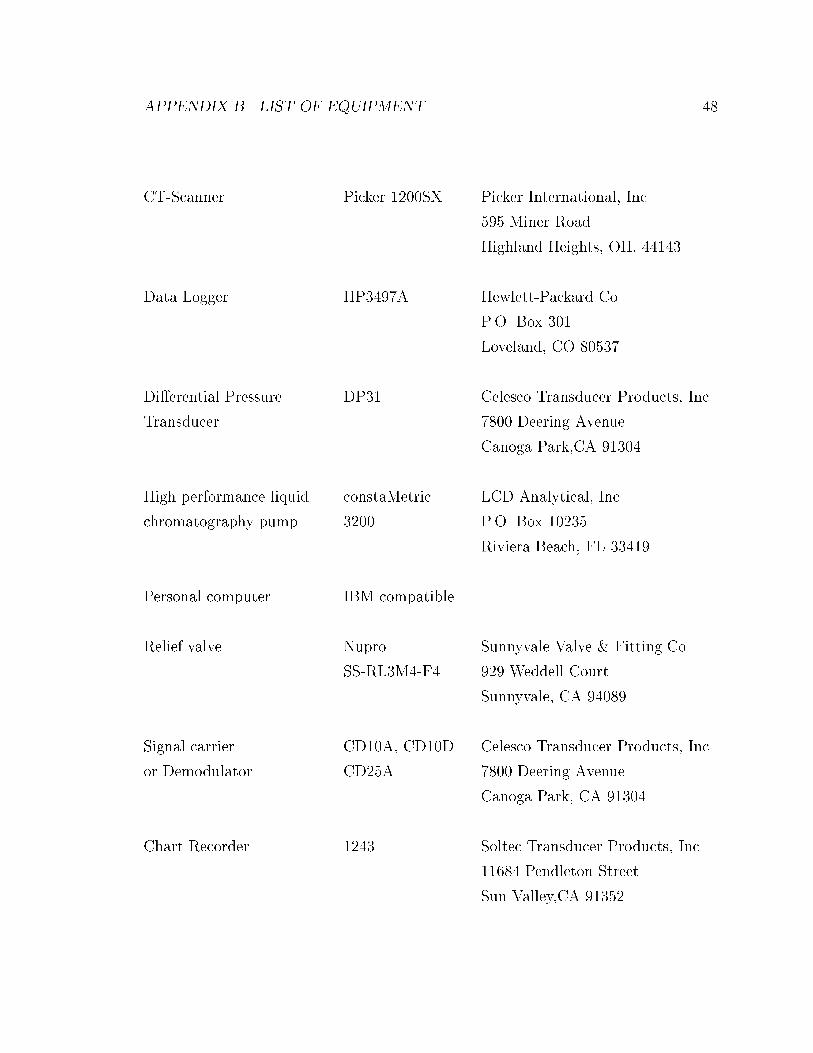
APPENDIX B. LIST OF EQUIPMENT 48
CT-Scanner Picker 1200SX Picker International, Inc
595 Miner Road
Highland Heights, OH, 44143
Data Logger HP3497A Hewlett-Packard Co.
P.O. Box 301
Loveland, CO 80537
Di�erential Pressure DP31 Celesco Transducer Products, Inc.
Transducer 7800 Deering Avenue
Canoga Park,CA 91304
High performance liquid constaMetric LCD Analytical, Inc.
chromatography pump 3200 P.O. Box 10235
Riviera Beach, FL 33419
Personal computer IBM compatible
Relief valve Nupro Sunnyvale Valve & Fitting Co.
SS-RL3M4-F4 929 Weddell Court
Sunnyvale, CA 94089
Signal carrier CD10A, CD10D Celesco Transducer Products, Inc.
or Demodulator CD25A 7800 Deering Avenue
Canoga Park, CA 91304
Chart Recorder 1243 Soltec Transducer Products, Inc.
11684 Pendleton Street
Sun Valley,CA 91352

APPENDIX B. LIST OF EQUIPMENT 49
Test gauge Marshall Town Valin Corporation
0-30 psi 209 Fair Oaks Ave.
Sunnyvale, CA 94086
Three way ball Whitey B-42XF2 Sunnyvale Valve & Fitting Co.
valve 929 Weddell Court
Sunnyvale, CA 94089

Appendix C
Graphic Files
For each CT scan taken there is a 512 � 512 matrix of CT numbers stored in a �le.
The data is formatted in such a way that it requires processing in order to create the
graphics seen in Section 4. This processing is done in two ways.
The �rst method asks the user to input a CT number level and a CT number
window. Any CT number that is larger than the level plus one half of the window is
assigned a Tape Image File Format (TIFF) color value of 255. Any CT number that
is smaller than the level minus one half the window is assigned a TIFF color value
of 0. An output TIFF �le is then created which scales the remaining CT numbers
between 1 and 254. For these scans, a CT level of 1300 and a CT window of 325 was
used. This means that CT numbers less that 1138 received color values of 0 and CT
numbers greater than 1462 were given color values of 255.
To create Figs. 4.2, 4.4, 4.5, and 4.7, two �les were required for each location
at each time step shown. For each time step, the �rst data �le is for the partially
saturated scan and the second data �le is for the dry scan at the same location. The
dry scan TIFF �le is then subtracted from the TIFF �le from the time step using
the software package NIF Image version 1.54 for the Macintosh. The resulting image
was then copied into Microsoft PowerPoint version 3.0 for the Macintosh to create
the montage of images for these �gures.
This method was chosen for the �gures which were showing uid migration pat-
terns for two reasons. The resulting greyscale images allow the reader to see bulk
50

APPENDIX C. GRAPHIC FILES 51
uid movement quite easily. The images are also easier to reproduce without losing
picture quality.
The primary disadvantage in using this method is that it loses some of the most
important data that we are trying to capture. Data in the fracture and in the vug
have CT numbers that are below the value of 1138 in both the dry scans and in the
partially saturated scans. All of the TIFF �les contain zeros for the data values in
the fracture and in the vug despite the fact that data changes do occur.
The second way to process the CT data uses a software package written for use
with Stanford's Picker 1200SX scanner to access the CT numbers directly. This
package uses script �les written by the user to process the information. A script was
created that reads in a partially saturated scan and a dry scan. It then subtracts
the data in the dry scan from the data in the partially saturated scan and divides by
1000. This is, essentially Eqn. 4.1 with an unsaturated CT number substituting for
the saturated value.
The script �les in this processing package can use a variety of color palettes to
create the resulting image. The color scheme chosen used shades of blue for low
values, green for intermediate values and red for high values. A white color is used
for o� scale values on the high side, while a black color is used for o� scale values on
the low side.
A TIFF �le is then created from the resulting matrix. For the scans in this report,
a level of 0.15 and a window of 0.30 were chosen. This means that o� scale values on
the low side are registering negative values and are known to be data anomalies or
artifacts. O� scale values on the high side are larger than 0.30.
This method was used in creating Figs. 4.3, 4.6, 4.8, and 4.9. The advantage of
this method is that it shows subtle changes quite easily. It also uses and retains all
of the data in the calculations. The biggest disadvantage to this method is the color
scheme chosen. Use of this method for the uid movement �gures would have meant
that Figs. 4.2 and 4.4 would contain a signi�cant amount of black in the images. Our
experience has been that these very dark images have a tendency to smudge and, in
general, have poor image quality. Changes in the color scheme are in progress.

Nomenclature
A Core cross sectional area
B Formation Volume Factor
D Depth
h Reservoir thickness
K Absolute permeability
k Permeability
kr Relative permeability
L Length
p Pressure
Pc Capillary pressure
q Flow rate
S Saturation
t Time
T Transmissibility
V Volume
Greek
Speci�c gravity
� Contact angle
� Viscosity
� Density
� Interfacial tension or shape factor
52

NOMENCLATURE 53
� Porosity
� Matrix-Fracture transfer function
Subscripts
c Capillary
D Dimensionless
f Fracture
m Matrix
min Minimum
max Maximum
o Oil
p Phase
r Relative
w Water

Bibliography
[1] Aronofsky, J.S., Mass�e, L. and Natanson, S.G.: \A Model for the Mechanism
of Oil Recovery from the Porous Matrix Due to Water Invasion in Fractured
Reservoirs," Trans., AIME (1958) 213, 17{19.
[2] Ameri, H. and Wang, J.: \E�ect of Temperature on Oil-Water Relative Perme-
ability," SUPRI Heavy Oil Research Program, Eighth Annual Report, SUPRI
TR{47, (April 1985), 11{24.
[3] Babadagli, T. and Ershaghi, I.: \Imbibition Assisted Two-Phase Flow in Natural
Fractures," SPE 24044 presented at the Western Regional Meeting of the Society
of Petroleum Engineers, Bakers�eld, CA, March 30{April 1, 1992.
[4] Beckner, B.L.: Improved Modeling of Imbibition Matrix/Fracture Fluid Trans-
fer in Double Porosity Simulators, PhD dissertation, Stanford University (July
1990).
[5] de Swaan, A.: \Theory of Water ooding in Fractured Reservoirs," SPEJ (April
1978) 115{122.
[6] Firoozabadi, A. and Hauge, J.: \Capillary Pressure in Fractured Porous Media,"
JPT (June 1990) 784{791.
[7] Firoozabadi, A. and Markeset, T.: \An Experimental Study of Capillary and
Gravity Cross ow in Fractured Porous Media," SPE 24918, presented at the 67th
SPE Annual Technical Conference and Exhibition, Washington, D.C., October
4{7, 1992.
54

BIBLIOGRAPHY 55
[8] Firoozabadi, A. and Markeset, T.: \An Experimental Study of Gas-Liquid Trans-
missibility in Fractured Porous Media," SPE 24919, presented at the 67th SPE
Annual Technical Conference and Exhibition, Washington, D.C., October 4{7,
1992.
[9] Graham J.W. and Richardson, J.G.: \Theory and Application of Imbibition
Phenomena in Recovery of Oil," Trans. AIME (1950) 216, 377{381.
[10] Gilman, J.R., Bowzer, J.L. and Rothkopf, B.W.: \Application of Short-Radius
Horizontal Boreholes in the Naturally Fractured Yates Field," SPE 28568, pre-
sented at the 69th SPE Annual Technical Conference and Exhibition, New Or-
leans, LA, September 25{28, 1994.
[11] Guzman, R. E. and Aziz, K.: Design and Construction of an Experiment For
Two-Phase Flow in Fractured Porous Media, SUPRI TR{95, Stanford Petroleum
Research Institute, Stanford, CA, (June 1993).
[12] Guzman, R. E. and Aziz, K.: \Fine Grid Simulation of Two-Phase Flow in Frac-
tured Porous Media," SPE 24916, presented at the 67th SPE Annual Technical
Conference and Exhibition, Washington, D.C., October 4{7, 1992.
[13] Horie, T., Firoozabadi, A. and Ishimoto, K.: \Capillary Continuity in Fractured
Reservoirs," SPE 18282, presented at the 63rd SPE Annual Technical Conference
and Exhibition, Houston, TX, October 2{5, 1988.
[14] I�y, R., Rousselet, D. C., and Vermeulen, J. L.: \Fundamental Study of Imbi-
bition in Fissured Oil Fields," SPE 4102 presented at the 47th Annual Meeting
of the Society of Petroleum Engineers, San Antonio, TX, October 8{11, 1972.
[15] Kazemi, H. and Merrill, L. S.: \Numerical Simulation of Water Imbibition in
Fractured Cores," SPEJ (June 1979) 175{182.
[16] Kazemi, H.: Naturally Fractured Reservoirs, Third International Forum on
Reservoir Simulation, Baden, Austria (1990).
BIBLIOGRAPHY 56
[17] Kazemi, H., Gilman, J.R. and Eisharkawy, A. M.: \Analytical and Numerical
Solution of Oil Recovery From Fractured Reservoirs With Empirical Transfer
Functions," SPERE (May 1992) 219{227.
[18] Kleppe, J. and Morse, R. A.: \Oil Production from Fractured Reservoirs by
Water Displacement," SPE 5084 presented at the 49th Annual Meeting of the
Society of Petroleum Engineers, Houston, TX, Oct.6{9, 1974.
[19] Kyte, J.R.: \A Centrifuge Method To Predict Matrix-Block Recovery in Frac-
tured Reservoirs," SPEJ (June 1970), 164{170.
[20] Labastie, A.: \Capillary Continuity Between Blocks of a Fractured Reservoir,"
SPE 20515 presented at the 65th SPE Annual Technical Conference and Exhi-
bition, New Orleans, LA, September 23{26, 1990.
[21] Lefebvre du Prey, E.: \Gravity and Capillarity E�ects on Imbibition in Porous
Media," SPEJ (June 1978) 195{206.
[22] Mattax, C. C. and Kyte, J. R.: \Imbibition Oil Recovery from Fractured, Water-
Drive Reservoir," SPEJ (June 1962), 177{184.
[23] Parsons, R.W. and Chaney, P.R.: \Imbibition Model Studies on Water-Wet
Carbonate Rocks," SPEJ (March 1966), 26{34.
[24] Operator's Guide, Synerview 600s/1200SX, C850:F, REV1, Picker International
(January 1983).
[25] Qadeer, S.: Techniques to Handle Limitations in Dynamic Relative Permeability
Measurements, PhD dissertation, Stanford University (in progress).
[26] Sanyal, S.K.: The E�ect of Temperature on Electrical Resistivity and Capillary
Pressure Behavior of Porous Media, PhD dissertation, Stanford University (De-
cember 1971).
[27] Sumnu, M.D.: A Study of Steam Injection in Fractured Media, PhD dissertation,
Stanford University (November 1995).

BIBLIOGRAPHY 57
[28] Withjack, E.M.: \Computed Tomography for Rock-Property Determination and
Fluid-Flow Visualization," SPEFE (December 1988) 696{704.