ctc media investor presentation · october 2014 ctc media, inc. investor presentation . a leading...
TRANSCRIPT

October 2014
CTC Media, Inc.
Investor Presentation

A Leading Independent Broadcasting and Content Company in Russia

From Private TV Network to Public Media Holding
1989 1994 2002 2005 2006 2008 2009 2010 2011 2012 2013 2014
CTC Media was
founded as Story
First
Communications
Launch of CTC
Network
Modern Times Group
became a shareholder
of CTC Media
Launch of
Domashny Network
Initial Public Offering
on NASDAQ
Acquisition of DTV
(rebranded to Peretz
in 2011)
Acquisition of
Channel 31 in
Kazakhstan and a TV
company in Moldova
Launch of CTC-
international in
Kazakhstan,
Kyrgyzstan,
Armenia, Georgia,
Azerbaijan, Thailand
and
uplink to HOT BIRD
CTC and Domashny
received digital
licenses
Launch of CTC-
international in
Germany, North America
and the Baltics
Telcrest Investments
Limited acquired a 25%
stake in СTС Media
from Alfa Group
Launch of Domashniy.ru
women’s portal Launch of CTC-
international in
USA
Launch of CTC-
international in
Israel
Establishment of
CTC Media’s
internal advertising
sales house
‘Everest Sales’
Launch of
Videomore.ru
online content
portal
Development of in-
house creative
production center
Launch of Peretz
International in
Belarus
Launch of CTC Love
Channel on cable
and satellite
Launch of Peretz
International in
Kyrgystan
Launch of Sweet me
brand together with
KupiVip
Launch of Russian
TV series in the US
on the HULU
subscription service
2

TRANSMEDIA
CTC-INTERNATIONAL (PAY-TV)
AD SALES
FREE-TO-AIR (CIS)
We Fully Capture the Value Chain by Being Integrated TV Broadcaster
BROADCASTING ( RUSSIA)
Free-to-air
TV ad maket growth1
International version of CTC channel
Mobile, smart TV, second screen, transmedia projects
Ctc.ru, Domashniy.ru, Peretz.ru
Online video portal Videomore.ru
CTC – target audience All 10-45
Domashny – target audience Females 25-59
Peretz – target audience All 25-49
International version of PERETZ channel
Kazakhstan Channel 31
Moldova СTС Dixi
Internal advertising sales house Everest
CTC Love – target audience All 11-34
3

Delivering on Strategic Priorities
Digital media revenue up
55% in RUB in 9M 2014
and continues to grow
Launch of Russian TV
series in the US on the
HULU subscription
service
Launch of the first e-
commerce project by a TV
company in Russia
Channels' websites
became full scale
platforms
New approach of
monetization throw
partnerships
Launched in-house
creative production center
Centralized content
purchases to secure
synergies, longer content
life span and sharing
among platforms
Centralized programming
to avoid cannibalization
Further steps towards
more local content
Prioritize content
and synergies
STRATEGIC GOAL: To become a leader in creation, management and distribution of content
on all potentially monetizable platforms
Grow combined
audience share
Expand digital
offerings
Diversify revenue
streams
1 2 3 4
Launch of CTC Love to
cover a further,
complementary audience
segment
New Head of Domashny
upgrades Channel’s
content and programming
4
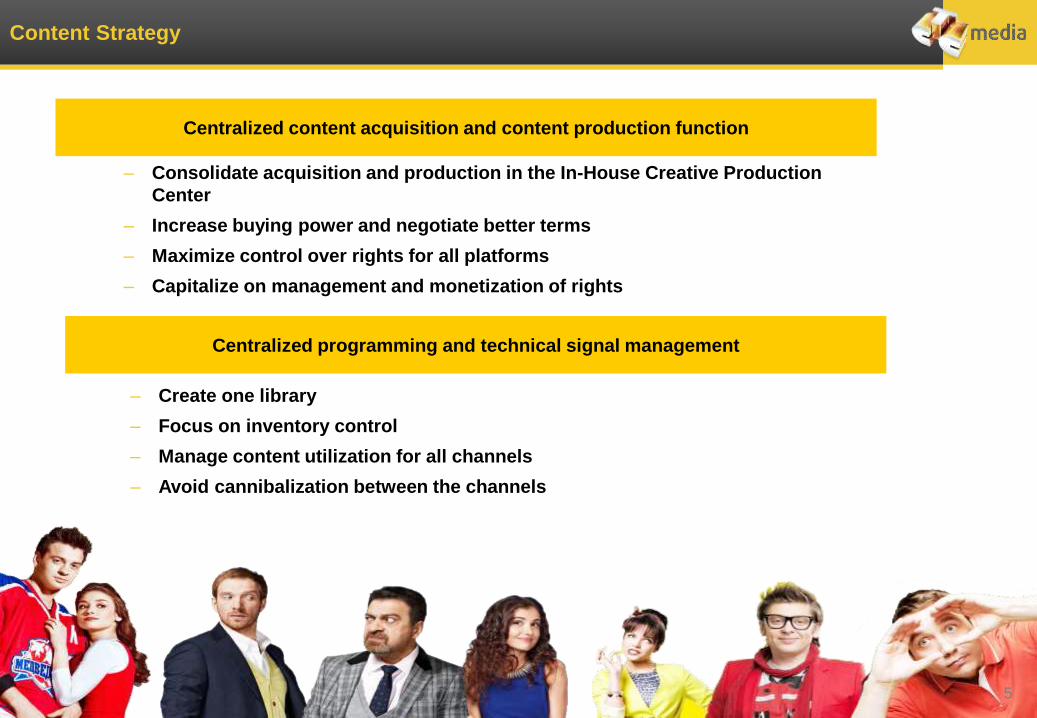
Content Strategy
– Consolidate acquisition and production in the In-House Creative Production
Center
– Increase buying power and negotiate better terms
– Maximize control over rights for all platforms
– Capitalize on management and monetization of rights
5 5
Centralized content acquisition and content production function
Centralized programming and technical signal management
– Create one library
– Focus on inventory control
– Manage content utilization for all channels
– Avoid cannibalization between the channels

Driving Operating Efficiency
Avoid multiple divisions and departments; consolidate under the top
management
Strategy core to CEO responsibility
Digital integrated with – and a continuation of – the TV business
– Take multiplatform approach to content creation and distribution
– Consolidate all channels’ digital activities in one division
Already centralized marketing, corporate communication, strategic programming
and content acquisitions
6
Create centralized structure with the potential to integrate
more businesses, channels and platforms
Keep the smart balance between the optimization and growth
Focus on developing and retaining young talent
Make all operations profitable
Significant increase of efficiency: no growth of headcount while growing
business and launching new channel

Combination of Growth, Profitability and Dividend Yield
GROWTH EFFICIENCY /
PROFITABILITY
RETURN CASH
TO SHAREHOLDERS
Operating in Europe’s third
largest1
Forecast for Russian TV
advertising market to grow up
1-3% in 2014, CTC Media strive
to outperform the market with
its Russian advertising revenue
OIBDA margin of 32.5% in 2013,
well above European TV
broadcasters average
High Group power ratio above 1.5x
compared to rivals due to attractive
audience profiles2
Strong cash flow generation and
net cash position
Over 50% cash dividend payout
More than 5% dividend yield in
2011, 2012 and 2013
Current dividend yield
approximately 12%, the highest
among European media
companies
+ +
Source: (1) Zenith Optimedia, April 2014 estimates
(2) Kommersant newspaper, 16 April 2013 (FY 2012 results). Power ratio = national TV ad revenue share / audience share in “all 4+” age group. Power ratio demonstrates relative effectiveness of audience monetization.
7

We Operate in Attractive Markets
Sources: Video International, Russian Association of Communications Agencies, ZenithOptimedia, CIA World Factbook, Rosstat, Russkiy Mir Foundation
Note: (*) All TV Ad Markets figures are net of VAT
Kazakhstan Population = 17.1 million
2012 TV Ad Market = US$ 128.6 million*
Russian-speaking population = 12.3 million
Kyrgyzstan Russian-speaking population = 3.6 million North America
Russian-speaking
population = 3.5 million
Germany Russian-speaking
population = 6 million
Russia Population = 143.7 million
2013 TV Ad Market = US$ 4.9 billion*
Israel Russian-speaking
population = 1.5 million
Moldova Population = 3.6 million
2012 TV Ad Market = US$ 17.1 million*
Baltic states Russian-speaking
population = 4 million
Since February 2012
CTC-International an
is available on the HOT
BIRDTM 8 satellite
(W/E Europe, North Africa,
Middle East and Central Asia
coverage)
Thailand Russian-speaking tourists = 1.3 million (2012)
Armenia, Georgia, Azerbaijan Russian-speaking population=10.4 mln
Belarus Russian-speaking population = 7 million
8
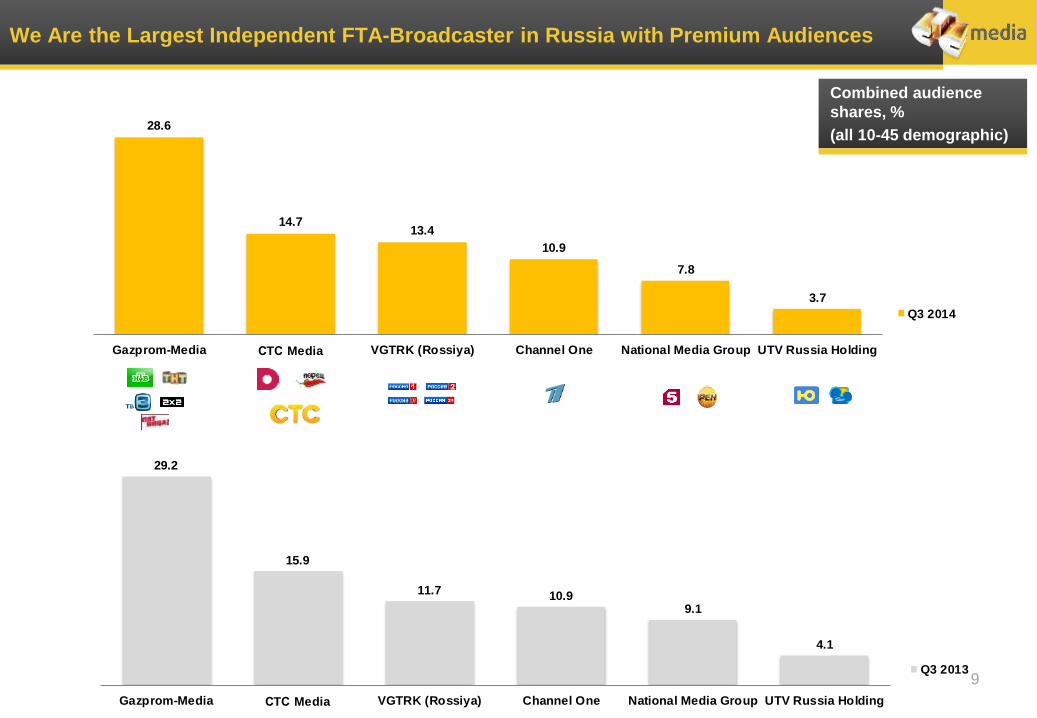
We Are the Largest Independent FTA-Broadcaster in Russia with Premium Audiences
Combined audience
shares, %
(all 10-45 demographic)
9
29.2
15.9
11.7 10.99.1
4.1
Gazprom-Media СTС Media VGTRK (Rossiya) Channel One National Media Group UTV Russia Holding
Q3 2013
28.6
14.713.4
10.9
7.8
3.7
Gazprom-Media СTС Media VGTRK (Rossiya) Channel One National Media Group UTV Russia Holding
Q3 2014
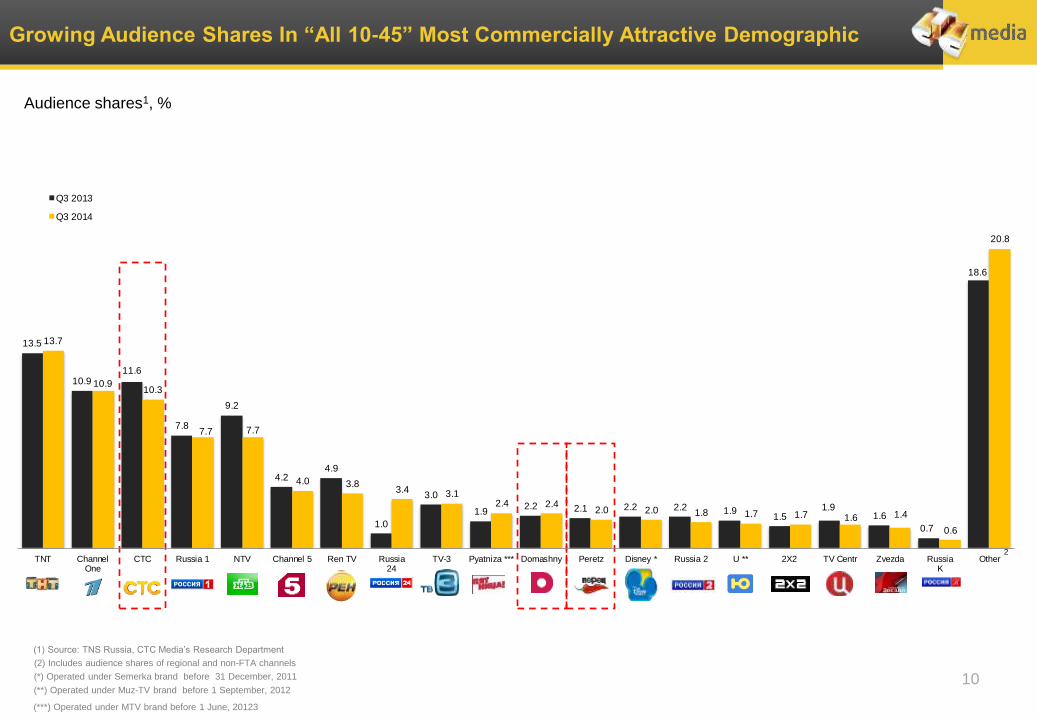
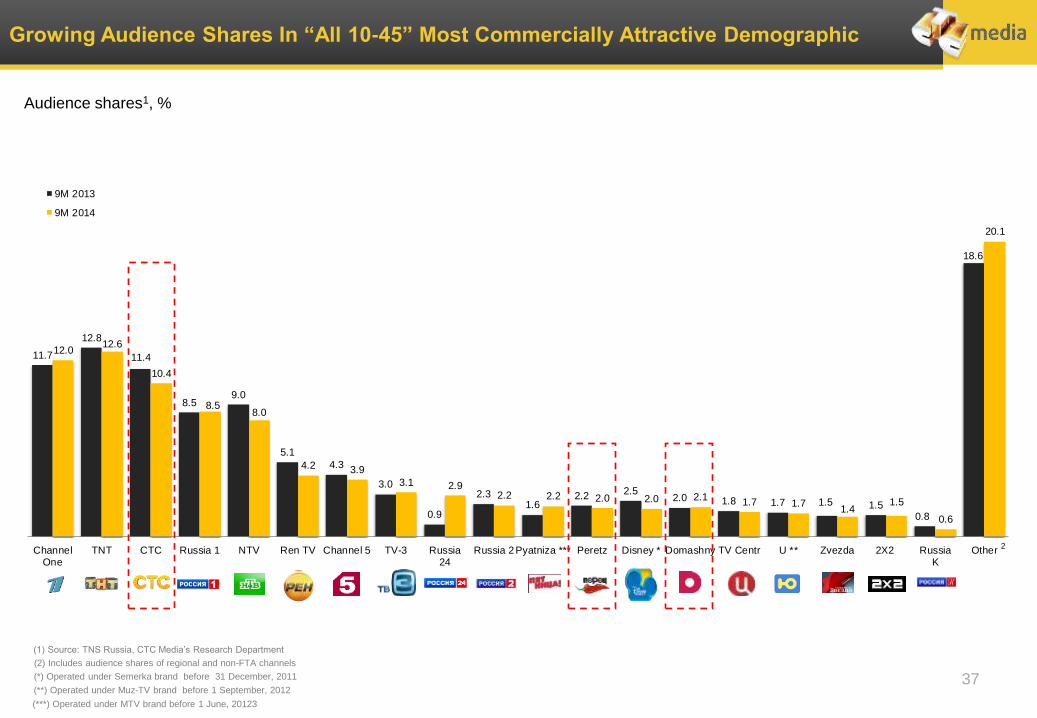
Growing Audience Shares In “All 10-45” Most Commercially Attractive Demographic
Audience shares1, %
(1) Source: TNS Russia, CTC Media’s Research Department
(2) Includes audience shares of regional and non-FTA channels
(*) Operated under Semerka brand before 31 December, 2011
(**) Operated under Muz-TV brand before 1 September, 2012
2
(***) Operated under MTV brand before 1 June, 20123
10
13.5
10.911.6
7.8
9.2
4.24.9
1.0
3.0
1.92.2 2.1 2.2 2.2 1.9
1.51.9
1.6
0.7
18.6
13.7
10.910.3
7.7 7.7
4.0 3.83.4 3.1
2.4 2.42.0 2.0 1.8 1.7 1.7 1.6 1.4
0.6
20.8
TNT ChannelOne
CTC Russia 1 NTV Channel 5 Ren TV Russia24
TV-3 Pyatniza *** Domashny Peretz Disney * Russia 2 U ** 2X2 TV Centr Zvezda RussiaK
Other
Q3 2013
Q3 2014
Growth Company Operating in a Dynamic Market

Digitalization in Russia Is on Its Way
First multiplex Second multiplex
12
Multiplex Expenses*, RUBm
P&L, RUBm (net of VAT) 2014 2014-2019
Current ~185
Savings ~700
Cash, RUBm (net of VAT) 2014 2015-2018
Current ~575
Savings ~300
OPEX savings
>5000
CASH savings
>4000
* per CTC + Domashny in Multiplex, annualy Part of cash payments are capitalized as prepaid expenses; to be written off to PnL in 2019 and subsequent years
Significant cost optimization have been achieved as a result of active positioning of CTC Media. We consider this to be a
huge achievement that will have a significant impact on current and future CTC Media Group financial performance in the
long-term period
The rollout of second digital multiplex has been modified as follows:
Instead of 100% infrastructure roll-out in 2015, beginning 2H 2014 RTRS launches broadcasting in cities with
population more than 50 thousand people in the second multiplex
Over the period 2015-2018, RTRS constructs broadcasting infrastructure in cities with population less than 50
thousand people, but does not put this infrastructure into operation
Starting from 2019 RTRS put into operations broadcasting units in cities with population less that 50 thousand
people.

USA Japan China Brazil UK Germany Russia
US
$ b
ln
Russian TV Ad Market Has Significant Potential for Further Development…
Russian TV ad market was #7 in the world and #3
in Europe in 20131 and is expected to maintain its
position by 2016
Free-to-air TV ad market growth1
RU
B
bln
Sources: (1) Zenith Optimedia, as of April 2014, Company’s estimates Note: All TV Ad Markets figures are net of VAT
64.3
22.5
16.4
11.8
5.4 5.4
5.0
42
11795
109129
140152
96
257
186
219
263
298
328
2004 2008 2009 2010 2011 2012 2013TV Ad Market Total Ad Market
13
1.4
1.7
0.9
1.2
0.90.9
0.80.7
0.6 0.6 0.6
1.6 1.6
1.0 1.01.0
0.8
0.7
0.5 0.5 0.5
0.4
Slo
ve
nia
Bu
lga
ria
Au
str
ia
US
A
Be
lgiu
m
UK
Ge
rma
ny
CE
E A
ve
rag
e
Russia
Ukra
ine
Po
lan
d
2008 2013
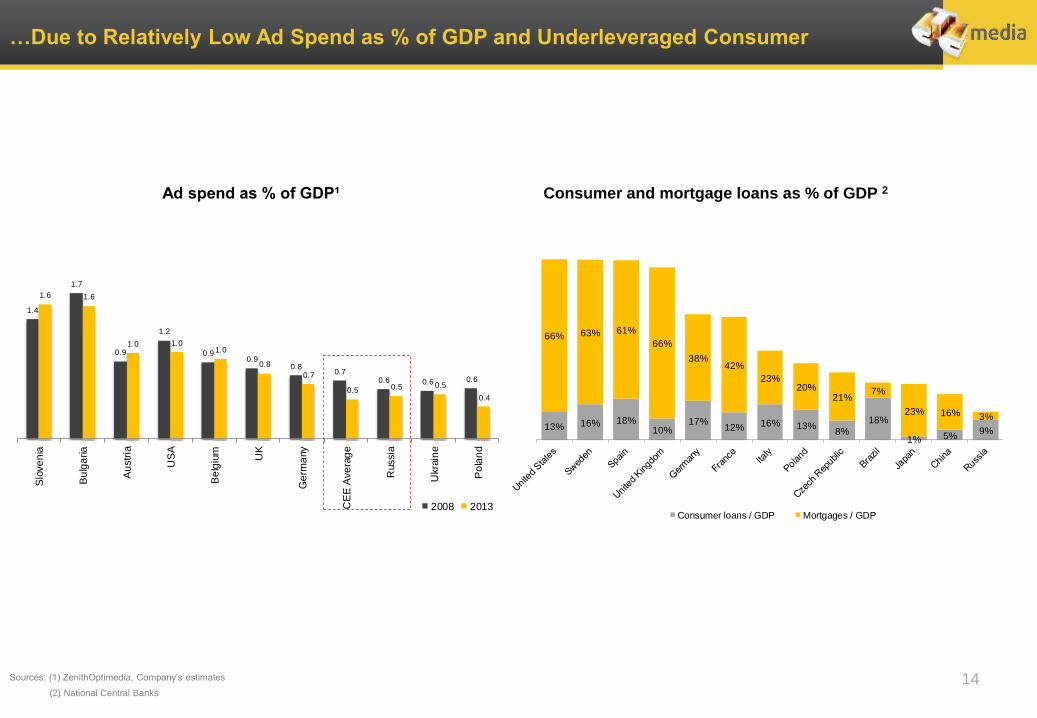
13% 16% 18%10%
17%12% 16% 13%
8%
18%
1% 5%9%
66% 63% 61%
66%
38%42%
23%20%
21%7%
23% 16% 3%
Consumer loans / GDP Mortgages / GDP
…Due to Relatively Low Ad Spend as % of GDP and Underleveraged Consumer
Ad spend as % of GDP¹
Sources: (1) ZenithOptimedia, Company’s estimates
(2) National Central Banks
Consumer and mortgage loans as % of GDP 2
14

TV is the only medium with truly national reach
Important social and cultural platform
More free-to-air networks than in other countries
High quality free-to-air content offering
TV Is the Most Attractive Advertising Medium in Russia
Ad spend in Russia by media segment1 (%)
Sources: (1) Russian Association of Communication Agencies, Video International
43%
1%
31%
18%
6%
0.4%
48%
22%
11%12%
5%2%
48%
30%
6%
10%
5%2%
TV Internet Press Outdoor Radio Other
2004 2013 2018F
15

232226
246 243 243
222
249251
133142
134
188210
170 169
166
5 613
2339
47
5866
4537
46 5144 40
42 41
2006 2007 2008 2009 2010 2011 2012 2013
TV
Radio
Internet
Other
Internet Is Growing Not at the Expense of TV Usage
Source: TNS Gallup Media, Russia
* Change in TNS Measurement panel in 2012 increase proportion of 2+ Tv-sets per household
TV Usage (Minutes per day, All 16+)
Min
ute
s p
er
da
y
*
But in “All 10-45” demographic
TV viewership was down 4%
16

We Continue to Deliver Strong Top and Bottom-line Growth…
Notes: (*) OIBDA is defined as operating income before depreciation and amortization (exclusive of amortization of programming and sublicensing rights. OIBDA margin is defined as OIBDA divided by total operating revenues. Both OIBDA and OIBDA margin
are non-GAAP financial measures (see reconciliations on page 48)
(**) 2008 OIBDA and OIBDA margin are adjusted to exclude a $232.7 million charge arising from the impairment of the intangible assets of DTV Group in Russia, Channel 31 in Kazakhstan and a broadcasting group in Moldova; 2009 OIBDA and
OIBDA margin are adjusted to exclude an $18.7 million charge arising from the impairment of the broadcasting licenses in Russia and a $28.6 million stock-based compensation expense recognized in conjunction with the previously announced
settlement by CTC Media of litigation brought by it against its former CEO; 2011 OIBDA and OIBDA margin are adjusted to exclude a $106.4 million charge arising from the impairment of several regional broadcasting licenses and the Peretz Network
goodwill; 2011 OIBDA and OIBDA margin are adjusted to $82.5 million non-recurring charge arising from the impairment of analog broadcasting licenses; 2013 OIBDA and OIBDA margin are adjusted to $29 million charge arising from the impairment of the
Company’s production unit in the fourth quarter 2013 (see reconciliations on page 46-47)
(***) Comparable-basis operating revenues are non-GAAP financial measures provided in order to facilitate period-to-period comparisons of CTC Media’s results following the implementation of the new model of advertising sales starting from 2011 (see
reconciliations on page 48)
(****) Following companies are included in European peers average OIBDA margin calculations: CME, TVN, S.A. Modern Times Group, Antena3, ITV plc, Metropole Television, Mediaset, ProSiebenSat, Mediaset Espana, TF1
US
$ m
ln
US
$ m
ln
181
273
427
532
730
574
680
766805
832
2004 2005 2006 2007 2008** 2009** 2010 2011** 2012** 2013**
(Comparable-basis) total operating revenues***
71
104
174
220
280
211221
247256
271
39%38%
41%
41%38%
37%
32% 32% 32% 33%
22%
26% 26% 27%
21%16%
21% 20% 16%21%
2004 2005 2006 2007 2008** 2009** 2010 2011** 2012** 2013**
OIBDA* OIBDA margin*, % Peers average OIBDA margin****,%
17

…and to Diversify Our Lines of Business
2004
Russian FTA
Broadcasting
100%
Sublicensing
~0.5% 3Q 2014
Russian FTA
Broadcasting
95%
69% 16%
10%
Channel 31
~3.0%
Digital Media
~1.0%
CTC-
International
~0.5%
18
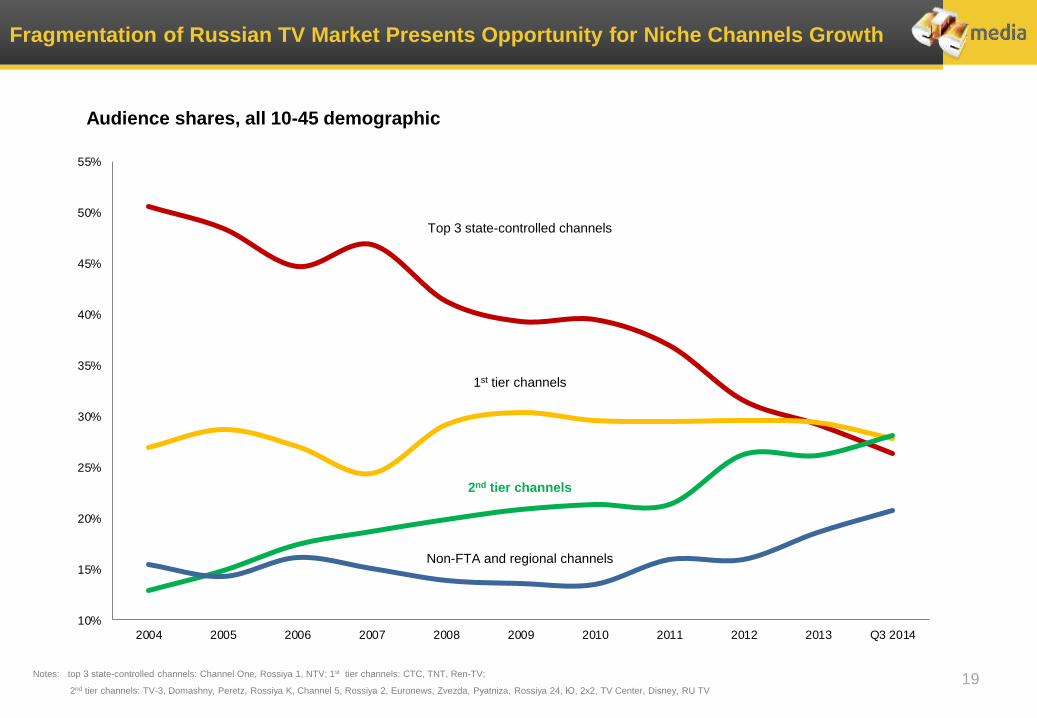
Fragmentation of Russian TV Market Presents Opportunity for Niche Channels Growth
Audience shares, all 10-45 demographic
Top 3 state-controlled channels
1st tier channels
2nd tier channels
Notes: top 3 state-controlled channels: Channel One, Rossiya 1, NTV; 1st tier channels: CTC, TNT, Ren-TV;
2nd tier channels: TV-3, Domashny, Peretz, Rossiya K, Channel 5, Rossiya 2, Euronews, Zvezda, Pyatniza, Rossiya 24, Ю, 2x2, TV Center, Disney, RU TV
Non-FTA and regional channels
19
10%
15%
20%
25%
30%
35%
40%
45%
50%
55%
2004 2005 2006 2007 2008 2009 2010 2011 2012 2013 Q3 2014

Audience Share Performance
CTC channel inventory was fully sold out in Q3
2014
Launch of new premier series with an audience
share higher than the channel’s average audience
share for the season: 80s (12.9%), Family Business
(12.1%), Angelica (11.3%)
CTC channel maintained its place as the third most-
watched broadcaster in Russia in its target
demographic of 10-45 yo viewers
20
Audience share growth from 3.1 in Q1 2014 to 3.7 in
Q3 2014
Successful changes in the programming schedule
in primetime slots
Launch restyle of a new logo and updated visual
format with a new motto “Forever for women” in
October
Despite some audience share loss year-on-year
Domashny continued to rejuvenate and its share
ratio of Woman 25-50 to Woman 25-59 improved
from 0.91 in 2013 to 0.98 in Q3 2014
Peretz increased its audience share from 1.9% in
Q2 2014 to 2.1% in Q3 2014
The channel remained affected by extensive news
flow about Ukraine with its reality and action
positioning and male skewed audience
Repositioning and programming grid improvement
are on track
11.6
10.3
11.4
10.4
Q3'13 Q3'14 9M'13 9M'14
3.93.7
3.5 3.4
Q3'13 Q3'14 9M'13 9M'14
2.3
2.1
2.4
2.1
Q3'13 Q3'14 9M'13 9M'14

CTC Improves Its Target Audience Profile in Commercially Attractive Demographic
Sources: TNS Russia
21

Domashny Improves Affinity in Its Target Demographic
Sources: TNS Russia 22

Peretz Improves Audience Profile In Commercially Attractive Young Adults Demographics
Sources: TNS Russia 23

Stable Consumer Goods Client Base with Large Multi-National and Local Advertisers
Ad spending on CTC Media’s Russian channels by category
■ Vast majority of CTC Media’s Russian advertisers are
basic consumer goods focused
■ CTC Media’s advertisers’ budgets split:
80% multinationals, 20% local companies
■ 38% of ad revenue** came from top 10 clients in Q3 2014
Notes: (*) National advertising sales for CTC, Domashny and Peretz Networks
(**) Total Russian advertising sales for CTC, Domashny and Peretz Channels
*
24
3Q 2013 3Q 2014
1 Food and beverages 24% 26%
2 Cosmetics and personal care products 19% 22%
3 Other goods 15% 16%
4 Pharmaceuticals and vitamins 17% 15%
5 Telecoms 8% 7%
6 Auto 3% 5%
7 Detergents 4% 4%
8 Appliances 4% 3%
9 Retail 5% 3%
10 Finance 1% 1%

Developing in Attractive CIS, International and Transmedia Markets

10.011.9
16.9
23.6
25.8
FY 2009 FY 2010 FY 2011 FY 2012 FY 2013
Revenue OIBDA margin
Strong Market Positions in Kazakhstan
Channel 31, Kazakhstan (all 6-54 demographics)* Significant growth in Kazakhstan revenue and OIBDA margin
US
$ m
ln
Source: (*) TNS Central Asia
** Measured since March 1, 2014
17.4% 21.8%
30.4%
16.2%
Power ratio up to 1.2x from 1.0x
31.0% 11.6% 11.2%
15.2% 14.7%
13.2%
11%12%
14%
17%
18%
FY 2009 FY 2010 FY 2011 FY 2012 FY 2013
Target audience share Market share
#2 among Top-10 Kazakh channels
26
22.0
14.1 14.3
12.2
6.1
8.17.1
3.7
1.8
20.3
14.9
13.5
10.4
8.98.1
6.3
4.43.7 3.3
Channel 1 Channel 31 KTK NTK Astana Kazakhstan Channel 7 RTRPlaneta (KZ) **
Habar Mir
Q3 2013
Q3 2014

Plus We Continue to Expand Internationally…
Thailand July 2012 – Thai Media Export cable network
Armenia
Georgia
Azerbaijan
May 2012 – Caucasus cable networks 10.4 mln
Kyrgyzstan April 2012 – Europe-Asia cable and satellite network 2.5 mln
Europe
North Africa Middle East
Central Asia
February 2012 – uplink service HOT BIRDTM
Kazakhstan February 2012 – Digital TV; Icon TV 12.3 mln
Baltic States October 2011 – Viasat Broadcasting 4 mln
Germany March 2011 – Kartina TV IPTV 6 mln
Israel June 2011 – Hot; Yes 1.5 mln
North America
December 2009 – Dish
May 2011 – Time Warner; RMG
October 2011 – Cablevision
2013 - Comcast 3.5 mln
Increasing CTC Media’s international brand awareness & value through CTC-international and
Peretz-International
Total Russian-speaking population 47.2 mln
Russian-speaking
population
Belarus October 2013 – Beltelecom (Zala), MTIS, Cosmos-TV cable networks 7 mln
27

Special Projects
■ Successful launch of 7 transmedia projects with total revenues of 124 million rubles - PepsiCo,
BEKO, Unilever (Lipton, Dove), Novartis (Theraflu), Beiersdorf (Nivea), HERO Rus (Corny)
Partnerships
Odnoklassniki – The project successfully launched in September 2014
Game Insight – A unique for Russia project with games developer for mobile and social platforms to
be launched in December 2014
Yandex – The partnership to be launched by the end of 2014
Vkontakte, Rambler&Co – Projects are under active development
28
Digital Partnerships and Transmedia Projects
■ First ever in Russia second screen App to be launched simultaneously with premier TV series of
Youth League (Molodezhka) in November’ 2014

…and Enter New Platforms to Be Wherever Our Viewers Are
29
Strong and Flexible Financial Position

Q3 and 9M 2014 Financial Highlights
31
2013 2014 in USD in RUB 2013 2014 in USD in RUB
Total operating revenues 171 084 158 567 -7% 3% 572 386 529 126 -8% 4%
Total operating expenses (126,897) (114,307) -10% 0% (436,620) (398,107) -9% 2%
OIBDA 52 337 50 629 -3% 9% 160 739 152 040 -5% 7%
OIBDA margin 30.6% 31.9% 28.1% 28.7%
Net income/(loss) attributable to CTC
Media, Inc. stockholders 46 655 31 595 -32% -24% 106 836 89 472 -16% -5%
Diluted earnings per share $0.30 $0.20 -33% $0.68 $0.57 -16%
Nine Months
Ended September 30, Change(US$ 000’s except per share data)
Three Months
Ended September 30, Change

Q3 and 9M 2014 Balance Sheet and Cash Flow Highlights
Consolidated Balance Sheet Highlights Consolidated Cash Flow Highlights
Notes: (1) Working capital = current assets - current liabilities
(2) Net cash position = cash and cash equivalents + short-term investments - total debt
(3) Free cash flow = cash flow from operating activities - acquisitions of property and equipment and intangible assets
32
(US$ mln)As of December 31,
2013
As of September 30,
2014
Cash and cash equivalents 30.6 29.8
Short-term investments 180.3 122.0
Total assets 971.0 828.2
including goodwill 135.3 112.4
including broadcasting licenses 59.7 41.4
including programming rights 294.0 258.3
Working capital1 311.9 249.5
Stockholders’ equity 734.1 615.1
Net cash position2 207.5 149.0
(US$ mln)Nine months ended
September 30, 2013
Nine months ended
September 30, 2014
Cash at beginning of period 55.2 30.6
Net cash provided by operating activities 64.5 55.0
including acquisition of progr. and sublic. rights (282.5) (273.2)
Net cash used in investing activities 22.2 33.1
including CapEx (3.5) (3.8)
including receipts from/(investments in) deposits 26.2 36.9
Net cash used in financing activities (111.5) (87.0)
Cash at end of period 27.8 29.8
CapEx (3.5) (3.8)
CapEx as % of total revenue 0.6% 0.7%
Free cash flow3 61.0 51.2

36%
33%
27% 27% 27%29%
32%
2007 2008 2009 2010 2011 2012 2013
High Levels of Cash Conversion and Return on Capital Employed
2007-2013
average
ROCE: 30%
% of OIBDA Converted to Operating Cash Flow Return on Capital Employed*
Note: (*) ROCE excludes one-off non-cash asset impairment charges recognized in 2008, 2009, 2011, 2012 and 2013
US
$ m
ln
158
186
133
186
116
158
187
72%66% 63%
84%
47%
62%69%
0
20
40
60
80
100
120
140
160
180
200
2007 2008 2009 2010 2011 2012 2013
Operating Cash Flow % of OIBDA converted
33

Strong Management Team
Yuliana Slashcheva
Chief Executive Officer • Joined CTC Media in 2013
• 20 years in high growth media
related businesses
• Vast executive experience
• Experience in creating and
managing digital development
projects
Nikolay Surikov
Chief Financial Officer • Joined CTC Media in 2012
• Almost 20 years experience in
finance
• Previously with Ernst & Young,
VTB and MTS
Julia Moskvitina
Chief Commercial Officer • Joined CTC Media in 1999
• 15 years experience in advertising
sales
Sergey Petrov
Chief Broadcasting Officer • Joined CTC Media in 1995
• 20 years experience in TV industry
Viacheslav Murugov
Chief Content Officer • Joined CTC Media in 2005
• Over 15 years in media industry
• Acclaimed producer of numerous
award winning TV shows
Lilia Omasheva
Chief of Operational Efficiency and
Organizational Development • Joined CTC Media in 2013
• 10 years experience in advertising
industry
34

CTC Media Shareholder Structure
CTC Media, Inc.
Shareholder of CTC Media
since 2002
Modern Times Group
MTG AB
39%
Number of common shares outstanding
(as of October 29, 2014)
Shareholder of CTC Media
since 2011
Telcrest Investments
Limited
25%
IPO on NASDAQ in June 2006
Free float
36%
155,762,166
Mathias Hermansson
Director
Irina Gofman
Director
Jørgen Madsen Lindemann
Co-chairman
Board of Directors
Independent Directors
Angelo Codignoni
Co-Chairman
Alexander Pentya
Director
Timur Weinstein
Director
Tamjid Basunia
Director
Werner Klatten
Director
Jean-Pierre Morel
Director
35

Appendix
11.7
12.8
11.4
8.59.0
5.1
4.3
3.0
0.9
2.31.6
2.22.5
2.0 1.8 1.7 1.5 1.50.8
18.6
12.012.6
10.4
8.58.0
4.2 3.9
3.1 2.92.2 2.2 2.0 2.0 2.1
1.7 1.71.4
1.5
0.6
20.1
ChannelOne
TNT CTC Russia 1 NTV Ren TV Channel 5 TV-3 Russia24
Russia 2Pyatniza *** Peretz Disney * Domashny TV Centr U ** Zvezda 2X2 RussiaK
Other
9M 2013
9M 2014
Growing Audience Shares In “All 10-45” Most Commercially Attractive Demographic
Audience shares1, %
(1) Source: TNS Russia, CTC Media’s Research Department
(2) Includes audience shares of regional and non-FTA channels
(*) Operated under Semerka brand before 31 December, 2011
(**) Operated under Muz-TV brand before 1 September, 2012
2
(***) Operated under MTV brand before 1 June, 20123
37

13.5
12.0
12.7
7.47.0
5.85.0
1.2
2.9 2.7 2.72.2 2.5
1.9 1.71.1
1.7
1.0 0.8
17.5
13.6
12.6
11.3
7.3
6.0 5.7
3.8 3.7
2.92.6 2.5 2.4
1.8 1.6 1.6 1.4 1.4 0.90.8
19.1
ChannelOne
Russia 1 NTV TNT CTC Channel 5 Ren TV Russia 24 TV Centr Domashny TV-3 Zvezda Russia 2 Peretz Disney * Pyatniza *** Russia K U ** 2X2 Other
Q3 2013
Q3 2014
Audience Shares In “All 4+” Demographic
(1) Source: TNS Russia, CTC Media’s Research Department
(2) Includes audience shares of regional and non-FTA channels
Audience shares1, %
(*) Operated under Semerka brand before 31 December, 2011
(**) Operated under Muz-TV brand before 1 September, 2012
2
(***) Operated under MTV brand before 1 June, 20123
38

Audience Shares In “All 4+” Demographic
(1) Source: TNS Russia, CTC Media’s Research Department
(2) Includes audience shares of regional and non-FTA channels
Audience shares1, %
(*) Operated under Semerka brand before 31 December, 2011
(**) Operated under Muz-TV brand before 1 September, 2012
2
(***) Operated under MTV brand before 1 June, 20123
39
13.7
12.812.9
7.16.9
5.75.3
2.9
1.1
2.62.4 2.5
2.1 1.9 1.8 1.7
0.9 0.9 0.8
17.3
14.4
13.4
11.6
6.7
6.05.5
4.2
3.0 3.2
2.52.2 2.4 2.3
1.7 1.5 1.41.2 0.9
0.7
18.5
ChannelOne
Rossiya 1 NTV TNT CTC Channel 5 Ren-TV TV Center Rossiya 24 TV-3 Rossiya 2 Domashny Zvezda Peretz Disney* Rossiya K Pyatnica*** U** 2x2 Other
9M 2013
9M 2014

87%
65%
54%
88%
71%
61%
91%
76%
68%
94%
82%
73%
95%
85%80%
95%
89%
84%
95%90%
85%
Consistent Growth in Technical Penetration
Note: (1) Technical penetration means the percentage of the population that has the technical ability to receive a particular broadcast signal. Measured annually by TNS Gallup Media in cities with populations of more than 100,000
Technical Penetration1, %
2007 2008 2009 2010 2011 2012 2013 2007 2008 2009 2010 2011 2012 2013 2007 2008 2009 2010 2011 2012 2013
40
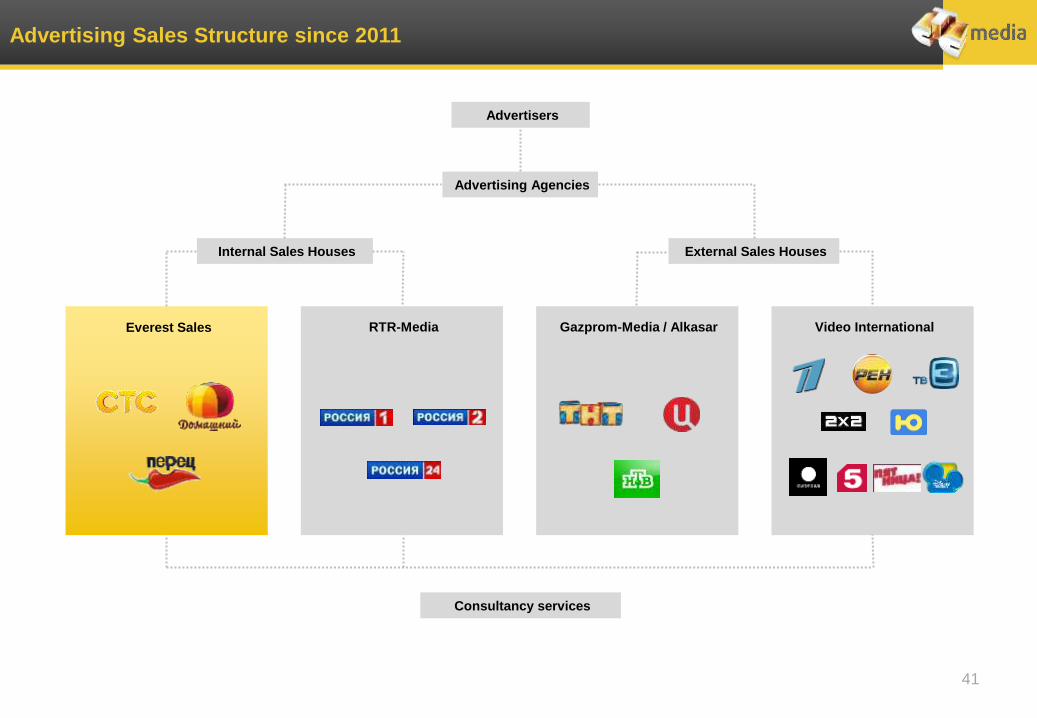
Advertising Sales Structure since 2011
Advertisers
Advertising Agencies
Internal Sales Houses External Sales Houses
Everest Sales RTR-Media Gazprom-Media / Alkasar Video International
Consultancy services
41

Operating Expenses
as % of total operating
expenses
as % of total operating
revenues
$171.1 mln $158.6 mln $114.3 mln $126.9 mln
42
55% 55%
41% 40%
30% 30%
22% 21%
8% 9%
6%6%
0% 1%
0%0%
6% 6%
5%4%
Q3 2013 Q3 2014 Q3 2013 Q3 2014
Depreciation & amortization
Stock-based compensation
Direct operating expenses
SG&A expenses
Programming expenses

FY 2013 Income Statement Highlights
2012 2013 in USD in RUB
Total operating revenues 804,946 832,103 3% 7%
Total operating expenses (655,059) (624,404) -5% -2%
Total operating expenses before non-
recurring items (572,556) (594,535) 4% 7%
OIBDA 173,905 240,815 nm nm
OIBDA margin 21.6% 28.9%
Adjusted OIBDA 256,408 270,684 6% 10%
Adjusted OIBDA margin 31.9% 32.5% 0.6pp
Net income/(loss) attributable to CTC
Media, Inc. stockholders 93,063 152,340 nm nm
Diluted earnings per share $0.59 $0.97 nm
Adjusted Net income/(loss)
attributable to CTC Media, Inc.
stockholders
157,794 182,209 15% 19%
Adjusted Diluted earnings per share $1.00 $1.16 16%
Twelve Months
Ended December 31, Change(US$ 000’s except per share data)
43
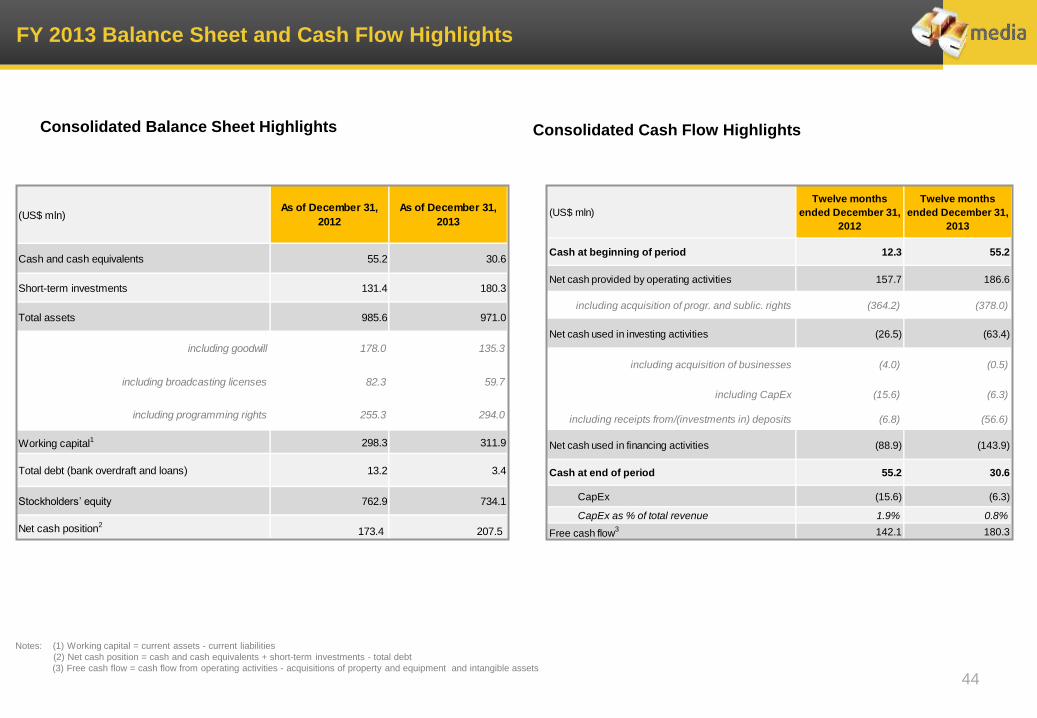
(US$ mln)As of December 31,
2012
As of December 31,
2013
Cash and cash equivalents 55.2 30.6
Short-term investments 131.4 180.3
Total assets 985.6 971.0
including goodwill 178.0 135.3
including broadcasting licenses 82.3 59.7
including programming rights 255.3 294.0
Working capital1 298.3 311.9
Total debt (bank overdraft and loans) 13.2 3.4
Stockholders’ equity 762.9 734.1
Net cash position2173.4 207.5
(US$ mln)
Twelve months
ended December 31,
2012
Twelve months
ended December 31,
2013
Cash at beginning of period 12.3 55.2
Net cash provided by operating activities 157.7 186.6
including acquisition of progr. and sublic. rights (364.2) (378.0)
Net cash used in investing activities (26.5) (63.4)
including acquisition of businesses (4.0) (0.5)
including CapEx (15.6) (6.3)
including receipts from/(investments in) deposits (6.8) (56.6)
Net cash used in financing activities (88.9) (143.9)
Cash at end of period 55.2 30.6
CapEx (15.6) (6.3)
CapEx as % of total revenue 1.9% 0.8%
Free cash flow3 142.1 180.3
FY 2013 Balance Sheet and Cash Flow Highlights
Consolidated Balance Sheet Highlights Consolidated Cash Flow Highlights
Notes: (1) Working capital = current assets - current liabilities
(2) Net cash position = cash and cash equivalents + short-term investments - total debt
(3) Free cash flow = cash flow from operating activities - acquisitions of property and equipment and intangible assets
44

Reconciliation of Non-GAAP Measures
Reconciliation of consolidated adjusted OIBDA and other adjusted financial measures to consolidated OIBDA and other
corresponding GAAP financial measures
45
(US$ 000’s except per share data) OIBDATotal operating
expenses
Operating
income
Income before
income tax and
noncontrolling
interest
Income tax
expenseNet income
Fully diluted
earnings per
share
Twelve Months Ended December 31, 2013
Adjusted non-US GAAP results $270 684 ($594 535) $237 568 $251 365 ($61 335) $182 209 $1.16
Impact of impairment loss (29 869) (29 869) (29 869) (29 869) - (29 869) 0.19
Results as reported
(under US GAAP, except for OIBDA which is a non-US GAAP
financial measure) 152 340 $0.97 $240 815 (624 404) 207 699 221 496 (61 335)
(US$ 000’s except per share data) OIBDATotal operating
expenses
Operating
income
Income before
income tax and
noncontrolling
interest
Income tax
expenseNet income
Fully diluted
earnings per
share
Twelve Months Ended December 31, 2012
Adjusted non-US GAAP results $256 408 ($572 556) $232 390 $247 192 ($82 645) $157 794 $1.00
Impact of impairment loss (82 503) (82 503) (82 503) (82 503) 17 772 (64 731) (0.41)
Results as reported
(under US GAAP, except for OIBDA which is a non-US GAAP
financial measure) $173 905 ($655 059) $149 887 $164 689 ($64 873) $93 063 $0.59

USD mln 9M 2014 9M 2013 Q3 2014 Q3 2013 FY 2013 FY 2012 FY 2011 FY 2010 FY 2009 FY 2008 FY 2007 FY 2006 FY 2005 FY 2004
Operating margin 24.8% 23.7% 27.9% 25.8% 25.0% 18.6% 16.0% 34.4% 30.1% 5.3% 40.9% 41.6% 38.0% 40.2%
Add: depreciation and
amortization as
percentage of revenue
3.9% 4.4% 4.0% 4.8% 4.0% 3.0% 2.3% 2.3% 2.3% 2.1% 5.8% 5.3% 5.8% 5.1%
OIBDA margin 28.7% 28.1% 31.9% 30.6% 28.9% 21.6% 18.3% 36.7% 32.4% 7.4% 46.7% 46.9% 43.8% 45.3%
USD mln 9M 2014 9M 2013 Q3 2014 Q3 2013 FY 2013 FY 2012 FY 2011 FY 2010 FY 2009 FY 2008 FY 2007 FY 2006 FY 2005 FY 2004
Operating income (loss) 131 019 135 766 44 260 44 187 207 699 149 887 122 685 207 118 152 475 34 181 193 061 154 313 90 187 62 559
Add: depreciation and
amortization21 021 24 973 6 369 8 150 33 116 24 018 17 649 13 736 11 454 13 379 27 361 19 651 13 920 7 962
OIBDA 152 040 160 739 50 629 52 337 240 815 173 905 140 334 220 854 163 929 47 560 220 422 173 964 104 107 70 521
Reconciliation of Non-GAAP Measures (continued)
Reconciliation of consolidated OIBDA margin to consolidated operating income margin
USD mln 2004 2005 2006 2007 2008 2009 2010
Comparable-basis total operating
revenues180,639 273,352 427,091 532,143 729,629 574,107 680,418
Agency commission fees payable to
Video International in connection
with Russian advertising sales
(excluding commissions for regional
advertising sales to local clients)
(25,072) (35,875) (56,257) (60,087) (89,458) (67,994) (79,133)
Total operating revenues 155,567 237,477 370,834 472,056 640,171 506,113 601,285
Reconciliation of consolidated OIBDA to consolidated operating income
Reconciliation of comparable-basis, non-GAAP total operating revenues to total operating revenues
46

Reconciliation of Non-GAAP Measures
Reconciliation of consolidated adjusted OIBDA and other adjusted financial measures to consolidated OIBDA and other
corresponding GAAP financial measures
(US$ 000’s except per share data) OIBDA
Total
operating
expenses
Operating
income
(loss)
Income (loss)
before income tax
and noncontrolling
interest
Income tax
expenseNet income (loss)
Fully diluted
earnings per
share
Twelve months ended December 31, 2011
Adjusted non-US GAAP results $246,716 ($537,293) $ 229,067 $ 243,301 ($83,342) $ 152,561 $ 0.97
Impact of impairment loss (106,382) (106,382) (106,382) (106,382) 6,939 (99,443) (0.63)
Results as reported
(under US GAAP, except for OIBDA which is a non-US GAAP
financial measure) $ 0.34 $140,334 ($643,675) $ 122,685 $ 136,919 ($76,403) $ 53,118
Twelve months ended December 31, 2009
Adjusted non-US GAAP results $87,382 ($96,460) $84,047 $87,585 ($20,759) $64,466 $0.41
Impact of non-cash intangible asset impairment charge (18,739) (18,739) (18,739) (18,739) 3,748 (14,991) (0.10)
Impact of Stock-based compensation expense related to
settlement of litigation against former executive (28,588) (28,588) (28,588) (28,588) - (28,588) (0.18)
Results as reported (under US GAAP, except for OIBDA,
which is a non-GAAP financial measure) $163,929 ($353,638) $152,475 $148,645 ($45,626) $100,389 $0.64
Twelve months ended December 31, 2008
Adjusted non-US GAAP results $280,241 ($94,636) $92,712 $74,266 ($1,653) $64,635 $1.11
Impact of non-cash impairment of intangible assets of DTV,
Kz and Moldova (232,683) (232,683) (232,683) (232,683) 30,331 (153,679) (0.97)
Results as reported
(under US GAAP, except for OIBDA) $28,678 ($89,044) $0.14 $47,558 ($327,319) ($139,971) ($158,417)
47
Contact Information and Disclaimer
For further information please visit www.ctcmedia.ru or contact:
Nickolai Ivanov
Head of Investor Relations E-mail: [email protected]
Tel: +7 (495) 981 0740
DISCLAIMER
• The information contained in this presentation, including market data that are attributed to specific sources and have not been independently
verified. No representation, warranty or undertaking, express or implied, is made as to, and no reliance should be placed on, the fairness, accuracy,
completeness or correctness of the information or the opinions contained herein. None of the Company or any of its affiliates, advisors or representatives shall
have any liability whatsoever (in negligence or otherwise) for any loss howsoever arising from any use of this presentation or its contents or otherwise arising
in connection with the presentation.
• The presentation is not an offer of securities for sale in the United States. Neither the presentation nor any copy of it may be taken or transmitted into
or distributed in the United States of America or to any U.S. person within the meaning of Regulation S under the United States Securities Act of 1933, as
amended (the “Securities Act”).
• This presentation is not a public offer or advertisement of securities in the Russian Federation, and is not an offer, or an invitation to make offers, to
purchase any securities in the Russian Federation.
• Certain statements in this presentation that are not based on historical information are "forward-looking statements" within the meaning of the Private
Securities Litigation Reform Act of 1995. Such forward-looking statements include, among others, Russian advertising market growth, roll-out of digital
broadcasting in 2014 – 2019 and ability of RTRS to put into operation equipment for digital broadcasting, TV ad spend in Russia by 2018 and etc. These
statements reflect the Company's current expectations concerning future results and events. These forward-looking statements involve known and unknown
risks, uncertainties and other factors which may cause the actual results, performance or achievements of CTC Media to be materially different from any future
results, performance or achievements expressed or implied by such forward-looking statements. The potential risks and uncertainties that could cause actual
future results to differ from those expressed by forward-looking statements include, among others, changes in the size of the Russian television advertising
market; the roll-out of digital broadcasting in Russia; depreciation of the value of the Russian ruble compared to the US dollar; geopolitical events involving
Russia and the other countries in which the Company operates, including any potential negative economic impact of such events; the Company’s ability to
deliver audience share, particularly in primetime, to its advertisers; free-to-air television remaining a significant advertising forum in Russia; and restrictions on
foreign involvement in the Russian television business. These and other risks are described in the "Risk Factors" section of CTC Media's annual report on
Form 10-K filed with the SEC on March 6, 2014. Other unknown or unpredictable factors could have material adverse effects on CTC Media's future results,
performance or achievements. In light of these risks, uncertainties, assumptions and factors, the forward-looking events discussed herein may not occur. You
are cautioned not to place undue reliance on these forward-looking statements. CTC Media does not undertake any obligation to publicly update or revise any
forward-looking statements because of new information, future events or otherwise.
48