ctd report 2017001gu - nefsc.noaa.gov . oceans and climate branch ctd data report . noaa fisheries...
TRANSCRIPT

CTD_REPORT_2017001GU.pdf Oceans and Climate Branch CTD Data Report NOAA Fisheries Service Northeast Fisheries Science Center Woods Hole, MA 02543 GU 1701 2017 Spring ECOMON Survey Data Coverage: May 16 – June 07, 2017 Mid Atlantic Bight, Georges Bank, and Gulf of Maine This report presents a summary of surface and bottom temperature and salinity data collected during the Northeast Fisheries Science Center’s 2017 ECOMON Survey aboard the NOAA Ship Gordon Gunter. All data was obtained with a Seabird Electronics SBE Model 9/11+ CTD (s/n 0420) and a NMFS SBE19+V2 Seacat profiling CTD (s/n 7143). Salt water samples were collected for the purpose of calibrating the conductivity cell. The SBE19+ was deployed on 134 double oblique bongo casts and 8 vertical and water sampling casts. The SBE9/11+ was used successfully on 31 stations. Data presented here have been audited; however, corrections and/or updates may be applied at a later time. The most recent and complete station data can be found in an NODCformatted ASCII file. This report may be viewed on the Oceans and Climate Branch website choose: 2017 Cruises MAY_ECOMON_GU1701 CTD_REPORT_2017001GU.pdf Revised: July 18, 2017

-76 -74 -72 -70 -68 -66
LONGITUDE
35
36
37
38
39
40
41
42
43
44
LAT
ITU
DE
1234567
891011
1213
14
1516
17
19
2021
2223
24
252627
30
3132
3334
35
38
41
424344
45
46
484849
50
51
5254 575758
59
6061
6265
666768 69 70
71
72 7575
767879
8081
838486878890
9192
93 94 95
969798 99
100
102103
105106107108
109
110
111112113114
115116117
118119 120
122123124
125125126126127
128128
130130
131131
132
133
134136137
138139140
141142
143
144145
147148
149150
151152153154154155156
157158
18
2829
3637 3940
47
53
5556
6364
7374
778285
89
101
104
121
122127
129
133
135
144145146147
GOMWEST GOM
EAST
GEORGESBANK
MABNORTH
MABSOUTH
GU 1701 ECOMONMay 16 - June 7, 2017Station Positions
Seacat 19+ Stations
CTD 9/11+ Stations

Areal average surface and bottom temperature/salinity and temperature/salinity anomalies for the GU1701 ECOMON Survey
May 16 - June 7, 2017
SURFACE BOTTOM
CRUISE CD #obs T/S Anomaly SDV1 SDV2 Flag #obs T/S Anomaly SDV1 SDV2 Flag Purpose
Western Gulf of Mainegu1701 155 19 10.42 0.11 0.23 0.87 0 17 6.49 1.08 0.20 0.56 0 22gu1701 155 19 31.83 -0.32 0.10 0.49 0 17 33.07 -0.21 0.07 0.21 0 22
Eastern Gulf of Mainegu1701 154 17 9.50 0.38 0.24 0.62 0 11 8.77 1.30 0.35 0.61 0 22gu1701 154 17 32.02 -0.37 0.11 0.19 0 11 34.41 -0.10 0.08 0.33 0 22
Georges Bankgu1701 149 32 9.15 0.20 0.22 0.94 0 32 8.59 0.70 0.23 0.70 0 22gu1701 149 32 32.64 -0.25 0.08 0.30 0 32 32.97 -0.22 0.08 0.25 0 22
MAB Northgu1701 145 32 11.13 -0.10 0.29 0.65 0 32 8.61 1.07 0.31 1.63 0 22gu1701 145 32 32.40 -0.11 0.13 0.57 0 32 33.13 -0.19 0.11 0.32 0 22
MAB Southgu1701 139 46 14.82 0.78 0.27 1.09 0 43 9.88 0.84 0.31 1.50 0 22gu1701 139 46 32.30 0.06 0.16 0.99 0 43 33.35 -0.12 0.11 0.38 0 22
"CRUISE", the code name for a cruise: "CD", the calendar mid-date of all the stations within a region for a cruise:"#obs", the number of observations include in each average: "T/S", the areal average temp/salt: "Anomaly", the areal average temp/salt anomaly:"SDV1", the standard deviation associated with the average temp/salt anomaly: "SDV2", the standard deviation of the individual anomalies from which the average anomaly was derived"Flag", a value of "1" indicates that a true areal average could not be calculated due to poor station coverage. The areal averages listed were derived from a simple average of the observations within the region."Purpose", 2 digit code assigned by DMS to identify a unique NEFSC program survey.

-76 -74 -72 -70 -68 -66
LONGITUDE
35
36
37
38
39
40
41
42
43
44
LAT
ITU
DE
GU 1701 ECOMONMay 16 - June 07, 2017Surface Temperature (deg C)

-76 -74 -72 -70 -68 -66
LONGITUDE
35
36
37
38
39
40
41
42
43
44
LAT
ITU
DE
GU 1701 ECOMONMay 16 - June 07, 2017Surface Temperature Anomaly (deg C)

-76 -74 -72 -70 -68 -66
LONGITUDE
35
36
37
38
39
40
41
42
43
44
LAT
ITU
DE
GU 1701 ECOMONMay 16 - June 07, 2017Surface Salinity

-76 -74 -72 -70 -68 -66
LONGITUDE
35
36
37
38
39
40
41
42
43
44
LAT
ITU
DE
GU 1701 ECOMONMay 16 - June 07, 2017Surface Salinity Anomaly

-76 -74 -72 -70 -68 -66
LONGITUDE
35
36
37
38
39
40
41
42
43
44
LAT
ITU
DE
GU 1701 ECOMONMay 16 - June 07, 2017Bottom Temperature (deg C)

-76 -74 -72 -70 -68 -66
LONGITUDE
35
36
37
38
39
40
41
42
43
44
LAT
ITU
DE
GU 1701 ECOMONMay 16 - June 07, 2017Bottom Temperature Anomaly (deg C)

-76 -74 -72 -70 -68 -66
LONGITUDE
35
36
37
38
39
40
41
42
43
44
LAT
ITU
DE
GU 1701 ECOMONMay 16 - June 07, 2017Bottom Salinity

-76 -74 -72 -70 -68 -66
LONGITUDE
35
36
37
38
39
40
41
42
43
44
LAT
ITU
DE
GU 1701 ECOMONMay 16 - June 07, 2017Bottom Salinity Anomaly

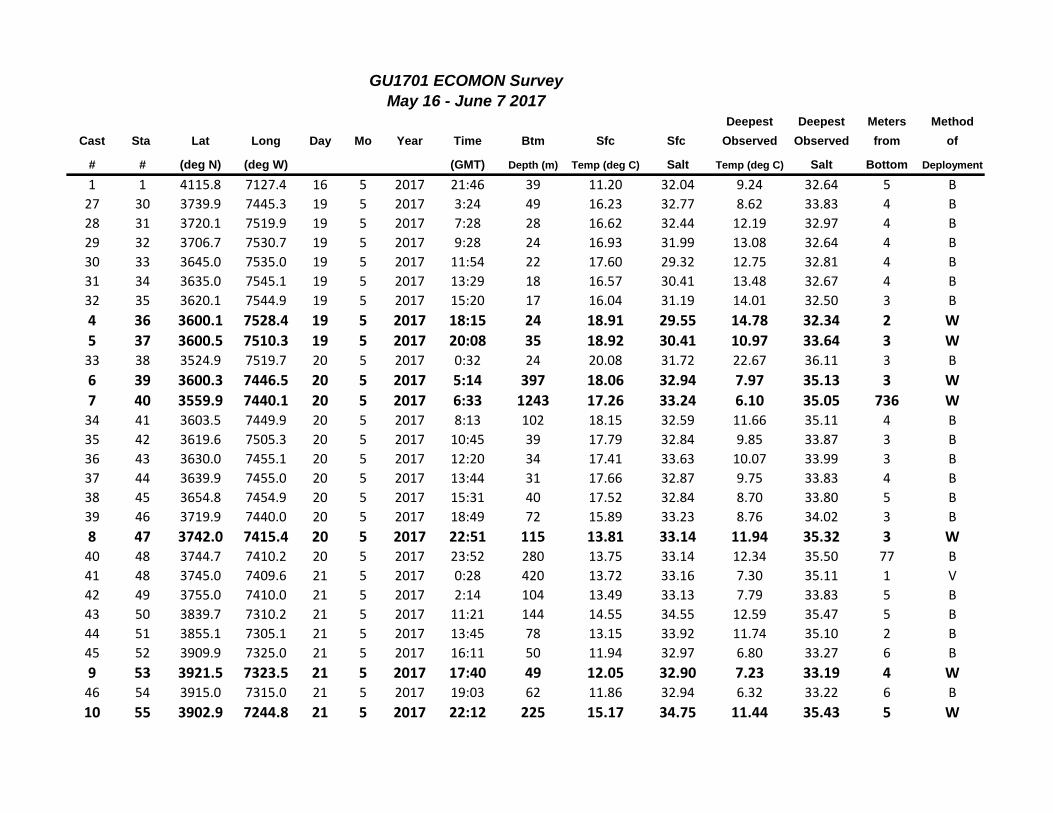
GU1701 ECOMON SurveyMay 16 - June 7 2017
Deepest Deepest Meters MethodCast Sta Lat Long Day Mo Year Time Btm Sfc Sfc Observed Observed from of
# # (deg N) (deg W) (GMT) Depth (m) Temp (deg C) Salt Temp (deg C) Salt Bottom Deployment
1 1 4115.8 7127.4 16 5 2017 21:46 39 11.20 32.04 9.24 32.64 5 B2 2 4104.6 7125.1 16 5 2017 23:18 37 10.49 32.61 8.77 32.79 5 B3 3 4059.8 7134.8 17 5 2017 0:33 45 10.67 32.37 8.66 32.79 4 B4 4 4049.6 7124.5 17 5 2017 2:06 60 10.22 32.72 6.61 33.10 6 B5 5 4039.7 7124.8 17 5 2017 3:22 62 10.51 32.94 6.21 33.14 6 B6 6 4034.7 7129.9 17 5 2017 4:19 69 10.37 32.99 6.15 33.15 3 B7 7 4029.8 7134.8 17 5 2017 5:15 76 10.48 32.98 6.21 33.17 5 B8 8 4014.7 7144.9 17 5 2017 7:21 80 10.46 32.94 6.25 33.18 4 B9 9 4014.7 7203.9 17 5 2017 9:19 63 10.37 32.97 6.25 33.14 4 B
10 10 4010.7 7227.2 17 5 2017 11:36 66 10.63 32.81 5.60 32.95 5 B11 11 4021.3 7322.9 17 5 2017 16:08 32 11.32 31.56 9.04 32.28 5 B12 12 4015.1 7339.5 17 5 2017 17:48 27 11.65 31.70 8.78 32.22 5 B13 13 4010.2 7334.5 17 5 2017 19:12 36 11.40 31.96 7.51 32.53 5 B14 14 3954.8 7315.1 17 5 2017 21:40 58 11.17 32.81 6.17 33.13 6 B15 15 3939.6 7320.0 17 5 2017 23:34 38 11.85 33.06 6.95 33.25 4 B16 16 3949.8 7340.1 18 5 2017 1:46 30 12.88 31.30 9.33 32.49 6 B17 17 4005.0 7350.2 18 5 2017 3:50 29 13.21 29.54 8.90 32.55 5 B1 18 3943.2 7359.6 18 5 2017 6:56 23 13.45 29.00 10.86 31.47 1 W
18 19 3934.9 7400.0 18 5 2017 8:08 25 13.16 30.31 11.03 31.62 4 B19 20 3914.8 7405.0 18 5 2017 10:26 26 13.87 31.19 11.08 32.23 5 B20 21 3909.9 7410.0 18 5 2017 11:16 21 13.92 31.42 10.95 32.24 4 B21 22 3855.5 7430.6 18 5 2017 13:43 23 13.76 31.49 10.95 32.20 3 B22 23 3844.9 7435.1 18 5 2017 15:08 29 13.38 31.58 9.74 32.41 4 B23 24 3834.7 7440.4 18 5 2017 16:31 23 14.15 31.57 11.20 32.12 5 B24 25 3819.9 7449.5 18 5 2017 18:37 21 15.82 30.63 12.11 32.31 5 B25 26 3814.9 7434.9 18 5 2017 20:06 40 14.91 32.70 8.35 33.37 4 B26 27 3804.9 7449.8 18 5 2017 22:05 33 15.21 31.38 11.06 32.78 5 B2 28 3800.1 7457.1 18 5 2017 23:11 22 15.88 31.56 12.35 32.45 2 W3 29 3750.6 7434.8 19 5 2017 1:36 54 15.61 33.20 8.48 33.77 3 W
GU1701 ECOMON SurveyMay 16 - June 7 2017
Deepest Deepest Meters MethodCast Sta Lat Long Day Mo Year Time Btm Sfc Sfc Observed Observed from of
# # (deg N) (deg W) (GMT) Depth (m) Temp (deg C) Salt Temp (deg C) Salt Bottom Deployment
1 1 4115.8 7127.4 16 5 2017 21:46 39 11.20 32.04 9.24 32.64 5 B27 30 3739.9 7445.3 19 5 2017 3:24 49 16.23 32.77 8.62 33.83 4 B28 31 3720.1 7519.9 19 5 2017 7:28 28 16.62 32.44 12.19 32.97 4 B29 32 3706.7 7530.7 19 5 2017 9:28 24 16.93 31.99 13.08 32.64 4 B30 33 3645.0 7535.0 19 5 2017 11:54 22 17.60 29.32 12.75 32.81 4 B31 34 3635.0 7545.1 19 5 2017 13:29 18 16.57 30.41 13.48 32.67 4 B32 35 3620.1 7544.9 19 5 2017 15:20 17 16.04 31.19 14.01 32.50 3 B4 36 3600.1 7528.4 19 5 2017 18:15 24 18.91 29.55 14.78 32.34 2 W5 37 3600.5 7510.3 19 5 2017 20:08 35 18.92 30.41 10.97 33.64 3 W
33 38 3524.9 7519.7 20 5 2017 0:32 24 20.08 31.72 22.67 36.11 3 B6 39 3600.3 7446.5 20 5 2017 5:14 397 18.06 32.94 7.97 35.13 3 W7 40 3559.9 7440.1 20 5 2017 6:33 1243 17.26 33.24 6.10 35.05 736 W
34 41 3603.5 7449.9 20 5 2017 8:13 102 18.15 32.59 11.66 35.11 4 B35 42 3619.6 7505.3 20 5 2017 10:45 39 17.79 32.84 9.85 33.87 3 B36 43 3630.0 7455.1 20 5 2017 12:20 34 17.41 33.63 10.07 33.99 3 B37 44 3639.9 7455.0 20 5 2017 13:44 31 17.66 32.87 9.75 33.83 4 B38 45 3654.8 7454.9 20 5 2017 15:31 40 17.52 32.84 8.70 33.80 5 B39 46 3719.9 7440.0 20 5 2017 18:49 72 15.89 33.23 8.76 34.02 3 B8 47 3742.0 7415.4 20 5 2017 22:51 115 13.81 33.14 11.94 35.32 3 W
40 48 3744.7 7410.2 20 5 2017 23:52 280 13.75 33.14 12.34 35.50 77 B41 48 3745.0 7409.6 21 5 2017 0:28 420 13.72 33.16 7.30 35.11 1 V42 49 3755.0 7410.0 21 5 2017 2:14 104 13.49 33.13 7.79 33.83 5 B43 50 3839.7 7310.2 21 5 2017 11:21 144 14.55 34.55 12.59 35.47 5 B44 51 3855.1 7305.1 21 5 2017 13:45 78 13.15 33.92 11.74 35.10 2 B45 52 3909.9 7325.0 21 5 2017 16:11 50 11.94 32.97 6.80 33.27 6 B9 53 3921.5 7323.5 21 5 2017 17:40 49 12.05 32.90 7.23 33.19 4 W
46 54 3915.0 7315.0 21 5 2017 19:03 62 11.86 32.94 6.32 33.22 6 B10 55 3902.9 7244.8 21 5 2017 22:12 225 15.17 34.75 11.44 35.43 5 W

GU1701 ECOMON SurveyMay 16 - June 7 2017
Deepest Deepest Meters MethodCast Sta Lat Long Day Mo Year Time Btm Sfc Sfc Observed Observed from of
# # (deg N) (deg W) (GMT) Depth (m) Temp (deg C) Salt Temp (deg C) Salt Bottom Deployment
1 1 4115.8 7127.4 16 5 2017 21:46 39 11.20 32.04 9.24 32.64 5 B11 56 3900.9 7235.1 21 5 2017 23:43 1200 15.10 34.68 6.43 35.06 698 W47 57 3920.0 7215.1 22 5 2017 3:04 292 15.24 34.89 11.93 35.50 89 B48 57 3920.0 7215.1 22 5 2017 3:39 284 15.20 34.86 9.34 35.22 2 V49 58 3929.8 7245.3 22 5 2017 6:34 66 11.76 32.94 5.29 32.98 4 B50 59 3954.9 7200.0 22 5 2017 11:11 97 10.80 32.69 8.29 33.92 4 B51 60 4029.8 7120.0 22 5 2017 16:19 72 11.31 32.69 6.27 33.09 6 B52 61 4029.6 7105.2 22 5 2017 17:46 79 11.43 32.67 6.66 33.04 5 B53 62 4005.6 7059.9 22 5 2017 20:50 177 9.75 32.48 12.01 35.42 4 B12 63 3950.1 7037.4 22 5 2017 23:51 884 12.12 33.75 6.09 35.04 382 W13 64 4002.4 7036.0 23 5 2017 1:56 166 10.22 32.42 12.00 35.41 3 W54 65 3959.7 6940.4 23 5 2017 7:00 131 12.07 33.48 12.34 35.48 3 B55 66 4010.0 7005.1 23 5 2017 9:32 110 9.69 32.06 11.56 35.09 4 B56 67 4015.0 7030.0 23 5 2017 11:53 111 10.24 32.36 11.39 35.12 4 B57 68 4023.4 7025.4 23 5 2017 13:09 82 10.02 32.27 8.94 34.18 4 B58 69 4028.9 6932.1 23 5 2017 18:03 65 9.14 32.44 7.52 32.61 5 B59 70 4029.9 6905.5 23 5 2017 20:33 80 9.30 32.48 7.35 32.56 5 B60 71 4010.0 6840.0 23 5 2017 23:55 163 10.72 32.94 12.07 35.46 5 B61 72 4025.4 6751.2 24 5 2017 4:45 155 8.27 32.21 11.12 35.09 6 B14 73 4023.0 6741.3 24 5 2017 6:06 300 12.15 33.91 9.92 35.28 2 W15 74 4014.7 6741.3 24 5 2017 7:50 1003 10.69 33.05 6.64 35.07 502 W62 75 4026.3 6719.8 24 5 2017 10:43 316 9.16 32.56 12.67 35.60 115 B63 75 4026.1 6719.3 24 5 2017 11:06 330 10.34 33.03 9.50 35.24 7 V64 76 4044.1 6718.6 24 5 2017 13:25 98 8.70 32.62 6.81 33.06 4 B16 77 4055.4 6742.2 24 5 2017 16:10 67 9.47 32.60 7.54 32.72 4 W65 78 4044.7 6750.1 24 5 2017 17:37 72 9.38 32.61 6.58 32.83 6 B66 79 4049.8 6825.2 24 5 2017 20:36 51 8.73 32.48 8.73 32.46 6 B67 80 4035.1 6825.5 24 5 2017 22:40 82 9.32 32.47 6.66 32.74 4 B

GU1701 ECOMON SurveyMay 16 - June 7 2017
Deepest Deepest Meters MethodCast Sta Lat Long Day Mo Year Time Btm Sfc Sfc Observed Observed from of
# # (deg N) (deg W) (GMT) Depth (m) Temp (deg C) Salt Temp (deg C) Salt Bottom Deployment
1 1 4115.8 7127.4 16 5 2017 21:46 39 11.20 32.04 9.24 32.64 5 B68 81 4044.9 6900.1 25 5 2017 1:36 72 8.90 32.44 8.07 32.59 7 B17 82 4053.8 6909.4 25 5 2017 3:06 68 7.91 32.16 7.78 32.22 2 W69 83 4055.0 7010.2 25 5 2017 9:36 28 10.20 31.78 10.20 31.77 3 B70 84 4059.9 7020.3 25 5 2017 10:42 42 9.53 32.07 9.38 32.11 4 B18 85 4040.4 7037.3 25 5 2017 13:41 61 10.23 32.43 6.97 32.79 2 W71 86 4051.0 7050.5 25 5 2017 15:30 53 10.97 32.57 7.85 32.85 4 B72 87 4059.8 7050.0 25 5 2017 16:40 49 11.10 32.62 8.47 32.73 7 B73 88 4104.5 7040.4 25 5 2017 17:49 42 10.48 32.40 8.73 32.61 3 B19 89 4106.1 7037.5 25 5 2017 18:25 43 10.46 32.33 8.93 32.46 2 W74 90 4111.8 7047.0 25 5 2017 19:37 31 11.13 31.80 10.81 32.01 5 B75 91 4122.5 7113.7 25 5 2017 22:10 27 12.37 32.17 12.01 32.27 5 B76 92 4120.0 7120.0 25 5 2017 23:05 29 12.24 32.32 11.38 32.29 4 B77 93 4134.7 6939.9 31 5 2017 0:15 38 9.80 31.54 6.04 32.02 5 B78 94 4134.8 6920.1 31 5 2017 1:59 131 9.95 NaN 5.92 33.04 5 B79 95 4140.0 6900.0 31 5 2017 4:02 158 10.45 31.68 6.21 33.22 7 B80 96 4054.7 6845.1 31 5 2017 9:37 63 9.01 32.52 9.01 32.50 9 B81 97 4059.9 6834.8 31 5 2017 11:16 51 8.83 32.57 8.83 32.55 5 B82 98 4110.0 6820.2 31 5 2017 13:46 48 9.43 32.60 9.43 32.58 4 B83 99 4109.8 6735.2 31 5 2017 18:12 53 9.79 32.86 9.79 32.84 4 B84 100 4125.0 6734.9 31 5 2017 19:54 41 10.27 32.82 10.27 32.81 3 B20 101 4128.2 6741.2 31 5 2017 20:52 40 10.09 32.74 10.05 32.73 3 W85 102 4142.8 6755.8 31 5 2017 23:40 32 9.42 32.68 9.42 32.66 3 B86 103 4149.9 6800.1 1 6 2017 1:02 60 9.47 32.42 6.86 32.62 4 B21 104 4201.4 6741.7 1 6 2017 3:11 84 9.35 32.47 6.02 33.00 3 W87 105 4209.7 6720.1 1 6 2017 5:34 171 9.59 32.41 8.15 34.16 5 B88 106 4201.8 6724.5 1 6 2017 7:01 48 8.58 32.73 8.58 32.71 4 B89 107 4156.1 6719.9 1 6 2017 8:04 49 9.02 32.75 9.02 32.73 3 B90 108 4144.8 6720.1 1 6 2017 9:36 49 9.29 32.72 9.29 32.70 4 B

GU1701 ECOMON SurveyMay 16 - June 7 2017
Deepest Deepest Meters MethodCast Sta Lat Long Day Mo Year Time Btm Sfc Sfc Observed Observed from of
# # (deg N) (deg W) (GMT) Depth (m) Temp (deg C) Salt Temp (deg C) Salt Bottom Deployment
1 1 4115.8 7127.4 16 5 2017 21:46 39 11.20 32.04 9.24 32.64 5 B91 109 4124.7 6715.0 1 6 2017 11:46 48 9.69 32.81 9.69 32.79 4 B92 110 4054.8 6705.6 1 6 2017 15:11 84 8.69 32.10 7.90 32.89 4 B93 111 4121.2 6649.8 1 6 2017 18:32 73 9.32 32.86 8.36 32.84 5 B94 112 4130.3 6645.2 1 6 2017 19:48 72 8.56 32.86 8.56 32.83 4 B95 113 4130.1 6639.9 1 6 2017 20:36 78 9.10 32.82 8.26 32.81 3 B96 114 4135.1 6645.1 1 6 2017 21:36 73 9.11 32.83 8.56 32.82 4 B97 115 4124.8 6620.1 1 6 2017 23:59 95 9.77 32.56 7.40 32.90 4 B98 116 4124.7 6610.2 2 6 2017 1:03 130 7.93 31.97 8.46 34.35 2 B99 117 4134.8 6625.4 2 6 2017 3:09 89 8.51 32.83 8.19 32.85 4 B
100 118 4144.9 6635.1 2 6 2017 5:04 72 7.98 32.90 7.98 32.86 5 B101 119 4149.9 6630.4 2 6 2017 6:02 75 7.99 32.83 7.49 32.90 4 B102 120 4154.7 6547.0 2 6 2017 9:56 175 9.99 32.82 9.52 35.16 6 B22 121 4145.3 6526.6 2 6 2017 12:33 1983 10.99 32.70 5.57 35.02 1478 W103 122 4213.5 6546.2 2 6 2017 16:24 223 7.56 31.53 9.96 35.13 22 B23 122 4213.5 6546.2 2 6 2017 17:26 221 7.95 31.19 9.51 35.21 1 W104 123 4219.9 6540.5 2 6 2017 18:51 109 8.74 30.90 8.83 34.15 4 B105 124 4225.1 6540.2 2 6 2017 19:43 96 7.51 31.15 3.75 32.22 3 B106 125 4214.9 6629.7 2 6 2017 23:43 247 9.06 32.32 8.31 34.25 45 B107 125 4214.9 6629.7 3 6 2017 0:09 249 9.27 32.30 9.18 34.77 1 W108 126 4224.6 6655.0 3 6 2017 2:48 362 10.04 32.23 9.58 34.97 160 B109 126 4224.8 6655.5 3 6 2017 3:14 362 10.06 32.24 9.60 35.11 2 W110 127 4222.3 6702.6 3 6 2017 4:27 335 10.08 32.24 9.80 35.03 133 B24 127 4222.5 6703.1 3 6 2017 4:54 336 10.03 32.23 9.67 35.10 3 W111 128 4244.5 6720.0 3 6 2017 7:56 227 8.45 32.09 9.54 34.93 26 B112 128 4244.6 6721.0 3 6 2017 8:23 224 8.60 32.07 9.63 34.98 3 W25 129 4241.9 6742.1 3 6 2017 10:28 191 8.98 31.98 8.19 34.06 2 W113 130 4229.8 6745.2 3 6 2017 12:14 236 9.15 32.06 9.59 34.78 35 B114 130 4230.0 6745.0 3 6 2017 12:54 236 9.20 32.06 9.81 34.94 5 V

GU1701 ECOMON SurveyMay 16 - June 7 2017
Deepest Deepest Meters MethodCast Sta Lat Long Day Mo Year Time Btm Sfc Sfc Observed Observed from of
# # (deg N) (deg W) (GMT) Depth (m) Temp (deg C) Salt Temp (deg C) Salt Bottom Deployment
1 1 4115.8 7127.4 16 5 2017 21:46 39 11.20 32.04 9.24 32.64 5 B115 131 4249.9 6810.1 3 6 2017 16:13 179 10.40 32.24 7.85 33.87 4 B116 131 4250.6 6810.8 3 6 2017 16:52 175 10.34 32.24 7.73 33.80 5 B117 132 4304.9 6745.1 3 6 2017 19:41 171 8.82 31.53 6.97 33.45 5 B118 133 4323.4 6740.2 3 6 2017 22:04 245 10.23 31.71 8.91 34.27 44 B26 133 4324.0 6741.1 3 6 2017 22:35 247 10.19 31.70 9.00 34.29 4 W119 134 4349.9 6740.2 4 6 2017 1:56 218 9.80 31.77 8.75 34.20 8 B27 135 4346.4 6840.1 4 6 2017 6:49 115 8.08 31.42 5.41 32.32 4 W120 136 4339.0 6857.8 4 6 2017 9:35 120 8.71 30.76 5.03 32.18 4 B121 137 4334.6 6859.8 4 6 2017 10:30 120 9.04 31.28 4.92 32.45 1 B122 138 4254.6 6850.0 4 6 2017 15:17 180 10.53 31.99 7.59 33.77 3 B123 139 4250.0 6905.2 4 6 2017 16:54 180 10.41 32.17 6.25 33.17 5 B124 140 4249.9 6915.3 4 6 2017 18:08 139 10.60 32.26 5.87 32.99 5 B125 141 4229.9 6835.0 4 6 2017 22:29 203 12.61 32.53 8.24 34.19 4 B126 142 4220.1 6859.9 5 6 2017 1:04 219 11.00 32.17 7.52 33.80 14 B127 143 4209.7 6925.2 5 6 2017 3:48 181 11.65 32.38 6.36 33.24 6 B128 144 4230.0 6939.8 5 6 2017 6:41 252 11.66 32.39 8.05 33.90 51 B28 144 4229.7 6940.5 5 6 2017 7:10 259 11.62 32.38 8.34 34.04 1 W129 145 4219.0 7017.2 5 6 2017 10:34 33 9.18 31.30 6.32 31.87 4 B29 145 4218.6 7017.2 5 6 2017 10:52 35 11.19 30.77 6.34 31.87 3 W30 146 4222.4 7027.6 5 6 2017 12:08 86 11.77 29.43 4.68 32.35 4 W130 147 4225.5 7037.1 5 6 2017 13:18 88 11.86 29.85 4.54 32.41 3 B31 147 4225.2 7036.8 5 6 2017 13:35 86 11.94 29.82 4.56 32.40 2 W131 148 4214.8 7040.1 5 6 2017 15:10 28 12.39 29.69 8.20 31.02 4 B132 149 4109.8 7100.1 6 6 2017 0:34 37 11.74 31.66 9.81 32.08 4 B133 150 4114.8 7035.4 6 6 2017 2:52 28 12.64 30.91 11.17 31.43 4 B134 151 4054.9 7035.0 6 6 2017 5:09 51 12.46 32.41 8.33 32.54 5 B135 152 4049.7 7105.3 6 6 2017 7:46 57 12.50 32.34 7.54 32.78 3 B

GU1701 ECOMON SurveyMay 16 - June 7 2017
Deepest Deepest Meters MethodCast Sta Lat Long Day Mo Year Time Btm Sfc Sfc Observed Observed from of
# # (deg N) (deg W) (GMT) Depth (m) Temp (deg C) Salt Temp (deg C) Salt Bottom Deployment
1 1 4115.8 7127.4 16 5 2017 21:46 39 11.20 32.04 9.24 32.64 5 B136 153 4044.7 7120.0 6 6 2017 9:22 61 12.68 32.39 7.43 32.87 4 B137 154 4034.8 7145.4 6 6 2017 11:50 68 13.07 32.44 6.99 33.00 4 B138 154 4034.8 7145.1 6 6 2017 12:00 68 13.08 32.44 6.97 33.01 3 W139 155 4034.9 7220.1 6 6 2017 14:56 47 13.66 32.52 9.04 32.78 5 B140 156 4034.9 7257.3 6 6 2017 17:53 25 13.92 31.67 12.45 32.29 3 B141 157 4044.8 7224.5 6 6 2017 21:11 37 12.93 31.72 12.62 31.77 3 B142 158 4054.5 7155.4 7 6 2017 0:31 35 12.43 32.05 12.12 32.05 4 B
Deployment codes: B=bongo cast; W=water cast; and V=vertical castCasts in bold are from CTD s/n 0420