cttp algorithm theoretical basis document -...
TRANSCRIPT

Algorithm Theoretical Basis Document For
Cloud Top Temperature and Pressure
Code:NMSC/SCI/ATBD/CTTP Issue:1.0 Date:2012.12.26 File: CTTP-ATBD_V5.0.hwp Page : 1/40
National Meteorological Satellite Center
CTTP Algorithm Theoretical Basis Document
NMSC/SCI/ATBD/CTTP, Issue 1, rev.5
26 December 2012

Algorithm Theoretical Basis Document For
Cloud Top Temperature and Pressure
Code:NMSC/SCI/ATBD/CTTP Issue:1.0 Date:2012.12.26 File: CTTP-ATBD_V5.0.hwp Page : 1/40
National Meteorological Satellite Center
REPORT SIGNATURE TABLE
Function Name Signature Date
Prepared by Yong-Sang Choi, Heaje Cho 26 December 2012
Reviewed by Yong-Sang Choi 26 December 2012 Authorised by NMSC 26 December 2012

Algorithm Theoretical Basis Document For
Cloud Top Temperature and Pressure
Code:NMSC/SCI/ATBD/CTTP Issue:1.0 Date:2012.12.26 File: CTTP-ATBD_V5.0.hwp Page : 1/40
National Meteorological Satellite Center
DOCUMENT CHANGE RECORD
Version Date Pages Changes
Version5 26 December 2012 5 page
- The method defined brightness temperature of clear pixel change.
- In the previous defined the clear pixel compared with brightness
temperature of the neighboring pixel, but changed to use the
maximum value of brightness temperature between 15 days.
Version5 26 December 2012 19 page - Add improvement of underestimated cloud top temperature
Version5 26 December 2012 20 Page
- Insert regression coefficient table of re-retrieved optimal
corresponding cloud top temperature
- Add modified result in Fig 11.

Algorithm Theoretical Basis Document For
Cloud Top Temperature and Pressure
Code:NMSC/SCI/ATBD/CTTP Issue:1.0 Date:2012.12.26 File: CTTP-ATBD_V5.0.hwp Page : 1/40
National Meteorological Satellite Center
Table of Contents
1. Overview
2. Background and purpose
3. Algorithm
3.1 Theoretical background and basis
3.2 Retrieval method
3.2.1 Single channel method
3.2.2 Radiation ratio method
3.3 Retrieval process
3.3.1 Input data
3.3.2 Pre-processing Process
3.3.3 Algorithm
3.3.4 QC flag
3.4 Validation
3.4.1 Validation method
3.4.2 Validation data
3.4.3 Temporal and spatial collocation method
3.4.4 Validation result analysis
4. Interpretation of retrieval results
5. COMS version and algorithm improvement after COMS satellite launch
6. Problems and possibilities for improvement
7. References
Algorithm Theoretical Basis Document For
Cloud Top Temperature and Pressure
Code:NMSC/SCI/ATBD/CTTP Issue:1.0 Date:2012.12.26 File: CTTP-ATBD_V5.0.hwp Page : 1/40
National Meteorological Satellite Center
List of Tables
Table 1 : QC flag.
Table 2 : Definitions of terms used in this analysis.
Table 3 : Validation results of CTP
Table 4 : Detailed Output data for the CTTP algorithm.
Table 5 : Modification of lookup table for CMDPS CTTP

Algorithm Theoretical Basis Document For
Cloud Top Temperature and Pressure
Code:NMSC/SCI/ATBD/CTTP Issue:1.0 Date:2012.12.26 File: CTTP-ATBD_V5.0.hwp Page : 1/40
National Meteorological Satellite Center
List of Figures
Figure 1 : Climatological atmospheric absorption used to compute cloud top temperature from IR10.8
㎛ brightness temperature (SAFNWC/MSG user manual, 2002).
Figure 2 : Flow chart of the CTTP algorithm.
Figure 3 : JAMI/MTSAT-1R radiance imagery for the five spectral channels centered at 0.725 (VIS),
10.8 (IR1), 12.0 (IR2), 6.75 (IR3), and 3.75 m (IR4) for 0333 UTC August 7, 2006.
Except for the VIS channel, the brighter color corresponds to a relatively low value in W
m2 sr1 m1. The full-disk imagery covers East Asia, West Pacific, Australia, and a part of the
Antarctic region (80.5S80.5N, 60.4E139.4W).
Figure 4 : Cloud top pressure derived by the CLA from the JAMI level-1b calibrated radiances shown
in Figure 3. Base products (left) are the results of conventional methods or without
correction methods, and final products (right) from improved methods or with the
correction methods developed in the present study.
Figure 5 : Relative frequency distribution (in %) of MODIS CTP (a), base CTP retrieved by the IR1
estimate only (b), and final CTP corrected by the radiance ratioing method (c) for the total
clouds. The results are shown for August 2006, daytime, nighttime, Northern and Southern
Hemispheres, and the polar, tropical, and midlatitude regions.\
Figure 6 : The difference between MTSAT-1R (both base and final) CTP and MODIS CTP values
(in %) shown in figure 5. The radiance ratios are calculated by using clear-sky radiances
obtained within various spatial resolutions: 12 (3 ×3), 60 (15×15), 100 (25×25), and 220
km (55×55 pixels).
Figure 7 : Time series of the ratio of ice clouds to the total clouds at nine selected sites; base CTP (a),
and final CTP (b).
Figure 8 : Relative frequency of MTSAT minus MODIS CTP (a) for the maximum values. Errors in
the retrieved CTP (b) (in %) with respect to the corresponding parameters. The solid and
dotted lines indicate values from the final (corrected) and base (uncorrected) products,
respectively.

Algorithm Theoretical Basis Document For
Cloud Top Temperature and Pressure
Code:NMSC/SCI/ATBD/CTTP Issue:1.0 Date:2012.12.26 File: CTTP-ATBD_V5.0.hwp Page : 1/40
National Meteorological Satellite Center
Figure 9 : Simulation for radiance ratio and single layer ice-clouds. Figure 10 : Cloud top pressure (a)before and (b)after correcting discontinuities at ±30°latitude.
Algorithm Theoretical Basis Document For
Cloud Top Temperature and Pressure
Code:NMSC/SCI/ATBD/CTTP Issue:1.0 Date:2012.12.26 File: CTTP-ATBD_V5.0.hwp Page : 1/40
National Meteorological Satellite Center
List of Acronyms
COMS Communication, Ocean, and Meteorological Satellite
MTSAT Multi-functional Transport Satellite
JAMI Japanese Advanced Meteorological Imager
ISCCP International Satellite Cloud Climatology Project
FOV Field of view
MODIS Moderate Resolution Imaging Spectroradiometer
CTT Cloud Top Temperature
CTP Cloud Top Pressure
CTH Cloud Top Height
CTTP Cloud Top Temperature and Pressure
SBDART Santa Barbara DISORT Atmospheric Radiative Transfer

Algorithm Theoretical Basis Document For
Cloud Top Temperature and Pressure
Code:NMSC/SCI/ATBD/CTTP Issue:1.0 Date:2012.12.26 File: CTTP-ATBD_V5.0.hwp Page : 1/40
National Meteorological Satellite Center
1. Overview
Cloud Top Temperature and Pressure (CTTP) retrieval algorithm is information that is usefully
utilized in various fields such as very short range forecasting support, and Atmospheric Motion Vector
(AMV) retrieval. CTTP is a part of information retrieved in the scene analysis. It is produced using
cloud detection information and brightness temperature observed from satellite, and results of
Radiative Transfer Model (RTM).
Section 2 of this document presents background and the purpose of the CTTP retrieval algorithm.
Section 3 explains the algorithm. Section 4 describes the analysis method of retrieval results. Section 5
discusses with problems with the algorithm and possibilities for improvement.
2. Background and purpose
The results of the CTTP algorithm are cloud top temperature, cloud top pressure and cloud top height.
The algorithm performs the single channel and radiation ratio method at the same time. The single
channel method derives cloud top temperature(K) using 10.8㎛ brightness temperature. It is converted
into cloud top pressure (hPa) using atmospheric profile data. If the Numerical Weather Prediction
(NWP) model or observation value is not available, we uses climate data prepared in advance.
The radiation ratio method derives cloud top pressure using 6.75 ㎛ and 10.8 ㎛ channels. This will
be used to complement cloud top pressure of semi-transparent clouds. It selects the optimal cloud top
pressure by comparing cloud top pressure calculated through two methods. It retrieves cloud top
height using a height formula from the selected cloud top pressure.
Cloud top height and temperature can utilize basic data to produce an early diagnosis and alert of
thunderstorm development. In other applications, it can support activity in aviation forecasting and can
be used as input data for mesoscale models. Also, it is used as input data for classification of ISCCP
cloud type. The detailed background purpose for the CTTP algorithm is introduced in detail in the
Appendix (Choi et al., 2007).
3. Algorithm
3.1 Theoretical background and basis
The retrieval methods of the CTTP algorithm will find the cloud top pressure through the single

Algorithm Theoretical Basis Document For
Cloud Top Temperature and Pressure
Code:NMSC/SCI/ATBD/CTTP Issue:1.0 Date:2012.12.26 File: CTTP-ATBD_V5.0.hwp Page : 1/40
National Meteorological Satellite Center
channel and radiation ratio methods. The retrieval method is introduced later in this paper. More
detailed theory and the basis is described on pages 4,725-4,730 of the Appendix (Choi et al., 2007).
3.2 Retrieval method
3.2.1 Single channel method
Cloud top temperature is retrieved using and offset value for IR10.8㎛ brightness temperature
depending on satellite zenith angle. The offset value has a big value when low clouds are present, or
the satellite viewing angle is large. The table of offset values are calculated in advance as input data to
a brightness temperature of IR10.8㎛ (i.e. indicating the height of opaque clouds) and satellite zenith
angle.
In the case of calculation, simulation of radiative transfer models is performed offline. Cloud top
pressure, and radiative transfer models have to be supported online with atmospheric vertical
distribution data. The atmospheric vertical distribution is interpolated as an exact view using the result
of the NWP model.
The atmospheric IR10.8㎛ brightness temperature is simulated for each different pressure layer by
atmospheric vertical distribution data. A suitable cloud top pressure is retrieved as the best fit between
the observed IR10.8㎛ radiance and the simulated radiance. In the case of a low level inversion layer,
if the temperature of a cloud is cooler than the low inversion layer, clouds are regarded as located
above the inversion layer.

Algorithm Theoretical Basis Document For
Cloud Top Temperature and Pressure
Code:NMSC/SCI/ATBD/CTTP Issue:1.0 Date:2012.12.26 File: CTTP-ATBD_V5.0.hwp Page : 1/40
National Meteorological Satellite Center
Fig. 1. Climatological atmospheric absorption used to compute cloud top temperature from IR10.8㎛ brightness
temperature (SAFNWC/MSG user manual, 2002).
3.2.2. Radiation ratio method
The radiation ratio method is retrieved using two IR channels with cloud top pressure of semi-
transparent clouds. Also, RTM simulation data has to be supported online and the atmospheric vertical
distribution data is needed. The fundamental equation of this method is shown in equation 1:
(1)
Where Rm is observed radiance, Rclear is clear sky radiance, and Rop is radiance of the opaque cloud
(Simulation value). N is the cloudiness, ε is the emissivity of cloud. 1, 2 of both sides indicate each IR
window channel and WV6.75㎛. If the ratio of emissivity is approximate to 1, equation (1) is
simplified as shown in equation 2:
(2)

Algorithm Theoretical Basis Document For
Cloud Top Temperature and Pressure
Code:NMSC/SCI/ATBD/CTTP Issue:1.0 Date:2012.12.26 File: CTTP-ATBD_V5.0.hwp Page : 1/40
National Meteorological Satellite Center
Both sides depend on the selected channel, surface temperature, vertical temperature and absorption
distribution. The right side is a value which depends on the cloud top pressure by Rop. Consequently,
If we use the fixed surface temperature and vertical distribution, the right side becomes a function
which depends on the pressure and the left side will become a constant. The retrieved cloud top
pressure is the pressure p to satisfy the equation (2).
Radiation ratio method is very sensitive to noise. Especially, it is more sensitive to thin cirrus. Also the
simulated radiance in water vapor channel is inaccurate, because the predictability of water vapor is
not good. The retrieved cloud top pressure is sent as input data for ISCCP cloud type classification.
3.3 Retrieval process
Fig. 2. is the flowchart of the CTTP retrieval algorithm
Fig. 2. Flow chart of the CTTP algorithm.

Algorithm Theoretical Basis Document For
Cloud Top Temperature and Pressure
Code:NMSC/SCI/ATBD/CTTP Issue:1.0 Date:2012.12.26 File: CTTP-ATBD_V5.0.hwp Page : 1/40
National Meteorological Satellite Center
3.3.1 Input data
The input data of CTTP is divided into static data and dynamic data. Radiance and reflectance,
brightness temperature, satellite zenith angle, and scene analysis are derived from Level 1.5 and used
as input data. Reflectance has the range of 0~100%, brightness temperature 170~350K, and satellite
zenith angle 0~90°. Pre. and Acc, are 0.1. The input data derived in this module include surface
temperature, surface pressure, atmospheric temperature and relative humidity of 2m, and temperature
and relative humidity on the vertical pressure. Also, the constants of the retrieved values and empirical
values have to be prepared in cloud analysis
3.3.2 Pre-processing process
The pre-processing process calculates the value of radiation ratio of IR10.8㎛ and WV㎛ depending
on the cloud top pressure using “Streamer”/ Radiative Transfer Model. The calculated results for the
radiation ratio depend on the tropic, mid-latitude, atmosphere in the polar region showed slightly the
difference.
The difference of radiation ratio depends on cloud top pressure in the tropic region strikingly showed,
but the value grew less at higher latitudes. We applied the radiation ratio depending on atmospheric
profile and latitude to correct this difference.
3.3.3. Algorithm
The most important step of the CTTP algorithm is to find the cloud top pressure by performing the
single channel method and radiation ratio method at the same time. The single channel method uses
the properties from channel of infrared window IR10.8㎛, which changes the value depending on the
height of the cloud.
Radiation ratio method uses brightness temperatures of IR10.8㎛ and WV6.7㎛. The single channel
method uses cloud top temperature using the simple function from brightness temperature of 10.8㎛.
The coefficient of the function depends on the satellite zenith angle. Cloud top pressure is extracted to
compare with the retrieved cloud top temperature in advance and atmosphere profile of NWP. If the
semi-transparent cloud is located at high level, brightness temperature of IR10.8㎛ is influenced not
only by the cloud but also the surface. The values for cloud top temperature and pressure of high level
semi-transparent clouds retrieved by single channel method have errors.

Algorithm Theoretical Basis Document For
Cloud Top Temperature and Pressure
Code:NMSC/SCI/ATBD/CTTP Issue:1.0 Date:2012.12.26 File: CTTP-ATBD_V5.0.hwp Page : 1/40
National Meteorological Satellite Center
In order to compensate for this problem, the radiation ration method is used. The radiation ratio
method will use the ratio of the difference in brightness temperature between clear sky and cloudy
conditions of two channels (WV6.75㎛ and IR10.8㎛). This equation is expressed as follows:
(3)
Iop,m and Icc,m mean the radiance of semi-transparent cloud and the brightness temperature of clear
sky of each channels m. The equation (3) is applied in the case of semi-transparent clouds on the
assumption that the transmittance of the cloud for each channel is the same. The ratio R of the
equation (3) is a function of cloud top height. The channel m and n use the brightness temperature of
IR10.8㎛ and WV6.7㎛. Brightness temperatures of clear sky pixel use the maximum value of
brightness temperature of a 15-day period in each pixel. We retrieve cloud top pressure to compare
with the calculated radiation ratio and results of the radiative transfer model.
Single channel method and radiation ratio method select the final cloud top pressure which have a low
value comparing with the result retrieved using each method. If using the single channel method to
retrieve the pressure of semi-transparent clouds, it is retrieved higher than the existing pressure. The
retrieved result using the radiation ratio can compensate for the single channel method. The center of
WV6.7㎛ weighting function is 400~500 hPa. The radiation ratio method can be applied to high
clouds.
This algorithm retrieves cloud top pressure correcting in consequence of radiation ratio for cloud top
pressure of semi-transparent clouds in the single channel method. We retrieve cloud top height using
the function between pressure and height into this retrieved cloud top pressure.
3.3.4. QC flag
QC flag for cloud top pressure is listed in table 1. QC flag for cloud top pressure in the algorithm,
the final selected cloud top pressure presents 128 for single channel method, 64 for radiation ratio
method. Finally, if the cloud top pressure is not retrieved, it presents as flag 0.
Table 1. QC flag

Algorithm Theoretical Basis Document For
Cloud Top Temperature and Pressure
Code:NMSC/SCI/ATBD/CTTP Issue:1.0 Date:2012.12.26 File: CTTP-ATBD_V5.0.hwp Page : 1/40
National Meteorological Satellite Center
CLA - CTTP
bit Bit Interpretation Field Description
8(Method in final cloud top pressure) unavail => 0
128 64
IR window estimate Radiance rationing method
3.4 Validation
3.4.1 Validation method
3.4.1.1. Pre-processing process for validation- Simplified ISCCP cloud detection
We used calibrated radiance and brightness temperature of a hourly Full-disk provided from JAMI
sensors on board MTSAT as simulated images of COMS as input data. The central wavelength of 5
channel from JAMI are located at 0.725㎛ (VIS), 10.8㎛ (IR1), 12.0㎛ (IR2), 6.75㎛ (IR3), and 3.7
㎛(IR4).
The pre-processing process needs to distinguish clear pixels between clouds and clear in order to
validate of cloud information product. In the operation, the cloud detection algorithm played this role
in CMDPS algorithm, but this validation of algorithm utilized the simplified International Satellite
Cloud Climatology Project (ISCCP)cloud detection technique (Rossow and Garder 1993a). For cloud
detection, ISCCP uses the spectral test of VIS and IR channels as follows:
Clear: (BTIR1clr-BTIR1)≤IRTHR and (LVIS-LVIS
clr
Cloudy: (BT
)≤VISTHR
IR1clr-BTIR1)>IRTHR or (LVIS-LVIS
clr
)>VISTHR (4)
Where, BTIR1clr is brightness temperature of IR1 in all sky, BTIR1 is brightness temperature of IR1 in
clear sky, LVIS is radiance of VIS in all sky, LVISclr is radiance of VIS in clear sky. LVIS is the adjusted
radiance by the percent ratio, which is the same as the ISCCP algorithm. IRTHR of threshold value is
12.0K, VISTHR is 6.0% for the land, and 3.0 for the ocean. The availability of cloud detection have to
consider to determine mainly by the accuracy of the clear sky radiance (Rossow and Garder 1993b). In
this validation, BTIR1clr(LVIS
clr) set the maximum and minimum value for each UTC in the month of
August, 2006.

Algorithm Theoretical Basis Document For
Cloud Top Temperature and Pressure
Code:NMSC/SCI/ATBD/CTTP Issue:1.0 Date:2012.12.26 File: CTTP-ATBD_V5.0.hwp Page : 1/40
National Meteorological Satellite Center
VISTHR is the same as the value of ISCCP, because it is high calculated brightness temperature of IR
clear sky. IRTHR is higher 6K for land, 1K for the ocean than the value suggested by Rossow and
Gardar (1993a). Therefore, the selection of cloud pixels is stricter than the ISCCP algorithm. We use
IR condition of equation (4) during nighttime. The detected cloud amount by the above method
accounts for the average CA for August, 2006 about 57.3 % in JAMI Field Of View (FOV). This
value is comparable with estimation results of other global CA climate data. Rossow et al. (1993),
estimated 62.7% in ISCCP C2 (1984-1988), 61.2% in Gridded surface weather station reports (SOBS)
(1971-1981), 61.4% in METEOR (1976-1988), and 51.8% in Nimbus-7 (1980-1984). A notable point
is that it has a higher cloud amount than the JAMI cloud amount of MODIS , which was an average of
77.6% during the validation period.
It has 18 bands from MODIS in a narrower Field of View (FOV), because it detects clouds of various
shape including thin cirrus. Therefore, the results of cloud detection by this method will contain a
considerable uncertainty as compared with reality. This is obvious that have the cloud information
product or uncertainty using the result of cloud detection
3.4.1.2. Explanation of validation method
Validation is performed for Full-disk images of JAMI in the month of August, 2006. This period is
decided to consider a limited calculation space, but Field of view (FOV) of this period included all
situations that have the surface, cloud type, vertical distribution of atmospheric gas, observation and
sun zenith angle affecting the detection via geostationary satellite.
Besides, during this period typhoons such as Saomi and Bopha reached the Korean Peninsula and
Japan. When the main purpose of COMS utilization is to predict heavy weather, these validation
periods are optimal for examining the performance capacity of the algorithm.
This cloud validation has two types of products. It improves the current version in
comparison/validation with “base product” retrieved by traditional algorithm and the “final
product“ of the current version algorithm which was independently developed by a team lead by
Professor Chang-Hoi Ho at Seoul National University.
Basic cloud top height was retrieved using the radiance from the IR1 channel. Final cloud top height
is a value to correct basic cloud top height by radiation ratio method (Choi et al. 2007) between IR1
and IR3 channels. The designations of each product used in this validation are summarized in Table 2.

Algorithm Theoretical Basis Document For
Cloud Top Temperature and Pressure
Code:NMSC/SCI/ATBD/CTTP Issue:1.0 Date:2012.12.26 File: CTTP-ATBD_V5.0.hwp Page : 1/40
National Meteorological Satellite Center
Table 2. Definitions of terms used in this analysis.
Term Unit Definition
Base CTP hPa Cloud top pressure is retrieved by the IR1 window estimate.
Final CTP hPa Cloud top pressure is retrieved by both the IR1 window estimate and the
radiance ratioing method using IR1 and IR3 radiances.
Above are defined the basic, final, and MODIS products compared with four procedures. It corrects
into optimal condition algorithm of four results, and provides useful data to comprehend the weak
points of products.
(1) Scene analysis
Scene analysis is the first activity of this validation. Scene analysis means a comparison between
radiance and product. It can roughly review of the total reliability of product through this activity
(2) Climate data comparison
Comparison with climate data is an activity to identify whether the product has reliable climate data.
Also, product data can figure out how it is biased. Long term data must be obtained, but this validation
was limited for August, 2006. Climate data can figure out that the cause of bias for retrieval value
divided and compared with a variety of conditions. For example, It compares with climate data of
MODIS products for day, night, water phase clouds, ice phase clouds, southern hemisphere, northern
hemisphere, Antarctic region, the tropic region, and the mid-latitude region.
(3) Time-series comparison
Time-series comparison is an activity to compare the validation of ancillary data and diurnal
variation during the validation period for the region of interest. The region of interest is selected
evenly on the land, ocean, desert, and various surface conditions such as snow/ice, low, middle, and
high latitude. Nine regions of interest were selected in this validation; Seoul, Hwabuk plain in China,
Gobi desert, Tibetan plateau, South China Sea, East Pacific, Bering Sea, and the Antarctic region.
Finally, we grasp the error range in comparison with ancillary data into pixel units for cloud
information.
In this validation, cloud data of MODI06 collocation 5 were used as ancillary data. The validation

Algorithm Theoretical Basis Document For
Cloud Top Temperature and Pressure
Code:NMSC/SCI/ATBD/CTTP Issue:1.0 Date:2012.12.26 File: CTTP-ATBD_V5.0.hwp Page : 1/40
National Meteorological Satellite Center
region for pixel comparison was limited to the Pacific Northwest (10°-30°N, 113°-149°E). A lot of cyclonic
eddies of this region have strong wind and a zone of spiral precipitation. A variety of cloud phases are
observed to have highly developed convective activity (Kim et al. 2006). To avoid a temporal and
spatial discrepancy between MODIS and JAMI images, it compared the optimal pixels within 50 km
distance and 30 minutes between two images considering the path of wind. About 2,160,000 cloud
pixels under this condition were used as their validation. The image pixels of JMAI are at a resolution
of 4km, but cloud top height of MODIS MOD06 are at a resolution of 4km. The difference of
resolution between the two image pixels can lead to uncertainty in comparison of results of these
pixels.
3.4.2 Validation data
(1) CMDPS Validation (COLL/VAM)
The data used to validate CMDPS cloud top height is performed using data from November 1 to
November 5 of MODIS Terra and Aqua. We calculated the statistical value separated by latitude (the
equator: below latitude 30°, mid-latitude: north-south 30~60°). This is the same with other cloud
analysis data.
(2) Developer validation
JMAI radiance and the spatial resolution of the observation angle used for validation is 4km.
Full-disk image is similar to location of COMS including in East Asia and western pacific, Australia,
and the Antarctic region. We used MODIS cloud data to compare with products retrieved using
images from JAMI. This data included cloud top height of 5km resolution for nadir (Platnick et al.
2003). This is more improved point than the previous version in collection 5 data. It is found from
other references (Baum et al. 2005, King et al. 2006, Yang et al. 2007).
MODIS granules (5-min data) were collocated for the Pacific Northwest (10°-30°N, 113°-149°E) during the
period 5-11 August 2006. MOD06 cloud top height is retrieved by the “CO2
Radiation comparison method uses CO
slicing method” (also
known as the “Radiation comparison method“).
2 absorption band between 13.2~14.4㎛ (Menzel et al. 1983,
2006). Cloud top height has an interval of more than 10hPa between 95 hPa and 1040 hPa. This is a
more delicate level than cloud top height from CMDPS retrieval. CMDPS retrieved cloud top as 50
hPa between 100hPa and 1000hPa. Daily atmospheric data (MOD08, collocation 5) of MODIS

Algorithm Theoretical Basis Document For
Cloud Top Temperature and Pressure
Code:NMSC/SCI/ATBD/CTTP Issue:1.0 Date:2012.12.26 File: CTTP-ATBD_V5.0.hwp Page : 1/40
National Meteorological Satellite Center
gridded level-3 is collocated for the period of the same validation. MOD08 has the value of 1° pixel
and is calculated by MOD06. MOD08 is the mean value cloud retrieval information during the period
of validation, but it is used separately to analyze the time-series analysis for a given grid.
3.4.3 Temporal and spatial collocation method
(1) CMDPS Validation CMDPS
We collocated time and space using data of the range within –8 ~ 30 minutes on the same method
as the validation of other cloud analysis algorithm. High latitude (above 60° south and north) is
excluded from the validation. For temporal and spatial collocation, we excluded from the validation
to represent the difference of more than 1-standard deviation in 5x5 pixels of MODIS.
(2) Developer validation
In the case of pixel comparison, CMDPS CLA criteria, it is collocated to averaged temporal and
spatial pixels and entering within 30 minutes.
3.4.4 Validation result analysis
(1) CMDPS validation
Table 3 shows the result of validation from November 1 to 5, 2008. As mentioned earlier, It shows
the statistical value of the correlation coefficient, bias, and RMSE of MODIS and CMDPS cloud
optical thickness by a variety of validation conditions.
Table 3. Validation results of CTP
Reference Time Region R Bias RMSE
CTP
MODIS
(MOD06) 11/1~11/5
Global 0.324 -4.256 185.795
Low 0.261 -136.779 343.072
Mid 0.408 19.026 144.914
MODIS
(MYD06) 11/1~11/5
Global 0.433 -7.771 176.349
Low 0.275 -140.079 336.984
Mid 0.554 15.93 130.135

Algorithm Theoretical Basis Document For
Cloud Top Temperature and Pressure
Code:NMSC/SCI/ATBD/CTTP Issue:1.0 Date:2012.12.26 File: CTTP-ATBD_V5.0.hwp Page : 1/40
National Meteorological Satellite Center
(2) Developer validation
(1) Scene analysis
Fig. 3. JAMI/MTSAT-1R radiance imagery for the five spectral channels centered at 0.725㎛(VIS), 10.8㎛(IR1),
12.0㎛(IR2), 6.75㎛(IR3), and 3.75㎛(IR4) for 0333 UTC August 7, 2006. Except for the VIS channel, the
brighter color corresponds to a relatively low value in W m2 sr1 m1. The full-disk imagery covers East Asia,
West Pacific, Australia, and a part of the Antarctic region (80.5S80.5N, 60.4E139.4W).
Fig. 3 is an example of JAMI radiance imagery at 0333 UTC August 7, 2006. Clouds clearly show
along the Intertropical convergence zone (ITCZ). Optically thick clouds by scattering of sunlight in
VIS image show brightly.
Clouds for dark surface such as oceans are discriminated easily. A bright color In IR image
corresponds to relatively low value, and cloud of high altitude show brightly, because they emit a
lower IR radiance from the top of clouds. A high cloud with more than 400 hPa in IR3 image only
shows brightly. This is because water vapor absorption happens in the troposphere of middle-low level.
Low clouds in the IR window channel such as IR1 or IR2 are clearly confirmed. IR4 radiance in
general has a high value for small cloud particles, and water phase particles. When it considers the
0.55 − 0.90 µm (VIS) 10.3 − 11.3 µm (IR1) 11.5 − 12.5 µm (IR2)
6.5 − 7.0 µm (IR3) 3.5 − 4.0 µm (IR4)
SaomaiBopha
0.55 − 0.90 µm (VIS) 10.3 − 11.3 µm (IR1) 11.5 − 12.5 µm (IR2)
6.5 − 7.0 µm (IR3) 3.5 − 4.0 µm (IR4)
0.55 − 0.90 µm (VIS) 10.3 − 11.3 µm (IR1) 11.5 − 12.5 µm (IR2)
6.5 − 7.0 µm (IR3) 3.5 − 4.0 µm (IR4)
SaomaiBopha
Algorithm Theoretical Basis Document For
Cloud Top Temperature and Pressure
Code:NMSC/SCI/ATBD/CTTP Issue:1.0 Date:2012.12.26 File: CTTP-ATBD_V5.0.hwp Page : 1/40
National Meteorological Satellite Center
spectral properties of the above discussed 5 images, this time image is characterized by three great
regions depending on inferred cloud properties.
(i) High clouds including clouds of Typhoon in the tropic western pacific region and optically thick
clouds.
(ii) High clouds of Eastern pacific region and thin clouds.
(iii) An extensive distributed region contains low and thin clouds, high and thick clouds over south-
west ocean of Australia.
(i) is inferred from high VIS, low IR1, low IR2 radiance, (ii) from low VIS, low VIS, low IR2
radiance, (iii) from extensively distributed low VIS, high IR1, high IR2 radiance and high VIS, low
IR3 of spatial dendrite.
We compare the inferred three properties of clouds and CMDPS algorithm products. Here we
generally must review all cloud information.
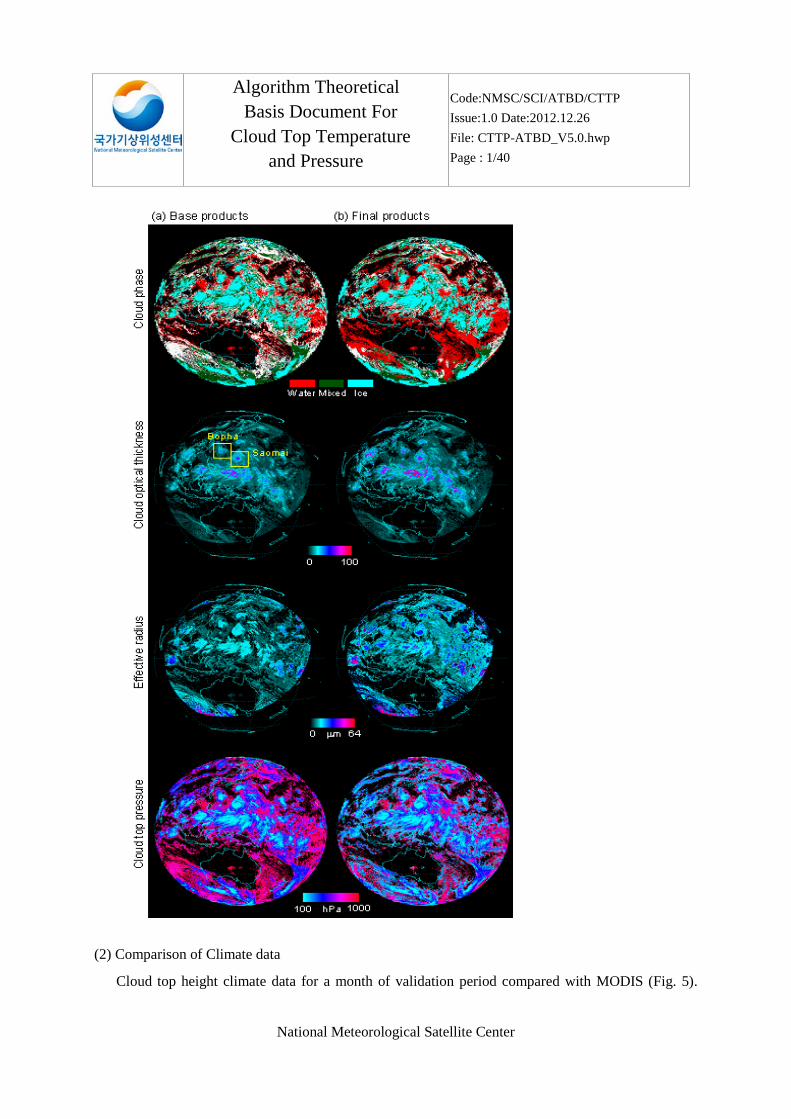
Fig. 4 is a basic product (left) and final product (right) of cloud top height. Overall, the difference
between the two products is clear. The final product represents the main properties of the three clouds
mentioned above better than the basic product. The final cloud top height has a greater value than the
basic product in ITCZ and typhoon. Very high and thick clouds of final product are more distinct in
the tropic western pacific.
Fig. 4. Cloud top pressure derived by the CLA from the JAMI level-1b calibrated radiances shown in Fig. 3.
Base products (left) are the results of conventional methods or without correction methods, and final products
(right) from improved methods or with the correction methods developed in the present study.
Algorithm Theoretical Basis Document For
Cloud Top Temperature and Pressure
Code:NMSC/SCI/ATBD/CTTP Issue:1.0 Date:2012.12.26 File: CTTP-ATBD_V5.0.hwp Page : 1/40
National Meteorological Satellite Center
(2) Comparison of Climate data
Cloud top height climate data for a month of validation period compared with MODIS (Fig. 5).

Algorithm Theoretical Basis Document For
Cloud Top Temperature and Pressure
Code:NMSC/SCI/ATBD/CTTP Issue:1.0 Date:2012.12.26 File: CTTP-ATBD_V5.0.hwp Page : 1/40
National Meteorological Satellite Center
Cloud top height of MODIS has the highest frequency on August in the height of 300-400, 700-800,
and 900-1000hPa. This distribution depends on day/night, Northern and Southern hemisphere, and the
tropic and polar region. Basic cloud top height is similar to MODIS, but the frequency of high clouds
and middle clouds are very little and cloud top height between 900 and 1000hPa has a high
frequency of low clouds.
Basic cloud top height is final cloud top height to correct by radiation ratio method. In the final cloud
top height, high clouds (300-400hPa) are increased by 4% and low clouds (900-1000hPa) are
decreased by 7%. Consequently, the vertical distribution of final cloud top height is approximate to
MODIS.
The local feature of cloud top height distribution for both Final cloud top height and MODIS cloud top
height data well appear.
Very high (200-300hPa) clouds and very low (above 1000hPa) clouds are common in the tropic region.
The middle clouds (600-800hPa) are common in the polar region. Therefore the radiation ratio method
using IR1 and IR3 channels can be extremely useful to distinguish with high clouds above 400hPa.
However, the radiation ratio method using MODIS CO2
channel identified the partial middle clouds,
but our algorithm can’t still identify them.
Fig. 5. Relative frequency distribution (in %) of MODIS CTP (a), base CTP retrieved by the IR1 estimate only
(b), and final CTP corrected by the radiance ratioing method (c) for the total clouds. The results are shown for
August 2006, daytime, nighttime, Northern and Southern Hemispheres, and the polar, tropical, and midlatitude
regions.

Algorithm Theoretical Basis Document For
Cloud Top Temperature and Pressure
Code:NMSC/SCI/ATBD/CTTP Issue:1.0 Date:2012.12.26 File: CTTP-ATBD_V5.0.hwp Page : 1/40
National Meteorological Satellite Center
We calculated the difference of MODIS and our product to determine the uncertainty quantitatively
(Fig. 6). The retrieved Basic product by IR1 displayed as a gray line. Clear sky radiance in the
radiation ratio method is used and it is decided on the maximum value in clear sky pixels observed in
the regular domain. It changed the domain size 12x12km, 60x60km, 100x100km, 220x220km to
decide the sensitivity by domain size and retrieved the final cloud top height. These compared with the
MODIS product. The larger the size of the calculated result domain, the bigger the difference with
MODIS. Therefore cloud top height reduces most uncertainty for the domain of 12x12km. Therefore,
the accuracy of clear sky radiance is the main factor to determine the error of cloud top height.
Fig. 6. The difference between MTSAT-1R (both base and final) CTP and MODIS CTP values (in %) shown in Fig. 5. The radiance ratios are calculated by using clear-sky radiances obtained within various spatial resolutions: 12 (3 ×3), 60 (15×15), 100 (25×25), and 220 km (55×55 pixels).

Algorithm Theoretical Basis Document For
Cloud Top Temperature and Pressure
Code:NMSC/SCI/ATBD/CTTP Issue:1.0 Date:2012.12.26 File: CTTP-ATBD_V5.0.hwp Page : 1/40
National Meteorological Satellite Center
(3) Time series comparison
The climate data comparison provides very important information for validation, but it does not show
the practical correspondence with MODIS product. This section analyzes the time series of products
for the nine areas of interest. MTSAT product calculated every hour average for 1° pixel in
comparison with MODIS gridded of MOD08 data, because it is retrieved in resolution of hourly 4km.
MODIS/Terra pass at 10:30 am for all regions. Therefore, hourly MTSAT data do not exactly coincide
with MODIS data and time. This is only able to identify every hour variation and a similar diurnal
variation. Time series of cloud top height generally follows properties of MODIS for all analysis
regions (Fig. 7). We presented as time series for basic cloud top height ((a) gray line), final cloud top
height (b0 gray line), and MODIS cloud top pressure (bold line) (Fig. 7).
The underestimated cloud top height by Radiation ratio method through time series know to ascend
realistically. In comparison with MODIS value, final cloud top heights are overestimated in Seoul,
Northern plain of China, Eastern Pacific ocean, and the Bering Sea. The reason retrieved highly for
this cloud top height, (i) middle cloud is not distinguished well, (ii) radiation ratio LUT for middle
latitude is applied for latitude 30-60°, so vertical profile and real value of model for location near
latitude 60° such as Bering sea are different (iii) radiation ratio in middle latitude is less sensitive to

Algorithm Theoretical Basis Document For
Cloud Top Temperature and Pressure
Code:NMSC/SCI/ATBD/CTTP Issue:1.0 Date:2012.12.26 File: CTTP-ATBD_V5.0.hwp Page : 1/40
National Meteorological Satellite Center
cloud top height. The factors which cause the uncertainty exist, but final cloud height in regions such
as the Gobi desert, the Tibet Plateau, the South China Sea, Philippine Sea, and the Antarctic
correspond considerably with MODIS data.
Fig. 7. Time series of the ratio of ice clouds to the total clouds at nine selected sites; base CTP (a), and final CTP
(b).
(4) Pixel comparison
Fig. 8 shows the results of pixel comparison of cloud information from MTSAT and MODIS. The
figure presents Relative frequency for the maximum value of the difference between two products, and

Algorithm Theoretical Basis Document For
Cloud Top Temperature and Pressure
Code:NMSC/SCI/ATBD/CTTP Issue:1.0 Date:2012.12.26 File: CTTP-ATBD_V5.0.hwp Page : 1/40
National Meteorological Satellite Center
error for MODIS data. Error was described in ratio between MTSAT minus MODIS and MODIS
product.
Fig. 8. Relative frequency of MTSAT minus MODIS CTP (a) for the maximum values. Errors in the retrieved
CTP (b) (in %) with respect to the corresponding parameters. The solid and dotted lines indicate values from the
final (corrected) and base (uncorrected) products, respectively.
(a) CTP difference (b) Error in retrieved CTP
(c) COT difference (d) Error in retrieved COT
(e) ER difference (f) Error in retrieved ER
FinalBase
(a) CTP difference (b) Error in retrieved CTP
(c) COT difference (d) Error in retrieved COT
(e) ER difference (f) Error in retrieved ER
FinalBaseFinalBase

Algorithm Theoretical Basis Document For
Cloud Top Temperature and Pressure
Code:NMSC/SCI/ATBD/CTTP Issue:1.0 Date:2012.12.26 File: CTTP-ATBD_V5.0.hwp Page : 1/40
National Meteorological Satellite Center
The whole final cloud top height and MODIS height values are consistent with each other. The
difference for cloud top height below 300 hPa is present for about 0.1% of total pixels. The factor to
cause the inconsistency are the difference of retrieval resolution, the radiation ratio, clear sky radiance,
and atmosphere vertical profile.
In comparison with Basic cloud top height and final cloud top height, final cloud top height can know
to approximate to MODIS. Especially, the error for low clouds (Cloud top height≥700 hPa) decreased
considerably. The error in final cloud top height is less than approximately 10%, a high cloud between
200-300hPa has the minimum value.
4 Interpretation method of the retrieval result
This algorithm retrieves cloud top height and cloud top temperature. Acc. of the retrieved data are
all 1, Prec. is pressure 50, the temperature has a value of 1. The range of pressure is 100~150hPa, the
temperature is 170~300K.
Table 4. Detailed Output data for the CTTP algorithm.
OUTPUT DATA
Parameter Mnemonic Units Min Max Prec Acc
Cloud top temperature cloud_top_temp K 170 300 1 1
Cloud top pressure cloud_top_pressure hPa 100 1050 50 1
Prec: Precision, Acc: Accuracy, Res: Resolution
5. COMS version and algorithm improvement after COMS satellite launch
Cloud height is calculated by radiation ratio method of 6.7μm and 11μm. LUT of existing radiation
ratio G value was provided as three type of middle latitude summer, the tropic, middle latitude winter
based on latitude ±30°.

Algorithm Theoretical Basis Document For
Cloud Top Temperature and Pressure
Code:NMSC/SCI/ATBD/CTTP Issue:1.0 Date:2012.12.26 File: CTTP-ATBD_V5.0.hwp Page : 1/40
National Meteorological Satellite Center
Fig. 9 Simulation for radiance ratio and single layer ice-clouds.
The discontinuities of cloud top height in latitude ±30° is found and modified it. Modified content is
shown in Table 5. The result applied the new algorithm is shown in Fig. 10.
Table 5. Modification of lookup table for CMDPS CTTP
before modification
latitude -30° ~ 30°
Winter hemisphere latitude
30° ~ 90°
Summer hemisphere latitude
The tropic LUT
Middle latitude winter LUT
Middle latitude summer LUT
after modification
Winter hemisphere latitude
Winter hemisphere latitude
Summer hemisphere latitude
Summer hemisphere latitude
Middle latitude winter LUT
Interpolation for latitude of Middle latitude winter LUT and the
tropic LUT
Interpolation for latitude of Middle latitude summer LUT and the
tropic LUT
Middle latitude summer LUT

Algorithm Theoretical Basis Document For
Cloud Top Temperature and Pressure
Code:NMSC/SCI/ATBD/CTTP Issue:1.0 Date:2012.12.26 File: CTTP-ATBD_V5.0.hwp Page : 1/40
National Meteorological Satellite Center
(a) (b)
Fig. 10. Cloud top pressure (a)before and (b)after correcting discontinuities at ±30°latitude.
To improve the overestimated cloud top temperature, improved for (a) regression coefficient re-
retrieval of the optimal-fit correction using single channel method, (b) LUT re-retrieval of radiation
ratio method, clear sky radiance. The result of (a) is Table 6, The figure f the re-retrieved cloud top
pressure is the same as Fig 11.
Table 6. Modification of regression coefficient (best-fit method)
SZA Before modification After modification
a b c a b c
0°~10° -0.003486 3.19251 -336.311 7.795572 0.9860177 0.000000
10°~20° -0.003474 3.18258 -334.434 7.913203 0.9858522 0.000000
20°~30° -0.003415 3.13266 -325.055 8.126994 0.9855779 0.000000
30°~40° -0.003320 3.05693 -311.247 8.572551 0.9849832 0.000000

Algorithm Theoretical Basis Document For
Cloud Top Temperature and Pressure
Code:NMSC/SCI/ATBD/CTTP Issue:1.0 Date:2012.12.26 File: CTTP-ATBD_V5.0.hwp Page : 1/40
National Meteorological Satellite Center
40°~50° -0.003164 2.93879 -290.412 9.273953 0.9841015 0.000000
50°~60° -0.002934 2.77426 -262.283 0.0001038601 0.9827880 0.000000
60°~70° -0.002679 2.59754 -232.622 0.0001201152 0.9809093 0.000000
70°~80° -0.002360 2.36972 -193.661 0.0001484903 0.9775916 0.000000
80°~90° -0.001991 2.11005 -149.727 0.0002151845 0.9681243 0.000000
Fig. 11 Cloud top pressure (a)before and (b)after modifying coefficient, lookup table, and definition
of clear sky radiance
6. Problems and possibilities for improvement
We need to diversify validation information for user-centered algorithm improvement. For example,
we must provide the user with a variety of information analyzing day/night, Southern / Northern
hemispheres, latitude, Height separation (high uncertainty of high latitude and middle clouds) errors
and relationship with CTTP.

Algorithm Theoretical Basis Document For
Cloud Top Temperature and Pressure
Code:NMSC/SCI/ATBD/CTTP Issue:1.0 Date:2012.12.26 File: CTTP-ATBD_V5.0.hwp Page : 1/40
National Meteorological Satellite Center
7. References
Baum, B.A., Yang, P., Heymsfield, A.J., Platnick, S., King, M.D., Hu, Y.X. and Bedka, S.T., 2005,
Bulk scattering properties for the remote sensing of ice clouds. Part II: Narrowband models.
Journal of Applied Meteorology, 44, pp. 1896–1911.
Choi, Y.-S., Ho, C.-H. and Sui, C.-H., 2005, Different optical properties of high cloud in GMS and
MODIS observations. Geophysical Research Letters, 32, L23823, doi:10.1029/2005GL024616.
Choi, Y.-S. and Ho., C.-H., 2006, Radiative effect of cirrus with different optical properties over the
tropics in MODIS and CERES observations. Geophysical Research Letters, 33, L21811,
doi:10.1029/2006GL027403.
Choi, Y.-S., Ho, C.-H., Ahn, M.-H. and Kim, Y.-M., 2007, An exploratory study of cloud remote
sensing capabilities of the Communication, Ocean and Meteorological Satellite (COMS) Imagery.
International Journal of Remote Sensing, 28, pp. 4715-4732.
Kim, J.-H., Ho, C.-H., Lee, M.-H., Jeong, J.-H. and Chen, D., 2006, Large increase in heavy rainfall
associated with tropical cyclone landfalls in Korea after the late 1970s. Geophysical Research
Letters, 33, L18706, doi:10.1029/2006GL027430.
King, M.D., Platnick, Hubanks, P.A., Arnold, G.T., Moody, E.G., Wind, G., and Wind, B., 2006,
Collection 005 Change Summary for the MODIS Cloud Optical Property (06_OD) Algorithm.
Available online at: modis-atmos.gsfc.nasa.gov/
C005_Changes/C005_CloudOpticalProperties_ver311.pdf.
Liou, K.N., 2002, An introduction to atmospheric radiation 2nd ed.. Academic Press, San Diego.
Menzel, W.P., Smith, W.L. and Stewart, T.R., 1983, Improved cloud motion wind vector and altitude
assignment using VAS. Journal of Climate and Applied Meteorology, 22, pp. 377–384.
Menzel, W.P., Frey, R.A., Baum, B.A. and Zhang, H., 2006, Cloud top properties and cloud phase
algorithm theoretical basis document, In MODIS Algorithm Theoretical Basis Document, NASA.
Platnick, S., King, M.D., Ackermann, S.A., Menzel, W.P., Baum, B.A., Riedi, J.C. and Frey, R.A.,
2003, The MODIS cloud products: Algorithms and examples from Terra. IEEE Transactions on
Geoscience and Remote Sensing, 41, pp. 456-473.
Rossow, W.B. and Garder, L.C., 1993a, Cloud detection using satellite measurements of infrared and

Algorithm Theoretical Basis Document For
Cloud Top Temperature and Pressure
Code:NMSC/SCI/ATBD/CTTP Issue:1.0 Date:2012.12.26 File: CTTP-ATBD_V5.0.hwp Page : 1/40
National Meteorological Satellite Center
visible radiances for ISCCP. Journal of Climate, 6, pp. 2341−2369.
____ and ____, 1993b, Validation of ISCCP cloud detections. Journal of Climate, 6, pp. 2370 −2393.
____, Walker, A.W. and Garder, L.C., 1993, Comparison of ISCCP and other cloud amounts. Journal
of Climate, 6, pp. 2394−2418.
____ and Schiffer, R.A., 1999, Advances in understanding clouds from ISCCP. Bulletin of the
American Meteorological Society, 80, pp. 2261–2287.
Shupe, M.D., Matrosov, S.Y. and Uttal, T., 2006, Arctic mixed-phase cloud properties derived from
surface-based sensors at SHEBA. Journal of the Atmospheric Sciences, 63, pp. 697711.
Strabala, K.I., Ackerman, S.A. and Menzel, W.P., 1994, Cloud properties inferred from 8–12-μm data.
Journal of Applied Meteorology, 33, pp. 212–229.
Yang, P., Zhang, L., Hong, G., Nasiri, S.L., Baum, B.A., Huang, H.L., King, M.D. and Platnick, S.,
2007,Differences between collection 4 and 5 MODIS ice cloud optical/microphysical products
and their impact on radiative forcing simulations. IEEE Transanctions on Geoscience and Remote
Sensing, 45, pp.2886–2899.
Verlinde, J. and Coauthors, 2007, The mixed-phase arctic cloud experiment. Bulletin of the American
Meteorological Society, 88, pp. 205221.

Algorithm Theoretical Basis Document For
Cloud Top Temperature and Pressure
Code:NMSC/SCI/ATBD/CTTP Issue:1.0 Date:2012.12.26 File: CTTP-ATBD_V5.0.hwp Page : 1/40
National Meteorological Satellite Center
8. Appendix

Algorithm Theoretical Basis Document For
Cloud Top Temperature and Pressure
Code:NMSC/SCI/ATBD/CTTP Issue:1.0 Date:2012.12.26 File: CTTP-ATBD_V5.0.hwp Page : 1/40
National Meteorological Satellite Center

Algorithm Theoretical Basis Document For
Cloud Top Temperature and Pressure
Code:NMSC/SCI/ATBD/CTTP Issue:1.0 Date:2012.12.26 File: CTTP-ATBD_V5.0.hwp Page : 1/40
National Meteorological Satellite Center

Algorithm Theoretical Basis Document For
Cloud Top Temperature and Pressure
Code:NMSC/SCI/ATBD/CTTP Issue:1.0 Date:2012.12.26 File: CTTP-ATBD_V5.0.hwp Page : 1/40
National Meteorological Satellite Center

Algorithm Theoretical Basis Document For
Cloud Top Temperature and Pressure
Code:NMSC/SCI/ATBD/CTTP Issue:1.0 Date:2012.12.26 File: CTTP-ATBD_V5.0.hwp Page : 1/40
National Meteorological Satellite Center

Algorithm Theoretical Basis Document For
Cloud Top Temperature and Pressure
Code:NMSC/SCI/ATBD/CTTP Issue:1.0 Date:2012.12.26 File: CTTP-ATBD_V5.0.hwp Page : 1/40
National Meteorological Satellite Center

Algorithm Theoretical Basis Document For
Cloud Top Temperature and Pressure
Code:NMSC/SCI/ATBD/CTTP Issue:1.0 Date:2012.12.26 File: CTTP-ATBD_V5.0.hwp Page : 1/40
National Meteorological Satellite Center

Algorithm Theoretical Basis Document For
Cloud Top Temperature and Pressure
Code:NMSC/SCI/ATBD/CTTP Issue:1.0 Date:2012.12.26 File: CTTP-ATBD_V5.0.hwp Page : 1/40
National Meteorological Satellite Center

Algorithm Theoretical Basis Document For
Cloud Top Temperature and Pressure
Code:NMSC/SCI/ATBD/CTTP Issue:1.0 Date:2012.12.26 File: CTTP-ATBD_V5.0.hwp Page : 1/40
National Meteorological Satellite Center

Algorithm Theoretical Basis Document For
Cloud Top Temperature and Pressure
Code:NMSC/SCI/ATBD/CTTP Issue:1.0 Date:2012.12.26 File: CTTP-ATBD_V5.0.hwp Page : 1/40
National Meteorological Satellite Center

Algorithm Theoretical Basis Document For
Cloud Top Temperature and Pressure
Code:NMSC/SCI/ATBD/CTTP Issue:1.0 Date:2012.12.26 File: CTTP-ATBD_V5.0.hwp Page : 1/40
National Meteorological Satellite Center

Algorithm Theoretical Basis Document For
Cloud Top Temperature and Pressure
Code:NMSC/SCI/ATBD/CTTP Issue:1.0 Date:2012.12.26 File: CTTP-ATBD_V5.0.hwp Page : 1/40
National Meteorological Satellite Center

Algorithm Theoretical Basis Document For
Cloud Top Temperature and Pressure
Code:NMSC/SCI/ATBD/CTTP Issue:1.0 Date:2012.12.26 File: CTTP-ATBD_V5.0.hwp Page : 1/40
National Meteorological Satellite Center