culvert report8 - usda
TRANSCRIPT

0
Fish Passage Status of Road-Stream Crossings on Selected National Forests in the Southern Region, 2005
United States Department of Agriculture Forest Service Southern Research Station
Center for Aquatic Technology Transfer 1650 Ramble Rd.
Blacksburg, VA 24060-6349
C. Andrew Dolloff, Project Leader
Report prepared by: Seth Coffman, Megan Minter, Jeff Zug, Dan Nuckols, and Craig Roghair

1
Table of Contents List of Figures ............................................................................................................................................... 2 List of Tables ................................................................................................................................................ 4 Background................................................................................................................................................... 5 Methods ........................................................................................................................................................ 6
Data Collection ......................................................................................................................................... 6 Data Analysis............................................................................................................................................ 7
Results........................................................................................................................................................... 8 Discussion ..................................................................................................................................................... 9
Regional Analysis..................................................................................................................................... 9 Current Limitations and Future Improvements ...................................................................................... 10
Literature Cited ........................................................................................................................................... 13 Acknowledgements..................................................................................................................................... 15 Appendix A: Results for the George Washington-Jefferson National Forest ............................................. 28 Appendix B: Results for the Daniel Boone National Forest ....................................................................... 47 Appendix C: Results for the Ozark-St. Francis National Forest ................................................................. 63 Appendix D: Results for the National Forests in Alabama......................................................................... 76

2
List of Figures
Figure 1. National Forests where road-stream crossing inventories were conducted in 2005................... 16 Figure 2. Common road-stream crossing structure shapes. ....................................................................... 17 Figure 3. Survey points used to calculate culvert characteristics............................................................... 18 Figure 4. Coarse Filter A ........................................................................................................................... 19 Figure 5. Coarse Filter B............................................................................................................................ 20 Figure 6. Coarse Filter C............................................................................................................................ 21 Figure 7. Results of coarse filter A for crossings (all Forests combined) in 2005..................................... 22 Figure 8. Results of coarse filter B for crossings (all Forests combined) in 2005. .................................... 22 Figure 9. Results of coarse filter C for crossings (all Forests combined) in 2005. .................................... 22 Figure 10. Results of coarse filter A for crossings (by Forest) in 2005 ..................................................... 23 Figure 11. Results of coarse filter B for crossings (by Forest) in 2005 ..................................................... 23 Figure 12. Results of coarse filter C for crossings (by Forest) in 2005. .................................................... 23 Figure 13. Results of coarse filter A for each crossing type (all Forests combined) in 2005. ................... 24 Figure 14. Results of coarse filter B for each crossing type (all Forests combined) in 2005 .................... 24 Figure 15. Results of coarse filter C for each crossing type (all Forests combined) in 2005 .................... 24 Figure 16. Crossing width to bankfull channel width ratios (by Forest) in 2005 ...................................... 25 Appendix A Figure A1. GWJNF Ranger Districts surveyed in 2005 ............................................................................ 30 Figure A2. Results of coarse filter A for crossings on the GWJNF in 2005.............................................. 31 Figure A3. Results of coarse filter B for crossings on the GWJNF in 2005.............................................. 31 Figure A4. Results of coarse filter C for crossings on the GWJNF in 2005.............................................. 31 Figure A5. Results of coarse filter A for each crossing type on the GWJNF in 2005. .............................. 32 Figure A6. Results of coarse filter B for each crossing type on the GWJNF in 2005 ............................... 32 Figure A7. Results of coarse filter C for each crossing type on the GWJNF in 2005 ............................... 32 Figure A8. Crossing width to bankfull channel width ratios on the GWJNF in 2005. .............................. 33 Figure A9. Map of impassable, passable, and indeterminate crossings on the GWJNF............................ 34 Appendix B Figure B1. DBNF Ranger Districts surveyed in 2005.. ............................................................................. 49 Figure B2. Results of coarse filter A for crossings on the DBNF in 2005................................................. 50 Figure B3. Results of coarse filter B for crossings on the DBNF in 2005................................................. 50 Figure B4. Results of coarse filter C for crossings on the DBNF in 2005................................................. 50 Figure B5. Results of coarse filter A for each crossing type on the DBNF in 2005.. ................................ 51 Figure B6. Results of coarse filter B for each crossing type on the DBNF in 2005.. ................................ 51 Figure B7. Results of coarse filter C for each crossing type on the DBNF in 2005. ................................. 51 Figure B8. Crossing width to bankfull channel width ratios on the DBNF in 2005. ................................. 52 Figure B9. Map of impassable, passable, and indeterminate crossings on the DBNF............................... 53 Appendix C Figure C1. OSFNF Ranger Districts surveyed in 2005.............................................................................. 65 Figure C2. Results of coarse filter A for crossings on the OSFNF in 2005............................................... 66 Figure C3. Results of coarse filter B for crossings on the OSFNF in 2005. .............................................. 66 Figure C4. Results of coarse filter C for crossings on the OSFNF in 2005 ............................................... 66 Figure C5. Results of coarse filter A for each crossing type on the OSFNF in 2005.. .............................. 67 Figure C6. Results of coarse filter B for each crossing type on the OSFNF in 2005. ............................... 67 Figure C7. Results of coarse filter C for each crossing type on the OSFNF in 2005.. .............................. 67 Figure C8. Crossing width to bankfull channel width ratios on the OSFNF in 2005 ................................ 68

3
List of Figures, continued… Figure C9. Map of impassable, passable, and indeterminate crossings on the OSFNF............................. 69 Appendix D Figure D1. NFAL Ranger Districts surveyed in 2005. .............................................................................. 78 Figure D2. Results of coarse filter A for crossings on the NFAL in 2005................................................. 79 Figure D3. Results of coarse filter B for crossings on the NFAL in 2005................................................. 79 Figure D4. Results of coarse filter C for crossings on the NFAL in 2005................................................. 79 Figure D5. Results of coarse filter A for each crossing type on the NFAL in 2005.. ................................ 80 Figure D6. Results of coarse filter B for each crossing type on the NFAL in 2005. ................................. 80 Figure D7. Results of coarse filter C for each crossing type on the NFAL in 2005.. ................................ 80 Figure D8. Crossing width to bankfull channel width ratios on the NFAL in 2005.................................. 81 Figure D9. Map of impassable, passable, and indeterminate crossings on the BHNF. ............................. 82 Figure D10. Map of impassable, passable, and indeterminate crossings on the TNF................................ 83

4
List of Tables
Table 1. Crossings documented and not surveyed by Forest in 2005. ....................................................... 26 Table 2. Results of coarse filters A, B, and C for crossings (by Forest and Forests combined) in 2005... 26 Table 3. Crossings impassable at outlet drop, slope, and slope x length (all Forests combined). ............. 27 Table 4. Results of the coarse filters for each crossing type (all Forest combined) in 2005...................... 27 Appendix A Table A1. Crossings documented and not surveyed on the GWJNF in 2005............................................ 35 Table A2. Results of coarse filters A, B, and C for crossings on the GWJNF in 2005. ............................ 35 Table A3. Location of surveyed crossings on the GWJNF in 2005........................................................... 36 Table A4. Results the of coarse filters for individual crossings on the GWJNF in 2005. ......................... 40 Table A5. Description of surveyed crossings on the GWJNF in 2005 ...................................................... 43 Appendix B Table B1. Crossings documented and not surveyed on the DBNF in 2005............................................... 54 Table B2. Results of coarse filters A, B, and C for crossings on the DBNF in 2005. ............................... 54 Table B3. Location of surveyed crossings on the DBNF in 2005 ............................................................. 55 Table B4. Results the of coarse filters for individual crossings on the DBNF in 2005. ............................ 58 Table B5. Description of surveyed crossings on the DBNF in 2005. ........................................................ 60 Appendix C Table C1. Crossings documented and not surveyed on the OSFNF in 2005 ............................................. 70 Table C2. Results of coarse filters A, B, and C for crossings on the OSFNF in 2005............................... 70 Table C3. Location of surveyed crossings on the OSFNF in 2005............................................................ 71 Table C4. Results the of coarse filters for individual crossings on the OSFNF in 2005. .......................... 73 Table C5. Description of surveyed crossings on the OSFNF in 2005 ....................................................... 74 Appendix D Table D1. Crossings documented and not surveyed on the NFAL in 2005............................................... 84 Table D2. Results of coarse filters A, B, and C for crossings on the NFAL in 2005. ............................... 84 Table D3. Location of surveyed crossings on the NFAL in 2005 ............................................................. 85 Table D4. Results the of coarse filters for individual crossings on the NFAL in 2005. ............................ 88 Table D5. Description of surveyed crossings on the NFAL in 2005 ......................................................... 90

5
Background
The United States has >6.2 million km of public roads (National Research Council 1997), that
directly impact 20% of its land surface (Forman 2000). There are an estimated 1.4 million road-stream
crossings in the United States and over 50,000 on National Forest managed lands in the eastern U.S. (M.
Hudy, U.S. Forest Service, unpublished data), each of which represents a potential impediment or barrier
to movement of fish and other aquatic organisms. The ability of animals to move freely through stream
networks is an important aspect of a species’ long-term viability (Fausch et al. 2002). In particular fish
movement in streams prevents population fragmentation (Winston et al. 1991), allows for population
recovery following disturbance (Detenbeck et al. 1992; Roghair and Dolloff 2005), and provides access to
critical spawning habitats (Fausch and Young 1995). Early work examining effects of road-stream
crossings on fish movement occurred primarily in the western U.S. and focused on anadromous Pacific
salmon. Effects of road-stream crossings on stream-resident fishes in the eastern U.S. have received less
attention, in part because resident fishes were regarded as sedentary (Gerking 1959). Recent research and
re-examination of historic movement studies (Gowan et al. 1994) on a wide range of stream-resident fish
species (Albanese et al. 2003; Schmetterling and Adams 2004; Warren and Pardew 1998) has shown that
so called resident species exhibit greater frequency and magnitude of movement than previously was
thought. For land managers, this new understanding of fishes ability and propensity to move has
significant implications. Road-stream crossings must be managed to permit both downstream and
upstream passage of aquatic animals.
In 2003 and 2004 the U.S. Forest Service Southern and Eastern Regions and the San Dimas
Technology and Development Center (SDTDC) hosted several fish passage assessment and remediation
workshops. The National Inventory and Assessment Procedure (NIAP) (Clarkin et al. 2003), developed
by SDTDC, presented at these workshops provided a framework for collecting field data, but the
assessment models, designed for fish species endemic to the western U.S., were not directly applicable to
species in the eastern U.S. The southeastern U.S. has over 560 freshwater fish species in over 28 families
encompassing a wide range of swimming and leaping abilities (Warren et al. 2000). Development of
species-specific passage models was considered impractical and lack of data on leaping and swimming
ability for most eastern fish species limited the usefulness of previously developed passage software such
as FishXing (Love et al. 1999).
In 2003, graduate students and biologists of the U.S. Forest Service Aquatic Ecology Unit – East
at James Madison University began to develop several simple models that would allow managers to
quickly assess the passage status of a crossing for groups of fish with similar swimming abilities. Three
‘coarse screening filters’ were developed: Filter A for species with strong leaping and swimming abilities;
Filter B for species with moderate leaping and swimming abilities; and Filter C for species with weak

6
leaping and swimming abilities. Movement data on a broad cross section of eastern stream fishes showed
that the coarse filters provided a reasonable estimate of the likelihood of a particular crossing presenting a
barrier to upstream passage (Coffman 2005).
In 2005 the Southern Region elected to allocate 10% of its Roads and Trails (TRTR) funds to
inventory road-stream crossings in the George Washington-Jefferson (GWJNF), Daniel Boone (DBNF),
Ozark-St. Francis (OSFNF), Bankhead (BNF) and Talladega (TNF) National Forests (Figure 1). To
insure a quality product with consistent data collection and analysis the Region partnered with the
Southern Research Station, Center for Aquatic Technology Transfer (CATT) to design an inventory and
assessment program for road-stream crossings. The CATT designed an inventory program based on the
NIAP, deployed field crews to collect data, and then classified each crossing as passable, impassable or
indeterminate for each of the three coarse filters described above. This report summarizes the results of
road-stream crossing inventories and data analysis performed by the CATT in 2005.
Methods
Data Collection Dimensions, shape (Figure 2), and condition of road-stream crossing structures and data
pertaining to the adjacent stream channel were recorded for each site following the (NIAP) (Clarkin et al.
2003). A CST/berger SAL series automatic level with 32x magnification mounted on a tripod and a 25-
foot stadia rod graduated in tenths of feet were used to measure the elevation of the crossing structure
inlet and outlet, tailwater control, and the water surface (Figure 3). A measuring tape marked in
hundredths of a foot was used to measure the distance between the crossings inlet and outlet. Bankfull
channel width was measured at three locations upstream of the crossing and three downstream where
natural channel geometry was intact (i.e. outside of the influence of the crossing structure). Photographs
of the inlet and outlet were taken and each site was sketched on paper. Condition of the crossing structure
was recorded and any natural barriers (e.g.. waterfalls) immediately upstream or downstream were
documented. Natural stream substrate covering the bottom of the crossing structure was recorded as
present continuous throughout the structure, present discontinuous, or not present. Substrate had to cover
100% of the structure bottom for a crossing to receive a present continuous throughout the structure
designation. Crossing location was documented but the structure was not surveyed if there was
inadequate habitat upstream of the crossing to support fish, or if the crossing structure was a bridge or
natural ford. Bridges and natural fords were assumed to always provide adequate upstream fish passage.
Crossing locations that could not be reached because of inaccessible or closed roads, private property
issues, or locked gates were also documented.

7
Data Analysis The elevation and distance measurements for the crossing inlet, crossing outlet, tailwater control,
and water surface were used to calculate residual inlet depth, outlet drop, outlet perch, slope, and slope x
length values for each crossing (Figure 3). Residual inlet depth was calculated as
P3 – P1,
where P3 is the tailwater control elevation of the outlet pool and P1 is the crossing inlet elevation.
Residual inlet depth values greater than zero indicate the structure is completely backwatered, allowing
fish passage. Outlet drop was calculated as
P2 – P3,
where P2 is the crossing outlet elevation and P3 is the tailwater control elevation of the outlet pool. Outlet
perch was calculated as
P2 – Ws,
where P2 is the crossing outlet elevation and Ws is the water surface elevation immediately downstream
of the outlet. Outlet perch is used in place of outlet drop when a tailwater control is not present and outlet
drop cannot be calculated. Excessive outlet drop or outlet perch values indicate the presence of jump
barriers. Slope was calculated as
(P1elev – P2elev) / (P1dist – P2dist) * 100,
where P1elev is the crossing inlet elevation, P2elev is the crossing outlet elevation, P1dist is the crossing inlet
distance, and P2dist is the crossing outlet distance. Steep slope is an indicator of velocity barriers. Slope x
length was calculated as
[(P1elev – P2elev) / (P1dist – P2dist) * 100] * (P1dist – P2dist),
where P1elev is the crossing inlet elevation, P2elev is the crossing outlet elevation, P1dist is the crossing inlet
distance, and P2dist is the crossing outlet distance. High slope x length values indicate an exhaustion
barrier.
Residual inlet depth, outlet drop, outlet perch, slope, and slope x length values for each crossing
were applied to each of three regional coarse filters (Figures 4 – 6) to determine upstream passage status.
Threshold values for each parameter differ by filter and were set according to published swimming and
leaping abilities of representative species in each filter group, and relationships among crossing
dimensions, species presence/absence data, and movement data (Coffman 2005). Filter A (Figure 4)
classifies crossings for species with strong swimming and leaping abilities, such as the adult brook trout
(Savelinus fontinalis). Filter B (Figure 5) classifies crossings for species with moderate swimming and
leaping abilities such as juvenile trout or species in the minnow family (Cyprinidae). Filter C (Figure 6)
classifies crossings for weak swimmers and leapers, such as species in the darter (Percidae) and sculpin
(Cottidae) families. Crossings are classified as passable, impassable, or indeterminate for each of the

8
three filters. Biological sampling or computer modeling is required to determine passage status for
crossings classified as indeterminate.
Sites with more than one crossing structure (e.g. culverted site with multiple pipes) were
occasionally encountered during the surveys. At these sites each individual structure was classified,
which could result in a single site having multiple classifications for a given filter. Under those
circumstances the location was classified based on the structure that received the best passage rating. For
example, in a crossing location with two circular culverts where one was classified as impassable and one
indeterminate by Filter B, the location would receive an overall classification of indeterminate rather than
impassable.
The ratio of culvert width to bankfull channel width was also calculated for each site. The ratio
was calculated as
CW / BCW,
where CW is the maximum width or diameter of the crossing structure and BCW is the average of all six
(three upstream and three downstream) bankfull channel width measurements. A ratio of 1.0 or greater
indicates that the crossing structure is equal to or greater than the width of the bankfull channel. Fords,
vented fords, and sites with multiple crossing structures were eliminated from the analysis.
Results
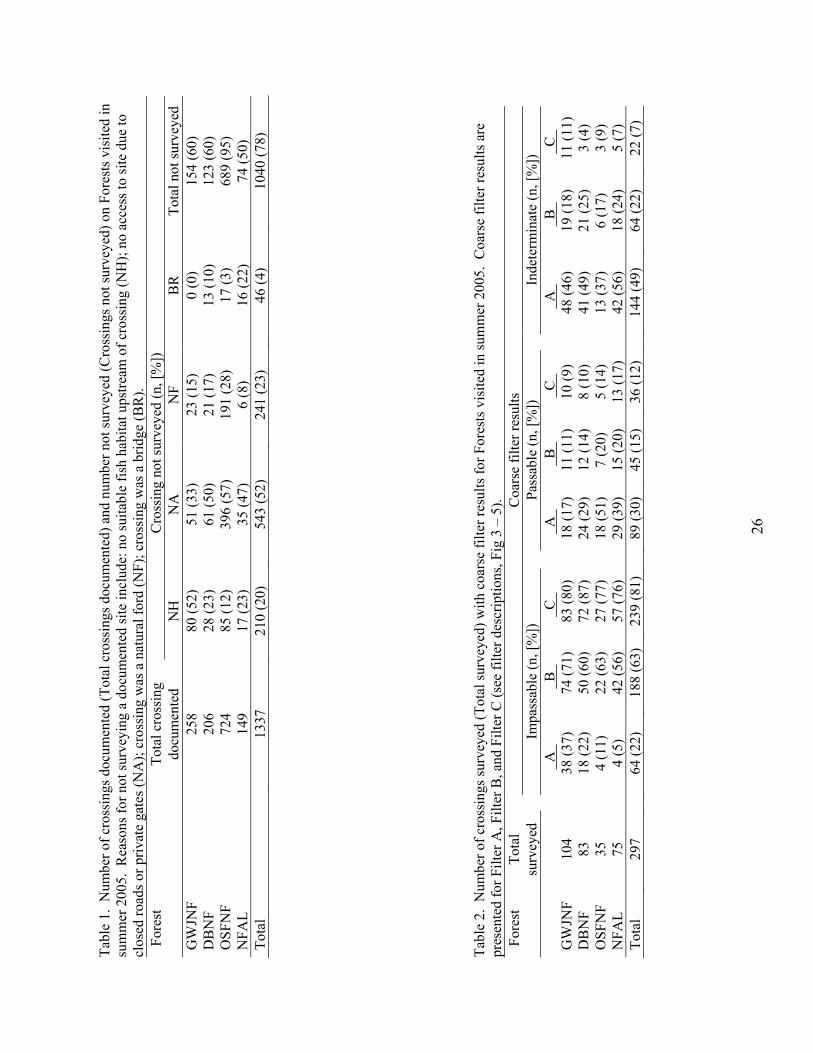
We visited a total of 1337 road-stream crossings in 2005 and completed surveys at 297 sites
(Table 1). Filter A (strong swimmers and leapers) classified 22% (n=64) of crossings as impassable, 30%
(n=89) as passable, and 48% (n=144) as indeterminate (Figure 7, Table 2). Filter B (moderate swimmers
and leapers) classified 63% (n=188) of crossings as impassable, 15% (n=45) as passable, and 22% (n=64)
as indeterminate (Figure 8, Table 2). Filter C (weak swimmers and leapers) classified 81% (n=239), of
crossings as impassable, 12% (n=36) as passable, and 7% (n=22) as indeterminate (Figure 9, Table 2).
The GWJNF had the highest percentage of impassable sites for both Filter A and B, and the DBNF had
the highest percentage of impassable sites for Filter C. All Forests had greater than 55% of sites for Filter
B and greater than 75% of sites for Filter C classified as impassable (Figures 10-12, Table 2). Excessive
outlet drops accounted for 61% of the impassable sites for Filter A, 74% for Filter B, and 85% for Filter C
(Table 3).
The majority of crossings were either circular culverts (n=145) or pipe arches (n=88), while box
culverts (n=18), vented fords (n=10), concrete slab fords (n=28), and open bottom arches (n=8) were less
frequently encountered. Filter A classified 25% of circular culverts and 24% of pipe arch crossings as
impassable (Figure 13, Table 4). The proportion of circular culverts and pipe arches classified impassable
increased from Filter A to Filters B and C. Filter B classified 70% of circular culverts and 67% of pipe

9
arch crossings as impassable (Figure 14, Table 4). Filter C classified 89% of circular culverts and 78% of
pipe arches as impassable (Figure 15, Table 4). All three filters classified 100% of the open bottom
arches as passable (Table 4).
Greater than 90% of all crossings (excluding fords, vented fords, and multiple structure crossings)
had crossing to channel width ratios less than 1.0 (i.e. crossing width was less than the bankfull channel
width). The mean crossing width to channel width ratio (n=177) was 0.54 (SD=0.23) (Figure 16). Only
11 crossings were greater than or equal to the mean bankfull channel width (i.e. crossing width to channel
width ratio was greater than or equal to 1.0).
Discussion
Regional Analysis Crossings that prevent upstream fish passage are a common feature of stream networks on all the
Forests we surveyed. Considering all Forests, no more than 17% of crossings were passable for all three
filters highlighting the potential severity of stream fragmentation. Outlet drop triggered passage failure at
the majority of impassable sites for all three filters, but it was not the only factor that prevented
movement at many sites. Over 40% of sites classified as impassable due to excessive outlet drop would
also have failed due to either excessive slope or slope x length values. Even if fish had managed to find a
way to leap into these crossing structures they likely would have faced water velocities that exceeded
their swimming abilities or a combination of water velocity and pipe length that would have exhausted
them before they could exit the upstream end of the structure. These conditions are created when crossing
structures do not mimic natural channel characteristics such as bankfull channel width, slope, and
substrate. The result is increased water velocity within the structure and scouring immediately
downstream creating an outlet drop, or perch (Castro 2003). This effect is exaggerated in high gradient
streams which may explain why the GWJNF, which had the highest gradient streams for Forests
inventoried in 2005, also had the highest proportion of sites that failed for Filters A and B. Streams in the
other Forests visited were primarily low gradient and failure for Filter A in these streams indicated an
extreme passage problem.
The high proportion of impassable sites for Filters B and C is particularly troubling. Minnow and
darter species, the majority of which fall within Filters B and C represent >70% of the freshwater fish
diversity in the Southeast (Warren et al. 2000) and occur on every Forest in the Southern Region. These
fishes also represent 65% of the imperiled fish taxa in the Southeast (Warren et al. 2000). Our results
suggest that these species face barriers to movement at 60% - 80% of road-stream crossings on National
Forest managed lands in the Southern Region. The fragmentation caused by these barriers likely
contributes to species imperilment, and the high number of impassable sites adds to the challenge of
restoring connectivity (Walsh et al. 1995).

10
All crossing types blocked upstream fish passage to some degree with the exception of open
bottom arches. Open bottom arches typically had crossing to channel width ratios close to 1.0 and always
had natural stream substrate throughout the crossing, providing favorable conditions for upstream fish
passage. However, open bottom arches are expensive compared to other crossing types (Murphy and
Pyles 1989), which may explain why we encountered relatively few of these structures. Other than open
bottom arches, box culverts and vented fords had the smallest percentage of impassable sites, but sample
size for these types was low in 2005. Pipe arches and circular culverts were the most frequently
encountered crossing type. Pipe arches and circular culverts dominate the road-stream crossing landscape
because they are the most readily available and cost effective to install, but as our results demonstrate,
they can create passage problems when stream hydrology and biological factors are not carefully
considered prior to installation (Baker and Votapka 1990).
Current Limitations and Future Improvements
The coarse filters presented here apply to several general categories of fish including strong
swimmers and leapers (Filter A), moderate swimmers and leapers (Filter B), and weak swimmers and
leapers (Filter C). We assigned adult trout to represent Filter A, minnows and young trout to represent
Filter B, and darters and sculpins to represent Filter C, however there are a range of swimming and
leaping abilities represented within each family. For example, passage of some minnow species may
actually be best assessed by Filter A whereas others may fit better in Filter C. Still other families or
species, such as those that are strong swimmers but weak to moderate leapers may require the creation of
additional filters to correctly classify their passage status. Currently, few data are available regarding
swimming and leaping ability of non-game fish species in the Southeast making it difficult to refine or
expand the existing filters. Members of the sucker (Catostomidae), catfish (Ictuluridae) and sunfish
(Centrarchidae) families may fit into such filters, but clearly more research is needed.
Results provided by the existing filters include a sometimes large area of indeterminate passage
status. Crossings enter this “gray area” when they pass for outlet drop and slope but do not pass or fail
for slope x length. The range of values that leads to an indeterminate classification for slope x length can
be quite large, particularly for Filter A leaving a large portion of sites essentially unclassified. The slope
x length value represents the relative level of exhaustion a fish would experience by trying to swim
through a pipe of a certain slope for a given distance. Because few empirical data exist for species
exhaustion rates the filters were designed to be conservative at this step. Biological sampling can provide
important information for evaluating fish passage at sites classified indeterminate and generally with little
expense relative to the cost of replacing a crossing structure. Mark-recapture sampling designs can vary
in complexity and effort depending on project goals (Warren and Pardew 1998) and provide direct
evidence of fish passage without the assumptions of fish passage models. The mark recapture design can

11
be as simple as marking and releasing a sample of fish downstream of a crossing, and then sampling for
marked fish about the crossing on subsequent sampling trips. Collection of marked fish above the
crossing would indicate that crossing is passable for the species in question. More elaborate designs to
detect if movement through the crossing is the same or similar to movement through the unobstructed
natural stream channel can also be implemented (Coffman 2005). The use of mark-recapture studies at
indeterminate sites would not only allow managers to classify these sites as passable or impassable, but
would also provide data necessary to refine the filter thresholds and shrink the gray areas.
We could not perform surveys at nearly 4 out of every 5 sites we visited in summer 2005. Many
sites were natural fords or bridges, which we do not survey or were on closed roads, behind private gates,
etc. Our efficiency could be vastly improved with better pre-visit preparation. Early notification of the
Forests selected for crossing assessments would give Forest personnel the time necessary to prepare for
the assessment. This preparation should include watershed selection using existing databases, recent
aerial photography, maps and local knowledge to eliminate crossings that do not require surveys (i.e.
natural fords, bridges, and closed roads). Specific crossings scheduled to be surveyed that are behind
locked gates or require passing through private property to access could be identified and the necessary
steps taken to ensure efficient use of the field crews. Maps denoting crossings to be surveyed and sites to
avoid can allow the field crews to coordinate an efficient strategy to complete the surveys. Because time
and resources for assessment and remediation are limited, prioritization is crucial to the assessment
program.
The Forests have opportunities to improve fish passage at road-stream crossings both during
routine maintenance when crossing structures reach the end of their serviceable life, and when funding
becomes available to replace crossings outside of the regular maintenance schedule. Managers should
always consult with their biologists and hydrologists to determine whether routine replacements should
include aquatic organism passage considerations. Selection of sites for replacement outside of the routine
maintenance schedule can be more challenging. Currently, Forests can use the information from our
surveys to locate impassable crossings that are candidates for replacement; however the number of
impassable crossings per Forest makes selecting sites an overwhelming task. Survey results only provide
passage status and exclude many other factors that should be considered when prioritizing crossings for
replacement. Information such as miles of habitat upstream of a crossing, cost of replacement, species
presence, and species status (i.e. threatened, endangered, exotic invasive) need to be included in the
decision process. Given the large number of impassable sites, using criteria such as these to prioritize
sites for remediation can be time consuming and overwhelming.
Decision support systems (DSS) can be designed to assist managers faced with complex
prioritization problems such as these. For example, in the case of the crossing assessment project a DSS

12
could be designed that would allow Forests to prioritize watersheds for assessment based on
characteristics such as number of stream crossings, percent Forest ownership, or presence of endangered
species within the watershed. Crossings within the prioritized watersheds that do not pose a threat to fish
passage (i.e. bridges and natural fords) could be eliminated from the surveys prior to field crew visits
saving valuable time. Once inventories are completed the DSS could be used to prioritize impassable
sites for replacement based on factors such as the quantity and quality of habitat that could be opened
upstream of a crossing. A DSS could be a powerful tool, helping Forests focus assessment efforts and
make justifiable fish passage remediation decisions allowing them to more efficiently and effectively
compete for funding.
The results of culvert inventories performed in the Southern Region in summer 2005 demonstrate
the impact of road-stream crossings on aquatic organism passage in southern streams. Future inventories
in the Region will expand the baseline data necessary to meet legislative provisions, prioritize crossings
for replacements, and compete for remediation funds.

13
Literature Cited
Albanese, B., P. L. Angermeier, and C. Gowan. 2003. Designing mark-recapture studies to reduce effects
of distance weighting on movement distance distributions of stream fishes. Transactions of the American Fisheries Society 132:925-939.
Baker, C.O. and F.E. Votapka. 1990. Fish passage through culverts. Report No. FHWA
FL-90-006 USDA Forest Service Technology and Development Center San Dimas, CA. Castro, J. 2003. Geomorphic impacts of culvert replacement and removal: avoiding channel incision. US
Fish and Wildlife Service Oregon State Office, Portland, Or. Clarkin, K., A. Connor, M. J. Furniss, B. Gubernick, M. Love, K. Moynan, and S. W. Musser.
National inventory and assessment procedure for identifying barriers to aquatic organism passage at road-stream crossings. USDA Forest Service, San Dimas Technology and Development Center, San Dimas, Ca.
Coffman, J. S. 2005. Evaluation of a predictive model for upstream fish passage through culverts.
Master’s Thesis, James Madison Univeristy. Harrisonburg, VA. Detenbeck, N.E., P.W. DeVore, G.J. Niemi, and A. Lima. 1992. Recovery of temperate-stream fish
communities from disturbance; areview of case studies and synthesis of theory. Environmental Management 16:33-53.
Fausch, K.D., C.E. Torgersen, C.V. Baxter, and H.W. Li. 2002. Landscapes to riverscapes: bridging the
gap between research and conservation of stream fishes. BioScience 52:483-498. Fausch, K. D. and M. K. Young. 1995. Evolutionary significant units and movement of resident stream
fishes: a cautionary tale. Pages 360-370. in J. L. Nielson, editor. Evolution and the aquatic system: defining unique units in population conservation. American Fisheries Society, Symposium 17, Bethesda, Maryland.
Forman, R. T. T. 2000. Estimate of the area affected ecologically by the road system in the United States.
Conservation Biology 14:31-35. Gerking, S. D. 1959. The restricted movement of fish populations. Biological Reviews 34:221-242. Gowan, C., M. K. Young, K. D. Fausch, and S. C. Riley. 1994. Restricted movement in resident stream
salmonids: a paradigm lost? Canadian Journal of Fisheries and Aquatic Sciences 51:2626-2637. Love, M., S. Firor, M. Furniss, R. Gubernick, T. Dunklin, and R. Quarles. 1999. FishXing (Version 2.2).
Six Rivers National Forest Watershed Interactions Team, USDA Forest Service, San Dimas Technology and Development Center, San Dimas, California. www.stream.fs.fed.us/fishxing
Murphy, G. and M.R. Pyles. 1989. Cost-effective selection of culverts for small forest streams:
minimizing total discounted cost. Journal of Forestry 87:45-50. NRC (National Research Council). 1997. Toward a sustainable future: addressing the long-term effects
of motor vehicle transportation on climate and ecology. National Academy Press, Washington D.C.

14
Roghair, C. N., C. A. Dolloff. 2005. Brook trout movement during and after recolonization of a naturally-defaunated stream reach. North American Journal of Fisheries Management 25:777-784.
Schmetterling, D.A. and S.B. Adams. 2004. Summer movements within the fish community of a small
montane stream. North American Journal of Fisheries Management 24:1163-1172. Walsh, S. J., N. M. Burkhead, and J. D. Williams. 1995. Southeastern freshwater fishes. In Our living
resources: a report to the nation on the distribution, abundance, and health of U.S. plants, animals, and ecosystems. U.S. Department of the Interior, National Biological Service, Washington DC. 144-147.
Warren, M. L., Jr., B. M. Burr, S. J. Walsh, H. L. Bart, Jr., R. C. Cashner, D. A. Etnier, B. J. Freeman, B.
R. Kahajda, R. L. Mayden, H. W. Robison, S. T. Ross, and W. C. Starnes. 2000. Diversity, distribution, and conservation status of the native freshwater fishes of the southern United States. Fisheries (25)10:7-29.
Warren, M. L., Jr., and M. G. Pardew. 1998. Road crossings as barriers to small-stream fish movement.
Transactions of the American Fisheries Society 127:637-644. Winston, M. R., C. M. Taylor, and J. Pigg. 1991. Upstream extirpation of four minnow species due to
damming a prairie stream. Transactions of the American Fisheries Society 120:98-105.

15
Acknowledgements
We would like to thank the CATT culvert field crew for collecting all of the data presented in this
report. The field crew included Catherine Lavagnino, Jeff Zug, and Megan Minter. In addition, we thank
Leigh McDougal and the Southern Region for providing assistance and funding for the surveys, along
with Keith Whalen, Dawn Kirk, John Moran, Tom Counts, Dagmar Thurmond and Vicki Bishop, for
their assistance with field logistics.

16
OSFNF
NFALNFAL
DBNFGWJNF
±0 250 500 750 1,000125Kilometers
Figure 1. National Forests managed lands in the Southern Region. Crossing assessments were conducted during summer 2005 in areas shaded black. GWJNF= George Washington-Jefferson National Forest, DBNF= Daniel Boone National Forest, OSFNF= Ozark-St. Francis National Forest, NFAL= National Forests in Alabama (Bankhead NF, western; Talladega NF, eastern).

17
circular open-bottom arch
pipe arch box
RoadWater surface
ford
Road
vented ford
Figure 2. Common crossing shapes encountered during road-stream crossing inventories conducted in the Southern Region, summer 2005.

18
Fi
gure
3.
Surv
ey p
oint
s mea
sure
d on
cul
verts
(A) a
nd u
nven
ted
ford
s (B
) to
calc
ulat
e pa
ram
eter
s use
d in
coa
rse
filte
rs fo
r ups
tream
fish
pas
sage
A
dapt
ed fr
om C
lark
in e
t al.
2003
. Pa
ram
eter
s are
cal
cula
ted
as fo
llow
s: R
esid
ual I
nlet
dep
th=
P 3 –
P1,
Out
let d
rop=
P2 –
P3,
Out
let p
erch
= P 2
–
Ws,
Slop
e= (P
1ele
v – P
2ele
v) / (
P 1di
st –
P2d
ist)
* 10
0, S
lope
x L
engt
h= [(
P 1el
ev –
P2e
lev)
/ (P 1
dist –
P2d
ist)
* 10
0] *
(P1d
ist –
P2d
ist).
ford
Cul
vert
inle
t (P
1)
Cul
vert
outle
t (P
2)
Tailw
ater
con
trol (
P 3)
Wat
er s
urfa
ce (W
s)
Out
let p
erch
Roa
d su
rface
(Rs)
culv
ert
Cha
nnel
bot
tom
A
Cha
nnel
bot
tom
Cul
vert
inle
t (P
1)
C
ulve
rt ou
tlet (
P2)
Roa
d su
rface
(Rs)
Tailw
ater
con
trol (
P 3)
Wat
er s
urfa
ce (W
s)
B

19
Yes
< 7.
0%≥
7.0%
< 24
in≥
24 in
No
≤50
> 50
& <
600
≥60
0
Res
idua
l inl
et d
epth
≥0.
0O
R
10
0% o
f stru
ctur
e bo
ttom
cov
ered
by
subs
trate
Out
let D
rop
Slo
pe
Slo
pe x
Len
gth
PA
SSA
BLE
IND
ETE
RM
INA
TEIM
PA
SS
AB
LE
Fi
gure
4.
Coa
rse
Filte
r A: P
redi
ctiv
e m
odel
use
d to
det
erm
ine
upst
ream
pas
sage
for f
ish
with
swim
min
g an
d le
apin
g ab
ilitie
s sim
ilar t
o ad
ult t
rout
. A
resi
dual
inle
t dep
th ≥
0.0
(Fig
ure
2) in
dica
tes s
truct
ure
is fu
lly b
ackw
ater
ed.
An
outle
t per
ch o
f 14
in. w
as u
sed
whe
n ou
tlet d
rop
coul
d no
t be
calc
ulat
ed (C
offm
an 2
005)
.

20
Yes
< 3.
5%≥
3.5%
< 10
in≥
10 in
No
≤25
> 25
& <
200
≥20
0
Res
idua
l inl
et d
epth
≥ 0
.0 O
R
10
0% o
f stru
ctur
e bo
ttom
cov
ered
by
subs
trate
Out
let D
rop
Slo
pe
Slo
pe x
Len
gth
PA
SSA
BLE
IND
ETE
RM
INA
TEIM
PA
SS
AB
LE
Fi
gure
5.
Coa
rse
Filte
r B: P
redi
ctiv
e m
odel
use
d to
det
erm
ine
upst
ream
pas
sage
for f
ish
with
swim
min
g an
d le
apin
g ab
ilitie
s sim
ilar t
o m
inno
ws
and
juve
nile
trou
t. A
resi
dual
inle
t dep
th ≥
0.0
(Fig
ure
2) in
dica
tes p
ipe
is fu
lly b
ackw
ater
ed.
An
outle
t per
ch o
f 5 in
. was
use
d w
hen
outle
t dro
p co
uld
not b
e ca
lcul
ated
(Cof
fman
200
5).

21
Yes
< 3.
5%≥
3.5%
< 4
in≥
4 in
No
≤15
> 15
& <
150
≥15
0
Res
idua
l inl
et d
epth
≥ 0
.0 O
R
10
0% o
f stru
ctur
e bo
ttom
cov
ered
by
subs
trate
Out
let D
rop
Slo
pe
Slo
pe x
Len
gth
PA
SSA
BLE
IND
ETE
RM
INA
TEIM
PA
SS
AB
LE
Fi
gure
6.
Coa
rse
Filte
r C: P
redi
ctiv
e m
odel
use
d to
det
erm
ine
upst
ream
pas
sage
for f
ish
with
swim
min
g an
d le
apin
g ab
ilitie
s sim
ilar t
o da
rters
and
sc
ulpi
ns.
A re
sidu
al in
let d
epth
≥ 0
.0 (F
igur
e 2)
indi
cate
s pip
e is
fully
bac
kwat
ered
. A
n ou
tlet p
erch
of 2
in. w
as u
sed
whe
n ou
tlet d
rop
coul
d no
t be
cal
cula
ted
(Cof
fman
200
5).

22
impassable passable indeterminate
perc
enta
ge
0102030405060708090
100
n=64n=89
n=144
Figure 7. Percentage of crossings classified as impassable, passable, or indeterminate by Filter A; Southern Region (all Forests combined), summer 2005 (N=297).
impassable passable indeterminate
perc
enta
ge
0102030405060708090
100
n=188
n=64n=45
Figure 8. Percentage of crossings classified as impassable, passable, or indeterminate by Filter B; Southern Region (all Forests combined), summer 2005 (N=297).
impassable passable indeterminate
perc
enta
ge
0102030405060708090
100
n=239
n=36n=22
Figure 9. Percentage of crossings classified as impassable, passable, or indeterminate by Filter C; Southern Region (all Forests combined), summer 2005 (N=297).

23
GWJ DB OSF NFAL
perc
enta
ge
0102030405060708090
100 impassablepassableindeterminate
n=104 n=83 n=35 n=75
Figure 10. Percentage of crossings classified as impassable, passable, or indeterminate by Filter A; Southern Region (by Forest) summer 2005. GWJ=George Washington-Jefferson, DB=Daniel Boone, OSF=Ozark-St. Francis, and NFAL=National Forests in Alabama.
GWJ DB OSF NFAL
perc
enta
ge
0102030405060708090
100impassablepassableindeterminate
n=104 n=83 n=35 n=75
Figure 11. Percentage of crossings classified as impassable, passable, or indeterminate by Filter B; Southern Region (by Forest) summer 2005. GWJ=George Washington-Jefferson, DB=Daniel Boone, OSF=Ozark-St. Francis, and NFAL=National Forests in Alabama.
GWJ DB OSF NFAL
perc
enta
ge
0102030405060708090
100impassablepassableindeterminate
n=104 n=83 n=35 n=75
Figure 12. Percentage of crossings classified as impassable, passable, or indeterminate by Filter C; Southern Region (by Forest) summer 2005. GWJ=George Washington/ Jefferson, DB=Daniel Boone, OSF=Ozark/ St. Francis, and NFAL=National Forests in Alabama.

24
circular ford box
perc
enta
ge
0102030405060708090
100 impassablepassableindeterminate
n=145 n=88 n=10 n=28 n=8 n=18
openbottom
arch
pipearch
ventedford
Figure 13. Percentage of each crossing type classified as impassable, passable, or indeterminate by Filter A; Southern Region (all Forests combined) summer 2005.
circular ford box
perc
enta
ge
0102030405060708090
100impassablepassableindeterminate
n=145 n=88 n=10 n=28 n=8 n=18
openbottom
arch
pipearch
ventedford
Figure 14. Percentage of each crossing type classified as impassable, passable, or indeterminate by Filter B; Southern Region (all Forests combined) summer 2005.
circular ford box
perc
enta
ge
0102030405060708090
100impassablepassableindeterminate
n=145 n=88 n=10 n=28 n=8 n=18
openbottom
arch
pipearch
ventedford
Figure 15. Percentage of each crossing type classified as impassable, passable, or indeterminate by Filter C; Southern Region (all Forests combined) summer 2005.

25
ALL_NF GWJ DB OSF NFAL
Cro
ssin
g W
idth
/ C
hann
el W
idth
0.00.20.40.60.81.01.21.41.61.8
n=177 n=80 n=42 n=12 n=43
Figure 16. Crossing width to bankfull channel width ratio for crossings surveyed in summer 2005 (excluding fords, vented fords, and multiple structure crossings). A ratio of 1.0 (dashed line) or greater indicates the crossing structure opening is greater than or equal to the bankfull channel width. ALL_NF=Forests combined, GWJ=George Washington-Jefferson, DB=Daniel Boone, OSF=Ozark-St. Francis, and NFAL=National Forests in Alabama. The top and bottom of the boxes represent the 25th and 75th percentiles, the bar in the center of each box represents the median, whiskers represent the 10th and 90th percentiles, and closed circles represent the entire range of the data.
26
Tabl
e 1.
Num
ber o
f cro
ssin
gs d
ocum
ente
d (T
otal
cro
ssin
gs d
ocum
ente
d) a
nd n
umbe
r not
surv
eyed
(Cro
ssin
gs n
ot su
rvey
ed) o
n Fo
rests
vis
ited
in
sum
mer
200
5. R
easo
ns fo
r not
surv
eyin
g a
docu
men
ted
site
incl
ude:
no
suita
ble
fish
habi
tat u
pstre
am o
f cro
ssin
g (N
H);
no a
cces
s to
site
due
to
clos
ed ro
ads o
r priv
ate
gate
s (N
A);
cros
sing
was
a n
atur
al fo
rd (N
F); c
ross
ing
was
a b
ridge
(BR
). F
ores
t To
tal c
ross
ing
Cro
ssin
g no
t sur
veye
d (n
, [%
])
docu
men
ted
NH
N
A
NF
BR
To
tal n
ot su
rvey
ed
GW
JNF
258
80 (5
2)
51 (3
3)
23 (1
5)
0 (0
) 15
4 (6
0)
DB
NF
206
28 (2
3)
61 (5
0)
21 (1
7)
13 (1
0)
123
(60)
O
SFN
F 72
4 85
(12)
39
6 (5
7)
191
(28)
17
(3)
689
(95)
N
FAL
149
17 (2
3)
35 (4
7)
6 (8
) 16
(22)
74
(50)
To
tal
1337
21
0 (2
0)
543
(52)
24
1 (2
3)
46 (4
) 10
40 (7
8)
Tabl
e 2.
Num
ber o
f cro
ssin
gs su
rvey
ed (T
otal
surv
eyed
) with
coa
rse
filte
r res
ults
for F
ores
ts v
isite
d in
sum
mer
200
5. C
oars
e fil
ter r
esul
ts a
re
pres
ente
d fo
r Filt
er A
, Filt
er B
, and
Filt
er C
(see
filte
r des
crip
tions
, Fig
3 –
5).
For
est
Tota
l
Coa
rse
filte
r res
ults
surv
eyed
Impa
ssab
le (n
, [%
])
Pa
ssab
le (n
, [%
])
In
dete
rmin
ate
(n, [
%])
A 1
B
1
C 1
A 1
B
1
C 1
A 1
B
1
C 1
G
WJN
F 10
4
38 (3
7)
74 (7
1)
83 (8
0)
18
(17)
11
(11)
10
(9)
48
(46)
19
(18)
11
(11)
D
BN
F 83
18 (2
2)
50 (6
0)
72 (8
7)
24
(29)
12
(14)
8
(10)
41 (4
9)
21 (2
5)
3 (4
) O
SFN
F 35
4 (1
1)
22 (6
3)
27 (7
7)
18
(51)
7
(20)
5
(14)
13 (3
7)
6 (1
7)
3 (9
) N
FAL
75
4
(5)
42 (5
6)
57 (7
6)
29
(39)
15
(20)
13
(17)
42 (5
6)
18 (2
4)
5 (7
) To
tal
297
64
(22)
18
8 (6
3)
239
(81)
89 (3
0)
45 (1
5)
36 (1
2)
14
4 (4
9)
64 (2
2)
22 (7
)

27
Table 3. Number of crossings (percentage in parentheses) classified as impassable due to excessive outlet drop, excessive slope, or excessive slope x length values for each coarse filter; Southern Region (all Forests combined), summer 2005. Filter A Filter B Filter C Outlet drop 39 (61) 139 (74) 203 (85) Slope 24 (37) 47 (25) 33 (14) Slope*Length 1 (2) 2 (1) 3 (1) Total 64 (22) 188 (63) 239 (81)
Table 4. Number of each crossing type (percentage in parentheses) classified as impassable, passable, or indeterminate for each coarse filter; Southern Region (all Forests combined) during summer 2005.
Classification crossing type Filter A Filter B Filter C Impassable circular 37 (25) 102 (70) 129 (89) pipe arch 21 (24) 59 (67) 69 (78) vented ford 0 (0) 4 (40) 5 (50) ford 5 (18) 14 (50) 23 (82) open bottom arch 0 (0) 0 (0) 0 (0) box 1 (6) 9 (50) 13 (72) Passable circular 27 (19) 9 (6) 7 (5) pipe arch 18 (20) 9 (10) 8 (9) vented ford 7 (70) 4 (40) 4 (40) ford 19 (68) 8 (29) 4 (14) open bottom arch 8 (100) 8 (100) 8 (100) box 10 (55) 7 (39) 5 (28) Indeterminate circular 81 (56) 34 (24) 9 (6) pipe arch 49 (56) 20 (23) 11 (13) vented ford 3 (30) 2 (20) 1 (10) ford 4 (14) 6 (21) 1 (4) open bottom arch 0 (0) 0 (0) 0 (0) box 7 (39) 2 (11) 0 (0)

28
Appendix A: Results for the George Washington-Jefferson National Forest

29
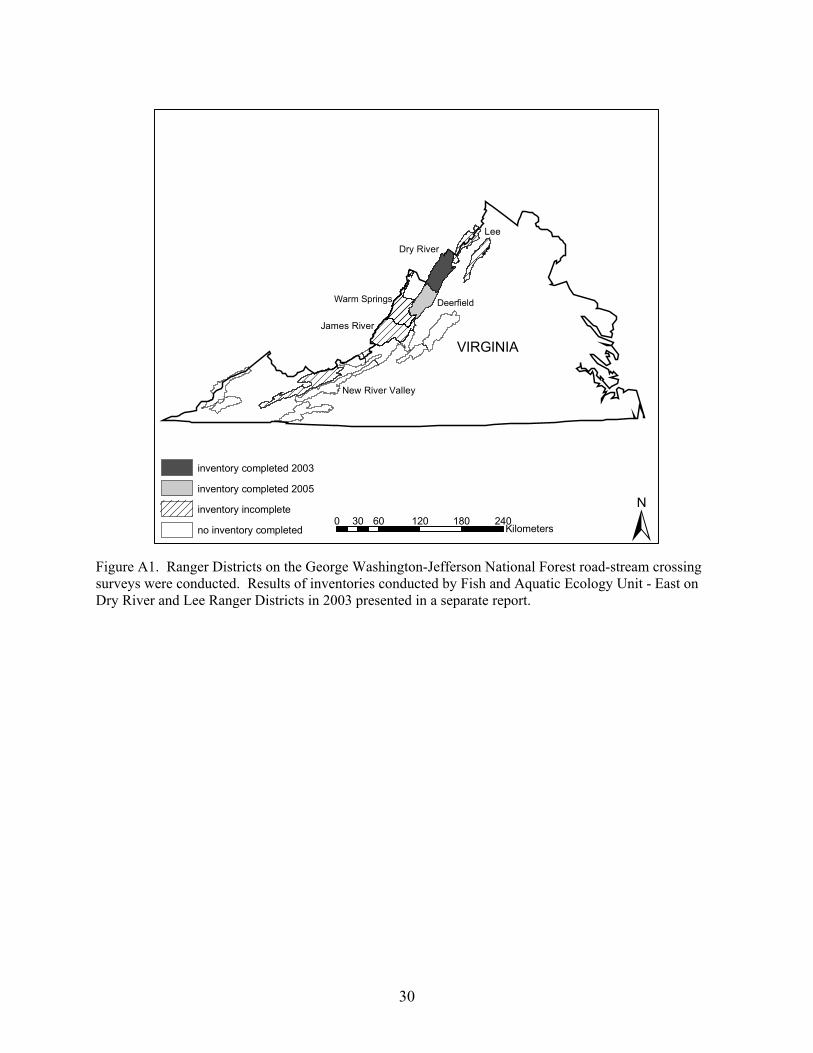
We visited 258 crossings on the Deerfield, Warm Springs, James River, and New River Valley
Ranger Districts in 2005 (Figure A1, Table A1) and completed surveys on 40% (n=104) (Table A2).
Filter A (strong swimmers and leapers) classified 37% (n=38) of crossings as impassable, 17% (n=18) as
passable, and 46% (n=48) as indeterminate (Figure A2, Table A2). Filter B (moderate swimmers and
leapers) classified 71% (n=74) of crossings as impassable, 11% (n=11) as passable, and 18% (n=19) as
indeterminate (Figure A3, Table A2). Filter C (weak swimmers and leapers) classified 80% (n=83) of
crossings as impassable, 9% (n=10) as passable, and 11% (n=11) as indeterminate (Figure A4, Table A2).
Characteristics and filter classifications for each crossing are presented in Tables A3-A5.
The majority of the crossings surveyed were either circular culverts (n=46) or pipe arches (n=52),
while open bottom arches (n=5), fords (n=1), vented fords (n=0), and box culverts (n=0) were less
frequently encountered. Filter A classified 39% of circular culverts and 38% of pipe arch crossings as
impassable (Figure A5). Filter B classified 80% of circular culverts and 71% of pipe arch crossings as
impassable (Figure A6). Filter C classified 91% of circular culverts and 79% of pipe arch crossings as
impassable (Figure A7). The 5 open bottom arches and 1 ford surveyed were passable for all 3 filters.
The mean crossing width to channel width ratio for surveyed structures (excluding fords and multiple
structure crossings) (n=80) was 0.54 (SD=0.22), and five crossings were greater than or equal to the mean
bankfull channel width, three of which were open bottom arches (Figure A8).
30
DeerfieldWarm Springs
VIRGINIA
Lee
Dry River
James River
New River Valley
0 60 120 180 24030Kilometers ±
inventory completed 2003
inventory completed 2005
inventory incomplete
no inventory completed
Figure A1. Ranger Districts on the George Washington-Jefferson National Forest road-stream crossing surveys were conducted. Results of inventories conducted by Fish and Aquatic Ecology Unit - East on Dry River and Lee Ranger Districts in 2003 presented in a separate report.

31
impassable passable indeterminate
perc
enta
ge
0102030405060708090
100
n=38
n=18
n=48
Figure A2. Percentage of crossings classified as impassable, passable, or indeterminate by Filter A; George Washington-Jefferson National Forest, summer 2005 (n=104).
impassable passable indeterminate
perc
enta
ge
0102030405060708090
100
n=74
n=11n=19
Figure A3. Percentage of crossings classified as impassable, passable, or indeterminate by Filter B; George Washington-Jefferson National Forest, summer 2005 (n=104).
impassable passable indeterminate
perc
enta
ge
0102030405060708090
100
n=83
n=10 n=11
Figure A4. Percentage of crossings classified as impassable, passable, or indeterminate by Filter C; George Washington-Jefferson National Forest, summer 2005 (n=104).

32
circular ford box
perc
enta
ge
0102030405060708090
100 impassablepassableindeterminate
pipearch
openbottom
arch
ventedford
n=46 n=52 n=1 n=5 n=0 n=0
Figure A5. Percentage of each crossing type classified as impassable, passable, or indeterminate by Filter A; George Washington-Jefferson National Forest, summer 2005 (N=104).
circular ford box
perc
enta
ge
0102030405060708090
100 impassablepassableindeterminate
pipearch
openbottom
arch
ventedford
n=46 n=52 n=1 n=5 n=0 n=0
Figure A6. Percentage of each crossing type classified as impassable, passable, or indeterminate by Filter B; George Washington-Jefferson National Forest, summer 2005 (N=104).
circular ford box
perc
enta
ge
0102030405060708090
100 impassablepassableindeterminate
pipearch
openbottom
arch
ventedford
n=46 n=52 n=1 n=5 n=0 n=0
Figure A7. Percentage of each crossing type classified as impassable, passable, or indeterminate by Filter C; George Washington-Jefferson National Forest, summer 2005 (N=104).

33
GWJNF
Cro
ssin
g W
idth
/ C
hann
el W
idth
0.00.20.40.60.81.01.21.41.61.8
n=80
Figure A8. Crossing width to bankfull channel width ratio for crossings surveyed in summer 2005 on the George Washington-Jefferson National Forest (excluding fords, vented fords, and multiple structure crossings). A ratio of 1.0 (dashed line) or greater indicates the crossing structure opening is greater than or equal to the bankfull channel width. The top and bottom of the boxes represent the 25th and 75th percentiles, the bar in the center of each box represents the median, whiskers represent the 10th and 90th percentiles, and closed circles represent the entire range of the data.

34
!
!
!
!
!
!!!
!
!
!
!
!!
!!!
!!
!!! !!
!
!!!
! !!
!!!
!
!
!
!
!
!!
!!!
!!!!
!
!
!
!
!
!
!
!!!!
!
!!!
!
!
!
!
!!
!
!!!
!!
!
!
!
!!!!
! !
!!
!!
DDDDD
((((((
DDDD
!
!
!
DDD( !!
!!!
!!
!!!
!D
DD
!!!
!
!
!!
!!
!!
!!
!!! !
!!!!!!(
!
!!
D
DDD
D
D
D
!!!!
DDD
DD
DDDDDDDDD
!
!
((((((((((
D
D
DD
(
!!!!!!!!!
!!!!!!
D
!!!!!
!!
(
!!
! !
!!!D
DD
!!
(((
DD
(
!
!
!
!
VIRGINIA
WEST VIRGINIA
±0 10 20 30 405Kilometers
( natural ford
GW/Jeff NF6th level watershed
! impassable! indeterminate! passableD no access
! insufficient upstream habitat
!
!!
!
!!
!
!
!
!
!
!!
!!
!
!
!!
!
!
!
!!!!
!!
!!
!!!!
!!!!
!!
!!!
!
!!
!
!! !!
!
!
!
!!!!
!!!
!!!!
!!!!!
!
!
!
!!!!!
!
!!
!
!
!!
!
!
!
DDDDD
((((((
DDDD
!
!
!
DDD( !!
!!!
!!
!!!
!D
DD
!!!
!
!
!!
!!
!!
!!
!!! !
!!!!!!(
!
!!
D
DDD
D
D
D
!!!!
DDD
DDDDDDDDDDD
!
!
((((((((((
D
D
DD
(
!!!!!!!!!
!!!!!!
D
!!!!!
!!
(
!!
! !!!!D
DD
!!
(((
DD
(
!
!
!
!
VIRGINIA
WEST VIRGINIA
±0 10 20 30 405Kilometers
( natural ford
GW/Jeff NF6th level watershed
! impassable! indeterminate! passableD no access
! insufficient upstream habitat
<Double click here to enter title>
!
!
!
!!
!
!
!
!
!
!
!
!
!
!
!
!!!
!!
!!
!!!!
!!!!
!!
!!!
!
!!
!
!!
!! !!
!
!
!
!
!!!!
!!!
!!!!
!!!!!
!
!
!
!!!
!
!!
!
!!
!
!
!
!!
!!
!!
!
DDDDD
((((((
DDDD
!
!
!
DDD( !!
!!!
!!
!!!
!D
DD
!!!
!
!
!!
!!
!!
!!
!!! !
!!!!!!(
!
!!
D
DDD
D
D
D
!!!!
DDD
DD
DDDDDDDDD
!
!
((((((((((
D
D
DD
(
!!!!!!!!!
!!!!!!
D
!!!!!
!!
(
!!
! !!!!D
DD
!!
(((
DD
(
!
!
!
!
VIRGINIA
WEST VIRGINIA
±0 10 20 30 405Kilometers
( natural ford
GW/Jeff NF6th level watershed
! impassable! indeterminate! passableD no access
! insufficient upstream habitat
Figure A9. Location of crossings classified for fish passage by coarse filters A, B, and C within 6th level watersheds, and crossings not surveyed on the George Washington-Jefferson National Forest, summer 2005.
Filter A
Filter B
Filter C

35
Tabl
e A
1. N
umbe
r of c
ross
ings
doc
umen
ted
(Tot
al c
ross
ings
doc
umen
ted)
and
not
surv
eyed
(cro
ssin
gs n
ot su
rvey
ed) o
n th
e G
WJN
F in
sum
mer
20
05.
Rea
sons
for n
ot su
rvey
ing
a do
cum
ente
d si
te in
clud
e: n
o su
itabl
e fis
h ha
bita
t ups
tream
of c
ross
ing
(NH
); no
acc
ess t
o si
te d
ue to
clo
sed
road
s or p
rivat
e ga
tes (
NA
); cr
ossi
ng w
as a
nat
ural
ford
(NF)
; cro
ssin
g w
as a
brid
ge (B
R).
For
est
Tota
l cro
ssin
g C
ross
ings
not
surv
eyed
(n, [
%])
do
cum
ente
d N
H
NA
N
F B
R
Tota
l not
surv
eyed
G
WJN
F 25
8 80
(52)
51
(33)
23
(15)
0
(0)
154
(60)
Ta
ble
A2.
Num
ber o
f cro
ssin
gs su
rvey
ed (T
otal
surv
eyed
) with
coa
rse
filte
r res
ults
for t
he G
WJN
F in
sum
mer
200
5. C
oars
e fil
ter r
esul
ts a
re
pres
ente
d fo
r Filt
er A
, Filt
er B
, and
Filt
er C
(see
filte
r des
crip
tions
, Fig
3 –
5).
For
est
Tota
l
Coa
rse
filte
r res
ults
surv
eyed
Impa
ssab
le (n
, [%
])
Pa
ssab
le (n
, [%
])
In
dete
rmin
ate
(n, [
%])
A 1
B
1
C 1
A 1
B
1
C 1
A 1
B
1
C 1
G
WJN
F 10
4
38 (3
7)
74 (7
1)
83 (8
0)
18
(17)
11
(11)
10
(10)
48 (4
6)
19 (1
8)
10 (1
1)

36
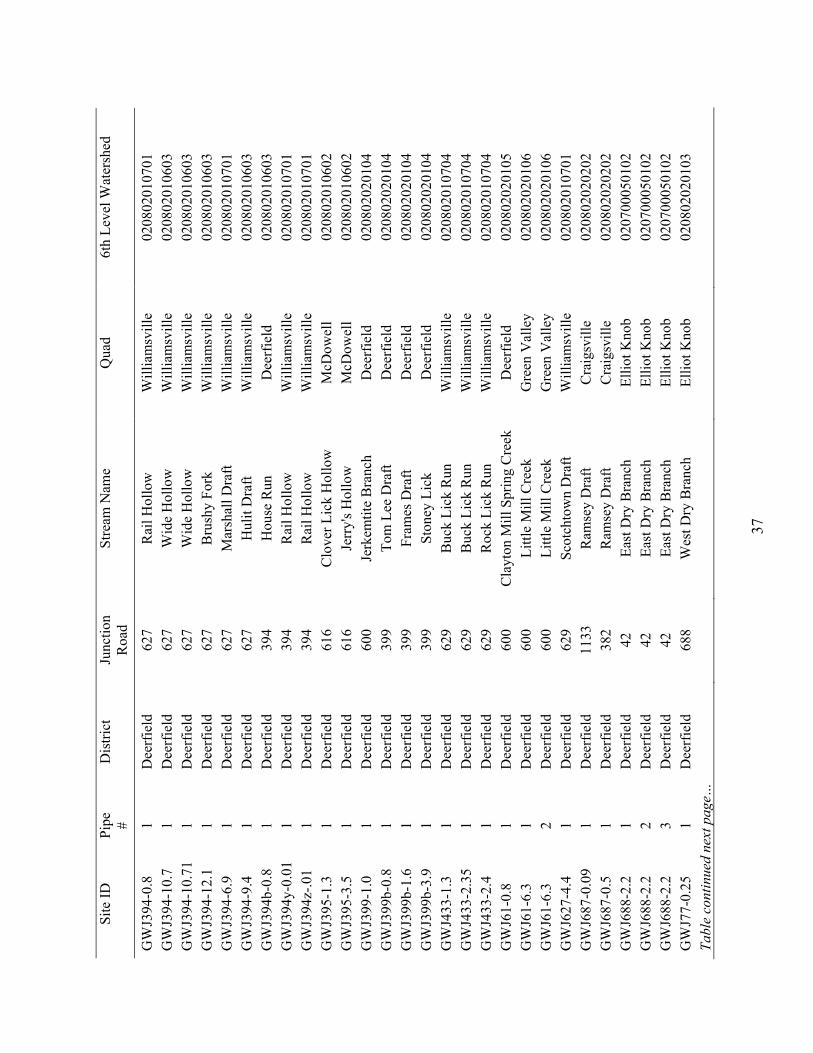
Tabl
e A
3. L
ocat
ion
of c
ross
ings
surv
eyed
on
the
Geo
rge
Was
hing
ton-
Jeff
erso
n N
atio
nal F
ores
t dur
ing
the
sum
mer
of 2
005.
Site
ID c
onsi
sts o
f th
e Fo
rest
abb
revi
atio
n (G
WJ)
, roa
d th
e cr
ossi
ng is
on
(157
6), a
nd th
e di
stan
ce (m
iles)
from
the
junc
tion
road
(0.4
). Si
te ID
Pi
pe
# D
istri
ct
Junc
tion
Roa
d St
ream
Nam
e Q
uad
6th
Leve
l Wat
ersh
ed
GW
J157
6-0.
4 1
Dee
rfie
ld
61
Cla
yton
Mill
Spr
ing
Cre
ek
Dee
rfie
ld
0208
0202
0105
G
WJ2
55-0
.9
1 D
eerf
ield
17
3 H
ollo
way
Dra
ft D
eerf
ield
02
0802
0201
03
GW
J255
-0.9
2
Dee
rfie
ld
173
Hol
low
ay D
raft
Dee
rfie
ld
0208
0202
0103
G
WJ2
55-4
.5
1 D
eerf
ield
62
9 R
ock
lick
Dee
rfie
ld
0208
0202
0103
G
WJ2
55-4
.6
1 D
eerf
ield
62
9 R
ock
lick
Dee
rfie
ld
0208
0202
0103
G
WJ2
55-4
.6
2 D
eerf
ield
62
9 R
ock
lick
Dee
rfie
ld
0208
0202
0103
G
WJ3
81-0
.1
1 D
eerf
ield
82
Fr
idle
y B
ranc
h El
liot K
nob
0208
0202
0105
G
WJ3
81-0
.1
2 D
eerf
ield
82
Fr
idle
y B
ranc
h El
liot K
nob
0208
0202
0105
G
WJ3
81-3
.6
1 D
eerf
ield
82
Sc
ott H
ollo
w
Dee
rfie
ld
0208
0202
0105
G
WJ3
81-4
.65
1 D
eerf
ield
82
U
T K
iser
Hol
low
D
eerf
ield
02
0802
0201
05
GW
J382
-1.2
1
Dee
rfie
ld
82
Arc
her R
un
Aug
usta
Spr
ings
02
0802
0202
01
GW
J382
-2.3
1
Dee
rfie
ld
82
Gum
Lic
k H
ollo
w
Aug
usta
Spr
ings
02
0802
0202
01
GW
J382
-4.3
1
Dee
rfie
ld
82
Ken
nedy
Dra
ft A
ugus
ta S
prin
gs
0208
0202
0201
G
WJ3
82-5
.5
1 D
eerf
ield
82
Ta
ylor
Hol
low
C
raig
svill
e 02
0802
0202
01
GW
J382
-6.5
1
Dee
rfie
ld
82
Stap
les H
ollo
w
Cra
igsv
ille
0208
0202
0201
G
WJ3
82-7
.1
1 D
eerf
ield
82
St
oupl
es H
ollo
w
Cra
igsv
ille
0208
0202
0201
G
WJ3
82-7
.15
1 D
eerf
ield
82
St
oupl
es H
ollo
w
Cra
igsv
ille
0208
0202
0201
G
WJ3
82-9
.6
1 D
eerf
ield
82
W
alla
ce D
raft
Cra
igsv
ille
0208
0202
0201
G
WJ3
82-9
.9
1 D
eerf
ield
82
W
alla
ce D
raft
Cra
igsv
ille
0208
0202
0201
G
WJ3
83h-
.001
1
Dee
rfie
ld
42
Fall
Bra
nch
Ellio
t Kno
b 02
0802
0202
01
GW
J383
h-.0
01
2 D
eerf
ield
42
Fa
ll B
ranc
h El
liot K
nob
0208
0202
0201
G
WJ3
87-0
.05
1 D
eerf
ield
61
Li
ttle
Mill
Cre
ek
Gre
en V
alle
y 02
0802
0201
06
GW
J393
-0.2
1
Dee
rfie
ld
173
Left
Fork
Hal
low
ay D
raft
Dee
rfie
ld
0208
0202
0103
G
WJ3
94-0
.39
1 D
eerf
ield
62
7 R
ail H
ollo
w
Will
iam
svill
e 02
0802
0107
01
GW
J394
-0.4
1
Dee
rfie
ld
627
Rai
l Hol
low
W
illia
msv
ille
0208
0201
0701
Ta
ble
cont
inue
d ne
xt p
age…
37
Site
ID
Pipe
#
Dis
trict
Ju
nctio
n R
oad
Stre
am N
ame
Qua
d 6t
h Le
vel W
ater
shed
GW
J394
-0.8
1
Dee
rfie
ld
627
Rai
l Hol
low
W
illia
msv
ille
0208
0201
0701
G
WJ3
94-1
0.7
1 D
eerf
ield
62
7 W
ide
Hol
low
W
illia
msv
ille
0208
0201
0603
G
WJ3
94-1
0.71
1
Dee
rfie
ld
627
Wid
e H
ollo
w
Will
iam
svill
e 02
0802
0106
03
GW
J394
-12.
1 1
Dee
rfie
ld
627
Bru
shy
Fork
W
illia
msv
ille
0208
0201
0603
G
WJ3
94-6
.9
1 D
eerf
ield
62
7 M
arsh
all D
raft
Will
iam
svill
e 02
0802
0107
01
GW
J394
-9.4
1
Dee
rfie
ld
627
Hul
it D
raft
Will
iam
svill
e 02
0802
0106
03
GW
J394
b-0.
8 1
Dee
rfie
ld
394
Hou
se R
un
Dee
rfie
ld
0208
0201
0603
G
WJ3
94y-
0.01
1
Dee
rfie
ld
394
Rai
l Hol
low
W
illia
msv
ille
0208
0201
0701
G
WJ3
94z-
.01
1 D
eerf
ield
39
4 R
ail H
ollo
w
Will
iam
svill
e 02
0802
0107
01
GW
J395
-1.3
1
Dee
rfie
ld
616
Clo
ver L
ick
Hol
low
M
cDow
ell
0208
0201
0602
G
WJ3
95-3
.5
1 D
eerf
ield
61
6 Je
rry'
s Hol
low
M
cDow
ell
0208
0201
0602
G
WJ3
99-1
.0
1 D
eerf
ield
60
0 Je
rkem
tite
Bra
nch
Dee
rfie
ld
0208
0202
0104
G
WJ3
99b-
0.8
1 D
eerf
ield
39
9 To
m L
ee D
raft
Dee
rfie
ld
0208
0202
0104
G
WJ3
99b-
1.6
1 D
eerf
ield
39
9 Fr
ames
Dra
ft D
eerf
ield
02
0802
0201
04
GW
J399
b-3.
9 1
Dee
rfie
ld
399
Ston
ey L
ick
Dee
rfie
ld
0208
0202
0104
G
WJ4
33-1
.3
1 D
eerf
ield
62
9 B
uck
Lick
Run
W
illia
msv
ille
0208
0201
0704
G
WJ4
33-2
.35
1 D
eerf
ield
62
9 B
uck
Lick
Run
W
illia
msv
ille
0208
0201
0704
G
WJ4
33-2
.4
1 D
eerf
ield
62
9 R
ock
Lick
Run
W
illia
msv
ille
0208
0201
0704
G
WJ6
1-0.
8 1
Dee
rfie
ld
600
Cla
yton
Mill
Spr
ing
Cre
ek
Dee
rfie
ld
0208
0202
0105
G
WJ6
1-6.
3 1
Dee
rfie
ld
600
Littl
e M
ill C
reek
G
reen
Val
ley
0208
0202
0106
G
WJ6
1-6.
3 2
Dee
rfie
ld
600
Littl
e M
ill C
reek
G
reen
Val
ley
0208
0202
0106
G
WJ6
27-4
.4
1 D
eerf
ield
62
9 Sc
otch
tow
n D
raft
Will
iam
svill
e 02
0802
0107
01
GW
J687
-0.0
9 1
Dee
rfie
ld
1133
R
amse
y D
raft
Cra
igsv
ille
0208
0202
0202
G
WJ6
87-0
.5
1 D
eerf
ield
38
2 R
amse
y D
raft
Cra
igsv
ille
0208
0202
0202
G
WJ6
88-2
.2
1 D
eerf
ield
42
Ea
st D
ry B
ranc
h El
liot K
nob
0207
0005
0102
G
WJ6
88-2
.2
2 D
eerf
ield
42
Ea
st D
ry B
ranc
h El
liot K
nob
0207
0005
0102
G
WJ6
88-2
.2
3 D
eerf
ield
42
Ea
st D
ry B
ranc
h El
liot K
nob
0207
0005
0102
G
WJ7
7-0.
25
1 D
eerf
ield
68
8 W
est D
ry B
ranc
h El
liot K
nob
0208
0202
0103
Ta
ble
cont
inue
d ne
xt p
age…
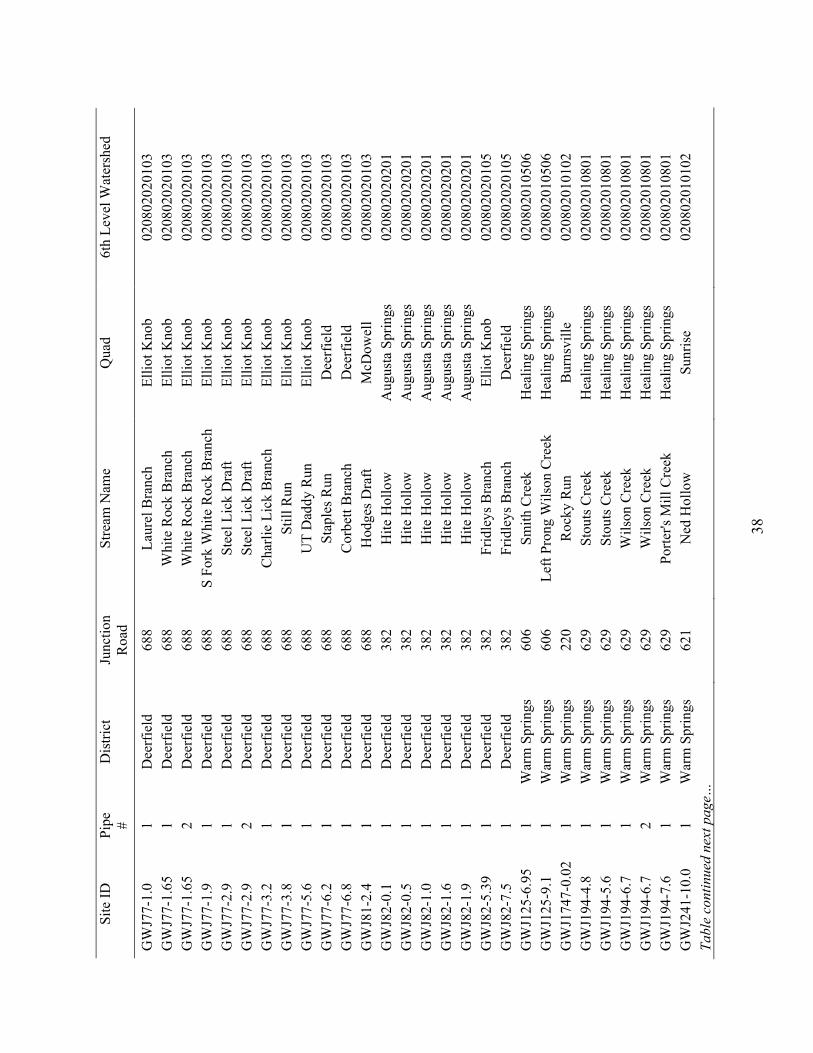
38
Site
ID
Pipe
#
Dis
trict
Ju
nctio
n R
oad
Stre
am N
ame
Qua
d 6t
h Le
vel W
ater
shed
GW
J77-
1.0
1 D
eerf
ield
68
8 La
urel
Bra
nch
Ellio
t Kno
b 02
0802
0201
03
GW
J77-
1.65
1
Dee
rfie
ld
688
Whi
te R
ock
Bra
nch
Ellio
t Kno
b 02
0802
0201
03
GW
J77-
1.65
2
Dee
rfie
ld
688
Whi
te R
ock
Bra
nch
Ellio
t Kno
b 02
0802
0201
03
GW
J77-
1.9
1 D
eerf
ield
68
8 S
Fork
Whi
te R
ock
Bra
nch
Ellio
t Kno
b 02
0802
0201
03
GW
J77-
2.9
1 D
eerf
ield
68
8 St
eel L
ick
Dra
ft El
liot K
nob
0208
0202
0103
G
WJ7
7-2.
9 2
Dee
rfie
ld
688
Stee
l Lic
k D
raft
Ellio
t Kno
b 02
0802
0201
03
GW
J77-
3.2
1 D
eerf
ield
68
8 C
harli
e Li
ck B
ranc
h El
liot K
nob
0208
0202
0103
G
WJ7
7-3.
8 1
Dee
rfie
ld
688
Still
Run
El
liot K
nob
0208
0202
0103
G
WJ7
7-5.
6 1
Dee
rfie
ld
688
UT
Dad
dy R
un
Ellio
t Kno
b 02
0802
0201
03
GW
J77-
6.2
1 D
eerf
ield
68
8 St
aple
s Run
D
eerf
ield
02
0802
0201
03
GW
J77-
6.8
1 D
eerf
ield
68
8 C
orbe
tt B
ranc
h
Dee
rfie
ld
0208
0202
0103
G
WJ8
1-2.
4 1
Dee
rfie
ld
688
Hod
ges D
raft
McD
owel
l 02
0802
0201
03
GW
J82-
0.1
1 D
eerf
ield
38
2 H
ite H
ollo
w
Aug
usta
Spr
ings
02
0802
0202
01
GW
J82-
0.5
1 D
eerf
ield
38
2 H
ite H
ollo
w
Aug
usta
Spr
ings
02
0802
0202
01
GW
J82-
1.0
1 D
eerf
ield
38
2 H
ite H
ollo
w
Aug
usta
Spr
ings
02
0802
0202
01
GW
J82-
1.6
1 D
eerf
ield
38
2 H
ite H
ollo
w
Aug
usta
Spr
ings
02
0802
0202
01
GW
J82-
1.9
1 D
eerf
ield
38
2 H
ite H
ollo
w
Aug
usta
Spr
ings
02
0802
0202
01
GW
J82-
5.39
1
Dee
rfie
ld
382
Frid
leys
Bra
nch
Ellio
t Kno
b 02
0802
0201
05
GW
J82-
7.5
1 D
eerf
ield
38
2 Fr
idle
ys B
ranc
h D
eerf
ield
02
0802
0201
05
GW
J125
-6.9
5 1
War
m S
prin
gs
606
Smith
Cre
ek
Hea
ling
Sprin
gs
0208
0201
0506
G
WJ1
25-9
.1
1 W
arm
Spr
ings
60
6 Le
ft Pr
ong
Wils
on C
reek
H
ealin
g Sp
rings
02
0802
0105
06
GW
J174
7-0.
02
1 W
arm
Spr
ings
22
0 R
ocky
Run
B
urns
ville
02
0802
0101
02
GW
J194
-4.8
1
War
m S
prin
gs
629
Stou
ts C
reek
H
ealin
g Sp
rings
02
0802
0108
01
GW
J194
-5.6
1
War
m S
prin
gs
629
Stou
ts C
reek
H
ealin
g Sp
rings
02
0802
0108
01
GW
J194
-6.7
1
War
m S
prin
gs
629
Wils
on C
reek
H
ealin
g Sp
rings
02
0802
0108
01
GW
J194
-6.7
2
War
m S
prin
gs
629
Wils
on C
reek
H
ealin
g Sp
rings
02
0802
0108
01
GW
J194
-7.6
1
War
m S
prin
gs
629
Porte
r's M
ill C
reek
H
ealin
g Sp
rings
02
0802
0108
01
GW
J241
-10.
0 1
War
m S
prin
gs
621
Ned
Hol
low
Su
nris
e 02
0802
0101
02
Tabl
e co
ntin
ued
next
pag
e…
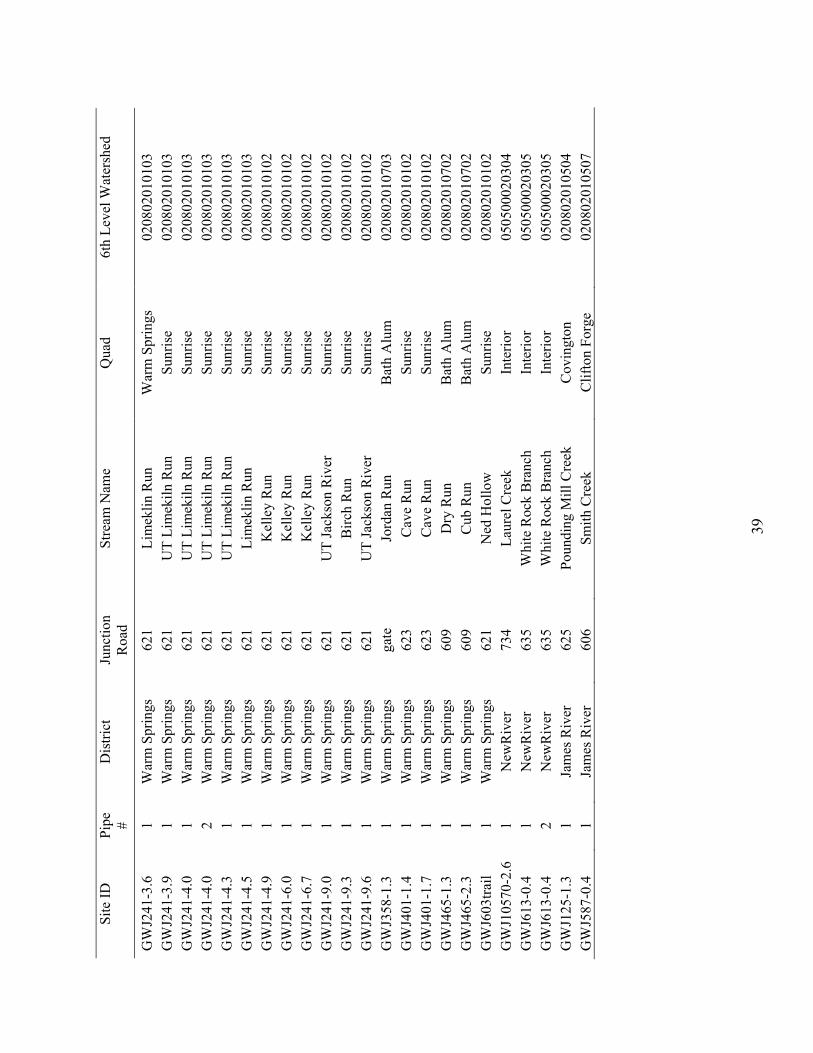
39
Site
ID
Pipe
#
Dis
trict
Ju
nctio
n R
oad
Stre
am N
ame
Qua
d 6t
h Le
vel W
ater
shed
GW
J241
-3.6
1
War
m S
prin
gs
621
Lim
eklin
Run
W
arm
Spr
ings
02
0802
0101
03
GW
J241
-3.9
1
War
m S
prin
gs
621
UT
Lim
ekiln
Run
Su
nris
e 02
0802
0101
03
GW
J241
-4.0
1
War
m S
prin
gs
621
UT
Lim
ekiln
Run
Su
nris
e 02
0802
0101
03
GW
J241
-4.0
2
War
m S
prin
gs
621
UT
Lim
ekiln
Run
Su
nris
e 02
0802
0101
03
GW
J241
-4.3
1
War
m S
prin
gs
621
UT
Lim
ekiln
Run
Su
nris
e 02
0802
0101
03
GW
J241
-4.5
1
War
m S
prin
gs
621
Lim
eklin
Run
Su
nris
e 02
0802
0101
03
GW
J241
-4.9
1
War
m S
prin
gs
621
Kel
ley
Run
Su
nris
e 02
0802
0101
02
GW
J241
-6.0
1
War
m S
prin
gs
621
Kel
ley
Run
Su
nris
e 02
0802
0101
02
GW
J241
-6.7
1
War
m S
prin
gs
621
Kel
ley
Run
Su
nris
e 02
0802
0101
02
GW
J241
-9.0
1
War
m S
prin
gs
621
UT
Jack
son
Riv
er
Sunr
ise
0208
0201
0102
G
WJ2
41-9
.3
1 W
arm
Spr
ings
62
1 B
irch
Run
Su
nris
e 02
0802
0101
02
GW
J241
-9.6
1
War
m S
prin
gs
621
UT
Jack
son
Riv
er
Sunr
ise
0208
0201
0102
G
WJ3
58-1
.3
1 W
arm
Spr
ings
ga
te
Jord
an R
un
Bat
h A
lum
02
0802
0107
03
GW
J401
-1.4
1
War
m S
prin
gs
623
Cav
e R
un
Sunr
ise
0208
0201
0102
G
WJ4
01-1
.7
1 W
arm
Spr
ings
62
3 C
ave
Run
Su
nris
e 02
0802
0101
02
GW
J465
-1.3
1
War
m S
prin
gs
609
Dry
Run
B
ath
Alu
m
0208
0201
0702
G
WJ4
65-2
.3
1 W
arm
Spr
ings
60
9 C
ub R
un
Bat
h A
lum
02
0802
0107
02
GW
J603
trail
1 W
arm
Spr
ings
62
1 N
ed H
ollo
w
Sunr
ise
0208
0201
0102
G
WJ1
0570
-2.6
1
New
Riv
er
734
Laur
el C
reek
In
terio
r 05
0500
0203
04
GW
J613
-0.4
1
New
Riv
er
635
Whi
te R
ock
Bra
nch
Inte
rior
0505
0002
0305
G
WJ6
13-0
.4
2 N
ewR
iver
63
5 W
hite
Roc
k B
ranc
h In
terio
r 05
0500
0203
05
GW
J125
-1.3
1
Jam
es R
iver
62
5 Po
undi
ng M
ill C
reek
C
ovin
gton
02
0802
0105
04
GW
J587
-0.4
1
Jam
es R
iver
60
6 Sm
ith C
reek
C
lifto
n Fo
rge
0208
0201
0507

40
Table A4. Coarse filter A, B, and C, classifications for crossings surveyed on the George Washington-Jefferson National Forest, summer 2005.
Site ID Pipe # Filter A Filter B Filter C GWJ1576-0.4 1 impassable impassable impassable GWJ255-0.9 1 impassable impassable impassable GWJ255-0.9 2 impassable impassable impassable GWJ255-4.5 1 indeterminate impassable impassable GWJ255-4.6 1 indeterminate impassable impassable GWJ255-4.6 2 impassable impassable impassable GWJ381-0.1 1 passable indeterminate indeterminate GWJ381-0.1 2 passable passable passable GWJ381-3.6 1 impassable impassable impassable GWJ381-4.65 1 passable indeterminate indeterminate GWJ382-1.2 1 impassable impassable impassable GWJ382-2.3 1 impassable impassable impassable GWJ382-4.3 1 impassable impassable impassable GWJ382-5.5 1 indeterminate impassable impassable GWJ382-6.5 1 indeterminate impassable impassable GWJ382-7.1 1 indeterminate impassable impassable GWJ382-7.15 1 indeterminate impassable impassable GWJ382-9.6 1 indeterminate impassable impassable GWJ382-9.9 1 impassable impassable impassable GWJ383h-.001 1 indeterminate indeterminate indeterminate GWJ383h-.001 2 passable passable passable GWJ387-0.05 1 indeterminate impassable impassable GWJ393-0.2 1 impassable impassable impassable GWJ394-0.39 1 indeterminate impassable impassable GWJ394-0.4 1 indeterminate indeterminate impassable GWJ394-0.8 1 indeterminate indeterminate impassable GWJ394-10.7 1 impassable impassable impassable GWJ394-10.71 1 impassable impassable impassable GWJ394-12.1 1 indeterminate impassable impassable GWJ394-6.9 1 impassable impassable impassable GWJ394-9.4 1 impassable impassable impassable GWJ394b-0.8 1 impassable impassable impassable GWJ394y-0.01 1 impassable impassable impassable GWJ394z-.01 1 passable passable passable GWJ395-1.3 1 indeterminate impassable impassable GWJ395-3.5 1 passable passable passable GWJ399-1.0 1 passable passable passable GWJ399b-0.8 1 impassable impassable impassable GWJ399b-1.6 1 indeterminate impassable impassable Table continued next page…

41
Site ID Pipe # Filter A Filter B Filter C GWJ399b-3.9 1 indeterminate impassable impassable GWJ433-1.3 1 impassable impassable impassable GWJ433-2.35 1 impassable impassable impassable GWJ433-2.4 1 indeterminate impassable impassable GWJ61-0.8 1 impassable impassable impassable GWJ61-6.3 1 passable passable impassable GWJ61-6.3 2 passable indeterminate impassable GWJ627-4.4 1 indeterminate indeterminate indeterminate GWJ687-0.09 1 indeterminate impassable impassable GWJ687-0.5 1 indeterminate indeterminate indeterminate GWJ688-2.2 1 passable impassable impassable GWJ688-2.2 2 indeterminate indeterminate impassable GWJ688-2.2 3 passable indeterminate impassable GWJ77-0.25 1 indeterminate indeterminate impassable GWJ77-1.0 1 impassable impassable impassable GWJ77-1.65 1 impassable impassable impassable GWJ77-1.65 2 impassable impassable impassable GWJ77-1.9 1 passable passable passable GWJ77-2.9 1 indeterminate impassable impassable GWJ77-2.9 2 indeterminate impassable impassable GWJ77-3.2 1 indeterminate indeterminate impassable GWJ77-3.8 1 impassable impassable impassable GWJ77-5.6 1 impassable impassable impassable GWJ77-6.2 1 indeterminate indeterminate indeterminate GWJ77-6.8 1 indeterminate impassable impassable GWJ81-2.4 1 indeterminate impassable impassable GWJ82-0.1 1 indeterminate impassable impassable GWJ82-0.5 1 indeterminate impassable impassable GWJ82-1.0 1 indeterminate impassable impassable GWJ82-1.6 1 indeterminate impassable impassable GWJ82-1.9 1 impassable impassable impassable GWJ82-5.39 1 impassable impassable impassable GWJ82-7.5 1 indeterminate impassable impassable GWJ125-6.95 1 passable passable passable GWJ125-9.1 1 indeterminate indeterminate indeterminate GWJ1747-.02 1 indeterminate impassable impassable GWJ194-4.8 1 impassable impassable impassable GWJ194-5.6 1 indeterminate impassable impassable GWJ194-6.7 1 indeterminate indeterminate indeterminate GWJ194-6.7 2 indeterminate indeterminate indeterminate GWJ194-7.6 1 indeterminate impassable impassable Table continued next page…

42
Site ID Pipe # Filter A Filter B Filter C GWJ241-10 1 passable impassable impassable GWJ241-3.6 1 passable passable passable GWJ241-3.9 1 impassable impassable impassable GWJ241-4.0 1 impassable impassable impassable GWJ241-4.0 2 impassable impassable impassable GWJ241-4.3 1 indeterminate impassable impassable GWJ241-4.5 1 indeterminate indeterminate impassable GWJ241-4.9 1 indeterminate impassable impassable GWJ241-6.0 1 indeterminate impassable impassable GWJ241-6.7 1 impassable impassable impassable GWJ241-9.0 1 impassable impassable impassable GWJ241-9.3 1 indeterminate indeterminate indeterminate GWJ241-9.6 1 indeterminate impassable impassable GWJ358-1.3 1 impassable impassable impassable GWJ401-1.4 1 indeterminate impassable impassable GWJ401-1.7 1 indeterminate impassable impassable GWJ465-1.3 1 impassable impassable impassable GWJ465-2.3 1 indeterminate impassable impassable GWJ603trail 1 passable indeterminate indeterminate GWJ10570-2.6 1 impassable impassable impassable GWJ613-0.4 1 impassable impassable impassable GWJ613-0.4 2 impassable impassable impassable GWJ125-1.3 1 passable passable passable GWJ587-0.4 1 passable passable passable

43
Tabl
e A
5. D
escr
iptio
n of
cro
ssin
gs su
rvey
ed o
n th
e G
eorg
e W
ashi
ngto
n-Je
ffer
son
Nat
iona
l For
est,
sum
mer
200
5. S
hape
abb
revi
atio
ns: C
= ci
rcul
ar, P
A=
pipe
arc
h, O
BA
= op
en b
otto
m a
rch,
and
F=
ford
. C
hann
el w
idth
is th
e m
ean
bank
full
chan
nel w
idth
. N
= no
nat
ural
subs
trate
, N
(dis
cont
in)=
dis
cont
inuo
us su
bstra
te, Y
= co
ntin
uous
nat
ural
subs
trate
. A
n N
A (n
ot a
pplic
able
) ind
icat
es o
utle
t dro
p (n
o ou
tlet p
ool o
r tai
lwat
er
cont
rol)
or o
utle
t per
ch (s
tream
dry
) cou
ld n
ot b
e ca
lcul
ated
. N
egat
ive
outle
t dro
p or
per
ch v
alue
s ind
icat
e a
subm
erge
d ou
tlet (
stru
ctur
e pa
rtial
ly
back
wat
ered
). R
esid
ual i
nlet
dep
th v
alue
s ≥ 0
.0 in
dica
te th
e st
ruct
ure
is fu
lly b
ackw
ater
ed.
Site
ID
Pipe
#
Shap
e Pi
pe
Con
ditio
n M
ean
Cha
nnel
W
idth
(ft)
Con
tinuo
us
Subs
trate
in
Stru
ctur
e
Pipe
sl
ope
(%)
Pipe
Wid
th:
Cha
nnel
W
idth
ratio
Out
let
Dro
p (in
)
Out
let
Perc
h (in
)R
esid
ual
Inle
t Dep
th
(in)
Pipe
Le
ngth
(f
t)
Slop
e (%
) *
Leng
th
(ft)
GW
J157
6-0.
4 1
C
fair
7.1
N
11.0
0 0.
42
14.4
0 12
.84
0.00
33
.1
364.
0 G
WJ2
55-0
.9
1 PA
po
or
13.7
N
(dis
cont
in)
2.17
0.
48
32.4
6 16
.86
0.00
48
.1
104.
5 G
WJ2
55-0
.9
2 PA
po
or
13.7
N
(dis
cont
in)
2.07
0.
48
32.5
8 16
.98
0.00
48
.1
99.5
G
WJ2
55-4
.5
1 C
po
or
8.5
N
4.22
0.
53
12.6
0 9.
96
0.00
36
.0
152.
0 G
WJ2
55-4
.6
1 PA
po
or
11.3
N
4.
14
0.46
23
.58
8.34
0.
00
34.4
14
2.5
GW
J255
-4.6
2
PA
poor
11
.3
N
6.60
0.
46
24.1
2 8.
88
0.00
34
.4
227.
0 G
WJ3
81-0
.1
1 PA
go
od
20.0
N
(dis
cont
in)
1.21
0.
33
-0.1
2 -3
.36
0.00
36
.5
44.0
G
WJ3
81-0
.1
2 PA
go
od
20.0
Y
0.
56
0.33
2.
64
-0.6
0 0.
00
36.5
20
.5
GW
J381
-3.6
1
PA
poor
16
.1
Y
7.72
0.
28
-0.7
2 N
A
0.00
23
.0
177.
5 G
WJ3
81-4
.65
1 PA
go
od
13.3
N
1.
96
0.47
-1
.02
-1.8
0 0.
00
25.0
49
.0
GW
J382
-1.2
1
C
poor
9.
7 N
(dis
cont
in)
2.51
0.
38
38.8
8 N
A
0.00
78
.2
196.
0 G
WJ3
82-2
.3
1 PA
po
or
11.1
N
2.
78
0.51
32
.64
NA
0.
00
59.0
16
4.0
GW
J382
-4.3
1
PA
good
19
.3
N
3.27
0.
50
24.2
4 30
.90
0.00
52
.8
172.
5 G
WJ3
82-5
.5
1 PA
go
od
13.1
N
5.
02
0.57
18
.12
14.7
6 0.
00
48.5
24
3.5
GW
J382
-6.5
1
PA
good
11
.8
N
5.01
0.
57
13.3
2 N
A
0.00
42
.7
214.
0 G
WJ3
82-7
.1
1 C
go
od
13.6
N
4.
07
0.39
22
.80
NA
0.
00
48.7
19
8.0
GW
J382
-7.1
5 1
C
good
10
.5
N
3.45
0.
48
11.2
8 12
.36
0.00
69
.5
240.
0 G
WJ3
82-9
.6
1 C
go
od
14.3
N
4.
34
0.35
7.
32
NA
0.
00
45.0
19
5.5
GW
J382
-9.9
1
C
good
11
.7
N
1.70
0.
38
80.5
2 N
A
0.00
45
.0
76.5
G
WJ3
83h-
.001
1
PA
fair
16.0
N
(dis
cont
in)
2.29
0.
38
3.84
-0
.06
0.00
33
.0
75.5
G
WJ3
83h-
.001
2
PA
fair
16.0
Y
1.
52
0.38
1.
20
-2.7
0 0.
00
33.0
50
.0
GW
J387
-0.0
5 1
PA
good
12
.6
N
3.49
0.
83
14.0
4 -0
.72
0.00
35
.0
122.
0 G
WJ3
93-0
.2
1 C
go
od
11.4
N
7.
59
0.39
16
.86
NA
0.
00
38.0
28
8.5
Tabl
e co
ntin
ued
next
pag
e…

44
Site
ID
Pipe
#
Shap
e Pi
pe
Con
ditio
n M
ean
Cha
nnel
W
idth
(ft)
Con
tinuo
us
Subs
trate
in
Stru
ctur
e
Pipe
sl
ope
(%)
Pipe
Wid
th:
Cha
nnel
W
idth
ratio
Out
let
Dro
p (in
)
Out
let
Perc
h (in
)R
esid
ual
Inle
t Dep
th
(in)
Pipe
Le
ngth
(f
t)
Slop
e (%
) *
Leng
th
(ft)
GW
J394
-0.3
9 1
C
fair
7.4
N
4.86
0.
40
5.34
N
A
0.00
77
.3
375.
5 G
WJ3
94-0
.4
1 C
fa
ir 10
.1
N
1.45
0.
40
9.12
N
A
0.00
80
.4
116.
4 G
WJ3
94-0
.8
1 PA
po
or
14.8
N
1.
94
0.39
8.
10
6.78
0.
00
59.5
11
5.5
GW
J394
-10.
7 1
PA
fair
9.5
N
7.78
0.
40
-14.
88N
A
0.00
67
.5
525.
0 G
WJ3
94-1
0.71
1
C
good
11
.5
N
5.12
0.
44
25.9
2 N
A
0.00
64
.3
329.
0 G
WJ3
94-1
2.1
1 C
go
od
10.8
N
5.
68
0.43
23
.88
25.4
4 0.
00
76.0
43
2.0
GW
J394
-6.9
1
C
good
12
.2
N
7.77
0.
41
13.1
4 13
.14
0.00
10
1.0
785.
0 G
WJ3
94-9
.4
1 C
go
od
10.3
N
6.
44
0.44
37
.80
42.7
2 0.
00
64.8
41
7.0
GW
J394
b-0.
8 1
C
good
10
.9
N
3.79
0.
46
24.7
8 N
A
0.00
49
.0
185.
5 G
WJ3
94y-
0.01
1
C
poor
8.
5 N
8.
05
0.35
6.
24
NA
0.
00
23.3
18
7.5
GW
J394
z-0.
01
1 C
po
or
10.8
N
(dis
cont
in)
0.67
0.
37
-3.4
8 N
A
5.28
22
.5
15.0
G
WJ3
95-1
.3
1 C
go
od
12.6
N
3.
80
0.40
7.
92
6.60
0.
00
44.0
16
7.0
GW
J395
-3.5
1
OB
A
good
18
.7
Y
0.82
0.
53
-4.2
0 -4
.80
0.24
40
.0
33.0
G
WJ3
99-1
.0
1 F
good
19
.7
N
0.28
N
A
3.36
1.
08
0.00
21
.6
6.0
GW
J399
b-0.
8 1
PA
good
11
.3
N
4.99
0.
42
27.1
2 12
.18
0.00
35
.7
178.
0 G
WJ3
99b-
1.6
1 PA
go
od
14.2
N
3.
78
0.48
-8
.64
-8.6
4 0.
00
44.9
16
9.5
GW
J399
b-3.
9 1
C
fair
14.6
N
2.
82
0.55
18
.84
15.1
2 0.
00
55.7
15
7.0
GW
J433
-1.3
1
PA
good
14
.1
N
4.70
0.
51
25.0
8 24
.36
0.00
36
.6
172.
0 G
WJ4
33-2
.35
1 C
fa
ir 8.
6 N
7.
10
0.49
50
.52
NA
0.
00
34.7
24
6.5
GW
J433
-2.4
1
C
poor
10
.4
N (d
isco
ntin
) 5.
45
0.40
20
.22
NA
0.
00
38.5
21
0.0
GW
J61-
0.8
1 C
go
od
7.1
N (d
isco
ntin
) 9.
80
0.56
N
A
1.00
0.
00
24.5
24
1.0
GW
J61-
6.3
1 C
po
or
10.9
N
(dis
cont
in)
0.46
0.
37
9.42
5.
94
0.00
24
.9
11.5
G
WJ6
1-6.
3 2
C
poor
10
.9
N (d
isco
ntin
) 1.
04
0.37
8.
52
5.04
0.
00
24.9
26
.0
GW
J627
-4.4
1
PA
poor
13
.5
N
3.05
0.
33
-4.6
8 -3
0.12
0.
00
40.3
12
3.0
GW
J687
-0.0
9 1
C
good
13
.3
N
5.72
0.
30
-0.9
6 N
A
0.00
30
.0
171.
5 G
WJ6
87-0
.5
1 C
fa
ir 10
.3
N
2.87
0.
39
-2.7
6 N
A
0.00
50
.2
144.
0 G
WJ6
88-2
.2
1 C
go
od
19.5
N
1.
63
0.12
13
.44
6.24
0.
00
30.0
49
.0
GW
J688
-2.2
2
C
good
19
.5
N
2.23
0.
10
4.80
-2
.40
0.00
30
.0
67.0
Ta
ble
cont
inue
d ne
xt p
age…
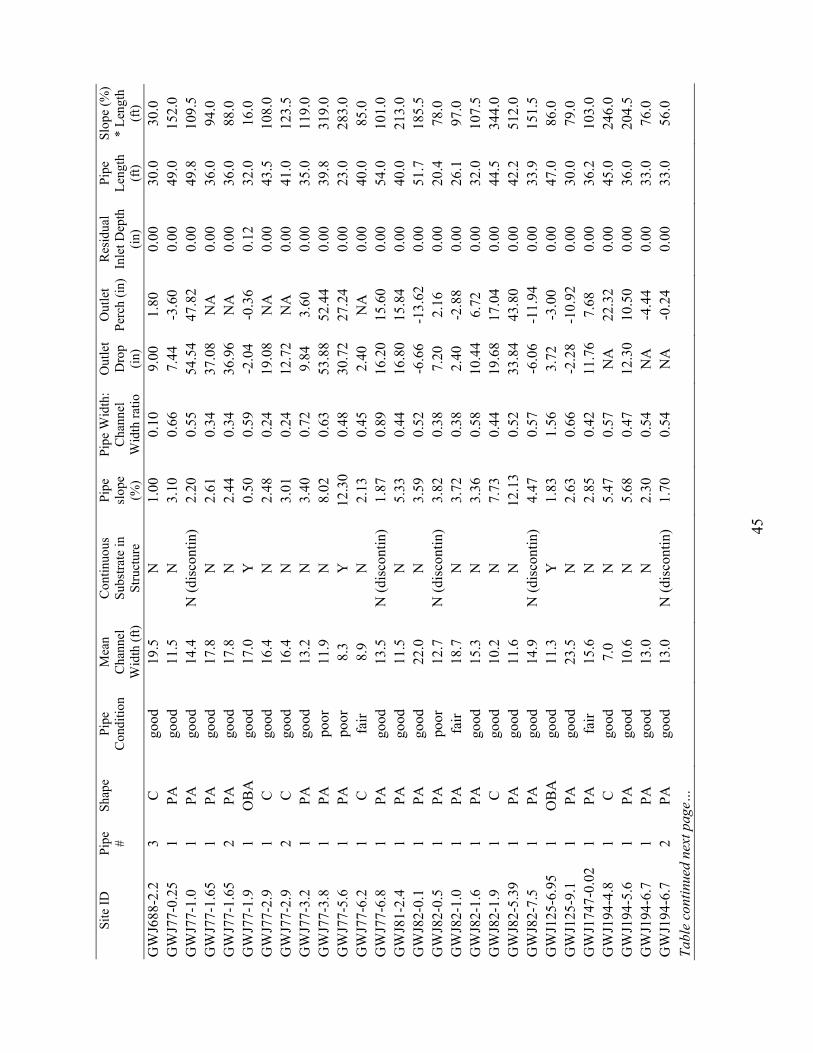
45
Site
ID
Pipe
#
Shap
e Pi
pe
Con
ditio
n M
ean
Cha
nnel
W
idth
(ft)
Con
tinuo
us
Subs
trate
in
Stru
ctur
e
Pipe
sl
ope
(%)
Pipe
Wid
th:
Cha
nnel
W
idth
ratio
Out
let
Dro
p (in
)
Out
let
Perc
h (in
)R
esid
ual
Inle
t Dep
th
(in)
Pipe
Le
ngth
(f
t)
Slop
e (%
) *
Leng
th
(ft)
GW
J688
-2.2
3
C
good
19
.5
N
1.00
0.
10
9.00
1.
80
0.00
30
.0
30.0
G
WJ7
7-0.
25
1 PA
go
od
11.5
N
3.
10
0.66
7.
44
-3.6
0 0.
00
49.0
15
2.0
GW
J77-
1.0
1 PA
go
od
14.4
N
(dis
cont
in)
2.20
0.
55
54.5
4 47
.82
0.00
49
.8
109.
5 G
WJ7
7-1.
65
1 PA
go
od
17.8
N
2.
61
0.34
37
.08
NA
0.
00
36.0
94
.0
GW
J77-
1.65
2
PA
good
17
.8
N
2.44
0.
34
36.9
6 N
A
0.00
36
.0
88.0
G
WJ7
7-1.
9 1
OB
A
good
17
.0
Y
0.50
0.
59
-2.0
4 -0
.36
0.12
32
.0
16.0
G
WJ7
7-2.
9 1
C
good
16
.4
N
2.48
0.
24
19.0
8 N
A
0.00
43
.5
108.
0 G
WJ7
7-2.
9 2
C
good
16
.4
N
3.01
0.
24
12.7
2 N
A
0.00
41
.0
123.
5 G
WJ7
7-3.
2 1
PA
good
13
.2
N
3.40
0.
72
9.84
3.
60
0.00
35
.0
119.
0 G
WJ7
7-3.
8 1
PA
poor
11
.9
N
8.02
0.
63
53.8
8 52
.44
0.00
39
.8
319.
0 G
WJ7
7-5.
6 1
PA
poor
8.
3 Y
12
.30
0.48
30
.72
27.2
4 0.
00
23.0
28
3.0
GW
J77-
6.2
1 C
fa
ir 8.
9 N
2.
13
0.45
2.
40
NA
0.
00
40.0
85
.0
GW
J77-
6.8
1 PA
go
od
13.5
N
(dis
cont
in)
1.87
0.
89
16.2
0 15
.60
0.00
54
.0
101.
0 G
WJ8
1-2.
4 1
PA
good
11
.5
N
5.33
0.
44
16.8
0 15
.84
0.00
40
.0
213.
0 G
WJ8
2-0.
1 1
PA
good
22
.0
N
3.59
0.
52
-6.6
6 -1
3.62
0.
00
51.7
18
5.5
GW
J82-
0.5
1 PA
po
or
12.7
N
(dis
cont
in)
3.82
0.
38
7.20
2.
16
0.00
20
.4
78.0
G
WJ8
2-1.
0 1
PA
fair
18.7
N
3.
72
0.38
2.
40
-2.8
8 0.
00
26.1
97
.0
GW
J82-
1.6
1 PA
go
od
15.3
N
3.
36
0.58
10
.44
6.72
0.
00
32.0
10
7.5
GW
J82-
1.9
1 C
go
od
10.2
N
7.
73
0.44
19
.68
17.0
4 0.
00
44.5
34
4.0
GW
J82-
5.39
1
PA
good
11
.6
N
12.1
3 0.
52
33.8
4 43
.80
0.00
42
.2
512.
0 G
WJ8
2-7.
5 1
PA
good
14
.9
N (d
isco
ntin
) 4.
47
0.57
-6
.06
-11.
94
0.00
33
.9
151.
5 G
WJ1
25-6
.95
1 O
BA
go
od
11.3
Y
1.
83
1.56
3.
72
-3.0
0 0.
00
47.0
86
.0
GW
J125
-9.1
1
PA
good
23
.5
N
2.63
0.
66
-2.2
8 -1
0.92
0.
00
30.0
79
.0
GW
J174
7-0.
02
1 PA
fa
ir 15
.6
N
2.85
0.
42
11.7
6 7.
68
0.00
36
.2
103.
0 G
WJ1
94-4
.8
1 C
go
od
7.0
N
5.47
0.
57
NA
22
.32
0.00
45
.0
246.
0 G
WJ1
94-5
.6
1 PA
go
od
10.6
N
5.
68
0.47
12
.30
10.5
0 0.
00
36.0
20
4.5
GW
J194
-6.7
1
PA
good
13
.0
N
2.30
0.
54
NA
-4
.44
0.00
33
.0
76.0
G
WJ1
94-6
.7
2 PA
go
od
13.0
N
(dis
cont
in)
1.70
0.
54
NA
-0
.24
0.00
33
.0
56.0
Ta
ble
cont
inue
d ne
xt p
age…

46
Site
ID
Pipe
#
Shap
e Pi
pe
Con
ditio
n M
ean
Cha
nnel
W
idth
(ft)
Con
tinuo
us
Subs
trate
in
Stru
ctur
e
Pipe
sl
ope
(%)
Pipe
Wid
th:
Cha
nnel
W
idth
ratio
Out
let
Dro
p (in
)
Out
let
Perc
h (in
)R
esid
ual
Inle
t Dep
th
(in)
Pipe
Le
ngth
(f
t)
Slop
e (%
) *
Leng
th
(ft)
GW
J194
-7.6
1
PA
good
7.
2 N
6.
69
0.83
4.
32
7.08
0.
00
42.0
28
1.0
GW
J241
-10.
0 1
C
good
13
.0
N
0.95
0.
46
15.7
2 15
.60
0.00
40
.2
38.0
G
WJ2
41-3
.6
1 PA
po
or
8.5
N (d
isco
ntin
) 0.
25
0.41
0.
12
-0.9
6 0.
00
27.6
1 7.
0 G
WJ2
41-3
.9
1 PA
fa
ir 5.
4 N
7.
38
0.54
2.
64
-0.1
2 0.
00
26.0
19
2.0
GW
J241
-4.0
1
PA
good
7.
8 N
6.
79
0.60
24
.12
18.3
6 0.
00
29.9
20
3.0
GW
J241
-4.0
2
PA
good
7.
8 N
6.
86
0.60
25
.32
19.5
6 0.
00
29.9
20
5.0
GW
J241
-4.3
1
PA
good
4.
7 N
5.
76
1.03
1.
32
0.00
0.
00
26.2
15
1.0
GW
J241
-4.5
1
PA
good
6.
1 N
3.
00
0.87
4.
92
3.00
0.
00
30.0
90
.0
GW
J241
-4.9
1
C
good
6.
6 N
6.
19
0.70
5.
76
3.72
0.
00
38.1
23
6.0
GW
J241
-6.0
1
C
fair
4.5
N
4.95
1.
03
12.1
2 9.
96
0.00
38
.0
188.
0 G
WJ2
41-6
.7
1 C
go
od
6.6
N
7.43
0.
60
12.0
0 6.
84
0.00
33
.1
246.
0 G
WJ2
41-9
.0
1 C
go
od
6.1
N
11.7
4 0.
77
20.4
0 18
.00
0.00
36
.3
426.
0 G
WJ2
41-9
.3
1 PA
go
od
12.8
N
1.
90
0.45
N
A
-6.1
2 0.
00
35.8
68
.0
GW
J241
-9.6
1
C
good
6.
1 N
4.
97
0.41
14
.88
15.2
4 0.
00
31.6
15
7.0
GW
J358
-1.3
1
C
good
7.
7 N
11
.83
0.39
24
.72
22.6
8 0.
00
37.2
44
0.0
GW
J401
-1.4
1
C
good
10
.6
N (d
isco
ntin
) 4.
67
0.47
23
.76
20.4
0 0.
00
32.0
14
9.5
GW
J401
-1.7
1
C
good
8.
7 N
6.
63
0.46
9.
24
9.06
0.
00
29.5
19
5.5
GW
J465
-1.3
1
C
good
10
.4
N
7.53
0.
29
6.72
N
A
0.00
36
.0
271.
0 G
WJ4
65-2
.3
1 PA
go
od
11.1
N
4.
54
0.69
20
.76
16.5
6 0.
00
38.8
17
6.0
GW
J603
trail
1 C
go
od
7.4
N
2.39
0.
41
0.60
-0
.18
0.00
19
.9
47.5
G
WJ1
0570
-2.6
1
C
good
14
.7
N
3.12
0.
52
32.5
2 32
.52
0.00
50
.5
157.
5 G
WJ6
13-0
.4
1 PA
go
od
8.3
N
5.34
0.
78
27.3
6 21
.84
0.00
58
.0
310.
0 G
WJ6
13-0
.4
2 PA
go
od
8.3
N
5.07
0.
78
30.0
0 24
.48
0.00
58
.0
294.
0 G
WJ1
25-1
.3
1 O
BA
go
od
17.1
Y
7.
36
1.35
-5
.88
-8.0
4 30
.60
28.0
20
6.0
GW
J587
-0.4
1
OB
A
good
25
.5
Y
0.29
1.
10
7.68
-2
.28
0.00
42
.0
12.0

47
Appendix B: Results for the Daniel Boone National Forest

48
We visited 206 crossings on the Stearns, Somerset, and London Ranger Districts in 2005 (Figure
B1, Table B1) and completed surveys on 40% (n=83) (Table B2). Filter A (strong swimmers and leapers)
classified 22% (n=18) of crossings as impassable, 29% (n=24) as passable, and 49% (n=41) as
indeterminate (Figure B2, Table B2). Filter B (moderate swimmers and leapers) classified 60% (n=50) of
crossings as impassable, 15% (n=12) as passable, and 25% (n=21) as indeterminate (Figure B3, Table
B2). Filter C (weak swimmers and leapers) classified 87% of crossings (n=72) as impassable, 10% (n=8)
as passable, and 3% (n=3) as indeterminate (Figure B4, Table B2). Characteristics and filter
classifications for each crossing are presented in Tables B3-B5.
The majority of the crossings were circular culverts (n=52) while fords (n=18), pipe arches
(n=12), open bottom arches (n=1), vented fords (n=0), and box culverts (n=0) were less frequently
encountered. Filter A classified 29% of circular culverts, 17% of fords, and 0% of pipe arches as
impassable (Figure B5). Filter B classified 65% of circular culverts, 58% of pipe arches, and 50% of
fords as impassable (Figure B6). Filter C classified 91% of pipe arches , 90% of circular culverts, and
78% of fords as impassable (Figure B7). The mean crossings width to channel width ratio (excluding
fords and multiple structure crossings) (n=42) was 0.49 (SD=0.21), and only two crossings were greater
than or equal to the mean bankfull channel width (Figure B8).

49
KENTUCKY
London
Somerset
Stearns
±0 60 120 180 24030Kilometers
inventory completed
inventory incomplete
no inventory completed
Figure B1. Ranger Districts on the Daniel Boone National Forest road-stream crossing surveys were conducted, summer 2005.
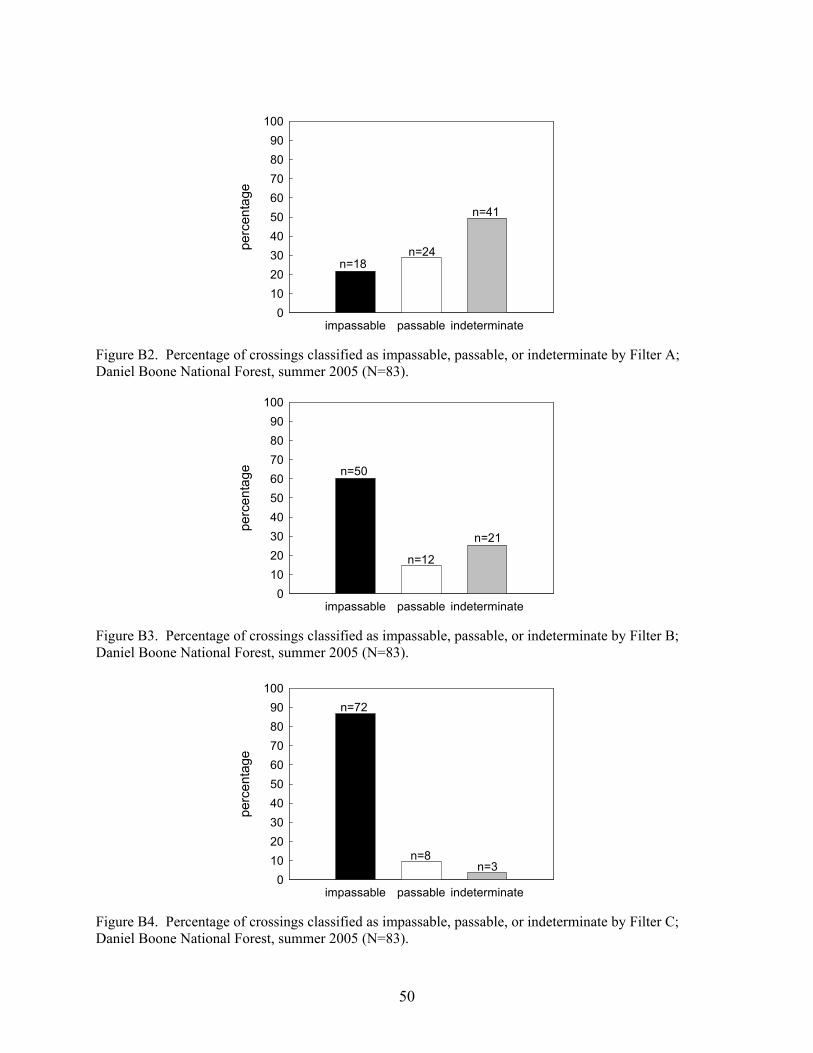
50
impassable passable indeterminate
perc
enta
ge
0102030405060708090
100
n=18 n=24
n=41
Figure B2. Percentage of crossings classified as impassable, passable, or indeterminate by Filter A; Daniel Boone National Forest, summer 2005 (N=83).
impassable passable indeterminate
perc
enta
ge
0102030405060708090
100
n=50
n=12
n=21
Figure B3. Percentage of crossings classified as impassable, passable, or indeterminate by Filter B; Daniel Boone National Forest, summer 2005 (N=83).
impassable passable indeterminate
perc
enta
ge
0102030405060708090
100n=72
n=8n=3
Figure B4. Percentage of crossings classified as impassable, passable, or indeterminate by Filter C; Daniel Boone National Forest, summer 2005 (N=83).

51
circular ford box
perc
enta
ge
0102030405060708090
100 impassablepassableindeterminate
pipearch
openbottom
arch
ventedford
n=52 n=12 n=18 n=1 n=0 n=0
Figure B5. Percentage of each crossing type classified as impassable, passable, or indeterminate for Filter A; Daniel Boone National Forest, summer 2005 (N=83).
circular ford box
perc
enta
ge
0102030405060708090
100 impassablepassableindeterminate
pipearch
openbottom
arch
ventedford
n=52 n=12 n=18 n=1 n=0 n=0
Figure B6. Percentage of each crossing type classified as impassable, passable, or indeterminate for Filter B; Daniel Boone National Forest, summer 2005 (N=83).
circular ford box
perc
enta
ge
0102030405060708090
100 impassablepassableindeterminate
pipearch
openbottom
arch
ventedford
n=52 n=12 n=18 n=1 n=0 n=0
Figure B7. Percentage of each crossing type classified as impassable, passable, or indeterminate for Filter C; Daniel Boone National Forest, summer 2005 (N=83).

52
DBNF
Cro
ssin
g W
idth
/ C
hann
el W
idth
0.00.20.40.60.81.01.21.41.61.8
n=42
Figure B8. Crossing width to bankfull channel width ratio for crossings surveyed in summer 2005 on the Daniel Boone National Forest (excluding fords, vented fords and multiple structure crossings). A ratio of 1.0 (dashed line) or greater indicates the crossing structure opening is greater than or equal to the bankfull channel width. The top and bottom of the boxes represent the 25th and 75th percentiles, the bar in the center of each box represents the median, whiskers represent the 10th and 90th percentiles, and closed circles represent the entire range of the data.

53
!
!
!!!
!!
!
!
!
!!!
! !
!
!! !
!
!
!
!
!!
!
!!!
!
!!!!!!
!!!
!!! !
!!!!
!
!
! !
!
!
!!!
!
!
!
!!!
!!!!
!
!
!
!
!
!
DD
!
!!!
!
((
DDD
D
D
!
(ú
(
D
DD
D(!
!DD
D ((
(
(
ú
úúú
D
D D
D
ú
D
!(
!ú
(
D
D
!!
D
(!!
D!
(
(
D!!
(!
ú úúú
ú
ú
D
(
DD
D
!
D!!
D
!
D
D
!
!
!
DD
DDDDDDDD
KENTUCKY
TENNESSEE
±0 10 20 30 405Kilometers
! impassable! indeterminate! passableú bridgeD no access( natural ford! insufficient upstream habitat
Daniel Boone NF6th level watershed
!
!
!!!
!!
!
!
!
!
!
!
!
!!
!!!
!!
!!
! !
!
!!
!
!
!!
!!!!!
!!
!!!!
!!!!!!!
!!!
!!!!
!
!
!!
!!
! !!
!
!!
!
!
!
DD
!
!!!
!
((
DDD
D
D
!
(ú
(
D
DD
D(!
!DD
D ((
(
(
ú
úúú
D
D D
D
ú
D
!(
!ú (
D
D
!!
D
(!!
D!
(
(
D!!
(!
ú úúú
ú
ú
D
(
DD
D
!
D!!
D
!
D
D
!
!
!
DD
DDDDDDDD
KENTUCKY
TENNESSEE
±0 10 20 30 405Kilometers
! impassable! indeterminate! passableú bridgeD no access( natural ford! insufficient upstream habitat
Daniel Boone NF6th level watershed
!
!!!
!!
!
!
!
!
!
!
!
!!!!
!
!
!!!!!!!
!!!
!!!!
!! !!!!!!
!!!!
!!
!!!!
!
!
!!
!!
! ! !!!
!!
!!
!!!
!
!!
DD
!
!!!
!
((
DDD
D
D
!
(ú
(
D
DD
D(!
!DD
D ((
(
(
ú
úúú
D
D D
D
ú
D
!(
!ú (
D
D
!!
D
(!!
D!
(
(
D!!
(!
ú úúú
ú
ú
D
(
DD
D
!
D!!
D
!
D
D
!
!
!
DD
DDDDDDDD
KENTUCKY
TENNESSEE
±0 10 20 30 405Kilometers
! impassable! indeterminate! passableú bridgeD no access( natural ford! insufficient upstream habitat
Daniel Boone NF6th level watershed
Figure B9. Location of crossings classified for fish passage by coarse filters A, B, and C within 6th level watersheds, and crossings not surveyed on the Daniel Boone National Forest, summer 2005.
Filter B
Filter C
Filter A

54
Tabl
e B
1. N
umbe
r of c
ross
ings
doc
umen
ted
(Tot
al c
ross
ings
doc
umen
ted)
and
not
surv
eyed
(Cro
ssin
gs n
ot su
rvey
ed) o
n th
e D
BN
F in
sum
mer
20
05.
Rea
sons
for n
ot su
rvey
ing
a do
cum
ente
d si
te in
clud
e: n
o su
itabl
e fis
h ha
bita
t ups
tream
of c
ross
ing
(NH
); no
acc
ess t
o si
te d
ue to
clo
sed
road
s or p
rivat
e ga
tes (
NA
); cr
ossi
ng w
as a
nat
ural
ford
(NF)
; cro
ssin
g w
as a
brid
ge (B
R).
For
est
Tota
l cro
ssin
gs
Cro
ssin
gs n
ot su
rvey
ed (n
, [%
])
docu
men
ted
NH
N
A
NF
BR
To
tal n
ot su
rvey
ed
DB
NF
206
28 (2
3)
61 (5
0)
21 (1
7)
13 (1
0)
123
(60)
Ta
ble
B2.
Num
ber o
f cro
ssin
gs su
rvey
ed (T
otal
surv
eyed
) with
coa
rse
filte
r res
ults
for t
he D
BN
F in
sum
mer
200
5. C
oars
e fil
ter r
esul
ts a
re
pres
ente
d fo
r Filt
er A
, Filt
er B
, and
Filt
er C
(see
filte
r des
crip
tions
, Fig
3 –
5).
For
est
Tota
l
Coa
rse
filte
r res
ults
surv
eyed
Impa
ssab
le (n
, [%
])
Pa
ssab
le (n
, [%
])
In
dete
rmin
ate
(n, [
%])
A 1
B
1
C 1
A 1
B
1
C 1
A 1
B
1
C 1
D
BN
F 83
18 (2
2)
50 (6
0)
72 (8
7)
24
(29)
12
(14)
8
(10)
41 (4
9)
21 (2
5)
3 (4
)

55
Tabl
e B
3. L
ocat
ion
of c
ross
ings
surv
eyed
on
the
Dan
iel B
oone
Nat
iona
l For
est d
urin
g th
e su
mm
er o
f 200
5. S
ite ID
con
sist
s of t
he F
ores
t ab
brev
iatio
n (D
B),
road
the
cros
sing
is o
n (1
19b)
, and
the
dist
ance
(mile
s) fr
om th
e ju
nctio
n ro
ad (0
.8).
Site
ID
Pipe
#
Dis
trict
Ju
nctio
n R
oad
Stre
am N
ame
Qua
d 6t
h le
vel w
ater
shed
DB
100-
1.5
1 Lo
ndon
12
77
UT
Cum
berla
nd R
iver
Sa
wye
r 05
1301
0114
05
DB
119b
-0.8
1
Lond
on
119
Lick
Bra
nch
Ano
05
1301
0205
07
DB
119b
-0.8
2
Lond
on
119
Lick
Bra
nch
Ano
05
1301
0205
07
DB
119b
-0.8
3
Lond
on
119
Lick
Bra
nch
Ano
05
1301
0205
07
DB
131-
0.3
1 Lo
ndon
34
97
Roc
k C
reek
Sa
wye
r 05
1301
0205
09
DB
132-
0.5
1 Lo
ndon
11
93
UT
Sam
's B
ranc
h La
urel
Riv
er L
k Sa
wye
r 05
1301
0113
09
DB
193-
1.8
1 Lo
ndon
12
77
Bar
k C
amp
Bra
nch
Saw
yer
0513
0101
1404
D
B19
5-1.
1 1
Lond
on
88
Nor
th F
ork
Gul
f Bra
nch
Cum
berla
nd F
alls
05
1301
0114
04
DB
195-
1.9
1 Lo
ndon
88
H
ogbe
d B
ranc
h C
umbe
rland
Fal
ls
0513
0101
1404
D
B19
5-3.
3 1
Lond
on
88
Sout
h Fo
rk
Cum
berla
nd F
alls
05
1301
0114
04
DB
4094
-0.6
1
Lond
on
4094
road
sign
U
T H
awk
Cre
ek
Ber
nsta
dt
0513
0102
0502
D
B41
33-0
.49
1 Lo
ndon
76
6 U
T Po
und
Bra
nch
Ano
05
1301
0205
08
DB
4252
-0.5
1
Lond
on
539
Am
os F
alls
Bra
nch
Cum
berla
nd F
alls
05
1301
0114
03
DB
4252
-0.5
2
Lond
on
539
Am
os F
alls
Bra
nch
Cum
berla
nd F
alls
05
1301
0114
03
DB
534-
xx
1 Lo
ndon
N
A
Can
e C
reek
C
umbe
rland
Fal
ls
0513
0101
1206
D
B61
5-0.
9 1
Lond
on
131
UT
Ned
Bra
nch
Saw
yer
0513
0102
0509
D
B62
6-0.
3 1
Lond
on
3497
(gat
e)
Dut
ch B
rook
Sa
wye
r 05
1301
0205
09
DB
741-
0.3
1 Lo
ndon
78
1 U
T Si
nkin
g C
reek
Lo
ndon
SW
05
1301
0205
05
DB
781-
0.01
1
Lond
on
741
UT
Sink
ing
Cre
ek
Lond
on S
W
0513
0102
0505
D
B11
9-3.
7 1
Som
erse
t 56
U
T St
orm
Bra
nch
Ano
05
1301
0205
08
DB
272-
1.3
1 So
mer
set
122a
B
ig L
ick
Hai
l 05
1301
0302
02
DB
272-
1.7
1 So
mer
set
122a
B
ig L
ick
Hai
l 05
1301
0302
02
DB
272-
2.5
1 So
mer
set
122a
B
ig L
ick
Saw
yer
0513
0103
0202
D
B46
-0.6
1
Som
erse
t 32
57
Dry
Bra
nch
Hai
l 05
1301
0302
01
DB
5057
-0.2
1
Som
erse
t 75
0 U
T Li
ck C
reek
A
no
0513
0102
0506
D
B50
57-0
.25
1 So
mer
set
750
UT
Lick
Cre
ek
Ano
05
1301
0205
06
DB
5057
-1.8
1
Som
erse
t 75
0 G
wen
's B
ranc
h A
no
0513
0102
0506
D
B50
57-1
.8
2 So
mer
set
750
Gw
en's
Bra
nch
Ano
05
1301
0205
06
DB
5138
-0.6
1
Som
erse
t 12
2a
UT
Bea
r Cre
ek
Hai
l 05
1301
0205
09
DB
5138
-1.0
1
Som
erse
t 12
2a
Cub
Cre
ek
Hai
l 05
1301
0205
09
tabl
e co
ntin
ued
next
pag
e…

56
Site
ID
Pipe
#
Dis
trict
Ju
nctio
n R
oad
Stre
am N
ame
Qua
d 6t
h le
vel w
ater
shed
DB
5138
-1.5
1
Som
erse
t 12
2a
Bea
r Cre
ek
Hai
l 05
1301
0205
09
DB
5138
-1.5
2
Som
erse
t 12
2a
Bea
r Cre
ek
Hai
l 05
1301
0205
09
DB
5138
-1.6
1
Som
erse
t 12
2a
UT
Bea
r Cre
ek
Hai
l 05
1301
0205
09
DB
5138
-1.6
2
Som
erse
t 12
2a
UT
Bea
r Cre
ek
Hai
l 05
1301
0205
09
DB
5138
-1.6
1 1
Som
erse
t 12
2a
Bea
r Cre
ek
Hai
l 05
1301
0205
09
DB
5138
-2.1
1
Som
erse
t 12
2a
UT
Bea
r Cre
ek
Saw
yer
0513
0102
0509
D
B51
38-2
.1
2 So
mer
set
122a
U
T B
ear C
reek
Sa
wye
r 05
1301
0205
09
DB
5138
-2.5
1
Som
erse
t 12
2a
Bea
r Cre
ek
Hai
l 05
1301
0205
09
DB
5165
-0.3
1
Som
erse
t 50
U
T C
ave
Cre
ek
Hai
l 05
1301
0302
03
DB
5183
-0.2
1
Som
erse
t 51
81
Pink
Bra
nch
Hai
l 05
1301
0114
06
DB
5195
-.09
1 So
mer
set
46
UT
Dry
Bra
nch
Hai
l 05
1301
0302
01
DB
5234
-0.4
1
Som
erse
t 81
7 U
T Ea
gle
Cre
ek
Hai
l 05
1301
0114
03
DB
5267
-0.2
5 1
Som
erse
t 92
7 U
T St
anle
y B
ranc
h N
evel
svill
e 05
1301
0407
03
DB
5270
-0.4
1
Som
erse
t 92
7 Li
ck B
ranc
h N
evel
svill
e 05
1301
0406
07
DB
5279
-0.8
1
Som
erse
t 64
6a
Stra
ight
Cre
ek
Nev
elsv
ille
0513
0104
0607
D
B52
79-1
.2
1 So
mer
set
646a
Fo
x D
en H
ollo
w
Nev
elsv
ille
0513
0104
0607
D
B52
79-1
.4
1 So
mer
set
646a
St
raig
ht C
reek
N
evel
svill
e 05
1301
0406
07
DB
5279
-1.4
5 1
Som
erse
t 64
6a
Stra
ight
Cre
ek
Nev
elsv
ille
0513
0104
0607
D
B52
79-1
.5
1 So
mer
set
646a
U
T St
raig
ht C
reek
N
evel
svill
e 05
1301
0406
07
DB
5279
-1.7
1
Som
erse
t 64
6a
UT
Stra
ight
Cre
ek
Nev
elsv
ille
0513
0104
0607
D
B52
79-1
.75
1 So
mer
set
646a
St
raig
ht C
reek
N
evel
svill
e 05
1301
0406
07
DB
137-
0.05
1
Stea
rns
564
UT
Roc
k C
reek
B
ell F
arm
05
1301
0404
08
DB
137-
0.8
1 St
earn
s TN
line
on
137
Big
Bra
nch
Bar
thel
l SW
05
1301
0404
08
DB
137-
1.2
1 St
earn
s TN
line
on
137
Buf
falo
Bra
nch
Bar
thel
l SW
05
1301
0404
08
DB
137-
2.9
1 St
earn
s TN
line
on
137
UT
Roc
k Tr
ace
Bel
l Far
m
0513
0104
0408
D
B13
7-2.
9 2
Stea
rns
TN li
ne o
n 13
7 U
T R
ock
Trac
e B
ell F
arm
05
1301
0404
08
DB
137x
0.0
1 1
Stea
rns
137
Roc
k C
reek
B
ell F
arm
05
1301
0404
08
DB
492-
2.3
1 St
earn
s 14
70
Lot H
ollo
w
Ket
chen
05
1301
0110
01
DB
492-
5.8
1 St
earn
s 14
70
UT
Roc
k C
reek
K
etch
en
0513
0101
1001
D
B49
2-7.
1 1
Stea
rns
1470
R
ock
Cre
ek
Ket
chen
05
1301
0110
01
DB
492-
8.0
1 St
earn
s 14
70
Shut
in B
ranc
h K
etch
en
0513
0101
1001
D
B49
8-0.
9 1
Stea
rns
1470
R
iggs
Bra
nch
Hol
ly H
ill
0513
0101
1002
D
B50
2-0.
6 1
Stea
rns
6274
U
T C
apuc
hin
Cre
ek
Jelli
co W
est
0513
0101
1001
ta
ble
cont
inue
d ne
xt p
age…

57
Site
ID
Pipe
#
Dis
trict
Ju
nctio
n R
oad
Stre
am N
ame
Qua
d 6t
h le
vel w
ater
shed
DB
502-
1.7
1 St
earn
s 49
2 U
T C
apuc
hin
Cre
ek
Jelli
co W
est
0513
0101
1001
D
B56
4-0.
1 1
Stea
rns
566
UT
Roc
k C
reek
B
ell F
arm
05
1301
0404
08
DB
564-
1.3
1 St
earn
s 56
6 U
T R
ock
Cre
ek
Bel
l Far
m
0513
0104
0408
D
B56
4-1.
3 2
Stea
rns
566
UT
Roc
k C
reek
B
ell F
arm
05
1301
0404
08
DB
566-
0.05
1
Stea
rns
564
UT
Roc
k C
reek
B
ell F
arm
05
1301
0404
08
DB
566-
2.4
1 St
earn
s 13
63
UT
Roc
k C
reek
B
arth
ell
0513
0104
0409
D
B56
6-3.
5 1
Stea
rns
1363
U
T R
ock
Cre
ek
Bar
thel
l 05
1301
0404
09
DB
566-
4.6
1 St
earn
s 13
63
UT
Fide
lity
Lock
er
Bar
thel
l 05
1301
0404
09
DB
566-
5.0
1 St
earn
s 13
63
UT
Roc
k C
reek
B
ell F
arm
05
1301
0404
09
DB
6020
-0.3
1
Stea
rns
90
Kilb
urn
Fork
W
ibor
g 05
1301
0114
02
DB
6020
-0.3
2
Stea
rns
90
Kilb
urn
Fork
W
ibor
g 05
1301
0114
02
DB
6061
-3.2
1
Stea
rns
1651
U
T B
ig C
reek
W
ibor
g 05
1301
0406
07
DB
6274
-0.2
1
Stea
rns
502
UT
Cap
uchi
n C
reek
Je
llico
Wes
t 05
1301
0110
01
DB
6274
-0.4
1
Stea
rns
6274
U
T C
apuc
hin
Cre
ek
Jelli
co W
est
0513
0101
1001
D
B65
0-3.
1 1
Stea
rns
69
Stal
lion
Fork
N
evel
svill
e 05
1301
0406
06
DB
663a
-0.0
1
Stea
rns
663
Big
Nor
th F
ork
Nev
elsv
ille
0513
0104
0607
D
B66
3a-0
.5
1 St
earn
s 66
3 B
ig N
orth
For
k N
evel
svill
e 05
1301
0406
07
DB
663a
-0.5
2
Stea
rns
663
Big
Nor
th F
ork
Nev
elsv
ille
0513
0104
0607
D
B68
-2.1
1
Stea
rns
651
Brid
ge H
ollo
w
Nev
elsv
ille
0513
0104
0607
D
B68
-3.6
1
Stea
rns
651
Stev
en's
Bra
nch
Nev
elsv
ille
0513
0104
0607

58
Table B4. Coarse filter A, B, and C, classifications for crossings surveyed on the Daniel Boone National Forest, summer 2005.
Site ID Pipe # Filter A Filter B Filter C
DB100-1.5 1 indeterminate impassable impassable DB119b-0.8 1 indeterminate indeterminate indeterminate DB119b-0.8 2 indeterminate indeterminate indeterminate DB119b-0.8 3 passable passable impassable DB131-0.3 1 indeterminate impassable impassable DB132-0.5 1 indeterminate impassable impassable DB193-1.8 1 passable passable passable DB195-1.1 1 indeterminate impassable impassable DB195-1.9 1 impassable impassable impassable DB195-3.3 1 indeterminate impassable impassable DB4094-0.6 1 indeterminate impassable impassable DB4133-0.49 1 indeterminate indeterminate impassable DB4252-0.5 1 passable impassable impassable DB4252-0.5 2 passable impassable impassable DB534-xx 1 passable impassable impassable DB615-0.9 1 indeterminate indeterminate impassable DB626-0.3 1 impassable impassable impassable DB741-0.3 1 indeterminate impassable impassable DB781-0.01 1 impassable impassable impassable DB119-3.7 1 indeterminate indeterminate impassable DB272-1.3 1 passable impassable impassable DB272-1.7 1 passable passable passable DB272-2.5 1 indeterminate indeterminate impassable DB46-0.6 1 indeterminate indeterminate impassable DB5057-0.2 1 passable passable passable DB5057-0.25 1 passable passable impassable DB5057-1.8 1 indeterminate indeterminate impassable DB5057-1.8 2 indeterminate indeterminate impassable DB5138-0.6 1 impassable impassable impassable DB5138-1.0 1 passable indeterminate impassable DB5138-1.5 1 indeterminate impassable impassable DB5138-1.5 2 indeterminate impassable impassable DB5138-1.6 1 indeterminate indeterminate impassable DB5138-1.6 2 indeterminate indeterminate impassable DB5138-1.61 1 passable passable passable DB5138-2.1 1 indeterminate indeterminate impassable DB5138-2.1 2 indeterminate indeterminate impassable DB5138-2.5 1 indeterminate impassable impassable DB5165-0.3 1 passable passable passable DB5183-0.2 1 passable passable passable DB5195-.09 1 indeterminate impassable impassable DB5234-0.4 1 passable indeterminate impassable DB5267-0.25 1 indeterminate impassable impassable DB5270-0.4 1 impassable impassable impassable DB5279-0.8 1 passable impassable impassable table continued next page…
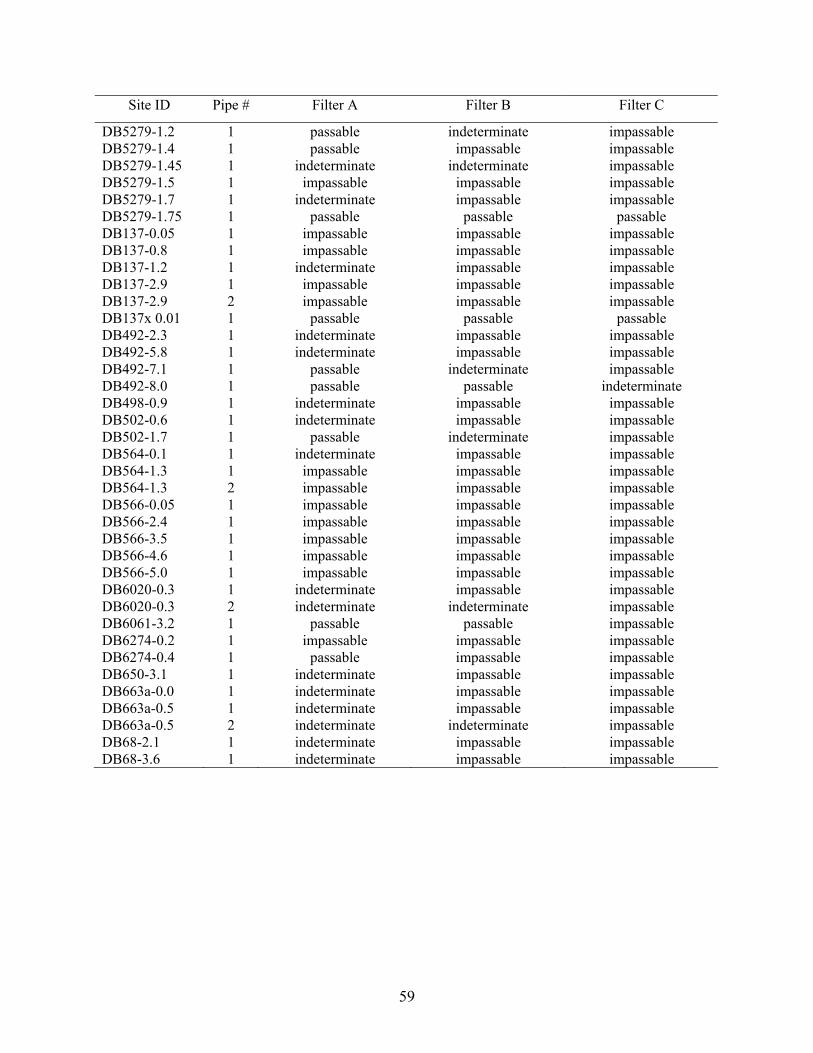
59
Site ID Pipe # Filter A Filter B Filter C
DB5279-1.2 1 passable indeterminate impassable DB5279-1.4 1 passable impassable impassable DB5279-1.45 1 indeterminate indeterminate impassable DB5279-1.5 1 impassable impassable impassable DB5279-1.7 1 indeterminate impassable impassable DB5279-1.75 1 passable passable passable DB137-0.05 1 impassable impassable impassable DB137-0.8 1 impassable impassable impassable DB137-1.2 1 indeterminate impassable impassable DB137-2.9 1 impassable impassable impassable DB137-2.9 2 impassable impassable impassable DB137x 0.01 1 passable passable passable DB492-2.3 1 indeterminate impassable impassable DB492-5.8 1 indeterminate impassable impassable DB492-7.1 1 passable indeterminate impassable DB492-8.0 1 passable passable indeterminate DB498-0.9 1 indeterminate impassable impassable DB502-0.6 1 indeterminate impassable impassable DB502-1.7 1 passable indeterminate impassable DB564-0.1 1 indeterminate impassable impassable DB564-1.3 1 impassable impassable impassable DB564-1.3 2 impassable impassable impassable DB566-0.05 1 impassable impassable impassable DB566-2.4 1 impassable impassable impassable DB566-3.5 1 impassable impassable impassable DB566-4.6 1 impassable impassable impassable DB566-5.0 1 impassable impassable impassable DB6020-0.3 1 indeterminate impassable impassable DB6020-0.3 2 indeterminate indeterminate impassable DB6061-3.2 1 passable passable impassable DB6274-0.2 1 impassable impassable impassable DB6274-0.4 1 passable impassable impassable DB650-3.1 1 indeterminate impassable impassable DB663a-0.0 1 indeterminate impassable impassable DB663a-0.5 1 indeterminate impassable impassable DB663a-0.5 2 indeterminate indeterminate impassable DB68-2.1 1 indeterminate impassable impassable DB68-3.6 1 indeterminate impassable impassable

60
Tabl
e B
5. D
escr
iptio
n of
cro
ssin
gs su
rvey
ed o
n th
e D
anie
l Boo
ne N
atio
nal F
ores
t, su
mm
er 2
005.
Sha
pe a
bbre
viat
ions
: C=
circ
ular
, PA
= pi
pe
arch
, OB
A=
open
bot
tom
arc
h, a
nd F
= fo
rd.
Cha
nnel
wid
th is
the
mea
n ba
nkfu
ll ch
anne
l wid
th.
N=
no n
atur
al su
bstra
te, N
(dis
cont
in)=
di
scon
tinuo
us su
bstra
te, Y
= co
ntin
uous
nat
ural
subs
trate
. A
n N
A (n
ot a
pplic
able
) ind
icat
es o
utle
t dro
p (n
o ou
tlet p
ool o
r tai
lwat
er c
ontro
l) or
ou
tlet p
erch
(stre
am d
ry) c
ould
not
be
calc
ulat
ed.
Neg
ativ
e ou
tlet d
rop
or p
erch
val
ues i
ndic
ate
a su
bmer
ged
outle
t (st
ruct
ure
parti
ally
ba
ckw
ater
ed).
Res
idua
l inl
et d
epth
val
ues ≥
0.0
indi
cate
the
stru
ctur
e is
fully
bac
kwat
ered
. Si
te ID
Pi
pe
# Sh
ape
Pipe
C
ondi
tion
Mea
n C
hann
el
Wid
th (f
t)
Con
tinuo
us
Subs
trate
in
Stru
ctur
e
Pipe
sl
ope
(%)
Pipe
W
idth
: C
hann
el
Wid
th
ratio
Out
let
Dro
p (in
)
Out
let
Perc
h (in
)
Res
idua
l In
let
Dep
th (i
n)
Pipe
Le
ngth
(f
t)
Slop
e (%
) *
Leng
th
(ft)
DB
100-
1.5
1 C
po
or
5.2
N
2.96
0.
87
13.6
2 N
A
0.00
46
.7
138.
0 D
B11
9b-0
.8
1 C
po
or
17.7
N
(dis
cont
in)
1.93
0.
25
2.64
2.
28
0.00
34
.2
66.0
D
B11
9b-0
.8
2 C
po
or
17.7
N
(dis
cont
in)
1.86
0.
25
2.28
1.
92
0.00
35
.5
66.0
D
B11
9b-0
.8
3 C
fa
ir 17
.7
N (d
isco
ntin
) 0.
60
0.25
5.
34
4.98
0.
00
34.3
20
.5
DB
131-
0.3
1 C
go
od
7.4
N
3.15
0.
48
11.5
2 N
A
0.00
83
.8
264.
0 D
B13
2-0.
5 1
PA
poor
12
.7
N
1.98
0.
35
15.6
0 16
.56
0.00
59
.7
118.
0 D
B19
3-1.
8 1
OB
A
good
32
.2
Y
3.51
0.
65
-30.
72
-41.
76
0.24
72
.3
254.
0 D
B19
5-1.
1 1
PA
good
23
.4
N
1.46
0.
56
18.9
0 15
.18
0.00
76
.4
111.
5 D
B19
5-1.
9 1
C
fair
14.0
N
3.
72
0.36
32
.40
29.1
6 0.
00
93.0
34
6.0
DB
195-
3.3
1 PA
fa
ir 17
.2
N
1.31
0.
70
11.4
0 3.
60
0.00
66
.6
87.0
D
B40
94-0
.6
1 C
go
od
18.2
N
2.
66
0.22
14
.04
15.7
2 0.
00
29.7
79
.0
DB
4133
-0.4
9 1
PA
fair
7.3
N
1.70
0.
59
9.24
7.
50
0.00
35
.2
60.0
D
B42
52-0
.5
1 C
po
or
10.6
N
0.
67
0.47
12
.84
10.4
4 0.
00
46.0
31
.0
DB
4252
-0.5
2
C
poor
10
.6
N
0.60
0.
47
13.2
0 10
.80
0.00
44
.4
26.5
D
B53
4-xx
1
F go
od
11.0
N
(dis
cont
in)
1.60
0.
00
NA
12
.42
0.00
17
.8
28.5
D
B61
5-0.
9 1
C
fair
6.4
N
2.98
0.
39
6.96
8.
88
0.00
24
.8
74.0
D
B62
6-0.
3 1
C
good
13
.2
N
9.68
0.
30
17.4
0 N
A
0.00
72
.3
700.
0 D
B74
1-0.
3 1
C
good
7.
9 N
4.
46
0.25
2.
28
-2.1
6 0.
00
24.9
11
1.0
DB
781-
0.01
1
C
fair
8.9
N
3.10
0.
34
44.7
6 38
.04
0.00
62
.9
195.
0 D
B11
9-3.
7 1
C
fair
10.2
N
1.
39
0.54
9.
60
13.1
4 0.
00
80.1
11
1.0
DB
272-
1.3
1 PA
fa
ir 16
.8
N
0.56
0.
68
11.6
4 21
.00
0.00
47
.9
27.0
D
B27
2-1.
7 1
PA
good
16
.4
Y
0.18
0.
76
-4.6
8 N
A
3.84
39
.4
7.0
DB
272-
2.5
1 PA
po
or
21.5
N
1.
34
0.58
-2
.76
-1.3
2 0.
00
116.
6 15
6.0
DB
46-0
.6
1 PA
po
or
5.5
N
2.28
1.
10
6.96
N
A
0.00
42
.6
97.0
D
B50
57-0
.2
1 C
go
od
9.7
Y
0.64
0.
31
-2.5
2 -3
.78
4.2
22.0
14
.0
DB
5057
-0.2
5 1
PA
fair
12.6
N
1.
06
0.35
8.
58
NA
0.
00
21.6
23
.0
tabl
e co
ntin
ued
next
pag
e…

61
Site
ID
Pipe
#
Shap
e Pi
pe
Con
ditio
n M
ean
Cha
nnel
W
idth
(ft)
Con
tinuo
us
Subs
trate
in
Stru
ctur
e
Pipe
sl
ope
(%)
Pipe
W
idth
: C
hann
el
Wid
th
ratio
Out
let
Dro
p (in
)
Out
let
Perc
h (in
)
Res
idua
l In
let
Dep
th (i
n)
Pipe
Le
ngth
(f
t)
Slop
e (%
) *
Leng
th
(ft)
DB
5057
-1.8
1
C
good
10
.1
N
1.90
0.
25
7.56
N
A
0.00
31
.0
59.0
D
B50
57-1
.8
2 C
go
od
10.1
N
2.
70
0.20
5.
46
NA
0.
00
31.5
85
.0
DB
5138
-0.6
1
C
fair
9.6
N
8.05
0.
26
53.5
2 52
.56
0.00
39
.9
321.
0 D
B51
38-1
.0
1 F
poor
17
.3
N (d
isco
ntin
) 2.
29
0.00
4.
92
1.32
0.
00
15.7
36
.0
DB
5138
-1.5
1
C
good
19
.9
N
2.10
0.
20
11.2
8 8.
28
0.00
41
.4
87.0
D
B51
38-1
.5
2 C
go
od
19.9
N
1.
61
0.20
14
.52
11.5
2 0.
00
40.4
65
.0
DB
5138
-1.6
1
C
fair
10.3
N
2.
81
0.24
7.
92
6.36
0.
00
22.4
63
.0
DB
5138
-1.6
2
C
fair
10.3
N
2.
23
0.24
6.
24
4.68
0.
00
22.4
50
.0
DB
5138
-1.6
1 1
F po
or
19.2
N
(dis
cont
in)
0.79
0.
00
NA
-3
.24
0.00
15
.2
12.0
D
B51
38-2
.1
1 C
po
or
9.7
N
3.23
0.
31
5.64
4.
08
0.00
30
.0
97.0
D
B51
38-2
.1
2 C
po
or
9.7
N
3.47
0.
31
4.68
3.
12
0.00
30
.0
104.
0 D
B51
38-2
.5
1 C
fa
ir 11
.1
N
4.00
0.
27
2.52
2.
40
0.00
39
.5
158.
0 D
B51
65-0
.3
1 C
po
or
9.6
N
0.10
0.
42
3.72
N
A
0.00
19
.9
2.0
DB
5183
-0.2
1
C
bad
8.4
N
0.10
0.
30
-2.2
8 -2
.76
2.04
19
.8
2.0
DB
5195
-.09
1 PA
po
or
7.9
N
5.40
0.
51
1.32
N
A
0.00
21
.3
115.
0 D
B52
34-0
.4
1 C
fa
ir 4.
3 N
2.
55
1.05
7.
86
7.56
0.
00
11.4
29
.0
DB
5267
-0.2
5 1
C
fair
6.3
N
4.51
0.
48
-0.3
6 -1
.44
0.00
27
.3
123.
0 D
B52
70-0
.4
1 C
po
or
12.5
N
0.
46
0.24
34
.68
32.7
6 0.
00
18.5
8.
5 D
B52
79-0
.8
1 F
good
18
.2
N (d
isco
ntin
) 0.
65
0.00
15
.96
14.5
2 0.
00
15.5
10
.0
DB
5279
-1.2
1
F go
od
8.6
N (d
isco
ntin
) 1.
43
0.00
9.
72
8.40
0.
00
22.3
32
.0
DB
5279
-1.4
1
F go
od
21.3
N
(dis
cont
in)
2.87
0.
00
15.6
6 10
.68
0.00
17
.0
48.0
D
B52
79-1
.45
1 F
good
19
.4
N
1.83
0.
00
9.24
7.
80
0.00
28
.0
51.0
D
B52
79-1
.5
1 F
good
8.
8 N
(dis
cont
in)
8.34
0.
00
18.1
2 N
A
0.00
15
.7
233.
0 D
B52
79-1
.7
1 F
good
19
.1
N (d
isco
ntin
) 4.
19
0.00
14
.04
12.0
0 0.
00
15.5
65
.0
DB
5279
-1.7
5 1
F go
od
16.3
N
(dis
cont
in)
0.09
0.
00
1.74
N
A
0.00
16
.0
1.5
DB
137-
0.05
1
C
good
10
.6
N
6.46
0.
57
11.2
8 N
A
0.00
11
5.9
749.
0 D
B13
7-0.
8 1
F go
od
13.2
N
(dis
cont
in)
8.02
0.
00
16.2
0 6.
24
0.00
8.
1 65
.0
DB
137-
1.2
1 F
good
14
.8
N
6.93
0.
00
5.52
-1
.56
0.00
14
.0
97.0
D
B13
7-2.
9 1
C
poor
7.
1 N
9.
49
0.28
1.
08
NA
0.
00
25.4
24
1.0
DB
137-
2.9
2 C
po
or
7.1
N
7.14
0.
28
-1.2
0 N
A
0.00
25
.2
180.
0 ta
ble
cont
inue
d ne
xt p
age…
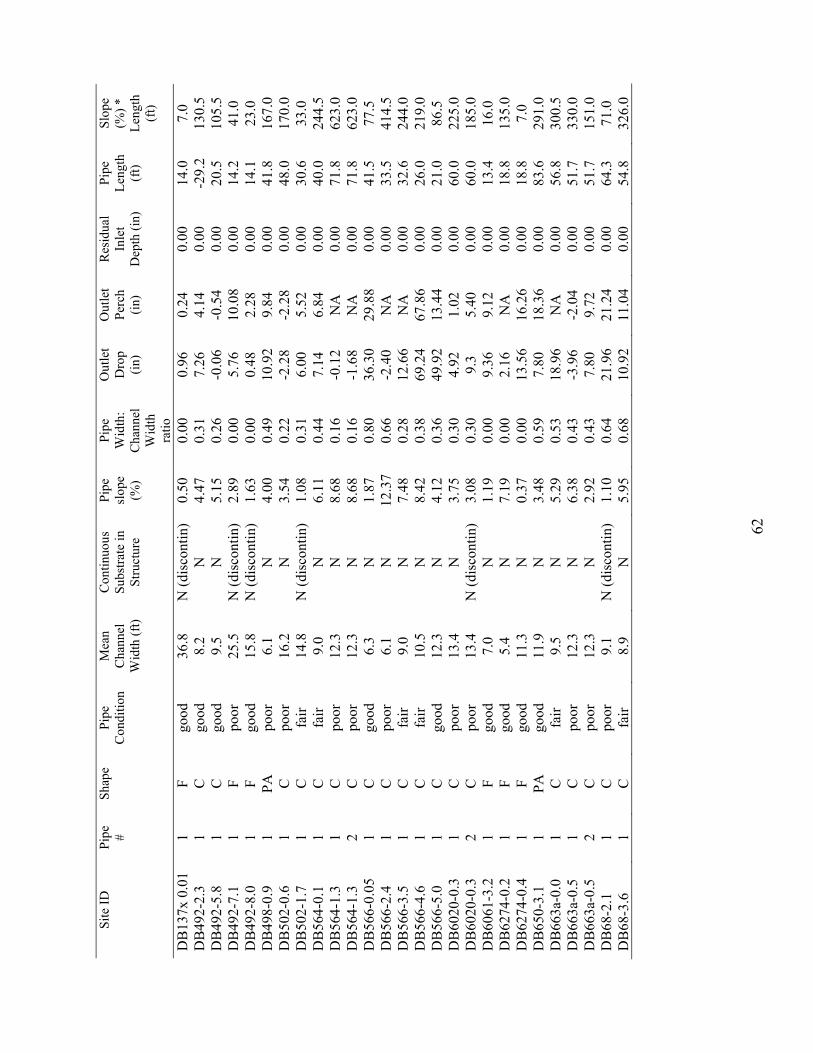
62
Site
ID
Pipe
#
Shap
e Pi
pe
Con
ditio
n M
ean
Cha
nnel
W
idth
(ft)
Con
tinuo
us
Subs
trate
in
Stru
ctur
e
Pipe
sl
ope
(%)
Pipe
W
idth
: C
hann
el
Wid
th
ratio
Out
let
Dro
p (in
)
Out
let
Perc
h (in
)
Res
idua
l In
let
Dep
th (i
n)
Pipe
Le
ngth
(f
t)
Slop
e (%
) *
Leng
th
(ft)
DB
137x
0.0
1 1
F go
od
36.8
N
(dis
cont
in)
0.50
0.
00
0.96
0.
24
0.00
14
.0
7.0
DB
492-
2.3
1 C
go
od
8.2
N
4.47
0.
31
7.26
4.
14
0.00
-2
9.2
130.
5 D
B49
2-5.
8 1
C
good
9.
5 N
5.
15
0.26
-0
.06
-0.5
4 0.
00
20.5
10
5.5
DB
492-
7.1
1 F
poor
25
.5
N (d
isco
ntin
) 2.
89
0.00
5.
76
10.0
8 0.
00
14.2
41
.0
DB
492-
8.0
1 F
good
15
.8
N (d
isco
ntin
) 1.
63
0.00
0.
48
2.28
0.
00
14.1
23
.0
DB
498-
0.9
1 PA
po
or
6.1
N
4.00
0.
49
10.9
2 9.
84
0.00
41
.8
167.
0 D
B50
2-0.
6 1
C
poor
16
.2
N
3.54
0.
22
-2.2
8 -2
.28
0.00
48
.0
170.
0 D
B50
2-1.
7 1
C
fair
14.8
N
(dis
cont
in)
1.08
0.
31
6.00
5.
52
0.00
30
.6
33.0
D
B56
4-0.
1 1
C
fair
9.0
N
6.11
0.
44
7.14
6.
84
0.00
40
.0
244.
5 D
B56
4-1.
3 1
C
poor
12
.3
N
8.68
0.
16
-0.1
2 N
A
0.00
71
.8
623.
0 D
B56
4-1.
3 2
C
poor
12
.3
N
8.68
0.
16
-1.6
8 N
A
0.00
71
.8
623.
0 D
B56
6-0.
05
1 C
go
od
6.3
N
1.87
0.
80
36.3
0 29
.88
0.00
41
.5
77.5
D
B56
6-2.
4 1
C
poor
6.
1 N
12
.37
0.66
-2
.40
NA
0.
00
33.5
41
4.5
DB
566-
3.5
1 C
fa
ir 9.
0 N
7.
48
0.28
12
.66
NA
0.
00
32.6
24
4.0
DB
566-
4.6
1 C
fa
ir 10
.5
N
8.42
0.
38
69.2
4 67
.86
0.00
26
.0
219.
0 D
B56
6-5.
0 1
C
good
12
.3
N
4.12
0.
36
49.9
2 13
.44
0.00
21
.0
86.5
D
B60
20-0
.3
1 C
po
or
13.4
N
3.
75
0.30
4.
92
1.02
0.
00
60.0
22
5.0
DB
6020
-0.3
2
C
poor
13
.4
N (d
isco
ntin
) 3.
08
0.30
9.
3 5.
40
0.00
60
.0
185.
0 D
B60
61-3
.2
1 F
good
7.
0 N
1.
19
0.00
9.
36
9.12
0.
00
13.4
16
.0
DB
6274
-0.2
1
F go
od
5.4
N
7.19
0.
00
2.16
N
A
0.00
18
.8
135.
0 D
B62
74-0
.4
1 F
good
11
.3
N
0.37
0.
00
13.5
6 16
.26
0.00
18
.8
7.0
DB
650-
3.1
1 PA
go
od
11.9
N
3.
48
0.59
7.
80
18.3
6 0.
00
83.6
29
1.0
DB
663a
-0.0
1
C
fair
9.5
N
5.29
0.
53
18.9
6 N
A
0.00
56
.8
300.
5 D
B66
3a-0
.5
1 C
po
or
12.3
N
6.
38
0.43
-3
.96
-2.0
4 0.
00
51.7
33
0.0
DB
663a
-0.5
2
C
poor
12
.3
N
2.92
0.
43
7.80
9.
72
0.00
51
.7
151.
0 D
B68
-2.1
1
C
poor
9.
1 N
(dis
cont
in)
1.10
0.
64
21.9
6 21
.24
0.00
64
.3
71.0
D
B68
-3.6
1
C
fair
8.9
N
5.95
0.
68
10.9
2 11
.04
0.00
54
.8
326.
0

63
Appendix C: Results for the Ozark-St. Francis National Forest
64
We visited 724 crossings on the Boston Mountain, Pleasant Hill, Buffalo, and Bayou Ranger
Districts in 2005 (Figure C1, Table C1) and completed surveys on 5% (n=35) (Table C2). Filter A
(strong swimmers and leapers) classified 12% (n=4) of crossings as impassable, 51% (n=18) as passable,
and 37% (n=13) as indeterminate (Figure C2, Table C2). Filter B (moderate swimmers and leapers)
classified 63% (n=22) of crossings as impassable, 20% (n=7) as passable, and 17% (n=6) as indeterminate
(Figure C3, Table C2). Filter C (weak swimmers and leapers) classified 77% (n=27) of crossing as
impassable, 14% (n=5) as passable, and 9% (n=3) as indeterminate (Figure C4, Table C2).
Characteristics and filter classifications for each crossing are presented in Tables C3-C5.
The number of each crossing types surveyed was evenly distributed among circular culverts
(n=8), fords (n=9), vented fords (n=7), and box culverts (n=8). In addition surveyed pipe arches (n=3)
and open bottom arches (n=0) were less frequently encountered. Filter A classified 25% of circular
culverts and 22% of fords as impassable (Figure C5). Filter B classified 100% of pipe arches, 63% of
circular culverts and box culverts, 57% of vented fords, and 56% of fords as impassable (Figure C6).
Filter C classified 100% of pipe arches and vented fords, 75% of circular culverts, 63% of box culverts,
and 57% of vented fords as impassable (Figure C7). The mean crossing width to channel width ratio
(excluding fords, vented fords, and multiple structure crossings) (n=12) was 0.30 (SD=0.08), and no
crossings were greater than or equal to the bankfull channel width (i.e. crossing width to channel width
ration was greater than or equal to 1.0) (Figure C8).

65
Boston Mtn Buffalo
BayouPleasant Hill
ARKANSAS
±0 60 120 180 24030Kilometers
inventory completed
inventory incomplete
no inventory completed
Figure C1. Ranger Districts on the Ozark St. Francis National Forest road-stream crossing surveys were conducted, summer 2005.

66
impassable passable indeterminate
perc
enta
ge
0102030405060708090
100
n=4
n=18
n=13
Figure C2. Percentage of crossings classified as impassable, passable, or indeterminate for Filter A; Ozark-St. Francis National Forest, summer 2005 (N=35).
impassable passable indeterminate
perc
enta
ge
0102030405060708090
100
n=22
n=7 n=6
Figure C3. Percentage of crossings classified as impassable, passable, or indeterminate for Filter B; Ozark-St. Francis National Forest, summer 2005 (N=35).
impassable passable indeterminate
perc
enta
ge
0102030405060708090
100
n=27
n=5n=3
Figure C4. Percentage of crossings classified as impassable, passable, or indeterminate for Filter C; Ozark-St. Francis National Forest, summer 2005 (N=35).

67
circular ford box
perc
enta
ge
0102030405060708090
100 impassablepassableindeterminate
pipearch
openbottom
arch
ventedford
n=8 n=3 n=9 n=7n=0 n=8
Figure C5. Percentage of each crossing type classified as impassable, passable, or indeterminate for Filter A; Ozark-St. Francis National Forest, summer 2005 (N=35).
circular ford box
perc
enta
ge
0102030405060708090
100 impassablepassableindeterminate
pipearch
openbottom
arch
ventedford
n=8 n=3 n=9 n=7n=0 n=8
Figure C6. Percentage of each crossing type classified as impassable, passable, or indeterminate for Filter B; Ozark-St. Francis National Forest, summer 2005 (N=35).
circular ford box
perc
enta
ge
0102030405060708090
100 impassablepassableindeterminate
pipearch
openbottom
arch
ventedford
n=8 n=3 n=9 n=7n=0 n=8
Figure C7. Percentage of each crossing type classified as impassable, passable, or indeterminate for Filter C; Ozark-St. Francis National Forest, summer 2005 (N=35).

68
OSFNF
Cro
ssin
g W
idth
/ C
hann
el W
idth
0.00.20.40.60.81.01.21.41.61.8
n=12
Figure C8. Crossing width to bankfull channel width ratio for crossings surveyed in summer 2005 on the Ozark-St. Francis National Forest (excluding fords, vented fords, and multiple structure crossings). A ratio of 1.0 (dashed line) or greater indicates the crossing structure opening is greater than or equal to the bankfull channel width. The top and bottom of the boxes represent the 25th and 75th percentiles, the bar in the center of each box represents the median, whiskers represent the 10th and 90th percentiles, and closed circles represent the entire range of the data.

69
((((( (( ( ((( ((( ((( (( ((((
DDDDDD(D
(D D
DDDD
!
DD
DDDD
DD
DDD DD DD D(
DD
((D( ((D ( D
((
DúDDD
((DD (D DDDD
DDD DD (( D! D
(DD
DD
( (((D(
D (((! ((D( D
DD ((D (( (DD (DDDDDD
D (D D( ((D
DDDDDDD
D DDDD!! D
(D
( DDDD( D DD
((DD
! DD
!
DD (
D!
(D
DDD (DDDDDD
D((D D
DD!
DD(
D( !!
((
Dú
! D!((
D(( ! D(
DD (
D(DD
!
D (D( Dú D
((D( D D D(
D!!
DD!
DD(D(!!
!
(!D
((
DDú(
(
D
D
DD
D
D(( D!
DDD D( D(
D(
ú(
Dú
!D!ú
( ! DD
D (D
úD
D!
D
D
D D
DD
ú
D!
DD (D
DDD
DD
D ! (!
(
ú
DDD(D D
DD
D DD
D
! D!!D
D DD
D
Dú((!D !
DD
(
D DDD D D
D !D
D(
D! !
DD
Dú D
D(ú
D((
D ((DD D
(! D
(D
!(D(D
D D
!
DD( D DD
!!
(
!
DD !
D!
ú!
!
D(D !DDD
((
!
((
!
( (
!D D
(D D D
DD D DD
DD
( DDD!DD
(
D(D! ! (( D D(D( DD( DD(D ((((( DD ( D (DD
D(DD
DD (D D(( D (((D D(D (D (( D( DDD D((D DD
! !( (D! !((D
! (! ( DD!! (!( ( !DDD
D D (D DD
D(!D D DDD !! D !DDD
! !
!!
!!
!
!! !
! !!
!!
!!
!
!
! !
!
!
!
!
ARKANSAS
±0 10 20 30 405Kilometers
OSF NF
! impassable! indeterminate! passableú bridgeD no access( natural ford! insufficient upstream habitat
6th level watershed
((((( (( ( ((( ((( ((( (( ((
((
DDDDDD(D
(D D
DDDD
!
DD
DDDD
DD
DDD DD DD D(
DD
((D( ((D ( D(
(Dú
DDD ((DD (D DDDD
DDD DD (( D! D
(DD
DD
( (((D (D (((! ((
D( DDD ((
D (( (DD (DDDDDD DD
D (D D
D ( ((DD
DDDDDDD DDDD
!! D(
D( ( DD
DD( D DD(
(DD! D
D!
DD (
D!
(D
DDD (DDDDDD D
((D DD
D!
DD(
D( !!
((
Dú
! D!
((D(( ! D
(D
D (D
(DD!
D (D( Dú D
((D( D D D(
D!!
DD!
DD(D(!!
!
(!D
((
DDú(
(
D
D
DD
D
D(( D!
DDD D( D(
D(
ú(
Dú
!D!ú
( ! DD
D (D
úD
D!
D
D
D D
DD
úD!
DD (D
DDD
DD
D ! ( !(
ú
DDD(D D
DDD D
D
D
! D!!D
D DD
D
Dú((!D !
DD
(
D DDD D D
D !D
D(
D! !
DD
Dú D
D(ú
D((
D ((DD D
(!D
(D
!(D(D
D D
!
DD( D DD
!!
(
!
DD !
D!
ú!
!
D(D !DDD
((
!
((
!
( (
!D D(
D D D
DD D DD
DD
( DDD!DD
(
D(D! ! (( D D(D( DD( DD(D ((((( DD ( D (DD
D(DD
DD (D D(( D (((D D(D (D (( D( DDD D((D DD! !
( (D! !((D
! (! ( DD!! (!( ( !DDD
D D (D DD
D(!D D DDD !! D !DDD
!
!
!
! !
!
!!!
!!
!
!! !!!
!!
!!
! !! !
ARKANSAS
±0 10 20 30 405Kilometers
OSF NF
! impassable! indeterminate! passableú bridgeD no access( natural ford! insufficient upstream habitat
6th level watershed
DDDDDD(D
(D D
DDDD
!
DD
DDDD
DD
DDD DD DD D(
DD
((D( ((D ( D
((
DúDDD ((DD (D DDDD
DDD DD (( D! D
(DD
DD
( (((D (D (((! ((
D( DDD ((
D (( (DD (DDDDDD DDD (D D
D ( ((DD
DDDDDDD DDDD
!! D(
D( ( DD
DD( D DD(
(DD! D
D!
DD (
D!
(D
DDD (DDDDDD D
((D DD
D!
DD(
D( !!
((
Dú
! D!((
D(( ! D(
DD (
D(DD
!
D (D( Dú D
((D( D D D(
D!!
DD!
DD(D(!!
!
(!D
((
DDú(
(
D
D
DD
D
D(( D!
DDD
D( D(D
(ú
(D
ú
!D!ú
( ! DD
D (D
úD
D!
D
DD D
DD
úD!
DD (D
DDD
DD
D ! ( !(
ú
DDD(D D
DDD D
D
D
! D!!D
D DD
D
Dú((!D !
DD
(
D DDD D D
D !D
D(
D! !
DD
Dú D
D(ú
D((
D ((DD D
(!D
(D
!(D(D
D D
!
DD( D DD
!!
(
!
DD !
D!
ú!
!
D(D !DDD
((
!
((
!
( (
!D D(
D D D
DD D DD
DD
( DDD!DD
(
D(D! ! (( D D(D( DD( DD(D ((((( DD ( D (DD
D(DD
DD (D D(( D (((D D(D (D (( D( DDD D((D DD
! !( (D! !((D
! (! ( DD!! (!( ( !DDD
D D (D DD
D(!D D DDD !! D !DDD
((((( (( ( ((( ((( ((( (( ((((
!
!
!
!
!!!
!
!! !!!
!!
!!
!! !!! !!!
ARKANSAS
±0 10 20 30 405Kilometers
OSF NF
! impassable! indeterminate! passableú bridgeD no access( natural ford! insufficient upstream habitat
6th level watershed
Figure C9. Location of crossings classified for fish passage by coarse filters A, B, and C within 6th level watersheds, and crossings not surveyed on the Ozark St. Francis National Forest, summer 2005.
Filter B
Filter C
Filter A

70
Tabl
e C
1. N
umbe
r of c
ross
ings
doc
umen
ted
(Tot
al c
ross
ing
docu
men
ted)
and
not
surv
eyed
(Cro
ssin
gs n
ot su
rvey
ed) o
n th
e O
SFN
F in
sum
mer
20
05.
Rea
sons
for n
ot su
rvey
ing
a do
cum
ente
d si
te in
clud
e: n
o su
itabl
e fis
h ha
bita
t ups
tream
of c
ross
ing
(NH
); no
acc
ess t
o si
te d
ue to
clo
sed
road
s or p
rivat
e ga
tes (
NA
); cr
ossi
ng w
as a
nat
ural
ford
(NF)
; cro
ssin
g w
as a
brid
ge (B
R).
For
est
Tota
l cro
ssin
gs
Cro
ssin
gs n
ot su
rvey
ed (n
, [%
])
docu
men
ted
NH
N
A
NF
BR
To
tal n
ot su
rvey
ed
OSF
NF
724
85 (1
2)
396
(57)
19
1 (2
8)
17 (3
) 68
9 (9
5)
Tabl
e C
2. N
umbe
r of c
ross
ings
surv
eyed
(Tot
al su
rvey
ed) w
ith c
oars
e fil
ter r
esul
ts fo
r the
OSF
NF
in su
mm
er 2
005.
Coa
rse
filte
r res
ults
are
pr
esen
ted
for F
ilter
A, F
ilter
B, a
nd F
ilter
C (s
ee fi
lter d
escr
iptio
ns, F
ig 3
– 5
). F
ores
t To
tal
C
oars
e fil
ter r
esul
ts
su
rvey
ed
Im
pass
able
(n, [
%])
Pass
able
(n, [
%])
Inde
term
inat
e (n
, [%
])
A
1
B 1
C
1
A
1
B 1
C
1
A
1
B 1
C
1
OSF
NF
35
4
(12)
22
(63)
27
(77)
18 (5
1)
7 (2
0)
5 (1
4)
13
(37)
6
(17)
3
(9)

71
Tabl
e C
3. L
ocat
ion
of c
ross
ings
surv
eyed
on
the
Oza
rk S
t. Fr
anci
s Nat
iona
l For
est d
urin
g th
e su
mm
er o
f 200
5. S
ite ID
con
sist
s of t
he F
ores
t ab
brev
iatio
n (O
SF),
road
the
cros
sing
is o
n (1
538)
, and
the
dist
ance
(mile
s) fr
om th
e ju
nctio
n ro
ad (0
.8).
Site
ID
Pipe
#
Dis
trict
Ju
nctio
n R
oad
Stre
am N
ame
Qua
d 6t
h Le
vel W
ater
shed
OSF
113-
0.1
1 B
ayou
12
3 U
T Li
ttle
Pine
y C
reek
H
agar
ville
11
1102
0208
04
OSF
113-
0.1
2 B
ayou
12
3 U
T Li
ttle
Pine
y C
reek
H
agar
ville
11
1102
0208
04
OSF
113-
0.7
1 B
ayou
12
3 U
T Li
ttle
Pine
y C
reek
H
agar
ville
11
1102
0208
04
OSF
1813
-0.0
5 1
Bay
ou
113
Littl
e Su
lphu
r Cre
ek
Hag
arvi
lle
1111
0202
0804
O
SF18
13-1
.3
1 B
ayou
11
3 U
T To
ms B
ranc
h H
agar
ville
11
1102
0208
04
OSF
1813
-1.6
1
Bay
ou
113
Tom
s Bra
nch
Hag
arvi
lle
1111
0202
0804
O
SF10
03-7
.4
1 B
osto
n M
tn
23
Spiri
ts C
reek
B
idvi
lle
1111
0201
0704
O
SF15
01-2
.4
1 B
osto
n M
tn
23
Big
Edd
y H
ollo
w
Cas
s 11
1102
0107
04
OSF
1501
-2.4
2
Bos
ton
Mtn
23
B
ig E
ddy
Hol
low
C
ass
1111
0201
0704
O
SF15
09-0
.4
1 B
osto
n M
tn
79
UT
Mill
Cre
ek
St. P
aul
1101
0001
0103
O
SF15
20-0
.4
1 B
osto
n M
tn
1520
road
sign
off
112
Fa
ne C
reek
C
ass
1111
0201
0705
O
SF15
20-0
.4
2 B
osto
n M
tn
1520
road
sign
off
112
Fa
ne C
reek
C
ass
1111
0201
0705
O
SF15
20-0
.4
3 B
osto
n M
tn
1520
road
sign
off
112
Fa
ne C
reek
C
ass
1111
0201
0705
O
SF15
20-0
.4
4 B
osto
n M
tn
1520
road
sign
off
112
Fa
ne C
reek
C
ass
1111
0201
0705
O
SF15
20-1
.0
1 B
osto
n M
tn
1520
road
sign
off
112
C
ove
Cre
ek
Cas
s 11
1102
0107
05
OSF
1520
-7.2
1
Bos
ton
Mtn
15
20 ro
ad si
gn o
ff 1
12
UT
Mill
Cre
ek
Bid
ville
11
0100
0101
03
OSF
1520
-7.2
2
Bos
ton
Mtn
15
20 ro
ad si
gn o
ff 1
12
UT
Mill
Cre
ek
Bid
ville
11
0100
0101
03
OSF
1521
-0.8
1
Bos
ton
Mtn
23
C
rippl
e B
ranc
h C
ass
1111
0201
0704
O
SF14
05-0
.8
1 Pl
easa
nt H
ill
57
UT
Pine
y C
reek
R
oset
ta
1111
0202
0801
O
SF14
05-1
.6
1 Pl
easa
nt H
ill
21
Clif
ty H
ollo
w
Ozo
ne
1111
0202
0801
O
SF14
09-0
.9
1 Pl
easa
nt H
ill
57
UT
Pine
y C
reek
R
oset
ta
1111
0202
0802
O
SF14
22-1
.3
1 Pl
easa
nt H
ill
182
Dry
Spr
ada
Cre
ek
Har
mon
y 11
1102
0205
01
OSF
1422
-2.7
1
Plea
sant
Hill
18
2 U
T Sp
rada
Cre
ek
Har
mon
y 11
1102
0205
01
OSF
1426
-0.3
1
Plea
sant
Hill
12
3 U
T Li
ttle
Pine
y C
reek
H
agar
ville
11
1102
0208
04
OSF
1538
-0.5
1
Plea
sant
Hill
50
2 Lu
mpk
in C
reek
Pe
ttigr
ew
1101
0001
0102
Ta
ble
cont
inue
d ne
xt p
age…

72
Site
ID
Pipe
#
Dis
trict
Ju
nctio
n R
oad
Stre
am N
ame
Qua
d 6t
h Le
vel W
ater
shed
OSF
1538
-1.0
1
Plea
sant
Hill
50
2 U
T Lu
mpk
in C
reek
Pe
ttigr
ew
1101
0001
0102
O
SF15
38-1
.2
1 Pl
easa
nt H
ill
502
Lum
pkin
Cre
ek
Petti
grew
11
0100
0101
02
OSF
283-
1.7
1 Pl
easa
nt H
ill
164
Hor
sehe
ad C
reek
H
unt
1111
0202
0601
O
SF35
3-0.
2 1
Plea
sant
Hill
40
6 Li
ttle
Mul
berr
y C
reek
B
osto
n 11
1102
0106
01
OSF
36-0
.3
1 Pl
easa
nt H
ill
1425
A
UT
Mul
berr
y C
reek
O
ark
1111
0201
0604
O
SF36
-0.3
2
Plea
sant
Hill
14
25 A
U
T M
ulbe
rry
Cre
ek
Oar
k 11
1102
0106
04
OSF
407-
0.1
1 Pl
easa
nt H
ill
5151
(409
) U
T M
ulbe
rry
Cre
ek
Oar
k 11
1102
0106
01
OSF
5151
-2.5
1
Plea
sant
Hill
40
7 El
drid
ge H
ollo
w
Bos
ton
1111
0201
0601
O
SF51
51-2
.5
2 Pl
easa
nt H
ill
407
Eldr
idge
Hol
low
B
osto
n 11
1102
0106
01
OSF
5151
-2.5
3
Plea
sant
Hill
40
7 El
drid
ge H
ollo
w
Bos
ton
1111
0201
0601

73
Table C4. Coarse filters A, B, and C, classifications for surveyed crossings on the Ozark-St. Francis National Forest, summer 2005.
Site ID Pipe # Filter A Filter B Filter C OSF113-0.1 1 passable indeterminate indeterminate OSF113-0.1 2 passable indeterminate indeterminate OSF113-0.7 1 passable indeterminate impassable OSF1813-0.05 1 passable passable impassable OSF1813-1.3 1 indeterminate impassable impassable OSF1813-1.6 1 passable indeterminate impassable OSF1003-7.4 1 passable impassable impassable OSF1501-2.4 1 indeterminate impassable impassable OSF1501-2.4 2 indeterminate impassable impassable OSF1509-0.4 1 passable indeterminate impassable OSF1520-0.4 1 indeterminate impassable impassable OSF1520-0.4 2 passable impassable impassable OSF1520-0.4 3 passable impassable impassable OSF1520-0.4 4 indeterminate impassable impassable OSF1520-1.0 1 indeterminate impassable impassable OSF1520-7.2 1 passable passable passable OSF1520-7.2 2 passable passable passable OSF1521-0.8 1 indeterminate impassable impassable OSF1405-0.8 1 impassable impassable impassable OSF1405-1.6 1 impassable impassable impassable OSF1409-0.9 1 impassable impassable impassable OSF1422-1.3 1 passable passable impassable OSF1422-2.7 1 indeterminate impassable impassable OSF1426-0.3 1 impassable impassable impassable OSF1538-0.5 1 indeterminate impassable impassable OSF1538-1.0 1 indeterminate impassable impassable OSF1538-1.2 1 indeterminate impassable impassable OSF283-1.7 1 passable impassable impassable OSF353-0.2 1 passable passable passable OSF36-0.3 1 indeterminate impassable impassable OSF36-0.3 2 indeterminate impassable impassable OSF407-0.1 1 passable impassable impassable OSF5151-2.5 1 passable passable passable OSF5151-2.5 2 passable passable Passable OSF5151-2.5 3 passable indeterminate Indeterminate

74
Tabl
e C
5. D
escr
iptio
n of
cro
ssin
gs su
rvey
ed o
n th
e O
zark
St.
Fran
cis N
atio
nal F
ores
t, su
mm
er 2
005.
Sha
pe a
bbre
viat
ions
: C=
circ
ular
, PA
= pi
pe
arch
, OB
A=
open
bot
tom
arc
h, V
= ve
nted
ford
, B=
box,
and
F=
ford
. C
hann
el w
idth
is th
e m
ean
bank
full
chan
nel w
idth
. N
= no
nat
ural
subs
trate
, N
(dis
cont
in)=
dis
cont
inuo
us su
bstra
te, Y
= co
ntin
uous
nat
ural
subs
trate
. A
n N
A (n
ot a
pplic
able
) ind
icat
es o
utle
t dro
p (n
o ou
tlet p
ool o
r tai
lwat
er
cont
rol)
or o
utle
t per
ch (s
tream
dry
) cou
ld n
ot b
e ca
lcul
ated
. N
egat
ive
outle
t dro
p or
per
ch v
alue
s ind
icat
e a
subm
erge
d ou
tlet (
stru
ctur
e pa
rtial
ly
back
wat
ered
). R
esid
ual i
nlet
dep
th v
alue
s ≥ 0
.0 in
dica
te th
e st
ruct
ure
is fu
lly b
ackw
ater
ed.
Site
ID
Pipe
#
Shap
e Pi
pe
Con
ditio
n M
ean
Cha
nnel
W
idth
(ft)
Con
tinuo
us
Subs
trate
in
Stru
ctur
e
Pipe
sl
ope
(%)
Pipe
Wid
th:
Cha
nnel
W
idth
ratio
Out
let
Dro
p (in
)
Out
let
Perc
h (in
)
Res
idua
l In
let
Dep
th (i
n)
Pipe
Le
ngth
(f
t)
Slop
e (%
) *
Leng
th
(ft)
OSF
113-
0.1
1 C
go
od
16.0
N
1.
75
0.17
0.
48
75.3
6 0.
00
20.0
35
.0
OSF
113-
0.1
2 C
go
od
16.0
N
1.
80
0.17
1.
20
76.0
8 0.
00
20.0
36
.0
OSF
113-
0.7
1 C
go
od
15.0
N
1.
64
0.17
4.
56
NA
0.
00
24.4
40
.0
OSF
1813
-.05
1 F
good
23
.4
N
1.92
N
A
NA
2.
34
0.00
12
.0
23.0
O
SF18
13-1
.3
1 C
go
od
12.9
N
3.
86
0.27
11
.88
NA
0.
00
36.8
14
2.0
OSF
1813
-1.6
1
F go
od
19.2
N
1.
97
NA
N
A
2.40
0.
00
15.0
29
.5
OSF
1003
-7.4
1
B
good
28
.8
N
0.88
0.
26
22.3
2 17
.76
0.00
13
.0
11.5
O
SF15
01-2
.4
1 B
go
od
29.7
N
(dis
cont
in)
3.03
0.
52
17.7
0 N
A
0.00
63
.3
192.
0 O
SF15
01-2
.4
2 B
go
od
29.7
N
(dis
cont
in)
4.93
0.
52
3.84
N
A
0.00
63
.3
312.
0 O
SF15
09-0
.4
1 F
good
13
.8
N
3.00
N
A
7.38
6.
90
0.00
14
.5
43.5
O
SF15
20-0
.4
1 V
F fa
ir 50
.8
N
2.16
N
A
18.2
4 11
.70
0.00
24
.1
52.0
O
SF15
20-0
.4
2 V
F fa
ir 50
.8
N
1.49
N
A
19.5
0 12
.96
0.00
24
.1
36.0
O
SF15
20-0
.4
3 V
F fa
ir 50
.8
N
1.87
N
A
19.6
8 13
.14
0.00
24
.1
45.0
O
SF15
20-0
.4
4 V
F fa
ir 50
.8
N
2.72
N
A
18.5
4 12
.00
0.00
24
.1
65.5
O
SF15
20-1
.0
1 F
good
47
.0
N
6.79
N
A
-1.7
4 -2
.16
0.00
16
.8
114.
0 O
SF15
20-7
.2
1 B
po
or
13.8
Y
5.
52
0.29
-8
.40
NA
0.
00
20.0
11
0.5
OSF
1520
-7.2
2
B
poor
13
.8
Y
0.65
0.
29
3.30
N
A
0.00
20
.0
13.0
O
SF15
21-0
.8
1 C
fa
ir 19
.0
N
1.65
0.
42
11.8
8 8.
88
0.00
42
.3
70.0
O
SF14
05-0
.8
1 C
fa
ir 22
.7
N
7.00
0.
22
39.9
6 N
A
0.00
40
.0
280.
0 O
SF14
05-1
.6
1 F
fair
35.1
N
7.
17
NA
12
.00
NA
0.
00
20.5
14
7.0
OSF
1409
-0.9
1
F go
od
19.7
N
0.
33
NA
40
.56
27.4
2 0.
00
12.2
4.
0 O
SF14
22-1
.3
1 F
good
26
.1
N
0.32
N
A
4.56
N
A
0.00
20
.0
6.5
Tabl
e co
ntin
ued
next
pag
e…

75
Site
ID
Pipe
#
Shap
e Pi
pe
Con
ditio
n M
ean
Cha
nnel
W
idth
(ft)
Con
tinuo
us
Subs
trate
in
Stru
ctur
e
Pipe
sl
ope
(%)
Pipe
Wid
th:
Cha
nnel
W
idth
ratio
Out
let
Dro
p (in
)
Out
let
Perc
h (in
)
Res
idua
l In
let
Dep
th (i
n)
Pipe
Le
ngth
(f
t)
Slop
e (%
) *
Leng
th
(ft)
OSF
1422
-2.7
1
C
poor
17
.4
N
4.01
0.
32
21.0
6 18
.60
0.00
28
.2
113.
0 O
SF14
26-0
.3
1 C
fa
ir 8.
8 N
5.
12
0.45
27
.18
NA
0.
00
36.7
18
8.0
OSF
1538
-0.5
1
PA
fair
17.3
N
4.
00
0.29
9.
42
5.28
0.
00
39.5
15
8.0
OSF
1538
-1.0
1
PA
fair
11.4
N
6.
41
0.40
23
.40
21.6
0 0.
00
29.0
18
6.0
OSF
1538
-1.2
1
PA
fair
18.4
N
4.
75
0.28
10
.56
22.8
0 0.
00
32.0
15
2.0
OSF
283-
1.7
1 F
good
45
.6
N
0.55
N
A
17.4
6 13
.26
0.00
15
.4
8.5
OSF
353-
0.2
1 B
fa
ir 74
.7
Y
7.64
N
A
-3.4
8 -1
2.24
0.
00
14.0
10
7.0
OSF
36-0
.3
1 B
fa
ir 16
.9
N
4.12
0.
24
22.4
4 N
A
0.00
45
.4
187.
0 O
SF36
-0.3
2
B
fair
16.9
N
4.
26
0.24
21
.96
NA
0.
00
45.4
19
3.5
OSF
407-
0.1
1 F
fair
26.5
N
1.
68
NA
12
.90
18.4
8 0.
00
14.0
23
.5
OSF
5151
-2.5
1
VF
good
24
.7
N
0.05
0.
05
2.88
-2
.28
0.00
40
.4
2.0
OSF
5151
-2.5
2
VF
good
24
.7
Y
0.52
0.
05
4.20
-0
.96
0.00
40
.4
21.0
O
SF51
51-2
.5
3 V
F go
od
24.7
N
0.
69
0.05
1.
68
-3.4
8 0.
00
40.4
28
.0

76
Appendix D: Results for the National Forests in Alabama

77
We visited a total of 149 culverts on the Bankhead, Shoals Creek, and Talladega Ranger Districts
in 2005 (Figure D1, Table D1) and completed surveys on 50% (n=75) of the 149 crossings (Table D2).
Filter A (strong swimmers and leapers) classified 5% (n=4) of crossings as impassable, 39% (n=29) as
passable, and 56% (n=42) as indeterminate (Figure D2, Table D2). Filter B (moderate swimmers and
leapers) classified 56% (n=42) of crossings as impassable, 20% (n=15) as passable, and 24% (n=18) as
indeterminate (Figure D3, Table D2). Filter C (weak swimmers and leapers) classified 76% (n=57) of
crossings as impassable, 17% (n=13) as passable, and 7% (n=5) as indeterminate (Figure D4, Table D2).
Characteristics and filter classifications for each crossing are presented in Tables D3-D5.
The majority of the crossings were either circular culverts (n=39) or pipe arches (n=21), while
box culverts (n=10), vented fords (n=3), and open bottom arches (n=2) were less frequently encountered.
Filter A classified 10% of box culverts, 5% of circular culverts and 4% of pipe arches impassable (Figure
D5). Filter B classified 67% of circular culverts, 57% of pipe arches, and 40% of box culverts impassable
(Figure D6). Filter C classified 87% of circular culverts, 80% of box culverts, 67% of pipe arches, and
33% of vented fords impassable (Figure D7). The open bottom arches surveyed were passable for all 3
filters.
The mean crossings width to channel width ratio for surveyed structures (excluding fords and
vented fords) (n=43) was 0.65 (SD=0.34), and four crossings were greater than or equal to the mean
bankfull channel width (i.e. crossing width to channel width ration was greater than or equal to 1.0)
(Figure D8).

78
Talladega
William B. Bankhead
Shoal Creek
ALABAMA
±0 60 120 180 24030Kilometers
inventory completed
inventory incomplete
no inventory completed
Figure D1. Ranger Districts on the National Forests in Alabama road-stream crossing surveys were conducted, summer 2005.

79
impassable passable indeterminate
perc
enta
ge
0102030405060708090
100
n=4
n=29
n=42
Figure D2. Percentage of crossings classified as impassable, passable, or indeterminate for Filter A; National Forests in Alabama (Bankhead and Talladega NFs), summer 2005 (N=75).
impassable passable indeterminate
perc
enta
ge
0102030405060708090
100
n=42
n=15n=18
Figure D3. Percentage of crossings classified as impassable, passable, or indeterminate for Filter B; National Forests in Alabama (Bankhead and Talladega NFs), summer 2005 (N=75).
impassable passable indeterminate
perc
enta
ge
0102030405060708090
100
n=57
n=13n=5
Figure D4. Percentage of crossings classified as impassable, passable, or indeterminate for Filter C; National Forests in Alabama (Bankhead and Talladega NFs), summer 2005 (N=75).

80
circular ford box
perc
enta
ge
0102030405060708090
100 impassablepassableindeterminate
pipearch
openbottom
arch
ventedford
n=39 n=21 n=0 n=2 n=3 n=10
Figure D5. Percentage of each crossing type classified as impassable, passable, or indeterminate for Filter A; National Forests in Alabama (Bankhead and Talladega NFs), summer 2005 (N=75).
circular ford box
perc
enta
ge
0102030405060708090
100 impassablepassableindeterminate
pipearch
openbottom
arch
ventedford
n=39 n=21 n=0 n=2 n=3 n=10
Figure D6. Percentage of each crossing type classified as impassable, passable, or indeterminate for Filter B; National Forests in Alabama (Bankhead and Talladega NFs), summer 2005 (N=75).
circular ford box
perc
enta
ge
0102030405060708090
100 impassablepassableindeterminate
pipearch
openbottom
arch
ventedford
n=39 n=21 n=0 n=2 n=3 n=10
Figure D7. Percentage of each crossing type classified as impassable, passable, or indeterminate for Filter C; National Forests in Alabama (Bankhead and Talladega NFs), summer 2005 (N=75).
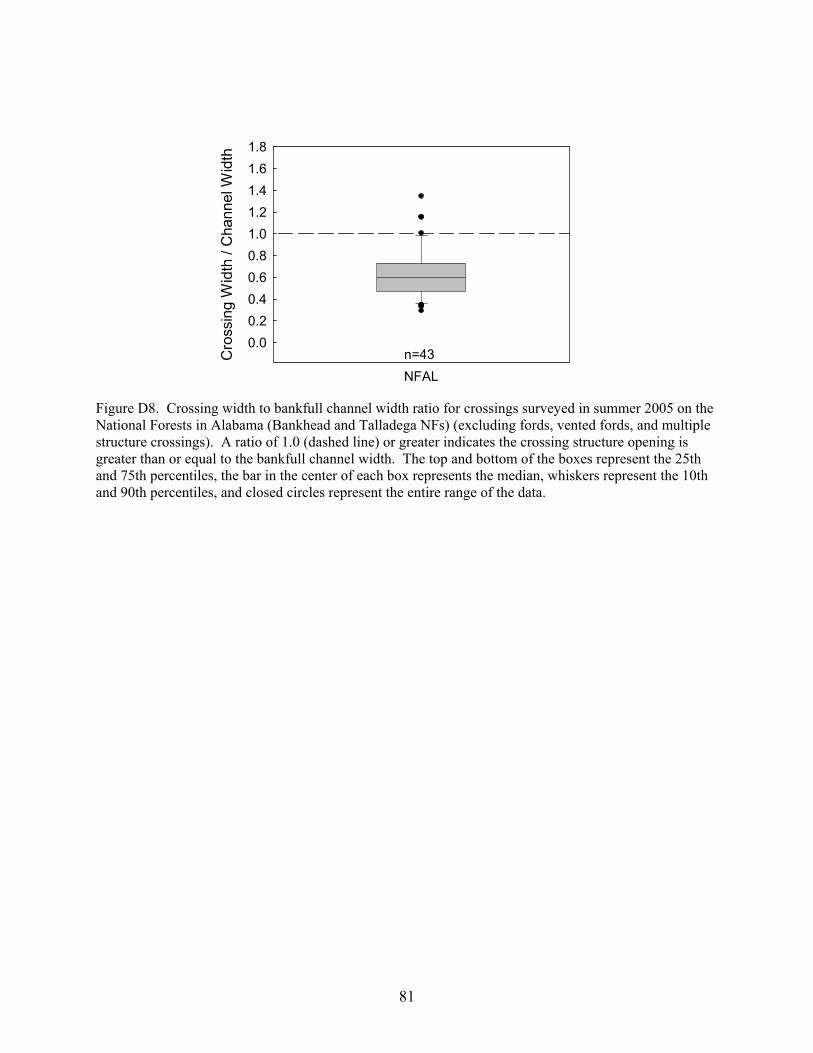
81
NFAL
Cro
ssin
g W
idth
/ C
hann
el W
idth
0.00.20.40.60.81.01.21.41.61.8
n=43
Figure D8. Crossing width to bankfull channel width ratio for crossings surveyed in summer 2005 on the National Forests in Alabama (Bankhead and Talladega NFs) (excluding fords, vented fords, and multiple structure crossings). A ratio of 1.0 (dashed line) or greater indicates the crossing structure opening is greater than or equal to the bankfull channel width. The top and bottom of the boxes represent the 25th and 75th percentiles, the bar in the center of each box represents the median, whiskers represent the 10th and 90th percentiles, and closed circles represent the entire range of the data.

82
!
!
!
!
!! !
!
!
!
úD
!
!
ú D
!!!!
D
!ú
!(
ú
ú
D!
!
!
!
ú
D
ú
D
D
ú
ú ú
úú
!
D
ALABAMA
±0 10 20 30 405Kilometers
! impassable! indeterminate! passableú bridgeD no access( natural ford! insufficient upstream habitat
6th level watershedBankhead NF
!
!
!
!!
!!
!
!
!
úD
!
!
ú D
!!!!
D
!ú
!(
ú
ú
D!
!
!
!
ú
D
ú
D
D
ú
ú ú
úú
!
D
ALABAMA
±0 10 20 30 405Kilometers
! impassable! indeterminate! passableú bridgeD no access( natural ford! insufficient upstream habitat
6th level watershedBankhead NF
<Double-click here to enter title>
!
!
!
!!
!!
!
!
!
úD
!
!
ú D
!!!!
D
!ú
!(
ú
ú
D!
!
!
!
ú
D
ú
D
D
ú
ú ú
úú
!
D
ALABAMA
±0 10 20 30 405Kilometers
! impassable! indeterminate! passableú bridgeD no access( natural ford! insufficient upstream habitat
6th level watershedBankhead NF
Figure D9. Location of crossings classified for fish passage by coarse filters A, B, and C within 6th level watersheds, and crossings not surveyed on the Bankhead National Forest in Alabama, summer 2005.
Filter B
Filter C
Filter A

83
!!
!
!
!!!
!!
!!!!!
!
!
!!!!!!
!!
!
!
!
!!!
!!
!
!
!!
!
!
!
!!
!
!!
!
!
!DD
D
ú ú
DDDD
!
D
(DD
DD
D
DD
DDDD
ú
DD
(((
DD
DD
DDD
ALABAMA
GEORGIA
±0 10 20 30 405Kilometers
! impassable! indeterminate! passableú bridgeD no access( natural ford! insufficient upstream habitat
Talladega NF6th level watershed
!!!
!
!!
!
!
!!!! !!
!
!
!!!
!
!
!
!
!!
!!
!
!
!!
!!
!
!
!!!
!!!
!
!!
!
!
!
ú
DD
(((
DD
DD
DDD
DDD
ú ú
DDDD
!
D
(DD
DD
D
DD
DDDD
ALABAMA
GEORGIA
±0 10 20 30 405Kilometers
! impassable! indeterminate! passableú bridgeD no access( natural ford! insufficient upstream habitat
Talladega NF6th level watershed
<Double-click here to enter title>
!!
!
!
!!
!!!! !!
!
!
!!
!!!
!
!
!
!!
!!
!!
!
!!!!!
!!!
!
!!
!!
!
!
!!
!DDD
ú ú
DDDD
!
D
(DD
DD
D
DD
DDDD
ú
DD
(((
DD
DD
DDD
ALABAMA
GEORGIA
±0 10 20 30 405Kilometers
! impassable! indeterminate! passableú bridgeD no access( natural ford! insufficient upstream habitat
Talladega NF6th level watershed
Figure D10. Location of crossings classified for fish passage by coarse filters A, B, and C within 6th level watersheds, and crossings not surveyed on the Talladega National Forest in Alabama, summer 2005.
Filter B
Filter C
Filter A

84
Tabl
e D
1. N
umbe
r of c
ross
ings
doc
umen
ted
(Tot
al c
ross
ings
doc
umen
ted)
and
not
surv
eyed
(Cro
ssin
gs n
ot su
rvey
ed) o
n th
e N
atio
nal F
ores
ts in
A
laba
ma
(Ban
khea
d an
d Ta
llade
ga N
Fs) s
umm
er 2
005.
Rea
sons
for n
ot su
rvey
ing
a do
cum
ente
d si
te in
clud
e: n
o su
itabl
e fis
h ha
bita
t ups
tream
of
cros
sing
(NH
); no
acc
ess t
o si
te d
ue to
clo
sed
road
s or p
rivat
e ga
tes (
NA
); cr
ossi
ng w
as a
nat
ural
ford
(NF)
; cro
ssin
g w
as a
brid
ge (B
R).
For
est
Tota
l cro
ssin
gs
Cro
ssin
gs n
ot su
rvey
ed (n
, [%
])
docu
men
ted
NH
N
A
NF
BR
To
tal n
ot su
rvey
ed
NFA
L 14
9 17
(23)
35
(47)
6
(8)
16 (2
2)
74 (5
0)
Tabl
e D
2. N
umbe
r of c
ross
ings
surv
eyed
(Tot
al su
rvey
ed) w
ith c
oars
e fil
ter r
esul
ts fo
r the
Nat
iona
l For
ests
in A
laba
ma
(Ban
khea
d an
d Ta
llade
ga
NFs
) sum
mer
200
5. C
oars
e fil
ter r
esul
ts a
re p
rese
nted
for F
ilter
A, F
ilter
B, a
nd F
ilter
C (s
ee fi
lter d
escr
iptio
ns, F
ig 3
– 5
). F
ores
t To
tal
C
oars
e fil
ter r
esul
ts
su
rvey
ed
Im
pass
able
(n, [
%])
Pass
able
(n, [
%])
Inde
term
inat
e (n
, [%
])
A
1
B 1
C
1
A
1
B 1
C
1
A
1
B 1
C
1
NFA
L 75
4 (5
) 42
(56)
57
(76)
29 (3
9)
15 (2
0)
13 (1
7)
42
(56)
18
(24)
5
(7)

85
Tabl
e D
3. L
ocat
ion
of c
ross
ings
surv
eyed
on
the
Nat
iona
l For
ests
in A
laba
ma
(Ban
khea
d an
d Ta
llade
ga N
Fs),
sum
mer
of 2
005.
Site
ID c
onsi
sts
of th
e Fo
rest
abb
revi
atio
n (B
H),
road
the
cros
sing
is o
n (1
18A
), an
d th
e di
stan
ce (m
iles)
from
the
junc
tion
road
(0.3
). Si
te ID
Pi
pe
# D
istri
ct
Junc
tion
Roa
d St
ream
Nam
e Q
uad
6th
Leve
l W
ater
shed
B
H11
8A-0
.3
1 B
ankh
ead
118
Alfo
rd S
prin
g H
oust
on
0316
0110
0105
B
H16
0-0.
9 1
Ban
khea
d 16
0 G
love
r Cre
ek
Add
ison
03
1601
1002
03
BH
160-
0.9
2 B
ankh
ead
160
Glo
ver C
reek
A
ddis
on
0316
0110
0203
B
H20
4A-1
.0
1 B
ankh
ead
210
Bas
in C
reek
K
inlo
ck S
prin
g 03
1601
1001
01
BH
204A
-1.0
2
Ban
khea
d 21
0 B
asin
Cre
ek
Kin
lock
Spr
ing
0316
0110
0101
B
H20
4A-1
.0
3 B
ankh
ead
210
Bas
in C
reek
K
inlo
ck S
prin
g 03
1601
1001
01
BH
208-
4.0
1 B
ankh
ead
203
Trib
. Tho
mps
on C
reek
B
ee B
ranc
h 03
1601
1001
01
BH
248-
0.35
1
Ban
khea
d 63
C
ollie
r Cre
ek T
rib.
Gra
yson
03
1601
1002
01
BH
250-
0.3
1 B
ankh
ead
63
Col
lier C
reek
Trib
. G
rays
on
0316
0110
0201
B
H25
4-0.
45
1 B
ankh
ead
246
Bru
shy
Cre
ek T
rib.
Gra
yson
03
1601
1002
01
BH
254-
0.45
2
Ban
khea
d 24
6 B
rush
y C
reek
Trib
. G
rays
on
0316
0110
0201
B
H26
4-1.
5 1
Ban
khea
d 49
Le
e C
reek
U
psha
w
0603
0002
1005
B
H26
4-1.
5 2
Ban
khea
d 49
Le
e C
reek
U
psha
w
0603
0002
1005
B
H26
4-2.
15
1 B
ankh
ead
249
Gill
espi
e C
reek
O
akvi
lle
0603
0002
1005
B
H26
8-2.
0 1
Ban
khea
d 49
Tr
ib. W
est F
lint C
reek
U
psha
w
0603
0002
1005
B
H26
8-2.
0 2
Ban
khea
d 49
Tr
ib. W
est F
lint C
reek
U
psha
w
0603
0002
1005
TN
F500
-0.7
1
Shoa
ls C
reek
55
3 Tr
ib. S
hoal
Cre
ek
Pied
mon
t SE
0315
0106
0602
TN
F500
-1.2
1
Shoa
ls C
reek
55
Tr
ib.M
ary'
s Cre
ek
Pied
mon
t SE
0315
0105
0901
TN
F500
-1.3
1
Shoa
ls C
reek
50
0 Tr
ib. C
olem
an L
ake
Pied
mon
t SE
0315
0106
0602
TN
F500
-1.4
1
Shoa
ls C
reek
55
3 Tr
ib. S
hoal
Cre
ek
Pied
mon
t SE
0315
0106
0602
TN
F500
-1.7
1
Shoa
ls C
reek
55
3 Tr
ib. S
hoal
Cre
ek
Pied
mon
t SE
0315
0106
0602
TN
F500
-11.
2 1
Shoa
ls C
reek
28
1 Tr
ib. S
wee
twat
er L
ake
Pied
mon
t SE
0315
0106
0602
TN
F500
-2.2
1
Shoa
ls C
reek
ch
ange
pav
emen
t to
grav
el
S. F
ork
Terr
apin
Cre
ek
Pied
mon
t SE
0315
0105
0901
TN
F500
-2.3
1
Shoa
ls C
reek
53
2 Tr
ib. S
hoal
Cre
ek
Pied
mon
t SE
0315
0106
0602
TN
F500
-5.6
1
Shoa
ls C
reek
28
1 Tr
ib. H
ighr
ock
Lake
H
eflin
03
1501
0606
02
TNF5
00-5
.8
1 Sh
oals
Cre
ek
281
Trib
. Hig
hroc
k La
ke
Hef
lin
0315
0106
0602
TN
F500
-6.5
1
Shoa
ls C
reek
28
1 Tr
ib. H
ighr
ock
Lake
H
eflin
03
1501
0606
02
TNF5
00-6
.5
2 Sh
oals
Cre
ek
281
Trib
. Hig
hroc
k La
ke
Hef
lin
0315
0106
0602
TN
F500
-6.5
3
Shoa
ls C
reek
28
1 Tr
ib. H
ighr
ock
Lake
H
eflin
03
1501
0606
02
TNF5
00-6
.8
1 Sh
oals
Cre
ek
281
Trib
. Hig
hroc
k La
ke
Hef
lin
0315
0106
0602
TN
F500
-6.8
2
Shoa
ls C
reek
28
1 Tr
ib. H
ighr
ock
Lake
H
eflin
03
1501
0606
02
Tabl
e co
ntin
ued
next
pag
e…

86
Site
ID
Pipe
#
Dis
trict
Ju
nctio
n R
oad
Stre
am N
ame
Qua
d 6t
h Le
vel
Wat
ersh
ed
TNF5
00-6
.8
3 Sh
oals
Cre
ek
281
Trib
. Hig
hroc
k La
ke
Hef
lin
0315
0106
0602
TN
F500
-8.2
1
Shoa
ls C
reek
28
1 Tr
ib. S
hoal
Cre
ek
Hef
lin
0315
0106
0602
TN
F500
-8.2
2
Shoa
ls C
reek
28
1 Tr
ib. S
hoal
Cre
ek
Hef
lin
0315
0106
0602
TN
F500
k-3.
1 1
Shoa
ls C
reek
50
0 D
ry C
reek
Pi
edm
ont S
E 03
1501
0606
01
TNF5
22-0
.5
1 Sh
oals
Cre
ek
522
Trib
. Sho
al C
reek
C
hocc
oloc
co
0315
0106
0602
TN
F522
-1.5
1
Shoa
ls C
reek
53
1 Tr
ib. C
hocc
oloc
co C
reek
C
hocc
oloc
co
0315
0106
0603
TN
F529
-1.2
1
Shoa
ls C
reek
50
0 Tr
ib. W
hite
side
s Mill
s Lak
e H
eflin
03
1501
0606
02
TNF5
29-2
.6
1 Sh
oals
Cre
ek
500
Trib
. Whi
tesi
des M
ills L
ake
Cho
ccol
occo
03
1501
0606
02
TNF5
29-2
.6
2 Sh
oals
Cre
ek
500
Trib
. Whi
tesi
des M
ills L
ake
Cho
ccol
occo
03
1501
0606
02
TNF5
29-2
.9
1 Sh
oals
Cre
ek
500
Trib
. Whi
tesi
des M
ills L
ake
Cho
ccol
occo
03
1501
0606
02
TNF5
31-0
.2
1 Sh
oals
Cre
ek
548
Trib
. Hen
ry C
reek
H
eflin
03
1501
0804
04
TNF5
31-1
.1
1 Sh
oals
Cre
ek
500
Trib
. Hig
hroc
k La
ke
Hef
lin
0315
0106
0602
TN
F531
-1.5
1
Shoa
ls C
reek
50
0 Tr
ib. H
ighr
ock
Lake
H
eflin
03
1501
0606
02
TNF5
31-1
.5
2 Sh
oals
Cre
ek
500
Trib
. Hig
hroc
k La
ke
Hef
lin
0315
0106
0602
TN
F531
-1.5
3
Shoa
ls C
reek
50
0 Tr
ib. H
ighr
ock
Lake
H
eflin
03
1501
0606
02
TNF5
32-0
.9
1 Sh
oals
Cre
ek
500
Trib
. Cho
ccol
occo
Cre
ek
Pied
mon
t SE
0315
0106
0601
TN
F532
-1.0
1
Shoa
ls C
reek
50
0 Tr
ib. C
hocc
oloc
co C
reek
Pi
edm
ont S
E 03
1501
0606
01
TNF5
48-0
.2
1 Sh
oals
Cre
ek
500
Shoa
l Cre
ek
Pied
mon
t SE
0315
0106
0602
TN
F548
-0.2
2
Shoa
ls C
reek
50
0 Sh
oal C
reek
Pi
edm
ont S
E 03
1501
0606
02
TNF5
48-2
.7
1 Sh
oals
Cre
ek
531
Trib
. Sho
al C
reek
H
eflin
03
1501
0606
02
TNF5
48-2
.7
2 Sh
oals
Cre
ek
531
Trib
. Sho
al C
reek
H
eflin
03
1501
0606
02
TNF5
53-1
.9
1 Sh
oals
Cre
ek
500
Trib
. Sho
al C
reek
Pi
edm
ont S
E 03
1501
0606
02
TNF5
53c-
0.3
1 Sh
oals
Cre
ek
500
Trib
. Sho
al C
reek
Pi
edm
ont S
E 03
1501
0606
02
TNF5
58a-
0.9
1 Sh
oals
Cre
ek
570
Trib
. Nan
ces C
reek
Ja
ckso
nvill
e E
0315
0105
0905
TN
F534
r-0.
1 1
Shoa
ls C
reek
55
Tr
ib. C
hocc
oloc
co C
reek
Pi
edm
ont S
E 03
1501
0606
01
TNF6
00-0
.9
1 Sh
oals
Cre
ek
385
Trib
. Che
aha
Cre
ek
Che
aha
Mt.
0315
0106
0608
TN
F600
-1.1
1
Shoa
ls C
reek
38
5 Tr
ib. C
heah
a C
reek
C
heah
a M
t. 03
1501
0606
08
TNF5
70-0
.1
1 Sh
oals
Cre
ek
chan
ge p
avem
ent t
o gr
avel
Tr
ib. N
ance
s Cre
ek
Jack
sonv
ille
E 03
1501
0509
05
TNF4
86-0
.7
1 Ta
llade
ga
651
Trib
. Sal
t Cre
ek
Oxf
ord
0315
0106
0606
TN
F486
-1.1
1
Talla
dega
65
1 Tr
ib. S
alt C
reek
O
xfor
d 03
1501
0606
06
TNF4
86-1
.1
2 Ta
llade
ga
651
Trib
. Sal
t Cre
ek
Oxf
ord
0315
0106
0606
TN
F486
-1.5
1
Talla
dega
65
1 Tr
ib. S
alt C
reek
O
xfor
d 03
1501
0606
06
TNF4
86-1
.9
1 Ta
llade
ga
651
Trib
. Sal
t Cre
ek
Oxf
ord
0315
0106
0606
Ta
ble
cont
inue
d ne
xt p
age…

87
Site
ID
Pipe
#
Dis
trict
Ju
nctio
n R
oad
Stre
am N
ame
Qua
d 6t
h Le
vel
Wat
ersh
ed
TNF4
86-1
.9
2 Ta
llade
ga
651
Trib
. Sal
t Cre
ek
Oxf
ord
0315
0106
0606
TN
F486
-2.4
1
Talla
dega
65
1 Tr
ib. S
alt C
reek
O
xfor
d 03
1501
0606
06
TNF6
00-1
.5
1 Ta
llade
ga
385
Che
aha
Cre
ek T
rib.
Che
aha
Mt.
0315
0106
0608
TN
F643
-0.7
1
Talla
dega
65
1 Tr
ib. D
ry B
ranc
h O
xfor
d 03
1501
0606
04
TNF6
43-1
.1
1 Ta
llade
ga
651
Trib
. Dry
Bra
nch
Oxf
ord
0315
0106
0604
TN
F643
-1.3
1
Talla
dega
65
1 Tr
ib. D
ry B
ranc
h O
xfor
d 03
1501
0606
04
TNF6
51-0
.9
1 Ta
llade
ga
CR
42
Trib
. Sal
t Cre
ek
Oxf
ord
0315
0106
0606
TN
F651
-1.4
1
Talla
dega
C
R 4
2 Sa
lt C
reek
Trib
. O
xfor
d 03
1501
0606
06
TNF6
51-2
.5
1 Ta
llade
ga
CR
42
Dry
Cre
ek T
rib.
Che
aha
Mt.
0315
0106
0606
TN
F651
-3.2
1
Talla
dega
C
R 4
2 Tr
ib. C
heah
a C
reek
C
heah
a M
t. 03
1501
0606
06
TNF6
51-3
.9
1 Ta
llade
ga
CR
42
Dry
Cre
ek T
rib.
Che
aha
Mt.
0315
0106
0606

88
Table D4. Coarse filters A, B, and C, classifications for surveyed crossings on the National Forest in Alabama (Bankhead and Talladega NFs), summer 2005.
Site ID Pipe #
Filter A Filter B Filter C
BH118A-0.3 1 indeterminate impassable impassable BH160-0.9 1 indeterminate indeterminate indeterminate BH160-0.9 2 passable passable passable BH204A-1.0 1 passable impassable impassable BH204A-1.0 2 passable impassable impassable BH204A-1.0 3 passable impassable impassable BH208-4.0 1 passable passable passable BH248-0.35 1 indeterminate impassable impassable BH250-0.3 1 passable passable passable BH254-0.45 1 indeterminate impassable impassable BH254-0.45 2 indeterminate impassable impassable BH264-1.5 1 passable passable passable BH264-1.5 2 passable passable passable BH264-2.15 1 passable passable passable BH268-2.0 1 passable impassable impassable BH268-2.0 2 indeterminate impassable impassable TNF500-0.7 1 indeterminate indeterminate impassable TNF500-1.2 1 indeterminate indeterminate indeterminate TNF500-1.3 1 impassable impassable impassable TNF500-1.4 1 indeterminate impassable impassable TNF500-1.7 1 indeterminate impassable impassable TNF500-11.2 1 indeterminate indeterminate impassable TNF500-2.2 1 passable passable impassable TNF500-2.3 1 passable impassable impassable TNF500-5.6 1 passable impassable impassable TNF500-5.8 1 passable passable passable TNF500-6.5 1 indeterminate indeterminate impassable TNF500-6.5 2 indeterminate indeterminate impassable TNF500-6.5 3 indeterminate indeterminate impassable TNF500-6.8 1 passable passable passable TNF500-6.8 2 passable indeterminate indeterminate TNF500-6.8 3 passable passable passable TNF500-8.2 1 passable impassable impassable TNF500-8.2 2 indeterminate impassable impassable TNF500k-3.1 1 indeterminate impassable impassable TNF522-0.5 1 indeterminate impassable impassable TNF522-1.5 1 indeterminate impassable impassable TNF529-1.2 1 passable passable impassable TNF529-2.6 1 indeterminate impassable impassable TNF529-2.6 2 indeterminate impassable impassable TNF529-2.9 1 indeterminate impassable impassable TNF531-0.2 1 indeterminate indeterminate impassable TNF531-1.1 1 indeterminate indeterminate impassable TNF531-1.5 1 indeterminate indeterminate impassable TNF531-1.5 2 passable passable passable Table continued next page…

89
Site ID Pipe #
Filter A Filter B Filter C
TNF531-1.5 2 passable passable passable TNF531-1.5 3 passable passable passable TNF532-0.9 1 indeterminate indeterminate indeterminate TNF532-1.0 1 indeterminate impassable impassable TNF548-0.2 1 indeterminate impassable impassable TNF548-0.2 2 passable impassable impassable TNF548-2.7 1 indeterminate impassable impassable TNF548-2.7 2 indeterminate impassable impassable TNF553-1.9 1 indeterminate impassable impassable TNF553c-0.3 1 indeterminate impassable impassable TNF558a-0.9 1 indeterminate indeterminate impassable TNF534r-0.1 1 indeterminate impassable impassable TNF600-0.9 1 indeterminate indeterminate impassable TNF600-1.1 1 passable passable passable TNF570-0.1 1 impassable impassable impassable TNF486-0.7 1 indeterminate indeterminate indeterminate TNF486-1.1 1 passable impassable impassable TNF486-1.1 2 passable impassable impassable TNF486-1.5 1 passable indeterminate impassable TNF486-1.9 1 passable impassable impassable TNF486-1.9 2 indeterminate impassable impassable TNF486-2.4 1 impassable impassable impassable TNF600-1.5 1 passable impassable impassable TNF643-0.7 1 indeterminate impassable impassable TNF643-1.1 1 indeterminate indeterminate impassable TNF643-1.3 1 impassable impassable impassable TNF651-0.9 1 indeterminate impassable impassable TNF651-1.4 1 indeterminate impassable impassable TNF651-2.5 1 indeterminate impassable impassable TNF651-3.2 1 passable passable passable TNF651-3.9 1 indeterminate indeterminate impassable

90
Tabl
e D
5. D
escr
iptio
n of
cro
ssin
gs su
rvey
ed o
n th
e N
atio
nal F
ores
ts in
Ala
bam
a (B
ankh
ead
and
Talla
dega
NFs
) sum
mer
200
5. S
hape
ab
brev
iatio
ns: C
= ci
rcul
ar, P
A=
pipe
arc
h, O
BA
= op
en b
otto
m a
rch,
and
F=
ford
. C
hann
el w
idth
is th
e m
ean
bank
full
chan
nel w
idth
. N
= no
na
tura
l sub
stra
te, N
(dis
cont
in)=
dis
cont
inuo
us su
bstra
te, Y
= co
ntin
uous
nat
ural
subs
trate
. A
n N
A (n
ot a
pplic
able
) ind
icat
es o
utle
t dro
p (n
o ou
tlet
pool
or t
ailw
ater
con
trol)
or o
utle
t per
ch (s
tream
dry
) cou
ld n
ot b
e ca
lcul
ated
. N
egat
ive
outle
t dro
p or
per
ch v
alue
s ind
icat
e a
subm
erge
d ou
tlet
(stru
ctur
e pa
rtial
ly b
ackw
ater
ed).
Res
idua
l inl
et d
epth
val
ues ≥
0.0
indi
cate
the
stru
ctur
e is
fully
bac
kwat
ered
. Si
te ID
Pi
pe
# Sh
ape
Pipe
C
ondi
tion
Mea
n C
hann
el
Wid
th
(ft)
Con
tinuo
us
Subs
trate
in
Stru
ctur
e
Pipe
sl
ope
(%)
Pipe
Wid
th:
Cha
nnel
W
idth
ratio
Out
let
Dro
p (in
)
Out
let
Perc
h (in
)
Res
idua
l In
let
Dep
th (i
n)
Pipe
Le
ngth
(f
t)
Slop
e (%
) *
Leng
th
(ft)
BH
118A
-0.3
1
C
fair
6.0
N
0.93
0.
92
17.7
6 12
.96
0.00
80
.0
74.0
B
H16
0-0.
9 1
PA
fair
23.7
N
3.
02
0.30
-9
.36
6.36
0.
00
28.5
86
.0
BH
160-
0.9
2 PA
fa
ir 23
.7
N
0.72
0.
27
-2.5
2 13
.20
5.16
30
.4
22.0
B
H20
4A-1
.0
1 PA
go
od
15.6
N
1.
00
0.45
16
.08
7.08
0.
00
33.0
33
.0
BH
204A
-1.0
2
PA
good
15
.6
N
0.79
0.
45
16.3
2 7.
32
0.00
33
.0
26.0
B
H20
4A-1
.0
3 PA
go
od
15.6
N
0.
73
0.45
16
.44
7.44
0.
00
33.0
24
.0
BH
208-
4.0
1 O
BA
go
od
5.9
Y
0.00
1.
35
4.20
-1
.20
0.00
21
.0
0.0
BH
248-
0.35
1
C
fair
4.2
N
2.93
0.
94
14.4
0 13
.80
0.00
41
.0
120.
0 B
H25
0-0.
3 1
C
good
3.
5 Y
5.
20
1.16
3.
60
-6.6
0 0.
00
63.5
33
0.0
BH
254-
0.45
1
C
poor
8.
8 N
1.
88
0.51
18
.00
12.6
0 0.
00
32.0
60
.0
BH
254-
0.45
2
C
poor
8.
8 N
2.
50
0.51
16
.80
11.4
0 0.
00
32.0
80
.0
BH
264-
1.5
1 C
go
od
17.1
N
1.
33
0.20
-1
4.28
-2
2.20
19
.08
30.0
40
.0
BH
264-
1.5
2 C
go
od
17.1
N
0.
47
0.20
-8
.40
-16.
32
10.0
8 30
.0
14.0
B
H26
4-2.
15
1 PA
po
or
16.7
N
3.
00
0.35
N
A
-24.
00
0.96
21
.0
63.0
B
H26
8-2.
0 1
PA
fair
4.6
N
1.13
1.
17
16.6
8 8.
88
0.00
32
.0
36.0
B
H26
8-2.
0 2
PA
fair
4.6
N
1.91
1.
17
17.7
6 9.
96
0.00
27
.0
51.5
TN
F500
-0.7
1
C
fair
6.2
N
1.88
0.
73
4.20
2.
88
0.00
66
.5
125.
0 TN
F500
-1.2
1
C
good
7.
8 N
1.
94
0.38
2.
16
0.60
0.
00
35.0
68
.0
TNF5
00-1
.3
1 C
fa
ir 4.
5 N
0.
88
1.01
25
.44
21.8
4 0.
00
81.4
72
.0
TNF5
00-1
.4
1 C
fa
ir 5.
3 N
1.
24
0.79
13
.92
6.12
0.
00
80.9
10
0.0
TNF5
00-1
.7
1 C
fa
ir 4.
3 N
2.
12
1.15
3.
00
4.08
0.
00
112.
8 23
9.0
TNF5
00-1
1.2
1 C
fa
ir 4.
5 N
1.
94
0.55
4.
68
1.68
0.
00
33.0
64
.0
Tabl
e co
ntin
ued
next
pag
e…

91
Site
ID
Pipe
#
Shap
e Pi
pe
Con
ditio
n M
ean
Cha
nnel
W
idth
(f
t)
Con
tinuo
us
Subs
trate
in
Stru
ctur
e
Pipe
sl
ope
(%)
Pipe
Wid
th:
Cha
nnel
W
idth
ratio
Out
let
Dro
p (in
)
Out
let
Perc
h (in
)
Res
idua
l In
let
Dep
th (i
n)
Pipe
Le
ngth
(f
t)
Slop
e (%
) *
Leng
th
(ft)
TNF5
00-2
.2
1 B
ex
celle
nt
14.2
N
0.
02
0.35
6.
66
-0.5
4 0.
00
24.0
0.
5 TN
F500
-2.3
1
C
good
5.
7 N
0.
64
0.71
15
.36
26.0
4 0.
00
73.0
47
.0
TNF5
00-5
.6
1 B
go
od
11.1
N
0.
19
0.90
12
.48
9.12
0.
00
31.7
6.
0 TN
F500
-5.8
1
B
good
11
.8
N
1.45
0.
68
-13.
20
-16.
44
9.72
20
.0
29.0
TN
F500
-6.5
1
C
good
6.
3 N
2.
03
0.40
5.
04
1.68
0.
00
39.0
79
.0
TNF5
00-6
.5
2 C
go
od
6.3
N
3.31
0.
40
5.88
2.
52
0.00
39
.0
129.
0 TN
F500
-6.5
3
C
good
6.
3 N
2.
85
0.40
5.
04
1.68
0.
00
39.0
11
1.0
TNF5
00-6
.8
1 PA
fa
ir 13
.7
Y
0.08
0.
40
NA
-2
.64
0.00
26
.4
2.0
TNF5
00-6
.8
2 PA
fa
ir 13
.7
N (d
isco
ntin
) 1.
33
0.40
N
A
-4.4
4 0.
00
26.4
35
.0
TNF5
00-6
.8
3 PA
fa
ir 13
.7
Y
0.30
0.
40
NA
2.
64
0.00
26
.4
8.0
TNF5
00-8
.2
1 C
po
or
7.4
N
0.81
0.
34
17.2
8 15
.36
0.00
37
.0
30.0
TN
F500
-8.2
2
C
poor
7.
4 N
1.
82
0.34
14
.40
12.4
8 0.
00
37.0
67
.5.
TNF5
00k-
3.1
1 C
go
od
9.6
N
5.59
0.
73
13.2
0 11
.52
0.00
34
.0
190.
0 TN
F522
-0.5
1
C
poor
6.
1 N
(dis
cont
in)
3.59
0.
41
-3.1
2 -4
.38
0.00
57
.0
204.
5 TN
F522
-1.5
1
C
good
5.
5 N
3.
74
0.73
13
.20
10.3
2 0.
00
49.6
18
5.5
TNF5
29-1
.2
1 B
go
od
12.5
N
0.
40
0.80
5.
64
0.48
0.
00
16.3
6.
5 TN
F529
-2.6
1
C
good
14
.4
N (d
isco
ntin
) 1.
45
0.38
18
.48
13.0
8 0.
00
48.2
70
.0
TNF5
29-2
.6
2 C
go
od
14.4
N
1.
36
0.38
18
.66
13.2
6 0.
00
48.2
65
.5
TNF5
29-2
.9
1 C
go
od
8.0
N
2.05
0.
63
12.8
4 10
.08
0.00
48
.3
99.0
TN
F531
-0.2
1
PA
good
8.
3 N
1.
63
0.67
7.
68
-1.2
0 0.
00
41.0
67
.0
TNF5
31-1
.1
1 PA
fa
ir 11
.7
N
0.92
0.
47
9.96
7.
08
0.00
14
7.5
136.
0 TN
F531
-1.5
1
VF
good
28
.3
N
2.81
0.
18
-2.8
8 -2
3.52
0.
00
60.1
16
9.0
TNF5
31-1
.5
2 V
F go
od
28.3
Y
0.
35
0.18
-6
.84
-27.
48
4.32
60
.1
21.0
TN
F531
-1.5
3
VF
good
28
.3
N
0.62
0.
18
-5.5
2 -2
6.16
9.
96
60.1
37
.0
TNF5
32-0
.9
1 PA
go
od
8.5
N
2.74
0.
59
3.24
0.
72
0.00
31
.7
87.0
Ta
ble
cont
inue
d ne
xt p
age…

92
Site
ID
Pipe
#
Shap
e Pi
pe
Con
ditio
n M
ean
Cha
nnel
W
idth
(f
t)
Con
tinuo
us
Subs
trate
in
Stru
ctur
e
Pipe
sl
ope
(%)
Pipe
Wid
th:
Cha
nnel
W
idth
ratio
Out
let
Dro
p (in
)
Out
let
Perc
h (in
)
Res
idua
l In
let
Dep
th (i
n)
Pipe
Le
ngth
(f
t)
Slop
e (%
) *
Leng
th
(ft)
TNF5
32-1
.0
1 C
go
od
5.6
N
3.92
0.
53
3.72
0.
96
0.00
31
.1
122.
0 TN
F548
-0.2
1
PA
fair
10.8
N
2.
17
0.56
11
.16
3.36
0.
00
35.0
76
.0
TNF5
48-0
.2
2 PA
fa
ir 10
.8
N
0.60
0.
56
17.1
6 9.
36
0.00
35
.0
21.0
TN
F548
-2.7
1
PA
good
10
.3
N
3.60
0.
53
0.36
-3
.72
0.00
53
.0
191.
0 TN
F548
-2.7
2
PA
good
10
.3
N
1.19
0.
53
19.0
8 15
.00
0.00
53
.0
63.0
TN
F553
-1.9
1
B
fair
16.7
N
2.
67
0.60
14
.88
10.6
8 0.
00
30.7
82
.0
TNF5
53c-
0.3
1 C
fa
ir 6.
6 N
4.
81
0.38
-3
.60
-5.9
4 0.
00
32.2
15
5.0
TNF5
58a-
0.9
1 C
po
or
7.1
N
2.85
0.
56
6.60
4.
56
0.00
65
.0
185.
0 TN
F534
r-0.
1 1
C
poor
7.
8 N
6.
06
0.64
-2
.76
-6.2
4 0.
00
39.8
24
1.0
TNF6
00-0
.9
1 B
go
od
10.7
N
2.
62
0.56
7.
08
15.0
0 0.
00
24.0
63
.0
TNF6
00-1
.1
1 B
go
od
7.1
Y
1.00
0.
85
-0.6
0 -0
.72
0.00
8.
0 8.
0 TN
F570
-0.1
1
PA
good
7.
9 N
1.
49
0.38
27
.66
25.0
2 0.
00
30.5
45
.5
TNF4
86-0
.7
1 C
go
od
6.0
N
3.16
0.
33
3.60
0.
12
0.00
25
.0
79.0
TN
F486
-1.1
1
C
poor
4.
5 N
1.
71
0.44
21
.60
6.24
0.
00
24.5
42
.0
TNF4
86-1
.1
2 C
po
or
4.5
N
2.02
0.
44
19.6
8 4.
32
0.00
24
.5
49.5
TN
F486
-1.5
1
C
fair
6.8
N (d
isco
ntin
) 1.
63
0.29
9.
24
NA
0.
00
24.5
40
.0
TNF4
86-1
.9
1 C
go
od
7.4
N
0.40
0.
34
18.7
2 17
.52
0.00
24
.7
10.0
TN
F486
-1.9
2
C
good
7.
4 N
3.
28
0.34
14
.76
13.5
6 0.
00
24.7
81
.0
TNF4
86-2
.4
1 C
fa
ir 4.
3 N
7.
14
0.59
-4
.32
-4.9
2 0.
00
21.0
15
0.0
TNF6
00-1
.5
1 B
go
od
7.1
N
1.88
0.
56
14.4
0 11
.76
0.00
24
.0
45.0
TN
F643
-0.7
1
PA
poor
9.
1 N
3.
39
0.64
15
.18
14.2
8 0.
00
60.5
20
5.0
TNF6
43-1
.1
1 B
go
od
13.9
N
0.
88
0.43
8.
28
4.92
0.
00
56.8
50
.0
TNF6
43-1
.3
1 B
go
od
14.7
N
7.
17
0.54
-9
.96
-10.
92
0.00
29
.0
208.
0 TN
F651
-0.9
1
C
good
5.
5 N
3.
64
0.73
3.
12
0.00
0.
00
42.0
15
3.0
TNF6
51-1
.4
1 PA
po
or
14.0
N
2.
75
0.64
10
.32
5.04
0.
00
48.3
13
3.0
Tabl
e co
ntin
ued
next
pag
e…

93
Site
ID
Pipe
#
Shap
e Pi
pe
Con
ditio
n M
ean
Cha
nnel
W
idth
(f
t)
Con
tinuo
us
Subs
trate
in
Stru
ctur
e
Pipe
sl
ope
(%)
Pipe
Wid
th:
Cha
nnel
W
idth
ratio
Out
let
Dro
p (in
)
Out
let
Perc
h (in
)
Res
idua
l In
let
Dep
th (i
n)
Pipe
Le
ngth
(f
t)
Slop
e (%
) *
Leng
th
(ft)
TNF6
51-2
.5
1 C
go
od
7.2
N
5.68
0.
56
15.2
4 12
.6
0.00
37
.0
210.
0 TN
F651
-3.2
1
OB
A
good
22
.8
Y
4.15
0.
47
-3.2
4 -8
.76
0.00
10
8.7
451.
0 TN
F651
-3.9
1
C
good
3.
9 N
(dis
cont
in)
2.62
0.
52
8.40
6.
36
0.00
24
.0
63.0