curbing global sugar consumption - effective food policy actions to help promote healthy diets &...
TRANSCRIPT
Curbing global sugar consumptionEffective food policy actions to help promote healthy diets & tackle obesity
In this brief, we provide a guide to available policies that can assist countries in reducing the amount of sugar consumed at a population level to meet the World Health Organization’s sugar guideline.
We illustrate the available policies, provide examples that have worked and include input from those involved in the development and implementation of these policies.
u Globally, the number of people overweight or obese has reached epidemic proportions
fuelling the growing rates of non-communicable diseases, including at least ten cancers.
Excessive sugar consumption is one factor promoting overweight and obesity.
u Sugar is widely available and cheap. Over the last decade, global sugar consumption has
grown from about 130 to 178 million tonnes.
u The World Health Organization’s (WHO) sugar guideline, issued in March 2015, recommends
that adults and children restrict their sugar intake to less than 10% of total energy intake per
day, which is the equivalent of around 12.5 teaspoons of sugar for adults, and suggests a
further reduction to below 5% of total energy intake per day.
u Effective, feasible policy actions are available for governments to reduce the availability and
affordability of sugar and sugary products, influence the acceptability of alternatives and
raise awareness about the sugar contained in products in an effort to move towards meeting
the WHO sugar guideline.
u Examples of actions which have had these effects include school nutrition standards in
Queensland, Australia; a vending machine ban in France; a front-of-package symbol that led
to product reformulation in the Netherlands; soda taxes in France and Mexico; a programme
targeting retail environments in New York City, USA; a programme promoting increased water
consumption in schools in Hungary; school fruit and vegetable programmes in Netherlands
and Norway; a healthy marketing campaign in Los Angeles County, USA and a comprehensive
nutrition and health programme in France.
u Experience from officials implementing these policies and pilot programmes provides
important insights for governments to help them design more effective policies to reduce
sugar intake in the context of broader dietary improvements. Insights include the need for
measurable indicators of change; engagement, incentives, and/or clear standards for entities
involved in the manufacture and delivery of food; actions to inform stakeholders about the
broader benefits of reduced sugar consumption; clear and understandable messages for
consumers, and synergistic, complementary actions.
u A comprehensive approach is needed to reduce sugar consumption at a population level. Our
NOURISHING framework can be used to identify the ten areas where policy action is needed.
u Part of this comprehensive approach should be dialogue with stakeholders in the sugar
supply chain to identify what ‘upstream’ actions can be taken to reduce the supply and
demand for sugar, taking into consideration the economic impact of such actions.
Overview
1
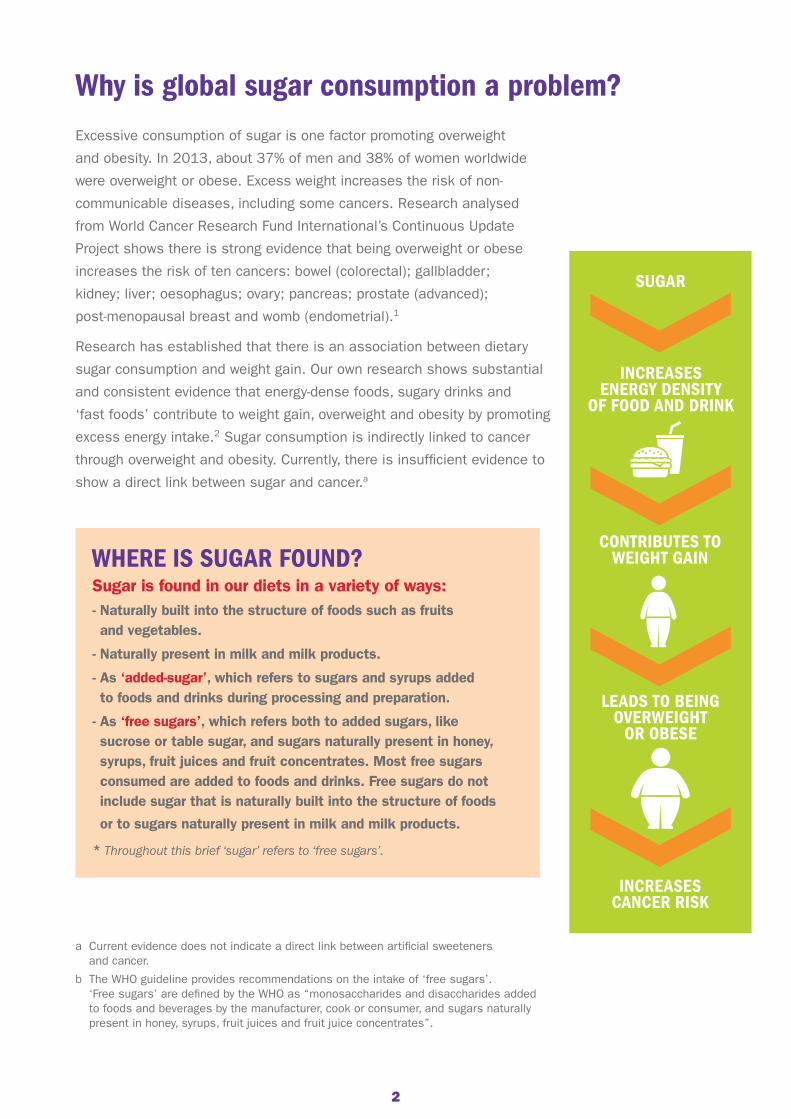
Excessive consumption of sugar is one factor promoting overweight
and obesity. In 2013, about 37% of men and 38% of women worldwide
were overweight or obese. Excess weight increases the risk of non-
communicable diseases, including some cancers. Research analysed
from World Cancer Research Fund International’s Continuous Update
Project shows there is strong evidence that being overweight or obese
increases the risk of ten cancers: bowel (colorectal); gallbladder;
kidney; liver; oesophagus; ovary; pancreas; prostate (advanced);
post-menopausal breast and womb (endometrial).1
Research has established that there is an association between dietary
sugar consumption and weight gain. Our own research shows substantial
and consistent evidence that energy-dense foods, sugary drinks and
‘fast foods’ contribute to weight gain, overweight and obesity by promoting
excess energy intake.2 Sugar consumption is indirectly linked to cancer
through overweight and obesity. Currently, there is insufficient evidence to
show a direct link between sugar and cancer.a
WHERE IS SUGAR FOUND?Sugar is found in our diets in a variety of ways:- Naturally built into the structure of foods such as fruits and vegetables.
- Naturally present in milk and milk products.
- As ‘added-sugar’, which refers to sugars and syrups added to foods and drinks during processing and preparation.
- As ‘free sugars’, which refers both to added sugars, like sucrose or table sugar, and sugars naturally present in honey, syrups, fruit juices and fruit concentrates. Most free sugars consumed are added to foods and drinks. Free sugars do not include sugar that is naturally built into the structure of foods
or to sugars naturally present in milk and milk products.
* Throughout this brief ‘sugar’ refers to ‘free sugars’.
2
a Current evidence does not indicate a direct link between artificial sweeteners and cancer.
b The WHO guideline provides recommendations on the intake of ‘free sugars’. ‘Free sugars’ are defined by the WHO as “monosaccharides and disaccharides added to foods and beverages by the manufacturer, cook or consumer, and sugars naturally present in honey, syrups, fruit juices and fruit juice concentrates”.
Why is global sugar consumption a problem?
INCREASES ENERGY DENSITY
OF FOOD AND DRINK
CONTRIBUTES TO WEIGHT GAIN
LEADS TO BEING OVERWEIGHT
OR OBESE
INCREASES CANCER RISK
SUGAR
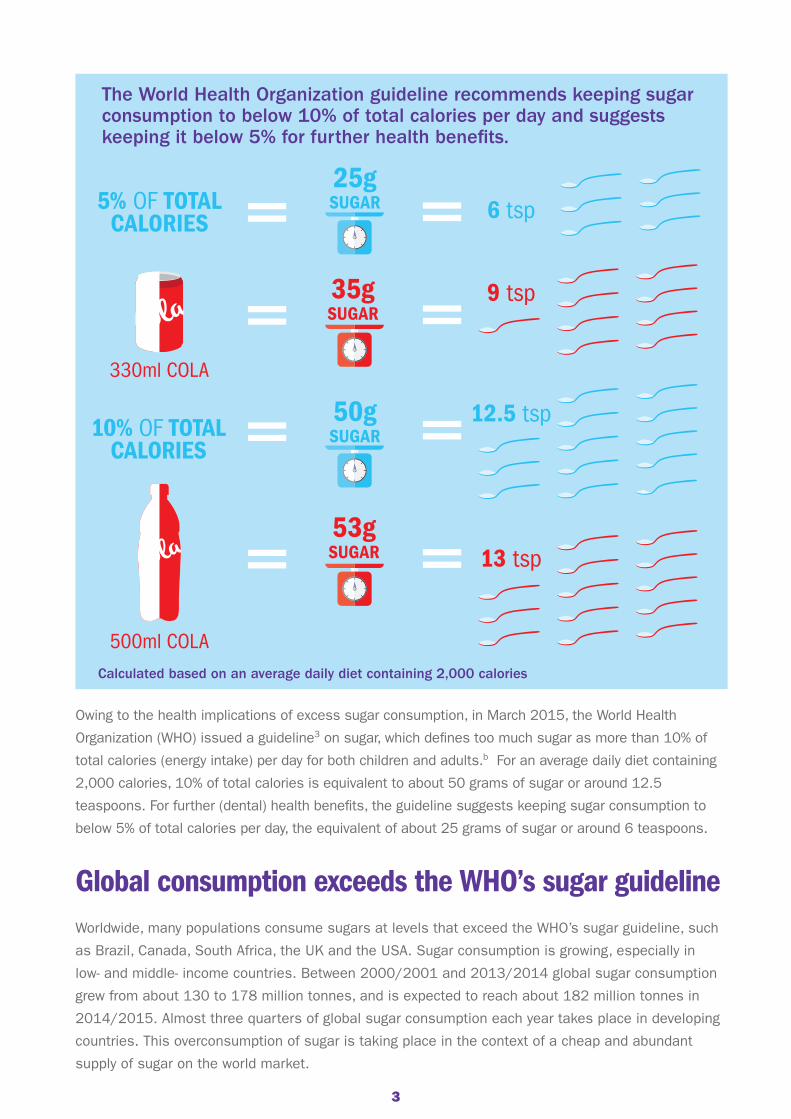
Owing to the health implications of excess sugar consumption, in March 2015, the World Health
Organization (WHO) issued a guideline3 on sugar, which defines too much sugar as more than 10% of
total calories (energy intake) per day for both children and adults.b For an average daily diet containing
2,000 calories, 10% of total calories is equivalent to about 50 grams of sugar or around 12.5
teaspoons. For further (dental) health benefits, the guideline suggests keeping sugar consumption to
below 5% of total calories per day, the equivalent of about 25 grams of sugar or around 6 teaspoons.
Global consumption exceeds the WHO’s sugar guidelineWorldwide, many populations consume sugars at levels that exceed the WHO’s sugar guideline, such
as Brazil, Canada, South Africa, the UK and the USA. Sugar consumption is growing, especially in
low- and middle- income countries. Between 2000/2001 and 2013/2014 global sugar consumption
grew from about 130 to 178 million tonnes, and is expected to reach about 182 million tonnes in
2014/2015. Almost three quarters of global sugar consumption each year takes place in developing
countries. This overconsumption of sugar is taking place in the context of a cheap and abundant
supply of sugar on the world market.
3
The World Health Organization guideline recommends keeping sugar consumption to below 10% of total calories per day and suggests keeping it below 5% for further health benefits.
Calculated based on an average daily diet containing 2,000 calories
5% OF TOTAL CALORIES
13 tsp
12.5 tsp
6 tsp
9 tsp
330ml COLA
10% OF TOTAL CALORIES
50g SUGAR
500ml COLA
25g SUGAR
53g SUGAR
35g SUGAR
MAIN SUGAR PRODUCING COUNTRIES
0
5000
10000
15000
20000
25000
30000
35000
40000
21%
BRAZ
IL
INDI
A EU
CHIN
A
THAI
LAND U
S
MEX
ICO
PAKI
STAN
AUST
RALI
A
SUGAR PRODUCED SUGAR EXPORTED
SUG
AR (
1,00
0 TO
NNES
)
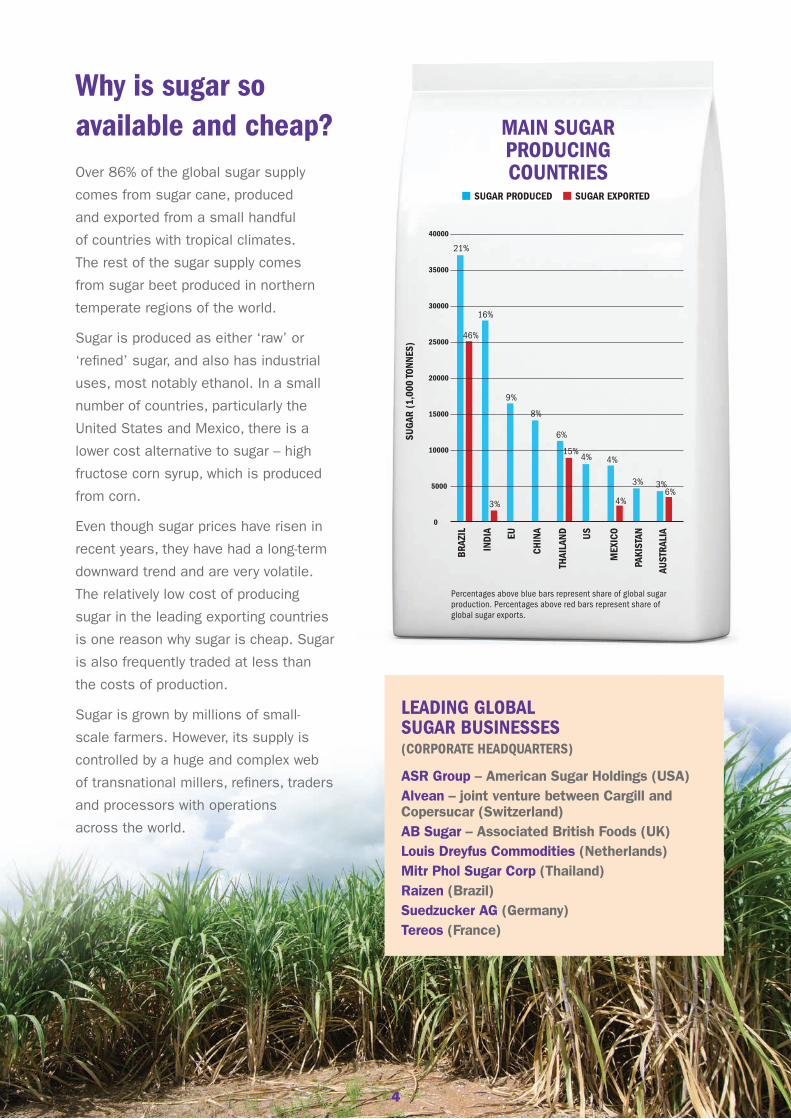
Why is sugar so available and cheap?Over 86% of the global sugar supply
comes from sugar cane, produced
and exported from a small handful
of countries with tropical climates.
The rest of the sugar supply comes
from sugar beet produced in northern
temperate regions of the world.
Sugar is produced as either ‘raw’ or
‘refined’ sugar, and also has industrial
uses, most notably ethanol. In a small
number of countries, particularly the
United States and Mexico, there is a
lower cost alternative to sugar – high
fructose corn syrup, which is produced
from corn.
Even though sugar prices have risen in
recent years, they have had a long-term
downward trend and are very volatile.
The relatively low cost of producing
sugar in the leading exporting countries
is one reason why sugar is cheap. Sugar
is also frequently traded at less than
the costs of production.
Sugar is grown by millions of small-
scale farmers. However, its supply is
controlled by a huge and complex web
of transnational millers, refiners, traders
and processors with operations
across the world.
LEADING GLOBAL SUGAR BUSINESSES (CORPORATE HEADQUARTERS)
ASR Group – American Sugar Holdings (USA)Alvean – joint venture between Cargill and Copersucar (Switzerland)AB Sugar – Associated British Foods (UK)Louis Dreyfus Commodities (Netherlands)Mitr Phol Sugar Corp (Thailand)Raizen (Brazil) Suedzucker AG (Germany)Tereos (France)
4
46%
16%
9%
3%
8%
6%
15%4% 4%
4%
3% 3%6%
Percentages above blue bars represent share of global sugar production. Percentages above red bars represent share of global sugar exports.
How can policies influence sugar consumption?World Cancer Research Fund International’s NOURISHING framework on Page 6 shows that a
comprehensive set of policies is necessary to reduce sugar consumption. Action is needed across
all three policy domains outlined in NOURISHING: food environment, food system and behaviour
change communication, as each plays an important role in influencing what we eat.
Policies to address sugar consumption should be implemented in consideration of the many dietary
factors that influence health. Failure to embed sugar policy in the context of improving the total diet
introduces the risk that the policies will be inefficient or ineffective, or have unintended adverse
effects from a broader health perspective: for example, if reducing the sugar content of processed
foods is compensated for by an increase of fat.
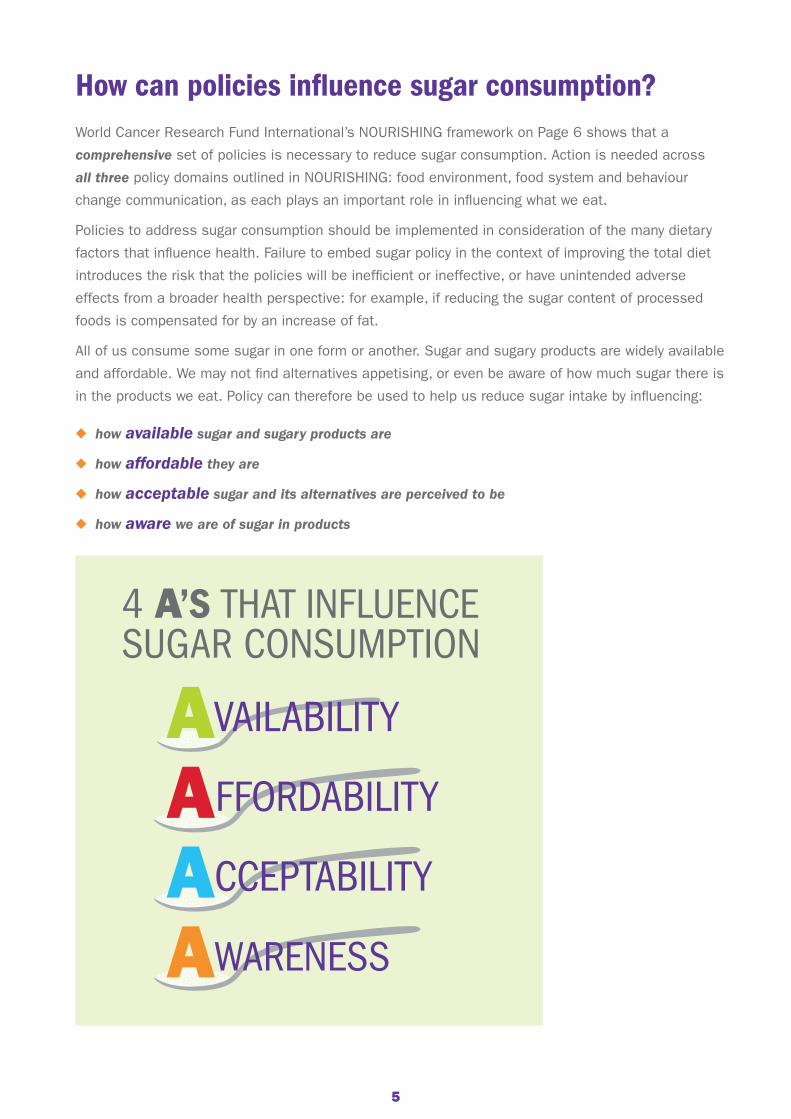
All of us consume some sugar in one form or another. Sugar and sugary products are widely available
and affordable. We may not find alternatives appetising, or even be aware of how much sugar there is
in the products we eat. Policy can therefore be used to help us reduce sugar intake by influencing:
u how available sugar and sugary products are
u how affordable they are
u how acceptable sugar and its alternatives are perceived to be
u how aware we are of sugar in products
4 A’S THAT INFLUENCE SUGAR CONSUMPTION
AVAILABILITY
AFFORDABILITY
ACCEPTABILITY AWARENESS
5
What policies are available?There is a wide range of policies available to reduce the availability and affordability of sugar and
sugary products, increase the acceptability of alternatives and make us more aware of sugar in our
foods. Some examples are shown in Table 1.
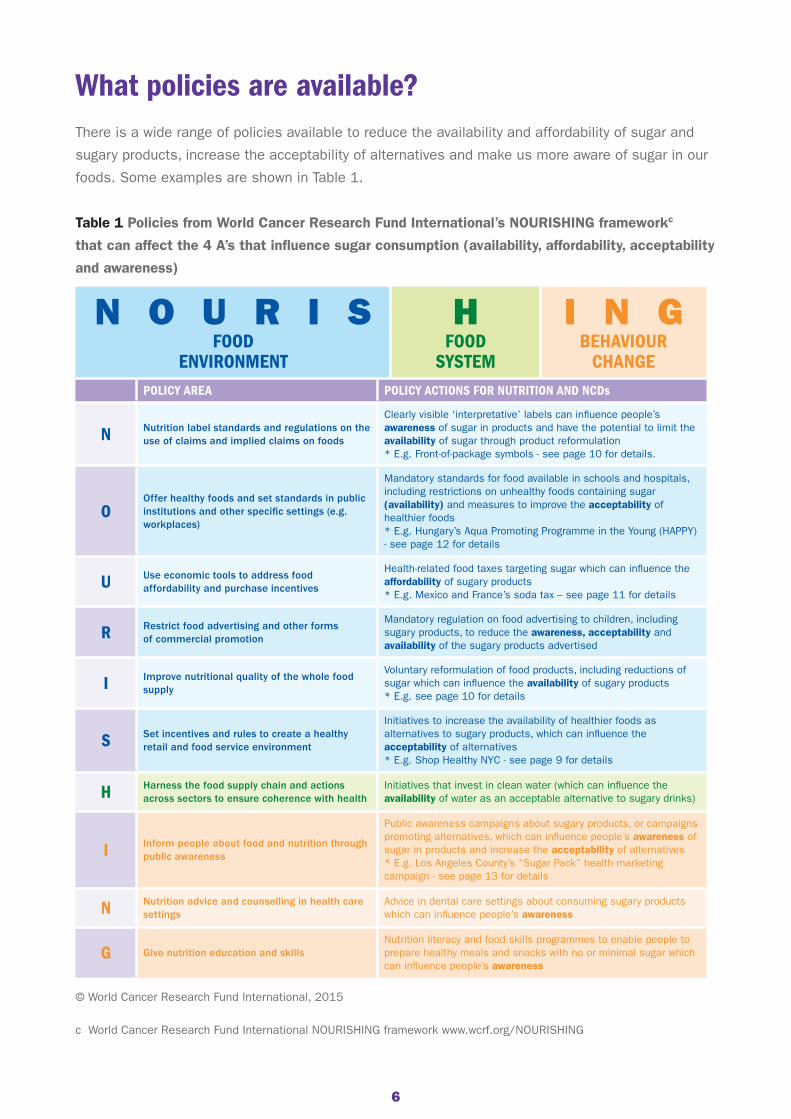
Table 1 Policies from World Cancer Research Fund International’s NOURISHING frameworkc
that can affect the 4 A’s that influence sugar consumption (availability, affordability, acceptability
and awareness)
6
© World Cancer Research Fund International, 2015
N O U R I SFOOD
ENVIRONMENT
HFOOD
SYSTEM
I N GBEHAVIOUR
CHANGEPOLICY AREA POLICY ACTIONS FOR NUTRITION AND NCDs
N Nutrition label standards and regulations on the use of claims and implied claims on foods
Clearly visible ‘interpretative’ labels can influence people’s awareness of sugar in products and have the potential to limit the availability of sugar through product reformulation* E.g. Front-of-package symbols - see page 10 for details.
OOffer healthy foods and set standards in public institutions and other specific settings (e.g. workplaces)
Mandatory standards for food available in schools and hospitals, including restrictions on unhealthy foods containing sugar (availability) and measures to improve the acceptability of healthier foods * E.g. Hungary’s Aqua Promoting Programme in the Young (HAPPY) - see page 12 for details
U Use economic tools to address food affordability and purchase incentives
Health-related food taxes targeting sugar which can influence the affordability of sugary products* E.g. Mexico and France’s soda tax – see page 11 for details
R Restrict food advertising and other forms of commercial promotion
Mandatory regulation on food advertising to children, including sugary products, to reduce the awareness, acceptability and availability of the sugary products advertised
I Improve nutritional quality of the whole food supply
Voluntary reformulation of food products, including reductions of sugar which can influence the availability of sugary products* E.g. see page 10 for details
S Set incentives and rules to create a healthy retail and food service environment
Initiatives to increase the availability of healthier foods as alternatives to sugary products, which can influence the acceptability of alternatives* E.g. Shop Healthy NYC - see page 9 for details
H Harness the food supply chain and actions across sectors to ensure coherence with health
Initiatives that invest in clean water (which can influence the availability of water as an acceptable alternative to sugary drinks)
I Inform people about food and nutrition through public awareness
Public awareness campaigns about sugary products, or campaigns promoting alternatives, which can influence people’s awareness of sugar in products and increase the acceptability of alternatives* E.g. Los Angeles County’s “Sugar Pack” health marketing campaign - see page 13 for details
N Nutrition advice and counselling in health care settings
Advice in dental care settings about consuming sugary products which can influence people’s awareness
G Give nutrition education and skillsNutrition literacy and food skills programmes to enable people to prepare healthy meals and snacks with no or minimal sugar which can influence people’s awareness
c World Cancer Research Fund International NOURISHING framework www.wcrf.org/NOURISHING
Which policies have worked? Our NOURISHING policy database shows that countries around the world have implemented actions
from across the NOURISHING framework to promote healthier diets. Evidence is available from
several of these actions to show there are ways to effectively reduce the availability and affordability
of sugary products; increase the acceptability of alternatives and increase the awareness of sugar in
products. We identified the evidence through a four-step process (see Method Box).
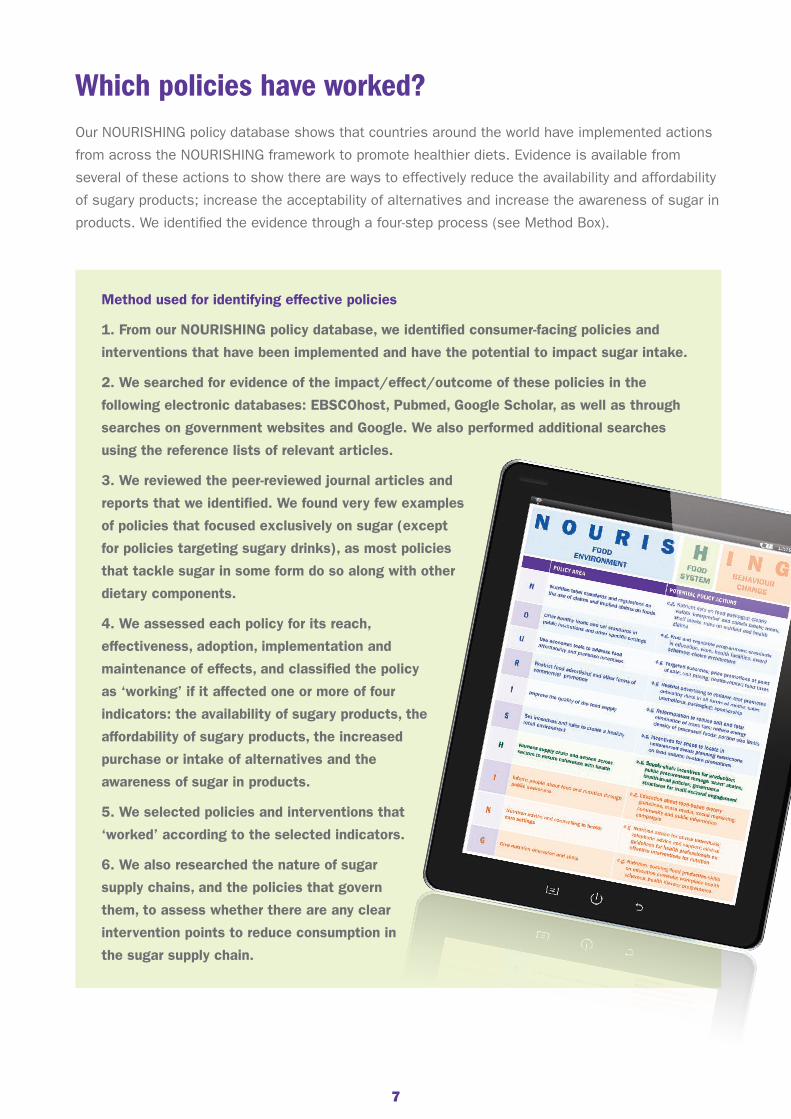
Method used for identifying effective policies
1. From our NOURISHING policy database, we identified consumer-facing policies and
interventions that have been implemented and have the potential to impact sugar intake.
2. We searched for evidence of the impact/effect/outcome of these policies in the
following electronic databases: EBSCOhost, Pubmed, Google Scholar, as well as through
searches on government websites and Google. We also performed additional searches
using the reference lists of relevant articles.
3. We reviewed the peer-reviewed journal articles and
reports that we identified. We found very few examples
of policies that focused exclusively on sugar (except
for policies targeting sugary drinks), as most policies
that tackle sugar in some form do so along with other
dietary components.
4. We assessed each policy for its reach,
effectiveness, adoption, implementation and
maintenance of effects, and classified the policy
as ‘working’ if it affected one or more of four
indicators: the availability of sugary products, the
affordability of sugary products, the increased
purchase or intake of alternatives and the
awareness of sugar in products.
5. We selected policies and interventions that
‘worked’ according to the selected indicators.
6. We also researched the nature of sugar
supply chains, and the policies that govern
them, to assess whether there are any clear
intervention points to reduce consumption in
the sugar supply chain.
7

Availability, affordability, acceptability & awarenessHere we describe examples of policy actions and their effects across the 4 A’s that influence sugar
consumption: availability, affordability, acceptability and awareness.
AVAILABILITY Reducing the availability of sugary products in schoolsAUSTRALIA: Queensland’s “Smart Choices – Healthy Food and Drink Supply Strategy”
Launched in 2005 and mandatory in all state schools since 2007, Smart Choices are school nutrition
standards that separate foods and drinks into three categories ‘green, amber and red,’ based on
their energy, saturated fat, sugar, sodium and fibre content. Smart Choices ensures that ‘red’ foods
and drinks (those high in saturated fat, added sugar or salt) are eliminated across the entire school
environment (e.g. tuck shops, vending machines, school events, sponsorship and advertising).
Surveys of school principals, Parents and Citizens’ Associations (‘P&Cs’ - who usually operate school
tuck shops or canteens) and tuck shop convenors six months after implementation indicated that
Smart Choices nutrition standards had been implemented in almost all tuck shops (between 96%
and 99%). 97% of tuck shop convenors reported all ‘red’ foods had been removed and 91% reported
the availability of ‘green’ foods had increased. 56% of P&Cs reported increased or unchanged tuck
shop profits. Smart Choices therefore effectively reduced the availability of ‘unhealthy foods’ on
school premises, especially sugary drinks and confectionery. Targeting drink vending machines was
particularly effective in reducing the supply of sugary drinks.
“Critical success factors of the Smart Choices strategy include that it applies to all situations
where food and drinks are supplied in the school environment, implementation is mandatory
in all 1,275 Queensland state primary and secondary schools, and the requirements are well
understood.”
“A key breakthrough in securing the education sector’s leadership in this health initiative was
the recognition that improving schools’ food supply not only helped fulfill their duty of care to the
students, but contributed positively to children’s academic performance. This was fostered by the
development of strategic partnerships and strong inter-disciplinary relationships, that promoted
evidence-informed decision making.”
Professor Amanda Lee, School of Public Health and Social Work & School of Exercise and Nutrition
Science, Queensland University of Technology
8
“
“
FRANCE: Vending machine ban
France’s 2004 Public Health Law includes a vending machine ban in schools, which has been
enforced since September 2005. Before the ban, vending machines were present on the school
premises of 89.4% of public lycées (students aged 14-17) and 39.3% of public collèges (students
aged 11-13). Comparing data from 1998 and 2006 (before and after the ban was implemented),
a significant reduction in calories (between 90-115 calories), fat, sodium and, especially, free sugar
intakes (10-12 grams) was observed during morning break after the ban came into force.
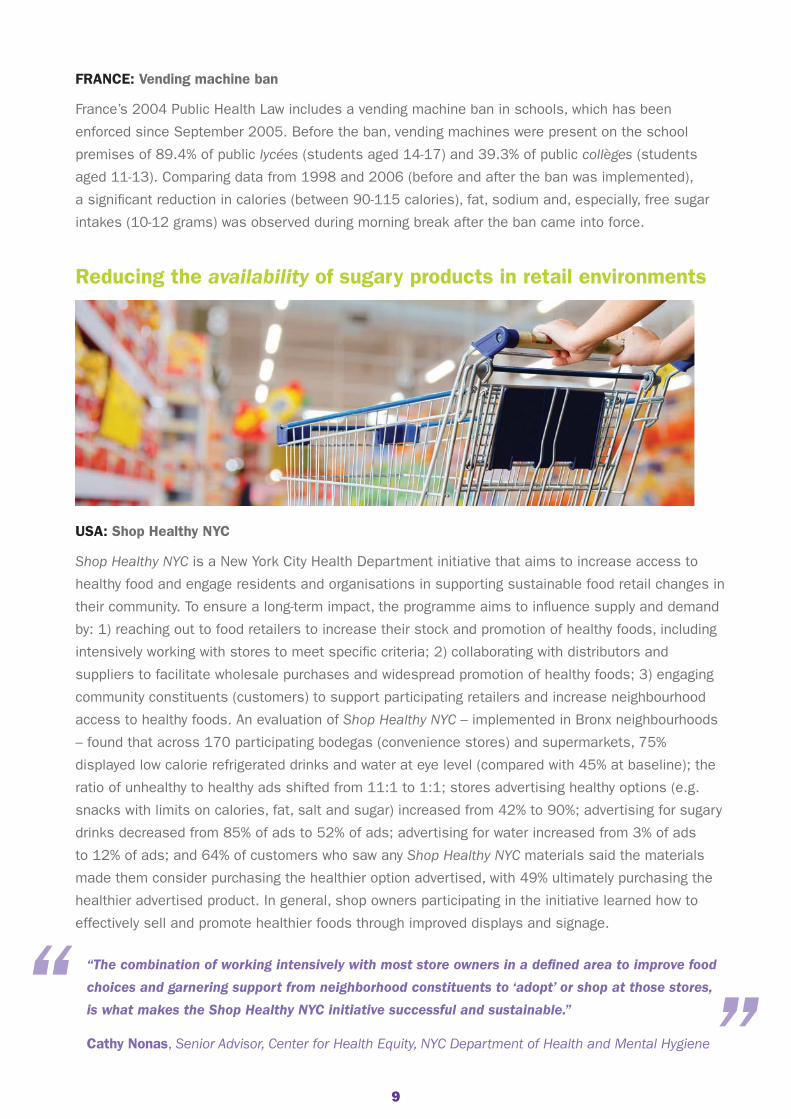
Reducing the availability of sugary products in retail environments
USA: Shop Healthy NYC
Shop Healthy NYC is a New York City Health Department initiative that aims to increase access to
healthy food and engage residents and organisations in supporting sustainable food retail changes in
their community. To ensure a long-term impact, the programme aims to influence supply and demand
by: 1) reaching out to food retailers to increase their stock and promotion of healthy foods, including
intensively working with stores to meet specific criteria; 2) collaborating with distributors and
suppliers to facilitate wholesale purchases and widespread promotion of healthy foods; 3) engaging
community constituents (customers) to support participating retailers and increase neighbourhood
access to healthy foods. An evaluation of Shop Healthy NYC – implemented in Bronx neighbourhoods
– found that across 170 participating bodegas (convenience stores) and supermarkets, 75%
displayed low calorie refrigerated drinks and water at eye level (compared with 45% at baseline); the
ratio of unhealthy to healthy ads shifted from 11:1 to 1:1; stores advertising healthy options (e.g.
snacks with limits on calories, fat, salt and sugar) increased from 42% to 90%; advertising for sugary
drinks decreased from 85% of ads to 52% of ads; advertising for water increased from 3% of ads
to 12% of ads; and 64% of customers who saw any Shop Healthy NYC materials said the materials
made them consider purchasing the healthier option advertised, with 49% ultimately purchasing the
healthier advertised product. In general, shop owners participating in the initiative learned how to
effectively sell and promote healthier foods through improved displays and signage.
“The combination of working intensively with most store owners in a defined area to improve food
choices and garnering support from neighborhood constituents to ‘adopt’ or shop at those stores,
is what makes the Shop Healthy NYC initiative successful and sustainable.”
Cathy Nonas, Senior Advisor, Center for Health Equity, NYC Department of Health and Mental Hygiene
9
“ “
10
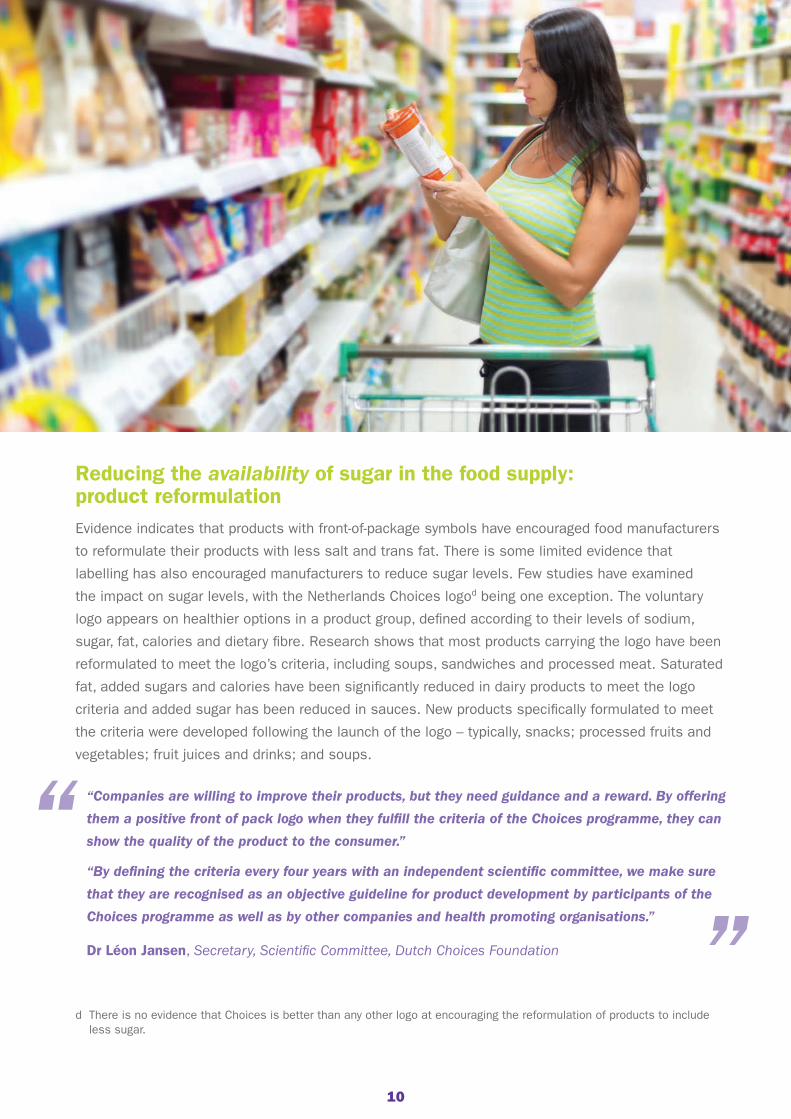
Reducing the availability of sugar in the food supply: product reformulation Evidence indicates that products with front-of-package symbols have encouraged food manufacturers
to reformulate their products with less salt and trans fat. There is some limited evidence that
labelling has also encouraged manufacturers to reduce sugar levels. Few studies have examined
the impact on sugar levels, with the Netherlands Choices logod being one exception. The voluntary
logo appears on healthier options in a product group, defined according to their levels of sodium,
sugar, fat, calories and dietary fibre. Research shows that most products carrying the logo have been
reformulated to meet the logo’s criteria, including soups, sandwiches and processed meat. Saturated
fat, added sugars and calories have been significantly reduced in dairy products to meet the logo
criteria and added sugar has been reduced in sauces. New products specifically formulated to meet
the criteria were developed following the launch of the logo – typically, snacks; processed fruits and
vegetables; fruit juices and drinks; and soups.
“Companies are willing to improve their products, but they need guidance and a reward. By offering
them a positive front of pack logo when they fulfill the criteria of the Choices programme, they can
show the quality of the product to the consumer.”
“By defining the criteria every four years with an independent scientific committee, we make sure
that they are recognised as an objective guideline for product development by participants of the
Choices programme as well as by other companies and health promoting organisations.”
Dr Léon Jansen, Secretary, Scientific Committee, Dutch Choices Foundation
d There is no evidence that Choices is better than any other logo at encouraging the reformulation of products to include less sugar.
“ “
AFFORDABILITYReducing affordability of sugary drinks: soda taxesFRANCE: The French soda tax
The tax, comprising approximately of 11 euro cents for a 1.5 litre of soda, has been in effect since 1
January 2012. As an excise tax, it is expected that producers or sellers (who must pay the tax to the
government) will pass (shift) the tax on to the consumer by raising the price of the product; thereby,
recovering the cost of tax. Research shows that the tax significantly increased the price of beverages
liable for the tax (all non-alcoholic beverages with added sugar or sweetener, e.g. soda, fruit drinks
and flavoured waters). Six months after implementation, the tax was ‘fully shifted’ to soda prices but
only partially to the prices of fruit drinks and flavoured waters (about 60% and 85% respectively).
MEXICO: Mexico’s sugary drinks tax
The tax has been in effect since January 2014 and increases the price of sugary drinks by about 10%
– 1 peso ($0.07) per litre. Sugary drinks are defined under the law as all drinks with added sugar,
excluding milks or yoghurts. Preliminary results of the Mexican soda tax show that in the first quarter
of 2014, there was, approximately, a 10% decrease in sales of taxed beverages.
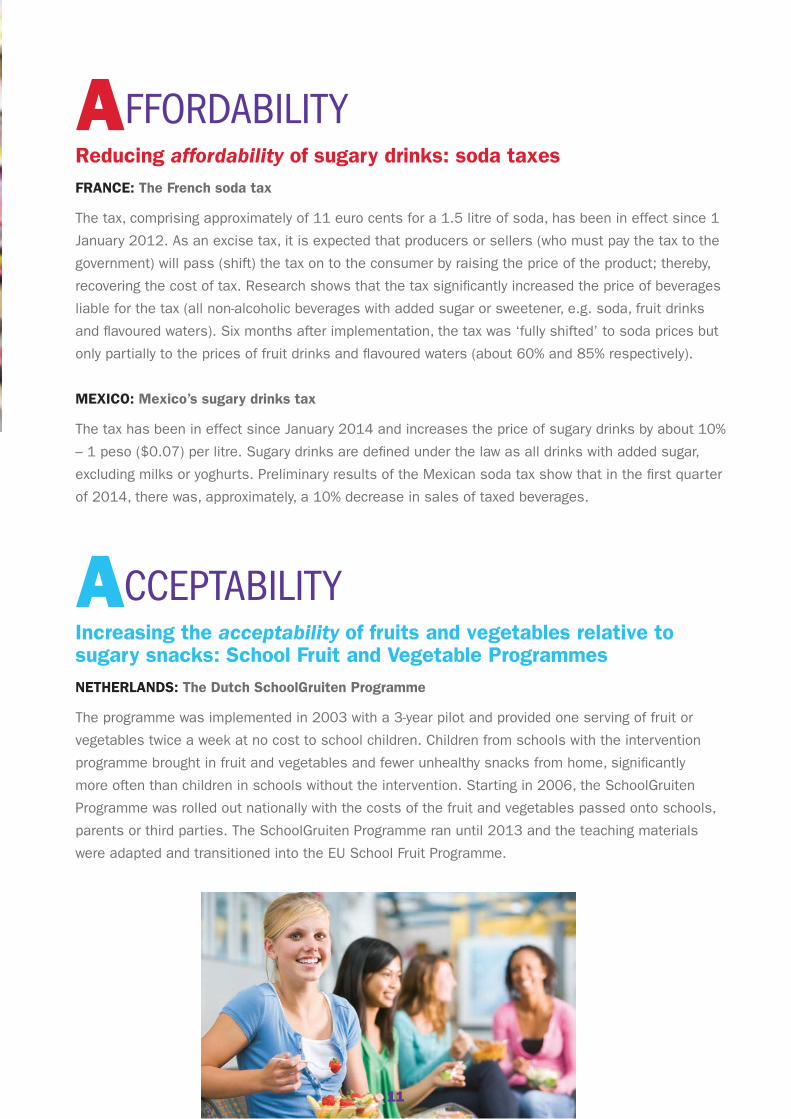
ACCEPTABILITYIncreasing the acceptability of fruits and vegetables relative to sugary snacks: School Fruit and Vegetable ProgrammesNETHERLANDS: The Dutch SchoolGruiten Programme
The programme was implemented in 2003 with a 3-year pilot and provided one serving of fruit or
vegetables twice a week at no cost to school children. Children from schools with the intervention
programme brought in fruit and vegetables and fewer unhealthy snacks from home, significantly
more often than children in schools without the intervention. Starting in 2006, the SchoolGruiten
Programme was rolled out nationally with the costs of the fruit and vegetables passed onto schools,
parents or third parties. The SchoolGruiten Programme ran until 2013 and the teaching materials
were adapted and transitioned into the EU School Fruit Programme.
11
12
NORWAY: Norway’s School Fruit Programmes
The subscription school fruit programme was initiated in 1996 and made nationwide in 2003, for
students in grades 1-10. In 2007, a free school fruit programme was also implemented nationwide in all
secondary elementary schools (grades 8-10) and combined schools (grades 1-10). In both programmes,
a piece of fruit or vegetable was provided every school day to students. Research shows that students
enrolled in schools implementing the programme increased their overall fruit and vegetable intake and
reduced the frequency of their unhealthy snack consumption (sugary drinks, candy and potato chips).
In the free fruit programme, the reduced frequency in consumption of unhealthy snacks was especially
evident among students with parents with lower educational attainment. Norway’s Free School Fruit
Programme was replaced with a subscription programme in 2014.
“The national education act was revised in 2008 and made it clear that the municipalities
(as school owner) were responsible for providing free fruit and vegetables every school day to all
students attending the included schools.”
“Furthermore, the amount of earmarked funds available for this programme to each municipality
was public information, and parents could complain to the County Governor if their municipality
cut programme funds. Whenever a County Governor had to instruct a city to reinstate the
programme, it received a lot of media attention.”
Professor Knut-Inge Klepp, Director-General, Division of Epidemiology, Norwegian Institute
of Public Health, Norway
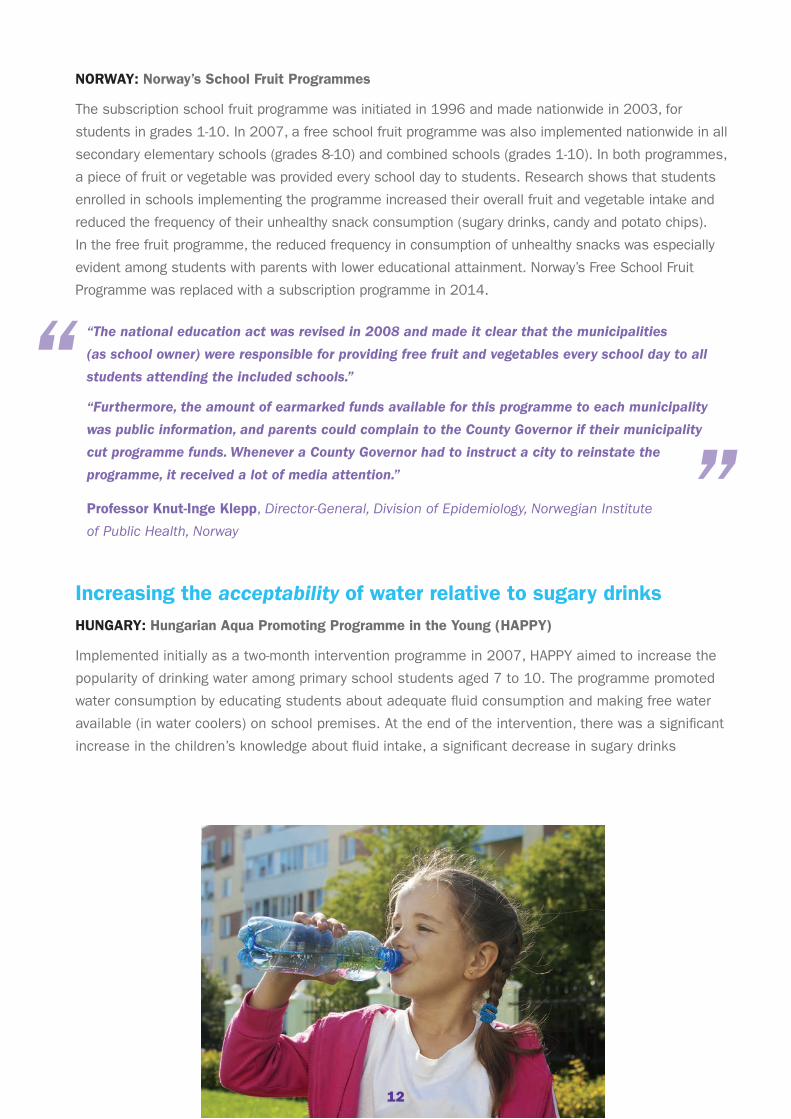
Increasing the acceptability of water relative to sugary drinksHUNGARY: Hungarian Aqua Promoting Programme in the Young (HAPPY)
Implemented initially as a two-month intervention programme in 2007, HAPPY aimed to increase the
popularity of drinking water among primary school students aged 7 to 10. The programme promoted
water consumption by educating students about adequate fluid consumption and making free water
available (in water coolers) on school premises. At the end of the intervention, there was a significant
increase in the children’s knowledge about fluid intake, a significant decrease in sugary drinks
“ “
13
consumption, and an increase in water consumption (with almost two-thirds of students reducing the
amount of sugary drinks they consumed). In addition, fewer students brought sugary drinks to school
and more students brought water to school following the intervention. Based on the success of the
pilot, in 2010 the National Institute for Food and Nutrition Science extended HAPPY nationwide for
voluntary adoption by schools. In 2014, around 144 schools had implemented the programme.
“Clear measurable indicators are needed to demonstrate programme achievements for decision
makers. Thus, monitoring and roboust evaluation are key elements for sustainability and future funding.”
“Appropriate steps like having a responsible contact person, building strong collaborations,
regular communication with the target groups, and effective documentation and dissemination
needs to be planned and undertaken. If you would like to realise impact, first identify the problem
then develop the proper language to effectively educate and reach your target group, especially
when you are working with children.”
Dr Eva Martos MD PhD, General Director, National Institute for Food and Nutrition Science,
Budapest, Hungary
AWARENESS Raising awareness of sugar in productsUSA: Los Angeles County’s “Sugar Pack” campaign
This campaign aimed to increase awareness of the number of “sugar packs” (a packet containing
three grams of sugar, commonly found in restaurants) in sugary drinks, as well as the adverse health
effects of obesity. The campaign ran between October 2011 and December 2012 and used paid
media messages placed on billboards, buses, and railways, a short video on transit TV, a website that
included a sugar calculator, and social media. The campaign visuals and messages were pre-tested
on the intended targeted audiences, and the campaign materials and resources were produced in
both English and Spanish. Results from an evaluation demonstrated that the campaign increased
the public’s knowledge of the number of sugar packs in drinks and the health effects of obesity. The
campaign also resulted in favourable recognition of health messages, and over 60% of respondents
reported they were likely or very likely to reduce their daily intake of sugary drinks.e
“Sugar in a soda presented as sugar packets rather than other measures such as grams
resonated with the public. Consumers were provided with a measure that was clear, striking,
and very familiar to them – really driving the point home.”
Noel Barragan, Program Manager, Strategic Planning for Community and Health Resources,
Division of Chronic Disease and Injury Prevention, Los Angeles County Department of Public Health
“ ““
“
e Barragan NC et al. (2014). The “sugar pack” health marketing campaign in Los Angeles County, 2011-2012. Health Promotion Practice 15(2): 208-216.
14
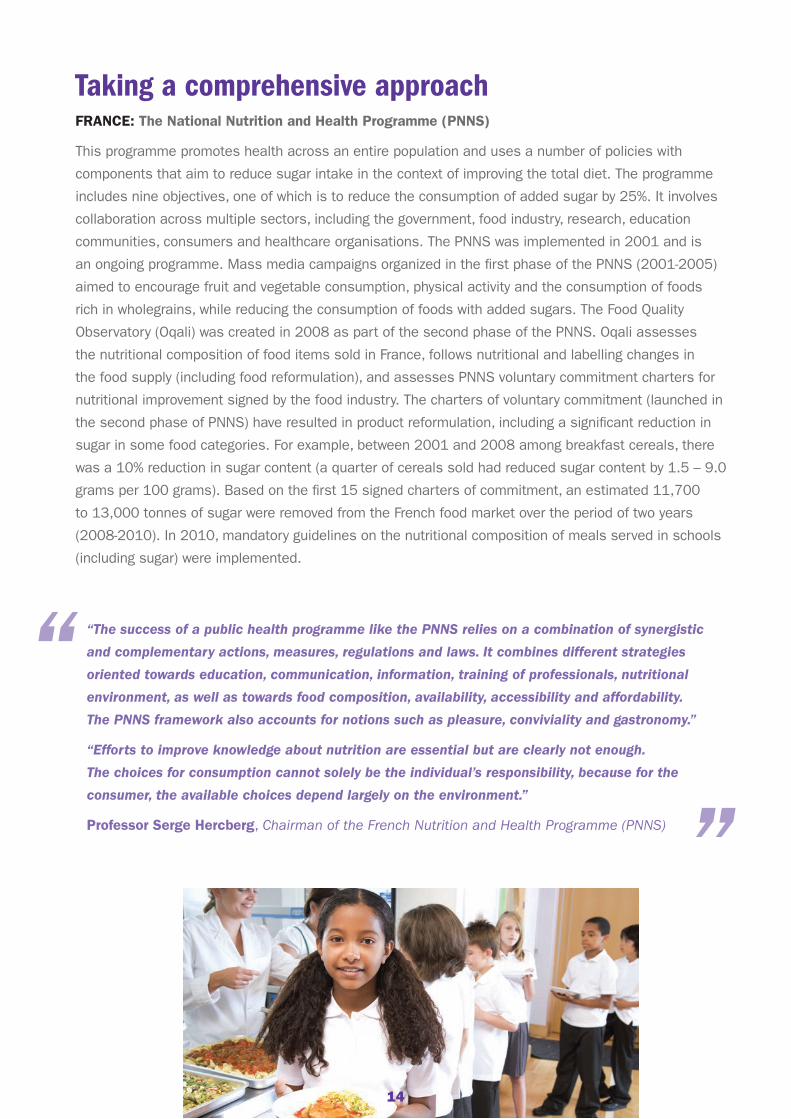
Taking a comprehensive approachFRANCE: The National Nutrition and Health Programme (PNNS)
This programme promotes health across an entire population and uses a number of policies with
components that aim to reduce sugar intake in the context of improving the total diet. The programme
includes nine objectives, one of which is to reduce the consumption of added sugar by 25%. It involves
collaboration across multiple sectors, including the government, food industry, research, education
communities, consumers and healthcare organisations. The PNNS was implemented in 2001 and is
an ongoing programme. Mass media campaigns organized in the first phase of the PNNS (2001-2005)
aimed to encourage fruit and vegetable consumption, physical activity and the consumption of foods
rich in wholegrains, while reducing the consumption of foods with added sugars. The Food Quality
Observatory (Oqali) was created in 2008 as part of the second phase of the PNNS. Oqali assesses
the nutritional composition of food items sold in France, follows nutritional and labelling changes in
the food supply (including food reformulation), and assesses PNNS voluntary commitment charters for
nutritional improvement signed by the food industry. The charters of voluntary commitment (launched in
the second phase of PNNS) have resulted in product reformulation, including a significant reduction in
sugar in some food categories. For example, between 2001 and 2008 among breakfast cereals, there
was a 10% reduction in sugar content (a quarter of cereals sold had reduced sugar content by 1.5 – 9.0
grams per 100 grams). Based on the first 15 signed charters of commitment, an estimated 11,700
to 13,000 tonnes of sugar were removed from the French food market over the period of two years
(2008-2010). In 2010, mandatory guidelines on the nutritional composition of meals served in schools
(including sugar) were implemented.
“The success of a public health programme like the PNNS relies on a combination of synergistic
and complementary actions, measures, regulations and laws. It combines different strategies
oriented towards education, communication, information, training of professionals, nutritional
environment, as well as towards food composition, availability, accessibility and affordability.
The PNNS framework also accounts for notions such as pleasure, conviviality and gastronomy.”
“Efforts to improve knowledge about nutrition are essential but are clearly not enough.
The choices for consumption cannot solely be the individual’s responsibility, because for the
consumer, the available choices depend largely on the environment.”
Professor Serge Hercberg, Chairman of the French Nutrition and Health Programme (PNNS)
“
“
15
What can other sectors do?Our research shows that with so many players and a complex, dynamic system, there is no obvious
way to intervene in the sugar supply chain to reduce the consumption of free sugars. Many different
sectors of government (e.g. agriculture, trade, industry) and society (e.g. farmers, agribusiness, food
manufacturers) are involved. Despite this complexity, the fact that sugar is both cheap and widely
available means there is a strong case for exploring opportunities to harness these other sectors
to take action to influence the availability and affordability of sugary products, the acceptability of
alternatives and people’s awareness of sugar in products.
Our research suggests that the following questions could provide a starting point for dialogue
and research:
u Is supporting farmers and labourers involved in sugar production one way of reducing
consumption? Though the rewards are few, growing sugar supports the livelihoods of millions
of farmers and agricultural workers. It is also an important source of national revenue for many
countries, both large and small. Reducing production could potentially have adverse economic
impacts. The economic threats posed by reduced production have led to opposition to policies
to reduce sugar consumption. Is the time right to encourage farmers to transition out of sugar
production and into healthier alternatives which demand higher market prices? Since farmers
receive such a small proportion of the price paid for sugar, could more Fairtrade and organic sugar
benefit both people’s health (through higher sugar prices) and farmers’ livelihoods?
u Could the provision of clean water, fruits and vegetables encourage a large-scale substitution
away from sugary foods and drinks? Evidence presented here shows that school-based policies
can effectively encourage children to switch from sugary drinks to water and from sugary snacks
to fruits and vegetables. Could the same process be scaled up from specific settings to the
whole food supply? There is anecdotal evidence that people in low- and middle-income countries
consume sugary drinks because they are concerned about the safety of the water supply. Many
people across the world lack access to fruit and vegetables. Is harnessing the power of suppliers
of water, fruit and vegetables to increase availability and affordability, one answer to excess
sugar intake?
u What is the role of reformulation? Evidence presented here shows that reformulation to reduce
the amount of sugars added to processed foods is possible. Moreover, our research into the sugar
supply chain shows that a lot of the global sugar supply is sold to food manufacturers for use
in processed foods, rather than to households for use in the home. Yet, actions to reformulate
products around the world still focus on salt and trans fats. What are the challenges faced by
food manufacturers to reduce added sugars in their products? Can government policies and
investments help address some of these challenges and motivate change? Will the reduction of
sugar content actually lead to healthier diets, or will there be unintended consequences?
16
u Is facilitating the adoption of non-caloric sweeteners by soft drink manufacturers part of the
solution? Many large sugar refiners also produce non-caloric sweeteners, or have joint ventures
with companies who manufacturer non-caloric sweeteners. Equivalent prices of non-caloric
sweeteners are lower than sugar. Yet despite these price incentives to increase the use of
non-caloric sweeteners, the market is still just 10% of the global market for all sweeteners
(80% is sugar). One reason may be that non-caloric sweeteners cannot be used as a direct
substitute for sugar in foods since they do not have ‘bulking’ properties. Non-caloric sweeteners
are also heavily regulated. And from a health perspective, there is reported to be “insufficient
clinical and epidemiologic data available to make definitive conclusions regarding the benefits of
NNS [non-nutritive sweeteners] in displacing caloric sweeteners as related to energy balance.”f
Nevertheless, soft drink manufacturers can directly substitute non-caloric sweeteners in their
sugary drinks. What is preventing soft drink manufacturers from switching all of their product
portfolios to non-caloric sweeteners? What further evidence is needed to identify if the use of
non-caloric sweeteners can assist in obesity prevention? Or is looking to non-caloric sweeteners
at best an ill-advised short-term solution since it still promotes a preference for sweetness and a
reliance on highly-processed foods in the diet?
u Is there a role for policy on sugar production, trade and distribution? The policy environment
around sugar is very complex, with incentives for production, trade and distribution being affected
by a range of subsidies, quotas and trade agreements, which vary from place to place and affect
different parts of the sugar supply chain in different ways. Yet within this complexity, specific policies
clearly have specific effects on sugar prices and on the behaviour of sugar businesses. Are there any
supply-side sugar policies that could make a difference to sugar consumption globally?
f Shankar P, Ahuja S, Sriram K (2013). Non-nutritive sweeteners: Review and update. Nutrition, 29(11-12):1293-1299.
RECOMMENDATIONSTo help curb sugar consumption, promote healthier diets and reduce non-communicable
diseases, governments should:
u Learn from the policy actions highlighted here and the experience of the experts who have
developed and implemented them. Governments should prioritise not only taking more
action, but more effective action to curb sugar consumption.
u Initiate dialogue with stakeholders in the sugar supply chain. This could identify what
‘upstream’ actions can be taken to reduce the supply and demand for sugar.
u Avoid looking at sugar in isolation. Policies to reduce sugar intake should be implemented
in the context of broader dietary improvements.
u Take a comprehensive approach to reducing sugar consumption. Action is needed across
all three policy domains outlined in our NOURISHING framework: food environment,
food system and behaviour change communication.
References1. World Cancer Research Fund International Continuous Update Project www.wcrf.org/int/research-we-fund/continuous-
update-project-findings-reports
2. World Cancer Research Fund / American Institute for Cancer Research. Food, Nutrition, Physical Activity, and the Prevention of Cancer: a Global Perspective. Washington DC: AICR, 2007
3. Guideline: Sugars intake for adults and children. Geneva: World Health Organization; 2015.
AcknowledgementsThis brief was written by Bryony Sinclair and Corinna Hawkes with research support from Anna Savelyeva. We would like to gratefully acknowledge input from policymakers and researchers about the included policy actions and their effects, as well as colleagues from World Cancer Research Fund International who reviewed and designed the brief.
Suggested citation for this publicationWorld Cancer Research Fund International. ‘Curbing global sugar consumption: Effective food policy actions to help promote healthy diets and tackle obesity’, 2015
For further informationContact World Cancer Research Fund International’s Policy and Public Affairs department email: [email protected]

Blog
World Cancer Research Fund International 22 Bedford Square, London WC1B 3HH Tel: +44 (0)20 7343 4200 Email: [email protected] www.wcrf.org
twitter.com/wcrfint facebook.com/wcrfint wcrf.org/blog
© 2015 World Cancer Research Fund International
About World Cancer Research Fund InternationalWorld Cancer Research Fund International leads and unifies a network of cancer prevention charities
with a global reach.
We are the world’s leading authority on cancer prevention research related to diet, weight and
physical activity.
We work collaboratively with organisations around the world to encourage governments to implement
policies to prevent cancer and other non-communicable diseases.