curis.ku.dkcuris.ku.dk/ws/files/135067267/green_manuring_effect_of_pure_and... · guiducci,...
TRANSCRIPT

u n i ve r s i t y o f co pe n h ag e n
Københavns Universitet
Green manuring effect of pure and mixed barley - hairy vetch winter cover crops onmaize and processing tomato N nutritionTosti, Giacomo; Benincasa, Paolo; Farneselli, Michela; Pace, Roberta; Tei, Francesco;Guiducci, Marcello; Thorup-Kristensen, KristianPublished in:European Journal of Agronomy
DOI:10.1016/j.eja.2012.06.004
Publication date:2012
Document VersionEarly version, also known as pre-print
Citation for published version (APA):Tosti, G., Benincasa, P., Farneselli, M., Pace, R., Tei, F., Guiducci, M., & Thorup-Kristensen, K. (2012). Greenmanuring effect of pure and mixed barley - hairy vetch winter cover crops on maize and processing tomato Nnutrition. European Journal of Agronomy, 43, 136-146. https://doi.org/10.1016/j.eja.2012.06.004
Download date: 17. Feb. 2019

Go
GMa
b
a
ARRA
KOLSMCG
1
sdttKit
1h
Europ. J. Agronomy 43 (2012) 136–146
Contents lists available at SciVerse ScienceDirect
European Journal of Agronomy
journa l homepage: www.e lsev ier .com/ locate /e ja
reen manuring effect of pure and mixed barley – hairy vetch winter cover cropsn maize and processing tomato N nutrition
iacomo Tosti a,∗, Paolo Benincasaa, Michela Farneselli a, Roberta Pacea, Francesco Teia,arcello Guiduccia, Kristian Thorup-Kristensenb
University of Perugia, Department of Agricultural and Environmental Sciences, Borgo XX Giugno, 74, 06121 Perugia, ItalyUniversity of Copenhagen, Faculty of Life Sciences, Department of Agriculture and Ecology, 2630 Taastrup, Denmark
r t i c l e i n f o
rticle history:eceived 21 February 2012eceived in revised form 8 June 2012ccepted 11 June 2012
eywords:rganic farmingegumesowing proportionsediterranean environment
ritical Nreen manuring
a b s t r a c t
Adopting mixtures between legumes and non legumes can be an efficient tool to merge the advantages ofthe single species in the fall-sown cover crop practice. Nevertheless there is a lack of information on howthe species proportion may affect N accumulation and C/N of the cover crops and how this can influencethe N uptake and N status of different subsequent summer cash crops.
In this study the N effect of barley (Hordeum vulgare L.) and hairy vetch (Vicia villosa Roth.) grown in purestands or in mixtures with different sowing proportion was tested on maize (Zea Mays L.) and processingtomato (Lycopersicon esculentum Mill.). Cover crop N accumulation and C/N ratio were monitored duringthe whole growing cycle, and CO2 flux from the soil was measured after their incorporation into the soil.N status of the following cash crops was evaluated by comparing the observed data with the appropriatecritical N dilution curves.
The results highlight the effectiveness of mixtures for the management of the winter cover crop practice.In the two considered years, the species proportion influences the aboveground biomass (ranging from2.90 to 5.94 Mg ha−1) and N accumulation (ranging from 73.8 to 183.2 kg ha−1) of the mixtures. Thelegume component, even at low proportion, increased the N accumulation of the cover crop of 148% (in2006) and 134% (in 2007) compared to pure stand barley. Also the biomass quality of the cover crops wasgreatly affected by species proportion (e.g. C/N ranging from 12.0 to 18.9) and this aspect showed a cleareffect on the N availability for the subsequent crop. N effect (Neff) of the different cover crop mixtures
(especially those with high barley proportions) brought tomato much closer to the critical N value thanthey did with maize. The basis of the relationship between cover crop C/N and Neff was confirmed, somixtures can be used to adjust the extent and timing of mineralisation of the incorporated biomass to thesubsequent cash crop requirements. Prediction of the cash crops N status on the cover crop C/N appearsto be a useful approach, but, it may be important to take the characteristics of the following cash cropinto account.. Introduction
Nitrogen (N) management in low-input and organic farmingystems relies mainly on preventive measures, such as the intro-uction of legumes in crop rotations (van Kessel and Hartley, 2000),he use of winter cover crops and the adoption of conservative soilillage techniques (Lampkin, 1990; Stockdale et al., 2002; Thorup-ristensen et al., 2003). Recently, there has been an increased
nterest in cover crops also in conventional agriculture, mainly dueo a rise in the price of fertilisers and to the increased awareness of
∗ Corresponding author. Tel.: +39 075 585 6333; fax: +39 075 585 6344.E-mail addresses: [email protected], [email protected] (G. Tosti).
161-0301/$ – see front matter © 2012 Elsevier B.V. All rights reserved.ttp://dx.doi.org/10.1016/j.eja.2012.06.004
© 2012 Elsevier B.V. All rights reserved.
environmental issues (Salmeron et al., 2011; Gabriel and Quemada,2011).
In the Mediterranean environment, winter cover crops aremainly grown because of their capacity to incorporate N duringthe winter season and hand it over to the succeeding cash crop inspring–summer, upon the incorporation of aboveground biomassresidues into the soil (Teasdale et al., 2008; Kramberger et al.,2009). Such ‘nitrogen effect’ results from two combined processes:on one side the uptake of N (Nupt) by the cover crop during its grow-ing cycle and, on the other side, the release of N by mineralisationafter the incorporation of aboveground biomass residues into the
soil (Thorup-Kristensen, 1994a; Thorup-Kristensen and Nielsen,1998). Therefore, the large Nupt variability of the subsequent cashcrops, that mainly depends on crop potential and soil N availability(Vos and Van der Putten, 1997; Benincasa et al., 2010), and the
grono
oapitopab
ctalCwa2
aib2twctttHatc
oramenbars
2
2
(Dvslt2
weAilyb
G. Tosti et al. / Europ. J. A
ccurrence of asynchrony between N release from the residuesnd the subsequent cash crop, still need a comprehensive inter-retation in the light of the “N effect” approach. All those aspects
nterfere, in fact, with the reliability of the cover crops as efficientool for the agroecosystem N management. Asynchrony couldccur as “excess-asynchrony” when release occurs at a time whenlant demand is restricted or non-existent; or as “insufficient-synchrony” when nutrient supply from the mineralisation of theiomass is too slow to meet plant needs (Myers et al., 1994).
One key aspect relates to the selection of species. When coverrops are specifically used for green manuring purposes, this selec-ion depends on the primary aims to be achieved. Indeed, legumesre mainly used for their ability to fix, accumulate and supplyarge amounts of N (Ledgard and Giller, 1995; Peoples et al., 1995;azzato et al., 2003; Caporali et al., 2004; Campiglia et al., 2010),hile non-legumes are mainly used to prevent soil erosion, trap N
nd reduce its leaching to the water table (Vos and Van der Putten,001; Macdonald et al., 2005; Constantin et al., 2011).
Adopting mixtures between legumes and non legumes can ben efficient tool to merge the advantages of the single speciesn the cover crop practice (Ranells and Wagger, 1997) achievingoth environmental and agronomic benefits (Crews and Peoples,005). The use of mixtures leads to a radical modification ofhe biochemical composition of the aboveground biomass thatill be incorporated into the soil (Tosti et al., 2010), hence it
ould represent an important factor affecting the N mineralisa-ion and the N availability for the subsequent crop. Moreover,he intercropping of legumes and non legumes frequently leadso facilitative interactions (Ofori and Stern, 1987; Jensen, 1996;auggaard-Nielsen and Jensen, 2005; Fan et al., 2006), but thisdvantage has never been evaluated considering how the propor-ion between the species affects the N effect for different summerash crops.
The objectives of this study were to: (i) analyse the dynamicsf growth (with particular reference to total N content and C/Natio) for two cover crop species (hairy vetch, Vicia villosa Roth.,nd barley, Hordeum vulgare L.) cultivated in pure stands and inixtures characterised by varying proportions among the differ-
nt species; (ii) examine how the mixture composition affects theitrogen effect for the succeeding crop, and (iii) evaluate possi-le differences between two summer crops (maize, Zea Mays L.,nd processing tomato, Lycopersicon esculentum Mill.) in terms ofesponse to the amount of N supplied by the cover crops in puretands or mixtures.
. Materials and methods
.1. Experimental site and design
Field experiments were carried out in two growing seasons2005–2006 and 2006–2007) at the Experimental Station of theepartment of Agricultural and Environmental Sciences of the Uni-ersity of Perugia (Papiano, Central Italy, 43◦ N, 165 m a.s.l.). Theoil was a clay-loam (Fluventic Haplustept) with the 0–0.5 m soilayer containing 46% silt, 33% clay, 20% sand and 1.2% organic mat-er. The pHH2O was 7.8; the content of extractable Olesen-P was9.5 mg kg−1, and exchangeable K was 254 mg kg−1.
Complete weather data (including temperature and rainfall)ere obtained from an automatic meteorological station inside the
xperimental site. In both years, the preceding crop was sunflower.fter harvesting operation the residues of sunflower were cut and
ncorporated into the soil by a superficial (0.25 m) ploughing fol-owed by harrowing. The seed bed preparation was optimal in bothears. The experiment consisted of two consecutive phases, the firsteing the cultivation of autumn–winter cover crops until the killing
my 43 (2012) 136–146 137
date, the second being the cultivation of two spring–summer cashcrops.
As cover crops, two species were used, i.e. barley (H. vulgare L.,cultivar Amillis) and hairy vetch (V. villosa Roth., cultivar Capello).These species were sown as pure crops at the ordinary sowing rates(400 seeds of barley m−2, B100; 200 seeds of vetch m−2, V100)and as mixtures, with varying seed ratios according to the replace-ment principle (de Wit and van den Bergh, 1965; Connolly, 1986).In detail, the following three combinations were chosen: barleyat 75% of its full sowing rate + vetch at 25% of its full sowing rate(300 + 50 seeds m−2; B75V25), barley 50% + vetch 50% (200 + 100seeds m−2; B50V50) and barley 25% + vetch 75% (100 + 150 seedsm−2; B25V75). Beside the cover crops, two control plots were alsoadded to the experiment (see later), wherein pure barley was grownas in B100, but the aboveground biomass was removed instead ofbeing incorporated into the soil at the killing date. The experimen-tal design was a completely randomized block with 8 replicates in2005–2006 and 6 replicates in 2006–2007. The plot size was 80 m2
in both years.After the killing of cover crops, grain maize (Z. mays L., culti-
var Arzano FAO class 400) and processing tomato (L. esculentumMill., cultivar PS1296) were sown/planted in 4 (2006) or 3 (2007)blocks each. Considering the aforementioned control plots (twofor each block), these were used to accommodate respectivelyan unfertilised control (N0) and a fertilised control (N200). Insuch way, the pre-emptive competition effect (Thorup-Kristensen,1993) occurred also in the N0 and N200 control treatments. N200received 200 kg N ha−1 as urea at sowing (in maize), or via ferti-gation (in processing tomato), while no other plots receive anymineral fertilisation input.
2.2. Crop management
Cover crops were sown on 28.10.2005 and 27.10.2006 in rowsspaced 0.15 m apart. Barley and hairy vetch in the mixtures weresown in the same row. No N fertilisation was supplied to the covercrops while Phosphorus and Potassium were applied to all plots ata rate of 75 kg ha−1 of P2O5 and K2O, respectively, each at covercrop planting. No diseases or weed control was performed.
At killing dates (12.04.2006 and 03.04.2007) the hairy vetchplants were at beginning of flowering and barley plants at earemergence. Cover crop aboveground biomass was mowed, finelychopped and immediately incorporated into the soil (0.2 m depth)by a rotary cultivator equipped with scissor organs and a back-roller.
Maize was sown with a pneumatic drill on 24.04.2006 andon 19.04.2007 and the emergence occurred on 08.05.2006 and03.05.2007; two weeks later plant density was adjusted by thin-ning out to 8 plants m−2. Processing tomato was bedded using adrawn row crop transplanter on 15.05.2006 and 15.05.2007 intwin-rows (1.2 m + 0.4 m) at 3.3 plants m−2. Both cash crops weredrip-irrigated twice a week for all treatments, according to ETc(Allen et al., 1998). Pest control was never necessary during thegrowing cycle, while weeds were thoroughly controlled by hand.Copper was applied during the processing tomato crop season inorder to control foliar diseases.
2.3. Plant sampling and analytical determinations
Aboveground biomass accumulation of the cover crops wasdetermined by periodical samplings of plants from a surface areaof 1.2 m2 per each plot. Plant sampling was performed at 75, 103,
138, 159, 166 Days After Sowing (DAS) in 2005–2006, and at 47,81, 124, 139, 158 DAS in 2006–2007. At each sampling date, theaboveground biomass of vetch and barley in mixtures was sepa-rated by hand. The harvested aboveground biomass was weighed,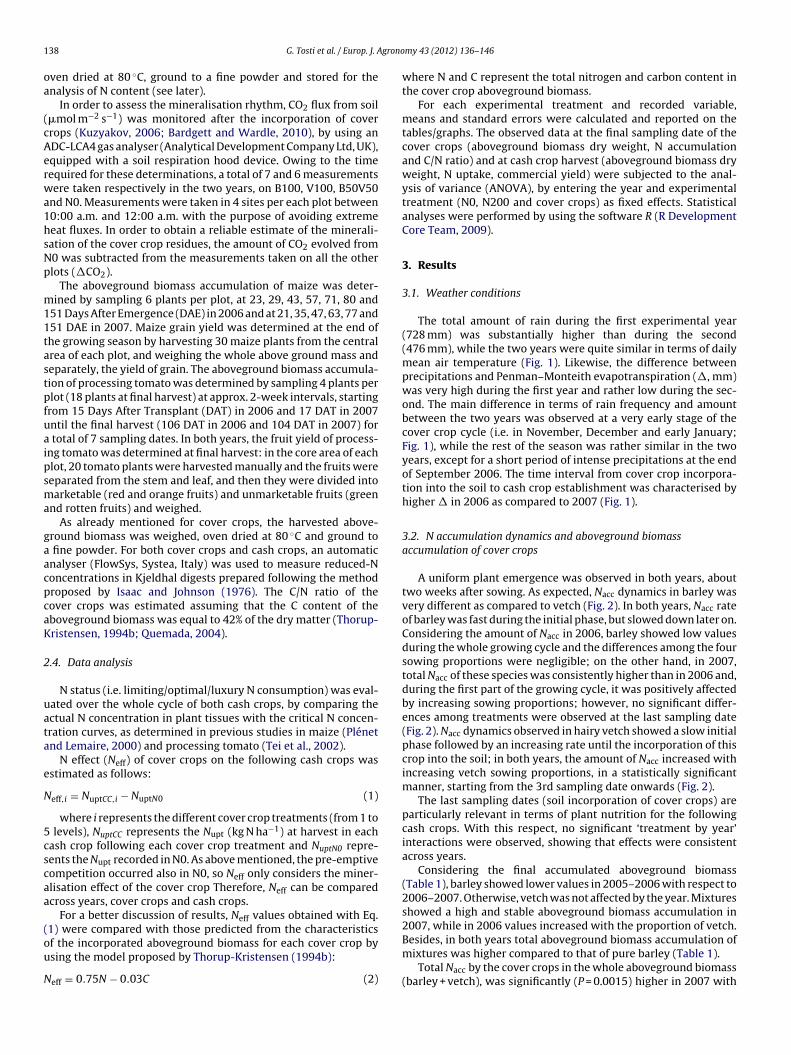
1 grono
oa
(cAerwa1hsNp
m11tastpfuaipsma
gaacpcaK
2
uata
e
N
5cscaa
(ou
N
38 G. Tosti et al. / Europ. J. A
ven dried at 80 ◦C, ground to a fine powder and stored for thenalysis of N content (see later).
In order to assess the mineralisation rhythm, CO2 flux from soil�mol m−2 s−1) was monitored after the incorporation of coverrops (Kuzyakov, 2006; Bardgett and Wardle, 2010), by using anDC-LCA4 gas analyser (Analytical Development Company Ltd, UK),quipped with a soil respiration hood device. Owing to the timeequired for these determinations, a total of 7 and 6 measurementsere taken respectively in the two years, on B100, V100, B50V50
nd N0. Measurements were taken in 4 sites per each plot between0:00 a.m. and 12:00 a.m. with the purpose of avoiding extremeeat fluxes. In order to obtain a reliable estimate of the minerali-ation of the cover crop residues, the amount of CO2 evolved from0 was subtracted from the measurements taken on all the otherlots (�CO2).
The aboveground biomass accumulation of maize was deter-ined by sampling 6 plants per plot, at 23, 29, 43, 57, 71, 80 and
51 Days After Emergence (DAE) in 2006 and at 21, 35, 47, 63, 77 and51 DAE in 2007. Maize grain yield was determined at the end ofhe growing season by harvesting 30 maize plants from the centralrea of each plot, and weighing the whole above ground mass andeparately, the yield of grain. The aboveground biomass accumula-ion of processing tomato was determined by sampling 4 plants perlot (18 plants at final harvest) at approx. 2-week intervals, startingrom 15 Days After Transplant (DAT) in 2006 and 17 DAT in 2007ntil the final harvest (106 DAT in 2006 and 104 DAT in 2007) fortotal of 7 sampling dates. In both years, the fruit yield of process-
ng tomato was determined at final harvest: in the core area of eachlot, 20 tomato plants were harvested manually and the fruits wereeparated from the stem and leaf, and then they were divided intoarketable (red and orange fruits) and unmarketable fruits (green
nd rotten fruits) and weighed.As already mentioned for cover crops, the harvested above-
round biomass was weighed, oven dried at 80 ◦C and ground tofine powder. For both cover crops and cash crops, an automatic
nalyser (FlowSys, Systea, Italy) was used to measure reduced-Noncentrations in Kjeldhal digests prepared following the methodroposed by Isaac and Johnson (1976). The C/N ratio of theover crops was estimated assuming that the C content of theboveground biomass was equal to 42% of the dry matter (Thorup-ristensen, 1994b; Quemada, 2004).
.4. Data analysis
N status (i.e. limiting/optimal/luxury N consumption) was eval-ated over the whole cycle of both cash crops, by comparing thectual N concentration in plant tissues with the critical N concen-ration curves, as determined in previous studies in maize (Plénetnd Lemaire, 2000) and processing tomato (Tei et al., 2002).
N effect (Neff) of cover crops on the following cash crops wasstimated as follows:
eff,i = NuptCC,i − NuptN0 (1)
where i represents the different cover crop treatments (from 1 tolevels), NuptCC represents the Nupt (kg N ha−1) at harvest in each
ash crop following each cover crop treatment and NuptN0 repre-ents the Nupt recorded in N0. As above mentioned, the pre-emptiveompetition occurred also in N0, so Neff only considers the miner-lisation effect of the cover crop Therefore, Neff can be comparedcross years, cover crops and cash crops.
For a better discussion of results, Neff values obtained with Eq.1) were compared with those predicted from the characteristics
f the incorporated aboveground biomass for each cover crop bysing the model proposed by Thorup-Kristensen (1994b):eff = 0.75N − 0.03C (2)
my 43 (2012) 136–146
where N and C represent the total nitrogen and carbon content inthe cover crop aboveground biomass.
For each experimental treatment and recorded variable,means and standard errors were calculated and reported on thetables/graphs. The observed data at the final sampling date of thecover crops (aboveground biomass dry weight, N accumulationand C/N ratio) and at cash crop harvest (aboveground biomass dryweight, N uptake, commercial yield) were subjected to the anal-ysis of variance (ANOVA), by entering the year and experimentaltreatment (N0, N200 and cover crops) as fixed effects. Statisticalanalyses were performed by using the software R (R DevelopmentCore Team, 2009).
3. Results
3.1. Weather conditions
The total amount of rain during the first experimental year(728 mm) was substantially higher than during the second(476 mm), while the two years were quite similar in terms of dailymean air temperature (Fig. 1). Likewise, the difference betweenprecipitations and Penman–Monteith evapotranspiration (�, mm)was very high during the first year and rather low during the sec-ond. The main difference in terms of rain frequency and amountbetween the two years was observed at a very early stage of thecover crop cycle (i.e. in November, December and early January;Fig. 1), while the rest of the season was rather similar in the twoyears, except for a short period of intense precipitations at the endof September 2006. The time interval from cover crop incorpora-tion into the soil to cash crop establishment was characterised byhigher � in 2006 as compared to 2007 (Fig. 1).
3.2. N accumulation dynamics and aboveground biomassaccumulation of cover crops
A uniform plant emergence was observed in both years, abouttwo weeks after sowing. As expected, Nacc dynamics in barley wasvery different as compared to vetch (Fig. 2). In both years, Nacc rateof barley was fast during the initial phase, but slowed down later on.Considering the amount of Nacc in 2006, barley showed low valuesduring the whole growing cycle and the differences among the foursowing proportions were negligible; on the other hand, in 2007,total Nacc of these species was consistently higher than in 2006 and,during the first part of the growing cycle, it was positively affectedby increasing sowing proportions; however, no significant differ-ences among treatments were observed at the last sampling date(Fig. 2). Nacc dynamics observed in hairy vetch showed a slow initialphase followed by an increasing rate until the incorporation of thiscrop into the soil; in both years, the amount of Nacc increased withincreasing vetch sowing proportions, in a statistically significantmanner, starting from the 3rd sampling date onwards (Fig. 2).
The last sampling dates (soil incorporation of cover crops) areparticularly relevant in terms of plant nutrition for the followingcash crops. With this respect, no significant ‘treatment by year’interactions were observed, showing that effects were consistentacross years.
Considering the final accumulated aboveground biomass(Table 1), barley showed lower values in 2005–2006 with respect to2006–2007. Otherwise, vetch was not affected by the year. Mixturesshowed a high and stable aboveground biomass accumulation in2007, while in 2006 values increased with the proportion of vetch.
Besides, in both years total aboveground biomass accumulation ofmixtures was higher compared to that of pure barley (Table 1).Total Nacc by the cover crops in the whole aboveground biomass(barley + vetch), was significantly (P = 0.0015) higher in 2007 with

G. Tosti et al. / Europ. J. Agronomy 43 (2012) 136–146 139
F aily pt trans
rNtNtn
Fad
ig. 1. Weather data during the experiment. Dark columns and thin lines represent dhe difference between cumulated rainfall and cumulated Penman–Monteith evapo
espect to 2006 (137.1 vs. 104.2 kg N ha−1 on average). As expected,acc was high in pure vetch (187.0 kg N ha−1 as an average of
−1
he two years) and low in pure barley (39.7 kg N ha ), whileacc of mixtures increased with the proportion of vetch withinhe above range and the observed differences were always sig-ificant (P < 0.001). Regarding each single species, Nacc of barley
ig. 2. N accumulation (kg N ha−1) in the aboveground biomass of barley (B), hairy vetchnd hairy vetch were grown as cover crops in pure stand at full sowing density (B100 andensity, i.e. 75% barley + 25% vetch (B75V25), 50% + 50% (B50V50) and 25% + 75% (B25V75
recipitation (mm) and mean air temperature (◦C), respectively. Bold lines representpiration (�, mm). The timing of the main field operations is also reported.
was not affected by the sowing proportion, but only by the year(P = 2.433e−10; 25.6 vs. 51.2 kg N ha−1 respectively in 2006 and
2007). On the other hand, Nacc of vetch was not significantlyaffected by the year and it was significantly affected by sow-ing proportion (P = 5.761e−8), ranging on average from 54.6 to187.0 kg N ha−1.(V) and barley + vetch (B + V) during the growing cycles in 2006 and 2007. BarleyV100, respectively) and in mixtures with varying seed ratios, relative to full sowing). Bars indicate ±1 standard error.
140 G. Tosti et al. / Europ. J. Agronomy 43 (2012) 136–146
Table 1Dry weight accumulation (Mg ha−1) of the cover crops aboveground biomass at the date of its incorporation into the soil in 2006 and 2007 (see Fig. 2 for the treatmentabbreviations). Standard errors (in brackets) and results of the analysis of variance are also reported.
Aboveground biomass (Mg ha−1)
Barley Vetch Total
2006 B100 2.34 (0.161) – 2.34 (0.161)B75V25 1.70 (0.155) 1.20 (0.189) 2.90 (0.123)B50V50 1.16 (0.081) 2.26 (0.063) 3.43 (0.050)B25V75 1.00 (0.065) 3.13 (0.174) 4.12 (0.193)V100 – 4.51 (0.262) 4.51(0.262)
2007 B100 4.17 (0.154) – 4.17 (0.154)B75V25 3.67 (0.150) 1.36 (0.158) 5.03 (0.082)B50V50 2.94 (0.185) 2.08 (0.099) 5.02 (0.182)B25V75 2.82 (0.185) 3.12 (0.191) 5.94 (0.239)V100 – 4.82 (0.224) 4.82 (0.224)
Treatment (T) *** *** ***Year (Y) *** ns ***T x Y ns ns ns
***: Significantly different at P < 0.001**: Significantly different at P < 0.01*n
aiwi(
3
ivigfww
FvtcV
: Significantly different at P < 0.05s: not significant
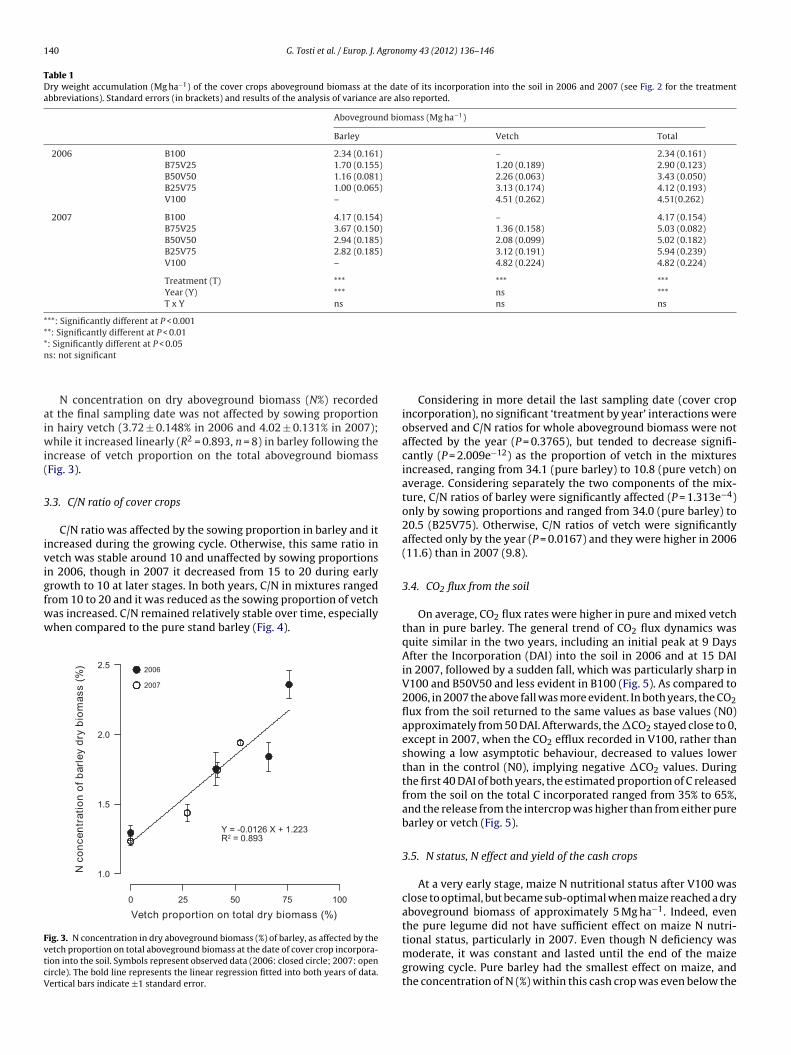
N concentration on dry aboveground biomass (N%) recordedt the final sampling date was not affected by sowing proportionn hairy vetch (3.72 ± 0.148% in 2006 and 4.02 ± 0.131% in 2007);
hile it increased linearly (R2 = 0.893, n = 8) in barley following thencrease of vetch proportion on the total aboveground biomassFig. 3).
.3. C/N ratio of cover crops
C/N ratio was affected by the sowing proportion in barley and itncreased during the growing cycle. Otherwise, this same ratio inetch was stable around 10 and unaffected by sowing proportionsn 2006, though in 2007 it decreased from 15 to 20 during earlyrowth to 10 at later stages. In both years, C/N in mixtures ranged
rom 10 to 20 and it was reduced as the sowing proportion of vetchas increased. C/N remained relatively stable over time, especiallyhen compared to the pure stand barley (Fig. 4).ig. 3. N concentration in dry aboveground biomass (%) of barley, as affected by theetch proportion on total aboveground biomass at the date of cover crop incorpora-ion into the soil. Symbols represent observed data (2006: closed circle; 2007: openircle). The bold line represents the linear regression fitted into both years of data.ertical bars indicate ±1 standard error.
Considering in more detail the last sampling date (cover cropincorporation), no significant ‘treatment by year’ interactions wereobserved and C/N ratios for whole aboveground biomass were notaffected by the year (P = 0.3765), but tended to decrease signifi-cantly (P = 2.009e−12) as the proportion of vetch in the mixturesincreased, ranging from 34.1 (pure barley) to 10.8 (pure vetch) onaverage. Considering separately the two components of the mix-ture, C/N ratios of barley were significantly affected (P = 1.313e−4)only by sowing proportions and ranged from 34.0 (pure barley) to20.5 (B25V75). Otherwise, C/N ratios of vetch were significantlyaffected only by the year (P = 0.0167) and they were higher in 2006(11.6) than in 2007 (9.8).
3.4. CO2 flux from the soil
On average, CO2 flux rates were higher in pure and mixed vetchthan in pure barley. The general trend of CO2 flux dynamics wasquite similar in the two years, including an initial peak at 9 DaysAfter the Incorporation (DAI) into the soil in 2006 and at 15 DAIin 2007, followed by a sudden fall, which was particularly sharp inV100 and B50V50 and less evident in B100 (Fig. 5). As compared to2006, in 2007 the above fall was more evident. In both years, the CO2flux from the soil returned to the same values as base values (N0)approximately from 50 DAI. Afterwards, the �CO2 stayed close to 0,except in 2007, when the CO2 efflux recorded in V100, rather thanshowing a low asymptotic behaviour, decreased to values lowerthan in the control (N0), implying negative �CO2 values. Duringthe first 40 DAI of both years, the estimated proportion of C releasedfrom the soil on the total C incorporated ranged from 35% to 65%,and the release from the intercrop was higher than from either purebarley or vetch (Fig. 5).
3.5. N status, N effect and yield of the cash crops
At a very early stage, maize N nutritional status after V100 wasclose to optimal, but became sub-optimal when maize reached a dryaboveground biomass of approximately 5 Mg ha−1. Indeed, eventhe pure legume did not have sufficient effect on maize N nutri-
tional status, particularly in 2007. Even though N deficiency wasmoderate, it was constant and lasted until the end of the maizegrowing cycle. Pure barley had the smallest effect on maize, andthe concentration of N (%) within this cash crop was even below the
G. Tosti et al. / Europ. J. Agronomy 43 (2012) 136–146 141
F vetcha
la
iicdscsb
Fi(
ig. 4. C/N in the aboveground biomass of barley (B), hairy vetch (V) and barley +bbreviations). Bars indicate ±1 standard error.
evel observed in N0. All the mixtures, particularly B75V25, showedscarce effect on the maize N status (Fig. 6).
Processing tomato responded more positively to the cover cropsn terms of N status (Fig. 6). When grown after V100, process-ng tomato could find optimal N conditions during the whole cropycle and it was rarely found to be significantly above the critical Nilution curve. Thus, V100 was found to be a more suitable fertili-ation strategy than N200, which produced a continuous luxury N
onsumption. Otherwise, pure barley resulted in an inadequate Ntatus of processing tomato, similar to N0. The mixtures betweenarley and vetch gave a different effect on N nutritional status ofig. 5. CO2 efflux from the soil expressed as the difference with the CO2 flux in the connto the soil, DAI). �CO2 was recorded in 2006 and 2007 after the incorporation of barleyB50V50). Black arrows indicate the time of maize sowing and processing tomato transpl
(B + V) during the growing cycles in 2006 and 2007 (see Fig. 2 for the treatment
tomato and, while this cash crop was close to the critical curvewhen grown after B25V75, it was in sub-optimal conditions afterB75V25. After B50V50 the N status of tomato was intermediate(Fig. 6).
Pure barley led to the lowest Neff, showing even negativevalues in 2007, while pure vetch showed the highest Neff, espe-cially in 2007. Mixtures showed intermediate Neff in both cashcrops, in close agreement with the proportion of vetch within
the aboveground biomass of cover crops (Fig. 7). Nevertheless,when processing tomato was grown after the mixtures, it showedNeff values consistently higher than maize. Furthermore, thesetrol treatment N0 (�CO2, �mol CO2 m−2 s−1) over time (Days After Incorporationand hairy vetch in pure stands (B100 and V100, respectively) and in 50:50 mixtureanting. Bars indicate ±1 standard error.

142 G. Tosti et al. / Europ. J. Agronomy 43 (2012) 136–146
Fig. 6. N concentration (% on dry aboveground biomass) vs. aboveground biomass accumulation (Mg ha−1) observed in maize and processing tomato in 2006 (closed symbols)a trols (f or proh
di
ateTep
Fi
nd 2007 (open symbols). Maize and processing tomato were cultivated both in conor the treatment abbreviations). The curves represent the critical N concentration forizontal bars indicate ±1 standard error.
ifferences between the two cash crops were much more evidentn 2007 as compared to 2006.
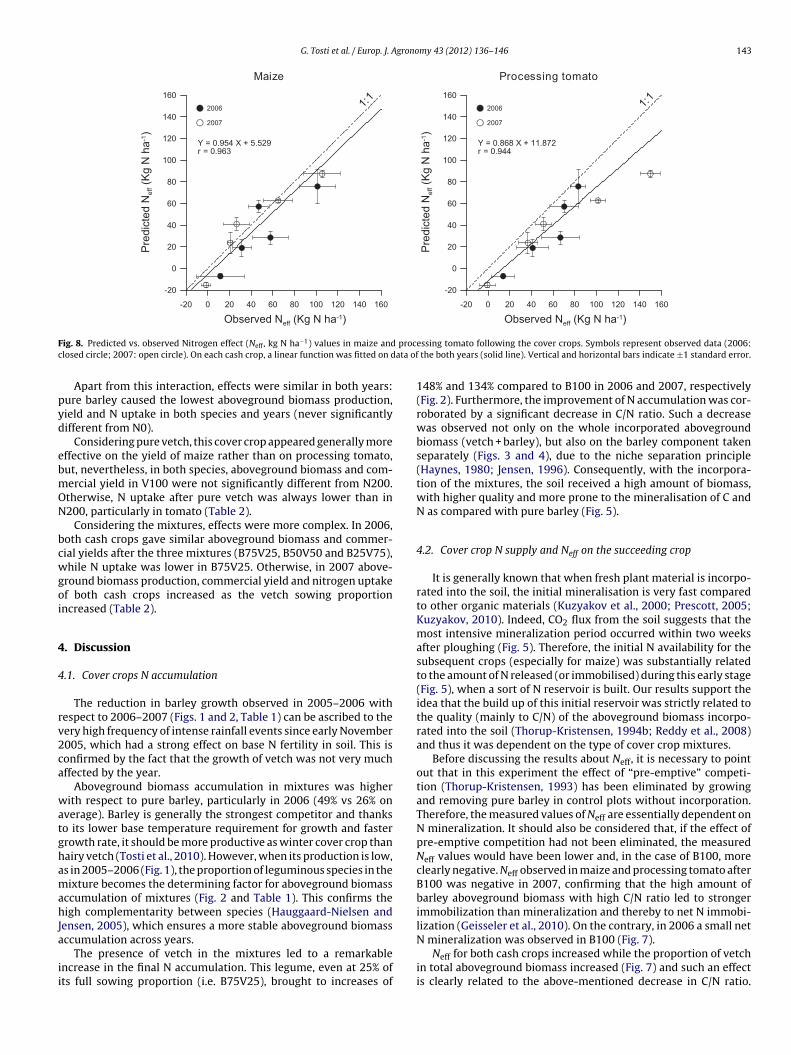
The mean values of Neff calculated across both years for maizend tomato were compared to the predicted values obtained fromhe model proposed by Thorup-Kristensen (1994b) for the N min-
ralization from plant material incorporated into the soil (Eq. (2)).he model predicted the observed values quite well, even if a gen-ral underestimation of the observations was found, especially withrocessing tomato (Fig. 8).ig. 7. Nitrogen effect (kg ha−1) observed in 2006 and 2007 in maize and processing toms calculated as the difference in main crop N uptake after the cover crop treatments and
low and high N fertility, N0 and N200 respectively) and after cover crops (see Fig. 2cessing tomato (Tei et al., 2002) and maize (Plénet and Lemaire, 2000). Vertical and
Aboveground biomass production, commercial yield and Nuptake of maize and processing tomato were always significantlyinfluenced by the experimental treatments (preceding cover cropsand controls, Table 2) and only aboveground biomass productionshowed a significant ‘treatment by year’ interaction, explained
by a very high aboveground biomass production with both cashcrops (particularly maize) in 2007, when preceded by mineral fer-tilisation or cover crops with high vetch proportion (V100 andB25V75).ato following cover crops (see Fig. 2 for the treatment abbreviations). The N effectthe N0 control treatment (Eq. (1)). Bars indicate ±1 standard error.
G. Tosti et al. / Europ. J. Agronomy 43 (2012) 136–146 143
F procc ata of
pyd
ebmON
bcwgoi
4
4
rv2ca
watghamahJa
ii
ig. 8. Predicted vs. observed Nitrogen effect (Neff , kg N ha−1) values in maize andlosed circle; 2007: open circle). On each cash crop, a linear function was fitted on d
Apart from this interaction, effects were similar in both years:ure barley caused the lowest aboveground biomass production,ield and N uptake in both species and years (never significantlyifferent from N0).
Considering pure vetch, this cover crop appeared generally moreffective on the yield of maize rather than on processing tomato,ut, nevertheless, in both species, aboveground biomass and com-ercial yield in V100 were not significantly different from N200.therwise, N uptake after pure vetch was always lower than in200, particularly in tomato (Table 2).
Considering the mixtures, effects were more complex. In 2006,oth cash crops gave similar aboveground biomass and commer-ial yields after the three mixtures (B75V25, B50V50 and B25V75),hile N uptake was lower in B75V25. Otherwise, in 2007 above-
round biomass production, commercial yield and nitrogen uptakef both cash crops increased as the vetch sowing proportionncreased (Table 2).
. Discussion
.1. Cover crops N accumulation
The reduction in barley growth observed in 2005–2006 withespect to 2006–2007 (Figs. 1 and 2, Table 1) can be ascribed to theery high frequency of intense rainfall events since early November005, which had a strong effect on base N fertility in soil. This isonfirmed by the fact that the growth of vetch was not very muchffected by the year.
Aboveground biomass accumulation in mixtures was higherith respect to pure barley, particularly in 2006 (49% vs 26% on
verage). Barley is generally the strongest competitor and thankso its lower base temperature requirement for growth and fasterrowth rate, it should be more productive as winter cover crop thanairy vetch (Tosti et al., 2010). However, when its production is low,s in 2005–2006 (Fig. 1), the proportion of leguminous species in theixture becomes the determining factor for aboveground biomass
ccumulation of mixtures (Fig. 2 and Table 1). This confirms theigh complementarity between species (Hauggaard-Nielsen and
ensen, 2005), which ensures a more stable aboveground biomass
ccumulation across years.The presence of vetch in the mixtures led to a remarkablencrease in the final N accumulation. This legume, even at 25% ofts full sowing proportion (i.e. B75V25), brought to increases of
essing tomato following the cover crops. Symbols represent observed data (2006:the both years (solid line). Vertical and horizontal bars indicate ±1 standard error.
148% and 134% compared to B100 in 2006 and 2007, respectively(Fig. 2). Furthermore, the improvement of N accumulation was cor-roborated by a significant decrease in C/N ratio. Such a decreasewas observed not only on the whole incorporated abovegroundbiomass (vetch + barley), but also on the barley component takenseparately (Figs. 3 and 4), due to the niche separation principle(Haynes, 1980; Jensen, 1996). Consequently, with the incorpora-tion of the mixtures, the soil received a high amount of biomass,with higher quality and more prone to the mineralisation of C andN as compared with pure barley (Fig. 5).
4.2. Cover crop N supply and Neff on the succeeding crop
It is generally known that when fresh plant material is incorpo-rated into the soil, the initial mineralisation is very fast comparedto other organic materials (Kuzyakov et al., 2000; Prescott, 2005;Kuzyakov, 2010). Indeed, CO2 flux from the soil suggests that themost intensive mineralization period occurred within two weeksafter ploughing (Fig. 5). Therefore, the initial N availability for thesubsequent crops (especially for maize) was substantially relatedto the amount of N released (or immobilised) during this early stage(Fig. 5), when a sort of N reservoir is built. Our results support theidea that the build up of this initial reservoir was strictly related tothe quality (mainly to C/N) of the aboveground biomass incorpo-rated into the soil (Thorup-Kristensen, 1994b; Reddy et al., 2008)and thus it was dependent on the type of cover crop mixtures.
Before discussing the results about Neff, it is necessary to pointout that in this experiment the effect of “pre-emptive” competi-tion (Thorup-Kristensen, 1993) has been eliminated by growingand removing pure barley in control plots without incorporation.Therefore, the measured values of Neff are essentially dependent onN mineralization. It should also be considered that, if the effect ofpre-emptive competition had not been eliminated, the measuredNeff values would have been lower and, in the case of B100, moreclearly negative. Neff observed in maize and processing tomato afterB100 was negative in 2007, confirming that the high amount ofbarley aboveground biomass with high C/N ratio led to strongerimmobilization than mineralization and thereby to net N immobi-lization (Geisseler et al., 2010). On the contrary, in 2006 a small net
N mineralization was observed in B100 (Fig. 7).Neff for both cash crops increased while the proportion of vetchin total aboveground biomass increased (Fig. 7) and such an effectis clearly related to the above-mentioned decrease in C/N ratio.

144 G. Tosti et al. / Europ. J. Agronomy 43 (2012) 136–146
Table 2Dry weight accumulation (Mg ha−1), yield (Mg ha−1) and N accumulation (kg ha−1) at harvest in maize and processing tomato in 2006 and 2007 (see Fig. 2 for the treatmentabbreviations). Standard errors (in brackets) and results of the analysis of variance are also reported.
Maize Processing tomato
Aboveground biomass(Mg ha−1 of DM)
Grain yield(Mg ha−1 of DM)
N uptake (kg ha−1) Aboveground biomass(Mg ha−1 of DM)
Fruit yield(Mg ha−1 of DM)
N uptake (kg ha−1)
2006 B100 16.0 (2.35) 8.0 (1.36) 131.8 (22.31) 8.5 (0.52) 5.2 (0.38) 162.5 (10.94)B75V25 21.1 (1.43) 10.3 (0.95) 151.7 (8.48) 9.8 (0.55) 5.9 (0.42) 189.8 (14.57)B50V50 19.8 (1.72) 9.3 (1.16) 178.1 (16.96) 10.6 (1.05) 5.9 (0.36) 215.4 (17.61)B25V75 20.8 (1.29) 9.9 (0.29) 167.3 (9.68) 10.9 (0.44) 6.5 (0.29) 219.0 (13.35)V100 20.9 (1.12) 11.0 (0.63) 221.5 (16.47) 10.5 (0.3) 6.1 (0.18) 231.9 (6.83)N200 22.1 (1.83) 12.2 (0.71) 259.8 (22.07) 11.2 (0.46) 6.2 (0.19) 313.3 (16.79)N0 16.5 (0.67) 8.1 (0.39) 120.2 (7.83) 8.5 (0.52) 4.9 (0.40) 148.6 (7.09)Mean 19.6 9.8 175.8 10.0 5.8 211.5
2007 B100 16.2 (0.59) 7.2 (0.37) 100.2 (4.30) 6.6 (0.27) 3.4 (0.19) 124.1 (7.66)B75V25 21.3 (0.32) 8.5 (0.09) 122.7 (2.30) 8.7 (0.26) 4.5 (0.18) 161.6 (8.54)B50V50 21.2 (0.66) 9.2 (0.41) 128.5 (11.84) 9.5 (0.23) 5.2 (0.06) 175.8 (7.64)B25V75 25.0 (0.88) 10.4 (0.20) 166.7 (13.18) 11.5 (1.03) 6.2 (0.71) 226.3 (7.23)V100 28.0 (0.33) 11.9 (0.26) 207.3 (17.44) 12.4 (0.73) 5.8 (0.54) 274.6 (9.40)N200 31.5 (3.59) 12.4 (0.56) 231.2 (14.09) 12.6 (0.69) 5.8 (0.15) 301.1 (29.99)N0 15.6 (1.28) 7.2 (0.84) 101.8 (10.65) 6.9 (0.34) 3.3 (0.29) 124.8 (9.83)Mean 22.7 9.5 151.2 9.8 4.9 198.3
Treatment (T) *** *** *** *** *** ***Year (Y) ** ns ** ns *** nsT × Y * ns ns * ns ns
***: Significantly different at P < 0.001**n
IrtopbiViiiuicbtpc
4
ttiN
TP(a
*: Significantly different at P < 0.01: Significantly different at P < 0.05s: not significant
ndeed, the main mineralisation effect of the cover crop could beeasonably well predicted, based on its quality, i.e. on C and N con-ent in its aboveground biomass (Fig. 8). In order to get an insightf what the effect would be when changing the incorporation date,redictions were made also by using the observed abovegroundiomass quality at two earlier dates, with respect to the actual
ncorporation dates (Table 3). These predictions showed that Neff in100 and all ‘barley + vetch’ mixtures should decrease when antic-
pating aboveground biomass incorporation, while the behaviourn B100 should be opposite. This seems to suggest that the optimalncorporation date depends on the type of the cover crop. Moreover,sing ‘barley + vetch’ mixtures might allow for longer growth dur-
ng the spring without hindering Neff (Table 3). From our results, wean argue that maize would have probably been more influencedy this delay than processing tomato. Finally, the N supply for bothhe cash crops was clearly modulated by the different barley/vetchroportions of the cover crops, that also influenced the C/N andonsequently the Neff (Fig. 8 and Table 3).
.3. N status and yield of maize and processing tomato
Comparing the N status of the cash crops to the critical N dilu-
ion curves, confirmed the better response of processing tomato tohe mixtures (especially to B25V75) as compared to maize. Maize,n fact, represents a very high N-demanding crop, so its optimalstatus was only reached when it was fertilised with synthetic
able 3redicted nitrogen effect (kg N ha−1) of the cover crops calculated (Eq. (2)) at the actual d166 DAS in 2006, 158 DAS in 2007) and at two potential earlier incorporation dates (1bbreviations. Standard errors are reported in brackets.
DAS 2006
138 152 166
B100 −2.48 (1.368) −4.49 (0.485) −7.22 (1.828)B75V25 6.89 (1.578) 4.39 (0.812) 18.86 (5.372)B50V50 10.97 (1.204) 15.30 (4.198) 28.44 (4.228)B25V75 19.94 (0.838) 24.14 (1.737) 57.05 (3.952)V100 26.03 (2.114) 30.04 (3.419) 75.59 (11.089)
N (N200). Thereby, the Neff of the different cover crops (especiallythose with high barley proportions) brought tomato much closerto the critical N value than they did with maize. Pure vetch didmeet the N requirement of maize only in 2006, while it perfectlysatisfied the N demand of processing tomato in both years (Fig. 6).Maize sowing usually precedes processing tomato transplantingof approximately 20 days; therefore less time is left for N min-eralization before crop establishment. Furthermore, toxic and/orallelopathic compounds released from the decomposing biomasshave not been taken into account in this study, but they couldhave also provoked some kind of negative effect on maize growth,particularly during the early phase (Hill et al., 2007).
As observed, in the considered pedoclimatic conditions the Nimmobilization was higher than the mineralization from the bar-ley aboveground biomass leading to a small net N release in 2006,while in 2007 the N accumulated in the pure barley tissues wasnot available for the cash crop (Neff ≈ 0). The timing of the releaseprocess was mainly influenced by C/N, rather than by the total Ncontent of the cover crops aboveground biomass. Even if the nonfertilised control supplied an extremely low amount of N to thecash crops, the effect of pure barley on the N status of both tomatoand maize was even worse. The quality of cover crop aboveground
biomass showed a clear effect on the N availability for the subse-quent crop, but, differently from maize, the Neff values observedin tomato were constantly higher than the predicted ones (Fig. 8).This finding suggests that the basis of the relationship betweenate (time expressed as Days After Sowing, DAS) of their incorporation into the soil38 and 152 DAS in 2006, 124 and 139 DAS in 2007). See Fig. 2 for the treatment
DAS 2007
124 139 158
4.96 (0.641) −1.30 (0.785) −15.34 (1.937)15.83 (0.830) 12.74 (2.445) 23.56 (6.824)21.58 (2.011) 26.27 (2.845) 41.01 (4.355)26.01 (1.631) 51.97 (3.806) 62.53 (1.059)39.77 (3.755) 72.62 (2.758) 87.30 (2.444)

grono
cab
cto(msgta
5
•
•
•
•
A
tSFm
R
A
B
B
C
C
C
C
G. Tosti et al. / Europ. J. A
over crop C/N and Neff was well-founded, even though the char-cteristics of the subsequent crop may play a role and should alsoe taken into account.
The effect of the cover crops on yield was quite similar for bothash crops. Amongst all the cover crop treatments, V100 allowedhe best yield in maize, while the effect of B25V75 on the yieldf processing tomato was better than that observed in pure vetchTable 3). The total N supplied by B25V75, and the C/N of this
ixture allowed a very good development of the photosynthetictructures of the crop, and, on the other hand, an optimal homo-eneity and better synchrony in the ripening of the processingomato fruits (i.e. less unmarketable fruits). These results led tobetter yield as compared to V100 or even to N200 (Table 2).
. Conclusions
Using mixtures proved to be a very effective strategy for themanagement of winter cover crops, because barley and vetchcomplement each other very well, as the grass is capable of highgrowth rates during the cold season, while vetch becomes veryimportant in spring, when N becomes the limiting factor. Chang-ing the proportion of species within the mixture can be a keyfactor to adjust the extent and timing of N mineralisation to thenutritional requirements of the following crop.Likewise, changing the above proportion can be very importantto ensure a good quality of the incorporated biomass (with par-ticular reference to C/N ratio), which is fundamental for a goodinitial growth and N status of the subsequent cash crop.Aboveground biomass quality is central to predict its Neff on thesubsequent crop. Therefore, the implementation of simple mod-els for such a prediction appears to be a useful approach, eventhough our findings suggest that it may be important to consideralso the characteristics of the following cash crop.The adoption of mixtures in the optimization of the “cover cropstrategy” should be considered in order to improve the N useefficiency. In particular, the potential applications of cover cropmixtures for the mitigation of environmental risks caused by Nleaching need to be better investigated, especially in the Mediter-ranean environment.
cknowledgments
Authors would like to thank Mr. Rossano Cortona for his skilledechnical assistance and all the technicians at the Experimentaltation of Papiano for their invaluable help with the field work.inally, we thank Dr. Andrea Onofri for his critical revision of theanuscript. Research funded by the FISR SIMBIO-VEG (2005-08).
eferences
llen, R.G., Pereira, L.S., Raes, D., Smith, M., 1998. Crop evapotranspiration. Guide-lines for computing crop water requirements. FAO Irrigation and Drainage Paper56. FAO, Rome, Italy.
ardgett, R.D., Wardle, D.A., 2010. Aboveground-Belowground Linkages: BioticInteractions, Ecosystem Processes, and Global Change. Oxford University Press.
enincasa, P., Tosti, G., Tei, F., Guiducci, M., 2010. Actual N availability from wintercatch crops used for green manuring in maize cultivation. Journal of SustainableAgriculture 34, 705–723.
ampiglia, E., Caporali, F., Radicetti, E., Mancinelli, R., 2010. Hairy vetch (Vicia villosaRoth) cover crop residue management for improving weed control and yield inno-tillage tomato (Lycopersicon esculentum Mill.) production. European Journalof Agronomy 33, 94–102.
aporali, F., Campiglia, E., Mancinelli, R., Paolini, R., 2004. Maize performances asinfluenced by winter cover crop green manuring. Italian Journal of Agronomy 8,37–45.
azzato, E., Annese, V., Corleto, A., 2003. N2 fixation of annual fodder legumes inMediterranean environment. 1. Estimation of N2 fixation by isotope dilution.Rivista di Agronomia 37, 57–61.
onnolly, J., 1986. On difficulties with replacement-series methodology in mixtureexperiments. Journal of Applied Ecology 23, 125–137.
my 43 (2012) 136–146 145
Constantin, J., Beaudoin, N., Laurent, F., Cohan, J.P., Duyme, F., Mary, B., 2011. Cumu-lative effects of catch crops on nitrogen uptake, leaching and net mineralization.Plant Soil 341, 137–154.
Crews, T.E., Peoples, M.B., 2005. Can the synchrony of nitrogen supply and cropdemand be improved in legume and fertilizer-based agroecosystems? A review.Nutrient Cycling in Agroecosystems 72, 101–120.
de Wit, C.T., van den Bergh, J.P., 1965. Competition between herbage plants.Netherlands Journal of Agricultural Science 13, 212–221.
Fan, F., Zhang, F., Song, Y., Sun, J., Bao, X., Guo, T., Li, L., 2006. Nitrogen fixationof faba bean (Vicia faba L.) interacting with a non-legume in two contrastingintercropping systems. Plant Soil 283, 275–286.
Gabriel, J.L., Quemada, M., 2011. Replacing bare fallow with cover crops in a maizecropping system: yield, N uptake and fertiliser fate. European Journal of Agron-omy 34, 133–143.
Geisseler, D., Horwath, W.R., Joergensen, R.G., Ludwig, B., 2010. Pathways of nitrogenutilization by soil microorganisms – a review. Soil Biology & Biochemistry 42,2058–2067.
Hauggaard-Nielsen, H., Jensen, E.S., 2005. Facilitative root interactions in intercrops.Plant Soil 274, 237–250.
Haynes, R.J., 1980. Competitive aspects of the grass-legume association. Advancesin Agronomy 33, 227–261.
Hill, E.C., Ngouajio, M., Nair, M.G., 2007. Allelopathic potential of Hairy Vetch (ViciaVillosa) and Cowpea (Vigna Unguiculata) methanol and ethyl acetate extracts onweeds and vegetables. Weed Technology 21, 437–444.
Isaac, R.A., Johnson, W.C., 1976. Determination of total nitrogen in plant tissue, usinga block digestor. Journal of AOAC 59, 98–100.
Jensen, E.S., 1996. Grain yield, symbiotic N2 fixation and interspecific competitionfor inorganic N in pea-barley intercrops. Plant Soil 182, 25–38.
Kramberger, B., Gselman, A., Janzekovic, M., Kaligaric, M., Bracko, B., 2009. Effects ofcover crops on soil mineral nitrogen and on the yield and nitrogen content ofmaize. European Journal of Agronomy 31, 103–109.
Kuzyakov, Y., 2006. Sources of CO2 efflux from soil and review of partitioning meth-ods. Soil Biology & Biochemistry 38, 425–448.
Kuzyakov, Y., 2010. Priming effects interactions between living and dead organicmatter. Soil Biology & Biochemistry 42, 1363–1371.
Kuzyakov, Y., Friedel, J.K., Stahr, K., 2000. Review of mechanisms and quantificationof priming effects. Soil Biology & Biochemistry 32, 1485–1498.
Lampkin, N., 1990. Organic Farming. Farming Press, Ipswich (UK).Ledgard, S.F., Giller, K.E., 1995. Atmospheric N2 fixation as an alternative N source.
In: Bacon, P.E. (Ed.), Nitrogen Fertilization in the Environment. Marcel DekkerInc., New York, pp. 443–486.
Macdonald, A.J., Poulton, P.R., Howe, M.T., Goulding, K.W.T., Powlson, D.S., 2005. Theuse of cover crops in cereal-based cropping systems to control nitrate leachingin SE England. Plant and Soil 273, 355–373.
Myers, R.J.K., Palm, C.A., Cuevas, E., Gunatilleke, I.U.N., Brossard, M., 1994. The syn-chronisation of nutrient mineralisation and plant nutrient demand. In: Woomer,P.L., Swift, M.J. (Eds.), The Biological Management of Tropical soil Fertility. JohnWiley & Sons, Chichester (UK), pp. 81–116.
Ofori, F., Stern, W.R., 1987. Cereal-legume intercropping systems. Advances inAgronomy 41, 41–90.
Peoples, M.B., Herridge, D.F., Ladha, J.K., 1995. Biological nitrogen fixation: an effi-cient source of nitrogen for sustainable agricultural production? Plant and Soil174, 3–28.
Plénet, D., Lemaire, G., 2000. Relationship between dynamics of nitrogen uptake anddry matter accumulation in maize crops. Determination of critical N concentra-tion. Plant and Soil 216, 65–82.
Prescott, C.E., 2005. Decomposition and mineralization of nutrients from litter andhumus. In: BassiriRad, H. (Ed.), Nutrient Acquisition by Plants. Springer-Verlag,Berlin/Heidelberg, pp. 15–41.
Quemada, M., 2004. Predicting crop residue decomposition using moisture adjustedtime scales. Nutrient Cycling in Agroecosystems 70, 283–291.
R Development Core Team. 2009. R: A language and environment for statisticalcomputing. R Foundation for Statistical Computing, Vienna, Austria. ISBN 3-900051-07-0, URL http://www.R-project.org.
Ranells, N.N., Wagger, M.G., 1997. Grass-legume bicultures as winter annual covercrops. Agronomy Journal 89, 659–665.
Reddy, K.S., Mohanty, M., Rao, D.L.N., Singh, M., Dalal, R.C., Rao, A.S., Pandey, M.,Menzies, N., 2008. Nitrogen mineralization in a vertisol from organic manures,green manures and crop residues in relation to their quality. Agrochimica 52,377–388.
Salmeron, M., Isla, R., Cavero, J., 2011. Effect of winter cover crop species and plant-ing methods on maize yield and N availability under irrigated Mediterraneanconditions. Field Crops Research 123, 89–99.
Stockdale, E.A., Shepherd, M.A., Fortune, S., Cuttle, S.P., 2002. Soil fertility inorganic farming systems – fundamentally different? Soil Use Management 18,301–308.
Teasdale, J.R., Abdul-Baki, A.A., Park, Y.B., 2008. Sweet corn production and effi-ciency of nitrogen use in high cover crop residue. Agronomy for SustainableDevelopment 28, 559–565.
Tei, F., Benincasa, P., Guiducci, M., 2002. Critical nitrogen concentration in processingtomato. European Journal of Agronomy 18, 45–55.
Thorup-Kristensen, K., 1993. The effect of nitrogen catch crops on the nitrogennutrition of a succeeding crop. Effects through mineralization and pre-emptivecompetition. Acta Agriculturæ Scandinavica 43, 74–81.
Thorup-Kristensen, K., 1994a. The effect of nitrogen catch crop species on the nitro-gen nutrition of succeeding crops. Fertility Research 37, 227–234.

1 grono
T
T
T
46 G. Tosti et al. / Europ. J. A
horup-Kristensen, K., 1994b. An easy pot incubation method for measuring nitro-gen mineralization from easily decomposable organic material under welldefined conditions. Fertility Research 38, 239–247.
horup-Kristensen, K., Nielsen, N.E., 1998. Modelling and measuring the effect of
nitrogen catch crops on the nitrogen supply for succeeding crops. Plant and Soil203, 79–89.horup-Kristensen, K., Magid, J., Jensen, L.S., 2003. Catch crops and green manuresas biological tools in nitrogen management in temperate zones. Advances inAgronomy 79, 227–302.
my 43 (2012) 136–146
Tosti, G., Benincasa, P., Guiducci, M., 2010. Competition and facilitation in hairyvetch-barley intercrops. Italian Journal of Agronomy 3, 239–247.
van Kessel, C., Hartley, C., 2000. Agricultural management of grain legumes: has itled to an increase in nitrogen fixation? Field Crops Research 65, 165–181.
Vos, J., Van der Putten, P.E.L., 1997. Field observations on nitrogen catch crops. I.Potential and actual growth and nitrogen accumulation in relation to sowingdate and crop species. Plant and Soil 195, 299–309.
Vos, J., Van der Putten, P.E.L., 2001. Field observations on nitrogen catch crops. III.Transfer of nitrogen to the succeeding main crop. Plant and Soil 236, 263–273.