current bioinformatics , 2011, 323-343 323 mathematical...
TRANSCRIPT

Current Bioinformatics, 2011, 6, 323-343 323
1574-8936/11 $58.00+.00 © 2011 Bentham Science Publishers
Mathematical Models and Numerical Schemes for the Simulation of Human Phonation
Fariborz Alipour1, Christoph Brücker
2, Douglas D. Cook
3, Andreas Gömmel
4, Manfred Kaltenbacher
5,
Willy Mattheus2, Luc Mongeau
6, Eric Nauman
7, Rüdiger Schwarze
2, Isao Tokuda
8 and
Stefan Zörner*,5
1The University of Iowa, National Center for Voice and Speech, Salt Lake City, UT 84101-1623, USA;
2Institute of
Mechanics and Fluid Dynamic, TU Bergakademie Freiberg, Lampadiusstraße 2, 09599 Freiberg, Germany; 3Mechanical/Biomechanical Engineering, New York University, Abu Dhabi, 6 MetroTech Center, Brooklyn, NY 11201;
4RWTH Aachen University, Mies-van-der-Rohe-Straße 1, 52074 Aachen, Germany;
5Alps-Adriatic University
Klagenfurt, Lakeside park Gebäude B04a, 9020 Klagenfurt, Austria; 6Department of Mechanical Engineering,
Macdonald Engineering Bui, Sherbrooke Street West, H3A 2K6 Montreal, Quebec, Canada; 7Purdue University, School
of Mechanical Engineering, Weldon School of Biomedical Engineering, West Lafayette, IN 47907; 8Graduate School of
Information Science, Japan Advanced Institute of Science and Technology, Nomi-city, Ishikawa 923-1292, Japan
Abstract: Acoustic data has long been harvested in fundamental voice investigations since it is easily obtained using a
microphone. However, acoustic signals alone do not reveal much about the complex interplay between sound waves,
structural surface waves, mechanical vibrations, and fluid flow involved in phonation. Available high speed imaging
techniques have over the past ten years provided a wealth of information about the mechanical deformation of the superior
surface of the larynx during phonation. Time-resolved images of the inner structure of the deformable soft tissues are not
yet feasible because of low temporal resolution (MRI and ultrasound) and x-ray dose-related hazards (CT and standard x-
ray). One possible approach to circumvent these challenges is to use mathematical models that reproduce observable
behavior such as phonation frequency, closed quotient, onset pressure, jitter, shimmer, radiated sound pressure, and
airflow. Mathematical models of phonation range in complexity from systems with relatively small degrees of freedom
(multi-mass models) to models based on partial differential equations (PDEs) mostly solved by finite element (FE)
methods resulting in millions of degrees-of-freedom.
We will provide an overview about the current state of mathematical models for the human phonation process, since they
have served as valuable tools for providing insight into the basic mechanisms of phonation and may eventually be of
sufficient detail and accuracy to allow surgical planning, diagnostics, and rehabilitation evaluations on an individual basis.
Furthermore, we will also critically discuss these models w.r.t. the used geometry, boundary conditions, material
properties, their verification, and reproducibility.
Keywords: Human phonation, multi-mass models, models based on partial differential equations.
1. INTRODUCTION
The human phonation process is a complex interaction
between the flow through the larynx, the vibrating vocal
folds and the generated sound. By compression of the lungs
air flow is generated which flows through the glottis being
located inside the trachea. Air flow is a major mechanism of
energy transport between exhaling air and vocal fold motion
inside the larynx. When physiologic and geometric
conditions are right, self-oscillation of the vocal folds
initiates a pulsating air flow. Fig. (1) shows a frontal cut
through the larynx displaying in Fig. (1a) the anatomical
components and illustrating in Fig. (1b) the sound sources
that exist in phonation. Basically, we differentiate between
*Address correspondence to this author at the Applied Mechatronics, Alps-
Adriatic University Klagenfurt, Lakesidepark Gebäude B04a, 9020
Klagenfurt, Austria; Tel: +43 (0)463 2700 3563;
Fax: +43 (0)463 2700 3698; E-mail: [email protected]
three sources: the volume-induced sound (mono-pol sources)
due to the modulated flow resulting from the self-sustained
oscillation of the vocal folds, the eddy-induced sound
(quadrupole sources) which emerges from turbulent flow
structures, and the sound from the vibrating vocal folds
(dipole sources).
Empirical studies of laryngeal flows have often been
used to estimate pressure and velocity distributions within
the glottis. However, due to space limitation of the larynx,
the measurable variables are quite limited and many
important flow phenomena are difficult to obtain. One
alternative is to use the numerical simulations that provide
more detailed information about the flow field and pressure
distributions. The complexity of the problem restricts
computational simulation approaches. One classical and very
popular approach to the study of voice production is to
construct a multi-mass model of the vocal fold vibrations.
Depending upon the number of masses, the model may
represent simple low-dimensional self-sustained oscillations

324 Current Bioinformatics, 2011, Vol. 6, No. 3 Alipour et al.
of the vocal folds (see, e.g., [1]) or more complex vibrations
with many oscillatory modes (see, e.g., [2-4]). The second
approach consists in models based on the underlying partial
differential equations (PDEs) of the flow, the structural
vibrations of the vocal folds and the acoustic field. Due to
limitations in computer resources, full coupling between all
three fields for realistic geometries is currently not feasible.
This review will present various models and their solution
methods (see, e.g., [5-10]).
The aim of the review article is to provide an overview of
mathematical models and their applications. Therewith, we
will describe the different models used in Sec. 2 and in Sec.
3 the results of these approaches. Finally, we will provide a
discussion about the models with respect to the used
geometry, boundary conditions, material properties, their
verification, and reproducibility.
2. MATHEMATICAL MODELS OF HUMAN
PHONATION
2.1. Multi-Mass Models
The key idea of the multi-mass model is to divide the
vocal fold tissue into small portions of masses and then
couple the neighboring masses via springs. Flanagan and
Landgraf [1] modeled the vocal fold vibrations with a single
mass-spring oscillator driven by airflow from the lungs (see
Fig. 2a). The model produced self-sustained oscillations
under the condition that the acoustic impedance of the vocal
tract is inertive. Because of its single degree of freedom, this
A
B
Fig. (1). Frontal cut through the larynx showing the anatomical constitution and the different sound sources. (a) [One-mass model of
Flanagan and Landgraf (1968).]. (b) [Two-mass model of Ishizaka and Flanagan (1972).]. (c) [Three-mass model of Story and Titze (1995).].
(d) [L � M � N point mass model of Titze (1973, 1974).]

Mathematical Models and Numerical Schemes Current Bioinformatics, 2011, Vol. 6, No. 3 325
model does not produce the vertical phase difference needed
for efficient flow-induced oscillation. Ishizaka and Flanagan
[11] introduced a two-mass model that simulates the core
mechanism of the vocal fold vibrations such as the phase
shift of lower and upper edges of the vocal folds introduced
by Stevens [12] (see Fig. 2b). The resulting wave-like
motion allows an efficient energy transfer from the airflow
to the vibrating vocal folds [13], enabling self-sustained
oscillations with or without the vocal tract. This model has
been widely used as a simple reduced order model of the
vocal folds. Asymmetry between the right and left vocal
folds was later introduced by Ishizaka and Isshiki [14] into
the two-mass model to study various pathologies. Steineke
and Herzel [15] simplified the asymmetric two-mass model
of Ishizaka and Isshiki to study nonlinear dynamics and
bifurcations of the vocal fold model. Döllinger et al. [16]
developed a method to estimate the parameter values of the
Steineke-Herzel model that may correspond to endoscopic
image series of the vocal folds. Despite its simplicity and
efficiency, the weakness of the two-mass model is its lack of
direct physiological correlation between the spring stiffness
and the effects of muscle contraction. To better link the
model to physiology, Story and Titze [17] introduced a
three-mass model close based on the body-cover theory of
Hirano [18,19]. Parameter values may be in close
correspondence to physiological measurements. Titze and
Story [20] further developed rules for controlling the
parameters of the three-mass model according to muscle
activity, which successfully reproduce Hirano's four baseline
phonations cases [18]. Adachi and Yu [21] introduced a one-
mass model that can vibrate both parallel and perpendicular
to the airflow and applied it to soprano singing. The idea of a
smooth borderline between the edges of the vocal fold was
introduced by Childers [22] to a one-mass model, which
simulates voice pathologies as well as vocal fry. Lous et al.
[23] also utilized a smooth geometry in the two-mass model,
and applied it to prosthesis design.
Another important approach to the multi-mass modeling
of the vocal folds has been provided by the mucosal wave
model [13]. This model assumes small-amplitude
oscillations of the vocal folds and represents the oscillatory
motion as a surface wave propagating in the direction of the
airflow. The dynamics are described only in terms of the
displacement of the midpoint position of the vocal fold and
its velocity. This simplification enables analytical treatment
for understanding the basic principles of the vocal folds
dynamics. Although the small-amplitude restriction means
that the model applies only to oscillations with slightly
abducted vocal folds without glottal closure, the model is
valid for falsetto and breathy voice and has been shown to be
useful for establishing the oscillation threshold condition
[13]. The model has been updated and extensively used in
analytical studies [24-27] as well as in full simulations of the
vocal folds [28,29].
The multi-mass models with limited degrees of freedom
such as one-mass, two-mass, and three-mass models are
reduced order models of the vocal folds. Extensions of the
simple models to more complex models have also been
made. Titze [2,30] represented both the vertical and
longitudinal modes of vocal fold vibrations with a sixteen-
mass model. This model consisted of eight coupled
longitudinal sections, each with two masses in the coronal
plane. The two-masses in each longitudinal section had a
vertical degree of freedom which simulated two-dimensional
trajectories of the vocal fold. Waves in the longitudinal
dimension may be also generated. Koizumi et al. [3]
described several variations of the simple two-mass model
with longitudinal discretization to synthesize more natural
sound. Wong et al. [31] combined the two-mass approach
with longitudinal discretization and created a ten-mass
model to study voice pathologies. Kob [4] modified the
sixteen-mass model [2] to simulate various singing voices. A
general formula for a L � M � N point mass model has
been described by Titze [32], where L is the number of
masses in the medio-lateral direction, M is the number of
masses in the anterior-posterior direction, and N is the
number of masses in the inferior-superior direction (see Fig.
2d).
Reduced order models capture the essence of the
vibration mechanisms, which is hidden in the complex
oscillation of the vocal folds. Since the number of model
parameters is limited, low-dimensional model results have a
weak dependence on parameter selection. Low-dimensional
models are also appropriate to study the nonlinear dynamics
[33] of vocal fold vibrations. Reduced order models are of
course limited in geometrical details and the number of
oscillatory modes which are present in the real vocal folds.
In contrast to low-dimensional models, the advantage of the
complex high-dimensional models is that they describe
anatomical and physiological structures of the real vocal
folds in detail. They produce the main oscillatory modes and
also many other complicated spatial-temporal modes, which
exist in real vocal folds. Such detailed models involves many
parameters, whose values are still not precisely known.
To describe the flow inside the glottis, a simple
mathematical model is usually preferred in multi-mass
modeling. Assuming a quasi-steady and incompressible
flow, Bernoulli’s equation is widely applied. For the
computation of the pressure distribution within the glottis, a
prior computation of the location of the flow-separation is
crucial. In particular, during the closing phase of the
phonatory cycle, the glottal walls take a diverging shape that
creates a flow-separation somewhere along the diverging
walls. Position of the flow-separation point has a strong
influence on the vocal folds oscillation, because it
determines not only the volume flow velocity but also the
aerodynamic force acting on the vocal fold tissues. The flow-
separation was also found to have a positive effect on the
lowering of the phonation threshold pressure, making it
easier to create self-oscillation of the vocal folds [34]. In
Ishizaka and Flanagan's model (1997), flow-separation was
located at vocal fold edges that are fixed in space. Then,
Pelorson et al. [35] introduced a model of moving flow-
separation point based on a boundary-layer theory and
applied it to a two-mass model. Introduction of the flow
model to compute the moving separation point made the
simulated signal quite similar to the real glottal signal. Later,

326 Current Bioinformatics, 2011, Vol. 6, No. 3 Alipour et al.
simplified technique for computing the moving flow-
separation point based on a geometric criterion has been also
developed [23]. Here the flow-separation is located at a
point, where the glottal area is related to the minimal glottal
area with a constant ratio, referred to as separation constant.
Although some discrepancy can be created between the
precise flow model and the simplified geometric model, the
geometric models are nonetheless found to be quite useful
for realistic simulation of the vocal folds and therefore
widely used [23,36].
A more sophisticated approach is presented by Tao and
Jiang [37], which combine the Navier-Stokes equations and
a two-mass model for the vocal folds and compare this to a
Bernoulli based approach.
2.2. PDE Based Models
The partial differential equation (PDE) based modeling
approach is aimed at resolving all physical details of the
phonation process in space and time. Therewith, the PDEs of
the flow, structural mechanics and acoustic fields with all
their relevant interactions have to be solved. As displayed in
Fig. (3) fluid forces act thereby on the neighboring vocal
folds, which are deformed and thereby influence the velocity
of the adhering fluid particles. Due to the solid deformation,
the fluid domain changes and has to be adapted. The fluid-
acoustics interactions are described by aeroacoustics (flow
induced sound) and the solid-acoustics coupling by claiming
coincident surface velocity (acceleration). However, due to
the enormous complexity, current PDE based approaches use
many simplifications. For most PDE based models, the finite
element (FE) method has been used to numerically solve the
arising PDEs, including their couplings.
A first continuum mechanical model was described by
Alipour et al. [5] using the FE method for the computation of
the vocal fold vibrations. In their 2D model the mechanical
field was discretized with finite elements and the fluid forces
(a) (b)
(c) (d)
Fig. (2). Schematic illustration of different multi-mass models.
�������
��� ��
����������
�
�
��
�
�
��
��
��
��
��
��
��
��
��
��
��
��
�������
��� ��
����������
��
��
��
��
��
��
��
��
����
��
��
��
��
��
��
��
��
�������
��� ��
����������
�������
��� ��
����������

Mathematical Models and Numerical Schemes Current Bioinformatics, 2011, Vol. 6, No. 3 327
were modeled based on Bernoulli's equation. A comparison
between a Bernoulli and a 2D Navier-Stokes solver was
discussed by Vries et al. [38] with a hemilarynx model (i.e.
half larynx). For a pure flow field simulation in the larynx,
several numerical models are available, e.g. [39-41].
Thomson et al. [42] used a hemilarynx continuum
mechanical model to clarify the causes for self-sustained
vocal fold oscillations. They confirmed that a cyclic
variation of the glottis profile from a convergent to a
divergent shape is a key factor for self-sustained vocal fold
oscillations. Tao et al. [6] applied a collision model with
fluid-solid interaction within a strongly coupled fluid-solid
algorithm to treat the interactions. Fully three dimensional
(3D) coupled simulations to analyze human phonation are
very challenging for current computing resources. A 3D
fluid-solid coupled model based on the FE method was done
by Rosa et al. [7]. The authors clearly demonstrate the self-
sustained vocal fold oscillations, although the grid for the
flow computation was quite coarse. The first fluid-solid
interaction model with fully resolved flow computation was
done by Luo et al. [43]. They used a realistic 2D setup and
applied the immersed boundary (IB) method for fluid-solid
interaction. Their results are quite similar to the one
presented by Link et al. [10], especially in that they were
also able to obtain the so-called Coanda effect ([44,45]).
Therewith, the jet shows significant asymmetry and attaches
stochastically to either side of the pharynx wall. This
phenomenon is caused by a minor asymmetry of the jet in
the geometrical configuration which induces a pressure field
leading to a curvature of the jet. The curved streamlines
strengthen the pressure gradient normal to the mean flow
direction. Thus any initial disturbance is reinforced forcing
the jet to attach to the curved wall.
Beside the fluid-solid interaction, the computation of
flow-induced sound is a second main challenge.
Aeroacoustic sound generation mechanisms have been
investigated by Zhao et al. and Zhang et al. [8,46,47]. They
described the aerodynamic generation of sound in a rigid
pipe under forced vibration. The fluid-solid interaction was
neglected and they focused on fluid-acoustic coupling based
on Lighthill's acoustic analogy, which was solved with an
integral method---the so-called Ffowcs Williams-Hawkins
(FWH) method [48]. The results based on the FWH method
were in good agreement with results based on direct
numerical simulations, which solves the compressible
Navier-Stokes equations. Further investigation have been
presented by Suh et al. [49]. Complementary to these
studies, a theoretical approach was proposed by Krane [50].
The acoustic source model was based on a prescribed jet
profile using a train of vortex rings and applied to an
axisymmetric model of the vocal tract. Bae and Moon [9]
applied a 2D axisymmetric model studying the flow and the
acoustics in the vocal tract with glottal motion. A hybrid
method was applied, describing the flow field via the
incompressible Navier-Stokes equations and computing the
acoustic field with the perturbed compressible equations.
Gloerfelt and Lafon [51] investigate the flow and the
acoustic field in a 3D slit-like constricted channel with a
DNS model. The channel geometry corresponded to a
simplified and up-scaled glottal constriction during
phonation. A fully coupled simulation scheme taking into
account the interaction between all three physical fields
restricted to 2D geometries was done by [10].
A major problem of PDE based models, which is
currently not fully solved, is to take contact between the
vocal folds into account. One of the first structural models
including contact used a setup of one vocal fold [5].
Therewith, each FE node of the surface of the vocal fold,
which reaches the symmetry plane, looses one degree of
freedom. Horácek et al. [52,53] used a low degree-of-
freedom model for the simulation of vocal fold oscillation.
Contact was implemented using a Hertz formulation. In their
study they calculated the maximum collision stress versus
prephonatory glottal gap width and lung pressure. They
obtained values around 2 3 kPa� . Rosa et al. and Tao et al.
[6,7] applied a full flow-structural mechanical model. Both
used a similar approach: When contact is detected, a force is
computed which prevents the concerning nodes from
Fig. (3). Fluid-Solid-Acoustic interactions.

328 Current Bioinformatics, 2011, Vol. 6, No. 3 Alipour et al.
interpenetration. Tao et al. [6] used the more extensive
Augmented Lagrangian method as contact algorithm in their
self-oscillating 3D half model. The major problem in fluid-
solid interaction computations using volume discretization
methods (such as the finite-volume or finite-element
method) is that the structural side has to ensure that there are
no zero-volume (3D) or zero-area (2D) elements. This is
achieved by enforcing a minimum gap between the vocal
folds by contact formulations. Decker et al. [54] defined a
minimal glottal gap of 0.048 mm in a 2D half-model. A
rigid target line is defined external from the vocal fold. Luo
et al. [43] ensured a gap of 0.2 mm by a kinematic
constraint in a 2D model, which uses the immersed boundary
(IB) method. In Zheng et al. [55] a sharp-interface immersed
boundary method flow solver is coupled to a finite-element
method solid dynamics solver for 2D and 3D problems.
Furthermore, a penalty coefficient method introduced by
Belytschko [56] is implemented to model vocal fold contact.
With a fixed pressure at the inlet of 1 kPa , 0 kPa at the
outlet and an additional zero gradient normal velocity at both
openings, results show a vibration frequency of 242 Hz
which can also be seen in the flow spectrum analyses. Based
on this method Seo et al. [57] implemented the acoustics in
2D and the sound propagation included the vocal tract and
the region around the speaker. With a given fluctuating inlet
flow rate they were able to simulate a monopole sound
source around the mouth and the propagation into the
surrounding region.
3. SIMULATION RESULTS FROM DIFFERENT
MODEL APPROACHES
3.1. Three-Mass Model
As an example of low-dimensional multi-mass model, a
three-mass model by Tokuda et al. [53] is considered in this
subsection. This model was constructed to replicate as
closely as possible the sudden chestfalsettotransitions and
accompanying voice instabilities, which were observed in
experiments with excised human larynges. Registers are one
of the most important voice qualities for classifying the type
of phonations and the transition between them is essential in
the singing voice. The careful study of van den Berg et al.
[54, 55] simulated chest and falsetto registers in excised
human larynx experiments, which has been recently repeated
by Horácek et al. [56]. The three-mass model was designed
to capture the gross features of this experiment.
The three-mass model was constructed by adding one
additional mass to the two-mass model [11] as shown in Fig.
(4a); note that the present three-mass configuration is
different from that of Story and Titze [17], who implemented
the body-cover structure in Fig. 2b). The three masses are
suitable for representing these coexistent vibratory patterns,
which may correspond to chest and falsetto registers [53].
The main modeling assumptions are (1) the three masses are
coupled by linear springs, (2) the air flow inside the glottis is
described by Bernoulli’s principle below the narrowest part
of the glottis [15], (3) there is no influence of the vocal tract
and the subglottal resonances (as in the experiment), and (4)
the left and the right vocal folds are symmetric with respect
to each other. The model equations are
Equation 1-3:
The dynamical variables xi represent the displacements
of the masses mi (lower mass: i = 1, middle mass: i = 2,
upper mass: i = 3), where the corresponding glottal areas are
given by prephonatory area, l:
length of the glottis). The constant parameters
represent damping, stiffness, and thickness of the masses mi,
respectively, whereas represents the coupling strength
between the two masses mi and mj . The effect of collision
between the right and left vocal folds is simply described as
an additional stiffness ci, which is to force the vocal folds
apart from each other (more precise modeling of the
collision impact is discussed, e.g., in [50]). The additional
stiffness ci is activated only when the corresponding glottal
area ai takes a negative value, where the collision function is
given by . The press-
ures , which act on the masses mi, and the glottal volume
flowvelocity U obey Bernoulli’s equation below the flow-
separation point, which is defined as the narrowest part of
the glottis [15]. Bernoulli’s equation is
where represents the air density is
the subglottal pressure, and is the supraglottalpressure.
The narrowest area of the glottis is given by
. By setting , the pressures
and the flow are obtained as
To simulate the excised larynx experiment, a tension
parameter is controlled, where determines the size and
the stiffness of the second mass in a way that it linearly
controls the frequency of the second mass. The other
parameter values were adopted from the standard values
established in the two-mass models[11, 15]. To integrate the
three-mass model equations (1)-(3), a fourth-order Runge-
Kutta method was used.
m1x1 + r1x1 + k1x1 + Θ(−a1)c1
(a1
2l
)+ k1,2(x1 − x2) = ld1P1
m2x2 + r2x2 + k2x2 + Θ(−a2)c2
(a2
2l
)+ k1,2(x2 − x1) = ld2P2
m3x3 + r3x3 + k3x3 + Θ(−a3)c3
(a3
2l
)+ k2,3(x3 − x2) = ld3P
( = 1.13 kg/m3), ps
��
ai = a0i + 2lxi (a 0i:�
ri, ki, di
ki,j
Θ(x) = 0 (x 0); Θ(x) = 1 (0 < x).<�
ps = p1 +2
(U
a1
)2
= p2 +2
(U
a2
)2
= p0 +2
(U
amin
)2� � �
p1 = ps[1 − Θ(amin)(
amin
a1
)2
]Θ (a1)
p2 = ps[1 − Θ (amin)(
amin
a2
)2
]Θ(a1)Θ(a2)Θ(a1 − a3)Θ(a2 − a3)
p3 = 0
U =√
2psaminΘ(amin)
�
Q Q
p0 = 0
p0
amin = min(a1, a2, a3)
�
�
pi,

Mathematical Models and Numerical Schemes Current Bioinformatics, 2011, Vol. 6, No. 3 329
Fig. (4b) shows a spectrogram of the three-mass model
by increasing the tension parameter from t = 0 s to t = 50 s
and then by decreasing it from t = 50 s to t = 100 s. This
resembles the spectrogram of Fig. (4c), which represents the
real experiments with excised human larynx when the vocal
folds were symmetrically elongated and shortened. In the
direction of increasing , low-frequency oscillations-
dominate the spectrogram, whereas in the direction of
decreasing higher-frequency oscillations last until they
switch to low-frequency oscillations at t = 90 s. This
hysteresis is due to the coexistence of the low-frequency and
high-frequency oscillations, which correspond respectively
to chest and falsetto registers according to the vibratory
patterns observed in the simulation. Namely, a complete
glottal closure was observed for the chest-like vibrations,
whereas glottal area was not completely closed for the
falsetto-like vibrations (no figure shown). Irregular dynamics
are observed around t = 15 s, whereas short interruption of
phonation (“aphonic episode”) exists at t = 50 s. These
instabilities are also found in the experiment. The
simulations therefore reveal that a simple three-mass model
can reproduce many of the complex transitions observed
experimentally. Since the three-mass model represents just
the core mechanisms of the vocal folds oscillations, gross
features of the register transitions simulated by the present
model are expected to be found commonly in other vocal
fold models.
3.2. 3D Flow and Acoustic Simulations
Based on Lighthill’s acoustic analogy a 3D model was
developed to compute the flow induced sound within the
larynx. Therewith, the incompressible form of the Navier-
Stokes equations was discretized and numerically solved by
the finite-volume (FV) method in a cell-centered formulation
on a fully block structured grid with the open source
Fig. (4). (a) Schematic illustration of the three-mass model. The left and right vocal folds have a symmetric configuration. Each vocal fold is
composed of three masses coupled by linear springs. (b) Spectrogram of the output signal from the three-mass model. The tension parameter
is increased from = 0.9Q% to = 1.58Q% in [0,50]t� and then decreased back to = 0.9Q% in [50,100]t� . (c) Spectrogram of the microphone
signal recorded from an excised human larynx by Horácek et al. [61]. Longitudinal tension of the vocal folds, monitored by force transducer,
was smoothly increased or decreased by rotating the thyroid cartilage.
Q
Q
Q
(a) (b)
(c)
m2
m1
k2
r2
k1
r1
k3
r3
m2
m3
m2
m1
k2
r2
k1
r1
k3
r3
m2
m3
�� !"#$%
& '( )*'
+$( '#!& ' (,
Time [sec]
Fre
quen
cy [H
z]
20 40 60 80 1000
400
800
1200
Time [sec]
Fre
quen
cy [H
z]
10 20 30 40 50 600
500
1,000
1,500
2000

330 Current Bioinformatics, 2011, Vol. 6, No. 3 Alipour et al.
computational fluid dynamics (CFD) code OpenFOAM [57].
To fully resolve the flow about 1 million FV cells were used
for the spatial discretization. In a second step, Lighthill’s
stress tensor was evaluated from the results of the flow field
simulation [58] and the acoustic field was computed by
numerically solving the inhomogeneous wave equation by
the FE method on the same computational grid using CFS++
[59].
The computational setup consists of a rectangular
channel with elliptic shaped constriction as sketched in Fig.
(5) (for details of the experimental setup, see [60]). Under
the precondition that Reynolds, Strouhal and Euler number
are conserved as given in Table 1 the CFD and CAA
computations are coupled by the hybrid approach used by
Mattheus et al. [61]. The CFD model has been validated with
the experimental results of Triep et al. [60] and by Schwarze
et al. [62]. The elliptic constriction reduces the area of the
transversal cross-section by a factor of 18 that equals an area
blockage of nearly 95%. In the coronal cross section, the
constriction is contoured like a nozzle with a smooth
convergent entry and a strong divergent exit. As inlet
velocity a characteristic wave form as shown in Fig. (6) has
been taken. The resulting flow divided up in the three
velocity components at probe point P0 (1D,0,0),
which is located one channel width D downstream from
glottal constriction, are plotted in Fig. (7). The waveforms
are recovered in the streamwise velocity component
Additionally, the fluctuations of all velocity components
indicate the effects of the induced vortices in the flow. The
corresponding normalized frequency spectra of the time
series at probe point P0 are displayed in Fig. (8). In all
spectra, a peak with strongest intensity is observed at the
base frequency of the prescribed volume flow waveforms.
To be pointed out, are the significant larger values of
intensity for frequencies with a factor between 30 and 40
times higher than the base frequency. They are generated in
the jet shear layer and transported downstream until they
decay into smaller structures. The acoustic signals obtained
from the aeroacoutsic simulations based on Lighthill’s
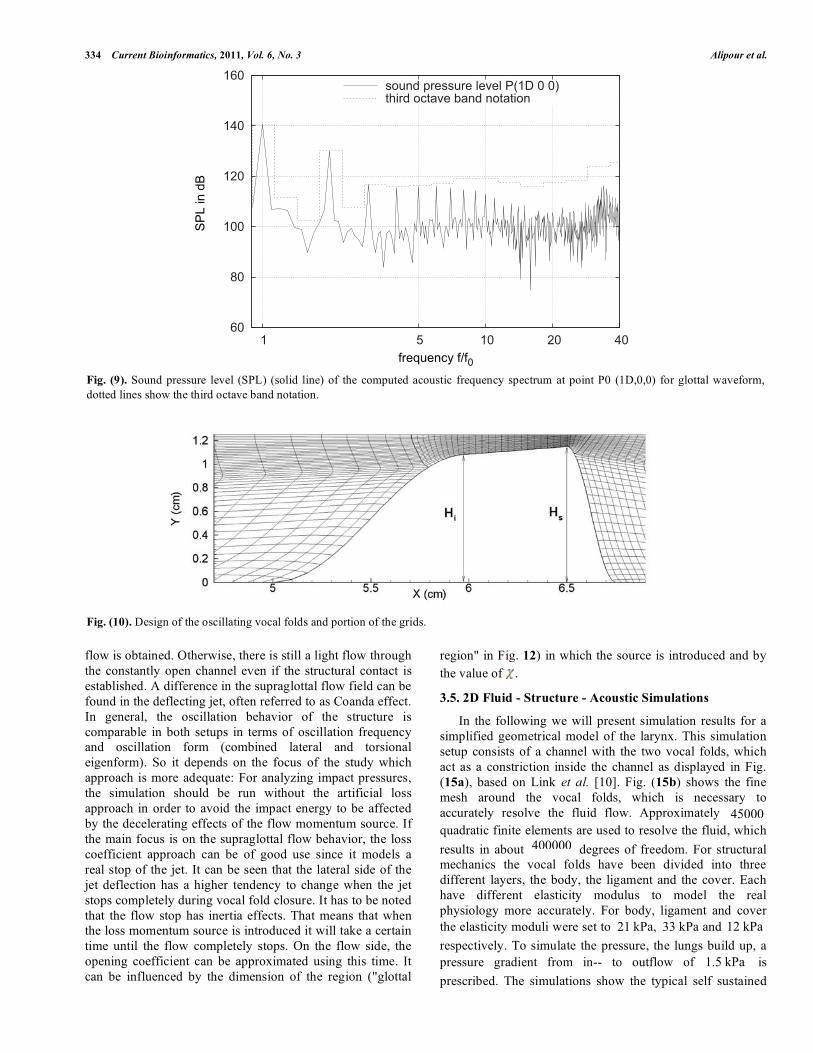
acoustic analogy are provided in Fig. (9). For all setups,the
base frequency of the inflow velocity (135 Hz) is recovered
in the spectra of the acoustic sound pressure level (SPL) and
their harmonics with lower amplitudes. For the glottal
waveform, the spectra of the SPL includes a broadband
sound at From the inspection of the SPL
spectra at different locationsin the supraglottal region, it is
found that the stochastically generated sound varies in space
with the highest amplitude at probe point P0. At this point
the flow is quite turbulent compared to the point at outflow
or at the glottis. With respect to the results of the
investigations by Bae and Moon [9] and Gloerfelt and Lafon
[49] for similar flow configurations, our spectra have similar
slopes in both the lower (dominated by the base frequency at
its harmonics) and the higher frequency part, where the
broadband sound is found. Therefore, we conclude that the
hybrid model approach is well suited to resolve the main
features of the flow and the acoustic spectra in the laryngeal
channel.
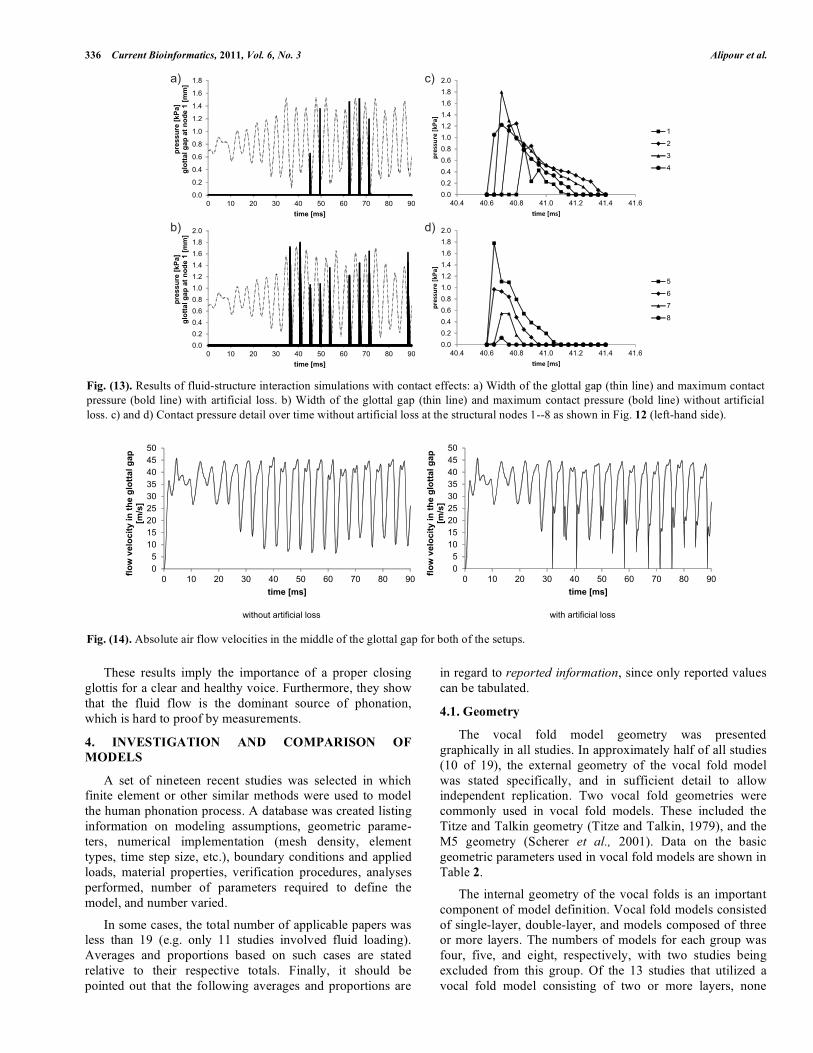
3.3. 2D Fluid-Structure Simulations
This section describes results of simulated pulsatile flow
in a model larynx that is shown in Fig. (10) by fully taking
the flow-structural mechanics interaction into account. The
channel height was 2.5 cm with 5 cm inlet duct and 50 cm
outlet duct. The vocal fold model had equilibrium height of
1:15 cm with amplitudes ranging from 0 to 0.9 mm. A
symmetric flow condition was assumed and only lower half
of the channel was discretized. The computational grid was
divided into three blocks. Block 1 (inlet) had grid
point, block 2 (glottis) had grid points, and block 3
(outlet) had grid points. Results were obtained for
various control parameters such as Reynolds number,
frequency, amplitudes and phase lead of inferior-superior
heights. For the continuum model of vocal fold vibrations, a
few assumptions are stated that help to simplify the job
Fig. (5). Sketch of the 3D computational domain, coronal (xy) (upper left), sagittal (xz) (lower) and transversal (yz) (upper right) cross
sections, channel width D = 60mm, max. opening of the constriction h = 8mm, contour angles � = 45° and � = 80°.
x
zD
0,1 D
y = 0
closed gap
β
D
0.8 D 2.5 D
flow
vocal folds z = 0 x = 0
y
z
y
α
P0
x
P0
h
Ux, Uy, Uz
Ux.
f0
f/f0 � 30−40.
21 × 4631 × 26
31 × 26

Mathematical Models and Numerical Schemes Current Bioinformatics, 2011, Vol. 6, No. 3 331
without sacrificing the accuracy:
� The vibration causes small deformations (linear
elasticity).
� The vibration takes place in a single plane only.
� The tissue layers of the vocal fold are either isotropic or
transversally isotropic (with the plane of isotropy being
perpendicular to the tissue fibers). This assumption is
based on measured mechanical properties of the vocal
fold tissues.
� The effect of grids motion during finite element space
integration is neglected, assuming fixed control volume
for integration.
Fig. (11) shows one cycle of the mean velocities (cross-
sectional average) at the glottal inlet (Uim) and the glottal
outlet ( The phase was varied from -60 to 90 degrees
while other parameters were held constant (Reynolds
number Re = 1000, frequency , and amplitudes
). There is a reverse flow in a
portion of each cycle at the inlet and outlet sections. This is
due to the displacement flow caused by the wall motion. The
phase difference plays an important role in the flow and
motion interaction. Since this is a forced oscillation model,
phase changes of the wall motion could have a positive or
negative effects on the airflow. At positive phase values a
large reverse flow will appear at the glottal exit near the end
of the cycle. The effects of phase difference on the
transglottal pressure (tgp) are shown in the Fig. (11c). There
is a positive pressure gradient in the direction of flow for
positive phase values during closing portion of the cycle.
The experimental data on the excised larynx shows this
phase is between 60–90 degrees. A phase value of 60 is used
for the remaining study
3.4. 2D Fluid-Structure Simulations with Contact
The contact formulation, which is used, is an augmented
Lagrangian method similar to the model of Luo et al. [41]. It
is based on an algorithm, which was published by Simo and
Laursen [63]. In this algorithm, a standard penalty method is
iteratively extended by a distance function until a Lagrange
multiplier is found which prevents interpenetration of the
corresponding nodes.
The weak formulation for structural mechanics is
extended by an augmented penalty regularization term,
which reads as follows
In (9) denotes the contact surface, the Lagrange
multiplier, the penalty parameter, and a function,
which determines the closest projection of a point onto an
admissible region and the outward normal of the current
configuration
In (9), is regarded as current estimate
of the correct Lagrange multiplier. The correct multiplier is
found iteratively by updating
until g(x) becomes smaller than a prescribed tolerance. The
advantage of this method is the better conditioning of the
equations compared with the earlier penalty methods. The
cost of the method is the use of an additional variable
Corresponding to the impact forces, which are
transferred between the vocal folds during glottal closure,
the flow has to be stopped. A straight-forward way to
approximate the flow effects in finite-volume models, where
zero-volumes are not possible, is introducing an artificial
momentum source when the vocal folds are nearly closed.
This (artificial) momentum source SM, which is added to the
Navier-Stokes equations, is calculated according to
with the loss coefficient Kl, the absolute velocity of the fluid
, and the velocity in direction is dependent of the
distance between the vocal folds
In (11) is the threshold value for closure, and an
arbitrary value with the unit of [kgm4]. The effects of contact
are shown on two setups. The first setup just includes the
structural contact while the second additionally comprehends
the arbitrary loss coefficient for stopping the flow in the
glottal gap. The model setup on the structural side includes
two contact pairs. Each of them consist of a contact and
target area whose normal directions tend toward each other
(Fig. (12), left-hand side). Both of the target areas are located
in the glottal gap and form a permanently open channel of
0.1mm. This approach ensures that the mesh in the flow
model is not distorted to zero or negative volumes.
Table 1. Characteristic Values, Similarity Parameters and Scaling Factors Between Air Flow and Up-Scaled Water Flow in the
Laryngeal Channel
Characteristic Value for Glottal Airflow Resulting Similarity Parameters
∫Γc
< λ(k)N + εng(x) > (δx) · n(x)dΓ .
λ(k)NΓc
εn g(x)
n(x).
< λ(k)N +εng(x) >
λ(k+1)N =< λ
(k)N + εng(x) >
(λN ).
SM,i = − 12Kl ρ |v| vi
Kl ={
0 for dVF ≥ dthr
χ for dVF < dthr
|v| vi i. Kl
dVF
dthr χ
(Uom).
f0 = 100 Hz,
Ai = 0.75 mm,As = 0.90 mm).

332 Current Bioinformatics, 2011, Vol. 6, No. 3 Alipour et al.
The closure effects on the fluid side are introduced by an
artificial momentum source. The volume in which the loss
coefficient is introduced is shown in Fig. (12) (right-hand
side, denoted as "glottal region").When the vocal folds
distance falls below the threshold distance of 0.1 mm,
takes the value of (see (10)).
A full flow-structural mechanical interaction simulation
of both setups (with and without the artificial loss) has been
carried out with a total simulation time of 90 ms. It can be
seen that both of the closure approaches influence each
other. When the loss coefficient is used, less structural
contact takes place Fig. (13a,b). That means that already the
Fig. (6). Prescribed volume flow waveform at the inlet as a characteristic waveforms for glottal cycle. Flow rate on the y-axis is normalized
to its maximum values maxQ of one cycle, max value is
i ,
g= 0.129m/s
n max
lottalU.
(a)
(b)
Fig. (7). Time-series of velocity components Ux (solid line), Uy (dotted line) and Uz (dash-dot line) and their fluctuations U’x (solid line) ,
U’y (dotted line) and U’z (dash-dot line) relative to phase averaged velocity. �phase at probe point P0 (1 D,0,0), located one channel width D
downstream from constriction on the central axis. The velocities are normalized to the maximum velocity of the inflow boundary condition
in Fig. (6).
0
0.2
0.4
0.6
0.8
1
0 0.5 1 1.5 2
flow
rate
Q/Q
max [-]
time t/T [-]
-5
0
5
10
15
20
25
0 0.2 0.4 0.6 0.8 1
t/T [-]
Ux P(1D 0 0)
Uy P(1D 0 0)
Uz P(1D 0 0)
-5
0
5
10
15
0 0.2 0.4 0.6 0.8 1
t/T [-]
fluctuation of Ux P(1D 0 0)
fluctuation of Uy P(1D 0 0)
fluctuation of Uz P(1D 0 0)
dthrχ
108 kgm4

Mathematical Models and Numerical Schemes Current Bioinformatics, 2011, Vol. 6, No. 3 333
loss coefficient prevents the vocal folds from touching each
other by the missing flow forces during the loss phase. In the
five cycles, when—nevertheless—contact takes place, the
maximum values of the contact pressure are lower than in
the simulation without the loss coefficient. In the latter case,
the maximum contact pressure values are 1.8 kPa, which is
in the same range as previously reported studies (e.g.[51]).
The spatial distribution of the contact pressure over time can
be found in Fig. (13). It was found that the maximum
pressures are located between the nodes 3 and 5 (for their
position see Fig. 12). Temporally, the contact pressures rise
rapidly and decrease much slower depending on the position
of the node. In this study, the channel between the vocal
folds is very small in order to model the vocal fold impact as
realistic as possible. Therefore, contact is not activated in
each oscillation cycle (for example when the supraglottal
flow influences the oscillation vertically so that the lateral
movement is reduced).
The flow effect of the artificial loss coefficient can be
seen in Fig. (14). Only if it is present, a complete stop of the
(a)
(b)
(c) ( )
Fig. (8). Frequency spectrum obtained by Fast-Fourier transforms of the time series of velocity components and their fluctuations Ux, U’ x,
Uy, U’y and Uz, U’z at probe point P0 (1D,0,0), inertial subrange (depicted with dash-dot line at slope angle -5/3) changes to dissipative
subrange (depicted with dotted line at slope angle-7)
10-5
10-4
10-3
10-2
10-1
100
101
102
103
100
101
102
103
f/f0 [-]
FFT of instantaneous Ux P(1D 0 0)
FFT of fluctuations of Ux P(1D 0 0)
(f/f0)-7
(f/f0)-5/3
10-5
10-4
10-3
10-2
10-1
100
101
102
103
100
101
102
103
f/f0 [-]
FFT of instantaneous Ux P(1D 0 0)
FFT of fluctuations of Ux P(1D 0 0)
(f/f0)-7
(f/f0)-5/3
10-5
10-4
10-3
10-2
10-1
100
101
102
103
100
101
102
103
f/f0 [-]
FFT of instantaneous Uy P(1D 0 0)
FFT of fluctuations of Uy P(1D 0 0)
(f/f0)-7
(f/f0)-5/3
334 Current Bioinformatics, 2011, Vol. 6, No. 3 Alipour et al.
flow is obtained. Otherwise, there is still a light flow through
the constantly open channel even if the structural contact is
established. A difference in the supraglottal flow field can be
found in the deflecting jet, often referred to as Coanda effect.
In general, the oscillation behavior of the structure is
comparable in both setups in terms of oscillation frequency
and oscillation form (combined lateral and torsional
eigenform). So it depends on the focus of the study which
approach is more adequate: For analyzing impact pressures,
the simulation should be run without the artificial loss
approach in order to avoid the impact energy to be affected
by the decelerating effects of the flow momentum source. If
the main focus is on the supraglottal flow behavior, the loss
coefficient approach can be of good use since it models a
real stop of the jet. It can be seen that the lateral side of the
jet deflection has a higher tendency to change when the jet
stops completely during vocal fold closure. It has to be noted
that the flow stop has inertia effects. That means that when
the loss momentum source is introduced it will take a certain
time until the flow completely stops. On the flow side, the
opening coefficient can be approximated using this time. It
can be influenced by the dimension of the region ("glottal
region" in Fig. 12) in which the source is introduced and by
the value of .
3.5. 2D Fluid - Structure - Acoustic Simulations
In the following we will present simulation results for a
simplified geometrical model of the larynx. This simulation
setup consists of a channel with the two vocal folds, which
act as a constriction inside the channel as displayed in Fig.
(15a), based on Link et al. [10]. Fig. (15b) shows the fine
mesh around the vocal folds, which is necessary to
accurately resolve the fluid flow. Approximately 45000
quadratic finite elements are used to resolve the fluid, which
results in about 400000 degrees of freedom. For structural
mechanics the vocal folds have been divided into three
different layers, the body, the ligament and the cover. Each
have different elasticity modulus to model the real
physiology more accurately. For body, ligament and cover
the elasticity moduli were set to 21 kPa, 33 kPa and 12 kPa
respectively. To simulate the pressure, the lungs build up, a
pressure gradient from in-- to outflow of 1.5 kPa is
prescribed. The simulations show the typical self sustained
Fig. (9). Sound pressure level (SPL) (solid line) of the computed acoustic frequency spectrum at point P0 (1D,0,0) for glottal waveform,
dotted lines show the third octave band notation.
Fig. (10). Design of the oscillating vocal folds and portion of the grids.
60
80
100
120
140
160
1 5 10 20 40
SP
L in
dB
frequency f/f0
sound pressure level P(1D 0 0)
third octave band notation

Mathematical Models and Numerical Schemes Current Bioinformatics, 2011, Vol. 6, No. 3 335
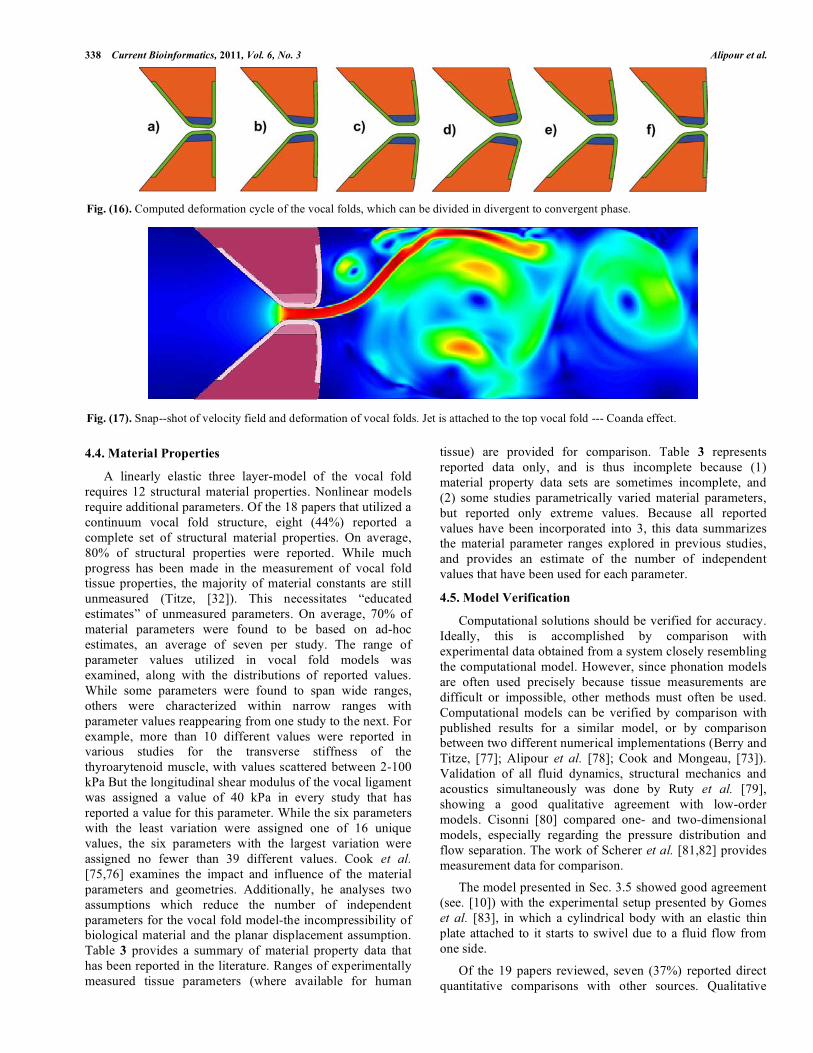
oscillation of the vocal folds during phonation, which is
divided into the divergent (opening) and convergent
(closing) phase as displayed in Fig. (16). In Fig. (17) the
fluid field can be seen at a characteristic time step. In the
transient simulation one can observe, how the jet is
stochastically attaching to either side of the trachea wall,
which is known as the Coanda effect.
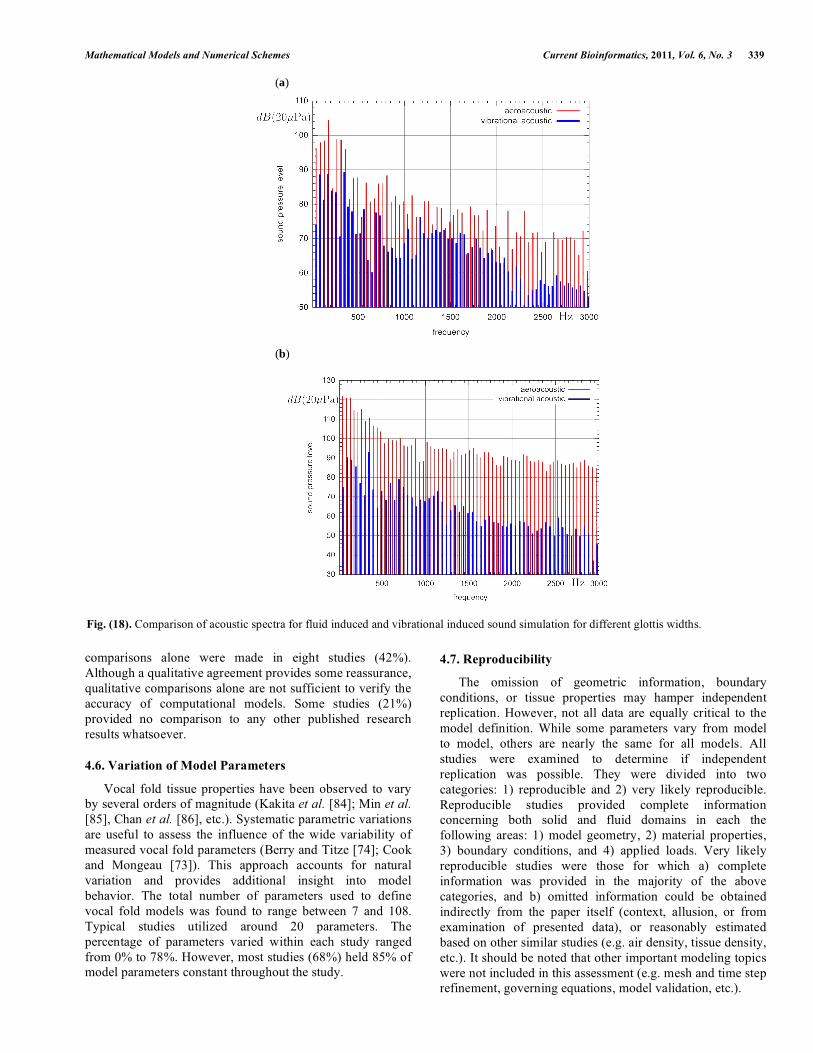
The acoustic sound computation has been separated into
a computation of the flow induced sound (using Lighthill's
tensor), and into a vibrational induced sound. In a series of
simulations the acoustic field of vibrational and fluid
induced sound was compared. As can be seen in Fig. (18a)
the mechanical induced sound is much smaller than that of
the fluid induced sound. Comparing this result with a
simulation were the initial glottis width is enlarged to
0.7 mm (see Fig. 18b) it shows that the bigger glottis results
in a much broader acoustic frequency spectrum.
Furthermore, no dominant frequency component is
recognizable as in Fig. (18a) at about 190 Hz .
(a)
(b)
(c)
Fig. (11). Effects of phase lag on the glottal inlet and outlet
velocities (a), (b) and on the tgp (c).
(a)
(b)
Fig. (12). Left: Position of the contact pairs in the glottal gap. Both
of the pairs form a permanently open channel of 0.1 mm width
between the vocal folds. Right: Position of the glottal region in the
flow model in which the loss coefficient is introduced when the
vocal folds distance falls below the threshold value of 0.25 mm.
0.1
0.25 0.25
[mm]
downstream
lateral
control points
(on both sides)
area normal
directions
1
2
34
5
6
7
8
supraglottal
area
glottal
region
flow
direction
336 Current Bioinformatics, 2011, Vol. 6, No. 3 Alipour et al.
These results imply the importance of a proper closing
glottis for a clear and healthy voice. Furthermore, they show
that the fluid flow is the dominant source of phonation,
which is hard to proof by measurements.
4. INVESTIGATION AND COMPARISON OF
MODELS
A set of nineteen recent studies was selected in which
finite element or other similar methods were used to model
the human phonation process. A database was created listing
information on modeling assumptions, geometric parame-
ters, numerical implementation (mesh density, element
types, time step size, etc.), boundary conditions and applied
loads, material properties, verification procedures, analyses
performed, number of parameters required to define the
model, and number varied.
In some cases, the total number of applicable papers was
less than 19 (e.g. only 11 studies involved fluid loading).
Averages and proportions based on such cases are stated
relative to their respective totals. Finally, it should be
pointed out that the following averages and proportions are
in regard to reported information, since only reported values
can be tabulated.
4.1. Geometry
The vocal fold model geometry was presented
graphically in all studies. In approximately half of all studies
(10 of 19), the external geometry of the vocal fold model
was stated specifically, and in sufficient detail to allow
independent replication. Two vocal fold geometries were
commonly used in vocal fold models. These included the
Titze and Talkin geometry (Titze and Talkin, 1979), and the
M5 geometry (Scherer et al., 2001). Data on the basic
geometric parameters used in vocal fold models are shown in
Table 2.
The internal geometry of the vocal folds is an important
component of model definition. Vocal fold models consisted
of single-layer, double-layer, and models composed of three
or more layers. The numbers of models for each group was
four, five, and eight, respectively, with two studies being
excluded from this group. Of the 13 studies that utilized a
vocal fold model consisting of two or more layers, none
Fig. (13). Results of fluid-structure interaction simulations with contact effects: a) Width of the glottal gap (thin line) and maximum contact
pressure (bold line) with artificial loss. b) Width of the glottal gap (thin line) and maximum contact pressure (bold line) without artificial
loss. c) and d) Contact pressure detail over time without artificial loss at the structural nodes 1--8 as shown in Fig. 12 (left-hand side).
Fig. (14). Absolute air flow velocities in the middle of the glottal gap for both of the setups.
a)
b)
c)
d)
0.0
0.2
0.4
0.6
0.8
1.0
1.2
1.4
1.6
1.8
2.0
40.4 40.6 40.8 41.0 41.2 41.4 41.6
pres
sure
[kPa
]
�me [ms]
1
2
3
4
0.0
0.2
0.4
0.6
0.8
1.0
1.2
1.4
1.6
1.8
2.0
40.4 40.6 40.8 41.0 41.2 41.4 41.6
pres
sure
[kPa
]
�me [ms]
5
6
7
8
0.0
0.2
0.4
0.6
0.8
1.0
1.2
1.4
1.6
1.8
0 10 20 30 40 50 60 70 80 90
pressu
re [
kP
a]
glo
tta
l g
ap
at
no
de
1 [
mm
]
time [ms]
0.0
0.2
0.4
0.6
0.8
1.0
1.2
1.4
1.6
1.8
2.0
0 10 20 30 40 50 60 70 80 90
pressu
re [
kP
a]
glo
tta
l g
ap
at
no
de
1 [
mm
]
time [ms]
0
5
10
15
20
25
30
35
40
45
50
0 10 20 30 40 50 60 70 80 90
flo
w v
elo
cit
y i
n t
he
glo
tta
l g
ap
[m/s
]
time [ms]
without artificial loss
0
5
10
15
20
25
30
35
40
45
50
0 10 20 30 40 50 60 70 80 90
flo
w v
elo
cit
y i
n t
he
glo
tta
l g
ap
[m/s
]
time [ms]
with artificial loss

Mathematical Models and Numerical Schemes Current Bioinformatics, 2011, Vol. 6, No. 3 337
provided a description of the internal geometry. Of the 19
studies, six (32%) provided geometric data that was
sufficiently detailed to allow independent replication of the
entire model geometry. These studies all utilized single-layer
models. The geometry of subglottal and supraglottal fluid
domains is another critical component of model definition.
The diameter and length of both the subglottal and
supraglottal tracts are required since the lengths of the both
tracts have been shown to have an effect on the vibratory
response of the vocal folds (Thomson et al. [70]). Of 10
studies which utilized a fluid model component, only four
provided a thorough description of the fluid geometry.
4.2. Boundary Conditions
Complete sets of structural boundary conditions were
stated in 12 of 19 (63%) of all papers. Nearly all of these (11
of 12), utilized rigid, rectangular boundary conditions for the
vocal fold structure, as introduced by Titze and Strong [71].
The accuracy of these boundary conditions was questioned
by Hunter et al. [72], in which transitional regions of soft
tissue were utilized to more accurately represent typical
human physiology. Cook and Mongeau [73] found that
boundary conditions significantly affected the vibratory
characteristics of the rectangular vocal fold geometry
introduced by Berry and Titze [74]. Typical fluid boundary
conditions included no-slip (zero velocity) conditions at
fixed walls, matched velocity at the fluid/solid interface, and
prescribed pressure inlet and outlet conditions. A symmetry
flow condition is also commonly applied to the centerline of
the model if the fluid flow is assumed to be symmetric about
the mid-sagittal plane. A total of 11 papers utilized a fluid
model. Of these, 6 (55%) reported a complete set of
boundary conditions. The assumption of symmetric fluid
flow was utilized in 9 studies (82%).
4.3. Applied Loads
The loads applied to vocal fold models included pressure
or forces applied directly to the vocal fold structure, and
loads applied to inlets and/or outlets of fluid domains. Of the
five studies involving loading in the absence of a fluid flow
model, less than one-half provided detailed loading
information. For fluid-structure interaction models, the most
common loading scheme is to impose a constant pressure
differential between inlet and outlet. Of the 11 studies that
utilized a flow model, this type of loading was reported in 5
studies (45%). A sinusoidally varying pressure was applied
to the inlet flow boundary in one study (Thomson et al.
[70]). in total, 17 studies utilized some type of applied load
(as defined above). Of these, 6 studies (35%) provided
sufficiently detailed information to allow for independent
replication of the load state.
(a)
(b)
Fig. (15). Model of the larynx with vocal folds and the according mesh used for the simulations.
338 Current Bioinformatics, 2011, Vol. 6, No. 3 Alipour et al.
4.4. Material Properties
A linearly elastic three layer-model of the vocal fold
requires 12 structural material properties. Nonlinear models
require additional parameters. Of the 18 papers that utilized a
continuum vocal fold structure, eight (44%) reported a
complete set of structural material properties. On average,
80% of structural properties were reported. While much
progress has been made in the measurement of vocal fold
tissue properties, the majority of material constants are still
unmeasured (Titze, [32]). This necessitates “educated
estimates” of unmeasured parameters. On average, 70% of
material parameters were found to be based on ad-hoc
estimates, an average of seven per study. The range of
parameter values utilized in vocal fold models was
examined, along with the distributions of reported values.
While some parameters were found to span wide ranges,
others were characterized within narrow ranges with
parameter values reappearing from one study to the next. For
example, more than 10 different values were reported in
various studies for the transverse stiffness of the
thyroarytenoid muscle, with values scattered between 2-100
kPa But the longitudinal shear modulus of the vocal ligament
was assigned a value of 40 kPa in every study that has
reported a value for this parameter. While the six parameters
with the least variation were assigned one of 16 unique
values, the six parameters with the largest variation were
assigned no fewer than 39 different values. Cook et al.
[75,76] examines the impact and influence of the material
parameters and geometries. Additionally, he analyses two
assumptions which reduce the number of independent
parameters for the vocal fold model-the incompressibility of
biological material and the planar displacement assumption.
Table 3 provides a summary of material property data that
has been reported in the literature. Ranges of experimentally
measured tissue parameters (where available for human
tissue) are provided for comparison. Table 3 represents
reported data only, and is thus incomplete because (1)
material property data sets are sometimes incomplete, and
(2) some studies parametrically varied material parameters,
but reported only extreme values. Because all reported
values have been incorporated into 3, this data summarizes
the material parameter ranges explored in previous studies,
and provides an estimate of the number of independent
values that have been used for each parameter.
4.5. Model Verification
Computational solutions should be verified for accuracy.
Ideally, this is accomplished by comparison with
experimental data obtained from a system closely resembling
the computational model. However, since phonation models
are often used precisely because tissue measurements are
difficult or impossible, other methods must often be used.
Computational models can be verified by comparison with
published results for a similar model, or by comparison
between two different numerical implementations (Berry and
Titze, [77]; Alipour et al. [78]; Cook and Mongeau, [73]).
Validation of all fluid dynamics, structural mechanics and
acoustics simultaneously was done by Ruty et al. [79],
showing a good qualitative agreement with low-order
models. Cisonni [80] compared one- and two-dimensional
models, especially regarding the pressure distribution and
flow separation. The work of Scherer et al. [81,82] provides
measurement data for comparison.
The model presented in Sec. 3.5 showed good agreement
(see. [10]) with the experimental setup presented by Gomes
et al. [83], in which a cylindrical body with an elastic thin
plate attached to it starts to swivel due to a fluid flow from
one side.
Of the 19 papers reviewed, seven (37%) reported direct
quantitative comparisons with other sources. Qualitative
Fig. (16). Computed deformation cycle of the vocal folds, which can be divided in divergent to convergent phase.
Fig. (17). Snap--shot of velocity field and deformation of vocal folds. Jet is attached to the top vocal fold --- Coanda effect.
Mathematical Models and Numerical Schemes Current Bioinformatics, 2011, Vol. 6, No. 3 339
comparisons alone were made in eight studies (42%).
Although a qualitative agreement provides some reassurance,
qualitative comparisons alone are not sufficient to verify the
accuracy of computational models. Some studies (21%)
provided no comparison to any other published research
results whatsoever.
4.6. Variation of Model Parameters
Vocal fold tissue properties have been observed to vary
by several orders of magnitude (Kakita et al. [84]; Min et al.
[85], Chan et al. [86], etc.). Systematic parametric variations
are useful to assess the influence of the wide variability of
measured vocal fold parameters (Berry and Titze [74]; Cook
and Mongeau [73]). This approach accounts for natural
variation and provides additional insight into model
behavior. The total number of parameters used to define
vocal fold models was found to range between 7 and 108.
Typical studies utilized around 20 parameters. The
percentage of parameters varied within each study ranged
from 0% to 78%. However, most studies (68%) held 85% of
model parameters constant throughout the study.
4.7. Reproducibility
The omission of geometric information, boundary
conditions, or tissue properties may hamper independent
replication. However, not all data are equally critical to the
model definition. While some parameters vary from model
to model, others are nearly the same for all models. All
studies were examined to determine if independent
replication was possible. They were divided into two
categories: 1) reproducible and 2) very likely reproducible.
Reproducible studies provided complete information
concerning both solid and fluid domains in each the
following areas: 1) model geometry, 2) material properties,
3) boundary conditions, and 4) applied loads. Very likely
reproducible studies were those for which a) complete
information was provided in the majority of the above
categories, and b) omitted information could be obtained
indirectly from the paper itself (context, allusion, or from
examination of presented data), or reasonably estimated
based on other similar studies (e.g. air density, tissue density,
etc.). It should be noted that other important modeling topics
were not included in this assessment (e.g. mesh and time step
refinement, governing equations, model validation, etc.).
Fig. (18). Comparison of acoustic spectra for fluid induced and vibrational induced sound simulation for different glottis widths.
(a)
(b)

340 Current Bioinformatics, 2011, Vol. 6, No. 3 Alipour et al.
Following the above guidelines, only three studies (16%)
were deemed to be reproducible and another four were
deemed to be partially reproducible. These findings may be
generalized by concluding that 37% of all studies could
reasonably be replicated by independent researchers. The
reasons for exclusion from this group were remarkably
consistent. Lack of geometric information was found in all
remaining studies, a lack of applied loading information
found in 83%, and lack of complete material properties sets
in 75% of these studies. Structural boundary conditions were
almost always stated (see Section IV.B), but fluid boundary
conditions were omitted in 4 of 8 non-reproducible studies
that utilized a fluid model (50%). An overview of
reproducibility of different parameters in reviewed studies is
listed in Table 4.
4.8. Discussion
A great deal of valuable information may be obtained
through the use of finite element vocal fold models, much of
which could not be gleaned as effectively using any other
methods. The use of finite element methods allows
systematic variation of parameters, which cannot be
accomplished clinically. The finite element method may
provide a more complete understanding of the deformation
field and the stress state of the human vocal folds, thus
eventually contributing to improved clinical treatment and
surgical intervention methods.
Any lack of rigor may hamper progress in future
computational efforts. For example none of the vocal fold
models reviewed in this study reported the internal geometry
of the model. This may be related to the fact that no standard
internal and external vocal fold geometry has been
developed based on measurements of actual vocal folds.
Boundary conditions follow a similar pattern. Nearly all
Table 2. Overall Dimensions Used in Computational Vocal Fold Models
n Minimum (mm) Maximum (mm) Average (mm) Std.Dev. (mm)
Length (anterior/posterior) 10 12 17 14.9 2.0
Depth (medial/lateral) 12 4 10 9.3 1.7
Thickness (inferior/superior) 13 3.5 10.9 7.1 2.8
Cover thickness 4 0.5 1.3 1.0 0.3
Table 3. Summary of Structural Parameters Reported in Vocal Fold Modeling Studies. E – Young’s Modulus; G – Shear
Modulus, – Poisson’s Ratio. Layers are Indicated by Subscripts: C – Cover; L – Ligament; M Thyroarytenoid Muscle.
The Prime Symbol (‘) Indicates Longitudinal Parameters. The Planar Displacement Assumption is Abbreviated as p.d.a
Total Number of Values Reported Number of Unique Values Range of Reported Values Experimental Range
13 8 1-- 100 kPa 4-165kPa
12 7 0-0.76 no data
7 4 1.7-5kPa 33-78kPa2
2 1 20kPa, p.d.a no data
7 1 40 kPa no data
7 5 0-0.68 no data
6 5 0-0.9 no data
14 8 2.1-36kPa no data
2 2 20kPa, p.d.a 2-10kPa3
10 3 10-30kPa no data
14 6 0-0.47 no data
7 4 0-0.9 no data
Table 4. Overall Reproducibility Rates from Reviewed
Studies (n = 19). The First Four Rows Address
Model Definition Issues, While the Last Four Rows
Address Numerical Implementation Issues. Fluid
and Solid Domains Indicated by (f) and (s)
Respectively
Aspect Percentage Reproducible
Geometry 37% (s) 45% (f)
Boundary Conditions 63%
Loading 35 %
Material Properties 44 % (s) 55 % (f)
Mesh Convergence 20 %
Time Step Convergence 25 %
Element Type Reported 77 %
Quantitative Verification 37 %

Mathematical Models and Numerical Schemes Current Bioinformatics, 2011, Vol. 6, No. 3 341
vocal fold models incorporate the rigid boundary conditions
of Titze and Strong [71], although the actual impedance of
the vocal folds supports has never been measured. Applied
loads are fairly well documented, in particular the
transglottal pressure drop (Hirano [87], Holmberg et al. [88];
Scherer et al. [89]). Virtually all computational studies
involving fluid-structure interactions were observed to utilize
information from such studies. The material properties of
vocal fold tissue, on the other hand, are not very well known.
Most studies utilized all available measured values, but
researchers are compelled to estimate a number of unknown
parameters. The utilization of previously estimated parame-
ters allows comparisons with previous research, but does not
expand the range or distribution of estimated values. Perhaps
the most rigorous approach would be to utilize previously
assumed values for validation and comparison with previous
studies, and then investigate other reasonable values for each
parameter. This would provide valuable information on the
influence of each parameter, and offer expanded sets of
estimated parameter values for subsequent studies.
5. CONCLUSION
We have presented an overview about the current state of
mathematical models for the human phonation process.
Therewith, we have discussed the different contributions
based on multi-mass and PDE based models. The obtained
simulation results provide a better understanding of the
human phonation and will developed in future to valuable
tools allowing surgical planning, diagnostics, and
rehabilitation evaluations on an individual basis. To achieve
this outlook, effort has to be put into reducing the simulation
time. This may either by done by simplification as the multi-
mass model or improving algorithms and implementations to
make a fully coupled 3D simulation in acceptable time
possible. Furthermore, realistic geometries and material
properties need to be determined to achieve reliable
simulations.
ACKNOWLEDGEMENT
This work was supported by Deutsche Forschungsge-
meinschaft Grant No. FOR894/2 Stromungsphysikalische Grundlagen der menschlichen Stimmgebung, FWF grant
I532-N20 and DFG grant BU 2231/2-1.
REFERENCES
[1] Flanagan J, Landgraf L. Self-oscillating source for vocal-tract
synthesizers. Audio Electroacoust IEEE Trans 1968; 16(1): 57-64.
[2] Titze IR. The Human Vocal Cords: A Mathematical Model, Part I.
Phonetica 1973; 28: 129-70.
[3] Koizumi T, Taniguchi S, Hiromitsu S. Two-mass models of the
vocal cords for natural sounding of voice synthesis. J Acoust Soc
Am 1987; 82: 1179-92.
[4] Kob M. Physical modeling of the singing voice. University of
Technology Aachen, PhD thesis, 2002.
[5] Alipour F, Berry DA, Titze IR. A finite-element model of vocal-
fold vibration. J Acoust Soc Am 2000; 108: 3003-12.
[6] Tao C, Jiang J, Zhang Y. Simulation of vocal fold impact pressures
with a self-oscillating finite element model. J Acoust Soc Am
2006; 119: 3987-94.
[7] Rosa MO, Pereira JC, Grellet M, Alwan A. A contribution to
simulating a three-dimensional larynx model using the finite-
element method. J Acoust Soc Am 2003; 114(5): 2893-905.
[8] Zhao W, Frankel SH, Mongeau L. Numerical simulation of sound
from confined pulsating axisymmetric jets. AIAA J 2001; 39:
1869-74.
[9] Bae Y, Moon Y. Computation of Phonation aeroacoustics by an
INS/PCE splitting method. Computers & Fluids2008; 37: 1332-43.
[10] Link G, Kaltenbacher M, Breuer M, Döllinger M. A 2D finite-
element scheme for fluid-solid-acoustic interactions and its
application to human phonation. Comp Methods Appl Mech Eng
2009; 198: 3321-34.
[11] Ishizaka K, Flanagan JL. Synthesis of voiced sounds from a two-
mass model of the vocal cords. BLTJ 1972; 51: 1233-68.
[12] Stevens K. Physics of laryngeal behavior and larynx mode.
Phonetica 1977; 34: 264-79.
[13] Titze I. The physics of small-amplitude oscillation of the vocal
folds. J Acoust Soc Am 1988; 83: 1536-52.
[14] Ishizaka K, Isshiki N. Computer simulation of pathological vocal-
cord vibration. J Acoust Soc Am 1976; 60: 1193-98.
[15] Steinecke I, Herzel H. Bifurcations in an asymmetric vocal fold
model. J Acoust Soc Am 1995; 97: 1571-8.
[16] Döllinger M, Hoppe U, Hettlich F, Lohscheller J, Schuberth S,
Eysholdt U. Vibration parameter extraction from endoscopic image
series of the vocal fold. IEEE Trans Biomed Eng 2002; 49: 773-81.
[17] Story B, Titze I. Voice simulation with a body-cover model of the
vocal folds. J Acoust Soc Am 1995; 97: 1249-60.
[18] Hirano M. Morphological structure of the vocal cord as a vibrator
and its variations. Folia Phonatrica 1974; 26: 89-94.
[19] Hirano M, Kakita Y. Cover-body theory of vocal cord vibration. In
Daniloff RG. (Ed.) Speech Science, College Hill Press, San Diego.
1985; p. 1-46.
[20] Titze I, Story B. Rules for controlling low-dimensional vocal fold
models with muscle activation. J Acoust Soc Am 2002; 112: 1064-
76.
[21] Adachi S, Yu J. Two-dimensional model of vocal fold vibration for
sound synthesis of voice and soprano singing. J Acoust Soc Am
2005; 117: 3213-24.
[22] Childers D, Hicks D, Moore G, Alsaka Y. A model for vocal fold
vibratory motion, contact area, and electroglottogr. Am J Acoust
Soc Am 1986; 80: 1309320.
[23] Lous N, Hofmans G, Veldhuis R, Hirschberg A. A symmetrical
two mass vocal fold model coupled to vocal tract and trachea, with
application to prothesis design. Acta Acustica 1998; 84: 1135-50.
[24] Lucero JC. The minimum lung pressure to sustain vocal fold
oscillation. J Acoust Soc Am 1995; 98: 779-84.
[25] Lucero JC. A theoretical study of the hysteresis phenomenon at
vocal fold oscillation onset-offset. J Acoust Soc Am 1999; 105(1):
423-31.
[26] Lucero JC, Koenig LL. On the relation between the phonation
threshold lung pressure and the oscillation frequency of the vocal
folds (L) [Article]. J Acoust Soc Am 2007; 121(6): 3280-3.
[27] Laje R, Gardner T, Mindlin GB. Continuous model for vocal fold
oscillations to study the effect of feedback. Phys Rev E 2001;
64(5): 056201.
[28] Avanzini F. Simulation of vocal fold oscillation with a pseudo-one-
mass physical model. Speech Commun 2008; 50: 95-108.
[29] Drioli C. A flow waveform-matched low-dimensional glottal model
based on physical knowledge. J Acoust Soc Am 2005; 117(5):
3184-95.
[30] Titze I. The human vocal cords: A mathematical model, part II.
Phonetica 1974; 29: 1-21.
[31] Wong D, Ito M, Cox N, Titze I. Observation of perturbation in a
lumped-element model of the vocal folds with application to some
pathological cases. J Acoust Soc Am 1991; 89: 383-94.
[32] Titze I. Myoelastic Arodynamic Theory of Phonation. Iowa City,
IA: National Center for Voice and Speech. 2006.
[33] Berge P, Pomeau Y, Vidal C. Order within Chaos: Towards a
deterministic approach to turbulence. New York: Wile. 1984.
[34] JC L. Optimal glottal configuration for ease of phonation. J Voice
1998; 12: 151-8.
[35] Pelorson X, Hirschberg A, van Hassel R, Wijnands A, Auregan Y.
Theoretical and experimental study of quasi-steady flow separation
within the glottis during phonation. J Acoust Soc Am 1994; 96:
3416-31.
[36] Sciamarella D, d’Alessandro C. On the acoustic sensitivity of a
symmetrical two-mass model of the vocal folds to the variation of
control parameters. Acta Acustica 2004; 90: 746-61.
[37] Tao C, Zhang Y, Hottinger DG, Jiang JJ. Asymmetric airflow and
vibration induced by the Coanda effect in a symmetric model of the
vocal folds. J Acoust Soc Am 2007; 122(4): 2270-8.

342 Current Bioinformatics, 2011, Vol. 6, No. 3 Alipour et al.
[38] de Vries MP, Schutte HK, Veldman AEP, Verkerke GJ. Glottal
flow through a two-mass model: Comparison of Navier-Stokes
solutions with simplified models. J Acoust Soc Am 2002; 111(4):
1847-5.
[39] Alipour F, Scherer RC. Flow separation in a computational
oscillating vocal fold model. J Acoust Soc Am 2004; 116: 1710-9.
[40] Decker G, Thomson S. Computational Simulations of Vocal Fold
Vibration: Bernoulli Versus Navier-Stokes. J Voice 2007; 21: 273-
84.
[41] Sciamarella D, Quere PL. Solving for unsteady airflow in a glottal
model with immersed moving boundaries. Eur J Mech B/Fluids
2008; 27: 42-53.
[42] Thomson SL, Mongeau L, Frankel SH. Physical and numerical
flow-excited vocal fold models. In: 3rd International Workshop
MAVEBA. Firenze University Press 2003; p. 147-50. ISBN 88-
8453-154-3.
[43] Luo H, Mittal R, Zheng X, Bielamowicz SA, Walsh RJ, Hahn JK.
An immersed-boundary method for flow-structure interaction in
biological systems with application to phonation. J Comput Phys
2008; 227: 9303-32.
[44] Coanda H. Device for deflecting a stream of elastic fluid projected
into an elastic fluid. US-patent 1935; 2.052.869.
[45] Erath BD, Plesniak MW. The occurrence of the Coanda effect in
pulsatile flow through static models of the human vocal folds. J
Acoust Soc Am 2006; 120(2): 1000-11.
[46] Zhao W, Zhang C, Frankel SH, Mongeau L. Computational
aeroacoustics of phonation, Part I: Computational methods and
sound generation mechanisms. J Acoust Soc Am 2002; 112: 2134-
46.
[47] Zhang Z, Mongeau L, Franke SH, Thomson SL. Sound generation
by steady flow through glottisshaped orifices. J Acoust Soc Am
2004; 116: 1720-8.
[48] Williams JEF, Hawkings DL. Sound generation by turbulence and
surface in arbitrary motion. Philosophical Transactions of the
Royal Society of London, Series A, Mathematical and Physical
Sciences. 1969; 264: 321-42.
[49] Suh J, Frankel SH. Numerical simulation of turbulence transition
and sound radiation for flow through a rigid glottal model. J Acoust
Soc Am 2007; 121(6): 3728-39.
[50] Krane MH. Aeroacoustic production of low-frequency unvoiced
speech sounds. J Acoust Soc Am 2005; 118: 410-27.
[51] Gloerfelt X, Lafon P. Direct Computation of the noise induced by a
turbulent flow through a diaphragm in a duct at low Mach number.
Computers & Fluids 2008; 37: 388-401.
[52] Horácek J, �idlof P, �vec JG. Numerical simulation of self-
oscillations of human vocal folds with Hertz model of impact
forces. J Fluid Struct 2005; 20: 853-69.
[53] Horácek J, Laukkanen AM, �idlof P. Estimation of impact stress
using an aeroelastic model of voice production. Logop Phoniatr
Vocol 2007; 32: 185-92.
[54] Decker GZ, Thomson SL. Computational simulations of vocal fold
vibration: Bernoulli Versus Navier-Stokes. J Voice 2007; 21: 273-
84.
[55] Zheng X, Xue Q, Mittal R, Beilamowicz S. A coupled sharp-
interface immersed boundary-finite-element method for flow-
structure interaction with application to human phonation. J
Biomech Eng 2010; 132(11): 111003.
[56] Belytschko T, Liu WK, Moran B. Nonlinear Finite Elements for
Continua and Structures. Chichester: J. Wiley & Sons Ltd; 2000.
[57] Seo JH, Mittal R. A high-order immersed boundary method for
acoustic wave scattering and low-Mach number flow-induced
sound in complex geometries. J Comput Phys 2011; 230: 1000-19.
[58] Tokuda I, Horácek J, �vec J, Herzel H. Comparison of
biomechanical modeling of register transitions and voice
instabilities with excised larynx experiments. J Acoust Soc Am
2007; 122: 519-31.
[59] van den Berg J, Tan T. Results of experiments with human
larynxes. Pract Otorhinolaryngol (Basel) 1959; 21: 425-50.
[60] van den Berg J. Sound productions in isolated human larynges.
Annals of New York Academy of Sciences 1968; 155: 18-27.
[61] Horácek J, �vec J, Vesel� J, Vilkman E. Bifurcations in excised
larynges caused by vocal fold elongation. In Giovanni A,
Dejonckere P, Ouaknine M, (Eds.). Proc Int Conf Voice Physiol
Biomech 2004; p. 87-89.
[62] OpenCFD Ltd. OpenFOAM1.5 documentation; http://www.openc-
fd.co.uk/openfoam/doc/index.html.
[63] Kaltenbacher M, Escobar M, Ali I, Becker S. Numerical simulation
of flow-induced noise using LES/SAS and Lighthill’s Acoustics
Analogy. Intl J Numerical Methods Fluids 2010; 63(9): 1103-22.
[64] Kaltenbacher M. Advanced simulation tool for the design of
sensors and actuators. In: Proceedings of Eurosensors XXIV. Linz,
Austria, 2010; CD-ROM.
[65] Triep M, Brücker C, SchröderW. High-speed PIV measurements of
the flow downstream of a dynamic mechanical model of the human
vocal folds. Experiments Fluids 2005; 39(2): 232-45.
[66] Mattheus W, Zörner S, Kaltenbacher M, Schwarze R, Brücker C.
Vortex induced sound in a pulsating flow through an elliptic glottal
shaped constriction. Eur J Mech B/Fluids (In review).
[67] Schwarze R, MattheusW, Klostermann J, Brücker C. Starting jet
flows in a three-imensional channel with larynx-shaped
constriction. Computers & Fluids (submitted).
[68] Zheng X, Bielamowicz S, Luo H, Mittal R. A computational study
of the effect of false vocal folds on glottal flow and vocal fold
vibration during phonation. J Biomed Eng Soc 2009; 37: 625-42.
[69] Simo JC, Laursen TA. An augmented Lagrangian treatment of
contact problems involving friction. Comput Struct 1992; 42: 97-
116.
[70] Thomson SL, Mongeau L, Frankel SH. Aerodynamic transfer of
energy to the vocal folds. J Acoust Soc Am 2005; 118(3): 1689-
100.
[71] Titze IR, Strong WJ. Normal modes in vocal cord tissues. J Acoust
Soc Am 1975; 57(3): 736-44.
[72] Hunter EJ, Titze IR, Alipour F. A three-dimensional model of
vocal fold abduction/adduction. J Acoust Soc Am 2004; 115: 1747-
59.
[73] Cook DD, Mongeau L. Sensitivity of a continuum vocal fold model
to geometric parameters, constraints, and boundary conditions. J
Acoust Soc Am 2007; 121(4): 2247-53.
[74] Berry DA, Titze IR. Normal modes in a continuum model of vocal
fold tissues. J Acoust Soc Am 1996; 100(5): 3345-54.
[75] Cook DD, Nauman E, Mongeau L. Reducing the number of vocal
fold mechanical tissue properties: Evaluation of the
incompressibility and planar displacement assumptions. J Acoust
Soc Am 2008; 124(6): 3888-96.
[76] Cook DD, Nauman E, Mongeau L. Ranking vocal fold model
parameters by their influence on modal frequencies. J Acoust Soc
Am 2009; 126(4): 2002-10.
[77] Alipour F, Titze IR. Combined simulation of airflow and vocal fold
vibrations, in Vocal Fold Physiology, Controlling Complexity and
Chaos. Singular Publishing Group, San Diego. 1996; p. 17-29.
[78] Alipour F, Scherer R. Vocal fold bulging effects on phonation
using a biophysical computer model. J Voice 2000; 4(14): 470-83.
[79] Ruty N, Pelorson X, Hirtum AV, Lopez-Arteaga I, Hirschberg A.
An in vitro setup to test the relevance and the accuracy of low-
order vocal folds models. J Acoust Soc Am 2007; 121(1): 479-90.
[80] Cisonni J, Hirtum AV, Luo X, Pelorson X. Experimental validation
of quasi-one-dimensional and two-dimensional steady glottal flow
models. Med Biol Eng Comput 2010; 48: 903-10. 10.1007/s11517-
010-0645-7.
[81] Scherer RC, Titze IR, Curtis JF. Pressure-flow relationships in two
models of the larynx having rectangular glottal shapes. J Acoust
Soc Am 1983; 73(2): 668-76.
[82] Fulcher LP, Scherer RC, Witt KJD, Thapa P, Bo Y, Kucinschi BR.
Pressure distributions in a static physical model of the hemilarynx:
Measurements and computations. J Voice 2010; 24(1): 2-20.
[83] Gomes JP, Lienhart H. Experimental study on a fluid-structure
interaction reference test case. In Fluid-Structure Interaction -
Modelling, Simulation, Optimization. 2006.
[84] Kakita Y, Hirano M, Ohmaru K. Physical properties of the vocal
fold tissue. In: Vocal Fold Physiology; 1981.
[85] Min YB, Titze IR, Alipour-Haghighi F. Stress-strain response of
the human vocal ligament. Ann Otol Rhinol Laryngol 1995; 104:
563-9.
[86] Chan RW, Titze IR. Viscoelastic shear properties of human vocal
fold mucosa: Measurement methodology and empirical results. J
Acoust Soc Am 1999; 106: 2008-21.
[87] Hirano M. Clinical Examination of Voice: Disord Human Commun
1981; p. 100.
[88] Holmberg EB, Hillman RE, Perkell JS. Glottal airflow and
transglottal air pressure measurements for male and female
speakers in soft, normal, and loud voice. J Acoust Soc Am 1988;
84(2): 511-29.

Mathematical Models and Numerical Schemes Current Bioinformatics, 2011, Vol. 6, No. 3 343
[89] Alipour F, Scherer RC. Effects of oscillation of a mechanical
hemilarynx model on mean transglottal pressures and flows. J
Acoust Soc Am 2001; 110(3): 1562-9.
[90] Tao C, Zhang Y, Hottinger DG, Jiang JJ. Asymmetric airflow and
vibration induced by the Coanda effect in a symmetric model of the
vocal folds. J Acoust Soc Am 2007; 122: 2270-8.
Received: November 25, 2010 Revised: February 02, 2011 Accepted: February 05, 2011