current clamp recordings with the epc 10 patch ... - heka
TRANSCRIPT
Dr. Christian Heinemann
Current Clamp Recordings with the EPC 10 Patch Clamp Amplifier

Agenda
Part A: Current clamp circuitry
Part B: Sensing membrane potential: Parameters affecting the shape of an action potential
Part C: Stimulation the cell by current injection: How much current can be injected?

CC Circuitry of the EPC 10 amplifier
Current injection path via the feedback resistor of the patch clamp headstage.
I-command (V-Ref)
C-fast comp (V-Ref)
V-mon
500 MOhm
V-Ref
-
+
-
+
1 pF
4,7 pF
-
+
I-mon
Part A 1.2
Voltage follower circuitry, direct and fast measurement of the membrane potential.
Current injection path via the injection capacitor.

Comparison of EPC 9 and EPC 10
The EPC 10 shows no deviations from the command current pulse. Good clamp performance.
Action potential recordings from DRG neurons. All recordings from cells within this presentation are courtesy of the Center for Molecular Biomedicine (CMB), Department of Biophysics, Friedrich-Schiller-University Jena.
Part A 1.3
The EPC 10 with its Voltage Follower circuitry measures the true action potential waveform.
The EPC 9 uses a slower current feedback loop. Clamp performance not perfect.
The EPC 9 gives only a qualitative measurement of the AP waveform.

Equivalent Circuit
Part B 2.1
CellPipette
Cm
Rm
Rs
C-fast

Stimulating in Voltage Clamp
Cm = 22pF
Rm = 500MOhm
Rs = 5.1MOhmV com
Part B 2.1
tauVm=RS∗Cm=112µs
Current charges the cell membrane capacitance, current transient.
During charging the membrane potential time course is dominated by the time constant:
The potential at the membrane drives the current through the Rm. That is, why the current we typically measure also increases with exponential time course.
iRs=iCm+iRm
iRm
V com
Current Recording with C-Slow compensation active.
20mV voltage stimulus drive about 40pA through Rm.

Initially, the constant current mainly charges the membrane capacitance.
Cm = 22pF
Rm = 500MOhm
Rs = 5.1MOhm I com
Stimulating in Current Clamp
Part B 2.2
tau=Rm∗Cm=11ms
iRs=iCm+iRm
With increasing potential the portion of the current that flows through Rm becomes dominating.
This equilibration happens with the time constant given by:
The increase in Vm is typically much slower in CC than VC recordings.
40pA current injection result in a Vm of about 20mV.

If the cell fires an action potential, then the equivalent circuit is reduced to a combination of access resistance and pipette capacitance.
The filtering element is given by:
Sensing an action potential fired by a cell
5,0 pF
Vm
measure
Part B 2.3
tau=RS∗C fast=50µs
BW eff=12∗pi∗tau
=3.18kHz
C-fast
Rs

CC Bandwidth: limited by C-fast?
The time constant Rs * C-fast limits the effective bandwidth of the voltage recording in a current clamp measurement.
C-fast compensation reduces the contributing capacitance and therefore increases the effective bandwidth.
rem. C-fast
theor. Tau meas. Tau eff. BW
5pF 50µs 57µs 2.8kHz
4pF 40µs 47µs 3.4kHz
3pF 30µs 37µs 4.3kHz
2pF 20µs 27µs 5.9kHz
10MOhm
5.0pF measurestimulate
Part B 2.4
tau

AP shape – Affected by C-fast Comp?
Rs = 3.3MOhm and rem. C-fast = 2pF the eff. BW > 20kHz
Part B 2.5

Checking C-fast adjustment in CC mode
Part B 2.8
4.78
pF
5.78 pF
1E-12[V^2/Hz]
1E-13
1E-14
1E-15
1,000 10,000 100,000Hz
Power Spectrum
Voltage recording in CC mode with 100kHz sampling frequency and V-Bessel filter set to 15kHz

CC Bandwidth: limited by Voltage Filter?
The maximum slope is effected significantly by the voltage filter. But in a speed range much faster than the rising phase of an AP.
V-Bessel max. slope
% slope reduction
15kHz 2.156V/s
10kHz 1.781V/s 17%
7kHz 1.531V/s 29%
5kHz 1.187V/s 45%
10MOhm
5.0pF measurestimulate
max. slope
Part B 2.6

AP shape – Affected by Voltage Filter?
The maximum slope of the AP is not significantly affected at V-Filter settings above 1 kHz.
A
B
C
D
Part B 2.7

Stimulation Artifact: Bridge Compensation The initial fast voltage step over Rs can be
compensated using the Bridge Compensation.
100% of the Rs value can be compensated. Adjust Rs or % value for fine tuning.
measure - V
stimulate - ICm = 47.0 pF
Rm = 500 MOhm
Rs = 100 MOhm
Part C 3.1

Stimulation Artifact: Bridge Compensation A fast enough time constant of Bridge
Compensation eliminates the voltage step completely. measure - V
stimulate - ICm = 47.0 pF
Rm = 500 MOhm
Rs = 100 MOhm
Part C 3.3
100µs
10µs

AP Recordings with high access Resistance estimated Rs about 70-80 MOhm, 80 pA
current injection induce about 6 mV voltage drop.
Recordings with Bridge Comp On and Off. Note change in AP amplitude. Slope is not affected.
Part C 3.2
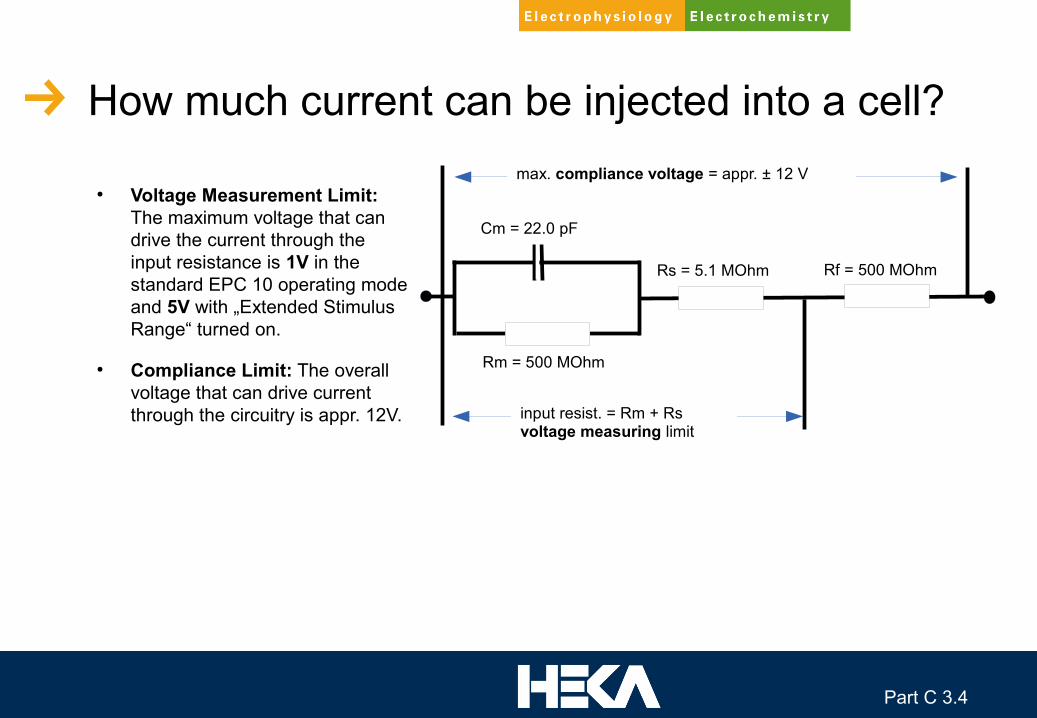
How much current can be injected into a cell?
Voltage Measurement Limit: The maximum voltage that can drive the current through the input resistance is 1V in the standard EPC 10 operating mode and 5V with „Extended Stimulus Range“ turned on.
Compliance Limit: The overall voltage that can drive current through the circuitry is appr. 12V.
Cm = 22.0 pF
Rm = 500 MOhm
Rs = 5.1 MOhm Rf = 500 MOhm
max. compliance voltage = appr. ± 12 V
input resist. = Rm + Rsvoltage measuring limit
Part C 3.4

Example 1: 10nA injection via 500MΩ
i
i
Cm = 22.0 pF
Rm = 500 MOhm
Rs = 5.1 MOhm
i
Rf = 500 MOhm
max. compliance voltage = appr. ± 12 V
input resist. = Rm + Rsvoltage measuring limit
Part C 3.5
CC-Gain I max
0.1 pA/mVRf = 500 MΩ
1 nA
1.0 pA/mVRf = 500 MΩ
10 nA
10 pA/mVRf = 5.1 MΩ
100 nA
100 pA/mVRf = 5.1 MΩ
1 µA
URf= i∗Rf=10nA∗500MOhm=5V
Rinput=1V10nA
=100MOhm
i limit=1V500MOhm
=2nA
Ucompl=1V+5V=6V
extended StimulusRange:URf= i∗Rf=10nA∗500MOhm=5V
Rinput=5V10nA
=500MOhm
Ucompl=5V+5V=10V

Example 2: 1µA injection via 5.1MΩ
i
i
Cm = 22.0 pF
Rm = 500 MOhm
Rs = 5.1 MOhm
i
Rf = 5.1 MOhm
max. compliance voltage = appr. ± 12 V
input resist. = Rm + Rsvoltage measuring limit
Part C 3.6
CC-Gain I max
0.1 pA/mVRf = 500 MΩ
1 nA
1.0 pA/mVRf = 500 MΩ
10 nA
10 pA/mVRf = 5.1 MΩ
100 nA
100 pA/mVRf = 5.1 MΩ
1 µA
URf=i∗R f=1µA∗5.1MOhm=5.1V
R input=1V1µA
=1MOhm
i limit=1V500MOhm
=2nA
Ucompl=1V+5.1V=6.1V
extended StimulusRange :URf=i∗R f=1µA∗5.1MOhm=5.1V
R input=5V1µA
=5MOhm
i limit=5V500MOhm
=10nA
Ucompl=5V+5.1V=10.1V
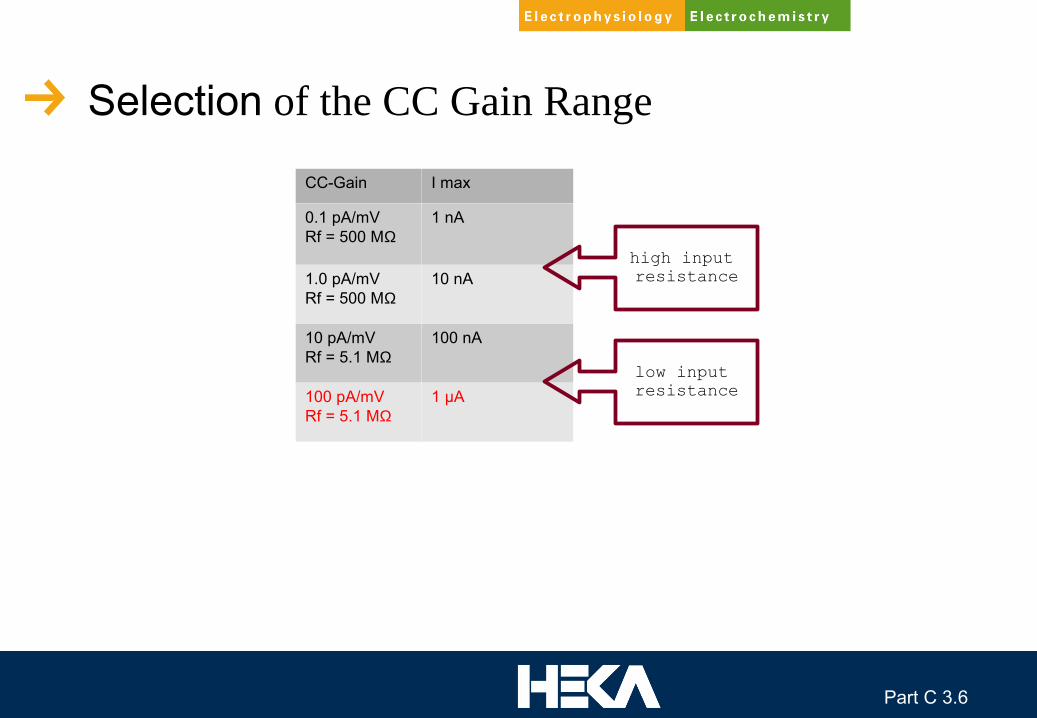
Selection of the CC Gain Range
Part C 3.6
CC-Gain I max
0.1 pA/mVRf = 500 MΩ
1 nA
1.0 pA/mVRf = 500 MΩ
10 nA
10 pA/mVRf = 5.1 MΩ
100 nA
100 pA/mVRf = 5.1 MΩ
1 µA
high input resistance
low input resistance

Attention: High CC Gain might cause Voltage offsets!
Part C 3.7
CC-Gain I max
0.1 pA/mVRf = 500 MΩ
1 nA
1.0 pA/mVRf = 500 MΩ
10 nA
10 pA/mVRf = 5.1 MΩ
100 nA
100 pA/mVRf = 5.1 MΩ
1 µA
0.3mV∗100pAmV
=30pA
Uoffset=500MOhm∗30pA=15mV , model cell−WholeCell Mode
Uoffset=10MOhm∗30pA=0.3mV , model cell−PipetteBath Mode
Current stimulus is generated by 16bit DAC with a typical resolution of about 0.3mV/bit.
What happens if we are just off by one bit?
Note:High CC-gains can not be used or tested with high input resistances, e.g.
model cell in Whole Cell Mode!
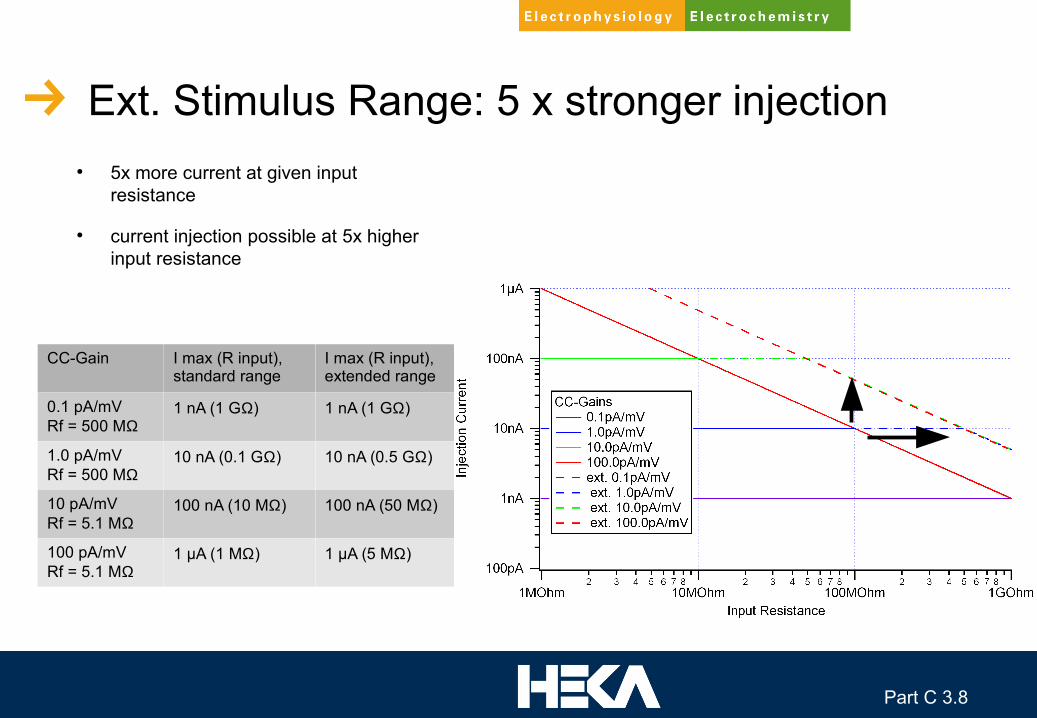
Ext. Stimulus Range: 5 x stronger injection
CC-Gain I max (R input), standard range
I max (R input), extended range
0.1 pA/mVRf = 500 MΩ
1 nA (1 GΩ) 1 nA (1 GΩ)
1.0 pA/mVRf = 500 MΩ
10 nA (0.1 GΩ) 10 nA (0.5 GΩ)
10 pA/mVRf = 5.1 MΩ
100 nA (10 MΩ) 100 nA (50 MΩ)
100 pA/mVRf = 5.1 MΩ
1 µA (1 MΩ) 1 µA (5 MΩ)
5x more current at given input resistance
current injection possible at 5x higher input resistance
Part C 3.8

Summary - CC related EPC 10 Features Voltage Follower Circuitry: True
Current Clamp
C-fast Compensation: increase bandwidth of CC recording
small Rs makes C-fast setting less critical
Voltage Filter: analog filter for the voltage signal
filtering with 5kHz or more typically does not affect the AP shape
4 different CC Stim Gains: for injection of large currents
amount of injected current depends on input resistance
with Rs lower than 10MOhm artifact typically less than 1mV
5x more current at given input resistance
given current at 5x higher input resistance
Bridge Compensation: remove current injection artifact
Extended Stimulus Range: 5x stronger current injection

Thank you!
Questions ?