current developments on the global commercial … commercial vehicles... · current developments on...
TRANSCRIPT

Current Developments on theGlobal Commercial Vehicle Market
Prof. Dr. Bernd GottschalkPresidentGerman Association of the Automotive Industry (VDA)
International Press Workshop “Commercial Vehicles – A Mobile Future”9 July 2004, Frankfurt/Main

Commercial Vehicle Markets
I. Global
II. Germany
page 3
page 41

I. Global Commercial Vehicle Markets- Overview- by Region
- North America- South America- Asia- Eastern Europe- Western Europe
page 4
page 10
page 12
page 15
page 21
page 28
4
Asia***39.1%
Western Europe19.6%
other countries16.6%
South America**3.6%Eastern Europe
11.0%North America*
10.1%
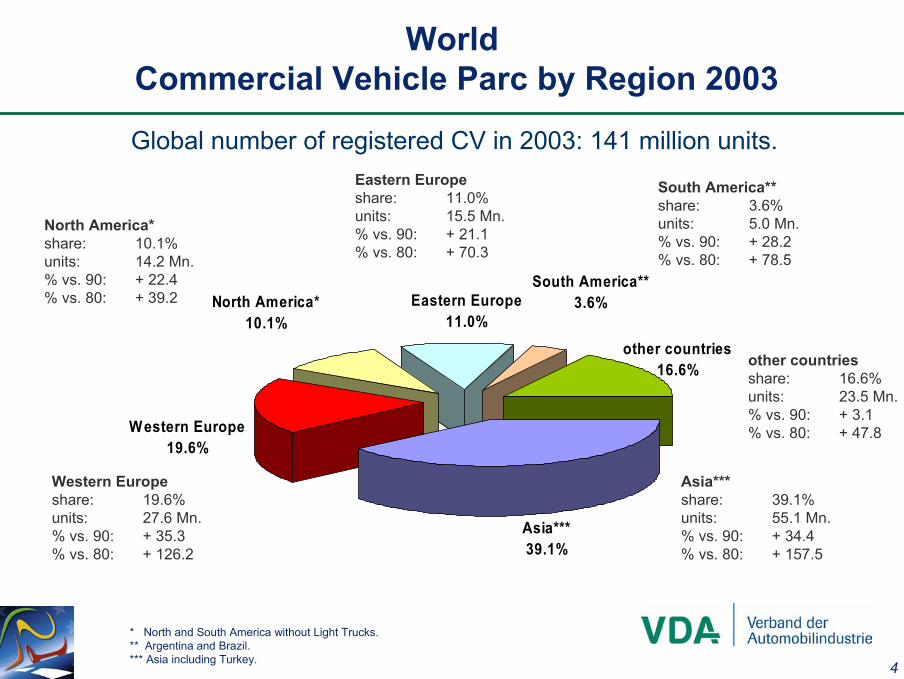
WorldCommercial Vehicle Parc by Region 2003
Global number of registered CV in 2003: 141 million units.
North America* share: 10.1%units: 14.2 Mn.% vs. 90: + 22.4% vs. 80: + 39.2
Eastern Europeshare: 11.0%units: 15.5 Mn.% vs. 90: + 21.1% vs. 80: + 70.3
South America**share: 3.6%units: 5.0 Mn.% vs. 90: + 28.2% vs. 80: + 78.5
Asia***share: 39.1%units: 55.1 Mn.% vs. 90: + 34.4% vs. 80: + 157.5
Western Europeshare: 19.6%units: 27.6 Mn.% vs. 90: + 35.3% vs. 80: + 126.2
other countriesshare: 16.6%units: 23.5 Mn.% vs. 90: + 3.1% vs. 80: + 47.8
* North and South America without Light Trucks.** Argentina and Brazil.*** Asia including Turkey.
5
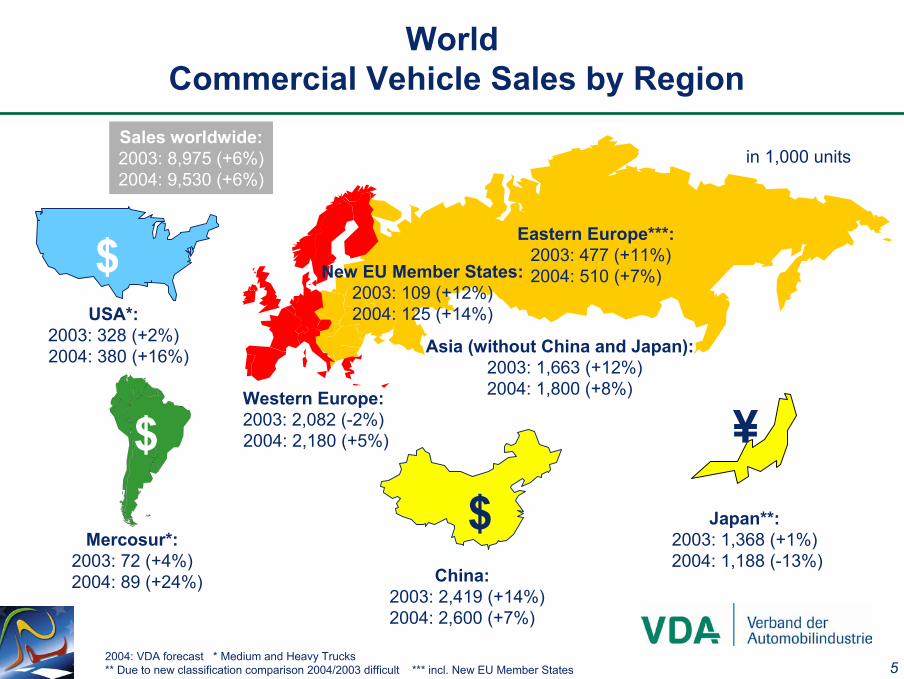
WorldCommercial Vehicle Sales by Region
Sales worldwide:2003: 8,975 (+6%)2004: 9,530 (+6%)
Sales worldwide:2003: 8,975 (+6%)2004: 9,530 (+6%)
USA*:2003: 328 (+2%)2004: 380 (+16%)
$
Japan**:2003: 1,368 (+1%)2004: 1,188 (-13%)
¥
China:2003: 2,419 (+14%)2004: 2,600 (+7%)
$Mercosur*:
2003: 72 (+4%)2004: 89 (+24%)
$Western Europe:2003: 2,082 (-2%)2004: 2,180 (+5%)
Asia (without China and Japan):2003: 1,663 (+12%)2004: 1,800 (+8%)
Eastern Europe***:2003: 477 (+11%)2004: 510 (+7%)
in 1,000 units
2004: VDA forecast * Medium and Heavy Trucks ** Due to new classification comparison 2004/2003 difficult *** incl. New EU Member States
New EU Member States:2003: 109 (+12%)2004: 125 (+14%)

6
WorldCommercial Vehicle Production by Region
Worldin Mn share in % in Mn share in % in Mn share in % in Mn share in % in Mn share in % in Mn
1980 1.6 21.1 0.3 3.9 3.9 51.3 0.2 2.6 1.6 21.1 7.6
1985 1.4 17.0 0.3 3.6 4.6 56.2 0.4 4.9 1.5 18.3 8.2
1990 1.8 22.0 0.2 2.4 3.5 42.7 0.6 7.2 2.2 26.5 8.3
1995 1.8 21.9 0.4 4.9 2.6 31.7 1.1 13.4 2.3 28.1 8.2
2000 2.3 25.9 0.4 4.5 1.8 20.0 1.5 16.9 2.9 32.7 8.9
2003 2.1 23.1 0.3 3.3 1.8 19.8 2.4 26.4 2.5 27.4 9.1
2005 2.2 21.6 0.4 3.9 1.9 18.6 3.0 29.4 2.7 26.5 10.2
2010 2.3 19.1 0.5 4.3 2.0 17.0 4.0 34.0 3.0 25.6 11.8
other countriesWestern Europe USA* Japan China
* Medium- and Heavy-Trucks.
7
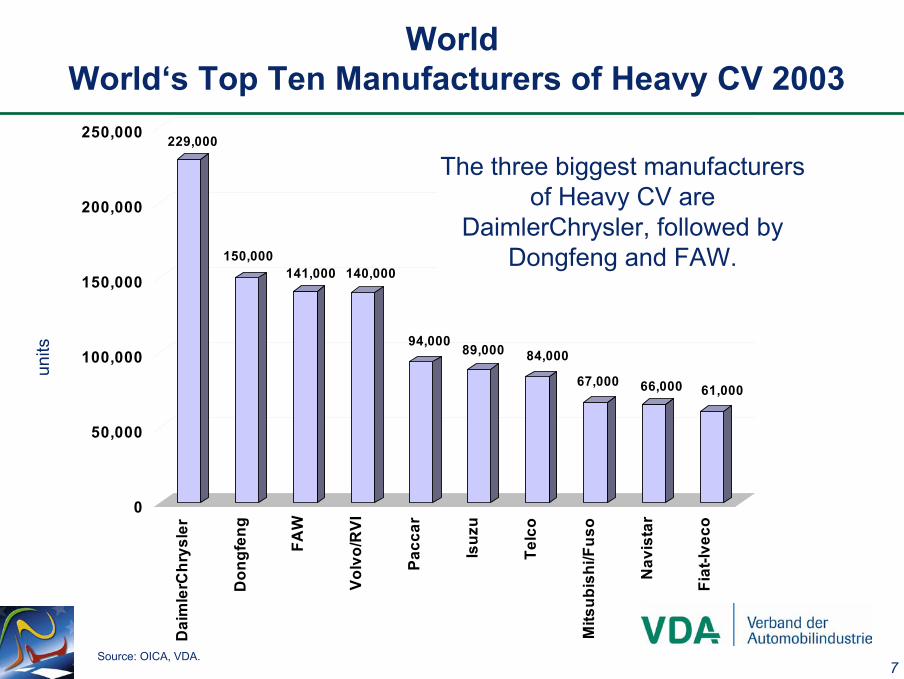
WorldWorld‘s Top Ten Manufacturers of Heavy CV 2003
229,000
150,000141,000 140,000
94,000 89,000 84,000
67,000 66,000 61,000
0
50,000
100,000
150,000
200,000
250,000
Dai
mle
rChr
ysle
r
Don
gfen
g
FAW
Volv
o/R
VI
Pacc
ar
Isuz
u
Telc
o
Mits
ubis
hi/F
uso
Nav
ista
r
Fiat
-Ivec
o
units
Source: OICA, VDA.
The three biggest manufacturers of Heavy CV are
DaimlerChrysler, followed by Dongfeng and FAW.

8
WorldWorld‘s Top Ten Manufacturers of Heavy Buses 2003
28,000
13,000 13,00011,000
7,000 7,000 7,0006,000 6,000
4,000
0
5,000
10,000
15,000
20,000
25,000
30,000
Dai
mle
rChr
ysle
r
Telc
o
Ash
ok L
eyla
nd
FAW
Volv
o
Don
gfen
g
Hyu
ndai
-Kia
Neo
man
Irisb
us
Cha
ngjia
ng B
us
units
Buses over 8 t.Source: OICA, VDA.
DaimlerChrysler held its rank as the leading
manufacturer of heavy buses in 2003.

9
Karosa(Czech Rep.)
Trends towards Globalisation amongstthe Most Important Commercial Vehicle Manufacturers
MitsubishiMotors Corp. 37.3%
Volkswagen
Scania34.0%
Toyota
Hino50.1%
Daihatsu100%
Seat100%
Sisu
Navistar Tatra
HyundaiMotor Company
Kia44.0% Asia Motors
10%
4.4%
DaimlerChrysler
FreightlinerMercedes-BenzEvoBus
Western Star
Orion Americanla France
SterlingSetra Mercedes-Benz
Dodge
PACCAR
DAFLeyland Trucks
FodenTrucks
KenworthTruck
PeterbiltMotors
Ford
Mazda33.4%
Getrag FordTransmission
Nissan Motors
44.6%
23.2%
15%
Cooperation
Astra(Italy)
Naveco(China)
IvecoMagirus
Irisbus
Uralaz(Russia)
Fiat
IvecoEurofire
Iveco InternationalTrucks Australia
Iveco FordTruck
IvecoPegaso
Iveco FiatBrazil
Ssangyong
GM-Daewoo42.1%
Mitsubishi FusoTruck and Bus
Corp.
65.0%
20.0% Daimler HyundaiTruck Corp.
50.0%
AshokLeyland
15%
Source: company data, VDA, Globalinsight
Askam Kamyon(Turkey)BMC
(Turkey)
Levend(Turkey)
Eicher(India)
FAW (Jiefang)
VWdo Brazil
General Motors
Fuji HeavyInd. (20%)
Suzuki20%
Isuzu12%
Vauxhall/Opel100%
IBC100%
Holden
AB Volvo
RenaultTrucks
MackTrucks Volvo BusVolvo Trucks
20%
Renault V.I.
22.5%
Nissan Diesel Dacia100%
Terberg(NL)
33.3%
PSA
Peugeot Citroën
Iveco
LDV (UK)
ZIL (Russia)
GAZ (Russia)
Ikarus BusHeuliez Bus50%
Haveco(China)
50%Otoyol
(Turkey)
27%
97.5%Atlas vehicles
(Marocco)
49%Dongfeng
MAN
ERFÖAF Star SteyrNEOMAN
Neoplan Bus MAN Bus
TFM Bus& Coaches
ZhengzhouYutong BusMAZ
MAN Truck &Bus China

10
-41.0-37.5
-32.6
-20.2 -19.1
-1.9
28.7
13.1
-9.4-3.0
-9.9
10.4
57.8
46.5
-50
-40
-30
-20
-10
0
10
20
30
40
50
60
1.Q. 0
1
2.Q. 0
1
3.Q. 0
1
4.Q. 0
1
1.Q. 0
2
2.Q. 0
2
3.Q. 0
2
4.Q. 0
2
1.Q. 0
3
2.Q. 0
3
3.Q. 0
3
4.Q. 0
3
1.Q. 0
4Ja
n.-May
04
USASales of Heavy-Trucks
chan
geon
pre
viou
sye
arin
per
cen
t
Sales of Heavy-TrucksJan.-May 2004: 72,654Jan.-May 04/03: + 46.5%
Sales of Heavy-TrucksJan.-May 2004: 72,654Jan.-May 04/03: + 46.5%
Clear rebound of U.S.-Heavy-Truck sales 2004

11
107,
433
118.
204 13
1,71
2
11,432
13,223
15,486
17,408
18,015
24,863
136,
273
130,
638
172,
061
0
20,000
40,000
60,000
80,000
100,000
120,000
140,000
160,000
180,000
USA Canada Mexico NAFTA
1-5/2002 1-5/2003 1-5/2004
North AmericaProduction of Medium- and Heavy-Trucks 2004
units
1-5/2004: 131,712change vs. 1-5/03: + 32.5%change vs. 1-5/02: + 22.6%
1-5/2004: 172,061change vs. 1-5/03: + 31.7%change vs. 1-5/02: + 26.2%
1-5/2004: 15,486change vs. 1-5/03: + 17.1%change vs. 1-5/02: + 35.5%
1-5/2004: 24,863change vs. 1-5/03: + 38.0%change vs. 1-5/02: + 42.8%
The production of Medium-and Heavy-Trucks in NAFTA countries increased by 26 per cent in the last two years.
12
30.7
10.2
-13.9
-19.3 -19.5-17.2
-13.7
4.6
22.7
-0.3
15.7
25.2
21.2
30.7
-20
-10
0
10
20
30
40
1.Q. 0
1
2.Q. 0
1
3.Q. 0
1
4.Q. 0
1
1.Q. 0
2
2.Q. 0
2
3.Q. 0
2
4.Q. 0
2
1.Q. 0
3
2.Q. 0
3
3.Q. 0
3
4.Q. 0
3
1.Q. 0
4Ja
n.-May
04
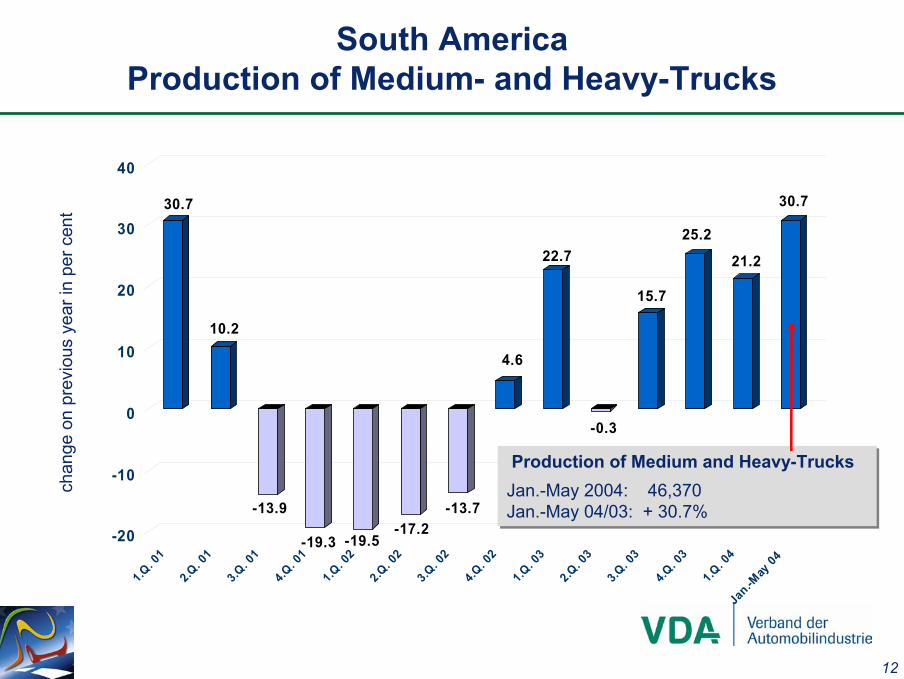
South AmericaProduction of Medium- and Heavy-Trucks
chan
geon
pre
viou
sye
arin
per
cen
t
Production of Medium and Heavy-TrucksJan.-May 2004: 46,370 Jan.-May 04/03: + 30.7%
Production of Medium and Heavy-TrucksJan.-May 2004: 46,370 Jan.-May 04/03: + 30.7%

13
After the market slumped by more than 75 per cent from 2000 to 2002 sales of medium and heavy trucks are on the rise again.
South AmericaSales of Medium- / Heavy-Trucks in Argentina
Einheiten 04 / 03 Einheiten 04 / 03Mercedes-Benz 429 382.0 1,985 451.4 32.6 24.9 Volkswagen 150 72.4 1,037 229.2 17.0 21.8 Total German Trucks 579 229.0 3,022 347.7 49.6 46.6 Ford 319 293.8 1,878 528.1 30.8 20.7 GM 0 - 0 - 0.0 0.0 Iveco 202 155.7 697 98.0 11.4 24.3 Scania 96 638.5 365 1303.8 6.0 1.8 Sonstige 25 66.7 135 42.1 2.2 6.6
Total Trucks 1,221 235.4 6,097 321.4 100.0 100.0
Medium and Heavy Trucks
May January - May % market share (Jan.-May)2004 2003
Source: Adefa.

14
South AmericaSales of Medium- / Heavy-Trucks in Brazil
Einheiten Einheiten
Mercedes-Benz 921 8.1 4,374 9.7 29.2 28.8 Volkswagen 1,044 11.4 4,901 - 2.1 32.7 36.2 Total German Trucks 1,965 9.8 9,275 3.1 61.8 65.0 Agrale 69 30.2 262 - 3.7 1.7 2.0 Fiat 117 317.9 254 71.6 1.7 1.1 Ford 900 16.0 4,183 11.3 27.9 27.1 GM 1 - 1 - 0.0 0.0 PSA 10 25.0 56 100.0 0.4 0.2 Iveco 180 36.4 968 50.8 6.5 4.6
Total Medium Trucks 3,242 16.4 14,999 8.4 100.0 100.0
Einheiten Einheiten
Mercedes-Benz 1,245 16.2 5,913 24.2 32.4 35.0 Volkswagen 1,083 27.6 4,655 27.1 25.5 26.9 Total German Trucks 2,328 21.3 10,568 25.5 57.9 61.9 Ford 513 22.4 2,418 49.8 13.2 11.9 Iveco 103 87.3 506 146.8 2.8 1.5 Scania 503 75.9 2,205 33.2 12.1 12.2 Volvo 566 48.2 2,559 50.0 14.0 12.5
Total Heavy Trucks 4,013 31.1 18,256 34.2 100.0 100.0
Medium Trucks May Januar - May
04 / 03 04 / 03
Heavy Trucks May Januar - May
04 / 03 04 / 03 2004 2003
% market share 2004 2003
% market share
Source: Anfavea.

15
22 30 27
-16
24
-30 -31
29
182
-50
0
50
100
150
200
China
Indien
Indon
esien
Japa
n
Malays
ia
Philipp
inen
Südko
rea
Taiwan
Thaila
nd
AsiaCV Sales in Individual Countries January-May 2004
chan
geon
pre
viou
sye
arin
per
cen
t
Sales of Commercial Vehicles in Asia:Striking increase in Turkey, strong rise in
India, Thailand, China and Malaysia.
China1,206,618
India115,079
Indonesia*131,257 Japan1)
470,144
Malaysia*31,667 Philippines
21,476South Korea
100,146
Taiwan64,196
Turkey118,935
* Sales up to April.1) Due to new statistical classification comparison to 2003 is not significant.

16
AsiaSales of Commercial Vehicles in China
0
50,000
100,000
150,000
200,000
250,000
300,000
1998 1999 2000 2001 2002 2003 2004
units
Trends and seasonally-adjusted monthly figures.
Total Sales of Commercial VehiclesJan.-May 2004: 1,206,619 Jan.-May 04/03: + 20.5%
Total Sales of Commercial VehiclesJan.-May 2004: 1,206,619 Jan.-May 04/03: + 20.5%
2003 total sales of Commercial Vehicles increased by
12.6 per cent to 2.4 Mn.

17
ChinaProduction of Heavy-Trucks by Manufacturer 2003
.
FAW Group Corp.: 98,288(-21%)
Dongfeng MotorGroup: 84,022
(-1%)
China National Heavy Duty: 21,136
(62%)
Beijing Auto Industry: 16,106
(589%) ChongqingHongyan: 16,082
(28%)
others: 19,513(80%)
33%
8% 6%6%
8%
39%
Source: Catarc.In brackets: change on previous year.
Production of Heavy-TrucksJan.-May 2004: 143,975 Jan.-May 04/03: + 14.1%
Production of Heavy-TrucksJan.-May 2004: 143,975 Jan.-May 04/03: + 14.1%

18
ChinaProduction of Medium-Trucks by Manufacturer 2003
.
Dongfeng Motor Group: 66,057(-16%)
Chengdu Wangpai: 8,965(49%)
ShannxiAuto: 8,226
(6%)
HubeiSanhuan:
3,737(-52%)
FAW Group: 42,289(-21%)
52%
33%
7%6%
2%
Source: Catarc.In brackets: change on previous year.
Production of Medium-TrucksJan.-May 2004: 80,836 Jan.-May 04/03: + 29.1%
Production of Medium-TrucksJan.-May 2004: 80,836 Jan.-May 04/03: + 29.1%

19
AsiaSales of Commercial Vehicles in India
0
5,000
10,000
15,000
20,000
25,000
30,000
35,000
01 02 03 04
Total Sales Medium- / Heavy-CV
units
Total sales of commercial vehicles:Jan.-May 2004: 115,079Jan.-May 04/03: + 30.0%
Total sales of commercial vehicles:Jan.-May 2004: 115,079Jan.-May 04/03: + 30.0%
From 2001 to 2003 sales of medium and heavy commercial vehicles rose by 64 per cent, while sales of all classes went up by 61 per cent.
Source: SIAM.

20
AsiaProduction of Commercial Vehicles in Turkey
units
2003 production of medium and heavy commercial vehicles rose by 55 per cent, while production of buses rose by 89 per cent.
150%
Source: OSD.
150%
0
10,000
20,000
30,000
40,000
50,000
60,000
70,000
96 97 98 99 00 01 02 1-5/03 1-5/04
busesheavy cvmedium cv
150%

21
Eastern EuropeProduction and Sales of Commercial Vehicles
units
0
100,000
200,000
300,000
400,000
500,000
600,000
1994 1995 1996 1997 1998 1999 2000 2001 2002 2003
Production SalesDespite recovery in the last two years,
production in 2003 only reached55 per cent of production in 1992 .

22
Eastern EuropeSales of Commercial Vehicles up to 6 t by country 2003
units
0
20,000
40,000
60,000
80,000
100,000
120,000
140,000
160,000
180,000
LatviaLith
uania
EstoniaBulgari
aSloveniaSlovakia
Czech R
epublicRoman
ia
Poland
Ukraine
Russia
2002: 282,158 Vehicles 2003: 304,072 Vehicles
In 2003 sales of commercial vehicles up to 6 t rose by 8 per cent to 304,100 units.
The Russian Federation accounted for 57 per cent of total sales.

23
Eastern EuropeSales of Commercial Vehicles over 6 t by country 2003
0
10,000
20,000
30,000
40,000
50,000
60,000
70,000
Estonia
LatviaBulgari
aLith
uaniaSloveniaSlovakiaRoman
ia
Ukraine
Czech R
epublic
Poland
Russia
2002: 92,457 Vehicles 2003: 100,517 Vehicles
units
Clear rise of sales (+ 9 per cent) of commercialvehicles over 6 t to 100.500 units.
The Russian Federation accounted for two thirds of total sales.

24
34
30
15
3
18
10
0
5
10
15
20
25
30
35
40
Polen
Tsch
ech.
Rep.
Slowak
. Rep
.
Ungar
n
Rumän
ien
Russla
nd
Eastern EuropeSales of Commercial Vehicles, January-May 2004
chan
geon
pre
viou
sye
arin
per
cen
t
Poland14,227
Czech Republic12,265
Slovakia4,877
Hungary*9,969
Romania12,905
Russia*91,624
* Sales up to April.
Sales in Eastern Europe:Signifcant growth rates reflect highertransport needs in „bigger“ Europe.

25
13%
14%
16%
17%
5%
11%
12%12%
PolandSales of Commercial Vehicles over 6 t, Jan.-April 2004
.
Volvo: 535(453)
DAF: 406(244)
Scania: 368(270)
Iveco: 351(161)
others: 156(306)
In brackets: Sales of previous year.Source: Samar.
Renault: 446(329)
Mercedes: 496(401)
MAN: 388(214)
Sales of commercial vehicles:Jan.-April 2004: 3,146Jan.-April 04/03: + 32%
Sales of commercial vehicles:Jan.-April 2004: 3,146Jan.-April 04/03: + 32%

26
Czech RepublicSales of Medium- and Heavy-Trucks, Jan.-May 2004
474 471
388
313293
256 241
303
0
100
200
300
400
500
600
Iveco Mercedes Renault MAN DAF Scania Volvo others
units
Source: SAP.
Sales of Medium- and Heavy-TrucksJan.-May 2004: 2,739Jan.-May 04/03: – 7%
Sales of Medium- and Heavy-TrucksJan.-May 2004: 2,739Jan.-May 04/03: – 7%

27
SlovakiaSales of Medium- and Heavy-Trucks, Jan.-May 2004
233
183
166 163
125
88 87
27
0
50
100
150
200
250
Iveco Mercedes Renault Volvo Scania DAF MAN others
units
Source: ZAP.
Sales of Medium- and Heavy-TrucksJan.-May 2004: 1,072Jan.-May 04/03: + 5%
Sales of Medium- and Heavy-TrucksJan.-May 2004: 1,072Jan.-May 04/03: + 5%
28
207,
264
205,
896
199,
494
218,
351
255,
164
237,
843
233,
116
0
40,000
80,000
120,000
160,000
200,000
240,000
1996 1997 1998 1999 2000 2001 2002 2003
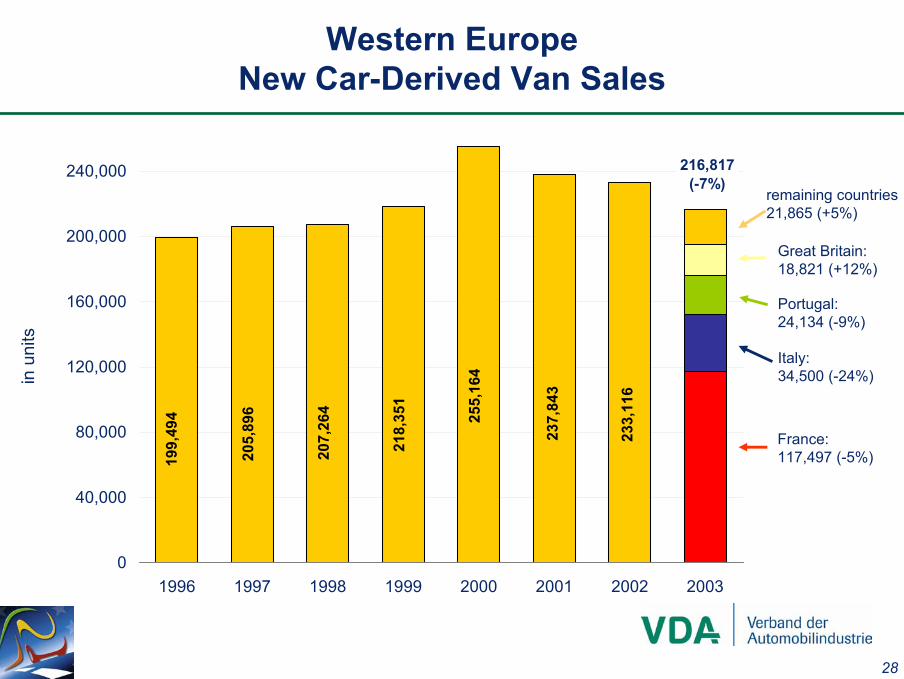
216,817(-7%)
Western EuropeNew Car-Derived Van Sales
in u
nits
France:117,497 (-5%)
Italy:34,500 (-24%)
Portugal:24,134 (-9%)
Great Britain:18,821 (+12%)
remaining countries21,865 (+5%)

29
95
5
31
572
287
74
654
217
53
5
28
449
249
62
345
15
199
11
0 100 200 300 400 500 600 700
Large Pickups
Small Pickups
Heavy Vans
Full-size Vans
Mid-size Vans
Compact Vans
Small Vans
Micro Vans
Car-Derived Vans
1996: 1.406 mn. cv up to 6 t
2003: 1.946 mn. cv up to 6 t
Western EuropeNew Registrations of CV up to 6 t by Segment
Main market growth took place inthe segment of small vans (+89%).
in 1
,000
uni
ts
30
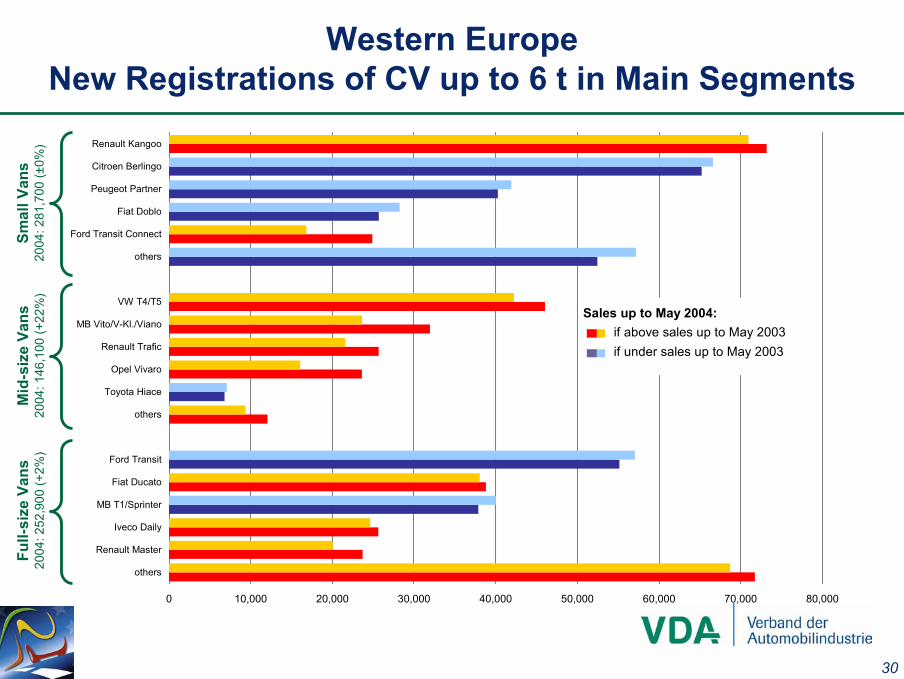
Western EuropeNew Registrations of CV up to 6 t in Main Segments
Smal
l Van
s20
04: 2
81,7
00 (±
0%)
Mid
-siz
eVa
ns20
04: 1
46,1
00 (+
22%
)Fu
ll-si
zeVa
ns20
04: 2
52,9
00 (+
2%)
0 10,000 20,000 30,000 40,000 50,000 60,000 70,000 80,000
others
Renault Master
Iveco Daily
MB T1/Sprinter
Fiat Ducato
Ford Transit
others
Toyota Hiace
Opel Vivaro
Renault Trafic
MB Vito/V-Kl./Viano
VW T4/T5
others
Ford Transit Connect
Fiat Doblo
Peugeot Partner
Citroen Berlingo
Renault Kangoo
Sales up to May 2004:if above sales up to May 2003if under sales up to May 2003

31
Western EuropeMarket share of CV up to 6 t*, up to May 2004
In this year‘s first five months the German manufacturers were ableto slightly expand their market share.
per c
ents
hare
s
* by segment (exclusive car-derived vans)
DaimlerChrysler10%
Ford11%
Toyota2%
VW Group9%
Fiat Group14%
Renault / Nissan20%
Opel7%
others5%
PSA22%
32
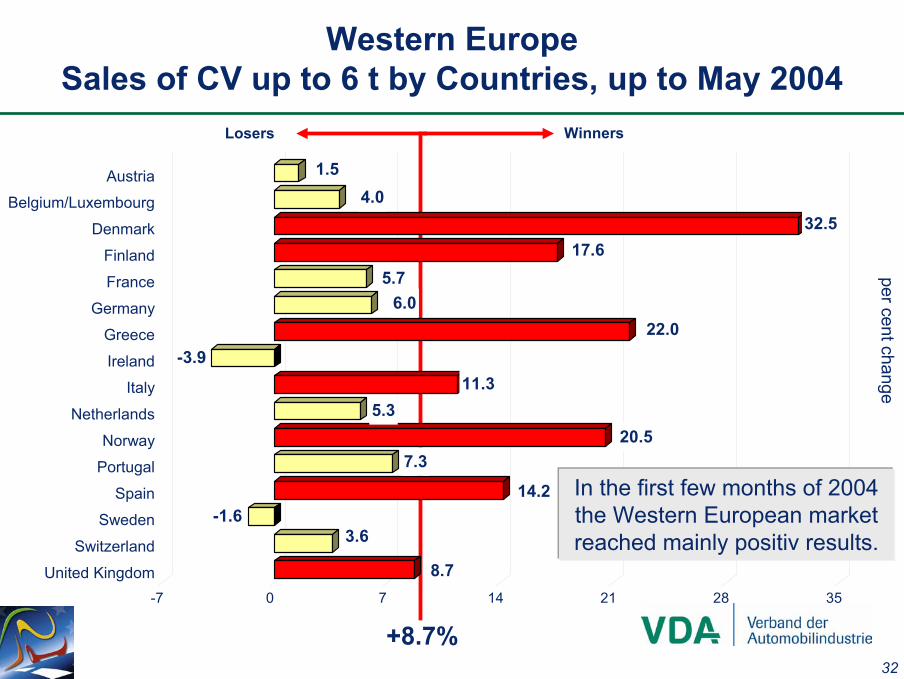
Losers Winners
+8.7%
8.7
3.6-1.6
14.2
7.320.5
5.311.3
-3.922.0
6.05.7
17.632.5
4.01.5
-7 0 7 14 21 28 35
United Kingdom
Switzerland
Sweden
Spain
Portugal
Norway
Netherlands
Italy
Ireland
Greece
Germany
France
Finland
Denmark
Belgium/Luxembourg
Austria
Western EuropeSales of CV up to 6 t by Countries, up to May 2004
per centchange
In the first few months of 2004 the Western European marketreached mainly positiv results.
33
37,3
17
500,
754
406,
654
324,
418
196,
653
217,
312
218,
310
131,
080
30,3
75
538,
759
433,
785
308,
434
255,
841
210,
789
204,
168
142,
460
0
100,000
200,000
300,000
400,000
500,000
600,000
PSA Renault/Nissan Fiat/Iveco Ford VW Group DaimlerChrysler
GM others
2002 2003
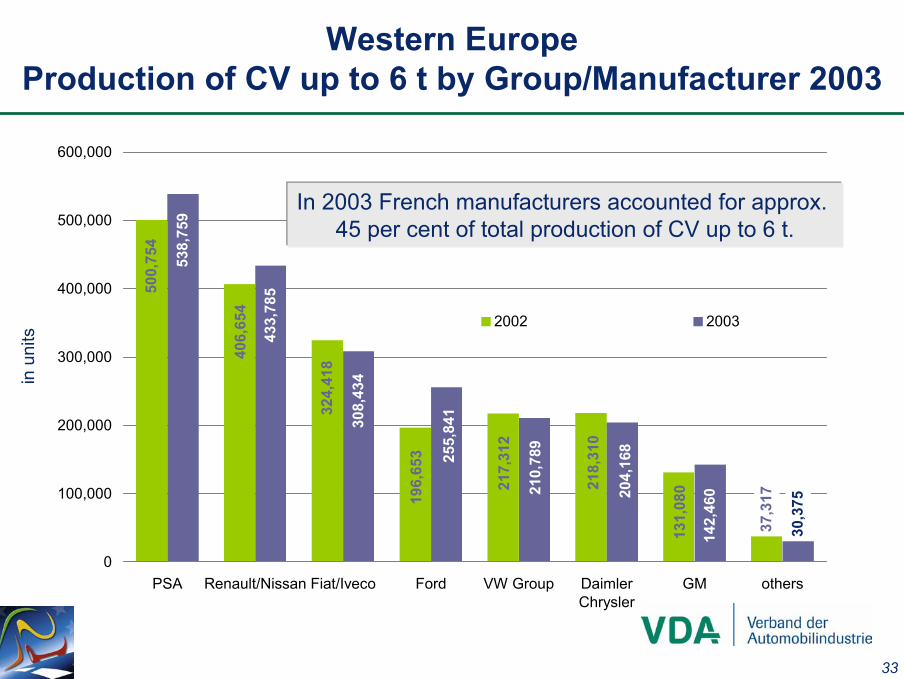
Western EuropeProduction of CV up to 6 t by Group/Manufacturer 2003
in u
nits
In 2003 French manufacturers accounted for approx. 45 per cent of total production of CV up to 6 t.

34
Western EuropeCV Sales over 6 t up to 16 t, January - May 2004
units 04/03 in % units 04/03 in % 2004 2003
Belgium 132 - 35 808 - 8 2.6 2.4 Denm ark 38 6 207 7 0.7 0.6 Germ any 2,146 - 9 10,594 4 33.8 33.4 Finland 39 - 22 221 21 0.7 0.6 France 579 - 16 3,383 - 15 10.8 11.4 Greece 62 3 248 47 0.8 0.7 United Kingdom 1,377 - 3 7,146 3 22.8 22.4 Ireland 101 29 569 4 1.8 1.3 Italy 619 - 9 2,919 - 8 9.3 11.3 Luxem bourg 12 - 20 59 - 26 0.2 0.2 Netherlands 126 6 817 13 2.6 2.1 Aus tria 63 - 33 369 - 13 1.2 1.4 Portugal **) 43 - 57 493 - 7 1.6 1.6 Sweden 59 - 6 290 - 12 0.9 0.8 Spain 575 4 2,654 2 8.5 8.1 European Union 5,971 - 8 30,777 - 1 98.1 98.3 Norway 61 - 6 394 25 1.3 1.1 Switzerland 32 - 41 198 - 7 0.6 0.6
Western Europe Total 6,064 - 8 31,369 - 1 100.0 100.0
WE without Germany 3,918 - 8 20,775 - 3 66.2 66.6
m arket shareCommercial Vehicles over 6 t up to 16 t*
May January - May
* Without buses.

35
Western EuropeCV Sales over 16 t, January - May 2004
units 04/03 in % units 04/03 in % 2004 2003
Belgium 615 - 1 3,971 5 4.0 3.4 Denm ark 346 10 1,706 11 1.7 1.7 Germ any 4,535 13 23,078 19 23.2 21.6 Finland 241 8 1,347 27 1.4 1.2 France 2,987 12 17,898 4 18.0 17.2 Greece 63 11 278 0 0.3 0.3 United Kingdom 2,760 7 13,576 1 13.6 16.0 Ireland 275 7 1,529 3 1.5 1.2 Italy 1,851 - 9 8,616 - 8 8.6 10.4 Luxem bourg 76 - 13 367 - 22 0.4 0.5 Netherlands 1,087 4 6,011 6 6.0 4.9 Aus tria 648 0 3,377 16 3.4 3.3 Portugal 269 15 1,380 32 1.4 1.2 Sweden 330 - 20 1,670 - 3 1.7 2.0 Spain 2,623 8 12,609 10 12.7 12.7 European Union 18,706 6 97,413 7 97.7 97.7 Norway 256 7 1,237 15 1.2 1.2 Switzerland 147 - 38 1,017 - 15 1.1 1.1
Western Europe Total 19,109 6 99,667 7 100.1 100.0
WE without Germany 14,574 4 76,589 4 76.9 78.4
m arket shareCommercial Vehicles over 16 t*
May January - May
* Without buses.
36
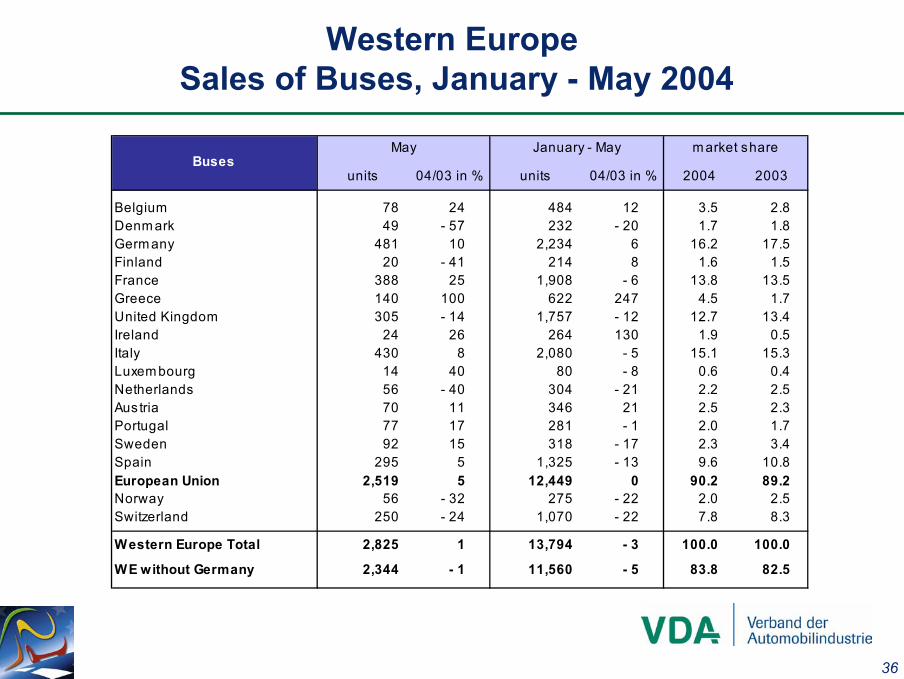
Western EuropeSales of Buses, January - May 2004
units 04/03 in % units 04/03 in % 2004 2003
Belgium 78 24 484 12 3.5 2.8 Denm ark 49 - 57 232 - 20 1.7 1.8 Germ any 481 10 2,234 6 16.2 17.5 Finland 20 - 41 214 8 1.6 1.5 France 388 25 1,908 - 6 13.8 13.5 Greece 140 100 622 247 4.5 1.7 United Kingdom 305 - 14 1,757 - 12 12.7 13.4 Ireland 24 26 264 130 1.9 0.5 Italy 430 8 2,080 - 5 15.1 15.3 Luxem bourg 14 40 80 - 8 0.6 0.4 Netherlands 56 - 40 304 - 21 2.2 2.5 Aus tria 70 11 346 21 2.5 2.3 Portugal 77 17 281 - 1 2.0 1.7 Sweden 92 15 318 - 17 2.3 3.4 Spain 295 5 1,325 - 13 9.6 10.8 European Union 2,519 5 12,449 0 90.2 89.2 Norway 56 - 32 275 - 22 2.0 2.5 Switzerland 250 - 24 1,070 - 22 7.8 8.3
Western Europe Total 2,825 1 13,794 - 3 100.0 100.0
WE without Germany 2,344 - 1 11,560 - 5 83.8 82.5
BusesMay m arket shareJanuary - May

37
Paccar13%
Volvo/RVI29%
other2%
Mercedes18%
Scania13%
Iveco-Magirus4%
MAN15%
Fiat-Gruppe*)6%
Western EuropeMarket Share of CV over 16 t, January - May 2004
* Without Iveco-Magirus.
The market share of VDA companies was 50 per cent
during the first five months of this year.
38
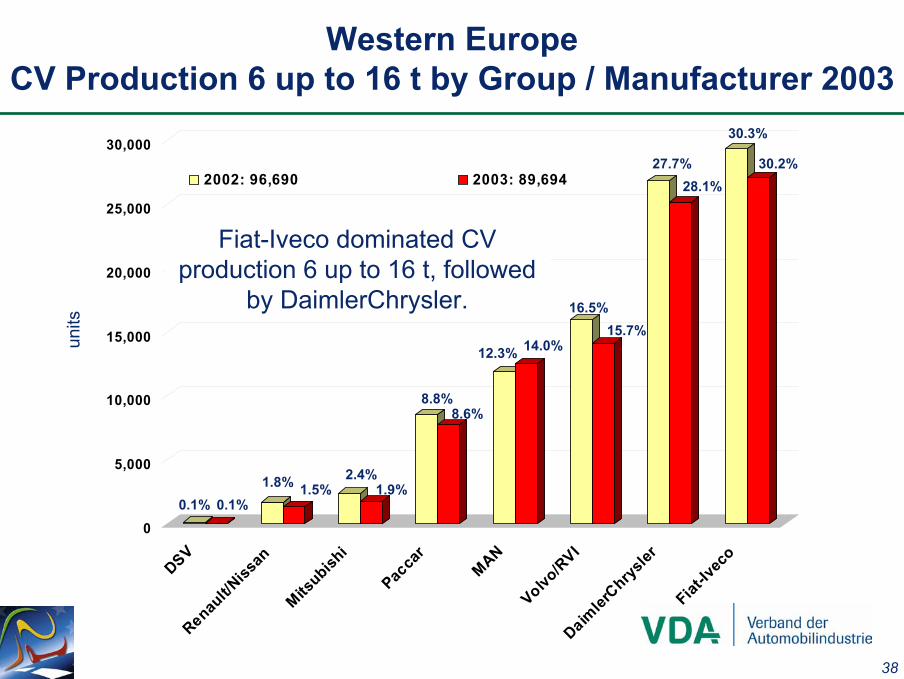
Western EuropeCV Production 6 up to 16 t by Group / Manufacturer 2003
units
0
5,000
10,000
15,000
20,000
25,000
30,000
DSVRenau
lt/Niss
an
Mitsubish
i
Pacca
r
MAN
Volvo/R
VIDaim
lerChrys
ler
Fiat-Iv
eco
2002: 96,690 2003: 89,694
0.1%1.5% 1.9%
15.7%
8.6%
14.0%
30.2%28.1%
0.1%1.8% 2.4%
16.5%
8.8%
12.3%
30.3%
27.7%
Fiat-Iveco dominated CV production 6 up to 16 t, followed
by DaimlerChrysler.

39
0
10,000
20,000
30,000
40,000
50,000
60,000
70,000
80,000
90,000
others
Pacca
r
Fiat-Iv
eco
Scania
MANDaim
lerChrysler
Volvo/R
VI2002: 273,249 2003: 288,138
0.4%
11.0% 11.1%
14.6%13.4%
20.6%
28.8%
0.3%
10.9%12.2%
15.0%13.6%
29.3%
Western EuropeCV Production over 16 t by Group / Manufacturer 2003
units
.
18.7%
Volvo/RVI was the mostimportant manufacturer of
commercial vehicles over 16 t.

40
606
352
219262
17384
20
23
35
105
131 30
14
2130
20
100
200
300
400
500
600
700
Spain
France
German
y
Italy
United
King
dom
Sweden
Belgium
Netherl
ands
Portug
al
Austria
cv over 6 t
cv up to 6 t
Western EuropeCV Production by Weight Classes in 2003
Germany accounts for 34 per cent of Western European CV production over 6 t.
in 1
,000
uni
ts

II. Germany- Domestic Market- Exports- Production- Key Figures - Freight Transport Market
page 42
page 54
page 60
page 65
page 69

42
4,000
6,000
8,000
10,000
12,000
14,000
16,000
18,000
20,000
98 99 00 01 02 03 04
GermanyDomestic Orders for Commercial Vehicles up to 6 t
units
up to May 2004: -8%
up to June 2004: +12%
total up to May 2004: +4%
imported makes
German makes
Trends and seasonally-adjusted monthly figures
Orders for transporters are rising slightly.
43
500
1,500
2,500
3,500
4,500
5,500
6,500
7,500
8,500
98 99 00 01 02 03 04
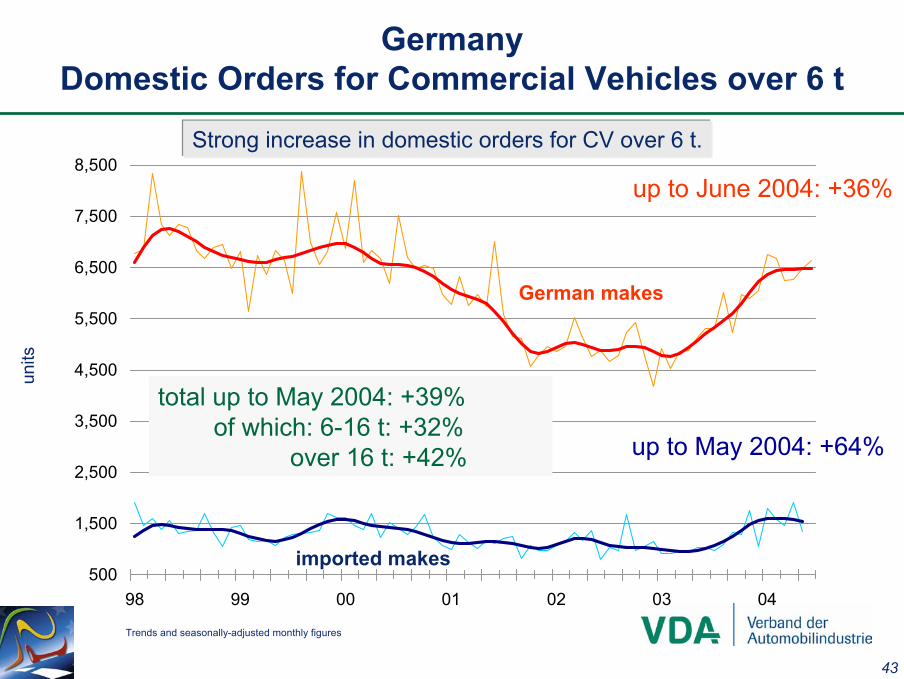
GermanyDomestic Orders for Commercial Vehicles over 6 t
units
up to May 2004: +64%
up to June 2004: +36%
total up to May 2004: +39%of which: 6-16 t: +32%
over 16 t: +42%
imported makes
German makes
Trends and seasonally-adjusted monthly figures
Strong increase in domestic orders for CV over 6 t.

44
0
10,000
20,000
30,000
40,000
50,000
60,000
70,000
98 99 00 01 02 03 04
GermanyDomestic Order Backlog of Commercial Vehicles
units
May 2004: 11,000 (-6%)
June 2004: 55,300 (+34%)< 6 t: 35,500 (+24%)> 6 t: 19,800 (+56%)
total May 2004: 67,400 (+21%)
imported makes
German makes
Trends and seasonally-adjusted monthly figures imported makes: order backlog up to 3.5 t
45
Mercedes20.7%
VW Group17.7%
Ford9.3%
Renault8.0%
Japanese brands5.1%
Fiat / Iveco19.6%
Opel10.7%
PSA6.3%
others2.6%
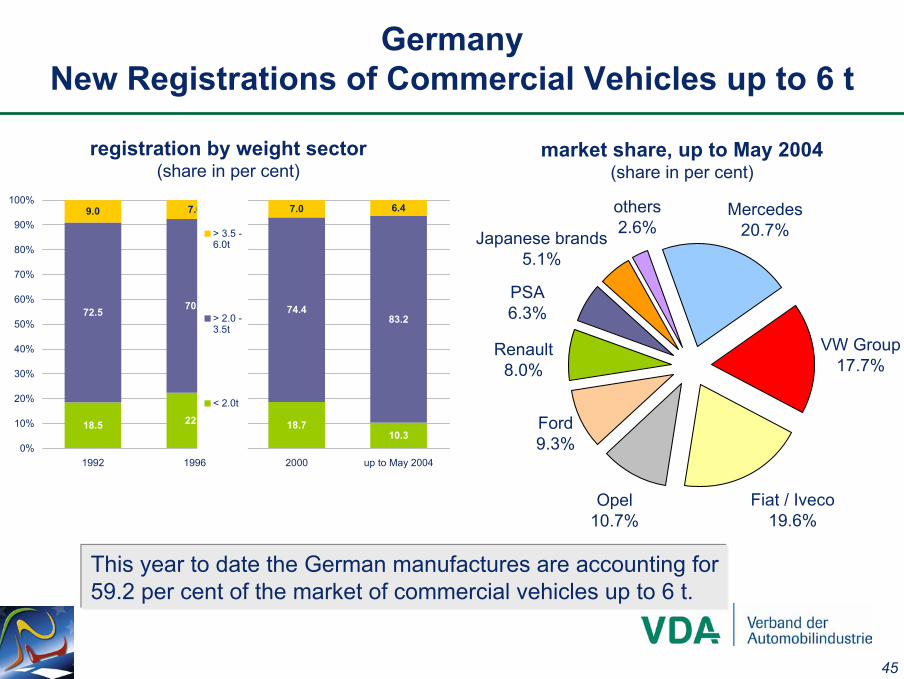
GermanyNew Registrations of Commercial Vehicles up to 6 t
registration by weight sector(share in per cent)
market share, up to May 2004(share in per cent)
This year to date the German manufactures are accounting for59.2 per cent of the market of commercial vehicles up to 6 t.
18.5 22.4 18.710.3
72.5 70.0 74.483.2
9.0 7.6 7.0 6.4
0%
10%
20%
30%
40%
50%
60%
70%
80%
90%
100%
1992 1996 2000 up to May 2004
> 3.5 -6.0t
> 2.0 -3.5t
< 2.0t

46
GermanyNew Registrations of CV up to 6 t in the Main Segments
units
109,
718
104,
298
60,3
73
104,
967
84,9
6293,8
11
43,9
47
42,6
35
34,9
52
0
20,000
40,000
60,000
80,000
100,000
120,000
Small Van Mid-size Van Full-size Van
1998 2000 2002 2003 05/2003 05/2004
-7%+24% -3%
03/98: -4%03/98: -19%
03/98
: +55
%
Renault KangooCitroën Berlingo
Opel Combo
VW T 5MB Vito / V-Kl. / Viano
Opel Vivaro
MB SprinterFord Transit
VW LT

47
GermanyMarket Shares of Commercial Vehicles over 6 t by Make
CV over 16 t, up to May 2004(share in per cent)
CV over 6 up to 16 t, up to May 2004(share in per cent)
The German manufacturers are dominating both the medium-and the heavy-duty CV segment.
Mercedes47.2%
MAN / ERF23.8%
Fiat / Iveco18.8%
others10.2%
Mercedes37.8%
MAN / ERF27.4%
Fiat / Iveco6.9%
Scania6.8%
Volvo / RVI11.3%
Paccar8.1%
others1.7%
48
1,500
2,000
2,500
3,000
3,500
4,000
4,500
5,000
5,500
98 99 00 01 02 03 04
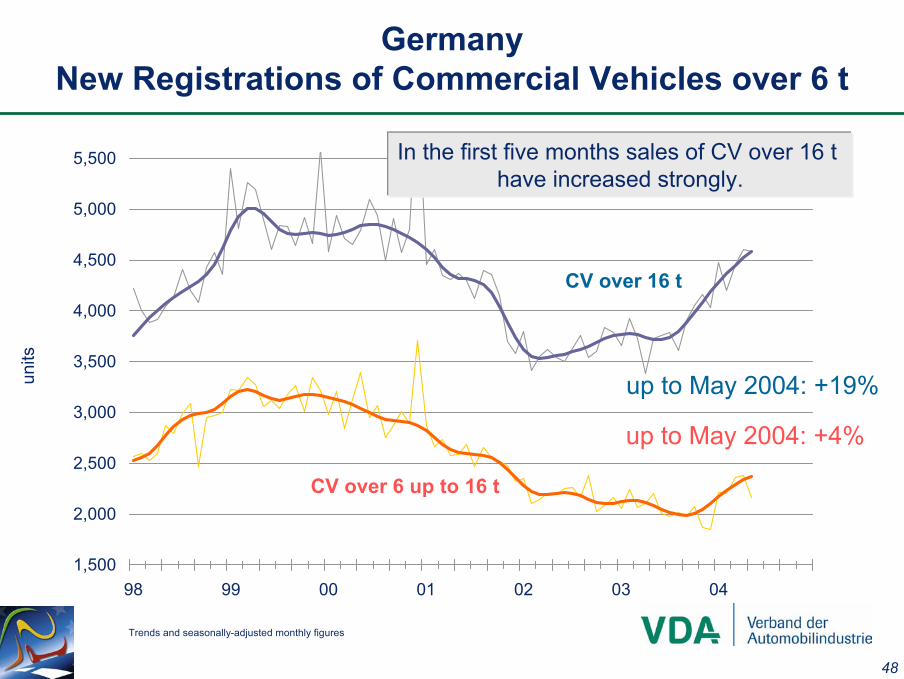
GermanyNew Registrations of Commercial Vehicles over 6 t
Trends and seasonally-adjusted monthly figures
up to May 2004: +4%
up to May 2004: +19%units
CV over 16 t
CV over 6 up to 16 t
In the first five months sales of CV over 16 t have increased strongly.

49
0
10
20
30
40
50
60
70
6-10 t 10-12 t 12-14 t 14-16 t over 16 t
1994 1998 2002 up to May 2004
GermanyNew Registrations of Commercial Vehicles over 6 t
shar
ein
per
cen
t
Apart from the weight segment of over 16 t the segmentof over 10 to 12 t also gained importance.

50
2,70
3
2,43
9
2,31
2
2,03
3
2,04
0
575 584
9,18
1 9,99
5
7,41
7
5,85
6
5,55
3
1,67
6
2,21
1
0
1,000
2,000
3,000
4,000
5,000
6,000
7,000
8,000
9,000
10,000
1999 2000 2001 2002 2003 up to May2003
up to May2004
tipper up to 6 t tipper over 6 t
+24%
+2%
GermanyNew Registrations of Tippers
units
After three years of decline tipper newregistrations have started to increase again in 2004.

51
20,0
39
17,6
32
11,4
68
11,4
80
15,9
03
17,0
93 19,3
44
24,9
72
28,4
57
27,8
95
25,9
67
23,7
51 25,6
30
11,1
37 13,3
55
0
5,000
10,000
15,000
20,000
25,000
30,000
1991 1992 1993 1994 1995 1996 1997 1998 1999 2000 2001 2002 2003 up toMay2003
up toMay2004
16
20
24
28
32
36
40
+20%
GermanyNew Registrations of Semitrailer Tractors
new
regi
stra
tions
in u
nits
The demand for semitrailer tractors ison record levels right now.
shareof sem
itrailertractorsin new
registrationsof
comm
ercialvehiclesover6 t
52
800
1,000
1,200
1,400
1,600
1,800
2,000
2,200
2,400
98 99 00 01 02 03 04
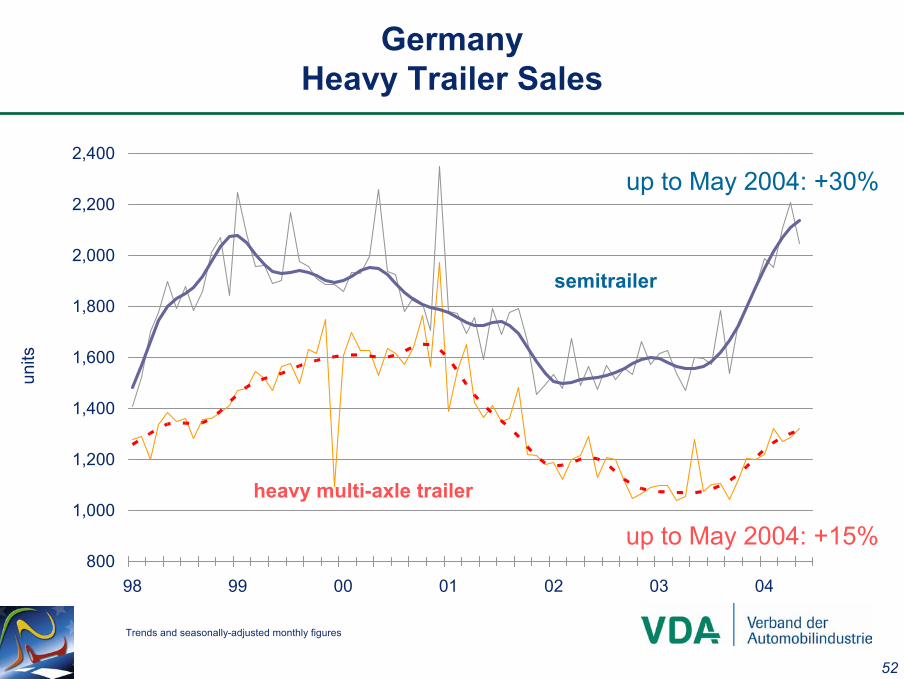
GermanyHeavy Trailer Sales
units
Trends and seasonally-adjusted monthly figures
up to May 2004: +15%
up to May 2004: +30%
semitrailer
heavy multi-axle trailer

53
800
1,200
1,600
2,000
2,400
2,800
98 99 00 01 02 03 04
GermanyNew Registrations of Motor Caravans and Caravans
units
Trends and seasonally-adjusted monthly figures
up to May 2004: +7%
up to May 2004: -4%
caravans
motor caravans

54
9,000
13,000
17,000
21,000
25,000
29,000
33,000
98 99 00 01 02 03 04
GermanyForeign Orders and Exports of CV up to 6 t
units
up to June 2004*: +26%
Trends and seasonally-adjusted monthly figures* Change figures are based on previous year figures that were corrected later due to the move of production sites** Incl. intake of orders for vehicles from foreign production (in Europe)
up to June 2004*: +5%
exports
foreign demand**

55
14,338
7,156
4,605
4,260
3,912
3,841
2,596
0 3,000 6,000 9,000 12,000 15,000
United Kingdom
France
Netherlands
Spain
Italy
Turkey
Belgium (-19%)
(+337%)
(-16%)
(+4%)
(-4%)
(+3%)
(+25%)
GermanyExports of CV up to 6 t in Selected Countries*, up to May 2004
Expo
rts in
uni
ts(C
hang
e ag
ains
tpre
viou
sye
arin
bra
cket
s)
* Exports adjusted due to move of production
Exports: 58,500 (+3%)EU-15: 44,700 (+4%)new EU-10: 3,800 (-2%)Asia: 4,700 (+163%)

56
6,000
7,000
8,000
9,000
10,000
11,000
12,000
13,000
98 99 00 01 02 03 04
GermanyForeign Orders and Exports of CV over 6 t
units
up to June 2004: +34%
up to June 2004: +14%
exports
foreign demand**
Trends and seasonally-adjusted monthly figures** Incl. intake of order for vehicles from foreign production (in Europe)

57
5,783
4,956
3,898
3,810
1,922
1,841
1,730
1,623
0 1,000 2,000 3,000 4,000 5,000 6,000
United Kingdom
France
Italy
Spain
Austria
Turkey
South Africa
Poland (+65%)
(+15%)
(+153%)
(+1%)
(+2%)
(-18%)
(-7%)
(+8%)
Germany Exports of CV over 6 t in Selected Countries, up to May 2004
Expo
rts in
uni
ts(C
hang
e ag
ains
tpre
viou
sye
arin
bra
cket
s) Exports: 43,700 (+11%)EU-15: 25,400 (-1%)new EU-10: 4,200 (+30%)Asia: 7,500 (+40%)Africa: 2,900 (+17%)

58
1,472
1,073
983
881
806
419
0 400 800 1,200 1,600
Turkey
Iran
Saudi Arabia
Kuwait
United Ar. Emirates
Oman
up to May 2003
up to May 2004
(+122%)
(+71%)
(+2,281%)
(-40%)
(+22%)
(+116%)
GermanyExports of CV over 16 t in Important Asian Countries
Expo
rts in
uni
ts(C
hang
e ag
ains
tpre
viou
sye
arin
bra
cket
s)
This year to date exports of CV over 16 t to Asia have increased above averageby 41 per cent.

59
9,747 11,371
19,04014,152
22,891
28,435 27,522
17,731
46,025
63,655
25,856
31,507(+22%)
89,239(-10%)
98,996
0
10,000
20,000
30,000
40,000
50,000
60,000
70,000
80,000
90,000
100,000
92 93 94 95 96 97 98 99 00 01 02 03 -04/03 -04/04
GermanyExports of Used Commercial Vehicles to Eastern Europe
Source: Statistisches Bundesamt
units
In this year‘s first five months a total of 49,700 used CV was shipped abroad (+21%), 31,500 of which were sent to Eastern Europe (+22%) and 7,000 of those (+16%) to Poland.
up to April 2004Trucks < 5t 16,826 (+21%)Trucks > 5t 9,535 (+18%)Semitrailer tractors 3,870 (+28%)Buses 1,276 (+51%)
60
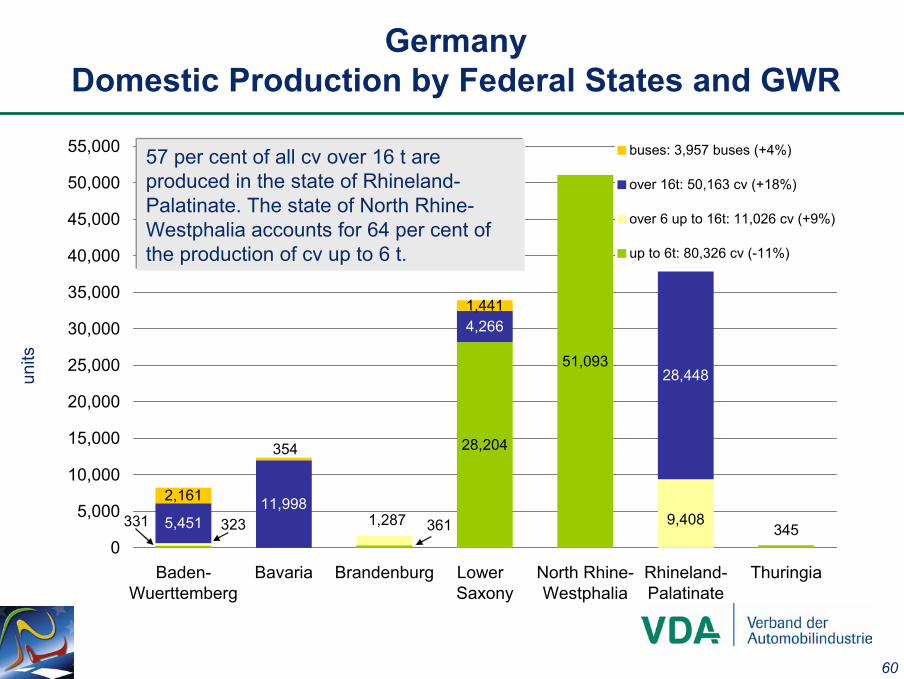
28,204
51,093
5,45111,998
4,266
28,448
2,161
1,441
323 361 345331 1,287 9,408
354
0
5,000
10,000
15,000
20,000
25,000
30,000
35,000
40,000
45,000
50,000
55,000
Baden-Wuerttemberg
Bavaria Brandenburg Lower Saxony
North Rhine-Westphalia
Rhineland-Palatinate
Thuringia
buses: 3,957 buses (+4%)
over 16t: 50,163 cv (+18%)
over 6 up to 16t: 11,026 cv (+9%)
up to 6t: 80,326 cv (-11%)
GermanyDomestic Production by Federal States and GWR
units
57 per cent of all cv over 16 t areproduced in the state of Rhineland-Palatinate. The state of North Rhine-Westphalia accounts for 64 per cent of the production of cv up to 6 t.

61
0
2,000
4,000
6,000
8,000
10,000
12,000
98 99 00 01 02 03 04
GermanyProduction of German Commercial Vehicles over 6 t
Trends and seasonally-adjusted monthly figures
units
up to May 2004: +9%
up to May 2004: +18%
CV over 16 t
CV over 6 up to 16 t
Production of CV over 6 t in full swing.

62
300
400
500
600
700
800
900
1,000
1,100
1,200
1,300
98 99 00 01 02 03 04
GermanyBus Production and Sales
Trends and seasonally-adjusted monthly figures
units
up to June 2004:+9%
up to June 2004:+24%
Exports
Production
up to June 2004:+1%New Registrations
Production and sales accelerating.

63
32,377
22,592
13,779
4,617 3,582
5,181
4912,752
16,378
2,95518,443 29,666
3,167
1,757
9,762
6,281
1,504
363106
237
0
10,000
20,000
30,000
40,000
50,000
60,000
EU-15 new EU-10 LatinAmerica
NorthAmerica
EasternAsia
WesternAsia
Africa
buses: 19,647 buses (+9%)
over 16 t: 54,231 cv (+35%)
over 6 up to 16 t: 34,723 cv (+20%)
up to 6 t: 76,947 cv (-17%)
GermanyGerman Production Abroad up to May 2004
units
The focus of German productionabroad lies for CV up to 6 t in Europe and for CV over 6 t as well as for buses in America.

64
GermanyGerman Production Abroad up to May 2004
units
332
706
3.194 388
3.306 656
4.571 463
7.561
8.196
8.864
10.176286
21.886
23.672
18.657 23.253
49.381
0 10.000 20.000 30.000 40.000 50.000
others
South Africa
Argentina
Turkey
Canada
Austria
Mexico
Belgium
Poland
Spain
Brazil
USA
DaimlerChrysler: 119,500 cv (incl. buses)
Ford: 10,200 cv
MAN: 8,900 cv (incl. buses)
VW: 46,900 cv
up to May 2004: 185,500 cv (+3 per cent)

65
372,458890,156
-45,00498,358
109,789
173,32692,955
242,224-248,061
144,531
152,890
456,854547,562
606,2331,009,744
-250,000 0 250,000 500,000 750,000 1,000,000
Africa
Asia total
Japan
China
Latin America
NAFTA
USA
new EU-10
Poland
Hungary
Czech Rep.
France
Italy
Spain
United Kingdom
GermanyForeign Trade Balance of the Commercial Vehicle Industry* in 2003: 6.4 billion €
EU-25 is main trade partner of thethe German CV industry (73 per cent)(7 per cent of which new EU countries).
in b
illion
euro
*Overall commercial vehicle exports - imports (incl. used vehicles)

66
GermanyExports of the German Commercial Vehicle Industry
in b
illion
euro
4.8
1.1
4.9
12.4
2.9
11.1
0
2
4
6
8
10
12
14
CV manufacturers Trailers and bodies CV parts industry
1993 1995 1997 1999 2001 2003
2003
/1993
: +15
8%
2003/1993: +175%
2003
/1993
: +12
9%

67
GermanyTurnover of the German Commercial Vehicle Industry
in b
illion
euro
10.013.3 15.3
19.324.0 24.56.0
5.34.8
5.9
6.5 6.9
5.04.4
7.5
9.2
11.512.1
0
5
10
15
20
25
30
35
40
45
1993 1995 1997 1999 2001 2003
CV parts industry
Trailers and bodies
CV manufacturers
21.023.0
27.6
34.4
42.043.5
total
68
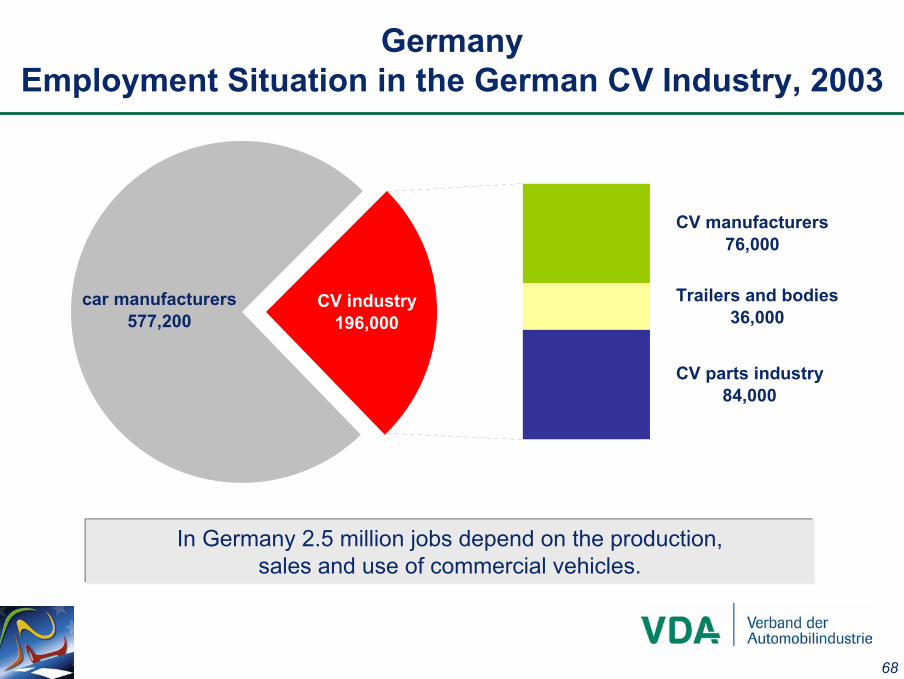
GermanyEmployment Situation in the German CV Industry, 2003
In Germany 2.5 million jobs depend on the production,sales and use of commercial vehicles.
car manufacturers 577,200
CV industry196,000
CV parts industry 84,000
Trailers and bodies36,000
CV manufacturers 76,000

69
Freight Transport in Germany up to 2015
Source: DIW, BMVBW, PROGNOS
in b
illion
tonn
eki
lom
etre
s
71.5
48.8
78.6
64.9
51.4
125.4
61.9
54.8
169.9
74.0
65.0
361.4
115.0
90.0
485.0
0
100
200
300
400
500
600
700
1970 1980 1990 2002 2015
road
inland waterways
rail

70
Freight Transportation by Modesin the New EU-Member States
in b
illion
tkm
Source: prog trans AG*Poland, Czech Rep., Hungary, Slovenia, Estonia
130.8
189.7 207.2
90.3
93.0100.2
4.7
4.0
2.9
0
50
100
150
200
250
300
350
2000 2010 2015
road rail inland waterways

71
Freight Transport in Europe by Freight Category in 2001Shares of Modes of Transport in per cent of Tonne Kilometres
Source: EU Commission
90%
21%
57%
60%
79%
74%
85%
7%
41%
22%
33%
9%
18%
14%
3%
38%
21%
7%
12%
8%
1%
0% 10% 20% 30% 40% 50% 60% 70% 80% 90% 100%
agricultural products
coal
petroleum and petroleumproducts
ore, steel and other metalproducts
cement and buildingmaterials
chemicals and fertilisers
vehicles, machinerymanufactured articles
road rail inland waterways

72
Infrastructure Investment per Unit Outputper Kilometer in Germany
Source: DIW, own calculations
in m
illion
euro
per b
illion
pass
enge
rand
tonn
eki
lom
etre
s(in
199
5 pr
ices
)
5
10
15
20
25
30
35
40
45
50
1960 1965 1970 1975 1980 1985 1990 1995 2000 2002
road rail inland waterways

73
Reduction in Exhaust Gas Thresholds in Europe
100%
40%
36%
25%
18%
18%
100%
46%
46%
32%
22%
22%
100%
56%
49%
34%
13%
7%
100%
51%
21%
15%
3% 3%
0%
10%
20%
30%
40%
50%
60%
70%
80%
90%
100%
CO HC NOx Particles
1990 1993 1996 2000 2005 2008

74
Freight Transportation in GermanyDecoupling of km driven from tkm
Source: ifo, DIW, prognos, VDA
0
100
200
300
400
500
600
1985
1987
1989
1991
1993
1995
1997
1999
2001
2003
2005
2007
2009
2011
2013
2015
km driven (in billion km) billion tkm

75
GermanyYearly Financial Burden of a 40 t - Truck
Source: BGL* burden in 2003 for a 40 t - truck, Euro II, with air suspension in long-distance traffic,
135,000 km/year, 34 l/100 km fuel consumption
Eur
o
21,591
17,442 16,52114,812
11,606
1,521
549399
716
511
0
5,000
10,000
15,000
20,000
25,000
Germany France Italy Netherlands Luxembourg
tax on oil
motor vehicle tax
23.112
17.99116.920
15.528
12.117

76
7.48 7.76
9.009.41
9.9110.74
13.0
16.36
4
6
8
10
12
14
16
1995 1996 1997 1998 1999 2000 2003 2005*
GermanySales Trend in Express Courier & Parcel Services
Source: BdKEP * Forecast
in b
illion
euro
Strong sales growth in Express Courier & Parcel Services- a consequence of e-commerce -
but impossible without commercial vehicles for delivery.