current employment statistics - bureau of labor statistics · pdf filedetailed industry...
TRANSCRIPT
February 2014
Release Date: March 7, 2014
Prepared by Staff of the National Estimates Branch Current Employment Statistics Survey
U.S. Bureau of Labor Statistics
202-691-6555 Email CES
Contents
Summary
Mining & Logging
Construction
Manufacturing
Wholesale Trade
Retail Trade
Transportation, Warehousing, & Utilities
Information
Financial Activities
Professional & Business Services
Private Education & Health Services
Leisure & Hospitality
Other Services
Government
Current Employment Statistics Highlights
Detailed Industry Employment Analysis
Current Employment Statistics Highlights
Current Employment Statistics Survey Summary, February 2014
CES Highlights
Release Date: March 7, 2014
Wholesale Trade + 15,000 Wholesale trade added 15,000 jobs, mostly in durable goods. Monthly jobs gains in wholesale trade had averaged 11,000 per month over the prior 6-month period.
Construction + 15,000 Construction employment edged up in February. Heavy and civil engineering construction added 12,000 jobs over the month.
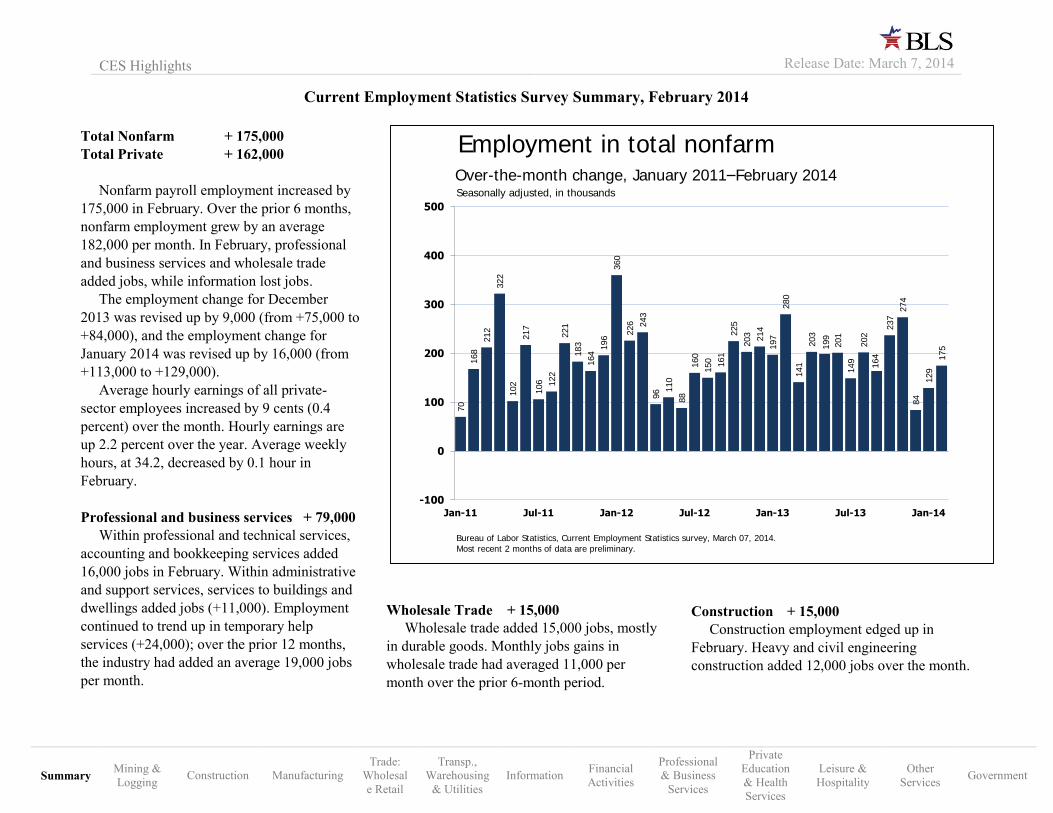
Total Nonfarm + 175,000 Total Private + 162,000 Nonfarm payroll employment increased by 175,000 in February. Over the prior 6 months, nonfarm employment grew by an average 182,000 per month. In February, professional and business services and wholesale trade added jobs, while information lost jobs. The employment change for December 2013 was revised up by 9,000 (from +75,000 to +84,000), and the employment change for January 2014 was revised up by 16,000 (from +113,000 to +129,000). Average hourly earnings of all private-sector employees increased by 9 cents (0.4 percent) over the month. Hourly earnings are up 2.2 percent over the year. Average weekly hours, at 34.2, decreased by 0.1 hour in February. Professional and business services + 79,000 Within professional and technical services, accounting and bookkeeping services added 16,000 jobs in February. Within administrative and support services, services to buildings and dwellings added jobs (+11,000). Employment continued to trend up in temporary help services (+24,000); over the prior 12 months, the industry had added an average 19,000 jobs per month.
70
168
212
322
102
217
106 122
221
183
164
196
360
226 243
96 1
10
88
160
150 161
225
203 214
197
280
141
203
199
201
149
202
164
237
274
84
129
175
-100
0
100
200
300
400
500
Jan-11 Jul-11 Jan-12 Jul-12 Jan-13 Jul-13 Jan-14
Employment in total nonfarmOver-the-month change, January 2011–February 2014
Bureau of Labor Statistics, Current Employment Statistics survey, March 07, 2014.
Most recent 2 months of data are preliminary.
Seasonally adjusted, in thousands
Summary Mining & Logging Construction Manufacturing
Trade: Wholesale Retail
Transp., Warehousing
& Utilities Information Financial
Activities
Professional & Business
Services
Private Education & Health Services
Leisure & Hospitality
Other Services Government

Education and health services + 33,000 Offices of physicians added 8,000 jobs in February, while employment changed little elsewhere in health care. Hospital employment (-1,000), little changed over the month, has declined by 10,000 over the past 3 months. Information - 16,000 Employment can be volatile in the motion picture and sound recording industry, which lost 14,000 jobs in February. Retail Trade - 4,000 Employment in retail trade changed little in February (-4,000). Over the month, a job gain in food and beverage stores (+12,000) was more than offset by job losses in electronics and appliance stores (-12,000), sporting goods, hobby, book, and music stores (-9,000), and department stores (-7,000). Transportation and warehousing - 4,000 Within transportation and warehousing, a job gain in warehousing and storage (+6,000) was more than offset by a job loss in couriers and messengers (-12,000).
Government +13,000 Federal government employment continued to trend down (-6,000) in February. Since reaching an employment peak in January 2011, the federal government has lost 157,000 jobs—59 percent of those losses have come in the past 12 months.
Employment in State government continued to trend up (+11,000) in February and has grown by 51,000 since reaching a trough in July 2013. Employment in local government changed little in February.
13
3
25
33
79
9
-16
0.1
-3.6
-4.1
14.8
6
15
1
-40 -20 0 20 40 60 80 100
Government
Other services
Leisure and hospitality
Education and health services
Professional and business services*
Financial activities
Information*
Utilities
Transportation and warehousing
Retail trade
Wholesale trade*
Manufacturing
Construction
Mining and logging
Employment in total nonfarm
Bureau of Labor Statistics, Current Employment Statistics survey, March 07, 2014.
Data are preliminary.
* denotes significance.
Over-the-month change, February 2014Seasonally adjusted, in thousands
Total nonfarm:175*
Summary Mining & Logging Construction Manufacturing
Trade: Wholesale
Retail
Transp., Warehousing
& Utilities Information Financial
Activities
Professional & Business
Services
Private Education & Health Services
Leisure & Hospitality
Other Services Government
Current Employment Statistics Survey Summary, February 2014
CES Highlights
Release Date: March 7, 2014
2
1
14
15
10
12
11
6
9
7
2
6
8
6
3 2
1
-1 -1 -2
-3
-7
7
5
4
3
1
-3
4
3
4
3
5
5
-1
1
5
1
-15
-10
-5
0
5
10
15
20
Jan-11 Jul-11 Jan-12 Jul-12 Jan-13 Jul-13 Jan-14
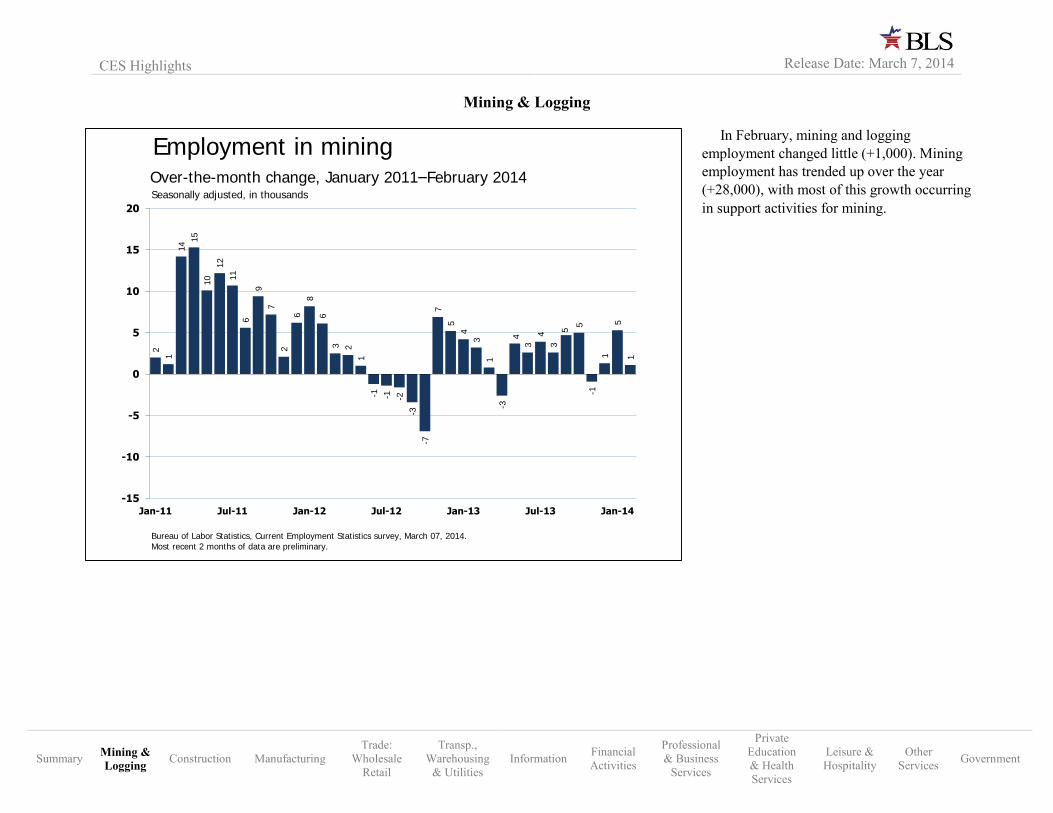
Employment in miningOver-the-month change, January 2011–February 2014
Bureau of Labor Statistics, Current Employment Statistics survey, March 07, 2014.
Most recent 2 months of data are preliminary.
Seasonally adjusted, in thousands
Mining & Logging
Summary Mining & Logging Construction Manufacturing
Trade: Wholesale
Retail
Transp., Warehousing
& Utilities Information Financial
Activities
Professional & Business
Services
Private Education & Health Services
Leisure & Hospitality
Other Services Government
CES Highlights
Release Date: March 7, 2014
In February, mining and logging employment changed little (+1,000). Mining employment has trended up over the year (+28,000), with most of this growth occurring in support activities for mining.
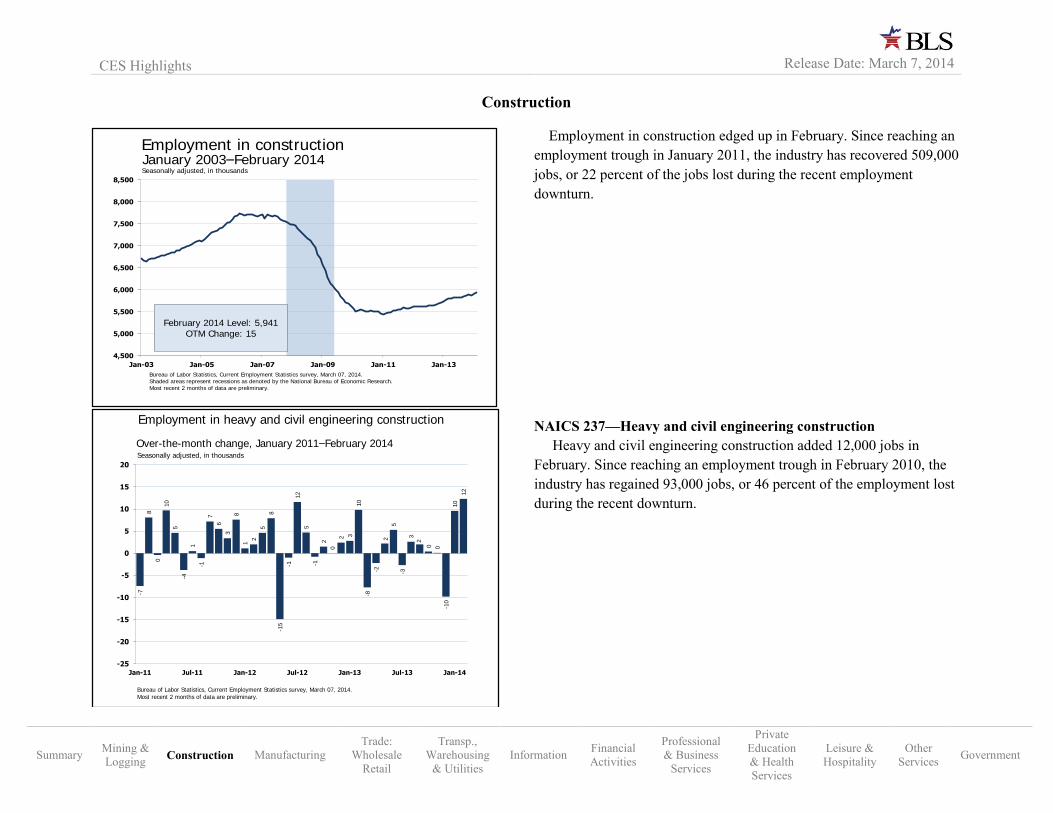
Employment in construction edged up in February. Since reaching an employment trough in January 2011, the industry has recovered 509,000 jobs, or 22 percent of the jobs lost during the recent employment downturn. NAICS 237—Heavy and civil engineering construction Heavy and civil engineering construction added 12,000 jobs in February. Since reaching an employment trough in February 2010, the industry has regained 93,000 jobs, or 46 percent of the employment lost during the recent downturn.
4,500
5,000
5,500
6,000
6,500
7,000
7,500
8,000
8,500
Jan-03 Jan-05 Jan-07 Jan-09 Jan-11 Jan-13
Employment in construction
February 2014 Level: 5,941OTM Change: 15
Bureau of Labor Statistics, Current Employment Statistics survey, March 07, 2014.
Shaded areas represent recessions as denoted by the National Bureau of Economic Research.
Most recent 2 months of data are preliminary.
January 2003–February 2014Seasonally adjusted, in thousands
-7
8
0
10
5
-4
1
-1
7
6
3
8
1
2
5
8
-15
-1
12
5
-1
2
0
2 3
10
-8
-2
2
5
-3
3
2
0 0
-10
10
12
-25
-20
-15
-10
-5
0
5
10
15
20
Jan-11 Jul-11 Jan-12 Jul-12 Jan-13 Jul-13 Jan-14
Employment in heavy and civil engineering construction
Over-the-month change, January 2011–February 2014
Bureau of Labor Statistics, Current Employment Statistics survey, March 07, 2014.
Most recent 2 months of data are preliminary.
Seasonally adjusted, in thousands
Construction
CES Highlights
Release Date: March 7, 2014
Summary Mining & Logging Construction Manufacturing
Trade: Wholesale
Retail
Transp., Warehousing
& Utilities Information Financial
Activities
Professional & Business
Services
Private Education & Health Services
Leisure & Hospitality
Other Services Government
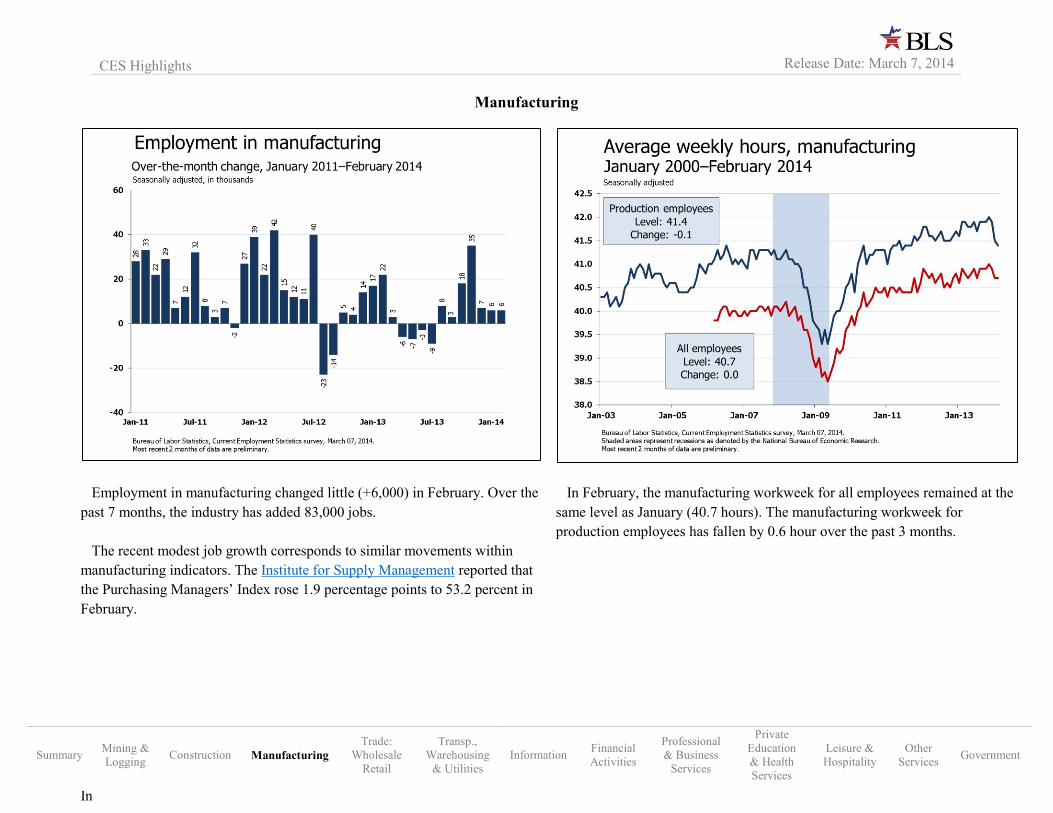
Employment in manufacturing changed little (+6,000) in February. Over the past 7 months, the industry has added 83,000 jobs. The recent modest job growth corresponds to similar movements within manufacturing indicators. The Institute for Supply Management reported that the Purchasing Managers’ Index rose 1.9 percentage points to 53.2 percent in February.
In February, the manufacturing workweek for all employees remained at the same level as January (40.7 hours). The manufacturing workweek for production employees has fallen by 0.6 hour over the past 3 months.
In
Manufacturing
CES Highlights
Release Date: March 7, 2014
Summary Mining & Logging Construction Manufacturing
Trade: Wholesale
Retail
Transp., Warehousing
& Utilities Information Financial
Activities
Professional & Business
Services
Private Education & Health Services
Leisure & Hospitality
Other Services Government
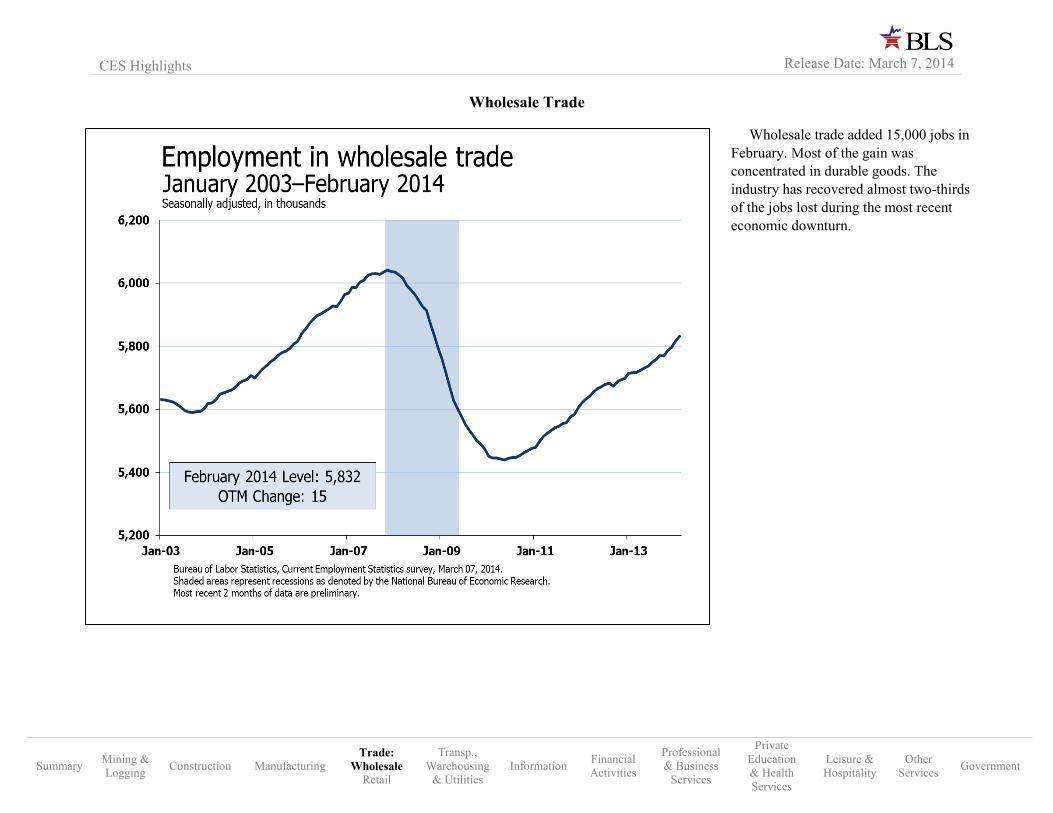
Wholesale trade added 15,000 jobs in February. Most of the gain was concentrated in durable goods. The industry has recovered almost two-thirds of the jobs lost during the most recent economic downturn.
Wholesale Trade
Summary Mining & Logging Construction Manufacturing
Trade: Wholesale
Retail
Transp., Warehousing
& Utilities Information Financial
Activities
Professional & Business
Services
Private Education & Health Services
Leisure & Hospitality
Other Services Government
CES Highlights
Release Date: March 7, 2014

Retail trade employment was essentially flat in February. Among the retail industries, employment changes were mixed, with significant movements in food and beverage stores (+12,000), electronics and appliance stores (-12,000), and sporting goods, hobby, book, and music stores (-9,000).
Recent retail-related indicators have weakened. As shown by Census Bureau data, retail sales for January decreased by 0.4 percent; however, sales were up 2.6 percent over the year. Additionally, the Conference Board noted that the Consumer Confidence Index decreased by 1.3 points in February.
14,000
14,200
14,400
14,600
14,800
15,000
15,200
15,400
15,600
15,800
16,000
Jan-03 Jan-05 Jan-07 Jan-09 Jan-11 Jan-13
Employment in retail trade
February 2014 Level: 15,235OTM Change: -4
Bureau of Labor Statistics, Current Employment Statistics survey, March 07, 2014.
Shaded areas represent recessions as denoted by the National Bureau of Economic Research.
Most recent 2 months of data are preliminary.
January 2003–February 2014Seasonally adjusted, in thousands
Retail Trade
Summary Mining & Logging Construction Manufacturing
Trade: Wholesale
Retail
Transp., Warehousing
& Utilities Information Financial
Activities
Professional & Business
Services
Private Education & Health Services
Leisure & Hospitality
Other Services Government
CES Highlights
Release Date: March 7, 2014
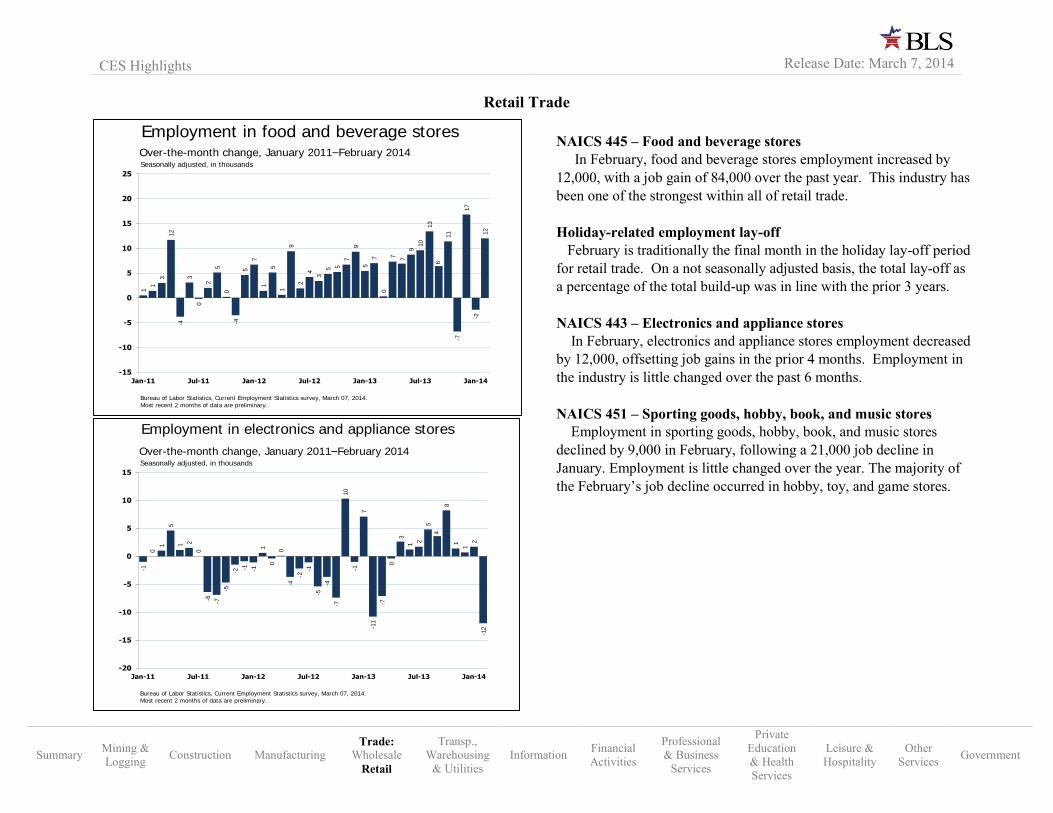
NAICS 445 – Food and beverage stores In February, food and beverage stores employment increased by 12,000, with a job gain of 84,000 over the past year. This industry has been one of the strongest within all of retail trade. Holiday-related employment lay-off February is traditionally the final month in the holiday lay-off period for retail trade. On a not seasonally adjusted basis, the total lay-off as a percentage of the total build-up was in line with the prior 3 years. NAICS 443 – Electronics and appliance stores In February, electronics and appliance stores employment decreased by 12,000, offsetting job gains in the prior 4 months. Employment in the industry is little changed over the past 6 months. NAICS 451 – Sporting goods, hobby, book, and music stores Employment in sporting goods, hobby, book, and music stores declined by 9,000 in February, following a 21,000 job decline in January. Employment is little changed over the year. The majority of the February’s job decline occurred in hobby, toy, and game stores.
1
1
3
12
-4
3
0
2
5
0
-4
5
7
1
5
1
9
2
4
3
5 5
7
9
5
7
0
7 7
9
10
13
6
11
-7
17
-2
12
-15
-10
-5
0
5
10
15
20
25
Jan-11 Jul-11 Jan-12 Jul-12 Jan-13 Jul-13 Jan-14
Employment in food and beverage storesOver-the-month change, January 2011–February 2014
Bureau of Labor Statistics, Current Employment Statistics survey, March 07, 2014.
Most recent 2 months of data are preliminary.
Seasonally adjusted, in thousands
-1
0
1
5
1 2
0
-6 -7
-5
-2
-1 -1
1
0
0
-4
-2
-1
-5
-4
-7
10
-1
7
-11
-7
0
3
1 2
5
4
8
1
1
2
-12
-20
-15
-10
-5
0
5
10
15
Jan-11 Jul-11 Jan-12 Jul-12 Jan-13 Jul-13 Jan-14
Employment in electronics and appliance stores
Over-the-month change, January 2011–February 2014
Bureau of Labor Statistics, Current Employment Statistics survey, March 07, 2014.
Most recent 2 months of data are preliminary.
Seasonally adjusted, in thousands
Retail Trade
CES Highlights
Release Date: March 7, 2014
Summary Mining & Logging Construction Manufacturing
Trade: Wholesale
Retail
Transp., Warehousing
& Utilities Information Financial
Activities
Professional & Business
Services
Private Education & Health Services
Leisure & Hospitality
Other Services Government
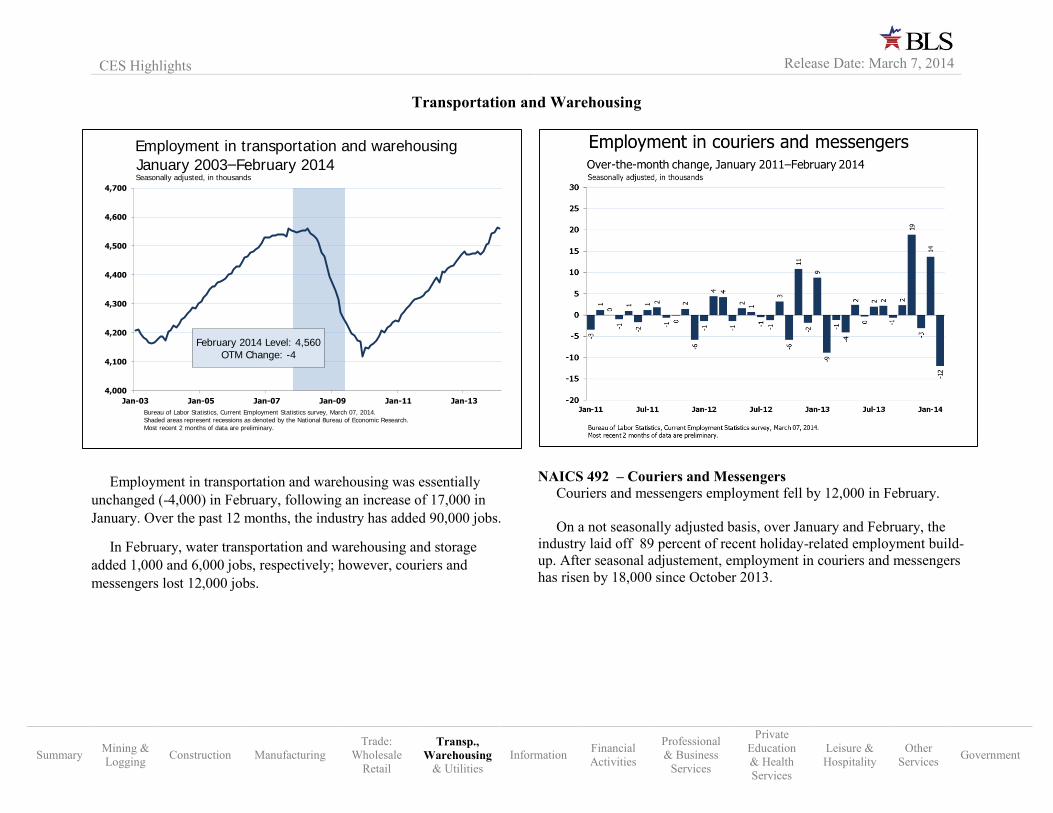
NAICS 492 – Couriers and Messengers Couriers and messengers employment fell by 12,000 in February. On a not seasonally adjusted basis, over January and February, the industry laid off 89 percent of recent holiday-related employment build-up. After seasonal adjustement, employment in couriers and messengers has risen by 18,000 since October 2013.
In
4,000
4,100
4,200
4,300
4,400
4,500
4,600
4,700
Jan-03 Jan-05 Jan-07 Jan-09 Jan-11 Jan-13
Employment in transportation and warehousing
February 2014 Level: 4,560OTM Change: -4
Bureau of Labor Statistics, Current Employment Statistics survey, March 07, 2014.
Shaded areas represent recessions as denoted by the National Bureau of Economic Research.
Most recent 2 months of data are preliminary.
January 2003–February 2014Seasonally adjusted, in thousands
Transportation and Warehousing
CES Highlights
Release Date: March 7, 2014
Summary Mining & Logging Construction Manufacturing
Trade: Wholesale
Retail
Transp., Warehousing
& Utilities Information Financial
Activities
Professional & Business
Services
Private Education & Health Services
Leisure & Hospitality
Other Services Government
Employment in transportation and warehousing was essentially unchanged (-4,000) in February, following an increase of 17,000 in January. Over the past 12 months, the industry has added 90,000 jobs.
In February, water transportation and warehousing and storage added 1,000 and 6,000 jobs, respectively; however, couriers and messengers lost 12,000 jobs.
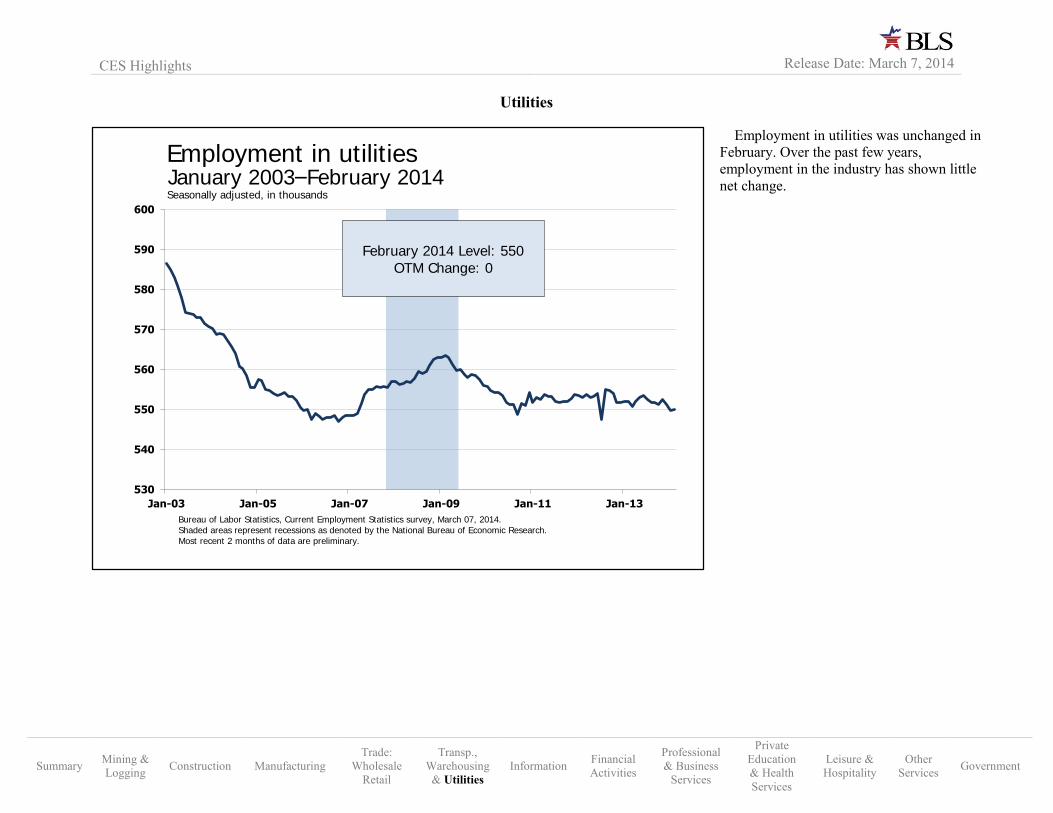
Employment in utilities was unchanged in February. Over the past few years, employment in the industry has shown little net change.
530
540
550
560
570
580
590
600
Jan-03 Jan-05 Jan-07 Jan-09 Jan-11 Jan-13
Employment in utilities
February 2014 Level: 550OTM Change: 0
Bureau of Labor Statistics, Current Employment Statistics survey, March 07, 2014.
Shaded areas represent recessions as denoted by the National Bureau of Economic Research.
Most recent 2 months of data are preliminary.
January 2003–February 2014Seasonally adjusted, in thousands
Utilities
CES Highlights
Release Date: March 7, 2014
Summary Mining & Logging Construction Manufacturing
Trade: Wholesale
Retail
Transp., Warehousing & Utilities
Information Financial Activities
Professional & Business
Services
Private Education & Health Services
Leisure & Hospitality
Other Services Government
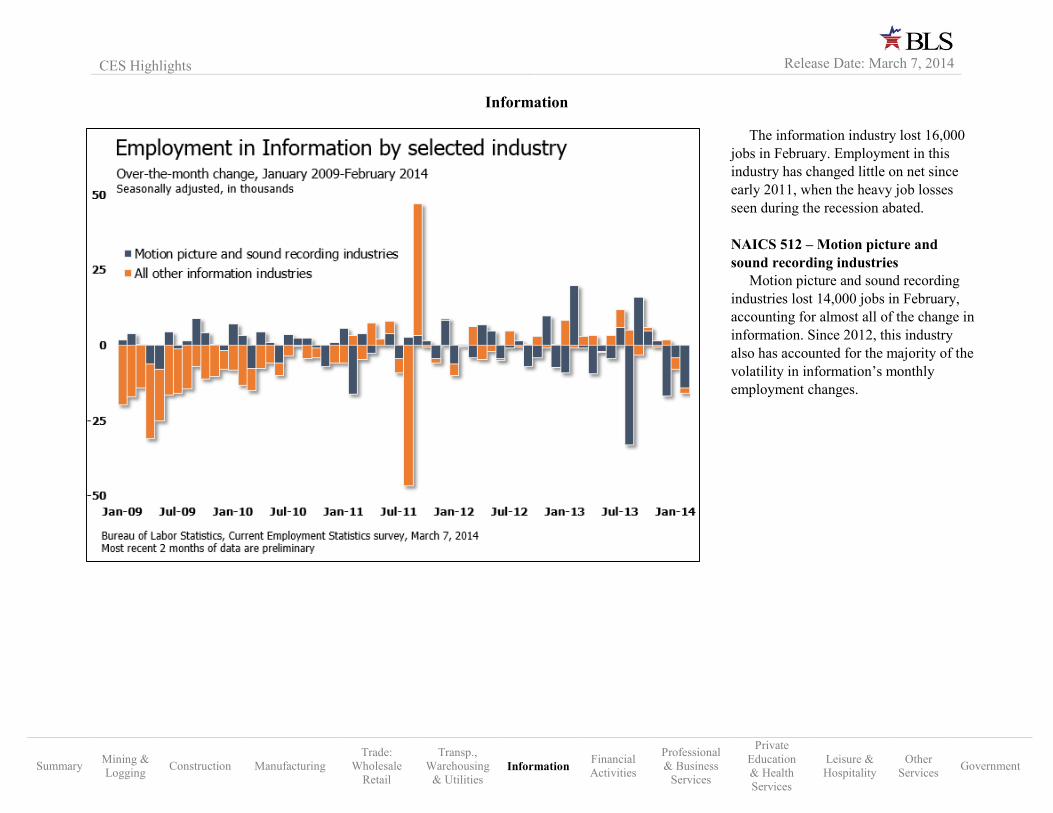
The information industry lost 16,000 jobs in February. Employment in this industry has changed little on net since early 2011, when the heavy job losses seen during the recession abated. NAICS 512 – Motion picture and sound recording industries Motion picture and sound recording industries lost 14,000 jobs in February, accounting for almost all of the change in information. Since 2012, this industry also has accounted for the majority of the volatility in information’s monthly employment changes.
Information
Summary Mining & Logging Construction Manufacturing
Trade: Wholesale
Retail
Transp., Warehousing
& Utilities Information Financial
Activities
Professional & Business
Services
Private Education & Health Services
Leisure & Hospitality
Other Services Government
CES Highlights
Release Date: March 7, 2014
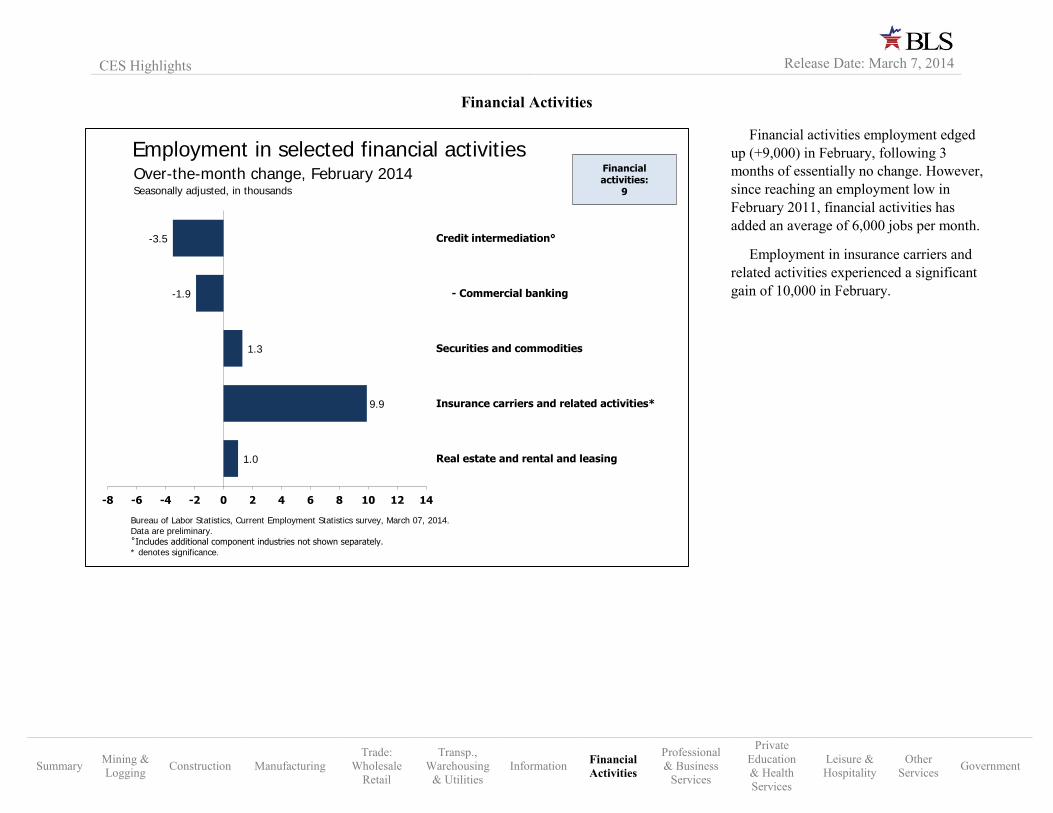
Financial activities employment edged up (+9,000) in February, following 3 months of essentially no change. However, since reaching an employment low in February 2011, financial activities has added an average of 6,000 jobs per month.
Employment in insurance carriers and related activities experienced a significant gain of 10,000 in February.
1.0
9.9
1.3
-1.9
-3.5
-8 -6 -4 -2 0 2 4 6 8 10 12 14
Real estate and rental and leasing
Insurance carriers and related activities*
Securities and commodities
- Commercial banking
Credit intermediation°
Employment in selected financial activities
Bureau of Labor Statistics, Current Employment Statistics survey, March 07, 2014.
Data are preliminary.
˚Includes additional component industries not shown separately.* denotes significance.
Over-the-month change, February 2014Seasonally adjusted, in thousands
Financial activities:
9
Financial Activities
Summary Mining & Logging Construction Manufacturing
Trade: Wholesale
Retail
Transp., Warehousing
& Utilities Information Financial
Activities
Professional & Business
Services
Private Education & Health Services
Leisure & Hospitality
Other Services Government
CES Highlights
Release Date: March 7, 2014
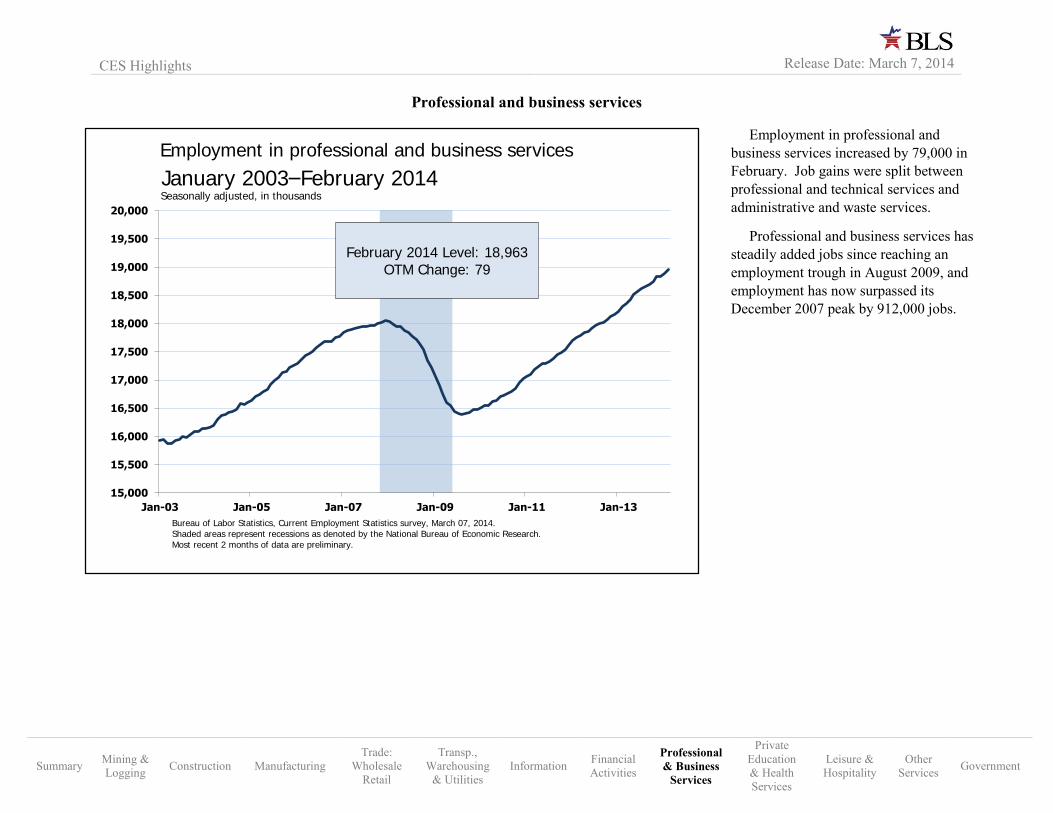
Employment in professional and business services increased by 79,000 in February. Job gains were split between professional and technical services and administrative and waste services.
Professional and business services has steadily added jobs since reaching an employment trough in August 2009, and employment has now surpassed its December 2007 peak by 912,000 jobs.
15,000
15,500
16,000
16,500
17,000
17,500
18,000
18,500
19,000
19,500
20,000
Jan-03 Jan-05 Jan-07 Jan-09 Jan-11 Jan-13
Employment in professional and business services
February 2014 Level: 18,963OTM Change: 79
Bureau of Labor Statistics, Current Employment Statistics survey, March 07, 2014.
Shaded areas represent recessions as denoted by the National Bureau of Economic Research.
Most recent 2 months of data are preliminary.
January 2003–February 2014Seasonally adjusted, in thousands
Professional and business services
Summary Mining & Logging Construction Manufacturing
Trade: Wholesale
Retail
Transp., Warehousing
& Utilities Information Financial
Activities
Professional & Business
Services
Private Education & Health Services
Leisure & Hospitality
Other Services Government
CES Highlights
Release Date: March 7, 2014
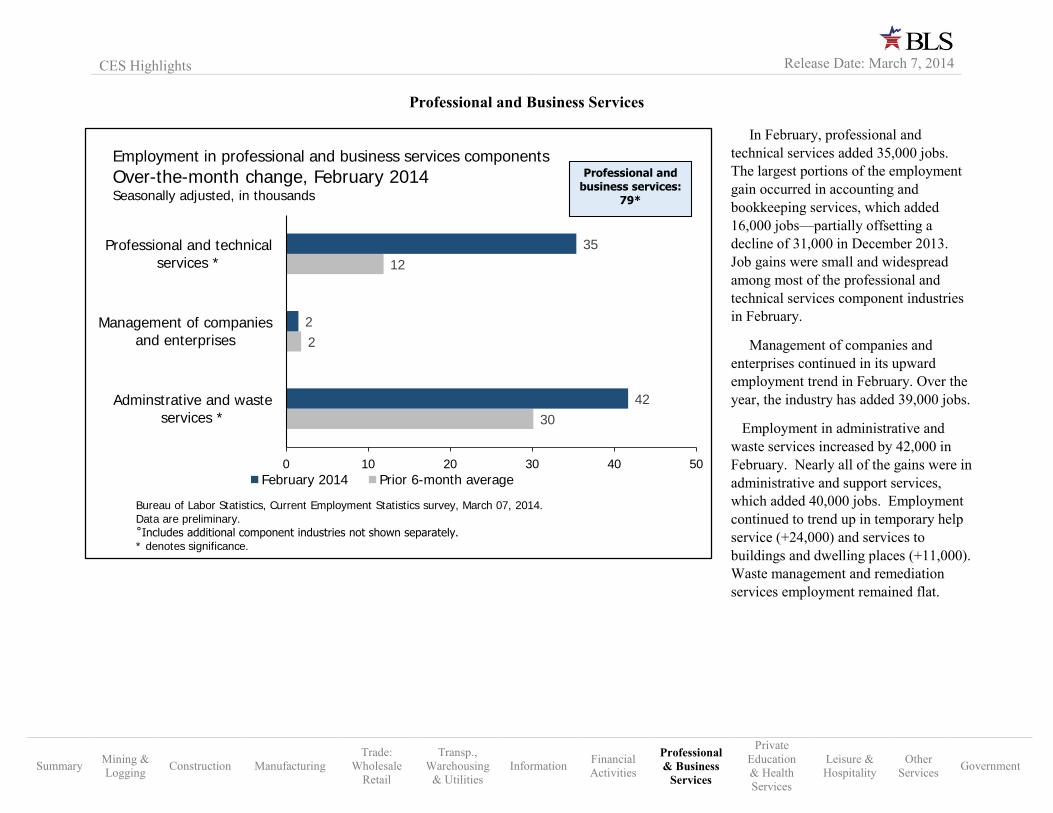
In February, professional and technical services added 35,000 jobs. The largest portions of the employment gain occurred in accounting and bookkeeping services, which added 16,000 jobs—partially offsetting a decline of 31,000 in December 2013. Job gains were small and widespread among most of the professional and technical services component industries in February.
Management of companies and enterprises continued in its upward employment trend in February. Over the year, the industry has added 39,000 jobs.
Employment in administrative and waste services increased by 42,000 in February. Nearly all of the gains were in administrative and support services, which added 40,000 jobs. Employment continued to trend up in temporary help service (+24,000) and services to buildings and dwelling places (+11,000). Waste management and remediation services employment remained flat.
30
2
12
42
2
35
0 10 20 30 40 50
Adminstrative and wasteservices *
Management of companiesand enterprises
Professional and technicalservices *
Employment in professional and business services components
Over-the-month change, February 2014Seasonally adjusted, in thousands
February 2014 Prior 6-month average
Bureau of Labor Statistics, Current Employment Statistics survey, March 07, 2014.
Data are preliminary.
˚Includes additional component industries not shown separately.* denotes significance.
Professional and
business services:
79*
Professional and Business Services
Summary Mining & Logging Construction Manufacturing
Trade: Wholesale
Retail
Transp., Warehousing
& Utilities Information Financial
Activities
Professional & Business
Services
Private Education & Health Services
Leisure & Hospitality
Other Services Government
CES Highlights
Release Date: March 7, 2014
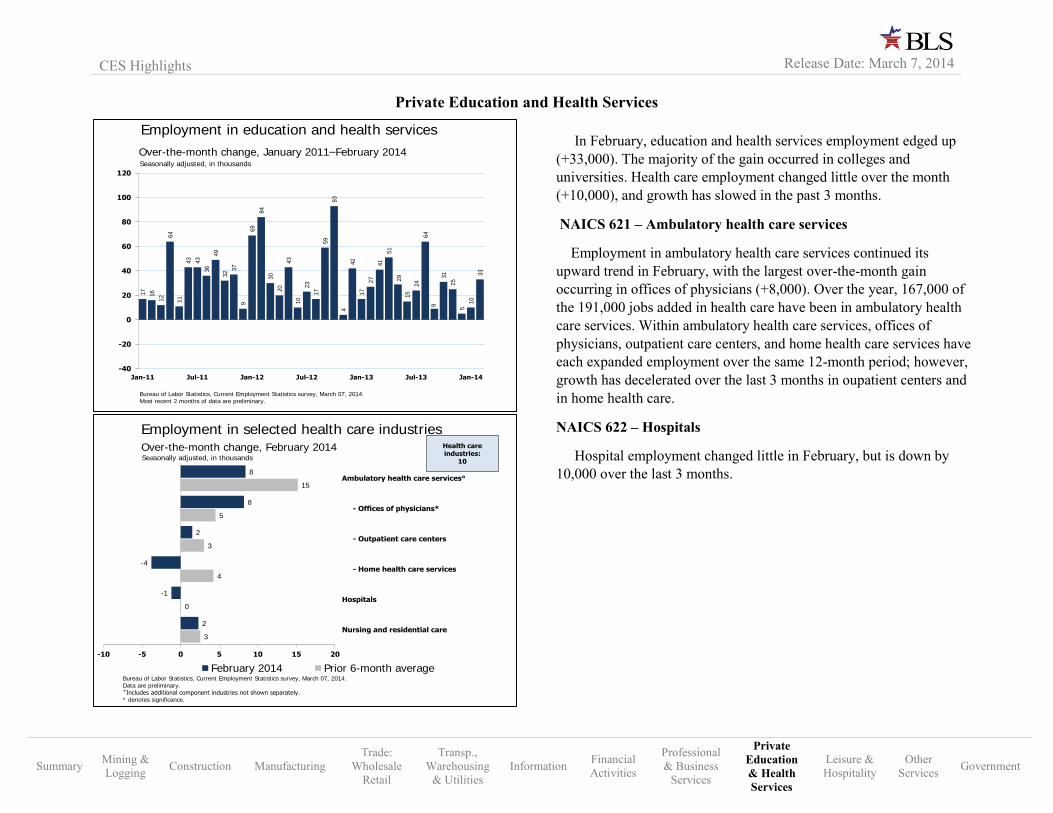
In February, education and health services employment edged up (+33,000). The majority of the gain occurred in colleges and universities. Health care employment changed little over the month (+10,000), and growth has slowed in the past 3 months.
NAICS 621 – Ambulatory health care services
Employment in ambulatory health care services continued its upward trend in February, with the largest over-the-month gain occurring in offices of physicians (+8,000). Over the year, 167,000 of the 191,000 jobs added in health care have been in ambulatory health care services. Within ambulatory health care services, offices of physicians, outpatient care centers, and home health care services have each expanded employment over the same 12-month period; however, growth has decelerated over the last 3 months in oupatient centers and in home health care.
NAICS 622 – Hospitals
Hospital employment changed little in February, but is down by 10,000 over the last 3 months.
17
16
12
64
11
43
43
36
49
32 3
7
9
69
84
30
20
43
10
23
17
59
93
4
42
17
27
41
51
29
15
24
64
9
31
25
5
10
33
-40
-20
0
20
40
60
80
100
120
Jan-11 Jul-11 Jan-12 Jul-12 Jan-13 Jul-13 Jan-14
Employment in education and health services
Over-the-month change, January 2011–February 2014
Bureau of Labor Statistics, Current Employment Statistics survey, March 07, 2014.
Most recent 2 months of data are preliminary.
Seasonally adjusted, in thousands
3
0
4
3
5
15
2
-1
-4
2
8
8
-10 -5 0 5 10 15 20
Nursing and residential care*
Hospitals
- Home health care services
- Outpatient care centers
- Offices of physicians*
Ambulatory health care services°
Employment in selected health care industries
February 2014 Prior 6-month average
Over-the-month change, February 2014Seasonally adjusted, in thousands
Health care industries:
10
Bureau of Labor Statistics, Current Employment Statistics survey, March 07, 2014.
Data are preliminary.
˚Includes additional component industries not shown separately.* denotes significance.
Private Education and Health Services
CES Highlights
Release Date: March 7, 2014
Summary Mining & Logging Construction Manufacturing
Trade: Wholesale
Retail
Transp., Warehousing
& Utilities Information Financial
Activities
Professional & Business
Services
Private Education & Health Services
Leisure & Hospitality
Other Services Government
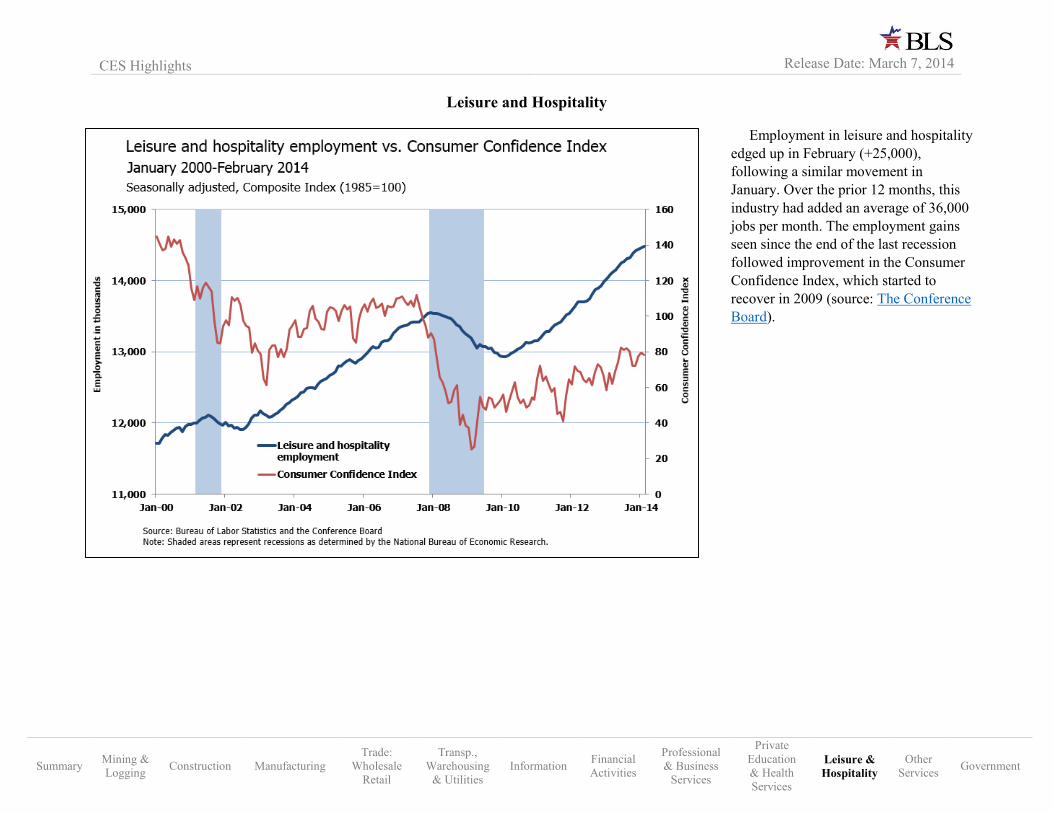
Employment in leisure and hospitality edged up in February (+25,000), following a similar movement in January. Over the prior 12 months, this industry had added an average of 36,000 jobs per month. The employment gains seen since the end of the last recession followed improvement in the Consumer Confidence Index, which started to recover in 2009 (source: The Conference Board).
Leisure and Hospitality
Summary Mining & Logging Construction Manufacturing
Trade: Wholesale
Retail
Transp., Warehousing
& Utilities Information Financial
Activities
Professional & Business
Services
Private Education & Health Services
Leisure & Hospitality
Other Services Government
CES Highlights
Release Date: March 7, 2014
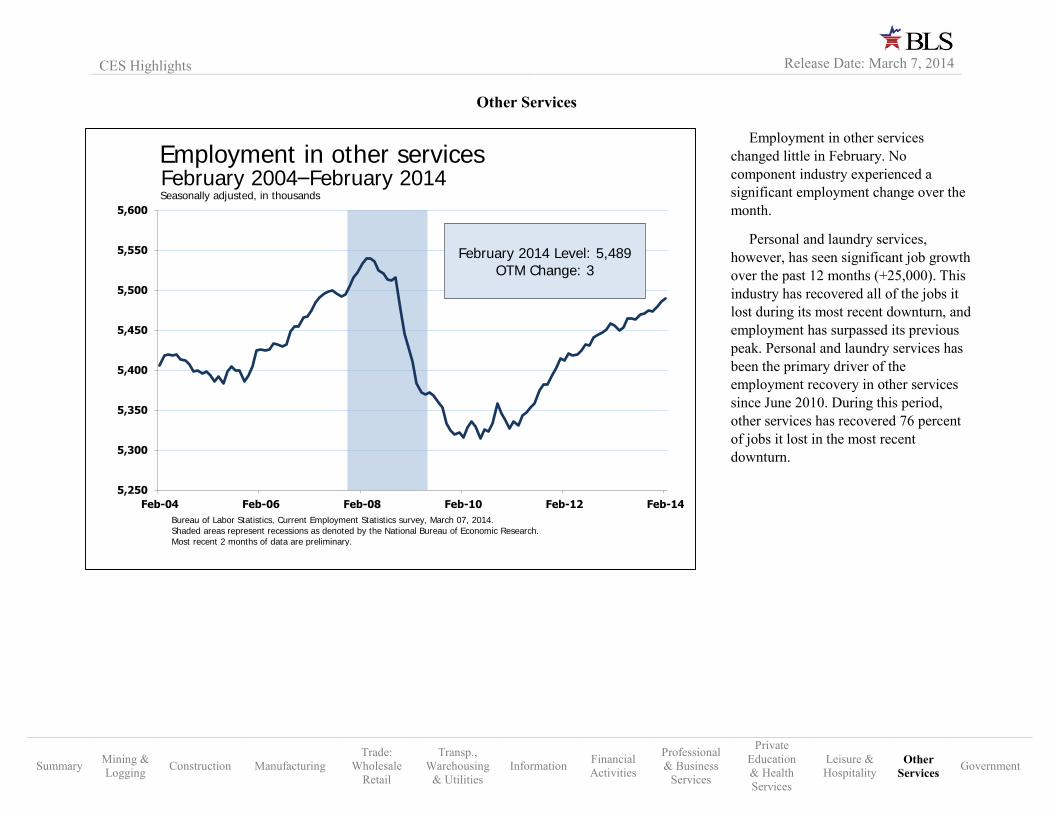
Employment in other services changed little in February. No component industry experienced a significant employment change over the month.
Personal and laundry services, however, has seen significant job growth over the past 12 months (+25,000). This industry has recovered all of the jobs it lost during its most recent downturn, and employment has surpassed its previous peak. Personal and laundry services has been the primary driver of the employment recovery in other services since June 2010. During this period, other services has recovered 76 percent of jobs it lost in the most recent downturn.
5,250
5,300
5,350
5,400
5,450
5,500
5,550
5,600
Feb-04 Feb-06 Feb-08 Feb-10 Feb-12 Feb-14
Employment in other services
February 2014 Level: 5,489OTM Change: 3
Bureau of Labor Statistics, Current Employment Statistics survey, March 07, 2014.
Shaded areas represent recessions as denoted by the National Bureau of Economic Research.
Most recent 2 months of data are preliminary.
February 2004–February 2014Seasonally adjusted, in thousands
Other Services
Summary Mining & Logging Construction Manufacturing
Trade: Wholesale
Retail
Transp., Warehousing
& Utilities Information Financial
Activities
Professional & Business
Services
Private Education & Health Services
Leisure & Hospitality
Other Services Government
CES Highlights
Release Date: March 7, 2014

Government employment changed little in February (+13,000). Employment at the federal, state, and local levels remained relatively flat over the month.
NAICS 911- Federal, except U.S. Postal Service
In February, employment in federal, except U.S. Postal Service continued to trend down (-7,000). Over the past 12 months, the industry has shed 73,000 jobs.
1
-1
1
6
-1
-5
5
3
2
10
1
-7
-12 -10 -8 -6 -4 -2 0 2 4 6 8 10 12 14
Local government, excluding education
Local government education
State government, excluding education
State government education
U.S. Postal Service
Federal, except U.S. Postal Service
Employment in selected government
February 2014 Prior 6-month average
Over-the-month change, February 2014Seasonally adjusted, in thousands
Government:13
Bureau of Labor Statistics, Current Employment Statistics survey, March 07, 2014.
Data are preliminary.
* denotes significance.
1,600
1,800
2,000
2,200
2,400
2,600
2,800
3,000
Jan-03 Jan-05 Jan-07 Jan-09 Jan-11 Jan-13
Employment in government, federal, except U.S. Postal Service
February 2014 Level: 2,131OTM Change: -7
Bureau of Labor Statistics, Current Employment Statistics survey, March 07, 2014.
Shaded areas represent recessions as denoted by the National Bureau of Economic Research.
Most recent 2 months of data are preliminary.
January 2003–February 2014Seasonally adjusted, in thousands
Government
CES Highlights
Release Date: March 7, 2014
Summary Mining & Logging Construction Manufacturing
Trade: Wholesale
Retail
Transp., Warehousing
& Utilities Information Financial
Activities
Professional & Business
Services
Private Education & Health Services
Leisure & Hospitality
Other Services Government
Prepared by Staff of the National Estimates Branch Current Employment Statistics Survey U.S. Bureau of Labor Statistics 202-691-6555 Email CES
CES Analysts
Richa Ajmera
Megan Barker
John Coughlan
Steve Crestol
Lyda Ghanbari
Mike McCall
John Mullins
Edward Park
Sutton Puglia
Kara Sullivan
Parth Tikiwala
Current Employment Statistics Highlights
Detailed Industry Employment Analysis