current macro management and long-term growth scenarios of chinese economy
DESCRIPTION
Current macro management and Long-term growth scenarios of Chinese economy. FAN Gang National Economic Research Institute & Peking University 06-2009. I. Global Crisis and China: Policies and Scenarios. I-1, The reasons for the slowdown. Global crisis; Domestic adjustment by itself: - PowerPoint PPT PresentationTRANSCRIPT

Current macro management and Long-term growth scenarios of
Chinese economy
FAN Gang
National Economic Research Institute &
Peking University
06-2009

I. Global Crisis and China:
Policies and Scenarios

I-1, The reasons for the slowdown
• Global crisis;
• Domestic adjustment by itself:
– It is better to have a strong macroeconomic policy during the booming time, instead of doing little to let things bubble up!
– Having had that, China does not have big bubble-burst to deal with and possible to recover quicker;

I-2, The good rooms for policy maneuver
• Gov’t debt / GDP = 22%
• Banking sector in good shape;
• 2 trillion foreign reserve.
-- China has been paid off for its financial prudence and patience.

I-3, Stimulus policies

Fiscal stimulus package and 8% growth
• The net fiscal stimulus is counted for almost 3% of GDP
• 8% may not be difficult if the stimulus big enough, but market may feel still cold and unemployment still high – over capacities.
• It is “sustainable” for one or two more years .

Monetary policy?
• Quantitative management.
• Interest – rate management is constrained by the exchange-rate relationships.

Other policies!
• Investment approval and local autonomy;
• Industrial policies;
• Financial policies, such as lending policies to SMEs and mortgage/real estate.
• Land policies.
• ……

I-4. Signs of bottom-up
Figure : Import and Export Growth (%, y/y) and Monthly Trade Balance ($b)
-50
-40
-30
-20
-10
0
10
20
30
40
5006
.01
06.0
3
06.0
5
06.0
7
06.0
9
06.1
1
07.0
1
07.0
3
07.0
5
07.0
7
07.0
9
07.1
1
08.0
1
08.0
3
08.0
5
08.0
7
08.0
9
08.1
1
09.0
1
09.0
3
%
0
5
10
15
20
25
30
35
40
45
50Bil $
Trade Bal ance (Bi l $) I mport Growth Export Growth
Source: Chinese State Statistical Bureau

Figure : Change in Industrial Output and Fixed Asset Investment (y/y, %)
0
5
10
15
20
25
30
35
06.0
1
06.0
3
06.0
5
06.0
7
06.0
9
06.1
1
07.0
1
07.0
3
07.0
5
07.0
7
07.0
9
07.1
1
08.0
1
08.0
3
08.0
5
08.0
7
08.0
9
08.1
1
09.0
1
09.0
3
I ndustri al Output
Fi xed Asset I nvestment
Source: Chinese State Statistical Bureau

Figure: Change in Retail Sales of Social Consumption Goods (M/M, %)
4
9
14
19
24
29
06.0
1
06.0
3
06.0
5
06.0
7
06.0
9
06.1
1
07.0
1
07.0
3
07.0
5
07.0
7
07.0
9
07.1
1
08.0
1
08.0
3
08.0
5
08.0
7
08.0
9
08.1
1
09.0
1
09.0
3
Nomi nal seri es Real seri es
Source: Chinese State Statistical Bureau


Figure 7: Change in CPI and Ex-Factory Price Index of Industrial Products (m/m, %)
- 7- 6- 5- 4- 3- 2- 10123456789
1011
06.0
1
06.0
3
06.0
5
06.0
7
06.0
9
06.1
1
07.0
1
07.0
3
07.0
5
07.0
7
07.0
9
07.1
1
08.0
1
08.0
3
08.0
5
08.0
7
08.0
9
08.1
1
09.0
1
09.0
3
Consumer Pri ce I ndex Ex- factory Pri ce I ndex of I ndustri al Products
Source: Chinese State Statistical Bureau

1.5 Risks of monetary expansion
• The credit expansion is already over the target (RMB5 trillion);
• M2 growth rate is historically rarely high at 25.5% ;
• World commodity prices are increasing.

Naturally, people start to worry about:
• Inflation, or asset bubbles;
• Bank NPL;

Policy makers are watch too!
• Deflation is still deepen (CPI -1.5% in April, from 1.2% in March, yoy);
• Not much credit has “sneaked” into the asset market so far;
• Policy may “switch” the direction, if needed.

II. Structural Problems:
High savings and low consumption

• As observed by everyone, China’s recovery or growth is still relying on either export or investment. Consumption is still a week spot.
• And this is particularly a problem in long run given the possibility that US consumption-saving relationship may be changed (a bit) by the restructuring of financial market after the crisis.
• So, for the medium and long run, the key question remain: how China can increase its domestic consumption?

Household sector savings rate

Various sectors as % of total savings
0
10
20
30
40
50
60
1992 1993 1994 1995 1996 1997 1998 1999 2000 2001 2002 2003 2004 2005 2006 2007
Househol d Government Corporate

Households’ disposable income / other incomes

Wage as % of GDP
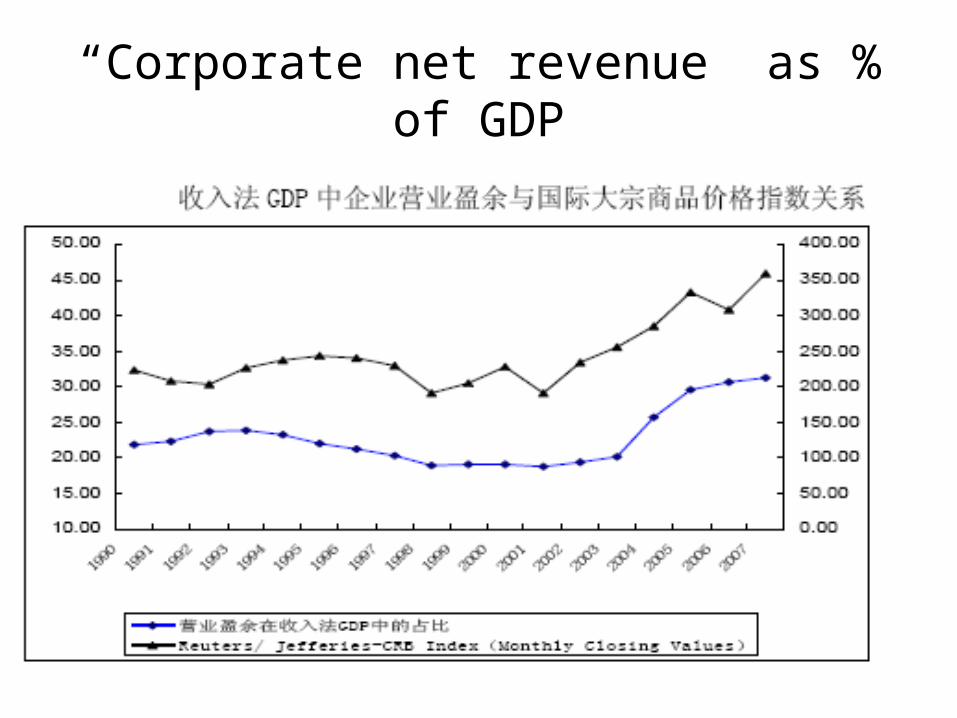
“Corporate net revenue” as % of GDP

How to increase Households’ Income
• Increasing gov’t expenditures on social security/health care?
• Minimum wage increase?
• Fiscal / taxation reforms – transfers between different sectors;
• Redistribution of wealth?

III. Factors Behind
3-decades Growth and Beyond

Table, China’s Growth: Input-driven vs. Productivity Increase
(Percentage points of GDP growth rate)
1953-78 1979-88 1989-98 1999-05
Annual GDP growth 6.15 10.06 9.59 9.11
Of it: Input growth 5.83 6.70 5.16 5.36
Of it: Capital 2.59 2.58 2.70 3.59
Human captal 2.39 4.26 2.19 1.56
Productivity (TFP) 0.31 3.35 4.42 3.74

Table, Explanations to China’s Productivity Increase
1978-88 1989-98 1999-05
Total Factor Productivity
(as explained) 2.86 4.37 3.53
Market-oriented reforms 0.68 0.92 0.32
Spill-over effect of FDI 0.16 1.15 -0.35
Spill-over effect of Trade 0.46 0.19 1.33
R&D growth -0.18 0.16 0.47
Spill-over effect of Human capital 1.02 0.84 0.79
Improvement of infrastructures 0.10 0.49 1.35
Urbanization 0.78 0.74 1.35
Reduction of government costs -0.14 -0.12 -1.73
Economic Structure -0.15 0.28 0.21

Most Factors of Growth are still working
and will work for the next 10-20 years

• High savings;
• Low labor cost;
• Reform effects;
• Globalization effects;
• Education and Technology progress.
• Urbanization.