current market outlook 2014–2033
TRANSCRIPT

Current Market Outlook2014–2033

2 Current Market Outlook 2014–2033
Outlook on a page
World regionsKey indicators and new airplane markets
RegionsAsia
Pacifi cNorth
America EuropeMiddle
EastLatin
America CIS Africa WorldWorld economy (gross domestic product [GDP])% 4.4 2.5 1.9 3.8 3.9 3.3 4.7 3.2Airline traffi c (revenue passenger-kilometers [RPK])% 6.3 2.9 3.9 6.4 6.2 4.4 5.9 5.0Cargo traffi c (revenue tonne-kilometers [RTK])% 5.5 3.4 3.5 5.9 5.3 4.0 6.1 4.7Airplane fl eet % 5.2 1.6 2.9 5.4 4.8 2.2 3.6 3.6
Market size
Deliveries 13,460 7,550 7,450 2,950 2,950 1,330 1,080 36,770Market value ($B) 2,020 870 1,040 640 340 150 140 5,200Average value ($M) 150 120 140 220 120 110 130 140Unit share % 37 21 20 8 8 4 3 100Value share % 39 17 20 12 7 3 3 100
New airplane deliveries
Large widebody 210 20 60 300 0 30 0 620Medium widebody 1420 510 590 790 40 60 50 3460Small widebody 1940 630 810 460 360 90 230 4520Single aisle 9,540 4,820 5,870 1,360 2,360 990 740 25,680Regional jets 350 1570 120 40 190 160 60 2490
Total 13,460 7,550 7,450 2,950 2,950 1,330 1,080 36,770
Market value (2013 $B catalog prices)
Large widebody 80 10 20 120 0 10 0 240Medium widebody 480 170 190 270 10 20 20 1160Small widebody 490 140 220 120 90 30 50 1140Single aisle 960 490 600 130 230 80 70 2560Regional jets 10 60 10 <5 10 10 <5 100
Total 2,020 870 1,040 640 340 150 140 5,200
2013 fl eet
Large widebody 290 100 180 100 0 60 10 740Medium widebody 520 320 360 280 20 20 60 1,580Small widebody 710 730 350 220 120 180 80 2,390Single aisle 3,820 3,790 3,120 520 1,160 740 430 13,580Regional jets 130 1,710 340 60 80 180 120 2,620
Total 5,470 6,650 4,350 1,180 1,380 1,180 700 20,910
2033 fl eet
Large widebody 270 80 110 270 0 60 0 790Medium widebody 1,500 560 640 770 50 90 70 3,680Small widebody 2,250 920 980 570 430 160 260 5,570Single aisle 10,850 5,950 5,830 1,680 2,840 1,350 1,000 29,500Regional jets 350 1,610 150 70 210 160 90 2,640
Total 15,220 9,120 7,710 3,360 3,530 1,820 1,420 42,180
Market values above 5 have been rounded to the nearest 10.
World regionsMarket value: $5.2 trillion
36,770new airplanes2014 to 2033
20,910Airplanes
2013
Delivery unitsShare of fleet
42,180Airplanes2033
• Regional jets • Single aisle • Small widebody • Medium widebody • Large widebody
2% 7%9%
12%
70%0%
25%
50%
75%
100%
World regionsMarket growth rates
3.2%
5.0%
4.7%
4.2%
2013 to 2033
Worldeconomy
(GDP)
Numberof airline
passengers
Airlinetraffic(RPK)
Cargotraffic(RTK)

3Copyright © 2014 Boeing. All rights reserved.
Long-term forecast
Purpose of the forecastThe Current Market Outlook is our long-term forecast of air traffic volumes and airplane demand. The forecast helps shape our product strategy and guide long-term business planning. We have shared the forecast with the public for more than 50 years to inform decisions by airlines, suppliers, and the financial community.
We start fresh every year, factoring the effects of current business conditions and developments into our analysis of the long-term drivers of air travel. The forecast details demand for passenger and freighter airplanes, both for fleet growth and for replacement of airplanes that retire during the forecast period. We also project the demand for passenger-to-freighter conversions.
Effects of market forcesThe aviation industry continually adapts to market forces. Key among these are fuel prices, economic growth and development, environmental regulations, infrastructure, market liberalization, airplane capabilities, other modes of transport, business models, and emerging markets. Fuel is now the largest component of airline cost structure. This fact has spurred manufacturers to produce more efficient airplanes, such as the 787 and the 737 MAX, and encouraged airlines to optimize other cost and revenue centers to maintain profitability in the face of high fuel prices.
Our long-term forecast incorporates the effects of market forces on the development of the aviation industry. Economic growth, as measured by gross domestic product (GDP), is a primary contributor to aviation industry growth. GDP is forecast to rise 3.2 percent over the next 20 years, which will drive passenger traffic to grow 5.0 percent annually and cargo traffic (which also depends on global trade) to grow 4.7 percent annually.
Shape of the marketWe forecast long-term demand for 36,770 new airplanes, valued at $5.2 trillion. We project that 15,500 of these airplanes (42 percent of all new deliveries) will replace older, less efficient airplanes. The remaining 21,270 airplanes will be for fleet growth, which stimulates expansion in emerging markets and development of innovative airline business models. Single-aisle airplanes continue to command the largest share of the market. Approximately 25,680 new single-aisle airplanes will be needed over the next 20 years. Fast-growing low-cost carriers and network carriers pressed to replace aging airplanes drive single-aisle demand. The widebody fleet will need 8,600 new airplanes. The new generation of efficient widebody airplanes is helping airlines open new markets that would not have been economically viable in the past.
Airplanes in service2013 to 2033
Demand by size2014 to 2033
Large widebody 740 790
Medium widebody 1,580 3,680
Small widebody 2,390 5,570
Single aisle 13,580 29,500
Regional jets 2,620 2,640
Total 20,910 42,180
Large widebody 620 240
Medium widebody 3,460 1,160
Small widebody 4,520 1,140
Single aisle 25,680 2,560
Regional jets 2,490 100
Total 36,770 5,200
SizeNew
airplanesValue
($B)*Size 2013 2033
*$ values though out the CMO are catalog prices.
Key indicators2013 to 2033
Demand by region2014 to 2033
Asia Pacifi c 13,460 2,020
Europe 7,450 1,040
North America 7,550 870
Middle East 2,950 640
Latin America 2,950 340
CIS* 1,330 150
Africa 1,080 140
Total 36,770 5,200
RegionNew
airplanesValue
($B)Growthmeasures (%)
World economy GDP 3.2
Airplane fl eet 3.6
Number ofpassengers
4.2
Airline traffi c RPK 5.0
Cargo traffi c RTK 4.7
*Commonwealth of Independent States.
Current Market Outlook2014 – 2033
Randy Tinseth
introduces
the 2014
Current Market
Outlook

4 Current Market Outlook 2014–2033
Global economic growth lagged the long-term average rate for the second straight year in 2013. However, signs of acceleration appeared in the second half of 2013, boosting confidence in predictions that better performance in North America and Western Europe will lead a gradual upward trend during 2014 and 2015. Recent data on US jobless claims, retail sales, industrial production, new home sales, and household finances support forecasts for a return to the long-term growth average. The European economy began to grow again in the second half of 2013, following five quarters of recession. Rising consumer and business confidence, low interest rates, improving export markets, and pent-up demand for durables are projected to extend the strengthening trend through 2014 and into 2015.
Emerging marketsGrowth in many emerging markets continues to outpace that in developed economies. Momentum has slowed, however, in recent quarters, with weakened demand from developed economies and withdrawal of government stimulus. Strengthening demand in Europe and the United States is expected to boost exports from emerging economies. Economic prospects in Asia will be shaped by capital rotation out of emerging markets, key elections in several countries, and the pace of domestic macroeconomic reforms. Rapid credit expansion in China has created vulnerabilities in real estate, banking, and local government, but government spending and fiscal policies support near-term growth. Elections in India and Indonesia should help resolve policy uncertainties, which will support stronger economic growth. The outlook for consumer spending in Asia is bright, thanks to robust income growth and deepening financial markets. In emerging markets outside Asia, commodity prices, political stability, and government response to inflationary pressures driven by weakening currencies will be key watch items.
IHS Economics forecasts an extended period of strong performance. There is a growing chance that pent-up business and household demand and idle production capacity in many parts of the world will fuel above-trend growth over the next several years, resulting in an upside growth surprise. Structural reforms will be key to sustaining these prospects.
Airline passenger traffic sustained a growth rate slightly above 5 percent during 2012 and 2013, despite consecutive years of weak global GDP growth. The global airline industry grew at or above the long-term growth rate on sound fundamentals. Productivity continues to increase, with historically high airplane utilization and passenger load factor. In 2013, load factor was 79 percent, showing that airlines are matching demand without oversupplying capacity. Unit revenue (passenger revenue per available seat-kilometer) was stable at the global level in 2013, indicating that airlines did not cut fares to fill seats. Unit cost was downslightly Better unit revenue, combined with reduced unit cost indicates a more profitable industry.
Business and market environment
Business and market environment World passenger load factors at historic highs
80
78
74
76
72
68
70
66
2003
2005
2007
2009
2011
2013
Source:ICAO/
IATA
Passenger load factor (%)
Business and market environment Emerging markets
CyclicalForces
StructuralForces
• Withdrawal of policy stimulus• Weak export markets• Capital rotation as US bond yields rise• Excess capacity after investment booms
• Slower labor force growth• Slower pace of globalization• End of commodity price supercycle• Lack of market reforms
Source:IHS
Economics
Why has growth in emerging markets slowed?
Business and market environment Global economic growth accelerating
$0 $2,000 $6,000 $10,000 $14,000 $18,000
Australia/NZ
Africa
Canada
India
Other Europe
CIS
Brazil
Middle East
Lat Am, excl Brazil
Other Asia
Japan
China
United States
European Union 1.9
2.7
7.1
1.0
4.2
3.8
4.2
3.8
3.4
2.7
7.2
2.5
5.1
2.7
Source:IHS
Economics
2014–2024 CAGR (%)
World growth
2014 2.92015 3.42016 3.62014–2024 3.5
2012 GDP US dollars (billions)

5Copyright © 2014 Boeing. All rights reserved.
Airline traffic in developed economies grew at a respectable pace in 2013, although mature markets generally lag the world average. Economic growth was flat in Europe, but the region’s passenger traffic increased nearly 4 percent from 2012. Profitability was sluggish, however, as network carriers restructured to compete with low-cost carriers in short-haul markets and sixth-freedom carriers in long-haul markets. In North America, consolidation and capacity discipline held growth to about 2 percent, but airline earnings in the region lead the global industry with an estimated $7 billion net profit. Their performance is expected to climb to $9 billion in 2014, representing approximately half the entire industry’s projected profit.
Overall, emerging markets, led by China and the Middle East, continue to grow faster than the global average, with double-digit traffic growth. Some emerging markets, however, such as Brazil and India, have seen slower growth owing to recent economic softness and volatile exchange rates that reduced traveler purchasing power. Weakening currencies in many emerging markets have also quickly and materially raised airline costs, such as jet fuel and financing, which are generally priced in US dollars. These higher costs, combined with growing competition, have led to near-term profit challenges for many emerging market airlines. Longer term prospects remain bright, however, as a result of the strong demand outlooks associated with growing middle classes and liberalizing air travel markets.
Air cargo trafficFrom 1993 to 2008, air cargo traffic averaged 5.4 percent annual growth. Annual growth has slowed to about 1 percent since 2008, however. The deep recession followed by a weak recovery in developed economies strongly curbed trade and air cargo growth. Although some countries took protectionist measures during the downturn, very few became more closed. Opportunities for trade liberalization are not exhausted. There is little evidence to indicate that supply chains are becoming less global. High-value merchandise trade is forecast to expand approximately 5 percent per year through 2030, which should bolster air cargo traffic. Traffic began to accelerate during the fourth quarter of 2013 and first quarter of 2014, which may herald a long-awaited recovery in air cargo.
Returning profitability Global airline industry net profits were an estimated $10.6 billion in 2013, up from $6.1 billion in 2012. Net profit for 2014 is forecast to improve further to $18 billion as economic growth accelerates and fuel prices remain stable. Brent oil prices have generally traded in the range of $110 plus or minus $5 per barrel since mid-2012. The broad trend has been relatively stable, with only very short-term volatility in response to specific events such as Middle East unrest or economic news from Europe or the United States. Inflation-adjusted price forecasts are largely stable into the middle of the decade, reflecting increased projected supply,
Business and market environment, continued
7
6
5
4
3
3
1
20
15
5
10
0
-10
-5
Business and market environment Passenger traffic is resilient
Source:ICAO
Annual growth (%) Annual RPKs (billions)
1990
1991
1992
1993
1994
1995
1996
1997
1998
1999
2000
2001
2002
2003
2004
2005
2006
2007
2008
2009
2010
2011
2012
2013
2014
F
Business and market environment Momentum slow after 2010 may be picking up
Volume Index (s.a. 2005 = 100); indicator of world merchandise trade
25
50
75
100
125
150
175
1992 2000 2008 2014
Source:CPB
Business and market environment Cargo market slowly starting to rebound
Air cargo traffic
50
100
150
200
250
300
-10
-5
0
5
10
15
20
Annual growth (%) Annual RTKs (billions)
Source:IATA / ICAO
1990
1991
1992
1993
1994
1995
1996
1997
1998
1999
2000
2001
2002
2003
2004
2005
2006
2007
2008
2009
2010
2011
2012
2013
2014
F

6 Current Market Outlook 2014–2033
Business and market environment, continued
based on US oil shale production and prospects. Although forecasts anticipate upward price pressure from supply-and-demand dynamics in the longer term, the trajectory has moderated from forecasts made just a few years ago.
Airlines continue to focus on boosting revenue through alliances and partnerships and by raising fees and charging for ancillary services. Sources for ancillary revenue include fees for baggage, ticket change, extra amenities, annual subscriptions to premium services, frequent flyer programs (FFP), and even onboard duty-free sales. Some of the more innovative sources (such as annual subscriptions and FFP products like branded credit cards) generate handsome margins for the airlines and promote brand loyalty. US carriers lead the industry in ancillary revenue, earning about 5 percent of total passenger revenue from ancillary services. Among LCCs, the share of ancillary revenue far surpasses the US industry average. Nearly 40 percent of Spirit Airlines operating revenue comes from ancillary services. Such strategies helped the airlines improve profitability in 2013, despite below-average global economic growth.
Improved profitability is allowing airlines to increase strategic investment for future growth. Airlines are boosting investments to enhance their customer product offering and operating efficiencies. For example, in addition to new airplanes, airlines are investing in new information and mobile technology, upgraded cabin interiors for higher levels of service, and additional seats to improve unit costs. Some airlines are increasing equity investment in other airlines and cross-border partnerships to solidify and expand networks. Reinvestment of profit into airline products enhances the long-term growth prospects for the industry.
Business and market environment Exchange rate fluctuations affect profits
Source:Paci�c Exchange
Rate Service
Exchange rate index vs. USD, Jan 2013 = 100
75
80
85
90
95
100
105
20142013
Japanese yen
Brazilian real
Turkish lira
Business and market environment Airlines managing economic uncertainty
Source:ICAO/
IATA
Net profit (loss) billions Percent of revenue (%)
-6
-5
-4
-3
-2
-1
0
1
2
3
4
($30)
($25)
($20)
($15)
($10)
($5)
$0
$5
$10
$15
$20
1984
1990
1996
2002
2008
2014
F
Business and market environment Oil prices to remain elevated, but stable
Spot $/barrel (Brent crude oil/US Gulf Coast jet fuel)
Average annual price
Jet fuel
Brent crude oil
Source:EIA
0.00
0.50
1.00
1.50
2.00
2.50
3.00
3.50
4.00
4.50
0
20
40
60
80
100
120
140
160
180
200
2000 2002 2004 2006 2008 2010 2012 2014
$/barrel (Brent crude oil) $/gallon (US Gulf Coast jet fuel )
2007 $722006 $65
2008 $972009 $622010 $802011 $1112012 $1122013 $1092014 YTD $111

7Copyright © 2014 Boeing. All rights reserved.
Airline strategies and business modelsStrategic planning is a continual process for airlines. Plans must take into account the challenging and ever-changing competitive environment as well as how passengers define value. For example, business travelers are sensitive to flight times and expect a high level of service. Short-haul business travelers tend to be more sensitive to ticket prices than long-haul business travelers. Leisure travelers are more sensitive to price but less demanding about service levels.
Deregulation has had a significant impact on airline strategies during the past several decades. As regulations on commercial aviation relax, airlines gain freedom to vary fares in response to competition and demand, develop network and schedule planning, and manage other key aspects of airline business. Deregulation has helped stimulate traffic and network growth, and the resulting competition provides increased choice to travelers. Airline business models continue to evolve in order to adapt to the dynamic marketplace.
Low-cost carrier business modelThe low-cost carrier (LCC) business model has grown tremendously over the past two decades. Successful LCC pioneers include Southwest Airlines in the United States and Ryanair in Europe. The LCC model focuses on business and operational practices that drive down airline costs. Typical cost-saving practices include operating at secondary airports, flying a single airplane type, increasing airplane utilization, relying on direct sales, offering a single-class product, avoiding frequent-flyer programs, and keeping labor costs low. Such tactics helped LCCs reduce unit cost by 20 percent to 40 percent compared with network carriers. Their lower cost structure allows LCCs to reduce fares, which significantly stimulates traffic. Thus, the LCC model has proved successful throughout the world and has driven the growth of air travel.
Recently, many LCCs have diverged from traditional LCC tactics. Customer expectations, regional variations, and competition have forced LCCs to adapt to new challenges. In today’s market, it is not difficult to find an LCC flying multiple airplane types, operating at primary airports, or offering frequent-flier programs. Other variations include using global distribution systems, offering more frills to passengers, or even flying medium- to long-haul routes. Despite these developments, the LCC model and LCC profitability continue to grow.
Network carriersAt the other end of the spectrum, network carriers include the largest airlines in the world, such as United, Air France, and JAL. Network carriers tend to have major hub operations for domestic, regional, and international services; large, complex fleets; airline alliances; and a broad array of service offerings, such as airport lounges, onboard meals, and multiple cabin classes. Hub operations significantly increase network reach and allow carriers to offer convenient one-stop connections around the globe.
Airline strategies and business models
Airline strategies and business models Destinations doubled since Japan-Taiwan Open Skies*
August 2011 August 2013
Source:Diio/
Innovata
Airline strategies and business models LCCs provide a large share of capacity
2013 LCC market share(%) measured in annual seats (by airline domicile)
53
36
35
33
27
26
25
15
12
9
2
1
Southeast Asia
South Asia
Europe
Latin America
North America
World
Oceania
Northeast Asia
Middle East
Africa
China
CIS
Source:Diio/Innovata2013, jet only
Airline strategies and business models Airlines continue to find benefits with alliances
Number of airlines
0
5
10
15
20
25
30
1997 2002 2007 2012 2013
Source:OAG
• Skyteam • Oneworld • Star Alliance

8 Current Market Outlook 2014–2033
Some carriers use the geographical advantage of their location to funnel both short- and long-haul traffic through their hubs. Examples include Emirates in the Middle East and Copa Airlines in Latin America. These carriers have grown strongly in recent years and plan continued expansion in the coming decade.
Less common business models include airlines that specialize in charter or inclusive tour operations. Some regional carriers operate smaller airplanes to serve airports that are unserved or underserved by major airlines.
Cargo modelsCarrying freight and mail gives airlines revenue opportunities beyond transporting passengers. Air cargo is commonly used for shipments of high-value, time-sensitive, or perishable goods that are not well suited for surface transportation. Many airlines carry cargo in the lower hold of passenger jets. Some operate dedicated freighters in addition to passenger airplanes. And a handful of airlines, including express carriers that provide fully integrated logistic services for businesses and consumers, focus exclusively on air cargo. The air cargo business differs in many respects from the passenger business. In particular, air cargo flows are more directional than passenger flows: passengers generally travel round trip, but air cargo does not. Therefore, network strategies for cargo operations differ significantly from passenger network strategies.
Partnerships and alliancesAirline partnerships, either full alliances or other cooperative arrangements, have become powerful tools for expanding networks, enhancing revenue, and reducing costs. Code sharing is a common partnering tactic, and code-sharing routes have grown nearly 8 percent annually during the past decade. The three major alliances (Star Alliance, SkyTeam, and oneworld) now provide more than 60 percent of global capacity. Many airlines have also entered joint ventures, some with antitrust immunity that allows them to operate more closely on applicable routes.
Airlines are also taking equity stakes in other airlines as a growth strategy. Partial acquisitions, full mergers, and cobranded subsidiaries are typical examples. These strategies are effective for opening new markets, obtaining new traffic, and rationalizing costs. Airline mergers have catalyzed industry consolidation and enabled participants to remain competitive. Creating subsidiaries has allowed airlines to expand their brands to foreign countries and to stay within foreign-ownership regulation limits. All of these tactics have contributed to the profitable growth of the industry.
Airline strategies and business models, continued
Airline strategy and business modelsCodeshare growth outpaces overall growth
Worldwide weekly ASK
Bill
ions
0
20
40
60
80
100
120
140
160
2002 2003 2004 2005 2006 2007 2008 2009 2010 2011 2012 2013
Code sharing 55.6%
40.9% code sharing
Code sharing
Non code sharing
Source:August
OAG
Airline strategies and business models 85% of cargo revenue by freighter operators
Source:ATI, US DOT
Expresscarrier36%
Combination carrier38%
All cargo11%
Passenger(belly only)
15%
$94 Billion
Dubai
Abu DhabiJeddah
Doha
Source:IATA
*80% of population is within an 8 hour flight from Middle East hubs
Airline strategies and business modelsMiddle East hubs are well situated geographically

9Copyright © 2014 Boeing. All rights reserved.
Network and fleet planningAirline networks constantly evolve as airlines strive to compete effectively and grow efficiently in the dynamic air transport market. Key network growth strategies include the increase of frequencies, expansion into new markets, and development of hubs. Each of these strategies enables airlines to capture greater market share and serve a broader traffic base.
Frequency growthFrequency is a key driver of network growth, particularly in the competition for business travelers. Daily service is crucial to gaining a foothold in a market. Established airlines can generate incremental market share by increasing frequencies because offering additional opportunities to fly makes an airline’s network more attractive to schedule-conscious business travelers. Increased frequency also boosts connectivity within hub networks, thereby multiplying the number of city pairs that can be linked. For example, over the past decade, increasing frequencies in existing markets has driven 60 percent of domestic market growth in China.
Frequency growth has begun to slow in some maturing networks as markets reach saturation, where nearly every available time slot is covered by nonstop flight options. In these networks, there is a modest trend toward increasing the number of available seats in particular markets by substituting a larger member of an airplane family for a smaller one. For example, airlines around the world are using larger 737-800 airplanes where 737-700 or 737-400 airplanes had served, as they leverage the versatility and efficiency of these fleets across stage lengths and makre types Airlines are also boosting the seat count of existing airplanes by installing new-technology seats that require less room and so allow additional seat rows. Over the past 20 years, the average capacity of single-aisle airplanes has increased by about 20 seats, to approximately 160 seats per airplane. We project that trend will continue during the next decade as airlines optimize airplane configurations for unit cost efficiency and demand for seats, while also preserving flexibility for cyclical demand and competitive dynamics
Growth strategiesExpansion into new markets has the greatest impact on network growth. Adding new destinations to an airline’s network provides access to new revenue streams and often accelerates economic development in the newly connected markets. The development of new domestic and regional routes in emerging aviation markets stimulates economic growth within the region as a result of the commerce that increased passenger traffic generates. The delivery of new, more efficient long-range airplanes in an array of sizes is enabling airlines to match airplane capacity to market demand much more precisely, which in turn, makes it possible to serve new long-distance city
Network and hub analysis
• Announced • In operation
Delhi
Birmingham
Melbourne
Sydney
Tokyo
San Jose
San Diego
Boston
Addis Ababa
Washington
Houston
Lagos
Denver New York
Bangkok
Oslo Helsinki
San Francisco
Chengdu
London
Austin
Copenhagen
Los Angeles Oakland
Orlando Fort Lauderdale
Stockholm
Network and hub analysis787 opening new markets around the world
20142000 2002 2004 2006 2008 20122010
2,000–3,000 nmi
1,000–2,000 nmi
<1,000 nmi
Average number of seats last 15 years
Network and hub analysis Average airplane converging on 160 seats
160
160
170
160
160
737 MAX 8
Efficiency• Unit cost • Fuel per seat • LCC growth
Flexibility• More markets • More frequency • Passenger
preference
Source:Flightglobal Ascend
Online Database
Network and hub analysisGrowth met by increased frequencies and nonstops
0.5
1.0
1.5
2.0
2.5
World (all routes)
1993
2003
2013
Air travel growth
Frequency growth
Average airplane size
Nonstop markets
Inde
x 19
93 =
1.0
0

10 Current Market Outlook 2014–2033
pairs that were not economical in the past. In fact, more than 21 new nonstop routes, including Tokyo-to-Dusseldorf, London-to-Austin, San Francisco–to-Chengdu, and Beijing-to-Boston, have been launched in the past 3 years alone, using the 787.
These growth strategies play a role in the development of hub-based and point-to-point networks. Airlines borrow freely from both models in the continual effort to optimize schedules for maximum revenue and operational efficiency. Airlines with global networks are strengthening schedule connections to maximize traffic and revenue as the trend toward smoothing traffic peaks at hubs, which took hold during the past decade, softens. Airlines, such as the Gulf carriers that take advantage of sixth-freedom connecting power, continue to expand their hubs and networks. Similarly, point-to-point airlines are connecting more city pairs in their networks with nonstop links to maximize airplane utilization and increase both point-to-point and connection traffic moving through their systems.
Structural and competitive challengesIn addition, airlines continuously react to structural and competitive challenges. Short-haul networks in some regions, including China and Europe, face pressure from high-speed rail alternatives, which sometimes requires rebalancing of capacity and redeployment of the fleet to support market expansion in sectors with longer routes. Networks also constantly adapt to pressures from the expansion of competitor networks and from mergers, acquisitions, or alliance partnerships among competing airlines. The most successful airlines blend frequency growth and network expansion to develop and compete profitably.
Strategic planningTo succeed, network strategies must be accompanied by effective fleet plans. Historically high airplane manufacturer backlogs, for single-aisle and widebody airplanes alike, make proactive planning essential to long-term competitive advantage. Airlines link their network strategies to their long-term requirements for airplane replacement and fleet growth to create the most efficient, capable, and flexible fleet. The global leased fleet has now surpassed 40 percent of the total fleet as airlines seek to increase fleet flexibility, obtain near-term growth capacity, and balance their capital expenditures.
The dynamics of the marketplace keep airline networks in a constant state of flux as they adjust to economic conditions, new capabilities of the latest generation of airplanes, and the evolving air transport industry. Airlines will rely increasingly on proactive strategic planning that links network development goals with airplane procurement requirements to realize long-term competitive advantage and achieve optimal network development potential.
Network and hub analysis,continued
Network and hub analysisNetworks are best for serving small markets
0
2
4
6
8
10
12
14
16
<6 <12 <25 <50 <100 <200 <400 <800 <1600 1600+
Sh
are
of
wo
rld
RP
Ks
Connecting markets (%) Nonstop markets (%)
O & D passengers per day
*Network carriers use hubs to maximize passengers in their networks
Network and hub analysisMaximize passengers in networks*
Source:OAG
August 2013
Source:OAG
August 2013
Network and hub analysisPoint-to-point service*
*Point-to-point increases connectivity in an airlines network

11Copyright © 2014 Boeing. All rights reserved.
Technology and capabilitiesDevelopment of commercial aviation technology is aimed largely at improving airplane operating economics, which directly affect airline profitability. Fuel is expected to remain the largest component of airplane operating cost, so technology development efforts focus strongly on reducing fuel consumption. The latest generation of Boeing airplanes, including the 787, 747-8, and the upcoming 737 MAX and 777X, reduce fuel consumption by double-digit percentages compared with earlier-generation airplanes.
Developments in engine technology made possible by advances in materials, aerodynamics, and manufacturing techniques drive much of the improvement. Advances in wing design also contribute to better fuel efficiency. The use of composites in the 787 and 777X wings permitted aerodynamic improvements that could not be achieved using conventional materials. The Boeing Advanced Technology Winglet on the 737 MAX optimizes the performance of the single-aisle airplane’s wing. Improved engines, aerodynamics, and systems also reduce noise by as much as 30 percent in the case of the 747-8.
Many developments that reduce fuel use also improve range and payload capabilities. Increased range capability enables airlines to expand the connectivity of their global networks. Increased payload capability allows airlines to carry additional passengers and revenue cargo, which improves profit potential on a given route. For example, a growing number of airlines are increasing passenger revenue by taking advantage of the flexibility of the 777-300ER interior configuration to install 10-abreast economy class seating.
Innovative interiors enable airlines to carry more passengers while improving passenger experience. For instance, larger and higher windows, sculpted sidewalls, and higher ceilings give a cabin interior a more spacious feel. Larger bins that are easier to open and close are more convenient for the crew and enhance passenger experience. The 787 maintains cabin pressure equivalent to that at 6,000 feet of altitude, with improved air purity and more comfortable cabin humidity than earlier airplanes. Developments such as the innovative, flexible lighting on the 787 help airlines differentiate their brands in creative ways that make flying more enjoyable.
Airlines are also increasingly looking to information technology (IT) solutions to improve operational efficiency, decrease costs, improve customer service, and increase safety. Increased communications connectivity and improved mobile technologies are helping IT solutions penetrate every aspect of airline operations, including maintenance and engineering, ground, and in-flight operations.
Technology and capabilities
Source:US DOT
Technology and capabilitiesTrack record of significant progress
1960s 2000s
Noise footprint based on 85 dBa.
Rel
ativ
e fu
el u
se
No
ise
dB
70% fuel improvement and reduced CO2
90% reduction in noise footprint
Early jet airplanes
New-generation jet airplanes areexponentially more efficient
More fuel Higherdecibels
Lowerdecibels
EvenlowerEven less
Less fuel
Technology and capabilitiesReduced costs, improved performance
Evolving and innovative technologies are reducing costs and improving performance and operations.
Technology and capabilitiesFuel has doubled as a percentage of airline costs
0%
25%
50%
75%
100%
2003
Single aisle Widebody
201320132003
50%25%30%15%
• Fuel costs • Other costs
Cash operating cost, typical rules, representative aircraft

12 Current Market Outlook 2014–2033
Maintenance and engineeringAirlines are seeking airplane and engine health management solutions that provide better prognostic capabilities. The ability to predict maintenance events and connect with maintenance operations during flight can minimize the number and duration of flight disruptions. Improved disruption management solutions can reduce the systemwide effect of delays and cancellations. Digital delivery of maintenance manuals and other technical information, updates, technical authoring tools, and data conversion technologies all improve the efficiency and accuracy of airline maintenance operations. Supply-chain solutions using optimized inventory management and parts procurement solutions can also reduce operating costs. In some cases, new aircraft technology is driving airlines to improve their own technology and capabilities. The latest airplanes, such as the Boeing 787, use vastly more loadable software airplane parts (LSAP), but the traditional method of using floppy disks to load LSAPs is becoming obsolete, pushing airlines to upgrade technology on the ground and in the air.
In-flight operationsThe trend toward in-flight connectivity is evident in the rapidly increasing use of mobile devices such as tablets and smart phones by the flight crew and cabin crew. Electronic flight bags have been in use for decades, but improved connectivity now allows pilots to quickly upload the latest navigation charts to their devices and monitor weather in flight, adjust flight plans to optimize fuel use, use moving runway and taxiway maps for improved situational awareness, and use a wide variety of applications to improve crew productivity and enhance safety. Cabin crew members use mobile devices with in-flight connectivity for onboard sales (including verification of credit cards to eliminate fraud), passenger services, and crew communication and to access crew reporting tools. The growing prevalence of personal electronic devices among passengers could eventually allow airlines to eliminate costly and weighty in-flight entertainment systems in favor of streamed content as onboard Wi-Fi speeds improve.
Airline planning and ground operationsIT advances can touch all parts of the airline planning cycle. Airline planners and ground operations suppliers can take advantage of new technologies that allow airlines to react quickly to ever-changing situations, including crew legality, weather, and airport traffic congestion. IT solutions help airlines optimize activities in real time as the operational environment changes. Mobile solutions that connect applications that assist baggage handlers, gate agents, caterers, fuel providers, and passengers on the ground will become more important as airlines strive to reduce flight disruptions and maximize airplane utilization to gain the greatest return on their investment.
Technology and capabilities,continued
Source:August
OAG
Technology and capabilitiesIncreased capabilities allow airlines to grow
Num
ber
of c
ities
ser
ved
Range category(miles)
• >8,000
• 7,000–7,999
• 6,000–6,999
• 5,000–5,999
• 4,000–4,999
1993
1994
1995
1995
1997
1998
1999
2000
2001
2002
2003
2004
2005
2006
2007
2008
2009
2010
2011
2012
2013
0
100
200
300
400
500
600777–200ER
enters service777–300ER
enters service777–200LRenters service
2003–2013 CAGR
4.3%
2.6%
5.1%
15.8%27.1%
Technology and capabilitiesConnecting with innovation and technology
Transforming data into actionable solutions to drive effective and efficient airline operations
Leveraging airplane technology and Boeing expertise to enhance integration with airline systems
Creating the right tools for the right people, by partnering with you to create innovative, integrated IT products and professional services
Delivering on the promise of enabling a Digital Airline
Technology and capabilitiesImproving operational efficiency
Maintenance and repair services to improve operational efficiency
Modification services to improve airplane performance and increase residual value
Digital tools for airplane troubleshooting and managing the entire maintenance process.
e-Enabled solutions to improve airplane availability and reliability.

13Copyright © 2014 Boeing. All rights reserved.
OpportunitiesIT infrastructure and connectivity can present challenges in developing economies. As these challenges are resolved, a greater number of airlines in developing economies will enter the market for IT solutions. The resultant improvements in operational efficiency, safety, and cost will allow carriers in these regions to compete more effectively with larger global carriers.
Original equipment manufacturers, regulators, and IT vendors must work together to better understand the risk of cyber attacks and develop solutions that reduce the risk. As airports, airplanes, and airlines become more connected, security risks increase. Airlines will seek integrated, robust, secure, and connected mobile solutions for application throughout their operations.
High-speed railOur long-term forecast considers how other technologies, such as high-speed rail (HSR), affect air travel. Railways are well suited for carrying passengers and cargo over relatively short distances (terrain permitting), whereas aviation excels for longer journeys. In addition, aviation is effective for creating large transportation networks without heavy investment in ground infrastructure.
In 2007, the world’s first privately run HSR line, developed under a build-operate-transfer model, started operating in Taiwan. Even with an annual ridership of more than 40 million passengers, the HSR is heavily in debt. Taiwan’s government is looking into recapitalizing and possibly nationalizing the private business venture. On the other side of the Taiwan Strait, China has seen tremendous HSR network growth. By the end of 2013, nearly 10,000 kilometers of HSR network was in operation in China, more than in the rest of the world combined. Yet according to Boeing analysis, only a handful of shorter air routes have ceased operations or reduced seat capacity significantly. The overall impact of HSR on aviation is estimated to be less than 1 percent of China’s pre-HSR domestic aviation capacity.
HSR could compete with some airlines in high-volume, high-yield markets. Yet the relatively short routes where HSR excels represent only a small portion of the market that commercial aviation serves. Airline assets are highly flexible because airplanes can easily be redeployed to more lucrative markets. In addition, the infrastructure investment for a comprehensive aviation network is much lower than for ground modes of transport. Aviation’s network connectivity simply cannot be replicated by ground-based modes. Opportunities to develop intermodal solutions have the potential to combine the advantages of HSR and aviation.
Technology and capabilities,continued
Technology and capabilitiesImproving flight operations
Optimization services Flight planning Crew scheduling
Flight operations Flight documents Airplane performance tools Airport technology Performance engineering training Technical support
Air Traffic Management Airspace design and transformation Performance-based navigation Optimization
Technology and capabilitiesAir travel growing, even with high-speed rail
0.5
1.0
1.5
2.0
2.5
Traf
fic
(pas
seng
er x
dis
tanc
e)
Robust air travel in China since introduction of HSR
2005 2007 2009 2011 2013
• Rail • Air (domestic)
First 300 km/hrHSR service
Source:US DOT
Technology and capabilitiesCauses of delays
0.2% Security
24.2% National Aviation System
4.1% Extreme weather
29.4% Air carrier delay
42.1% Airplane arriving late
1.7% Cancelledand diverted
<0.1 Security
5.5% Air carrier delay
7.7% Airplane arriving late
78.3% On time
6% National Aviation System
0.6% Extreme weather
US Airline Disruptions by Cause as a Percentage of Flights
US Airline Delays by Cause as a Percentage of Total Delay Minutes

14 Current Market Outlook 2014–2033
Methodology Boeing’s Current Market Outlook is a long-term, noncyclical forecast that looks beyond short-term shocks to address underlying trends in the aviation industry. In this forecast, we examine travel demand for 63 intraregional and interregional traffic flows. Key indicators include
n Gross domestic product (GDP) development.
n Population.
n Labor force composition.
n International trade (as a share of GDP).
n Emerging technology (e.g., new airplanes with improved economics and capabilities).
n Business model innovation.
n Quality of service (e.g., new nonstop city pairs, greater frequencies).
n Travel attractiveness.
n Industry competitiveness.
n Openness of air services and domestic airline regulation.
Different flows have different drivers and are therefore modeled differently. Flows touching emerging markets may emphasize GDP per capita, while mature markets may be driven more by time-series trends.
Forecasting requires more than just data because the future of a market is more than an extension of past performance. While some factors driving demand, such as GDP, are easily quantified, other factors that may have an even greater effect on market performance (e.g., liberalization) are more difficult to quantify. Where such factors are present, forecasting demand requires greater judgment than when the same factors are absent.
Short-term effectsAlthough the air transport industry is subject to occasional shocks, demand for air transportation is resilient, as services are often seen as essential, and discretionary trips, such as vacations or family events, are often high-priority items. Over the last 30 years, the aviation industry experienced recessions, oil price shocks, near-pandemics, wars, and security threats, yet traffic continued to grow, on average, at 5 percent annually.
Changes in industrial structure can also result in short-term effects. For example, after consolidating, the U.S. airlines have been focusing on matching demand with capacity. Although traffic growth (expressed in revenue passenger-kilometers (RPK)) has been minimal, airline profitability has improved. Conversely, low-fare carriers in other markets, and the competitive responses they provoke, led to falling fares and traffic stimulation, thereby supporting more rapid RPK growth than those same markets might have achieved in the past.
Traffic and market outlook
Macroeconomics Value of service
Trade GDPLevel
GDPper
capita
Laborforce
Network structure
Infra-structure
Businessmodel
Type of
service
Regulatory
Demand
environment
Traffic and Market OutlookDrivers of air travel demand
Regulatory
Demand
environment
Traffic and market outlookDrivers of air travel demand
Traffic and market outlook Propensity to travel increases with income
2012 GDP per capita, 2005 US dollarsAir trips per person per year
100 1,000 10,000 100,000
Source:IHS Economics
Sabre
10.00
5.00
1.00
IndiaChina RussiaUS
Traffic and market outlook World air travel has grown 5% per year since 1980
Source:ICAO skd.
traffic
0.0
1.0
2.0
3.0
4.0
5.0
6.0
1980
2013
4 recessions 2 financial crises 2 Gulf wars 1 oil shock 1 near pandemic (SARS)
9/11
Revenue Passenger Kilometers RPKs (trillions)
Trend

15Copyright © 2014 Boeing. All rights reserved.
Evolving air travel demandDemand dynamics are different for various levels of a country’s economic development. Emerging markets throughout the world have shown that air travel is a discretionary expenditure, but it is one of the first discretionary items to be added as consumers join the global middle class. As emerging market demand begins to develop, it may take the form of nonscheduled services to leisure destinations. Later on, the same demand may migrate to scheduled services of low-fare carriers, or to the network airlines.
In developed markets, demand for essential travel has been met, leaving growth to come from discretionary travel. GDP per capita matters less in these contexts. Factors such as availability of financing (for funding vacations), consumer confidence, service pricing, service quality (e.g., availability of nonstop flights), and vacation entitlements will tend to have a greater impact.
Propensity to travel, measured in trips or RPKs, generally increases with per capita income within any given region. The amount of this increase varies considerably. Generally, markets that are more open will be more responsive to changes in per capita income, as airlines are freer to add routes, frequencies, and seats to capture demand. In a more regulated environment, demand (i.e., desire to travel) may increase with GDP per capita, but lower service quality and higher pricing may restrain travel growth. Geography may also influence a region’s propensity to travel, with island geographies or poorly connected land areas resulting in somewhat more air travel than might otherwise be the case.
Key indicatorsAs discussed in our methodology section, gross domestic product (GDP) is a strong indicator for the Current Market Outlook. IHS Economics forecasts GDP to grow at 3.2 percent over the next 20 years. Emerging economies are expected to grow at 5.2 percent per year, outpacing the established economies, which will average 2.2 percent growth. Emerging and developing economies will grow from 27 percent of total GDP in 2013 to 40 percent by 2032. The fastest growing economies are those in Asia Pacific (with a projected growth of 4.4 percent), Latin America (with a projected growth of 3.9 percent), and Africa (with a projected growth of 4.7 percent).
Based on the expected 3.2 percent growth in GDP, we project airline passenger traffic to grow at 5.0 percent and air cargo traffic at 4.7 percent. Passenger traffic within China will be the largest travel market, expected to grow at 6.6 percent annually. Travel within North America and Europe, while growing below trend, will be the second and third largest markets, with growth rates at 2.3 percent and 3.5 percent. Traffic to and from the Middle East and Asia Pacific, within Asia Pacific (excluding China), and within Latin America will be among the fastest to grow.
Traffic and market outlook,continued
Source:IHS
Economics
Traffic and market outlookEmerging markets are driving growth
Annual GDP growth (%), 2013–2033
0 1 2 3 4 5 6 7
South Asia
Northeast Asia
ChinaSoutheast Asia
AfricaAsia Pacific
Latin AmericaMiddle East
CISWorld
OceaniaNorth America
Europe
6.56.2
4.74.7
4.43.9
3.83.3
3.22.7
2.51.9
1.5
Traffic and market outlook World traffic varies by market
6.3
6.6
2.3
3.5
7.4
5.3
3.1
6.9
4.3
4.5
4.7
4.9
4.9
0 500 1,000 1,500 2,000 2,500 3,000 3,500
WIthin Asia Pacific*
Within China
Within North America
Within Europe
Middle East–Asia Pacific
Europe—Asia Pacific
North Atlantic
Within Latin America
Transpacific
To/From/Within CIS
North America—Latin America
EuropeLatin America
Africa—Europe
Annual growth (%)
*does not include travel within China
RPKs (billions)
• 2013 traffic • Added traffic 2014–2033
World traffic growth: 5.0
World GDP growth: 3.2
Traffic and market outlookIn-service fleet of 20,910
In-service fleet Top 5 countries 2013
US China Russia UnitedKingdom
Germany0
1,000
2,000
3,000
4,000
5,000
6,000
7,000
Source:Flightglobal Ascend
Online Database

16 Current Market Outlook 2014–2033
Passenger’s options for air travel will continue to evolve. Twenty years ago, passengers were most likely to fly on an airline from Europe or North America. Over the next 20 years, passengers will see greater diversity among the world’s airlines, with 62 percent of traffic being carried by an airline outside of North America or Europe. Trends in passenger traffic growth are similar to those of GDP. Emerging markets will grow faster than established markets. Regions growing above trend are Asia Pacific (at 6.3 percent), Middle East (at 6.4 percent), and Latin America (at 6.2 percent), while European (at 3.9 percent) and North American markets (at 2.9 percent) will be below trend.
Fleet developmentsToday, nearly 21,000 jet airplanes are in commercial operation. The world’s largest fleets are in the United States, China, Russia, the United Kingdom, and Germany. Over the next 20 years, the world’s fleet will grow at an average rate of 3.6 percent annually, driving a need for more than 36,700 new airplanes, valued at $5.2 trillion. Of these new airplanes, more than 30 percent, 13,000 airplanes, have already been sold. The countries with the largest backlog are the United States, China, Indonesia, Russia, and India. With this demand, along with the current fleet, the world’s jet fleet will more than double to a size of more than 42,000 airplanes over the next 20 years.
Forty two percent of these new airplanes will be for replacement and 58 percent will be for growth. The replacement market tends to be driven by the more mature aviation markets, such as Europe and North America. Growth is being driven by the emerging markets, such as Latin America and Asia Pacific, and by the low-cost carrier and sixth freedom business models.
Business modelsAirline business models continue to evolve. What was once a clear division between network, low-cost, and charter models is now less clear, with network carriers operating low-cost, short-haul subsidiaries; low-cost carriers providing frequencies and services to attract business passengers; and charter carriers venturing into single-seat sales. Low-cost carriers are even starting long-haul service, competing with network carriers on point-to-point routes.
The trend toward growth of the low-cost model is clear. Low-cost carriers have grown from 7 percent of the world market in 2003 to 16 percent today and are projected to capture 21 percent by 2033. Charter carriers are hardest hit by this transition, declining from 9 percent in 2003 to 3 percent today and in 2013. Broad network carriers also suffer declines, from 66 percent in 2013 to 62 percent today and 56 percent in 2033. The shift to a low-cost model is even more dramatic when we take growing low-cost subsidiaries in many broad network carriers into consideration.
Traffic and market outlook,continued
Traffic and market outlook 58% of new deliveries are for growth
40,000
30,000
20,000
10,000
0
42,180
36,770
20332013
Units
21,270Growth
58%
15,500Replacement
42%
5,410Retained
20,910
Traffic and market outlookWorld fleet will double by 2033
6%2%
65% 70%
4%8%9%
13%13%
Source: Ascend
• Regional jets • Single aisle • Small widebody • Medium widebody • Large widebody
42,180airplanes
2033
20,910airplanes
2013
11%
Total fleet
Traffic and market outlookBacklog of 13,000 airplanes
Backlog Top 5 countries
US China Indonesia Russia India0
500
1,000
1,500
2,000
2,500
3,000
3,500
Source:Flightglobal Ascend
Online Database

17Copyright © 2014 Boeing. All rights reserved.
160-seat-size aircraft remains heart of the single-aisle marketSingle-aisle airplanes continue to dominate the world’s fleet. In 2013, the single-aisle category comprised 65 percent of the fleet. By 2033, we estimate that share to rise to 70 percent. Of the forecast demand for 25,680 new single-aisle airplanes, valued at $2.5 trillion, 38 percent will replace older airplanes, while 62 percent will expand the fleet. Emerging markets drive demand for single-aisle airplanes. Asia Pacific airlines are expected to take the largest share of new deliveries and will need 9,540 new airplanes to expand their single-aisle fleets from 3,820 to 10,850 airplanes by 2033. Low-cost carriers, whose business models focus on fleet commonality, also drive demand for single-aisle airplanes and are expected to take 40 percent of single-aisle deliveries.
Over the past 20 years, average aircraft size across short, medium, and long regional routes have been converging to 160 seats as the flexibility of today’s single-aisle aircraft allows airlines to fly more directly, more often, and more efficiently. In the short sectors, increases in fuel price drove carriers to larger aircraft to achieve lower unit costs in a challenging sector of the market, and a similar trend is seen in the medium (1,000 to 2,000 mile) segment. On the longer haul regional markets, such as those with transcontinental missions, airplane size flattened over the past 15 years, right at 160 seats, as the capabilities of airplanes such as the 737-800 allowed for more point-to-point services and greater frequencies for passengers. This size category (737-MAX8 size) continues to be the heart of the market today and going forward over the next 20 years. In today’s backlog, approximately 75 percent of airplanes to be delivered are in this size category, and over the next 20 years, 70 to 75 percent of new deliveries to airlines will be of this size.
New widebodies providing more direct, more frequent serviceThe widebody fleet continues to grow as airlines expand their international footprint and open new markets. We forecast that 8,600 new widebody airplanes will be needed to meet this demand. Of these, 4,520 will be in the 200- to 300-seat size category (787-8 and 787-9), 3,460 will be in the 300- to 400-seat size category (787-10, 777, and 777X); and the remaining 620 will be in the greater than 400-seat size category (747-8i). As with the single-aisle airplanes, 38 percent of deliveries will be for replacements and 62 percent of deliveries will be for growth. Europe and North America tend to be more of a replacement market, while Asia Pacific and Middle East are a growth market. Nearly 60 percent of all new deliveries will go to Middle Eastern and Asia Pacific airlines.
Since the 777 came to the market, the top 25 long-haul markets have expanded and capacity has increased by 60 percent. This increase in capacity has been met by an increase in frequencies (up 60 percent) and with the addition of new cities being served (up 46 percent), while
Traffic and market outlook, continued
Traffic and market outlookAirlines will need 25,680 new single aisle aircraft
AsiaPacific
Europe NorthAmerica
Latin America
MiddleEast
CIS Africa0
2,000
4,000
6,000
8,000
10,000
Traffic and market outlookAirline business models continue to evolve
3%
21%
62%56%
16%7% 19%
66%
20%
3%18% 9%
203320132003
• LCC • Charter and IT • Broad network • Other network
ASKs
Traffic and market outlookDelivery demand is becoming more diversified
36,770new airplanes2014 to 2033
Delivery units
4% 3%
8%
8%
21%
20%
37%
NewRegion airplanes
• Asia Pacific 13,460
• Europe 7,450
• North America 7,550
• Middle East 2,950
• Latin America 2,950
• CIS 1,330
• Africa 1,080
Total 36,770

18 Current Market Outlook 2014–2033
the number of seats per airplane has decreased slightly (down 2 percent). This market flexibility will continue as the 787 family and 777X come to market. The 787 is allowing airlines to provide customers the ability to fly where they want to, when they would like to fly, as in the cases of London Heathrow to Austin, Texas, San Francisco to Chengdu, and San Jose to Tokyo. Airlines are also announcing how they will be using the 787-9 in conjunction with the 787-8 to provide the right-size airplane on the right day.
The new twin-engine airplanes coming to market are also helping airlines to evolve airline business models. The 787-8 allows low-cost carriers to move from the traditional short-haul flight into more medium-haul flying, expanding their customer base while using an aircraft with lower operating costs. The range and efficiency of the 777-300ER allow airlines to take advantage of their geographical locations.
Asia Pacific, Europe, and the Middle East account for more than 90 percent of large-airplane demand in the 20-year forecast. These aircraft will serve as passenger jetliners on high-traffic trunk routes and as dedicated commercial freighters. We forecast 620 deliveries, comprising 5 percent of total delivery value, will be required. The Asia Pacific region will receive 34 percent of these deliveries, while Europe will take 10 percent and the Middle East 48 percent. Although their share of long-haul traffic will diminish over the next 20 years, large airplanes remain an important part of the commercial airline fleet.
Air cargo traffic stagnation amid market challengesAn unusually challenging environment over the past several years left traffic levels relatively flat and resulted in persistent overcapacity and weak yields. Nevertheless, air cargo remains indispensable for a variety of industries that require transport of time-sensitive and higher value commodities. These commodities include perishables, consumer electronics, high-fashion apparel, pharmaceuticals, industrial machinery, and high-value intermediate goods such as auto parts. The unparalleled speed and punctuality advantages of air freight ensure that it will continue to play a significant role in the global economy despite improving surface modes that can offer a cheaper transportation alternative.
Dedicated freighters and passenger airplane lower holds both carry air cargo. Cargo capacity on passenger flights has expanded as airlines deploy new jetliners, such as the 777-300ER, that have excellent cargo capability. Dedicated freight services, however, offer shippers a combination of reliability, predictability, and control over timing and routing that passenger lower hold cargo operations cannot often match. Thus, we expect freighters to continue to carry more than half of global air cargo traffic and market capacity balance to be restored within a few years, as world trade recovers.
Traffic and market outlook,continued
Traffic and market outlook 737-800 size single-aisles are “heart of the market”
Single-aisle backlog and forecast
79%
2010–2013Deliveries
Largesingle-aisle
Small single-aisle
76%
OrderBacklog
Largesingle-aisle
Small single-aisle
70-75%
FutureDemand
Largesingle-aisle
Small single-aisle
Traffic and market outlook Airlines will need 8,600 new widebody airplanes
Airplanes 8,600 new airplanes, valued at $2.5 trillion
0
1,000
2,000
3,000
4,000
5,000
Small Widebody Medium Widebody Large Widebody
Traffic and market outlook Mega-cities grow efficiently
Top 25 long-haul airports
Source:Industry
schedules
Capacity Frequency Cities served Seats per flight
+58% +60% +46%
304 299
-2%
2000
2014
Expansion–not size–driving growth

19Copyright © 2014 Boeing. All rights reserved.
Air cargo traffic, as measured in revenue tonne-kilometers (RTK), is projected to average 4.7 percent growth per year over the next 20 years as global GDP and world trade growth accelerate. In spite of multiple exogenous shocks arising from economic and political events and natural disasters, this is slightly below the 5 percent average annual rate achieved over the past three decades. Replacement of aging airplanes, plus the industry’s growth requirements, will create a demand for nearly 2,200 freighter deliveries over the same period. Of these, 1,330 will be passenger airplane conversions. The remaining 840 airplanes, valued at $240 billion, will be new. The freighter fleet will increase by more than half, from 1,690 airplanes in 2013 to 2,730 in 2033.
All standard-body freighters will be conversions from passenger airplanesWe forecast a need for 960 standard-body freighters, all of these passenger conversions, which are attractive for standard-body operations due to their low capital cost. Demand has recently been and will continue to be especially strong in emerging markets.
Express carriers drive medium widebody demandTwo hundred and fifty medium widebody purpose-built freighters will be delivered during the forecast period. This freighter market is driven by express carriers that mitigate the lower economic efficiency of medium widebodies with higher yields. Competition from less expensive surface transport and passenger airplane lower hold capacity constrains the use of medium widebody freighters in regional markets.
Widebody conversions While the performance, efficiency, and reliability of new, purpose-built freighters are valued in many applications, the lower purchase prices for converted freighters often offer opportunities for carriers where very high utilization and more market-dependent demand are more significant considerations. Thus, nearly 400 widebody conversions will be needed over the forecast period.
Intercontinental operations favoring new, large freightersNearly 600 new, large freighters will be required where high cargo density, larger payloads, and extended range are crucial.
Traffic and market outlook,continued
Traffic and market outlook840 new and 1,330 converted freighters
2,170new airplanes2014 to 2033
590
960
250
370
0%
25%
50%
75%
100%
1,690freighters
2013
2,730freighters2033
• Standard-body conversions <45 tonnes
• Medium widebody production 40 to 80 tonnes
• Widebody conversions 40 to 120 tonnes
• Large widebody production >80 tonnes
Traffic and market outlook Freighter market value: $240 billion
Market Value (in billions)
0
40
80
120
160
200
Large more than80 tonnes
Medium40 to 80tonnes
$190
$50
Business and market environment Emerging markets
CyclicalForces
StructuralForces
• Withdrawal of policy stimulus• Weak export markets• Capital rotation as US bond yields rise• Excess capacity after investment booms
• Slower labor force growth• Slower pace of globalization• End of commodity price supercycle• Lack of market reforms
Source:IHS
Economics
Why has growth in emerging markets slowed?

20 Current Market Outlook 2014–2033
Globalized demandAs aviation continues to become an integral part of life, it is bringing people closer together. As emerging markets continue to grow and new business models expand, airplane manufacturers are seeing greater geographical diversity in their customer base. In 1993, more than 73 percent of all traffic was carried by airlines in Europe or North America. By 2033, that proportion will shrink to 38 percent. Asia Pacific and Middle East airlines are becoming prominent in global aviation. The low-cost business model is becoming a viable option in emerging markets, offering consumers access to a wider range of destinations and the opportunity to choose the speed and convenience of flying over traditional modes of transportation. In addition, modern twin-aisle airplanes enable smaller operators in developing economies to compete on longer routes traditionally dominated by foreign carriers. Rapidly evolving aviation services in these regions are broadening the geographical balance of airplane demand, spurring a worldwide requirement for 36,770 new jet airplanes, valued at $5.2 trillion.
Regional focusDifferent regions will still have varying conditions with specialized requirements. Middle Eastern airlines will still favor twin-aisle airplanes and premium passenger services to take advantage of the area’s centrality and prominence in business travel. European and North American airlines respond to growing competition from low-cost carriers by replacing older, fuel inefficient airplanes with larger, more economical single-aisle models. In Asia, rising demand across the board will require a mix of single- and twin-aisle airplanes.
All regions will face similar challenges of fuel price volatility, emission control regimes, and ever-increasing airport congestion as the growing world fleet tries to keep pace with swelling international and local demand for air travel.
World Regions
World regionsMarket value: $5.2 trillion
36,770new airplanes2014 to 2033
20,910Airplanes
2013
Delivery unitsShare of fleet
42,180Airplanes2033
• Regional jets • Single aisle • Small widebody • Medium widebody • Large widebody
2% 7%9%
12%
70%0%
25%
50%
75%
100%
World regionsMarket value: $5.2 trillion
Economy (GDP) 3.2 Large widebody 620 2Traffi c (RPK) 5.0 Medium widebody 3,460 9Cargo (RTK) 4.7 Small widebody 4,520 12Airplane fl eet 3.6 Single aisle 25,680 70
Regional jet 2,490 7
Total 36,770
Marketsize
2013fl eet
2033fl eet
Deliveries 36,770 Large widebody 740 790Market value $5,200B Medium widebody 1,580 3,680Average value $140M Small widebody 2,390 5,570
Single aisle 13,580 29,500Regional jet 2,620 2,640Total 20,910 42,180
Growth measures (%)
Newairplanes
Share by size (%)
MiddleEast
Europe
LatinAmerica
Asia Pacific
CISNorth America
Africa
World regionsMarket value: $5.2 trillion

21Copyright © 2014 Boeing. All rights reserved.
Asia Pacifi cKey indicators and new airplane markets
Growth measures (%)
Newairplanes
Share by size (%)
Economy (GDP) 4.4 Large widebody 210 2Traffi c (RPK) 6.3 Medium widebody 1,420 10Cargo (RTK) 5.5 Small widebody 1,940 14Airplane fl eet 5.2 Single aisle 9,540 71
Regional jet 350 3
Total 13,460
Marketsize
2013fl eet
2033 fl eet
Deliveries 13,460 Large widebody 290 270Market value $2,020B Medium widebody 520 1,500Average value $150M Small widebody 710 2,250
Single aisle 3,820 10,850Regional jet 130 350Total 5,470 15,220
Growth measures (%)
Newairplanes
Share by size (%)
Today’s marketAsia Pacific economies continue to have strong growth. In 2013, regional GDP rose 4.8 percent, driven both by the region’s fast-growing, emerging economies and by the mature economies, which were lifted by recovery from the global recession. Passenger traffic grew 3.9 percent, slightly faster than capacity at 3.7 percent year-over-year growth. Despite high oil prices and fluctuating currency valuations, Asia Pacific airlines are estimated to have earned a net profit of $3.0 billion in 2013 and are forecast to earn $3.7 billion in 2014.
Continued liberalizationThe structure of the Asia Pacific airline industry is changing as regulations liberalize and carriers expand beyond national boundaries. Cross-border cobranded subsidiary agreements and direct investment in foreign airlines allow established airlines access to new markets and promote expanded air service to small markets. The growth of air travel as low-cost carriers (LCC) reduce fares and open new markets testifies to the effects of liberalization. Improved affordability and accessibility will stimulate demand for air travel in established markets and meet the emerging travel needs of the growing middle class.
Strong demandContinued economic growth is expected in the region over the next 20 years, with GDP averaging 4.4 percent growth annually. As income levels rise, Asia Pacific is set to become the largest air travel market in the world. In 2033, approximately 48 percent of global traffic will be to, from, or within the region. More than 100 million new passengers are projected to enter the market annually. By way of perspective, London Heathrow handles 70 million passengers and Atlanta 95 million annually.
To accommodate growing demand, the region will need 13,460 new airplanes, valued at $2,020 billion. By 2033, the fleet will be three times larger than it is today. Fast-growing LCCs and rapid traffic growth within the Asia Pacific region drive a need for 9,540 single-aisle airplanes. LCC market share in Asia is expected to grow from 15 percent today to 21 percent in 2033. Network carriers, the mainstay of international long-haul air transportation, will help drive demand for 3,570 widebody airplanes.
Air cargo also plays a crucial role, transporting goods over difficult terrain and vast stretches of ocean. Many of the world’s largest and most efficient cargo operators are located in Asia. The region’s air cargo will grow 5.5 percent per year. Carriers in the region are expected to take 360 new production freighters and 530 converted freighters.
Asia Pacific
NortheastAsia
Oceania
SouthAsia
China
SoutheastAsia
Asia PacificNew airplanes: 13,460
Asia PacificMarket value: $2.02 trillion
13,460new airplanes2014 to 2033
5,470airplanes
2013
Delivery unitsShare of fleet
15,220airplanes2033
2% 3%10%
14%
71%0%
25%
50%
75%
100%
• Regional jets • Single aisle • Small widebody • Medium widebody • Large widebody

22 Current Market Outlook 2014–2033
ChinaKey indicators and new airplane markets
Growth measures (%)
Newairplanes
Share by size (%)
Economy (GDP) 6.2 Large widebody 60 1Traffi c (RPK) 6.9 Medium widebody 640 11Cargo (RTK) 6.7 Small widebody 780 13Airplane fl eet 5.6 Single aisle 4,340 72
Regional jet 200 3
Total 6,020
Marketsize
2013 fl eet
2033 fl eet
Deliveries 6,020 Large widebody 60 80Market value $870B Medium widebody 130 660Average value $140M Small widebody 230 910
Single aisle 1,840 5,080Regional jet 50 200Total 2,310 6,930
Growth measures (%)
Newairplanes
Share by size (%)
China continues to be one of the fastest growing aviation marketsChina’s aviation market, one of the world’s fastest growing, is going through dramatic changes. Regulatory and policy reforms, low-cost carrier (LCC) and other innovative business models, new technology airplanes, and evolving consumer behaviors are driving airlines to launch additional direct flights and develop more point-to-point networks.
We project that the current growth trend will continue over the next 20 years, with passenger traffic increasing 6.9 percent and air cargo traffic increasing 6.7 percent annually. The majority of the growth, approximately 65 percent, will be within China. About 16 percent of the growth will be international traffic to destinations within the Asia Pacific region. The remaining 19 percent will be long-haul international traffic. To support this growth in demand, China will need 6,020 new airplanes valued at $870 billion.
Domestic markets shifting toward single-aisle airplanesOver the past 20 years, airlines in North America and other aviation markets have moved from flying widebody airplanes to flying single-aisle airplanes on domestic routes. In 1993, widebody airplanes supplied approximately 20 percent of capacity in North America. Today, that number has dwindled to 5 percent. We have also seen this trend in China, where almost 30 percent of capacity was on widebody airplanes in 1993, compared with 9 percent today.
Single-aisle airplanes, such as the 737-800, provide the efficiency and network flexibility airlines need to be competitive in short-to-medium-haul markets, where quick turnaround and airplane utilization are essential. LCCs and new entrants will stimulate traffic growth in China, as they have around the world. The LCC business model depends heavily on passenger demand for point-to-point service, which avoids connections at hubs and shortens travel time. Point-to-point service will help alleviate congestion at major hubs, such as Beijing, Shanghai, and Guangzhou. New LCCs, coupled with increased growth in established airlines, will drive a need for 4,340 new single-aisle airplanes.
New widebody airplanes opening new marketsNew-technology widebody airplanes, such as the 787 and 777, are helping Chinese airlines expand their global networks and compete more effectively with international carriers. In 2013, Chinese airlines opened 10 new long- haul markets. Over the next 20 years, this expansion is expected to continue as traffic to Europe grows 6.1 percent; to North America, 6.3 percent; to Oceania, 6.6 percent; and to Africa, 7.4 percent. China will need 1,480 new widebody airplanes to support this market growth.
China
0 600 1200 1800
Africa
South Asia
Oceania
Middle East
Northeast Asia
North America
Europe
Southeast Asia
Within China
ChinaTraffic varies by market
6.6
7.5
6.1
6.3
5.0
10.0
6.6
7.5
7.4
RPK (billions) Annual growth (%)
• 2013 traffic • Added traffic
China traffic growth: 6.9
China GDP growth: 6.2
ChinaMarket value: $870 billion
6,020New airplanes2014 to 2033
2,310airplanes
2013
Delivery unitsShare of fleet
6,930airplanes2033
• Regional jets • Single aisle • Small widebody • Medium widebody • Large widebody
1% 3%11%
13%
72%0%
25%
50%
75%
100%

23Copyright © 2014 Boeing. All rights reserved.
Northeast AsiaKey indicators and new airplane markets
Growth measures (%)
Newairplanes
Share by size (%)
Economy (GDP) 1.5 Large widebody 70 5Traffi c (RPK) 2.7 Medium widebody 320 24Cargo (RTK) 4.3 Small widebody 340 25Airplane fl eet 2.0 Single aisle 560 42
Regional jet 50 4
Total 1,340
Marketsize
2013 fl eet
2033 fl eet
Deliveries 1,340 Large widebody 120 90Market value $2,80B Medium widebody 180 330Average value $210M Small widebody 230 370
Single aisle 390 600Regional jet 40 50Total 960 1,440
Growth measures (%)
Newairplanes
Share by size (%)
Economic forecasts project modest growthThe Northeast Asia region encompasses Japan, North and South Korea, and Taiwan. The region’s GDP is forecast to grow 1.5 percent over the next 20 years. Japan will grow moderately as it recovers from long-term stagnation. However, an aging and declining population will challenge that growth over the long term. Although Japan will remain the dominant economy in the region, South Korea and Taiwan currently provide almost one-third of the base and will generate much of the projected economic dynamism.
Fleet growth and modernization continuesDespite modest economic growth, air travel in Northeast Asia is forecast to grow 2.5 percent annually over the next 20 years. The region’s major airline fleets are among the world’s most modern and efficient. To maintain the resulting competitive edge, the region’s airlines will require 1,340 new airplanes, valued at $280 billion. About 64 percent of these (860 airplanes) will be for replacement and 36 percent (490 airplanes) will be for growth.
Small and medium widebody airplanes will account for just under half of all deliveries. Single-aisle airplanes will account for 40 percent. Both the number of new regional jets and the number of large airplanes are projected to decline slightly. The requirement for new cargo airplanes is flat.
Low-cost carriers thriveNortheast Asia was initially slow to adopt the low-cost model, but the emergence of low-cost carriers (LCC) is now a major driver of growth in the region. Whether as subsidiaries of the major network carriers or as independent startups, LCCs are competing with the established airlines and among themselves to provide new, affordable opportunities for air travel. The strength and popularity of these new carriers are forcing the major international airlines of the region to reconsider their domestic strategies. The short distances between many of the destinations in the Asia Pacific region give the LCCs access not only to markets within Northeast Asia but also to locations in China and Southeast Asia.
Major airport expansion is proceedingAll the region’s major airports have been modernized recently. Tokyo’s Haneda has been upgraded to support expanded international operations and Narita to accommodate the new LCCs. Seoul’s Incheon is being redesigned to create a major international hub that will serve all of Asia Pacific. Taiwan is improving its major airports to facilitate traffic across the straits in anticipation of relaxed travel restrictions with mainland China.
Northeast Asia
Northeast AsiaAirline fleets will grow by more than a third
64% of new deliverieswill be for replacement
0
400
800
1,200
1,600
• In-servicefleet2013
• Retained
• Replaced
• Growth
• Totalfleet2033
Northeast AsiaMarket value: $280 billion
1,340New airplanes2014 to 2033
960airplanes
2013
Delivery unitsShare of fleet
1,440airplanes2033
• Regional jets • Single aisle • Small widebody • Medium widebody • Large widebody
5% 4%
24%
25%
42%
0%
25%
50%
75%
100%

24 Current Market Outlook 2014–2033
South AsiaKey indicators and new airplane markets
Growth measures (%)
Newairplanes
Share by size (%)
Economy (GDP) 6.5 Large widebody — —Traffi c (RPK) 8.6 Medium widebody 170 10Cargo (RTK) 8.3 Small widebody 130 7Airplane fl eet 7.7 Single aisle 1,430 82
Regional jet 20 1
Total 1,750
Marketsize
2013 fl eet
2033 fl eet
Deliveries 1,750 Large widebody 10Market value $230B Medium widebody 40 200Average value $130M Small widebody 40 230
Single aisle 370 1,620Regional jet 10 20Total 470 2,070
Growth measures (%)
Newairplanes
Share by size (%)
South Asia
Traffic growth (%) CAGR, 2014–2033
South Asia Airlines are forecast to have world-leading growth
0 2 4 6 8 10
Northeast Asia
North America
Europe
CIS
Oceania
World
Africa
Latin America
Middle East
Southeast Asia
China
South Asia 8.6
6.9
6.6
6.4
6.2
5.9
5.0
4.8
4.4
3.9
2.9
2.7
South AsiaMarket value: $230 billion
1,750new airplanes2014 to 2033
470airplanes
2013
Delivery unitsShare of fleet
2,070airplanes2033
• Regional jets • Single aisle • Small widebody • Medium widebody • Large widebody
10% 1%
7%
82%0%
25%
50%
75%
100%
Robust traffic growth projectedSouth Asian air travel is expected to grow 8.3 percent per year over the next 20 years. Domestic, regional, and interregional travel to the Middle East and Southeast Asia will be the largest flows.
South Asia’s demographics are favorable to air transportation growth. The region’s population totaled 1.6 billion in 2013, and a growing share of this population is entering the workforce. The region’s real GDP is forecast to grow an average 6.5 percent per year through 2033.
The 2014 elections of business-friendly candidates raised optimistic expectations for India’s economy. If current economic policy liberalization, market reform, and investment trends continue, India’s economy is projected to become the world’s fourth largest.
New partnerships aboundReform of foreign direct investment rules in 2012 allowed foreign airlines to acquire up to 49 percent of an Indian airline. Abu Dhabi’s Etihad Airways promptly acquired 24 percent of Jet Airways. The partnership immediately strengthened the Jet Airways balance sheet and promises long-term benefits from network synergies with Etihad and its equity partners.
Air India joined Star Alliance in June 2014, becoming the first Indian airline to enter a global alliance. Air India’s membership adds more than 400 daily flights connecting more than 50 destinations to the alliance’s network. Increased global connectivity could boost Air India’s revenue by about 5 to 6 percent in the near term.
The Tata Group also moved swiftly to partner with foreign airlines, announcing tie-ups with AirAsia and SIA. Both links are structured as joint ventures, with the foreign airlines owning 49 percent and Indian partners owning 51 percent. AirAsia started India operations in June 2014; the venture with SIA, named Vistara, is expected to launch in the third or fourth quarter.
Market reforms support further growthThe Directorate General of Civil Aviation recently moved toward easing regulation of the Indian aviation market. A new startup airline (Air Costa) was approved in 2013 and several new operators gained Air Operators Permits and No Objection Certificates in 2014.
Also helpful is the expansion in 2014 of the visa-on-arrival program from 11 countries to 180, offering 30-day visas at 26 ports of entry. Under consideration are taxation reforms, including rationalization of aviation fuel taxes, which can currently reach 35 percent; reduction of taxes on maintenance, repair, and overhaul, which encourage Indian airlines to outsource MRO to neighboring regions; and reduction of duties on engine spare parts.

25Copyright © 2014 Boeing. All rights reserved.
Southeast AsiaKey indicators and new airplane markets
Growth measures (%)
Newairplanes
Share by size (%)
Economy (GDP) 4.7 Large widebody 50 2Traffi c (RPK) 6.6 Medium widebody 240 7Cargo (RTK) 5.0 Small widebody 530 16Airplane fl eet 5.9 Single aisle 2,460 73
Regional jet 70 2
Total 3,350
Marketsize
2013 fl eet
2033 fl eet
Deliveries 3,350 Large widebody 70 60Market value $500B Medium widebody 140 250Average value $150M Small widebody 140 580
Single aisle 830 2,810Regional jet 10 70Total 1,190 3,770
Growth measures (%)
Newairplanes
Share by size (%)
Southeast Asia
Southeast Asia Traffic varies by market
Annual RPK (billions) CAGR (%)
0 200 400 600 800
Others
South Asia
Oceania
Northeast Asia
Middle East
Europe
China
Within Southeast Asia
• 2013 traffic • Added traffic 2014–2033
7.7
7.5
4.8
6.1
4.2
5.1
8.5
6.8
Southeast AsiaMarket value: $500 billion
3,350new airplanes2014 to 2033
1,190airplanes
2013
Delivery unitsShare of fleet
3,770airplanes2033
• Regional jets • Single aisle • Small widebody • Medium widebody • Large widebody
2% 2%7%
16%
73%0%
25%
50%
75%
100%
Airlines expand operationsSoutheast Asia’s airlines are growing rapidly as the region continues to develop economically. Low-cost carriers (LCC) are expanding and gaining market share, stimulating passenger demand with attractive fares and new routes. Some Southeast Asia LCCs have launched subsidiaries or franchises to expand their operations into other countries or regions. A few LCCs have even ventured beyond single-aisle operations to provide widebody services that connect to destinations that exceed the range capabilities of single-aisle airplane. Network carriers have restructured to expand their product offerings for growth and increased competitiveness in the quickly developing marketplace. The heightened competition has increased the availability and affordability of air travel within the region.
Regional markets will continue to grow rapidly as ties within the Association of Southeast Asian Nations (ASEAN) strengthen, stimulating business and leisure travel. New, efficient airplanes with improved capabilities and lower operating costs are integral to carriers’ business strategies. Southeast Asian airlines have dramatically increased their airplane orders to meet growing demand and to open new, direct, long-range markets. In fact, more than half of the region’s forecast 2,460 single-aisle airplane deliveries over the next 20 years are already on order.
Liberalization opens routesRegulatory changes and infrastructure improvements are crucial to air travel expansion. Relaxation of market regulations among ASEAN countries has removed many traditional barriers to growth. And flights among ASEAN capital cities have increased, marking an intermediate step in the path to a unified regional aviation market. Several carriers are aggressively expanding into new markets by acquiring or partnering with other carriers in Southeast Asia and surrounding regions. Governments and airport authorities in the region are eager to expand their aviation infrastructures and capitalize on increased trade and tourism.
Airlines bolster economic growthInternational economic relationships and collaboration within the region continue to strengthen. Air transportation plays a vital role in the region’s projected 4.7 percent annual GDP growth over the next 20 years. For example, affordable air travel options have stimulated growth in the region’s services sector, including tourism and financial services. The region’s strong air cargo operations enable efficient shipment of manufactured goods. Overall, air travel to, from, and within the region is projected to grow an average 6.6 percent annually over the next 20 years. Air travel within the region will lead with 7.7 percent annual growth, driving single-aisle airplane deliveries to reach 73 percent of total deliveries within the region.

26 Current Market Outlook 2014–2033
OceaniaKey indicators and new airplane markets
Growth measures (%)
Newairplanes
Share by size (%)
Economy (GDP) 2.7 Large widebody 30 3Traffi c (RPK) 4.8 Medium widebody 50 5Cargo (RTK) 4.5 Small widebody 160 16Airplane fl eet 3.2 Single aisle 750 75
Regional jet 10 1
Total 1,000
Marketsize
2013 fl eet
2033 fl eet
Deliveries 1,000 Large widebody 30 40Market value $140B Medium widebody 30 60Average value $140M Small widebody 70 160
Single aisle 390 740Regional jet 20 10Total 540 1,010
Growth measures (%)
Newairplanes
Share by size (%)
The market continues to thriveOceania is a dynamic region of roughly 40 million people. Total air traffic is forecast to continue to grow at the annual rate of 4.8 percent over the next 20 years as connections to the neighboring Asia Pacific region and other world regions improve. Traffic growth within Oceania will slightly lag the overall rate, at 4.7 percent. Capacity between Oceania and Southeast Asia, the primary gateway to other world regions, is forecast to increase 5.1 percent per year. In addition, continued expansion of trade and tourism will spur the opening of more flights and new markets to North America, the Middle East, and China. Middle East airlines, bridging Oceania to Europe and Africa via stops in the Middle East, are forecast to spur the Middle East traffic flow to increase 6.5 percent. Traffic between China and Oceania will grow a robust 6.6 percent per year.
The region’s airlines continue to evolveAirlines within Oceania continue to evolve in response to economic conditions and competition. Airlines based in the Middle East, China, and Southeast Asia continue to rapidly increase their capacity to and from Oceania. The Qantas-owned low-cost carrier (LCC), Jetstar, continues to expand its cobranded subsidiaries throughout Asia. In 2013, Qantas entered a 10-year partnership with Emirates to collaborate on routes, pricing, scheduling, and other important aspects of operations. Virgin Australia acquired a major share of Tigerair Australia. Etihad Airways, Singapore Airlines, and Air New Zealand acquired ownership shares of Virgin Australia. The first 787s in the region arrived at Jetstar in 2013, allowing the airline to begin medium-haul LCC operations.
New airplanes are needed in the regionThere will be a continual need for new airplanes in the region as traffic increases and airlines evolve. Over the next 20 years, Oceania is expected to need 1,000 new airplane deliveries, of which 760 will be single-aisle airplanes to transport people within the region or to nearby Southeast Asia. To meet demand for travel across the globe, 240 widebody airplanes will be required, of which approximately 160 will be small widebodies, 50 will be medium widebodies, and 30 will be large widebodies.
Oceania
5.1%
3.9% 3.8%
8.8%
4.7%
5.4%
6.6%
6.5%
OceaniaStrong annual capacity growth on traffic flows
OceaniaMarket value: $140 billion
1,000new airplanes2014 to 2033
540airplanes
2013
Delivery unitsShare of fleet
1,010airplanes2033
• Regional jets • Single aisle • Small widebody • Medium widebody • Large widebody
3% 1%5%
16%
75%0%
25%
50%
75%
100%

27Copyright © 2014 Boeing. All rights reserved.
Strong growth despite uncertaintyThe European aviation market remained strong in 2013 despite recessions in some economies and sluggish recovery in others. Europe’s GDP grew 0.4 percent in 2013 and is forecast to grow 1.9 percent annually through 2033. The Association of European Airlines reports that member airlines carried 0.2 percent more passengers in 2013 than in the previous year. Members of the European Low Fares Airline Association reported a 6.7 percent increase in passengers over 2012 levels. European airlines acquired more than 180 new airplanes in 2013, of which 78 percent were single aisle.
Aviation growth is expected to continue over the next 20 years, with European airlines forecast to acquire 7,450 new airplanes valued at $1,040 billion. Single-aisle airplanes will account for the majority of deliveries, representing a 79 percent share of total deliveries.
Although European aviation growth is not as rapid as aviation growth in the world’s emerging economies, the region’s large installed base of more than 4,300 airplanes supports a substantial demand for replacement airplanes. Replacement demand will account for 54 percent of Europe’s total market for new airplanes.
Continued strategic changeAirline operations continue to evolve with the launch of new ventures and new business models. Long-haul service by European low-cost carriers (LCC) became a reality in 2013 with the delivery of the 787 to Norwegian Air Shuttle. The next 20 years are expected to bring additional mergers and acquisitions, along with increased collaboration with alliance partners around the world.
Large Middle East carriers have captured significant long-haul share from European network carriers by providing one-stop service from Europe to markets such as India, Australia, and Southeast Asia. These carriers are also changing the way that they compete for European business. One airline entered a global alliance, another acquired an equity stake in a European carrier, and another formalized a cooperative agreement with a non-European partner.
Large network airlines are tending to shift away from short-haul traffic, which is targeted by LCCs, and toward flowing passengers through their hubs on longer itineraries. LCCs have continued to add service in short-haul markets, with LCCs providing 40 percent of capacity on intra-Europe flights in 2013. Smaller flag carriers and charter airlines will be challenged to compete in an environment where LCCs dominate short-haul, point-to-point service, and large network carriers and their alliance partners exploit the cost advantages of megahubs for long-haul traffic.
Europe
EuropeMarket value: $1.04 trillion
7,450new airplanes2014 to 2033
4,350airplanes
2013
Delivery unitsShare of fleet
7,710airplanes2033
• Regional jets • Single aisle • Small widebody • Medium widebody • Large widebody
1% 1%8%
11%
79%0%
25%
50%
75%
100%
EuropeLCC share continues to grow
LCC intra-Europe service
AS
K s
hare
Source:OAG
2001
2003
2005
2007
2009
2011
2013
40%
0%
10%
20%
30%
EuropeKey indicators and new airplane markets
Economy (GDP) 1.9 Large widebody 60 1Traffi c (RPK) 3.9 Medium widebody 590 8Cargo (RTK) 3.5 Small widebody 810 11Airplane fl eet 2.9 Single aisle 5,870 79
Regional jet 120 1
Total 7,450
Marketsize
2013 fl eet
2033 fl eet
Deliveries 7,450 Large widebody 180 110Market value $1,040B Medium widebody 360 640Average value $140M Small widebody 350 980
Single aisle 3,120 5,830Regional jet 340 150Total 4,350 7,710
Growth measures (%)
Newairplanes
Share by size (%)

28 Current Market Outlook 2014–2033
Continued traffic growth and financial stabilityPassenger traffic, as measured in revenue passenger-miles, continues to rebound from the lows of the 2008/2009 downturn. Overall US passenger traffic has averaged 2 percent growth per year since 2009, ahead of capacity growth, which ranged from 1 to 2 percent per year over the same period. Capacity growth of the low-cost carriers (LCC) continues to outpace network carriers, averaging 4 percent in 2013, compared with 1 percent for network carriers. Total fleet capacity increased 2 percent in 2013, rebounding to pre-2008 levels. The average passenger load factor for 2013 was 83 percent, an all-time high for the US airline industry. Canada’s two largest airlines outpaced the US airline traffic and capacity growth, posting 5 percent and 4 percent growth, respectively.
With the consolidation of the US airline industry over the past six years, a commanding 75 percent of both traffic and capacity is concentrated with the Big 3 network carriers: American, United, and Delta. Consequently, capacity growth slowed as the recently merged airlines continued to impose capacity discipline and to realign their networks to maximize profitability. LCCs accounted for a 20 percent share of traffic and capacity, a gain of half a percentage point compared with 2012.
Capacity growth rates varied by regional flow. For the Big 3 US airlines, capacity growth within North America increased 1 percent during 2013. When regional jet operations are included, network-carrier capacity growth drops to 0.5 percent per year, as available seat-miles on regional jets declined 1 percent. Regional jet operators continue to replace smaller regional jets with larger regional jets or small single-aisle commercial airplanes with better fuel economy and lower trip costs. Among individual flows, the Latin America flow grew the fastest, with capacity and traffic up 5 percent and 6 percent, respectively. Load factor remained constant at 81 percent. The transatlantic flow recorded the largest load-factor increase, rising 2 percentage points to 83 percent as traffic grew 1 percent and capacity declined 0.5 percent.
Five major airline mergers since 2008 have made the US airline industry the beacon of profitability for the global airline industry. US airlines are expected to report record net income of $5.5 billion for 2013, and IATA forecasts net income of $8 billion for 2014. Profit margins before interest and taxes are also forecast to increase 1.5 percentage points to slightly more than 6 percent.
North America
>1%21%
7%8%
64%0%
25%
50%
75%
100%
North AmericaMarket value: $870 billion
7,550new airplanes2014 to 2033
6,650airplanes
2013
Delivery unitsShare of fleet
9,120airplanes2033
• Regional jets • Single aisle • Small widebody • Medium widebody • Large widebody
North AmericaUS Airline industry profitability: 1968-2012
Net
inco
me
($ M
illion
s)
Collectively the industry has lost $25B since airline deregulation in 1978
-$25,000
-$20,000
-$15,000
-$10,000
-$5,000
$0
$5,000
$2,086
1968to
1977
1978to
1987
1988to
1997
1998to
2007
2008to
2013
-$18,989
-$9,248
$2,202$1,434
Source:airlines.org
North AmericaKey indicators and new airplane markets
Economy (GDP) 2.5 Large widebody 20 >1Traffi c (RPK) 2.9 Medium widebody 510 7Cargo (RTK) 3.4 Small widebody 630 8Airplane fl eet 1.6 Single aisle 4,820 64
Regional jet 1,570 21
Total 7,550
Marketsize
2013fl eet
2033fl eet
Deliveries 7,550 Large widebody 100 80Market value $870B Medium widebody 320 560Average value $120M Small widebody 730 920
Single aisle 3,790 5,950Regional jet 1,710 1,610Total 6,650 9,120
Growth measures (%)
Newairplanes
Share by size (%)
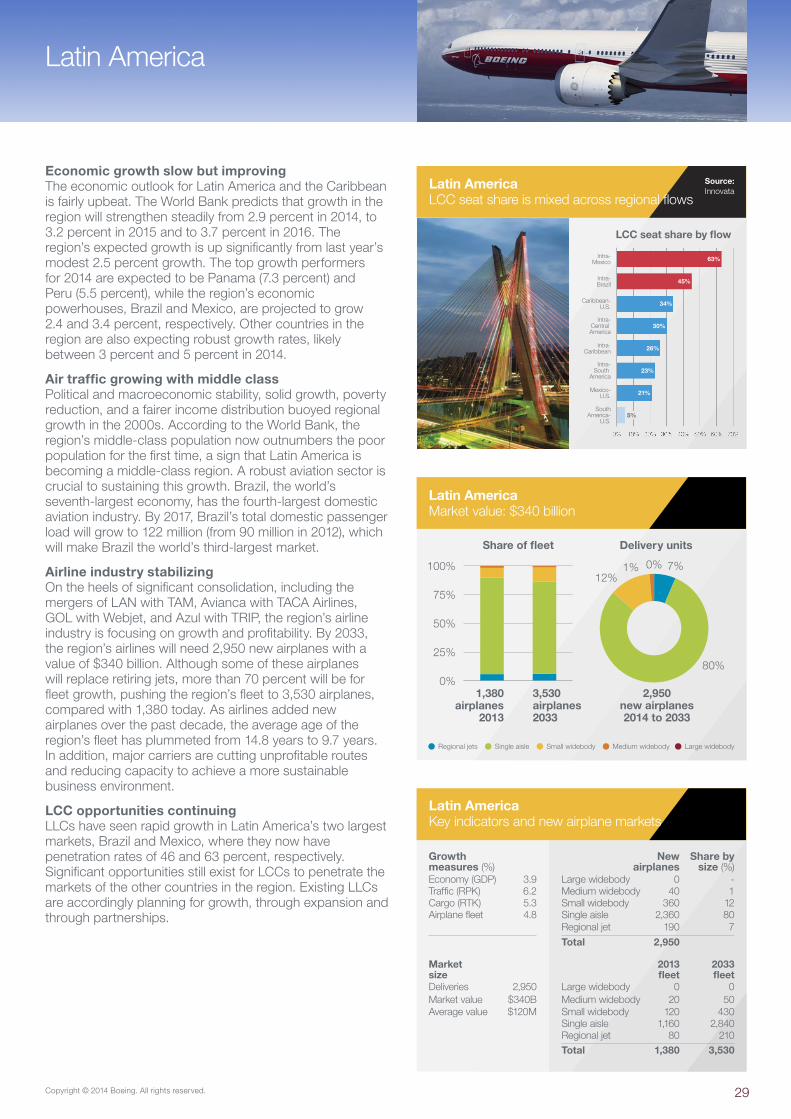
29Copyright © 2014 Boeing. All rights reserved.
Economic growth slow but improvingThe economic outlook for Latin America and the Caribbean is fairly upbeat. The World Bank predicts that growth in the region will strengthen steadily from 2.9 percent in 2014, to 3.2 percent in 2015 and to 3.7 percent in 2016. The region’s expected growth is up significantly from last year’s modest 2.5 percent growth. The top growth performers for 2014 are expected to be Panama (7.3 percent) and Peru (5.5 percent), while the region’s economic powerhouses, Brazil and Mexico, are projected to grow 2.4 and 3.4 percent, respectively. Other countries in the region are also expecting robust growth rates, likely between 3 percent and 5 percent in 2014.
Air traffic growing with middle classPolitical and macroeconomic stability, solid growth, poverty reduction, and a fairer income distribution buoyed regional growth in the 2000s. According to the World Bank, the region’s middle-class population now outnumbers the poor population for the first time, a sign that Latin America is becoming a middle-class region. A robust aviation sector is crucial to sustaining this growth. Brazil, the world’s seventh-largest economy, has the fourth-largest domestic aviation industry. By 2017, Brazil’s total domestic passenger load will grow to 122 million (from 90 million in 2012), which will make Brazil the world’s third-largest market.
Airline industry stabilizingOn the heels of significant consolidation, including the mergers of LAN with TAM, Avianca with TACA Airlines, GOL with Webjet, and Azul with TRIP, the region’s airline industry is focusing on growth and profitability. By 2033, the region’s airlines will need 2,950 new airplanes with a value of $340 billion. Although some of these airplanes will replace retiring jets, more than 70 percent will be for fleet growth, pushing the region’s fleet to 3,530 airplanes, compared with 1,380 today. As airlines added new airplanes over the past decade, the average age of the region’s fleet has plummeted from 14.8 years to 9.7 years. In addition, major carriers are cutting unprofitable routes and reducing capacity to achieve a more sustainable business environment.
LCC opportunities continuingLLCs have seen rapid growth in Latin America’s two largest markets, Brazil and Mexico, where they now have penetration rates of 46 and 63 percent, respectively. Significant opportunities still exist for LCCs to penetrate the markets of the other countries in the region. Existing LLCs are accordingly planning for growth, through expansion and through partnerships.
Latin America
Latin AmericaMarket value: $340 billion
2,950new airplanes2014 to 2033
1,380airplanes
2013
Delivery unitsShare of fleet
3,530airplanes2033
• Regional jets • Single aisle • Small widebody • Medium widebody • Large widebody
0% 7%1%12%
80%0%
25%
50%
75%
100%
Latin AmericaLCC seat share is mixed across regional flows
0% 10% 20% 30% 40% 50% 60% 70%
63%
45%
34%
30%
26%
23%
21%
5%
Source:Innovata
LCC seat share by flow
Intra-Mexico
SouthAmerica-
U.S.
Mexico-U.S.
Intra-South
America
Intra-Caribbean
Intra-Central America
Caribbean-U.S.
Intra-Brazil
Latin AmericaKey indicators and new airplane markets
Economy (GDP) 3.9 Large widebody 0 -Traffi c (RPK) 6.2 Medium widebody 40 1Cargo (RTK) 5.3 Small widebody 360 12Airplane fl eet 4.8 Single aisle 2,360 80
Regional jet 190 7
Total 2,950
Marketsize
2013fl eet
2033fl eet
Deliveries 2,950 Large widebody 0 0Market value $340B Medium widebody 20 50Average value $120M Small widebody 120 430
Single aisle 1,160 2,840Regional jet 80 210Total 1,380 3,530
Growth measures (%)
Newairplanes
Share by size (%)

30 Current Market Outlook 2014–2033
Growth strategiesAt the crossroads between Asia, Africa, and Europe, the Middle East is well positioned to compete for traffic connecting these regions. Total airline capacity in the Middle East grew 11 percent in 2013, led by Emirates, Qatar Airways, Etihad Airways, Saudia, and the region’s low-cost carriers (LCC).
Booming demand in neighboring regions, plus local demand development, work together to drive the Middle East market. Hub aggregation is a key to enabling growth, because the region’s central hubs allow carriers to serve hundreds of routes that have insufficient traffic to warrant point-to-point service. Alliances, partnerships, and equity stakes in airlines of neighboring regions also feed the Middle East hubs.
Business model innovation supports growth in the region as LCCs reduce short-haul fares, set up cross-border subsidiaries, and institute mobile booking portals to improve access to air transport services. Some LCCs are expanding their networks into previously underserved areas, such as the Commonwealth of Independent States. The LCC business model is evolving as carriers such as flydubai develop hybrid concepts that combine low-fare operations with business-class offerings.
Liberalization advancesThere remains significant untapped potential for liberaliz-ation within the region. The Kingdom of Saudi Arabia is taking steps toward opening its underserved domestic markets. Two new airlines are expected to begin operations in 2014: SaudiGulf, an independent based in Dammam, and Al Maha, an offshoot of Qatar Airways. State-owned Saudia is expected to be privatized, although perhaps not quickly. Commentators note the opportunity for the relaxation of price controls on domestic flights in Saudi Arabia, which would support industry health and service quality.
Infrastructure and airspace developmentInfrastructure investment tends to target new runways and terminals, focusing on the region’s main hubs. New airports opened in Jebel Ali (Dubai) and Doha, runways were refurbished and upgraded at Dubai International, and construction started on a new terminal at Abu Dhabi International. Airport expansion is also underway at King Abdulaziz International (Jeddah) and King Khalid International (Riyadh).
Other challenges remain: Large sections of airspace remain under military control, reducing the airspace available for commercial traffic; and the region’s air traffic control (ATC) systems are not centralized, leaving operators to contend with a patchwork of rules, agencies, and processes. Regional authorities are working to address these needs, and recent discussions of ATC coordination between the Gulf Cooperation Council countries and their neighbors serve as a sign of progress.
Middle East
Middle EastMarket value: $640 billion
2,950new airplanes2014 to 2033
1,180airplanes
2013
Delivery unitsShare of fleet
3,360airplanes2033
• Regional jets • Single aisle • Small widebody • Medium widebody • Large widebody
10% 1%
27%
46%16%0%
25%
50%
75%
100%
Middle EastOutpaces the World in international traffic growth
Source:IATA
-5%
0%
5%
10%
15%
20%
25%
30%
35%
Middle East
World
2001
2003
2005
2007
2009
2011
2013
Middle EastKey indicators and new airplane markets
Economy (GDP) 3.8 Large widebody 300 10Traffi c (RPK) 6.4 Medium widebody 790 27Cargo (RTK) 5.9 Small widebody 460 16Airplane fl eet 5.4 Single aisle 1,360 46
Regional jet 40 1
Total 2,950
Marketsize
2013 fl eet
2033 fl eet
Deliveries 2,950 Large widebody 100 270Market value $640B Medium widebody 280 770Average value $220M Small widebody 220 570
Single aisle 520 1,680Regional jet 60 70Total 1,180 3,360
Growth measures (%)
Newairplanes
Share by size (%)

31Copyright © 2014 Boeing. All rights reserved.
Strong travel growthThe commercial aviation outlook for the Commonwealth of Independent States (CIS) foresees continued growth. The region’s geographical size and diverse terrain make airline travel an attractive transportation option. Air travel will increase over the coming 20 years as personal incomes rise and air transport regulations are liberalized to make aviation services more available and affordable. The region’s demand for new airplanes is increasing. Over the next 20 years, airlines in CIS will need 1,330 airplanes, valued at $150 billion.
The economies of the CIS are expected to continue to expand, with GDP growing 3.3 percent annually over the next 20 years. Russia’s economy continues to be the region’s largest, accounting for nearly 75 percent of the region’s GDP in 2013. The economies of Ukraine and Kazakhstan follow that of Russia in size.
The Russian Transport Ministry’s Federal Air Transport Agency reported that the number of passengers carried by Russian airlines rose to nearly 85 million in 2013, an increase of 14.2 percent compared with 2012.
Developing fleetInternational traffic is expected to grow at an annual rate of 4.6 percent, nearly doubling over the next 20 years, as market regulation liberalizes. Airlines will need 180 widebody airplanes to handle the increased traffic. The new airplanes will help the region’s airlines increase their international footprint. Within the region, traffic is expected to grow 4.3 percent, creating a need for 990 single-aisle airplanes. Although the region’s fleet continues to grow, 52 percent of new airplane deliveries will be to replace older airplanes as they retire from the fleet. New airplanes, such as the 737 MAX and the 787 Dreamliner, are more efficient than the airplanes they replace, so overall fleet efficiency will improve.
Shifting business modelsThe low-cost carrier (LCC) business model has been expanding throughout the globe, though with limited success in the CIS. This may be changing, as recent increases in the number of LCC flights from neighboring regions and Aeroflot’s intention to launch a low-cost subsidiary could signal the market’s readiness for airline business model innovation. Rail transportation is still very popular in the region, but LCCs operating with competitive airfares and faster travel time may capture traffic from the rails.
Commonwealth of Independent States
CISKey indicators and new airplane markets
Economy (GDP) 3.3 Large widebody 30 2Traffi c (RPK) 4.4 Medium widebody 60 5Cargo (RTK) 4.0 Small widebody 90 7Airplane fl eet 2.2 Single aisle 990 74
Regional jet 160 12
Total 1,330
Marketsize
2013 fl eet
2033 fl eet
Deliveries 1,330 Large widebody 60 60Market value $150B Medium widebody 20 90Average value $110M Small widebody 180 160
Single aisle 740 1,350Regional jet 180 160Total 1,180 1,820
Growth measures (%)
Newairplanes
Share by size (%)
• Regional jets • Single aisle • Small widebody • Medium widebody • Large widebody
CISMarket value: $150 billion
1,330new airplanes2014 to 2033
1,180airplanes
2013
Delivery unitsShare of fleet
1,820airplanes2033
2% 12%5%7%
74%0%
25%
50%
75%
100%
CIS1,330 new passenger airplanes required
Passenger airplane fleet 2013–2033
0
500
1,000
1,500
2,000
• In-servicefleet2013
• In-service
• Retained
• Growth
• Totalfleet2033

32 Current Market Outlook 2014–2033
Economic growth prospects rival Asia’sGrowth of Africa’s economies has accelerated. Despite the global recession and political unrest in North Africa, gross domestic product has increased 4 percent annually over the past decade, compared with an average 2.2 percent rise during the 1990s. Rising demand for natural resources, particularly from emerging economies in Asia and the Middle East, contribute to this growth. Consequently, Africa conducts half its trade with developing economic regions.
Africa’s acceleration is more than a natural resources story. Its economies are diversifying as telecommunications, banking, and retail flourish. An economy based on rising incomes, consumption, employment, and productivity is emerging, and these trends are forecast to continue.
Twenty-five African countries have attained middle-income status as defined by the World Bank. The emergence of a middle class equal in size to India’s makes consumption a major driver of economic growth. Africa’s labor force is forecast to grow by 122 million people by 2020, and a total workforce that will surpass that of China or India by 2035.
Strong economic prospects lead to robust demand for air travelTraffic to, from, and within Africa is projected to grow about 6 percent per year for the next 20 years, driven by the economic outlook, increasing trade links, and the growing middle class.
Although air travel to and from Europe is Africa’s largest market, stronger growth to and from emerging markets and within Africa indicatesmore blance in the future. Today, flows to Europe account for half of all Africa traffic. In 20 years, that share is projected to fall to one-third, owing to growth in emerging markets.
Growth and replacement drive delivery projectionsAfrica is forecast to require about 1,100 new airplanes over the next 20 years, approximately two-thirds of which will expand the region’s fleet. Replacing the aging fleet is also an important component of demand. Although the average in-service age of Africa’s mainline fleet has declined by approximately 25 percent over the past decade, it remains higher than the world average.
Single-aisle airplanes will continue to be the largest segment of African airline deliveries. They can serve the majority of routes in Africa’s top three markets, where their versatility and ability to provide higher service levels make them attractive. Widebody airplanes, purchased by airlines that fly high-density and long-range routes, will account for almost half of the total delivery value to African airlines.
Africa
AfricaKey indicators and new airplane markets
Economy (GDP) 4.7 Large widebody - - Traffi c (RPK) 5.9 Medium widebody 50 5Cargo (RTK) 6.1 Small widebody 230 21Airplane fl eet 3.6 Single aisle 740 68
Regional jet 60 6
Total 1,080
Marketsize
2013 fl eet
2033 fl eet
Deliveries 1,080 Large widebody 10 -Market value $140B Medium widebody 60 70Average value $130M Small widebody 80 260
Single aisle 430 1,000Regional jet 120 90Total 700 1,420
Growth measures (%)
Newairplanes
Share by size (%)
AfricaMarket value: $140 billion
2014 to 2033New airplanes
1,080
2013Airplanes
700
Delivery unitsShare of fleet
2033Airplanes1,420
• Regional jets • Single aisle • Small widebody • Medium widebody • Large widebody
0% 6%5%
21%
68%0%
25%
50%
75%
100%
AfricaEconomic growth prospects rival Asia’s
• 2011–15 • 2016–20 • 2021–25 • 2026–30
Source:IHS
Ecomomics
World-real GDP growthFive-year averages
NorthAmerica
Asia-Pacific
LatinAmerica
Middle East/North Africa
Sub-SaharnAfrica
Europe
0 1 2 3 4 5 6

33Copyright © 2014 Boeing. All rights reserved.
Pilot and Technician OutlookThe 2014 Boeing Pilot and Technician Outlook projects that 533,000 new commercial airline pilots and 584,000 new maintenance technicians will be needed to fly and maintain the world fleet over the next 20 years.
Meeting this exponential increase in demand will require innovative solutions—focused on new, digital technology—to match the learning requirements of a new generation. The growing diversity of aviation personnel will also require instructors to have cross-cultural and cross-generational skills in order to engage tomorrow’s workforce. Training providers will be more focused on enabling airplane operators to gain optimal advantage of the advanced features of the latest generation of airplanes, such as the 787 Dreamliner and 737 MAX.
Asia Pacific demand for pilots remains greatestAlthough Asia Pacific remains the region with the highest overall demand, the anticipated number of pilots and technicians required in the Middle East has increased significantly, reflecting expected fleet expansion plans by the region’s airlines.
Airlines across the globe are expanding their fleets and flight schedules to meet surging aviation demand in emerging markets. The industry continues to consider how to address challenges and fill the future pilot pipeline.
Emerging markets that have relied heavily on recruitment of pilots from outside their home markets will increasingly need a strong local foundation for developing and training qualified pilots.
Over the next 20 years, the Asia Pacific region, with a requirement for 216,000 new pilots, will see the largest growth in pilot demand. Europe will require 94,000; North America, 88,000; the Middle East, 55,000; Latin America, 45,000; the Commonwealth of Independent States (CIS), 18,000; and Africa, 17,000.
The need for technicians will remain strongAs new-generation airplanes come to dominate the world fleet over the next 20 years, airplane reliability will improve, and maintenance check intervals will lengthen. Although this trend will moderate growth in the demand for technicians, the global requirement remains significant.
The combination of global fleet growth and an increasing trend to outsource maintenance, repair, and overhaul activities to third-party providers in emerging markets will drive the need for the number of qualified technicians to increase and the number of geographical sources of trained technicians to expand.
The need for maintenance personnel is greatest in the Asia Pacific region, which will require 224,000 new technical personnel. Airlines in Europe will require 102,000; North America, 109,000; the Middle East, 62,000; Latin America, 44,000; the CIS, 24,000; and Africa, 19,000.
Pilot and technician outlook
Pilot and technician outlookNew technicians by region 2014–2033
584,000Technicians2014 to 2033
4% 3%
11%
8%
19%
17%
38%
Region Technicians
• Asia Pacific 224,000
• Europe 102,000
• North America 109,000
• Middle East 62,000
• Latin America 44,000
• CIS 24,000
• Africa 19,000
Total 584,000
Pilot and technician outlookNew pilots by region 2014–2033
533,000Pilots
2014 to 2033
3% 3%
10%
8%
17%
18%
41%
Region Pilots
• Asia Pacific 216,000
• Europe 94,000
• North America 88,000
• Middle East 55,000
• Latin America 45,000
• CIS 18,000
• Africa 17,000
Total 533,000
Pilot and technician outlook20-year demand for aviation personnel
Demand
drives need
for a diverse
and growing
workforce

34 Current Market Outlook 2014–2033
Passenger traffic
Airline passenger traffi cGrowth by regional fl ow
Regions
RPKs in billions 2006 2007 2008 2009 2010 2011 2012 2013 2033Annual growth
2013 to 2033 (%)
Africa– Africa 35.6 37.3 41.6 43.9 48.7 51.1 54.5 53.7 197.6 6.7Africa–Europe 121.9 125.3 125.6 128.2 135.5 134.1 140.4 140.4 368.6 4.9
Africa–Middle East 20.9 23.1 24.9 32.9 36.4 39.4 48.6 50.8 206.0 7.3
Africa–North America 4.3 4.9 6.3 8.8 11.3 11.4 12.6 12.2 40.1 6.1
Africa–Southeast Asia 4.1 5.2 5.4 4.1 5.6 5.9 4.6 4.2 15.0 6.6
Central America–Central America 28.2 29.7 32.3 29.8 31.3 32.2 33.8 36.5 88.5 4.5
Central America–Europe 74.1 80.7 83.3 77.1 73.8 73.7 78.3 82.1 198.9 4.5
Central America–North America 105.0 106.8 115.8 104.7 112.7 114.5 132.0 138.3 310.5 4.1
Central America–South America 10.3 11.0 13.1 14.0 18.3 19.2 23.2 28.5 88.8 5.8
China–China 189.8 223.1 236.5 287.4 335.4 380.1 411.3 460.8 1,669.7 6.6
China–Europe 75.3 91.0 82.5 77.3 82.1 94.2 96.7 96.9 317.4 6.1
China–North America 51.4 54.5 62.7 60.9 71.4 85.4 87.1 89.5 305.3 6.3
China–Northeast Asia 42.4 49.3 48.4 43.2 51.8 51.5 60.9 60.7 162.4 5.0
China–Oceania 19.3 19.4 21.4 22.8 27.4 31.4 34.1 35.0 125.3 6.6
China–Southeast Asia 44.6 49.3 50.6 45.3 54.7 63.0 73.8 82.5 352.0 7.5
CIS Region–CIS Region 77.3 80.8 88.9 76.9 87.6 103.1 107.1 118.3 273.7 4.3
CIS Region–International 63.6 81.6 77.7 83.6 101.6 124.1 139.4 157.9 388.5 4.6
Europe–Europe 593.3 634.2 660.5 624.9 640.2 659.5 676.6 714.0 1,411.4 3.5
Europe–Middle East 99.2 106.6 115.2 131.2 143.8 153.3 178.0 196.8 561.6 5.4
Europe–North America 403.4 420.6 432.4 405.4 418.6 430.2 432.9 441.8 817.9 3.1
Europe–Northeast Asia 60.6 67.9 69.0 59.4 64.3 63.8 75.9 74.3 132.9 2.9
Europe–South America 67.4 70.7 75.2 79.3 82.9 89.8 99.6 102.4 278.3 5.1
Europe–South Asia 53.3 58.5 55.5 51.3 53.8 54.1 53.9 56.4 212.3 6.8
Europe–Southeast Asia 95.9 96.8 101.5 95.9 97.1 100.4 106.6 105.3 266.7 4.8
Middle East–Middle East 53.7 60.3 63.4 68.6 77.9 82.4 76.5 86.3 239.9 5.2
Middle East–North America 20.6 23.4 29.5 41.6 45.7 50.3 57.1 63.2 214.6 6.3
Middle East–South Asia 42.0 46.5 49.5 64.8 75.1 83.0 87.3 95.1 445.1 8.0
Middle East–Southeast Asia 33.4 41.1 45.4 46.7 56.3 61.3 66.4 79.0 259.2 6.1
North America–North America 977.4 1,022.4 974.1 915.1 946.3 976.3 984.7 998.4 1,565.8 2.3
North America–Northeast Asia 140.7 143.7 139.4 120.2 128.4 135.4 149.0 150.4 211.4 1.7
North America–Oceania 30.6 32.1 32.3 34.8 34.9 38.3 40.3 43.1 90.5 3.8
North America–South America 50.7 52.1 52.7 56.9 60.9 66.7 72.0 79.2 238.6 5.7
North America–Southeast Asia 9.4 11.3 9.3 10.3 10.3 11.3 10.7 9.8 34.0 6.4
Northeast Asia–Northeast Asia 87.4 88.8 84.9 81.9 84.6 81.9 92.6 103.9 152.9 1.9
Northeast Asia–Oceania 21.5 21.0 20.8 15.1 18.1 16.6 17.1 15.9 34.0 3.9
Northeast Asia–Southeast Asia 80.1 86.3 87.7 74.3 79.6 92.3 104.9 113.3 256.8 4.2
Oceania–Oceania 70.8 74.4 72.0 73.3 78.4 83.8 92.0 99.0 247.0 4.7
Oceania–Southeast Asia 51.9 52.4 57.4 54.7 61.1 66.9 71.5 77.8 210.3 5.1
South America–South America 74.2 83.1 81.6 86.9 115.8 134.4 141.9 147.4 633.4 7.6
South Asia–South Asia 31.3 36.3 40.1 43.8 49.5 58.6 63.8 68.1 421.3 9.5
Southeast Asia–South Asia 19.4 20.6 24.3 21.9 28.5 29.2 34.0 36.2 185.8 8.5
Southeast Asia–Southeast Asia 78.8 93.4 93.2 96.0 113.1 130.7 145.1 166.6 734.7 7.7
Rest of World 38.6 44.3 55.5 69.3 87.9 97.4 116.0 126.1 572.9 7.9
Grand Total 4,253.6 4,561.9 4,639.2 4,564.2 4,938.7 5,262.2 5,585.0 5,898.0 15,537.6 5.0
*Taiwan has been moved from Southeast Asia to Northeast Asia

35Copyright © 2014 Boeing. All rights reserved.
Airplanes required
Passenger and freighter airplanesMarket value and demand by region
Passenger and freighter airplanesIn service and future fl eet
Demand and value by region
Region $B Airplanes
Asia Pacifi c $2,020 13,460 Europe $1,040 7,450
North America $870 7,550
Latin America $340 2,950
Middle East $640 2,950
CIS $150 1,330
Africa $140 1,080
World $5,200 36,770
Deliveries by airplane size and region
RegionRegional
jetsSingle
aisleSmall
widebodyMedium
widebodyLarge
widebodyTotal
deliveriesAsia Pacifi c 350 9,540 1,940 1,420 210 13,460 Europe 120 5,870 810 590 60 7,450
North America
1,570 4,820 630 510 20 7,550
Latin America
190 2,360 360 40 - 2,950
Middle East 40 1,360 460 790 300 2,950
C.I.S. 160 990 90 60 30 1,330
Africa 60 740 230 50 - 1,080
World 2,490 25,680 4,520 3,460 620 36,770
Market value by airplane size and region*
RegionRegional
jetsSingle
aisleSmall
widebodyMedium
widebodyLarge
widebodyTotal
deliveries
Asia Pacifi c $10 $960 $490 $480 $80 $2,020
Europe $10 $600 $220 $190 $20 $1,040
North America
$60 $490 $140 $170 $10 $870
Latin America
$10 $230 $90 $10 - $340
Middle East <$5 $130 $120 $270 $120 $640
CIS $10 $80 $30 $20 $10 $150
Africa <$5 $70 $50 $20 - $140
World $100 $2,560 $1,140 $1,160 $240 $5,200
*2013 $B catalog prices. Values above 10 have been rounded to nearest 10.
Total airplanes in service
Size 2013 2033
Regional jet 2,620 2,640 Single aisle 13,580 29,500 Small widebody 2,390 5,570 Medium widebody 1,580 3,680 Large widebody 740 790
Total 20,910 42,180
Passenger airplanes in service
Size 2013 2033
Regional jet 2,570 2,600 Single aisle 13,040 28,440 Small widebody 1,810 4,760 Medium widebody 1,340 3,120 Large widebody 460 530
Total 19,220 39,450
Freighter airplanes in service
Size 2013 2033
Widebody 1,100 1,630 Standard 590 1,100
Total 1,690 2,730
Airplane demand
Size $B AirplanesRegional jet $100 2,490 Single aisle $2,560 25,680 Small widebody $1,140 4,520 Medium widebody $1,160 3,460 Large widebody $240 620
Grand total $5,200 36,770
Passenger airplane demand
Size $B AirplanesRegional jet $100 2,490 Single aisle $2,560 25,680 Small widebody $1,090 4,270 Medium widebody $1,010 2,990 Large widebody $200 500
Grand total $4,960 35,930
Freighter airplane demand
Size $B Airplanes
Large* $190 590Medium widebody $50 250Standard - 0
Grand total $240 840
*Large passenger and large freighter categories differ

36 Current Market Outlook 2014–2033
Passenger and freighter airplanesMarket value and fl eet development
Market by airplane size
Size Market value
2013 ($B) Market share
value (%) New airplane
deliveries Market share
units (%)
Large* $240 5 620 5
Medium $1,160 22 3,460 22
Small $1,140 22 4,520 22
Total twin aisle $2,540 49 8,600 49
More than 175 seats $730 14 6,380 14
90 to 175 seats $1,830 35 19,300 35
Total single aisle $2,560 49 25,680 49
Total regional jets $100 2 2,490 2
Total fl eet $5,200 100 36,770 100
Passenger fl eet development
Size End of year
2013 Removed from
service Converted to
freighter New deliveries
2014 to 2033 End of year
2033
Large* 460 430 500 530
Medium 1,340 1,210 2,990 3,120
Small 1,810 1,320 4,270 4,760
Total Wide-body 3,610 2,960 7,760 8,410
More than 175 seats 1,720 1,270 6,380 6,830
90 to 175 seats 11,320 9,010 19,300 21,610
Total single aisle 13,040 10,280 25,680 28,440
Total regional jets 2,570 2,460 2,490 2,600
Total fl eet 19,220 15,700 1,330 35,930 39,450
Freighter fl eet development
Size End of year 2013
Removed from service
Converted tofreighter
New deliveries 2014 to 2033
End of year 2033
Widebody 1,100 680 840 1,630
Standard body 590 450 - 1,100
Total freighter fl eet 1,690 1,130 1,330 840 2,730
Total fl eet
Size End of year 2013
Removed from service
Converted to freighter
New deliveries 2014 to 2033
End of year 2033
Passenger fl eet 19,220 15,700 1,330 35,930 39,450
Freighter fl eet 1,690 1,130 1,330 840 2,730
Total fl eet 20,910 16,830 1,330 36,770 42,180
*Large passenger and Larger Freighter categories differ
Fleet development
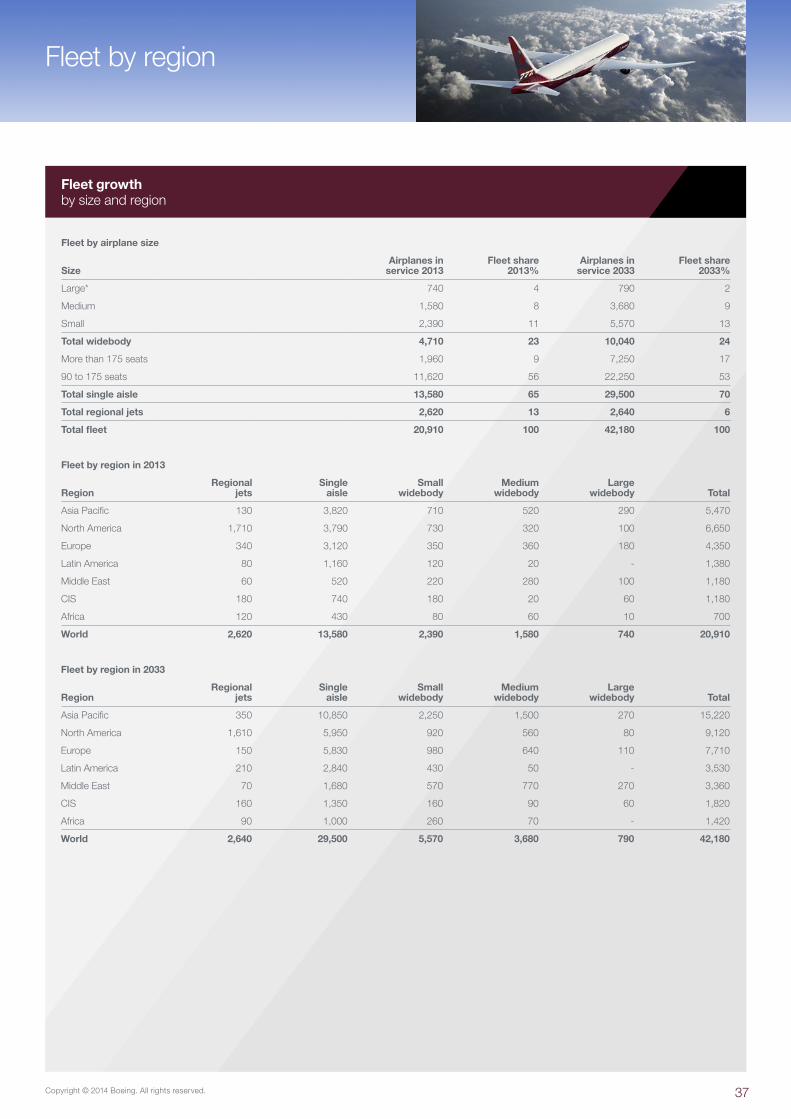
37Copyright © 2014 Boeing. All rights reserved.
Fleet by region
Fleet by airplane size
SizeAirplanes in
service 2013Fleet share
2013%Airplanes in
service 2033Fleet share
2033%
Large* 740 4 790 2
Medium 1,580 8 3,680 9
Small 2,390 11 5,570 13
Total widebody 4,710 23 10,040 24
More than 175 seats 1,960 9 7,250 17
90 to 175 seats 11,620 56 22,250 53
Total single aisle 13,580 65 29,500 70
Total regional jets 2,620 13 2,640 6
Total fl eet 20,910 100 42,180 100
Fleet by region in 2013
RegionRegional
jetsSingle
aisleSmall
widebodyMedium
widebodyLarge
widebody Total
Asia Pacifi c 130 3,820 710 520 290 5,470
North America 1,710 3,790 730 320 100 6,650
Europe 340 3,120 350 360 180 4,350
Latin America 80 1,160 120 20 - 1,380
Middle East 60 520 220 280 100 1,180
CIS 180 740 180 20 60 1,180
Africa 120 430 80 60 10 700
World 2,620 13,580 2,390 1,580 740 20,910
Fleet by region in 2033
RegionRegional
jetsSingle
aisleSmall
widebodyMedium
widebodyLarge
widebody Total
Asia Pacifi c 350 10,850 2,250 1,500 270 15,220
North America 1,610 5,950 920 560 80 9,120
Europe 150 5,830 980 640 110 7,710
Latin America 210 2,840 430 50 - 3,530
Middle East 70 1,680 570 770 270 3,360
CIS 160 1,350 160 90 60 1,820
Africa 90 1,000 260 70 - 1,420
World 2,640 29,500 5,570 3,680 790 42,180
Fleet growthby size and region

38 Current Market Outlook 2014–2033
Major traffic flows
Airline traffi c fl owsby region
Airline passenger growth rates 2013–2033
RPKs in percentages AfricaLatin
AmericaMiddle
East EuropeNorth
AmericaAsia
Pacifi c
Asia Pacifi c 7.1 8.8 7.4 5.3 4.3 6.4
North America 6.1 4.7 6.3 3.1 2.3
Europe 4.9 4.9 5.4 3.5
Middle East 7.3 - 5.2
Latin America 8.0 6.9
Africa 6.7
Airline passenger traffi c in 2013
RPKs in billions AfricaLatin
AmericaMiddle
East EuropeNorth
AmericaAsia
Pacifi c
Asia Pacifi c 19.8 2.3 244.9 332.9 303.3 1,334.2
North America 12.2 217.5 63.2 441.8 998.4
Europe 140.4 184.4 196.8 714.0
Middle East 50.8 - 86.3
Latin America 3.0 212.5
Africa 53.7
Airline passenger traffi c in 2033
RPKs in billions AfricaLatin
AmericaMiddle
East EuropeNorth
AmericaAsia
Pacifi c
Asia Pacifi c 78.5 12.2 1,021.0 929.3 700.3 4,616.6
North America 40.1 549.0 214.6 817.9 1,565.8
Europe 368.6 477.2 561.6 1411.4
Middle East 206.0 - 239.9
Latin America 14.0 810.7
Africa 197.6
Bold: Share within region.
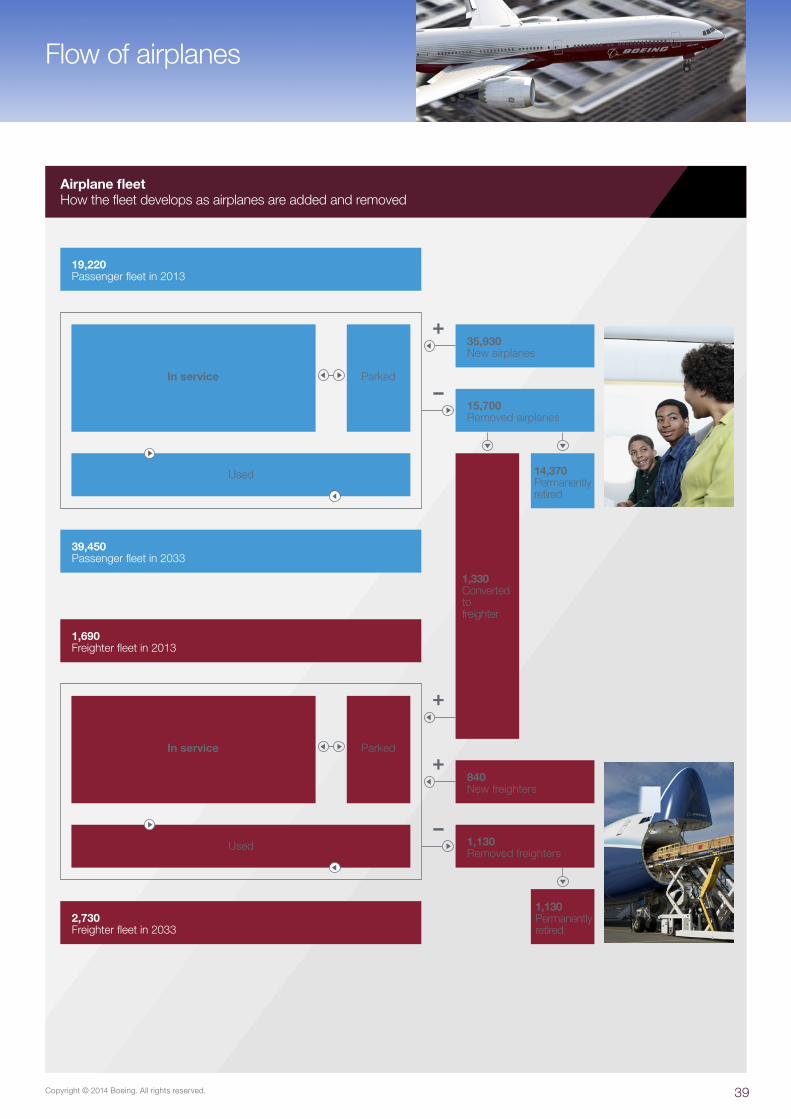
39Copyright © 2014 Boeing. All rights reserved.
Airplane fleetHow the fleet develops as airplanes are added and removed
In service
840New freighters
1,130Removed freighters
1,690Freighter fleet in 2013
19,220Passenger fleet in 2013
2,730Freighter fleet in 2033
39,450Passenger fleet in 2033
Used
–
–
In service
Parked
Parked
15,700Removed airplanes
Used
+35,930New airplanes
+
+
1,330Convertedtofreighter
14,370Permanentlyretired
1,130Permanentlyretired
Flow of airplanes

40 Current Market Outlook 2014–2033
Traffic by region
Airline traffi c fl owsby region
Airline passenger growth rates 2013–2033
RPKs in percentages AfricaLatin
AmericaMiddle
East EuropeNorth
AmericaAsia
Pacifi c
Asia Pacifi c 7.1 8.8 7.4 5.3 4.3 6.4
North America 6.1 4.7 6.3 3.1 2.3
Europe 4.9 4.9 5.4 3.5
Middle East 7.3 - 5.2
Latin America 8.0 6.9
Africa 6.7
Airline passenger traffi c in 2013
RPKs in billions AfricaLatin
AmericaMiddle
East EuropeNorth
AmericaAsia
Pacifi c
Asia Pacifi c 19.8 2.3 244.9 332.9 303.3 1,334.2
North America 12.2 217.5 63.2 441.8 998.4
Europe 140.4 184.4 196.8 714.0
Middle East 50.8 - 86.3
Latin America 3.0 212.5
Africa 53.7
Airline passenger traffi c in 2033
RPKs in billions AfricaLatin
AmericaMiddle
East EuropeNorth
AmericaAsia
Pacifi c
Asia Pacifi c 78.5 12.2 1,021.0 929.3 700.3 4,616.6
North America 40.1 549.0 214.6 817.9 1,565.8
Europe 368.6 477.2 561.6 1411.4
Middle East 206.0 - 239.9
Latin America 14.0 810.7
Africa 197.6
Bold: Share within region.

41Copyright © 2014 Boeing. All rights reserved.
Airplane categories
Passenger and freighterAirplane market sector definitions
90 to 175 seats
Boeing 717, 727Boeing 737-100 through -500Boeing 737-600, -700, -800Boeing 737 MAX 7, MAX 8Airbus A318, A319, A320Airbus A319neo, A320neoBoeing-MDC DC-9, MD-80, -90AVIC ARJ-900BAe 146-300, Avro RJ100Bombardier CRJ-1000Bombardier CS100, CS300Embraer 190, 195COMAC C919Fokker 100UAC MS 21-200 -300Ilyushin IL-62Tupolev TU-154Yakovlev Yak-42
Medium widebody40 to 80 tonnes
Boeing 767Lockheed L-1011SFBoeing-MDC DC-10Boeing 787Airbus A300Ilyushin IL-76TD
MediumTwo class: 340 to 450 seatsThree class: 300 to 400 seats
Boeing 777, 777XBoeing-MDC MD-11Airbus A340Airbus A350-1000Ilyushin IL-86Boeing 787-10
Single-aisle passenger airplanes
Regional jets
Antonov An-148AVIC ARJ-700Avro RJ70, RJ85BAe 146-100, -200Bombardier CRJDornier 328JETEmbraer 170, 175Embraer ERJ-135, -140, -145Fokker 70, F28Mitsubishi MRJSukhoi Superjet 100Yakovlev Yak-40
Freighter airplanes
Standard bodyLess than 45 tonnes
BAe 146Boeing-MDC DC-8, -9Boeing 737Boeing 727Tupolev TU-204Boeing 707Boeing-MDC MD-80Boeing 757-200Airbus A320, A321
Widebody passenger airplanes
SmallTwo class: 230 to 340 seatsThree class: 200 to 300 seats
Boeing 767, 787Boeing-MDC DC-10Airbus A300, A310Airbus A330-200, -300Airbus A350-800, -900Lockheed L-1011Ilyushin IL-96
More than 175 seats
Boeing 707, 757Boeing 737-900ERBoeing 737 MAX 9Airbus A321Airbus A321neoTupolev TU-204, TU-214
Large*More than 80 tonnes
Boeing-MDC MD-11Boeing 747-100 through -400Boeing 777Airbus A350Ilyushin IL-96TAntonov An-124747-8F
Large*Three class: more than 400 seats
Boeing 747-8Boeing 747-100 through -400Airbus A380
Bold: Airplanes in production or launched. Production and conversion (SF) models assumed for each type unless otherwise specified. *Large passenger and large freighter categories differ.

42 Current Market Outlook 2014–2033
Opinion and feedback
We value your opinionPlease provide your name, position, company, and address below, or attach your business card.
Send your comments to usOur contact details are below.
Your perspective• What will be the main factors to affect future air transport markets?
• What will be the likely impact of these factors?
Your feedback• What do you think of web-only access to forecast information (with a PDF for you to print locally)?
• If you have used the interactive forecast data- base on our website, tell us what you think of it.
• What areas would you like to see covered in more detail in the Current Market Outlook?
• What additional data would you like us to make available?
• What did you find most valuable?
• Was there anything you disliked?
Your commentsAny other questions or comments?
FeedbackWhat do you think?
Websitewww.boeing.com/cmo
Forecast databasewww.boeing.com/cmo/data
ContactDarren HulstDirectorProduct Forecasting
Fax1.206.766.1022
AddressBoeing Commercial AirplanesMarket AnalysisP.O. Box 3707, MC 21-28Seattle, WA 98124-2207

Boeing Commercial AirplanesMarket AnalysisP.O. Box 3707 MC 21-28Seattle, WA 98124-2207www.boeing.com/cmo
The statements contained herein are based on goodfaith assumptions and provided for general information purposes only. These statements do not constitute an offer, promise, warranty, or guarantee of performance.Actual results may vary depending on certain events or conditions. This document should not be used or relied upon for any purpose other than that intended by Boeing.
Printed in USA 261664 9/14Copyright © 2015 Boeing. All rights reserved.