Current perspective on clinical research opportunities … · clinical research opportunities and challenges in South Africa ... The ten leading underlying natural causes of death
45
1 Current perspective on clinical research opportunities and challenges in South Africa and neighbouring countries Victor Strugo 8 th International VPM Days Hannover, 18 September 2015
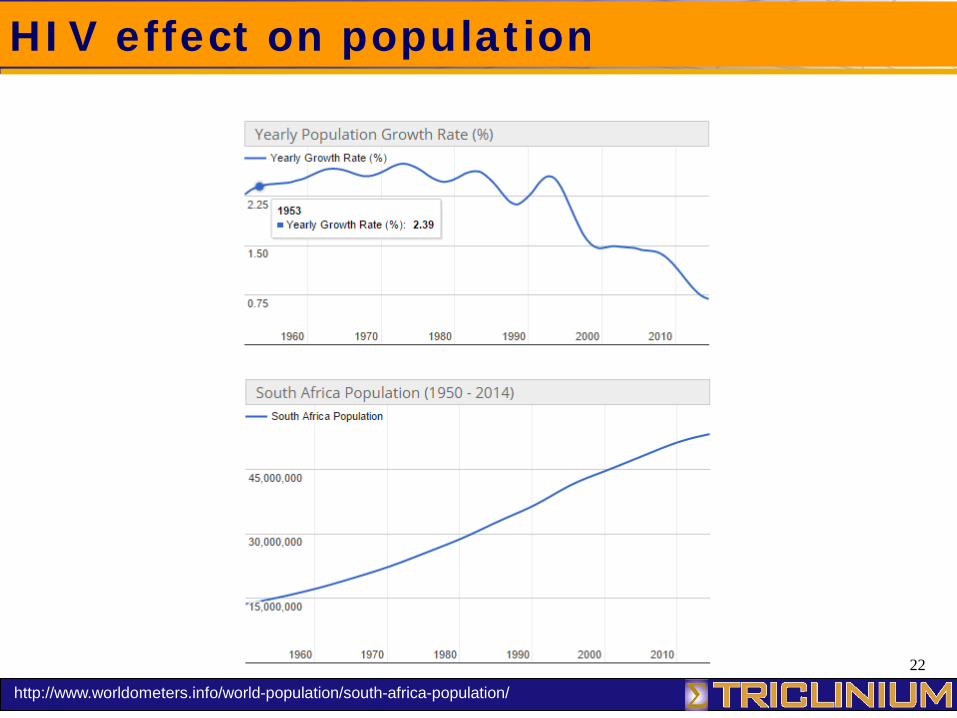
Current perspective on clinical research opportunities and challenges in South Africa
and neighbouring countries
Victor Strugo 8th International VPM Days Hannover 18 September 2015
2
Triclinium A South African CRO
bull Established February 2000 HQ Johannesburg bull Full service protocol co-development to CSR bull 15-year record gt 250 studies Phase I ndash IV bull N gt 48000 sites gt 700 most therapeutic areas 15 African countries bull gt 80 repeat business bull Predominance of TM (PDPs Biotechs AROs) bull Preferred Provider GHCC DAIDS (regulatory Africa) bull Site Audits in Africa Asia Europe bull 64 vaccine trials
TB HIV Measles Influenza Hepatitis Polio HPV RSV Polyvalent paeds
3
Collaboration with VPM SII
Phase Ib Open Label Randomized Controlled Dose-Escalation Study to Evaluate Safety and Immunogenicity of VPM1002 in Comparison with BCG in Healthy Volunteers in South Africa (Apr ndash Dec 2010) Phase II Open Label Randomized Controlled Study to Evaluate Safety and Immunogenicity of VPM1002 in Comparison with BCG in HIV-unexposed BCG naive newborn infants in South Africa (Nov 2011 ndash Nov 2012) Phase II double-blind randomized controlled study to evaluate the safety and immunogenicity of VPM1002 in comparison with BCG in HIV-exposed and HIV-unexposed BCG-naive newborn infants (Jun 2015 hellip Mar 2016)
Stats SA Rel P03093 Mortality and causes of death in South Africa 2009 Findings from death notification Nov-2011
Age group
TB 0-14 15-49 50-64 65+
Rank Rank Rank Rank
5 34 1 196 1 114 8 33
24
bull Well established research infrastructure bull Public and private sectors
28 teaching hospitals gt40000 tertiary care beds 140 private hospitals gt30000 beds 15 - 18 medical insurance
bull Large broad-based investigator database amp site networks bull Specialised Early Phase presence since 1970s bull GCPGLP and CLIA 88 compliant labs bull Specialist labs (biomarkers TB immunology
PKbioassay) bull Full support services (GMP-depots translations etc) bull Stringent ICH-compliant RAEC review policies
GCP is a legal requirement Informed Consent entrenched in Constitution
South Africa Advantages
25
bull Reliable (+) roads air links energy connectivity bull European Time bull Research language is English bull Inverse seasons bull Cost Currency bull Mobile-phone enabled obsessed population
South Africa Advantages
26
South Africa Track Record
bull Phase I-III data from SA included in hundreds of US amp European registration dossiers
bull Two entire NDA dossiers ndash rifapentine 1998 ndash tryptorelin (GnRH agonist) 2001) comprised SA data
bull 37 FDA inspections 1994-2009 1 OAI (27)
27
Therapeutic Indications
28
0
1
2
3
4
5
6
7
8
9
10
Belg
ium
Au
stria
Li
thua
nia
Can
ada
Luxe
mbo
urg
Mal
ta
Nor
way
Po
rtuga
l R
oman
ia
Rus
sia
Serb
ia
Swed
en
The
Net
herla
nds
USA
loca
l site
s U
SA c
entra
l site
C
zech
Rep
ublic
D
enm
ark
Esto
nia
Finl
and
Hun
gary
Ic
elan
d Ire
land
La
tvia
G
erm
any
Switz
erla
nd
Liec
hten
stei
n U
nite
d Ki
ngdo
m
Fran
ce
Italy
Au
stra
lia
Hon
g-Ko
ng
New
Zea
land
Si
ngap
ore
Taiw
an
Uga
nda
Pola
nd
Ukr
aine
C
hile
G
uate
mal
a Ja
pan
Isra
el
Slov
akia
Bu
lgar
ia
Gre
ece
Mal
aysi
a Ph
ilipp
ines
Pe
ru
Thai
land
Tu
rkey
Sl
oven
ia
Cos
ta R
ica
Mex
ico
Spai
n So
uth
Afric
a Ar
gent
ina
Sout
h Ko
rea
Col
ombi
a Pa
nam
a C
roat
ia
Indi
a Ve
nezu
ela
Braz
il C
hina
Mon
ths
Sout
h Afri
ca
Global Regulatory Review Timelines
Triclinium experience 2009-2015
Triclinium experience 2009 - 2015
29
Protocol release Country selection
Site Selection Collection of reg docs
Submission of RA application
EC application
Negotiate Site Contracts
EC Approvals
RA Approval amp Import permit
Site Initiation Import amp distribute drug
Import ancillary supplies Set up local labs
Set up EDC
Months
0
1
2
3
All EC approvals typically within 6
weeks
Site contracts signed within days
As soon as MCC approval obtained ALL sites can be initiated
Start-Up Activities in PARALLEL
GMO application (biologics)
30
0
2000
4000
6000
8000
10000
12000
14000C
hina
Ger
man
y
Per
u
Sou
th A
frica
Can
ada
Gre
ece
Fran
ce
Italy
Pol
and
Bul
garia
Cze
ch R
ep
Bra
zil
Spa
in
Kor
ea
Chi
le
Isra
el
Sin
gapo
re
Taiw
an
Bel
gium U
K
New
hellip
Aus
tralia
Source Bayer Presented SACRA Conference 2009
Aver
age
cost
per
pat
ient
(Eur
o)
Average Cost per Enrolled Participant
gt40000
Chart1
Average Cost Per Patient (Euro)
4978
7000
7000
7250
832545
9000
9000
10000
10000
10000
10000
10000
10500
10827
10840
11140
11565
1179649
12200
13000
145244
40200
Sheet1
Sheet2
Sheet2
Average Cost Per Patient (Euro)
Average Cost Per Patient
Sheet4
Ethics Subm
Regulatory Fees
Sheet3
Ethics + Regulatory
Total Ethics and Regulatory Fees
Add Inv Fees
Additional Investigator Application Fees
Total Regulatory Fees
Study starts
SubjectsStudy
31
Euro
0
10000
20000
30000
40000
50000
60000
70000
80000
90000S
outh
Afri
caC
anad
a
Italy
Ger
man
yP
eru
Pol
and
Spa
in UK
Bul
garia
Taiw
anC
zech
Rep
Gre
ece
Chi
leB
elgi
umK
orea
Sin
gapo
reFr
ance
Chi
naN
ew Z
eala
ndIs
rael
Bra
zil
Aus
tralia
Source Bayer Presented SACRA Conference 2009
Eur
os
Regulatory Application Fees
Chart1
Total Regulatory Fees
1113
181818
2200
3000
4500
4900
5450
5556
6000
656267
7500
7500
8300
8324
15438
19725
20000
403364
45096
53460
6136558
83000
Sheet1
Sheet2
Sheet2
Average Cost Per Patient (Euro)
Average Cost Per Patient
Sheet4
Ethics Subm
Regulatory Fees
Sheet3
Ethics + Regulatory
Total Ethics and Regulatory Fees
Add Inv Fees
Additional Investigator Application Fees
Total Regulatory Fees
Study starts
SubjectsStudy
32
SA Clinical Trial Regulatory Processes
Governed by SA-GCP and Declaration of Helsinki SA National Clinical Trials Register (SANCTR) Medicines Control Council (National Regulatory Authority)
o New protocols o Amendments o Additional sitesinvestigators
Ethics Committees (33 NHREC-registered) RegionalMunicipal DoH Export permits for bio samples (Nat Health Act 2003)
Clinical Trial Density Active sites million population
Nature Reviews Drug Discovery 7 13-14 (January 2008)
France 503
Germany 512 Canada
922
USA 1203
Czech Republic 776
553 sites
South Africa 119
757 sites
757 sites
533 sites
1084 sites
Argentina 269
Russia 77
China 04
India 07
34
Gateway to Africa
35
Why Africa bull Large accessible population relatively new to clinical trials
bull Experienced and willing investigators
bull Many clinical trial sites established by PDPs NGOs etc
bull Expanding therapeutic areas shifting burden of disease from
infectious to non-communicable diseases
bull Significantly improved infrastructure and accessibility
bull Rapidly evolving regulatory and ethics procedures
bull Potential for capacity building and sustainable clinical trial potential
36
Relatively young GCP culture Resident mentorships to build capacity Locations ndash accessibility for site monitoring Variable infrastructure esp electricity connectivity and
transportation Resourcing of public healthcare systems
Sub-Saharan Africa challenges
37
bull Second-largest continent
bull Spans NS and EW hemispheres
bull Second most populous continent 2014 estimate 1069 billion
bull Home to more than a quarter of the 196 independent countries
bull All 54 African countries are UN members
bull 39 urban population
bull 12 metropolitan areas gt 4m
bull gt 3000 distinct ethnicities
bull gt 2000 languages spoken
AFRICA hellip the true size
wwwcitypopulationdeworldAgglomerations 2015
38
SSV to SIV
0
5
10
15
20
25
30
35
40
45
Africa North America
Asia Pacific
Western Europe
Eastern Europe
Latin America
Source Quintiles South Africa SACRA Conference 2008
Wee
ks (A
vera
ge)
Start-Up Timelines
39
Region Median
Patients Site
of Sites
0 pts 1 - 3 pts 4 - 9 pts 10+ pts
Latin America 40 21 26 30 23
North America 30 29 29 24 18
Eastern Europe 60 15 31 26 27
Western Europe 40 15 22 29 34
Asia Pacific 40 19 30 34 18
Africa 100 4 17 28 51
Enrollment performance by region for 2008
Site Performance
Source Quintiles South Africa Presented SACRA Conference 2009
40
0 1 2 3 4 5 6 7 8 9
10
Latin America
North America
Eastern Europe
Western Europe
Asia Pacific
Africa
Num
ber o
f par
ticip
ants
MEDIAN site enrollment by region for 2008
Source Quintiles South Africa Presented SACRA Conference 2009
Site Performance
41
Source Quintiles South Africa Presented SACRA Conference 2009
s
ites
0
5
10
15
20
25
30
35
40
45
50
LatinAmerica
NorthAmerica
EasternEurope
WesternEurope
Asia Pacific Africa
0 pts
1 - 3 pts
4 - 9 pts
10+ pts
Enrollment performance by region for 2008
Site Performance
Chart1
0 pts
1 - 3 pts
4 - 9 pts
10+ pts
021
026
03
023
029
029
024
018
015
031
026
027
015
022
029
034
019
03
034
018
004
017
028
051
HIV
HIV
Resiratory amp Cancer
Male prevalence
Female prevalence
CVS
Overall death rates
Overall death rates
COPD
Asthma
Tracheabronchial lung cancer
Oesophageal cancer
prostate cancer
Trial metrics
COPD
Asthma
Tracheabronchial lung cancer
Oesophageal cancer
Prostate cancer
Cervical cancer
Breast cancer
Stroke
ill-defined heart disease
Diabetes mellitus
Ischaemic heart disease
Hypertension
Nephritisnephrosis
Stroke
ill-defined heart disease
Diabetes mellitus
Ischaemic heart disease
Hypertension
Nephritisnephrosis
Males
Female
UN - Male
SA 1997
SA 2004
UN - Female
SA 1997
SA 2004
0 pts
1 - 3 pts
4 - 9 pts
10+ pts
42
Source wwwclinicaltrialsgov 22-Oct-2010
Clinical trials registered across Africa
43
0
500
1000
1500
2000
2500
South Africa Kenya Malawi Tanzania Uganda Zambia
Selected African countries
2005
2010
2015
Source ClinTrialsgov
Trend 2005 - 2015
Source wwwclinicaltrialsgov 28-Aug-2015
44
AFRICA FOUND IN TRANSLATION
bull Vast treatment-naiumlve population bull Cost advantages (still) bull Diverse ethnicity amp morbidity bull Inverse seasonality bull Site capacity-building widely implemented bull Robust regulatory review bull Variable but generally good regulatory timelines bull Established GCP culture ndash sites and home-bred CROs
45
THANK YOU
Foliennummer 1
Triclinium A South African CRO
Collaboration with VPM SII
Vaccine Trials in SA 2015
Foliennummer 5
Foliennummer 6
Foliennummer 7
Foliennummer 8
Foliennummer 9
Foliennummer 10
Foliennummer 11
Foliennummer 12
Foliennummer 13
Foliennummer 14
Foliennummer 15
Foliennummer 16
Foliennummer 17
Distribution of clinical trial sites
Foliennummer 19
South Africa Leading Causes of Death
Foliennummer 21
Foliennummer 22
South Africa TB deaths by age group
Foliennummer 24
Foliennummer 25
Foliennummer 26
Foliennummer 27
Foliennummer 28
Foliennummer 29
Foliennummer 30
Foliennummer 31
SA Clinical Trial Regulatory Processes
Clinical Trial Density Active sites million population
Foliennummer 34
Why Africa
Foliennummer 36
AFRICA hellip the true size
SSV to SIV
Foliennummer 39
Foliennummer 40
Foliennummer 41
Foliennummer 42
Foliennummer 43
AFRICA FOUND IN TRANSLATION
Foliennummer 45
Region
Median
of Sites
Patients Site
0 pts
1 - 3 pts
4 - 9 pts
10+ pts
Latin America
4
21
26
30
23
North America
3
29
29
24
18
Eastern Europe
6
15
31
26
27
Western Europe
4
15
22
29
34
Asia Pacific
4
19
30
34
18
Africa
10
4
17
28
51
0 pts
1 - 3 pts
4 - 9 pts
10+ pts
Latin America
21
26
30
23
North America
29
29
24
18
Eastern Europe
15
31
26
27
Western Europe
15
22
29
34
Asia Pacific
19
30
34
18
Africa
4
17
28
51
Males
Female
15-19
210
150
20-24
340
205
25-29
395
300
30-34
460
360
35-39
600
405
40-44
800
500
45-49
1100
700
50-54
1600
1050
55-54
2300
1580
60-64
3340
2250
UN - Male
SA 1997
SA 2004
UN - Female
SA 1997
SA 2004
15-19
210
235
216
150
165
187
20-24
340
381
555
205
331
1085
25-29
395
625
1081
300
452
1985
30-34
460
817
2118
360
489
2267
35-39
600
916
2498
405
526
1890
40-44
800
1136
2765
500
615
1548
45-49
1100
1486
2744
700
800
1400
50-54
1600
2016
2979
1050
1116
1506
55-54
2300
2838
3270
1580
1626
1717
60-64
3340
3614
4146
2250
2201
2360
Stroke
ill-defined heart disease
Diabetes mellitus
Ischaemic heart disease
Hypertension
Nephritisnephrosis
Stroke
ill-defined heart disease
Diabetes mellitus
Ischaemic heart disease
Hypertension
Nephritisnephrosis
1999
34
345
20
248
14
10
1999
295
246
23
10
145
68
2000
36
362
218
249
152
112
2000
318
268
241
108
16
8
2001
35
372
22
25
15
125
2001
322
28
252
102
162
95
2002
405
298
24
26
147
126
2002
352
295
27
115
16
10
2003
425
32
245
285
152
15
2003
382
299
285
122
17
12
2004
39
325
255
26
165
16
2004
35
30
295
121
19
119
2005
36
328
265
26
15
162
2005
325
30
32
12
18
12
2006
35
336
27
258
155
16
2006
33
32
32
11
18
125
COPD
Asthma
Tracheabronchial lung cancer
Oesophageal cancer
prostate cancer
Cervical cancer
Breast cancer
1999
2001
12
135
10
26
2000
204
116
13
92
28
2001
222
131
133
96
27
2002
23
144
128
95
285
2003
243
149
124
94
29
2004
229
154
1255
87
29
2005
224
152
122
82
295
2006
224
136
116
75
3
COPD
Asthma
Tracheabronchial lung cancer
Oesophageal cancer
Prostate cancer
Cervical cancer
Breast cancer
1999
88
92
43
41
106
82
2000
96
95
4
43
11
81
2001
10
109
4
4
111
89
2002
10
116
4
4
112
85
2003
11
124
4
395
116
85
2004
102
1295
44
39
115
101
2005
105
128
42
38
1185
10
2006
10
12
42
32
1205
10
Based on this survey the researchers estimate that 109 of all South Africans over 2 years old were living with HIV in 2008 In 2002 and 2005 this figure was 114 and 108 respectively showing a degree of stabilisation Among those between 15 and 49 years old the estimated HIV prevalence was 169 in 2008 The survey found the prevalence among children aged 2-14 to be 25 down significantly since 2002 when prevalence was 56
Estimated HIV prevalence () among South Africans aged 2 years and older by age 2002-2008
Age
HIV +
HIV -
Children (2-14 years)
25
975
Youth (15-24 years)
87
913
Adults (25 and older)
168
832
(15-49 years)
169
831
Total (2 and older)
109
891
Estimated HIV prevalence among South Africans by age and sex 2008
Age
Male prevalence
Female prevalence
2-14
3
2
15-19
25
67
20-24
51
211
25-29
157
327
30-34
258
291
35-39
185
248
40-44
192
163
45-49
64
141
50-54
104
102
55-59
62
77
60+
35
18
Total
79
136
Among females HIV prevalence is highest in those between 25 and 29 years old among males the peak is in the group aged 30-34 years
HIV prevalence () by province 2002-2008
Province
2002
2005
2008
KwaZulu-Natal
117
165
158
Mpumalanga
141
152
154
Free State
149
126
126
North West
103
109
113
Gauteng
147
108
103
Eastern Cape
66
89
9
Limpopo
98
8
88
Northern Cape
84
54
59
Western Cape
107
19
38
National
114
108
109
The results of this study suggest that KwaZulu-Natal Mpumulanga and Free State have the highest HIV prevalence However the relatively small sample sizes may limit precision and in several cases the ranges of uncertainty overlap
HIV prevalence by population group 2008
Population group
Prevalence ()
African
136
864
White
03
997
Coloured
17
983
Indian
03
997
Studies of AIDS deaths
Latin America
Latin America
Latin America
Latin America
North America
North America
North America
North America
Eastern Europe
Eastern Europe
Eastern Europe
Eastern Europe
Western Europe
Western Europe
Western Europe
Western Europe
Asia Pacific
Asia Pacific
Asia Pacific
Asia Pacific
Africa
Africa
Africa
Africa
Country
Study starts
Subjects randomised
SubjectsStudy
USA
32
4385
13703125
Russia
20
788
394
Germany
19
1883
991052631579
UK
13
265
203846153846
South Africa
12
347
289166666667
Argentina
12
329
274166666667
Australia
11
195
177272727273
India
7
275
392857142857
Brazil
3
115
383333333333
Country
Initiation
Site activation
Recruitment
LOC setup
Unproductive sites
(Approval ndash FCI)
(FCI ndash FSFV)
(FSFV ndash LSFV)
(CPC ndash FSFV)
South Africa
19
38
153
357
21
Australia
117
63
401
239
11
Germany
16
37
401
224
21
UK
9
101
301
346
20
Russia
11
52
174
334
9
India
31
28
389
431
3
Argentina
94
67
288
32
13
Brazil
79
59
94
656
20
USA
44
31
149
26
Country
Pts Rand
Sites
Av CPP
Cost Per Country
Ethics Subm
Regulatory Fees
Add Inv Fees
CT Scan Total
Ethics + Regulatory
Total Regulatory Fees
South Africa
25
5
7250
181250
290
460
363
0
750
1113
Canada
18
4
832545
14985818
181818
0
0
1557576
181818
1818
Italy
7
2
10000
70000
2200
0
0
0
2200
2200
Germany
55
10
7000
385000
3000
0
0
12000
3000
3000
Peru
40
5
7000
280000
1500
1000
2000
60000
2500
4500
Poland
15
4
10000
150000
0
2500
2400
0
2500
4900
Spain
40
7
10500
420000
0
0
5450
0
0
5450
UK
12
4
13000
156000
0
0
5556
0
0
5556
Bulgaria
18
4
10000
180000
0
5000
1000
0
5000
6000
Taiwan
20
4
1179649
2359298
104167
313
5208
0
135467
6563
Czech Rep
10
2
10000
100000
1500
3000
3000
0
4500
7500
Greece
40
7
9000
360000
0
7500
0
0
7500
7500
Chile
15
4
10840
162600
1700
3600
3000
0
5300
8300
Belgium
25
6
12200
305000
3992
4332
0
0
8324
8324
Korea
30
3
10827
324802
1114
0
14324
0
1114
15438
Singapore
10
2
11565
115650
1750
0
17975
0
1750
19725
France
50
10
9000
450000
0
0
20000
0
0
20000
China
39
5
4978
194142
5224
0
39814
0
5224
40336
New Zealand
10
3
145244
145244
1973
0
43123
0
1973
45096
Israel
10
6
11140
111400
2060
3000
48400
16500
5060
53460
Brazil
30
6
10000
300000
2000
287356
5649202
0
487356
61366
Australia
24
6
40200
964800
0
500
82500
0
500
83000
23
543
109
532856799
3304716
26939
27700043
73748966
[1753EURO x 14 (ex rate) = $2454] [ $245416 hours=$153hour]
1095625
1095625
12271
1753
198089
198089
208514736842
South Africa
Canada
Italy
Germany
Peru
Poland
Spain
UK
Bulgaria
Taiwan
Czech Rep
Greece
Chile
Belgium
Korea
Singapore
France
China
New Zealand
Israel
Brazil
Australia
Country
Study starts
Subjects randomised
SubjectsStudy
USA
32
4385
13703125
Russia
20
788
394
Germany
19
1883
991052631579
UK
13
265
203846153846
South Africa
12
347
289166666667
Argentina
12
329
274166666667
Australia
11
195
177272727273
India
7
275
392857142857
Brazil
3
115
383333333333
Country
Initiation
Site activation
Recruitment
LOC setup
Unproductive sites
(Approval ndash FCI)
(FCI ndash FSFV)
(FSFV ndash LSFV)
(CPC ndash FSFV)
South Africa
19
38
153
357
21
Australia
117
63
401
239
11
Germany
16
37
401
224
21
UK
9
101
301
346
20
Russia
11
52
174
334
9
India
31
28
389
431
3
Argentina
94
67
288
32
13
Brazil
79
59
94
656
20
USA
44
31
149
26
Country
Pts Rand
Sites
Av CPP
Cost Per Country
Ethics Subm
Regulatory Fees
Add Inv Fees
CT Scan Total
Ethics + Regulatory
Total Regulatory Fees
China
39
5
4978
194142
522
0
39814
0
522
40336
Germany
55
10
7000
385000
3000
0
0
12000
3000
3000
Peru
40
5
7000
280000
1500
1000
2000
60000
2500
4500
South Africa
25
5
7250
181250
290
460
363
0
750
1113
Canada
18
4
8325
149858
1818
0
0
1557576
1818
1818
Greece
40
7
9000
360000
0
7500
0
0
7500
7500
France
50
10
9000
450000
0
0
20000
0
0
20000
Italy
7
2
10000
70000
2200
0
0
0
2200
2200
Poland
15
4
10000
150000
0
2500
2400
0
2500
4900
Bulgaria
18
4
10000
180000
0
5000
1000
0
5000
6000
Czech Rep
10
2
10000
100000
1500
3000
3000
0
4500
7500
Brazil
30
6
10000
300000
2000
2874
56492
0
4874
61366
Spain
40
7
10500
420000
0
0
5450
0
0
5450
Korea
30
3
10827
324802
1114
0
14324
0
1114
15438
Chile
15
4
10840
162600
1700
3600
3000
0
5300
8300
Israel
10
6
11140
111400
2060
3000
48400
16500
5060
53460
Singapore
10
2
11565
115650
1750
0
17975
0
1750
19725
Taiwan
20
4
11796
235930
1042
313
5208
0
1355
6563
Belgium
25
6
12200
305000
3992
4332
0
0
8324
8324
UK
12
4
13000
156000
0
0
5556
0
0
5556
New Zealand
10
3
14524
145244
1973
0
43123
0
1973
45096
Australia
24
6
40200
964800
0
500
82500
0
500
83000
23
543
109
5328568
33047
26939
277000
73748966
[1753EURO x 14 (ex rate) = $2454] [ $245416 hours=$153hour]
110
1095625
1227
1753
19809
20
21
China
Germany
Peru
South Africa
Canada
Greece
France
Italy
Poland
Bulgaria
Czech Rep
Brazil
Spain
Korea
Chile
Israel
Singapore
Taiwan
Belgium
UK
New Zealand
Australia
Population Group
IndianAsianOther
26
Mixed ethnicity
90
Caucasian
91
African
793
10000
IndianAsianOther
Mixed ethnicity
Caucasian
African
2
Triclinium A South African CRO
bull Established February 2000 HQ Johannesburg bull Full service protocol co-development to CSR bull 15-year record gt 250 studies Phase I ndash IV bull N gt 48000 sites gt 700 most therapeutic areas 15 African countries bull gt 80 repeat business bull Predominance of TM (PDPs Biotechs AROs) bull Preferred Provider GHCC DAIDS (regulatory Africa) bull Site Audits in Africa Asia Europe bull 64 vaccine trials
TB HIV Measles Influenza Hepatitis Polio HPV RSV Polyvalent paeds
3
Collaboration with VPM SII
Phase Ib Open Label Randomized Controlled Dose-Escalation Study to Evaluate Safety and Immunogenicity of VPM1002 in Comparison with BCG in Healthy Volunteers in South Africa (Apr ndash Dec 2010) Phase II Open Label Randomized Controlled Study to Evaluate Safety and Immunogenicity of VPM1002 in Comparison with BCG in HIV-unexposed BCG naive newborn infants in South Africa (Nov 2011 ndash Nov 2012) Phase II double-blind randomized controlled study to evaluate the safety and immunogenicity of VPM1002 in comparison with BCG in HIV-exposed and HIV-unexposed BCG-naive newborn infants (Jun 2015 hellip Mar 2016)
Stats SA Rel P03093 Mortality and causes of death in South Africa 2009 Findings from death notification Nov-2011
Age group
TB 0-14 15-49 50-64 65+
Rank Rank Rank Rank
5 34 1 196 1 114 8 33
24
bull Well established research infrastructure bull Public and private sectors
28 teaching hospitals gt40000 tertiary care beds 140 private hospitals gt30000 beds 15 - 18 medical insurance
bull Large broad-based investigator database amp site networks bull Specialised Early Phase presence since 1970s bull GCPGLP and CLIA 88 compliant labs bull Specialist labs (biomarkers TB immunology
PKbioassay) bull Full support services (GMP-depots translations etc) bull Stringent ICH-compliant RAEC review policies
GCP is a legal requirement Informed Consent entrenched in Constitution
South Africa Advantages
25
bull Reliable (+) roads air links energy connectivity bull European Time bull Research language is English bull Inverse seasons bull Cost Currency bull Mobile-phone enabled obsessed population
South Africa Advantages
26
South Africa Track Record
bull Phase I-III data from SA included in hundreds of US amp European registration dossiers
bull Two entire NDA dossiers ndash rifapentine 1998 ndash tryptorelin (GnRH agonist) 2001) comprised SA data
bull 37 FDA inspections 1994-2009 1 OAI (27)
27
Therapeutic Indications
28
0
1
2
3
4
5
6
7
8
9
10
Belg
ium
Au
stria
Li
thua
nia
Can
ada
Luxe
mbo
urg
Mal
ta
Nor
way
Po
rtuga
l R
oman
ia
Rus
sia
Serb
ia
Swed
en
The
Net
herla
nds
USA
loca
l site
s U
SA c
entra
l site
C
zech
Rep
ublic
D
enm
ark
Esto
nia
Finl
and
Hun
gary
Ic
elan
d Ire
land
La
tvia
G
erm
any
Switz
erla
nd
Liec
hten
stei
n U
nite
d Ki
ngdo
m
Fran
ce
Italy
Au
stra
lia
Hon
g-Ko
ng
New
Zea
land
Si
ngap
ore
Taiw
an
Uga
nda
Pola
nd
Ukr
aine
C
hile
G
uate
mal
a Ja
pan
Isra
el
Slov
akia
Bu
lgar
ia
Gre
ece
Mal
aysi
a Ph
ilipp
ines
Pe
ru
Thai
land
Tu
rkey
Sl
oven
ia
Cos
ta R
ica
Mex
ico
Spai
n So
uth
Afric
a Ar
gent
ina
Sout
h Ko
rea
Col
ombi
a Pa
nam
a C
roat
ia
Indi
a Ve
nezu
ela
Braz
il C
hina
Mon
ths
Sout
h Afri
ca
Global Regulatory Review Timelines
Triclinium experience 2009-2015
Triclinium experience 2009 - 2015
29
Protocol release Country selection
Site Selection Collection of reg docs
Submission of RA application
EC application
Negotiate Site Contracts
EC Approvals
RA Approval amp Import permit
Site Initiation Import amp distribute drug
Import ancillary supplies Set up local labs
Set up EDC
Months
0
1
2
3
All EC approvals typically within 6
weeks
Site contracts signed within days
As soon as MCC approval obtained ALL sites can be initiated
Start-Up Activities in PARALLEL
GMO application (biologics)
30
0
2000
4000
6000
8000
10000
12000
14000C
hina
Ger
man
y
Per
u
Sou
th A
frica
Can
ada
Gre
ece
Fran
ce
Italy
Pol
and
Bul
garia
Cze
ch R
ep
Bra
zil
Spa
in
Kor
ea
Chi
le
Isra
el
Sin
gapo
re
Taiw
an
Bel
gium U
K
New
hellip
Aus
tralia
Source Bayer Presented SACRA Conference 2009
Aver
age
cost
per
pat
ient
(Eur
o)
Average Cost per Enrolled Participant
gt40000
Chart1
Average Cost Per Patient (Euro)
4978
7000
7000
7250
832545
9000
9000
10000
10000
10000
10000
10000
10500
10827
10840
11140
11565
1179649
12200
13000
145244
40200
Sheet1
Sheet2
Sheet2
Average Cost Per Patient (Euro)
Average Cost Per Patient
Sheet4
Ethics Subm
Regulatory Fees
Sheet3
Ethics + Regulatory
Total Ethics and Regulatory Fees
Add Inv Fees
Additional Investigator Application Fees
Total Regulatory Fees
Study starts
SubjectsStudy
31
Euro
0
10000
20000
30000
40000
50000
60000
70000
80000
90000S
outh
Afri
caC
anad
a
Italy
Ger
man
yP
eru
Pol
and
Spa
in UK
Bul
garia
Taiw
anC
zech
Rep
Gre
ece
Chi
leB
elgi
umK
orea
Sin
gapo
reFr
ance
Chi
naN
ew Z
eala
ndIs
rael
Bra
zil
Aus
tralia
Source Bayer Presented SACRA Conference 2009
Eur
os
Regulatory Application Fees
Chart1
Total Regulatory Fees
1113
181818
2200
3000
4500
4900
5450
5556
6000
656267
7500
7500
8300
8324
15438
19725
20000
403364
45096
53460
6136558
83000
Sheet1
Sheet2
Sheet2
Average Cost Per Patient (Euro)
Average Cost Per Patient
Sheet4
Ethics Subm
Regulatory Fees
Sheet3
Ethics + Regulatory
Total Ethics and Regulatory Fees
Add Inv Fees
Additional Investigator Application Fees
Total Regulatory Fees
Study starts
SubjectsStudy
32
SA Clinical Trial Regulatory Processes
Governed by SA-GCP and Declaration of Helsinki SA National Clinical Trials Register (SANCTR) Medicines Control Council (National Regulatory Authority)
o New protocols o Amendments o Additional sitesinvestigators
Ethics Committees (33 NHREC-registered) RegionalMunicipal DoH Export permits for bio samples (Nat Health Act 2003)
Clinical Trial Density Active sites million population
Nature Reviews Drug Discovery 7 13-14 (January 2008)
France 503
Germany 512 Canada
922
USA 1203
Czech Republic 776
553 sites
South Africa 119
757 sites
757 sites
533 sites
1084 sites
Argentina 269
Russia 77
China 04
India 07
34
Gateway to Africa
35
Why Africa bull Large accessible population relatively new to clinical trials
bull Experienced and willing investigators
bull Many clinical trial sites established by PDPs NGOs etc
bull Expanding therapeutic areas shifting burden of disease from
infectious to non-communicable diseases
bull Significantly improved infrastructure and accessibility
bull Rapidly evolving regulatory and ethics procedures
bull Potential for capacity building and sustainable clinical trial potential
36
Relatively young GCP culture Resident mentorships to build capacity Locations ndash accessibility for site monitoring Variable infrastructure esp electricity connectivity and
transportation Resourcing of public healthcare systems
Sub-Saharan Africa challenges
37
bull Second-largest continent
bull Spans NS and EW hemispheres
bull Second most populous continent 2014 estimate 1069 billion
bull Home to more than a quarter of the 196 independent countries
bull All 54 African countries are UN members
bull 39 urban population
bull 12 metropolitan areas gt 4m
bull gt 3000 distinct ethnicities
bull gt 2000 languages spoken
AFRICA hellip the true size
wwwcitypopulationdeworldAgglomerations 2015
38
SSV to SIV
0
5
10
15
20
25
30
35
40
45
Africa North America
Asia Pacific
Western Europe
Eastern Europe
Latin America
Source Quintiles South Africa SACRA Conference 2008
Wee
ks (A
vera
ge)
Start-Up Timelines
39
Region Median
Patients Site
of Sites
0 pts 1 - 3 pts 4 - 9 pts 10+ pts
Latin America 40 21 26 30 23
North America 30 29 29 24 18
Eastern Europe 60 15 31 26 27
Western Europe 40 15 22 29 34
Asia Pacific 40 19 30 34 18
Africa 100 4 17 28 51
Enrollment performance by region for 2008
Site Performance
Source Quintiles South Africa Presented SACRA Conference 2009
40
0 1 2 3 4 5 6 7 8 9
10
Latin America
North America
Eastern Europe
Western Europe
Asia Pacific
Africa
Num
ber o
f par
ticip
ants
MEDIAN site enrollment by region for 2008
Source Quintiles South Africa Presented SACRA Conference 2009
Site Performance
41
Source Quintiles South Africa Presented SACRA Conference 2009
s
ites
0
5
10
15
20
25
30
35
40
45
50
LatinAmerica
NorthAmerica
EasternEurope
WesternEurope
Asia Pacific Africa
0 pts
1 - 3 pts
4 - 9 pts
10+ pts
Enrollment performance by region for 2008
Site Performance
Chart1
0 pts
1 - 3 pts
4 - 9 pts
10+ pts
021
026
03
023
029
029
024
018
015
031
026
027
015
022
029
034
019
03
034
018
004
017
028
051
HIV
HIV
Resiratory amp Cancer
Male prevalence
Female prevalence
CVS
Overall death rates
Overall death rates
COPD
Asthma
Tracheabronchial lung cancer
Oesophageal cancer
prostate cancer
Trial metrics
COPD
Asthma
Tracheabronchial lung cancer
Oesophageal cancer
Prostate cancer
Cervical cancer
Breast cancer
Stroke
ill-defined heart disease
Diabetes mellitus
Ischaemic heart disease
Hypertension
Nephritisnephrosis
Stroke
ill-defined heart disease
Diabetes mellitus
Ischaemic heart disease
Hypertension
Nephritisnephrosis
Males
Female
UN - Male
SA 1997
SA 2004
UN - Female
SA 1997
SA 2004
0 pts
1 - 3 pts
4 - 9 pts
10+ pts
42
Source wwwclinicaltrialsgov 22-Oct-2010
Clinical trials registered across Africa
43
0
500
1000
1500
2000
2500
South Africa Kenya Malawi Tanzania Uganda Zambia
Selected African countries
2005
2010
2015
Source ClinTrialsgov
Trend 2005 - 2015
Source wwwclinicaltrialsgov 28-Aug-2015
44
AFRICA FOUND IN TRANSLATION
bull Vast treatment-naiumlve population bull Cost advantages (still) bull Diverse ethnicity amp morbidity bull Inverse seasonality bull Site capacity-building widely implemented bull Robust regulatory review bull Variable but generally good regulatory timelines bull Established GCP culture ndash sites and home-bred CROs
45
THANK YOU
Foliennummer 1
Triclinium A South African CRO
Collaboration with VPM SII
Vaccine Trials in SA 2015
Foliennummer 5
Foliennummer 6
Foliennummer 7
Foliennummer 8
Foliennummer 9
Foliennummer 10
Foliennummer 11
Foliennummer 12
Foliennummer 13
Foliennummer 14
Foliennummer 15
Foliennummer 16
Foliennummer 17
Distribution of clinical trial sites
Foliennummer 19
South Africa Leading Causes of Death
Foliennummer 21
Foliennummer 22
South Africa TB deaths by age group
Foliennummer 24
Foliennummer 25
Foliennummer 26
Foliennummer 27
Foliennummer 28
Foliennummer 29
Foliennummer 30
Foliennummer 31
SA Clinical Trial Regulatory Processes
Clinical Trial Density Active sites million population
Foliennummer 34
Why Africa
Foliennummer 36
AFRICA hellip the true size
SSV to SIV
Foliennummer 39
Foliennummer 40
Foliennummer 41
Foliennummer 42
Foliennummer 43
AFRICA FOUND IN TRANSLATION
Foliennummer 45
Region
Median
of Sites
Patients Site
0 pts
1 - 3 pts
4 - 9 pts
10+ pts
Latin America
4
21
26
30
23
North America
3
29
29
24
18
Eastern Europe
6
15
31
26
27
Western Europe
4
15
22
29
34
Asia Pacific
4
19
30
34
18
Africa
10
4
17
28
51
0 pts
1 - 3 pts
4 - 9 pts
10+ pts
Latin America
21
26
30
23
North America
29
29
24
18
Eastern Europe
15
31
26
27
Western Europe
15
22
29
34
Asia Pacific
19
30
34
18
Africa
4
17
28
51
Males
Female
15-19
210
150
20-24
340
205
25-29
395
300
30-34
460
360
35-39
600
405
40-44
800
500
45-49
1100
700
50-54
1600
1050
55-54
2300
1580
60-64
3340
2250
UN - Male
SA 1997
SA 2004
UN - Female
SA 1997
SA 2004
15-19
210
235
216
150
165
187
20-24
340
381
555
205
331
1085
25-29
395
625
1081
300
452
1985
30-34
460
817
2118
360
489
2267
35-39
600
916
2498
405
526
1890
40-44
800
1136
2765
500
615
1548
45-49
1100
1486
2744
700
800
1400
50-54
1600
2016
2979
1050
1116
1506
55-54
2300
2838
3270
1580
1626
1717
60-64
3340
3614
4146
2250
2201
2360
Stroke
ill-defined heart disease
Diabetes mellitus
Ischaemic heart disease
Hypertension
Nephritisnephrosis
Stroke
ill-defined heart disease
Diabetes mellitus
Ischaemic heart disease
Hypertension
Nephritisnephrosis
1999
34
345
20
248
14
10
1999
295
246
23
10
145
68
2000
36
362
218
249
152
112
2000
318
268
241
108
16
8
2001
35
372
22
25
15
125
2001
322
28
252
102
162
95
2002
405
298
24
26
147
126
2002
352
295
27
115
16
10
2003
425
32
245
285
152
15
2003
382
299
285
122
17
12
2004
39
325
255
26
165
16
2004
35
30
295
121
19
119
2005
36
328
265
26
15
162
2005
325
30
32
12
18
12
2006
35
336
27
258
155
16
2006
33
32
32
11
18
125
COPD
Asthma
Tracheabronchial lung cancer
Oesophageal cancer
prostate cancer
Cervical cancer
Breast cancer
1999
2001
12
135
10
26
2000
204
116
13
92
28
2001
222
131
133
96
27
2002
23
144
128
95
285
2003
243
149
124
94
29
2004
229
154
1255
87
29
2005
224
152
122
82
295
2006
224
136
116
75
3
COPD
Asthma
Tracheabronchial lung cancer
Oesophageal cancer
Prostate cancer
Cervical cancer
Breast cancer
1999
88
92
43
41
106
82
2000
96
95
4
43
11
81
2001
10
109
4
4
111
89
2002
10
116
4
4
112
85
2003
11
124
4
395
116
85
2004
102
1295
44
39
115
101
2005
105
128
42
38
1185
10
2006
10
12
42
32
1205
10
Based on this survey the researchers estimate that 109 of all South Africans over 2 years old were living with HIV in 2008 In 2002 and 2005 this figure was 114 and 108 respectively showing a degree of stabilisation Among those between 15 and 49 years old the estimated HIV prevalence was 169 in 2008 The survey found the prevalence among children aged 2-14 to be 25 down significantly since 2002 when prevalence was 56
Estimated HIV prevalence () among South Africans aged 2 years and older by age 2002-2008
Age
HIV +
HIV -
Children (2-14 years)
25
975
Youth (15-24 years)
87
913
Adults (25 and older)
168
832
(15-49 years)
169
831
Total (2 and older)
109
891
Estimated HIV prevalence among South Africans by age and sex 2008
Age
Male prevalence
Female prevalence
2-14
3
2
15-19
25
67
20-24
51
211
25-29
157
327
30-34
258
291
35-39
185
248
40-44
192
163
45-49
64
141
50-54
104
102
55-59
62
77
60+
35
18
Total
79
136
Among females HIV prevalence is highest in those between 25 and 29 years old among males the peak is in the group aged 30-34 years
HIV prevalence () by province 2002-2008
Province
2002
2005
2008
KwaZulu-Natal
117
165
158
Mpumalanga
141
152
154
Free State
149
126
126
North West
103
109
113
Gauteng
147
108
103
Eastern Cape
66
89
9
Limpopo
98
8
88
Northern Cape
84
54
59
Western Cape
107
19
38
National
114
108
109
The results of this study suggest that KwaZulu-Natal Mpumulanga and Free State have the highest HIV prevalence However the relatively small sample sizes may limit precision and in several cases the ranges of uncertainty overlap
HIV prevalence by population group 2008
Population group
Prevalence ()
African
136
864
White
03
997
Coloured
17
983
Indian
03
997
Studies of AIDS deaths
Latin America
Latin America
Latin America
Latin America
North America
North America
North America
North America
Eastern Europe
Eastern Europe
Eastern Europe
Eastern Europe
Western Europe
Western Europe
Western Europe
Western Europe
Asia Pacific
Asia Pacific
Asia Pacific
Asia Pacific
Africa
Africa
Africa
Africa
Country
Study starts
Subjects randomised
SubjectsStudy
USA
32
4385
13703125
Russia
20
788
394
Germany
19
1883
991052631579
UK
13
265
203846153846
South Africa
12
347
289166666667
Argentina
12
329
274166666667
Australia
11
195
177272727273
India
7
275
392857142857
Brazil
3
115
383333333333
Country
Initiation
Site activation
Recruitment
LOC setup
Unproductive sites
(Approval ndash FCI)
(FCI ndash FSFV)
(FSFV ndash LSFV)
(CPC ndash FSFV)
South Africa
19
38
153
357
21
Australia
117
63
401
239
11
Germany
16
37
401
224
21
UK
9
101
301
346
20
Russia
11
52
174
334
9
India
31
28
389
431
3
Argentina
94
67
288
32
13
Brazil
79
59
94
656
20
USA
44
31
149
26
Country
Pts Rand
Sites
Av CPP
Cost Per Country
Ethics Subm
Regulatory Fees
Add Inv Fees
CT Scan Total
Ethics + Regulatory
Total Regulatory Fees
South Africa
25
5
7250
181250
290
460
363
0
750
1113
Canada
18
4
832545
14985818
181818
0
0
1557576
181818
1818
Italy
7
2
10000
70000
2200
0
0
0
2200
2200
Germany
55
10
7000
385000
3000
0
0
12000
3000
3000
Peru
40
5
7000
280000
1500
1000
2000
60000
2500
4500
Poland
15
4
10000
150000
0
2500
2400
0
2500
4900
Spain
40
7
10500
420000
0
0
5450
0
0
5450
UK
12
4
13000
156000
0
0
5556
0
0
5556
Bulgaria
18
4
10000
180000
0
5000
1000
0
5000
6000
Taiwan
20
4
1179649
2359298
104167
313
5208
0
135467
6563
Czech Rep
10
2
10000
100000
1500
3000
3000
0
4500
7500
Greece
40
7
9000
360000
0
7500
0
0
7500
7500
Chile
15
4
10840
162600
1700
3600
3000
0
5300
8300
Belgium
25
6
12200
305000
3992
4332
0
0
8324
8324
Korea
30
3
10827
324802
1114
0
14324
0
1114
15438
Singapore
10
2
11565
115650
1750
0
17975
0
1750
19725
France
50
10
9000
450000
0
0
20000
0
0
20000
China
39
5
4978
194142
5224
0
39814
0
5224
40336
New Zealand
10
3
145244
145244
1973
0
43123
0
1973
45096
Israel
10
6
11140
111400
2060
3000
48400
16500
5060
53460
Brazil
30
6
10000
300000
2000
287356
5649202
0
487356
61366
Australia
24
6
40200
964800
0
500
82500
0
500
83000
23
543
109
532856799
3304716
26939
27700043
73748966
[1753EURO x 14 (ex rate) = $2454] [ $245416 hours=$153hour]
1095625
1095625
12271
1753
198089
198089
208514736842
South Africa
Canada
Italy
Germany
Peru
Poland
Spain
UK
Bulgaria
Taiwan
Czech Rep
Greece
Chile
Belgium
Korea
Singapore
France
China
New Zealand
Israel
Brazil
Australia
Country
Study starts
Subjects randomised
SubjectsStudy
USA
32
4385
13703125
Russia
20
788
394
Germany
19
1883
991052631579
UK
13
265
203846153846
South Africa
12
347
289166666667
Argentina
12
329
274166666667
Australia
11
195
177272727273
India
7
275
392857142857
Brazil
3
115
383333333333
Country
Initiation
Site activation
Recruitment
LOC setup
Unproductive sites
(Approval ndash FCI)
(FCI ndash FSFV)
(FSFV ndash LSFV)
(CPC ndash FSFV)
South Africa
19
38
153
357
21
Australia
117
63
401
239
11
Germany
16
37
401
224
21
UK
9
101
301
346
20
Russia
11
52
174
334
9
India
31
28
389
431
3
Argentina
94
67
288
32
13
Brazil
79
59
94
656
20
USA
44
31
149
26
Country
Pts Rand
Sites
Av CPP
Cost Per Country
Ethics Subm
Regulatory Fees
Add Inv Fees
CT Scan Total
Ethics + Regulatory
Total Regulatory Fees
China
39
5
4978
194142
522
0
39814
0
522
40336
Germany
55
10
7000
385000
3000
0
0
12000
3000
3000
Peru
40
5
7000
280000
1500
1000
2000
60000
2500
4500
South Africa
25
5
7250
181250
290
460
363
0
750
1113
Canada
18
4
8325
149858
1818
0
0
1557576
1818
1818
Greece
40
7
9000
360000
0
7500
0
0
7500
7500
France
50
10
9000
450000
0
0
20000
0
0
20000
Italy
7
2
10000
70000
2200
0
0
0
2200
2200
Poland
15
4
10000
150000
0
2500
2400
0
2500
4900
Bulgaria
18
4
10000
180000
0
5000
1000
0
5000
6000
Czech Rep
10
2
10000
100000
1500
3000
3000
0
4500
7500
Brazil
30
6
10000
300000
2000
2874
56492
0
4874
61366
Spain
40
7
10500
420000
0
0
5450
0
0
5450
Korea
30
3
10827
324802
1114
0
14324
0
1114
15438
Chile
15
4
10840
162600
1700
3600
3000
0
5300
8300
Israel
10
6
11140
111400
2060
3000
48400
16500
5060
53460
Singapore
10
2
11565
115650
1750
0
17975
0
1750
19725
Taiwan
20
4
11796
235930
1042
313
5208
0
1355
6563
Belgium
25
6
12200
305000
3992
4332
0
0
8324
8324
UK
12
4
13000
156000
0
0
5556
0
0
5556
New Zealand
10
3
14524
145244
1973
0
43123
0
1973
45096
Australia
24
6
40200
964800
0
500
82500
0
500
83000
23
543
109
5328568
33047
26939
277000
73748966
[1753EURO x 14 (ex rate) = $2454] [ $245416 hours=$153hour]
110
1095625
1227
1753
19809
20
21
China
Germany
Peru
South Africa
Canada
Greece
France
Italy
Poland
Bulgaria
Czech Rep
Brazil
Spain
Korea
Chile
Israel
Singapore
Taiwan
Belgium
UK
New Zealand
Australia
Population Group
IndianAsianOther
26
Mixed ethnicity
90
Caucasian
91
African
793
10000
IndianAsianOther
Mixed ethnicity
Caucasian
African
3
Collaboration with VPM SII
Phase Ib Open Label Randomized Controlled Dose-Escalation Study to Evaluate Safety and Immunogenicity of VPM1002 in Comparison with BCG in Healthy Volunteers in South Africa (Apr ndash Dec 2010) Phase II Open Label Randomized Controlled Study to Evaluate Safety and Immunogenicity of VPM1002 in Comparison with BCG in HIV-unexposed BCG naive newborn infants in South Africa (Nov 2011 ndash Nov 2012) Phase II double-blind randomized controlled study to evaluate the safety and immunogenicity of VPM1002 in comparison with BCG in HIV-exposed and HIV-unexposed BCG-naive newborn infants (Jun 2015 hellip Mar 2016)
Stats SA Rel P03093 Mortality and causes of death in South Africa 2009 Findings from death notification Nov-2011
Age group
TB 0-14 15-49 50-64 65+
Rank Rank Rank Rank
5 34 1 196 1 114 8 33
24
bull Well established research infrastructure bull Public and private sectors
28 teaching hospitals gt40000 tertiary care beds 140 private hospitals gt30000 beds 15 - 18 medical insurance
bull Large broad-based investigator database amp site networks bull Specialised Early Phase presence since 1970s bull GCPGLP and CLIA 88 compliant labs bull Specialist labs (biomarkers TB immunology
PKbioassay) bull Full support services (GMP-depots translations etc) bull Stringent ICH-compliant RAEC review policies
GCP is a legal requirement Informed Consent entrenched in Constitution
South Africa Advantages
25
bull Reliable (+) roads air links energy connectivity bull European Time bull Research language is English bull Inverse seasons bull Cost Currency bull Mobile-phone enabled obsessed population
South Africa Advantages
26
South Africa Track Record
bull Phase I-III data from SA included in hundreds of US amp European registration dossiers
bull Two entire NDA dossiers ndash rifapentine 1998 ndash tryptorelin (GnRH agonist) 2001) comprised SA data
bull 37 FDA inspections 1994-2009 1 OAI (27)
27
Therapeutic Indications
28
0
1
2
3
4
5
6
7
8
9
10
Belg
ium
Au
stria
Li
thua
nia
Can
ada
Luxe
mbo
urg
Mal
ta
Nor
way
Po
rtuga
l R
oman
ia
Rus
sia
Serb
ia
Swed
en
The
Net
herla
nds
USA
loca
l site
s U
SA c
entra
l site
C
zech
Rep
ublic
D
enm
ark
Esto
nia
Finl
and
Hun
gary
Ic
elan
d Ire
land
La
tvia
G
erm
any
Switz
erla
nd
Liec
hten
stei
n U
nite
d Ki
ngdo
m
Fran
ce
Italy
Au
stra
lia
Hon
g-Ko
ng
New
Zea
land
Si
ngap
ore
Taiw
an
Uga
nda
Pola
nd
Ukr
aine
C
hile
G
uate
mal
a Ja
pan
Isra
el
Slov
akia
Bu
lgar
ia
Gre
ece
Mal
aysi
a Ph
ilipp
ines
Pe
ru
Thai
land
Tu
rkey
Sl
oven
ia
Cos
ta R
ica
Mex
ico
Spai
n So
uth
Afric
a Ar
gent
ina
Sout
h Ko
rea
Col
ombi
a Pa
nam
a C
roat
ia
Indi
a Ve
nezu
ela
Braz
il C
hina
Mon
ths
Sout
h Afri
ca
Global Regulatory Review Timelines
Triclinium experience 2009-2015
Triclinium experience 2009 - 2015
29
Protocol release Country selection
Site Selection Collection of reg docs
Submission of RA application
EC application
Negotiate Site Contracts
EC Approvals
RA Approval amp Import permit
Site Initiation Import amp distribute drug
Import ancillary supplies Set up local labs
Set up EDC
Months
0
1
2
3
All EC approvals typically within 6
weeks
Site contracts signed within days
As soon as MCC approval obtained ALL sites can be initiated
Start-Up Activities in PARALLEL
GMO application (biologics)
30
0
2000
4000
6000
8000
10000
12000
14000C
hina
Ger
man
y
Per
u
Sou
th A
frica
Can
ada
Gre
ece
Fran
ce
Italy
Pol
and
Bul
garia
Cze
ch R
ep
Bra
zil
Spa
in
Kor
ea
Chi
le
Isra
el
Sin
gapo
re
Taiw
an
Bel
gium U
K
New
hellip
Aus
tralia
Source Bayer Presented SACRA Conference 2009
Aver
age
cost
per
pat
ient
(Eur
o)
Average Cost per Enrolled Participant
gt40000
Chart1
Average Cost Per Patient (Euro)
4978
7000
7000
7250
832545
9000
9000
10000
10000
10000
10000
10000
10500
10827
10840
11140
11565
1179649
12200
13000
145244
40200
Sheet1
Sheet2
Sheet2
Average Cost Per Patient (Euro)
Average Cost Per Patient
Sheet4
Ethics Subm
Regulatory Fees
Sheet3
Ethics + Regulatory
Total Ethics and Regulatory Fees
Add Inv Fees
Additional Investigator Application Fees
Total Regulatory Fees
Study starts
SubjectsStudy
31
Euro
0
10000
20000
30000
40000
50000
60000
70000
80000
90000S
outh
Afri
caC
anad
a
Italy
Ger
man
yP
eru
Pol
and
Spa
in UK
Bul
garia
Taiw
anC
zech
Rep
Gre
ece
Chi
leB
elgi
umK
orea
Sin
gapo
reFr
ance
Chi
naN
ew Z
eala
ndIs
rael
Bra
zil
Aus
tralia
Source Bayer Presented SACRA Conference 2009
Eur
os
Regulatory Application Fees
Chart1
Total Regulatory Fees
1113
181818
2200
3000
4500
4900
5450
5556
6000
656267
7500
7500
8300
8324
15438
19725
20000
403364
45096
53460
6136558
83000
Sheet1
Sheet2
Sheet2
Average Cost Per Patient (Euro)
Average Cost Per Patient
Sheet4
Ethics Subm
Regulatory Fees
Sheet3
Ethics + Regulatory
Total Ethics and Regulatory Fees
Add Inv Fees
Additional Investigator Application Fees
Total Regulatory Fees
Study starts
SubjectsStudy
32
SA Clinical Trial Regulatory Processes
Governed by SA-GCP and Declaration of Helsinki SA National Clinical Trials Register (SANCTR) Medicines Control Council (National Regulatory Authority)
o New protocols o Amendments o Additional sitesinvestigators
Ethics Committees (33 NHREC-registered) RegionalMunicipal DoH Export permits for bio samples (Nat Health Act 2003)
Clinical Trial Density Active sites million population
Nature Reviews Drug Discovery 7 13-14 (January 2008)
France 503
Germany 512 Canada
922
USA 1203
Czech Republic 776
553 sites
South Africa 119
757 sites
757 sites
533 sites
1084 sites
Argentina 269
Russia 77
China 04
India 07
34
Gateway to Africa
35
Why Africa bull Large accessible population relatively new to clinical trials
bull Experienced and willing investigators
bull Many clinical trial sites established by PDPs NGOs etc
bull Expanding therapeutic areas shifting burden of disease from
infectious to non-communicable diseases
bull Significantly improved infrastructure and accessibility
bull Rapidly evolving regulatory and ethics procedures
bull Potential for capacity building and sustainable clinical trial potential
36
Relatively young GCP culture Resident mentorships to build capacity Locations ndash accessibility for site monitoring Variable infrastructure esp electricity connectivity and
transportation Resourcing of public healthcare systems
Sub-Saharan Africa challenges
37
bull Second-largest continent
bull Spans NS and EW hemispheres
bull Second most populous continent 2014 estimate 1069 billion
bull Home to more than a quarter of the 196 independent countries
bull All 54 African countries are UN members
bull 39 urban population
bull 12 metropolitan areas gt 4m
bull gt 3000 distinct ethnicities
bull gt 2000 languages spoken
AFRICA hellip the true size
wwwcitypopulationdeworldAgglomerations 2015
38
SSV to SIV
0
5
10
15
20
25
30
35
40
45
Africa North America
Asia Pacific
Western Europe
Eastern Europe
Latin America
Source Quintiles South Africa SACRA Conference 2008
Wee
ks (A
vera
ge)
Start-Up Timelines
39
Region Median
Patients Site
of Sites
0 pts 1 - 3 pts 4 - 9 pts 10+ pts
Latin America 40 21 26 30 23
North America 30 29 29 24 18
Eastern Europe 60 15 31 26 27
Western Europe 40 15 22 29 34
Asia Pacific 40 19 30 34 18
Africa 100 4 17 28 51
Enrollment performance by region for 2008
Site Performance
Source Quintiles South Africa Presented SACRA Conference 2009
40
0 1 2 3 4 5 6 7 8 9
10
Latin America
North America
Eastern Europe
Western Europe
Asia Pacific
Africa
Num
ber o
f par
ticip
ants
MEDIAN site enrollment by region for 2008
Source Quintiles South Africa Presented SACRA Conference 2009
Site Performance
41
Source Quintiles South Africa Presented SACRA Conference 2009
s
ites
0
5
10
15
20
25
30
35
40
45
50
LatinAmerica
NorthAmerica
EasternEurope
WesternEurope
Asia Pacific Africa
0 pts
1 - 3 pts
4 - 9 pts
10+ pts
Enrollment performance by region for 2008
Site Performance
Chart1
0 pts
1 - 3 pts
4 - 9 pts
10+ pts
021
026
03
023
029
029
024
018
015
031
026
027
015
022
029
034
019
03
034
018
004
017
028
051
HIV
HIV
Resiratory amp Cancer
Male prevalence
Female prevalence
CVS
Overall death rates
Overall death rates
COPD
Asthma
Tracheabronchial lung cancer
Oesophageal cancer
prostate cancer
Trial metrics
COPD
Asthma
Tracheabronchial lung cancer
Oesophageal cancer
Prostate cancer
Cervical cancer
Breast cancer
Stroke
ill-defined heart disease
Diabetes mellitus
Ischaemic heart disease
Hypertension
Nephritisnephrosis
Stroke
ill-defined heart disease
Diabetes mellitus
Ischaemic heart disease
Hypertension
Nephritisnephrosis
Males
Female
UN - Male
SA 1997
SA 2004
UN - Female
SA 1997
SA 2004
0 pts
1 - 3 pts
4 - 9 pts
10+ pts
42
Source wwwclinicaltrialsgov 22-Oct-2010
Clinical trials registered across Africa
43
0
500
1000
1500
2000
2500
South Africa Kenya Malawi Tanzania Uganda Zambia
Selected African countries
2005
2010
2015
Source ClinTrialsgov
Trend 2005 - 2015
Source wwwclinicaltrialsgov 28-Aug-2015
44
AFRICA FOUND IN TRANSLATION
bull Vast treatment-naiumlve population bull Cost advantages (still) bull Diverse ethnicity amp morbidity bull Inverse seasonality bull Site capacity-building widely implemented bull Robust regulatory review bull Variable but generally good regulatory timelines bull Established GCP culture ndash sites and home-bred CROs
45
THANK YOU
Foliennummer 1
Triclinium A South African CRO
Collaboration with VPM SII
Vaccine Trials in SA 2015
Foliennummer 5
Foliennummer 6
Foliennummer 7
Foliennummer 8
Foliennummer 9
Foliennummer 10
Foliennummer 11
Foliennummer 12
Foliennummer 13
Foliennummer 14
Foliennummer 15
Foliennummer 16
Foliennummer 17
Distribution of clinical trial sites
Foliennummer 19
South Africa Leading Causes of Death
Foliennummer 21
Foliennummer 22
South Africa TB deaths by age group
Foliennummer 24
Foliennummer 25
Foliennummer 26
Foliennummer 27
Foliennummer 28
Foliennummer 29
Foliennummer 30
Foliennummer 31
SA Clinical Trial Regulatory Processes
Clinical Trial Density Active sites million population
Foliennummer 34
Why Africa
Foliennummer 36
AFRICA hellip the true size
SSV to SIV
Foliennummer 39
Foliennummer 40
Foliennummer 41
Foliennummer 42
Foliennummer 43
AFRICA FOUND IN TRANSLATION
Foliennummer 45
Region
Median
of Sites
Patients Site
0 pts
1 - 3 pts
4 - 9 pts
10+ pts
Latin America
4
21
26
30
23
North America
3
29
29
24
18
Eastern Europe
6
15
31
26
27
Western Europe
4
15
22
29
34
Asia Pacific
4
19
30
34
18
Africa
10
4
17
28
51
0 pts
1 - 3 pts
4 - 9 pts
10+ pts
Latin America
21
26
30
23
North America
29
29
24
18
Eastern Europe
15
31
26
27
Western Europe
15
22
29
34
Asia Pacific
19
30
34
18
Africa
4
17
28
51
Males
Female
15-19
210
150
20-24
340
205
25-29
395
300
30-34
460
360
35-39
600
405
40-44
800
500
45-49
1100
700
50-54
1600
1050
55-54
2300
1580
60-64
3340
2250
UN - Male
SA 1997
SA 2004
UN - Female
SA 1997
SA 2004
15-19
210
235
216
150
165
187
20-24
340
381
555
205
331
1085
25-29
395
625
1081
300
452
1985
30-34
460
817
2118
360
489
2267
35-39
600
916
2498
405
526
1890
40-44
800
1136
2765
500
615
1548
45-49
1100
1486
2744
700
800
1400
50-54
1600
2016
2979
1050
1116
1506
55-54
2300
2838
3270
1580
1626
1717
60-64
3340
3614
4146
2250
2201
2360
Stroke
ill-defined heart disease
Diabetes mellitus
Ischaemic heart disease
Hypertension
Nephritisnephrosis
Stroke
ill-defined heart disease
Diabetes mellitus
Ischaemic heart disease
Hypertension
Nephritisnephrosis
1999
34
345
20
248
14
10
1999
295
246
23
10
145
68
2000
36
362
218
249
152
112
2000
318
268
241
108
16
8
2001
35
372
22
25
15
125
2001
322
28
252
102
162
95
2002
405
298
24
26
147
126
2002
352
295
27
115
16
10
2003
425
32
245
285
152
15
2003
382
299
285
122
17
12
2004
39
325
255
26
165
16
2004
35
30
295
121
19
119
2005
36
328
265
26
15
162
2005
325
30
32
12
18
12
2006
35
336
27
258
155
16
2006
33
32
32
11
18
125
COPD
Asthma
Tracheabronchial lung cancer
Oesophageal cancer
prostate cancer
Cervical cancer
Breast cancer
1999
2001
12
135
10
26
2000
204
116
13
92
28
2001
222
131
133
96
27
2002
23
144
128
95
285
2003
243
149
124
94
29
2004
229
154
1255
87
29
2005
224
152
122
82
295
2006
224
136
116
75
3
COPD
Asthma
Tracheabronchial lung cancer
Oesophageal cancer
Prostate cancer
Cervical cancer
Breast cancer
1999
88
92
43
41
106
82
2000
96
95
4
43
11
81
2001
10
109
4
4
111
89
2002
10
116
4
4
112
85
2003
11
124
4
395
116
85
2004
102
1295
44
39
115
101
2005
105
128
42
38
1185
10
2006
10
12
42
32
1205
10
Based on this survey the researchers estimate that 109 of all South Africans over 2 years old were living with HIV in 2008 In 2002 and 2005 this figure was 114 and 108 respectively showing a degree of stabilisation Among those between 15 and 49 years old the estimated HIV prevalence was 169 in 2008 The survey found the prevalence among children aged 2-14 to be 25 down significantly since 2002 when prevalence was 56
Estimated HIV prevalence () among South Africans aged 2 years and older by age 2002-2008
Age
HIV +
HIV -
Children (2-14 years)
25
975
Youth (15-24 years)
87
913
Adults (25 and older)
168
832
(15-49 years)
169
831
Total (2 and older)
109
891
Estimated HIV prevalence among South Africans by age and sex 2008
Age
Male prevalence
Female prevalence
2-14
3
2
15-19
25
67
20-24
51
211
25-29
157
327
30-34
258
291
35-39
185
248
40-44
192
163
45-49
64
141
50-54
104
102
55-59
62
77
60+
35
18
Total
79
136
Among females HIV prevalence is highest in those between 25 and 29 years old among males the peak is in the group aged 30-34 years
HIV prevalence () by province 2002-2008
Province
2002
2005
2008
KwaZulu-Natal
117
165
158
Mpumalanga
141
152
154
Free State
149
126
126
North West
103
109
113
Gauteng
147
108
103
Eastern Cape
66
89
9
Limpopo
98
8
88
Northern Cape
84
54
59
Western Cape
107
19
38
National
114
108
109
The results of this study suggest that KwaZulu-Natal Mpumulanga and Free State have the highest HIV prevalence However the relatively small sample sizes may limit precision and in several cases the ranges of uncertainty overlap
HIV prevalence by population group 2008
Population group
Prevalence ()
African
136
864
White
03
997
Coloured
17
983
Indian
03
997
Studies of AIDS deaths
Latin America
Latin America
Latin America
Latin America
North America
North America
North America
North America
Eastern Europe
Eastern Europe
Eastern Europe
Eastern Europe
Western Europe
Western Europe
Western Europe
Western Europe
Asia Pacific
Asia Pacific
Asia Pacific
Asia Pacific
Africa
Africa
Africa
Africa
Country
Study starts
Subjects randomised
SubjectsStudy
USA
32
4385
13703125
Russia
20
788
394
Germany
19
1883
991052631579
UK
13
265
203846153846
South Africa
12
347
289166666667
Argentina
12
329
274166666667
Australia
11
195
177272727273
India
7
275
392857142857
Brazil
3
115
383333333333
Country
Initiation
Site activation
Recruitment
LOC setup
Unproductive sites
(Approval ndash FCI)
(FCI ndash FSFV)
(FSFV ndash LSFV)
(CPC ndash FSFV)
South Africa
19
38
153
357
21
Australia
117
63
401
239
11
Germany
16
37
401
224
21
UK
9
101
301
346
20
Russia
11
52
174
334
9
India
31
28
389
431
3
Argentina
94
67
288
32
13
Brazil
79
59
94
656
20
USA
44
31
149
26
Country
Pts Rand
Sites
Av CPP
Cost Per Country
Ethics Subm
Regulatory Fees
Add Inv Fees
CT Scan Total
Ethics + Regulatory
Total Regulatory Fees
South Africa
25
5
7250
181250
290
460
363
0
750
1113
Canada
18
4
832545
14985818
181818
0
0
1557576
181818
1818
Italy
7
2
10000
70000
2200
0
0
0
2200
2200
Germany
55
10
7000
385000
3000
0
0
12000
3000
3000
Peru
40
5
7000
280000
1500
1000
2000
60000
2500
4500
Poland
15
4
10000
150000
0
2500
2400
0
2500
4900
Spain
40
7
10500
420000
0
0
5450
0
0
5450
UK
12
4
13000
156000
0
0
5556
0
0
5556
Bulgaria
18
4
10000
180000
0
5000
1000
0
5000
6000
Taiwan
20
4
1179649
2359298
104167
313
5208
0
135467
6563
Czech Rep
10
2
10000
100000
1500
3000
3000
0
4500
7500
Greece
40
7
9000
360000
0
7500
0
0
7500
7500
Chile
15
4
10840
162600
1700
3600
3000
0
5300
8300
Belgium
25
6
12200
305000
3992
4332
0
0
8324
8324
Korea
30
3
10827
324802
1114
0
14324
0
1114
15438
Singapore
10
2
11565
115650
1750
0
17975
0
1750
19725
France
50
10
9000
450000
0
0
20000
0
0
20000
China
39
5
4978
194142
5224
0
39814
0
5224
40336
New Zealand
10
3
145244
145244
1973
0
43123
0
1973
45096
Israel
10
6
11140
111400
2060
3000
48400
16500
5060
53460
Brazil
30
6
10000
300000
2000
287356
5649202
0
487356
61366
Australia
24
6
40200
964800
0
500
82500
0
500
83000
23
543
109
532856799
3304716
26939
27700043
73748966
[1753EURO x 14 (ex rate) = $2454] [ $245416 hours=$153hour]
1095625
1095625
12271
1753
198089
198089
208514736842
South Africa
Canada
Italy
Germany
Peru
Poland
Spain
UK
Bulgaria
Taiwan
Czech Rep
Greece
Chile
Belgium
Korea
Singapore
France
China
New Zealand
Israel
Brazil
Australia
Country
Study starts
Subjects randomised
SubjectsStudy
USA
32
4385
13703125
Russia
20
788
394
Germany
19
1883
991052631579
UK
13
265
203846153846
South Africa
12
347
289166666667
Argentina
12
329
274166666667
Australia
11
195
177272727273
India
7
275
392857142857
Brazil
3
115
383333333333
Country
Initiation
Site activation
Recruitment
LOC setup
Unproductive sites
(Approval ndash FCI)
(FCI ndash FSFV)
(FSFV ndash LSFV)
(CPC ndash FSFV)
South Africa
19
38
153
357
21
Australia
117
63
401
239
11
Germany
16
37
401
224
21
UK
9
101
301
346
20
Russia
11
52
174
334
9
India
31
28
389
431
3
Argentina
94
67
288
32
13
Brazil
79
59
94
656
20
USA
44
31
149
26
Country
Pts Rand
Sites
Av CPP
Cost Per Country
Ethics Subm
Regulatory Fees
Add Inv Fees
CT Scan Total
Ethics + Regulatory
Total Regulatory Fees
China
39
5
4978
194142
522
0
39814
0
522
40336
Germany
55
10
7000
385000
3000
0
0
12000
3000
3000
Peru
40
5
7000
280000
1500
1000
2000
60000
2500
4500
South Africa
25
5
7250
181250
290
460
363
0
750
1113
Canada
18
4
8325
149858
1818
0
0
1557576
1818
1818
Greece
40
7
9000
360000
0
7500
0
0
7500
7500
France
50
10
9000
450000
0
0
20000
0
0
20000
Italy
7
2
10000
70000
2200
0
0
0
2200
2200
Poland
15
4
10000
150000
0
2500
2400
0
2500
4900
Bulgaria
18
4
10000
180000
0
5000
1000
0
5000
6000
Czech Rep
10
2
10000
100000
1500
3000
3000
0
4500
7500
Brazil
30
6
10000
300000
2000
2874
56492
0
4874
61366
Spain
40
7
10500
420000
0
0
5450
0
0
5450
Korea
30
3
10827
324802
1114
0
14324
0
1114
15438
Chile
15
4
10840
162600
1700
3600
3000
0
5300
8300
Israel
10
6
11140
111400
2060
3000
48400
16500
5060
53460
Singapore
10
2
11565
115650
1750
0
17975
0
1750
19725
Taiwan
20
4
11796
235930
1042
313
5208
0
1355
6563
Belgium
25
6
12200
305000
3992
4332
0
0
8324
8324
UK
12
4
13000
156000
0
0
5556
0
0
5556
New Zealand
10
3
14524
145244
1973
0
43123
0
1973
45096
Australia
24
6
40200
964800
0
500
82500
0
500
83000
23
543
109
5328568
33047
26939
277000
73748966
[1753EURO x 14 (ex rate) = $2454] [ $245416 hours=$153hour]
110
1095625
1227
1753
19809
20
21
China
Germany
Peru
South Africa
Canada
Greece
France
Italy
Poland
Bulgaria
Czech Rep
Brazil
Spain
Korea
Chile
Israel
Singapore
Taiwan
Belgium
UK
New Zealand
Australia
Population Group
IndianAsianOther
26
Mixed ethnicity
90
Caucasian
91
African
793
10000
IndianAsianOther
Mixed ethnicity
Caucasian
African
5
CLINICAL TRIALS
IN SOUTH AFRICA
LOST IN TRANSLATION hellip AL RESEARCH
6
Perceptions of Africa
7
8
or helliphellip
9
10
11
or helliphellip
12
13
14
15
South African Trials
Whistle-Stop Tour
16
bull Ethnically a ldquoRainbow Nationrdquo
bull Populations representative of Africa Europe and Asia
17
Population 5495-million 1-Jul-2015 estimate
SA urbanrural profile
18
Cape Town Port Elizabeth
Durban
Pretoria
Joburg
Bloemfontein
Distribution of clinical trial sites
George
East London
Nelspruit
Richardrsquos Bay Kimberley
Welkom
19
Source Statistics South Africa 2015
3
9
979
IndianAsianOtherMixed ethnicityCaucasianAfrican
bull Young 44 aged lt 20 yrs bull Elderly 76 aged gt 60 yrs bull High number of treatment-naiumlve patients
SA Demographics
Chart1
9
0026
009
0091
0793
Sheet1
Sheet1
Sheet2
Sheet3
20
South Africa Leading Causes of Death
00
20
40
60
80
100
120
140 The ten leading underlying natural causes of death in South Africa (2009)
percentage
TB Flu amp Intest Heart Cereb Diab HIV HT Chron Immun Pneum Infect Other Vasc Mell Dis LRT Dis
Stats SA Rel P03093 Mortality and causes of death in South Africa 2009 Findings from death notification Nov-2011
Age group
TB 0-14 15-49 50-64 65+
Rank Rank Rank Rank
5 34 1 196 1 114 8 33
24
bull Well established research infrastructure bull Public and private sectors
28 teaching hospitals gt40000 tertiary care beds 140 private hospitals gt30000 beds 15 - 18 medical insurance
bull Large broad-based investigator database amp site networks bull Specialised Early Phase presence since 1970s bull GCPGLP and CLIA 88 compliant labs bull Specialist labs (biomarkers TB immunology
PKbioassay) bull Full support services (GMP-depots translations etc) bull Stringent ICH-compliant RAEC review policies
GCP is a legal requirement Informed Consent entrenched in Constitution
South Africa Advantages
25
bull Reliable (+) roads air links energy connectivity bull European Time bull Research language is English bull Inverse seasons bull Cost Currency bull Mobile-phone enabled obsessed population
South Africa Advantages
26
South Africa Track Record
bull Phase I-III data from SA included in hundreds of US amp European registration dossiers
bull Two entire NDA dossiers ndash rifapentine 1998 ndash tryptorelin (GnRH agonist) 2001) comprised SA data
bull 37 FDA inspections 1994-2009 1 OAI (27)
27
Therapeutic Indications
28
0
1
2
3
4
5
6
7
8
9
10
Belg
ium
Au
stria
Li
thua
nia
Can
ada
Luxe
mbo
urg
Mal
ta
Nor
way
Po
rtuga
l R
oman
ia
Rus
sia
Serb
ia
Swed
en
The
Net
herla
nds
USA
loca
l site
s U
SA c
entra
l site
C
zech
Rep
ublic
D
enm
ark
Esto
nia
Finl
and
Hun
gary
Ic
elan
d Ire
land
La
tvia
G
erm
any
Switz
erla
nd
Liec
hten
stei
n U
nite
d Ki
ngdo
m
Fran
ce
Italy
Au
stra
lia
Hon
g-Ko
ng
New
Zea
land
Si
ngap
ore
Taiw
an
Uga
nda
Pola
nd
Ukr
aine
C
hile
G
uate
mal
a Ja
pan
Isra
el
Slov
akia
Bu
lgar
ia
Gre
ece
Mal
aysi
a Ph
ilipp
ines
Pe
ru
Thai
land
Tu
rkey
Sl
oven
ia
Cos
ta R
ica
Mex
ico
Spai
n So
uth
Afric
a Ar
gent
ina
Sout
h Ko
rea
Col
ombi
a Pa
nam
a C
roat
ia
Indi
a Ve
nezu
ela
Braz
il C
hina
Mon
ths
Sout
h Afri
ca
Global Regulatory Review Timelines
Triclinium experience 2009-2015
Triclinium experience 2009 - 2015
29
Protocol release Country selection
Site Selection Collection of reg docs
Submission of RA application
EC application
Negotiate Site Contracts
EC Approvals
RA Approval amp Import permit
Site Initiation Import amp distribute drug
Import ancillary supplies Set up local labs
Set up EDC
Months
0
1
2
3
All EC approvals typically within 6
weeks
Site contracts signed within days
As soon as MCC approval obtained ALL sites can be initiated
Start-Up Activities in PARALLEL
GMO application (biologics)
30
0
2000
4000
6000
8000
10000
12000
14000C
hina
Ger
man
y
Per
u
Sou
th A
frica
Can
ada
Gre
ece
Fran
ce
Italy
Pol
and
Bul
garia
Cze
ch R
ep
Bra
zil
Spa
in
Kor
ea
Chi
le
Isra
el
Sin
gapo
re
Taiw
an
Bel
gium U
K
New
hellip
Aus
tralia
Source Bayer Presented SACRA Conference 2009
Aver
age
cost
per
pat
ient
(Eur
o)
Average Cost per Enrolled Participant
gt40000
Chart1
Average Cost Per Patient (Euro)
4978
7000
7000
7250
832545
9000
9000
10000
10000
10000
10000
10000
10500
10827
10840
11140
11565
1179649
12200
13000
145244
40200
Sheet1
Sheet2
Sheet2
Average Cost Per Patient (Euro)
Average Cost Per Patient
Sheet4
Ethics Subm
Regulatory Fees
Sheet3
Ethics + Regulatory
Total Ethics and Regulatory Fees
Add Inv Fees
Additional Investigator Application Fees
Total Regulatory Fees
Study starts
SubjectsStudy
31
Euro
0
10000
20000
30000
40000
50000
60000
70000
80000
90000S
outh
Afri
caC
anad
a
Italy
Ger
man
yP
eru
Pol
and
Spa
in UK
Bul
garia
Taiw
anC
zech
Rep
Gre
ece
Chi
leB
elgi
umK
orea
Sin
gapo
reFr
ance
Chi
naN
ew Z
eala
ndIs
rael
Bra
zil
Aus
tralia
Source Bayer Presented SACRA Conference 2009
Eur
os
Regulatory Application Fees
Chart1
Total Regulatory Fees
1113
181818
2200
3000
4500
4900
5450
5556
6000
656267
7500
7500
8300
8324
15438
19725
20000
403364
45096
53460
6136558
83000
Sheet1
Sheet2
Sheet2
Average Cost Per Patient (Euro)
Average Cost Per Patient
Sheet4
Ethics Subm
Regulatory Fees
Sheet3
Ethics + Regulatory
Total Ethics and Regulatory Fees
Add Inv Fees
Additional Investigator Application Fees
Total Regulatory Fees
Study starts
SubjectsStudy
32
SA Clinical Trial Regulatory Processes
Governed by SA-GCP and Declaration of Helsinki SA National Clinical Trials Register (SANCTR) Medicines Control Council (National Regulatory Authority)
o New protocols o Amendments o Additional sitesinvestigators
Ethics Committees (33 NHREC-registered) RegionalMunicipal DoH Export permits for bio samples (Nat Health Act 2003)
Clinical Trial Density Active sites million population
Nature Reviews Drug Discovery 7 13-14 (January 2008)
France 503
Germany 512 Canada
922
USA 1203
Czech Republic 776
553 sites
South Africa 119
757 sites
757 sites
533 sites
1084 sites
Argentina 269
Russia 77
China 04
India 07
34
Gateway to Africa
35
Why Africa bull Large accessible population relatively new to clinical trials
bull Experienced and willing investigators
bull Many clinical trial sites established by PDPs NGOs etc
bull Expanding therapeutic areas shifting burden of disease from
infectious to non-communicable diseases
bull Significantly improved infrastructure and accessibility
bull Rapidly evolving regulatory and ethics procedures
bull Potential for capacity building and sustainable clinical trial potential
36
Relatively young GCP culture Resident mentorships to build capacity Locations ndash accessibility for site monitoring Variable infrastructure esp electricity connectivity and
transportation Resourcing of public healthcare systems
Sub-Saharan Africa challenges
37
bull Second-largest continent
bull Spans NS and EW hemispheres
bull Second most populous continent 2014 estimate 1069 billion
bull Home to more than a quarter of the 196 independent countries
bull All 54 African countries are UN members
bull 39 urban population
bull 12 metropolitan areas gt 4m
bull gt 3000 distinct ethnicities
bull gt 2000 languages spoken
AFRICA hellip the true size
wwwcitypopulationdeworldAgglomerations 2015
38
SSV to SIV
0
5
10
15
20
25
30
35
40
45
Africa North America
Asia Pacific
Western Europe
Eastern Europe
Latin America
Source Quintiles South Africa SACRA Conference 2008
Wee
ks (A
vera
ge)
Start-Up Timelines
39
Region Median
Patients Site
of Sites
0 pts 1 - 3 pts 4 - 9 pts 10+ pts
Latin America 40 21 26 30 23
North America 30 29 29 24 18
Eastern Europe 60 15 31 26 27
Western Europe 40 15 22 29 34
Asia Pacific 40 19 30 34 18
Africa 100 4 17 28 51
Enrollment performance by region for 2008
Site Performance
Source Quintiles South Africa Presented SACRA Conference 2009
40
0 1 2 3 4 5 6 7 8 9
10
Latin America
North America
Eastern Europe
Western Europe
Asia Pacific
Africa
Num
ber o
f par
ticip
ants
MEDIAN site enrollment by region for 2008
Source Quintiles South Africa Presented SACRA Conference 2009
Site Performance
41
Source Quintiles South Africa Presented SACRA Conference 2009
s
ites
0
5
10
15
20
25
30
35
40
45
50
LatinAmerica
NorthAmerica
EasternEurope
WesternEurope
Asia Pacific Africa
0 pts
1 - 3 pts
4 - 9 pts
10+ pts
Enrollment performance by region for 2008
Site Performance
Chart1
0 pts
1 - 3 pts
4 - 9 pts
10+ pts
021
026
03
023
029
029
024
018
015
031
026
027
015
022
029
034
019
03
034
018
004
017
028
051
HIV
HIV
Resiratory amp Cancer
Male prevalence
Female prevalence
CVS
Overall death rates
Overall death rates
COPD
Asthma
Tracheabronchial lung cancer
Oesophageal cancer
prostate cancer
Trial metrics
COPD
Asthma
Tracheabronchial lung cancer
Oesophageal cancer
Prostate cancer
Cervical cancer
Breast cancer
Stroke
ill-defined heart disease
Diabetes mellitus
Ischaemic heart disease
Hypertension
Nephritisnephrosis
Stroke
ill-defined heart disease
Diabetes mellitus
Ischaemic heart disease
Hypertension
Nephritisnephrosis
Males
Female
UN - Male
SA 1997
SA 2004
UN - Female
SA 1997
SA 2004
0 pts
1 - 3 pts
4 - 9 pts
10+ pts
42
Source wwwclinicaltrialsgov 22-Oct-2010
Clinical trials registered across Africa
43
0
500
1000
1500
2000
2500
South Africa Kenya Malawi Tanzania Uganda Zambia
Selected African countries
2005
2010
2015
Source ClinTrialsgov
Trend 2005 - 2015
Source wwwclinicaltrialsgov 28-Aug-2015
44
AFRICA FOUND IN TRANSLATION
bull Vast treatment-naiumlve population bull Cost advantages (still) bull Diverse ethnicity amp morbidity bull Inverse seasonality bull Site capacity-building widely implemented bull Robust regulatory review bull Variable but generally good regulatory timelines bull Established GCP culture ndash sites and home-bred CROs
45
THANK YOU
Foliennummer 1
Triclinium A South African CRO
Collaboration with VPM SII
Vaccine Trials in SA 2015
Foliennummer 5
Foliennummer 6
Foliennummer 7
Foliennummer 8
Foliennummer 9
Foliennummer 10
Foliennummer 11
Foliennummer 12
Foliennummer 13
Foliennummer 14
Foliennummer 15
Foliennummer 16
Foliennummer 17
Distribution of clinical trial sites
Foliennummer 19
South Africa Leading Causes of Death
Foliennummer 21
Foliennummer 22
South Africa TB deaths by age group
Foliennummer 24
Foliennummer 25
Foliennummer 26
Foliennummer 27
Foliennummer 28
Foliennummer 29
Foliennummer 30
Foliennummer 31
SA Clinical Trial Regulatory Processes
Clinical Trial Density Active sites million population
Foliennummer 34
Why Africa
Foliennummer 36
AFRICA hellip the true size
SSV to SIV
Foliennummer 39
Foliennummer 40
Foliennummer 41
Foliennummer 42
Foliennummer 43
AFRICA FOUND IN TRANSLATION
Foliennummer 45
Region
Median
of Sites
Patients Site
0 pts
1 - 3 pts
4 - 9 pts
10+ pts
Latin America
4
21
26
30
23
North America
3
29
29
24
18
Eastern Europe
6
15
31
26
27
Western Europe
4
15
22
29
34
Asia Pacific
4
19
30
34
18
Africa
10
4
17
28
51
0 pts
1 - 3 pts
4 - 9 pts
10+ pts
Latin America
21
26
30
23
North America
29
29
24
18
Eastern Europe
15
31
26
27
Western Europe
15
22
29
34
Asia Pacific
19
30
34
18
Africa
4
17
28
51
Males
Female
15-19
210
150
20-24
340
205
25-29
395
300
30-34
460
360
35-39
600
405
40-44
800
500
45-49
1100
700
50-54
1600
1050
55-54
2300
1580
60-64
3340
2250
UN - Male
SA 1997
SA 2004
UN - Female
SA 1997
SA 2004
15-19
210
235
216
150
165
187
20-24
340
381
555
205
331
1085
25-29
395
625
1081
300
452
1985
30-34
460
817
2118
360
489
2267
35-39
600
916
2498
405
526
1890
40-44
800
1136
2765
500
615
1548
45-49
1100
1486
2744
700
800
1400
50-54
1600
2016
2979
1050
1116
1506
55-54
2300
2838
3270
1580
1626
1717
60-64
3340
3614
4146
2250
2201
2360
Stroke
ill-defined heart disease
Diabetes mellitus
Ischaemic heart disease
Hypertension
Nephritisnephrosis
Stroke
ill-defined heart disease
Diabetes mellitus
Ischaemic heart disease
Hypertension
Nephritisnephrosis
1999
34
345
20
248
14
10
1999
295
246
23
10
145
68
2000
36
362
218
249
152
112
2000
318
268
241
108
16
8
2001
35
372
22
25
15
125
2001
322
28
252
102
162
95
2002
405
298
24
26
147
126
2002
352
295
27
115
16
10
2003
425
32
245
285
152
15
2003
382
299
285
122
17
12
2004
39
325
255
26
165
16
2004
35
30
295
121
19
119
2005
36
328
265
26
15
162
2005
325
30
32
12
18
12
2006
35
336
27
258
155
16
2006
33
32
32
11
18
125
COPD
Asthma
Tracheabronchial lung cancer
Oesophageal cancer
prostate cancer
Cervical cancer
Breast cancer
1999
2001
12
135
10
26
2000
204
116
13
92
28
2001
222
131
133
96
27
2002
23
144
128
95
285
2003
243
149
124
94
29
2004
229
154
1255
87
29
2005
224
152
122
82
295
2006
224
136
116
75
3
COPD
Asthma
Tracheabronchial lung cancer
Oesophageal cancer
Prostate cancer
Cervical cancer
Breast cancer
1999
88
92
43
41
106
82
2000
96
95
4
43
11
81
2001
10
109
4
4
111
89
2002
10
116
4
4
112
85
2003
11
124
4
395
116
85
2004
102
1295
44
39
115
101
2005
105
128
42
38
1185
10
2006
10
12
42
32
1205
10
Based on this survey the researchers estimate that 109 of all South Africans over 2 years old were living with HIV in 2008 In 2002 and 2005 this figure was 114 and 108 respectively showing a degree of stabilisation Among those between 15 and 49 years old the estimated HIV prevalence was 169 in 2008 The survey found the prevalence among children aged 2-14 to be 25 down significantly since 2002 when prevalence was 56
Estimated HIV prevalence () among South Africans aged 2 years and older by age 2002-2008
Age
HIV +
HIV -
Children (2-14 years)
25
975
Youth (15-24 years)
87
913
Adults (25 and older)
168
832
(15-49 years)
169
831
Total (2 and older)
109
891
Estimated HIV prevalence among South Africans by age and sex 2008
Age
Male prevalence
Female prevalence
2-14
3
2
15-19
25
67
20-24
51
211
25-29
157
327
30-34
258
291
35-39
185
248
40-44
192
163
45-49
64
141
50-54
104
102
55-59
62
77
60+
35
18
Total
79
136
Among females HIV prevalence is highest in those between 25 and 29 years old among males the peak is in the group aged 30-34 years
HIV prevalence () by province 2002-2008
Province
2002
2005
2008
KwaZulu-Natal
117
165
158
Mpumalanga
141
152
154
Free State
149
126
126
North West
103
109
113
Gauteng
147
108
103
Eastern Cape
66
89
9
Limpopo
98
8
88
Northern Cape
84
54
59
Western Cape
107
19
38
National
114
108
109
The results of this study suggest that KwaZulu-Natal Mpumulanga and Free State have the highest HIV prevalence However the relatively small sample sizes may limit precision and in several cases the ranges of uncertainty overlap
HIV prevalence by population group 2008
Population group
Prevalence ()
African
136
864
White
03
997
Coloured
17
983
Indian
03
997
Studies of AIDS deaths
Latin America
Latin America
Latin America
Latin America
North America
North America
North America
North America
Eastern Europe
Eastern Europe
Eastern Europe
Eastern Europe
Western Europe
Western Europe
Western Europe
Western Europe
Asia Pacific
Asia Pacific
Asia Pacific
Asia Pacific
Africa
Africa
Africa
Africa
Country
Study starts
Subjects randomised
SubjectsStudy
USA
32
4385
13703125
Russia
20
788
394
Germany
19
1883
991052631579
UK
13
265
203846153846
South Africa
12
347
289166666667
Argentina
12
329
274166666667
Australia
11
195
177272727273
India
7
275
392857142857
Brazil
3
115
383333333333
Country
Initiation
Site activation
Recruitment
LOC setup
Unproductive sites
(Approval ndash FCI)
(FCI ndash FSFV)
(FSFV ndash LSFV)
(CPC ndash FSFV)
South Africa
19
38
153
357
21
Australia
117
63
401
239
11
Germany
16
37
401
224
21
UK
9
101
301
346
20
Russia
11
52
174
334
9
India
31
28
389
431
3
Argentina
94
67
288
32
13
Brazil
79
59
94
656
20
USA
44
31
149
26
Country
Pts Rand
Sites
Av CPP
Cost Per Country
Ethics Subm
Regulatory Fees
Add Inv Fees
CT Scan Total
Ethics + Regulatory
Total Regulatory Fees
South Africa
25
5
7250
181250
290
460
363
0
750
1113
Canada
18
4
832545
14985818
181818
0
0
1557576
181818
1818
Italy
7
2
10000
70000
2200
0
0
0
2200
2200
Germany
55
10
7000
385000
3000
0
0
12000
3000
3000
Peru
40
5
7000
280000
1500
1000
2000
60000
2500
4500
Poland
15
4
10000
150000
0
2500
2400
0
2500
4900
Spain
40
7
10500
420000
0
0
5450
0
0
5450
UK
12
4
13000
156000
0
0
5556
0
0
5556
Bulgaria
18
4
10000
180000
0
5000
1000
0
5000
6000
Taiwan
20
4
1179649
2359298
104167
313
5208
0
135467
6563
Czech Rep
10
2
10000
100000
1500
3000
3000
0
4500
7500
Greece
40
7
9000
360000
0
7500
0
0
7500
7500
Chile
15
4
10840
162600
1700
3600
3000
0
5300
8300
Belgium
25
6
12200
305000
3992
4332
0
0
8324
8324
Korea
30
3
10827
324802
1114
0
14324
0
1114
15438
Singapore
10
2
11565
115650
1750
0
17975
0
1750
19725
France
50
10
9000
450000
0
0
20000
0
0
20000
China
39
5
4978
194142
5224
0
39814
0
5224
40336
New Zealand
10
3
145244
145244
1973
0
43123
0
1973
45096
Israel
10
6
11140
111400
2060
3000
48400
16500
5060
53460
Brazil
30
6
10000
300000
2000
287356
5649202
0
487356
61366
Australia
24
6
40200
964800
0
500
82500
0
500
83000
23
543
109
532856799
3304716
26939
27700043
73748966
[1753EURO x 14 (ex rate) = $2454] [ $245416 hours=$153hour]
1095625
1095625
12271
1753
198089
198089
208514736842
South Africa
Canada
Italy
Germany
Peru
Poland
Spain
UK
Bulgaria
Taiwan
Czech Rep
Greece
Chile
Belgium
Korea
Singapore
France
China
New Zealand
Israel
Brazil
Australia
Country
Study starts
Subjects randomised
SubjectsStudy
USA
32
4385
13703125
Russia
20
788
394
Germany
19
1883
991052631579
UK
13
265
203846153846
South Africa
12
347
289166666667
Argentina
12
329
274166666667
Australia
11
195
177272727273
India
7
275
392857142857
Brazil
3
115
383333333333
Country
Initiation
Site activation
Recruitment
LOC setup
Unproductive sites
(Approval ndash FCI)
(FCI ndash FSFV)
(FSFV ndash LSFV)
(CPC ndash FSFV)
South Africa
19
38
153
357
21
Australia
117
63
401
239
11
Germany
16
37
401
224
21
UK
9
101
301
346
20
Russia
11
52
174
334
9
India
31
28
389
431
3
Argentina
94
67
288
32
13
Brazil
79
59
94
656
20
USA
44
31
149
26
Country
Pts Rand
Sites
Av CPP
Cost Per Country
Ethics Subm
Regulatory Fees
Add Inv Fees
CT Scan Total
Ethics + Regulatory
Total Regulatory Fees
China
39
5
4978
194142
522
0
39814
0
522
40336
Germany
55
10
7000
385000
3000
0
0
12000
3000
3000
Peru
40
5
7000
280000
1500
1000
2000
60000
2500
4500
South Africa
25
5
7250
181250
290
460
363
0
750
1113
Canada
18
4
8325
149858
1818
0
0
1557576
1818
1818
Greece
40
7
9000
360000
0
7500
0
0
7500
7500
France
50
10
9000
450000
0
0
20000
0
0
20000
Italy
7
2
10000
70000
2200
0
0
0
2200
2200
Poland
15
4
10000
150000
0
2500
2400
0
2500
4900
Bulgaria
18
4
10000
180000
0
5000
1000
0
5000
6000
Czech Rep
10
2
10000
100000
1500
3000
3000
0
4500
7500
Brazil
30
6
10000
300000
2000
2874
56492
0
4874
61366
Spain
40
7
10500
420000
0
0
5450
0
0
5450
Korea
30
3
10827
324802
1114
0
14324
0
1114
15438
Chile
15
4
10840
162600
1700
3600
3000
0
5300
8300
Israel
10
6
11140
111400
2060
3000
48400
16500
5060
53460
Singapore
10
2
11565
115650
1750
0
17975
0
1750
19725
Taiwan
20
4
11796
235930
1042
313
5208
0
1355
6563
Belgium
25
6
12200
305000
3992
4332
0
0
8324
8324
UK
12
4
13000
156000
0
0
5556
0
0
5556
New Zealand
10
3
14524
145244
1973
0
43123
0
1973
45096
Australia
24
6
40200
964800
0
500
82500
0
500
83000
23
543
109
5328568
33047
26939
277000
73748966
[1753EURO x 14 (ex rate) = $2454] [ $245416 hours=$153hour]
110
1095625
1227
1753
19809
20
21
China
Germany
Peru
South Africa
Canada
Greece
France
Italy
Poland
Bulgaria
Czech Rep
Brazil
Spain
Korea
Chile
Israel
Singapore
Taiwan
Belgium
UK
New Zealand
Australia
Population Group
IndianAsianOther
26
Mixed ethnicity
90
Caucasian
91
African
793
10000
IndianAsianOther
Mixed ethnicity
Caucasian
African
6
Perceptions of Africa
7
8
or helliphellip
9
10
11
or helliphellip
12
13
14
15
South African Trials
Whistle-Stop Tour
16
bull Ethnically a ldquoRainbow Nationrdquo
bull Populations representative of Africa Europe and Asia
17
Population 5495-million 1-Jul-2015 estimate
SA urbanrural profile
18
Cape Town Port Elizabeth
Durban
Pretoria
Joburg
Bloemfontein
Distribution of clinical trial sites
George
East London
Nelspruit
Richardrsquos Bay Kimberley
Welkom
19
Source Statistics South Africa 2015
3
9
979
IndianAsianOtherMixed ethnicityCaucasianAfrican
bull Young 44 aged lt 20 yrs bull Elderly 76 aged gt 60 yrs bull High number of treatment-naiumlve patients
SA Demographics
Chart1
9
0026
009
0091
0793
Sheet1
Sheet1
Sheet2
Sheet3
20
South Africa Leading Causes of Death
00
20
40
60
80
100
120
140 The ten leading underlying natural causes of death in South Africa (2009)
percentage
TB Flu amp Intest Heart Cereb Diab HIV HT Chron Immun Pneum Infect Other Vasc Mell Dis LRT Dis
Stats SA Rel P03093 Mortality and causes of death in South Africa 2009 Findings from death notification Nov-2011
Age group
TB 0-14 15-49 50-64 65+
Rank Rank Rank Rank
5 34 1 196 1 114 8 33
24
bull Well established research infrastructure bull Public and private sectors
28 teaching hospitals gt40000 tertiary care beds 140 private hospitals gt30000 beds 15 - 18 medical insurance
bull Large broad-based investigator database amp site networks bull Specialised Early Phase presence since 1970s bull GCPGLP and CLIA 88 compliant labs bull Specialist labs (biomarkers TB immunology
PKbioassay) bull Full support services (GMP-depots translations etc) bull Stringent ICH-compliant RAEC review policies
GCP is a legal requirement Informed Consent entrenched in Constitution
South Africa Advantages
25
bull Reliable (+) roads air links energy connectivity bull European Time bull Research language is English bull Inverse seasons bull Cost Currency bull Mobile-phone enabled obsessed population
South Africa Advantages
26
South Africa Track Record
bull Phase I-III data from SA included in hundreds of US amp European registration dossiers
bull Two entire NDA dossiers ndash rifapentine 1998 ndash tryptorelin (GnRH agonist) 2001) comprised SA data
bull 37 FDA inspections 1994-2009 1 OAI (27)
27
Therapeutic Indications
28
0
1
2
3
4
5
6
7
8
9
10
Belg
ium
Au
stria
Li
thua
nia
Can
ada
Luxe
mbo
urg
Mal
ta
Nor
way
Po
rtuga
l R
oman
ia
Rus
sia
Serb
ia
Swed
en
The
Net
herla
nds
USA
loca
l site
s U
SA c
entra
l site
C
zech
Rep
ublic
D
enm
ark
Esto
nia
Finl
and
Hun
gary
Ic
elan
d Ire
land
La
tvia
G
erm
any
Switz
erla
nd
Liec
hten
stei
n U
nite
d Ki
ngdo
m
Fran
ce
Italy
Au
stra
lia
Hon
g-Ko
ng
New
Zea
land
Si
ngap
ore
Taiw
an
Uga
nda
Pola
nd
Ukr
aine
C
hile
G
uate
mal
a Ja
pan
Isra
el
Slov
akia
Bu
lgar
ia
Gre
ece
Mal
aysi
a Ph
ilipp
ines
Pe
ru
Thai
land
Tu
rkey
Sl
oven
ia
Cos
ta R
ica
Mex
ico
Spai
n So
uth
Afric
a Ar
gent
ina
Sout
h Ko
rea
Col
ombi
a Pa
nam
a C
roat
ia
Indi
a Ve
nezu
ela
Braz
il C
hina
Mon
ths
Sout
h Afri
ca
Global Regulatory Review Timelines
Triclinium experience 2009-2015
Triclinium experience 2009 - 2015
29
Protocol release Country selection
Site Selection Collection of reg docs
Submission of RA application
EC application
Negotiate Site Contracts
EC Approvals
RA Approval amp Import permit
Site Initiation Import amp distribute drug
Import ancillary supplies Set up local labs
Set up EDC
Months
0
1
2
3
All EC approvals typically within 6
weeks
Site contracts signed within days
As soon as MCC approval obtained ALL sites can be initiated
Start-Up Activities in PARALLEL
GMO application (biologics)
30
0
2000
4000
6000
8000
10000
12000
14000C
hina
Ger
man
y
Per
u
Sou
th A
frica
Can
ada
Gre
ece
Fran
ce
Italy
Pol
and
Bul
garia
Cze
ch R
ep
Bra
zil
Spa
in
Kor
ea
Chi
le
Isra
el
Sin
gapo
re
Taiw
an
Bel
gium U
K
New
hellip
Aus
tralia
Source Bayer Presented SACRA Conference 2009
Aver
age
cost
per
pat
ient
(Eur
o)
Average Cost per Enrolled Participant
gt40000
Chart1
Average Cost Per Patient (Euro)
4978
7000
7000
7250
832545
9000
9000
10000
10000
10000
10000
10000
10500
10827
10840
11140
11565
1179649
12200
13000
145244
40200
Sheet1
Sheet2
Sheet2
Average Cost Per Patient (Euro)
Average Cost Per Patient
Sheet4
Ethics Subm
Regulatory Fees
Sheet3
Ethics + Regulatory
Total Ethics and Regulatory Fees
Add Inv Fees
Additional Investigator Application Fees
Total Regulatory Fees
Study starts
SubjectsStudy
31
Euro
0
10000
20000
30000
40000
50000
60000
70000
80000
90000S
outh
Afri
caC
anad
a
Italy
Ger
man
yP
eru
Pol
and
Spa
in UK
Bul
garia
Taiw
anC
zech
Rep
Gre
ece
Chi
leB
elgi
umK
orea
Sin
gapo
reFr
ance
Chi
naN
ew Z
eala
ndIs
rael
Bra
zil
Aus
tralia
Source Bayer Presented SACRA Conference 2009
Eur
os
Regulatory Application Fees
Chart1
Total Regulatory Fees
1113
181818
2200
3000
4500
4900
5450
5556
6000
656267
7500
7500
8300
8324
15438
19725
20000
403364
45096
53460
6136558
83000
Sheet1
Sheet2
Sheet2
Average Cost Per Patient (Euro)
Average Cost Per Patient
Sheet4
Ethics Subm
Regulatory Fees
Sheet3
Ethics + Regulatory
Total Ethics and Regulatory Fees
Add Inv Fees
Additional Investigator Application Fees
Total Regulatory Fees
Study starts
SubjectsStudy
32
SA Clinical Trial Regulatory Processes
Governed by SA-GCP and Declaration of Helsinki SA National Clinical Trials Register (SANCTR) Medicines Control Council (National Regulatory Authority)
o New protocols o Amendments o Additional sitesinvestigators
Ethics Committees (33 NHREC-registered) RegionalMunicipal DoH Export permits for bio samples (Nat Health Act 2003)
Clinical Trial Density Active sites million population
Nature Reviews Drug Discovery 7 13-14 (January 2008)
France 503
Germany 512 Canada
922
USA 1203
Czech Republic 776
553 sites
South Africa 119
757 sites
757 sites
533 sites
1084 sites
Argentina 269
Russia 77
China 04
India 07
34
Gateway to Africa
35
Why Africa bull Large accessible population relatively new to clinical trials
bull Experienced and willing investigators
bull Many clinical trial sites established by PDPs NGOs etc
bull Expanding therapeutic areas shifting burden of disease from
infectious to non-communicable diseases
bull Significantly improved infrastructure and accessibility
bull Rapidly evolving regulatory and ethics procedures
bull Potential for capacity building and sustainable clinical trial potential
36
Relatively young GCP culture Resident mentorships to build capacity Locations ndash accessibility for site monitoring Variable infrastructure esp electricity connectivity and
transportation Resourcing of public healthcare systems
Sub-Saharan Africa challenges
37
bull Second-largest continent
bull Spans NS and EW hemispheres
bull Second most populous continent 2014 estimate 1069 billion
bull Home to more than a quarter of the 196 independent countries
bull All 54 African countries are UN members
bull 39 urban population
bull 12 metropolitan areas gt 4m
bull gt 3000 distinct ethnicities
bull gt 2000 languages spoken
AFRICA hellip the true size
wwwcitypopulationdeworldAgglomerations 2015
38
SSV to SIV
0
5
10
15
20
25
30
35
40
45
Africa North America
Asia Pacific
Western Europe
Eastern Europe
Latin America
Source Quintiles South Africa SACRA Conference 2008
Wee
ks (A
vera
ge)
Start-Up Timelines
39
Region Median
Patients Site
of Sites
0 pts 1 - 3 pts 4 - 9 pts 10+ pts
Latin America 40 21 26 30 23
North America 30 29 29 24 18
Eastern Europe 60 15 31 26 27
Western Europe 40 15 22 29 34
Asia Pacific 40 19 30 34 18
Africa 100 4 17 28 51
Enrollment performance by region for 2008
Site Performance
Source Quintiles South Africa Presented SACRA Conference 2009
40
0 1 2 3 4 5 6 7 8 9
10
Latin America
North America
Eastern Europe
Western Europe
Asia Pacific
Africa
Num
ber o
f par
ticip
ants
MEDIAN site enrollment by region for 2008
Source Quintiles South Africa Presented SACRA Conference 2009
Site Performance
41
Source Quintiles South Africa Presented SACRA Conference 2009
s
ites
0
5
10
15
20
25
30
35
40
45
50
LatinAmerica
NorthAmerica
EasternEurope
WesternEurope
Asia Pacific Africa
0 pts
1 - 3 pts
4 - 9 pts
10+ pts
Enrollment performance by region for 2008
Site Performance
Chart1
0 pts
1 - 3 pts
4 - 9 pts
10+ pts
021
026
03
023
029
029
024
018
015
031
026
027
015
022
029
034
019
03
034
018
004
017
028
051
HIV
HIV
Resiratory amp Cancer
Male prevalence
Female prevalence
CVS
Overall death rates
Overall death rates
COPD
Asthma
Tracheabronchial lung cancer
Oesophageal cancer
prostate cancer
Trial metrics
COPD
Asthma
Tracheabronchial lung cancer
Oesophageal cancer
Prostate cancer
Cervical cancer
Breast cancer
Stroke
ill-defined heart disease
Diabetes mellitus
Ischaemic heart disease
Hypertension
Nephritisnephrosis
Stroke
ill-defined heart disease
Diabetes mellitus
Ischaemic heart disease
Hypertension
Nephritisnephrosis
Males
Female
UN - Male
SA 1997
SA 2004
UN - Female
SA 1997
SA 2004
0 pts
1 - 3 pts
4 - 9 pts
10+ pts
42
Source wwwclinicaltrialsgov 22-Oct-2010
Clinical trials registered across Africa
43
0
500
1000
1500
2000
2500
South Africa Kenya Malawi Tanzania Uganda Zambia
Selected African countries
2005
2010
2015
Source ClinTrialsgov
Trend 2005 - 2015
Source wwwclinicaltrialsgov 28-Aug-2015
44
AFRICA FOUND IN TRANSLATION
bull Vast treatment-naiumlve population bull Cost advantages (still) bull Diverse ethnicity amp morbidity bull Inverse seasonality bull Site capacity-building widely implemented bull Robust regulatory review bull Variable but generally good regulatory timelines bull Established GCP culture ndash sites and home-bred CROs
45
THANK YOU
Foliennummer 1
Triclinium A South African CRO
Collaboration with VPM SII
Vaccine Trials in SA 2015
Foliennummer 5
Foliennummer 6
Foliennummer 7
Foliennummer 8
Foliennummer 9
Foliennummer 10
Foliennummer 11
Foliennummer 12
Foliennummer 13
Foliennummer 14
Foliennummer 15
Foliennummer 16
Foliennummer 17
Distribution of clinical trial sites
Foliennummer 19
South Africa Leading Causes of Death
Foliennummer 21
Foliennummer 22
South Africa TB deaths by age group
Foliennummer 24
Foliennummer 25
Foliennummer 26
Foliennummer 27
Foliennummer 28
Foliennummer 29
Foliennummer 30
Foliennummer 31
SA Clinical Trial Regulatory Processes
Clinical Trial Density Active sites million population
Foliennummer 34
Why Africa
Foliennummer 36
AFRICA hellip the true size
SSV to SIV
Foliennummer 39
Foliennummer 40
Foliennummer 41
Foliennummer 42
Foliennummer 43
AFRICA FOUND IN TRANSLATION
Foliennummer 45
Region
Median
of Sites
Patients Site
0 pts
1 - 3 pts
4 - 9 pts
10+ pts
Latin America
4
21
26
30
23
North America
3
29
29
24
18
Eastern Europe
6
15
31
26
27
Western Europe
4
15
22
29
34
Asia Pacific
4
19
30
34
18
Africa
10
4
17
28
51
0 pts
1 - 3 pts
4 - 9 pts
10+ pts
Latin America
21
26
30
23
North America
29
29
24
18
Eastern Europe
15
31
26
27
Western Europe
15
22
29
34
Asia Pacific
19
30
34
18
Africa
4
17
28
51
Males
Female
15-19
210
150
20-24
340
205
25-29
395
300
30-34
460
360
35-39
600
405
40-44
800
500
45-49
1100
700
50-54
1600
1050
55-54
2300
1580
60-64
3340
2250
UN - Male
SA 1997
SA 2004
UN - Female
SA 1997
SA 2004
15-19
210
235
216
150
165
187
20-24
340
381
555
205
331
1085
25-29
395
625
1081
300
452
1985
30-34
460
817
2118
360
489
2267
35-39
600
916
2498
405
526
1890
40-44
800
1136
2765
500
615
1548
45-49
1100
1486
2744
700
800
1400
50-54
1600
2016
2979
1050
1116
1506
55-54
2300
2838
3270
1580
1626
1717
60-64
3340
3614
4146
2250
2201
2360
Stroke
ill-defined heart disease
Diabetes mellitus
Ischaemic heart disease
Hypertension
Nephritisnephrosis
Stroke
ill-defined heart disease
Diabetes mellitus
Ischaemic heart disease
Hypertension
Nephritisnephrosis
1999
34
345
20
248
14
10
1999
295
246
23
10
145
68
2000
36
362
218
249
152
112
2000
318
268
241
108
16
8
2001
35
372
22
25
15
125
2001
322
28
252
102
162
95
2002
405
298
24
26
147
126
2002
352
295
27
115
16
10
2003
425
32
245
285
152
15
2003
382
299
285
122
17
12
2004
39
325
255
26
165
16
2004
35
30
295
121
19
119
2005
36
328
265
26
15
162
2005
325
30
32
12
18
12
2006
35
336
27
258
155
16
2006
33
32
32
11
18
125
COPD
Asthma
Tracheabronchial lung cancer
Oesophageal cancer
prostate cancer
Cervical cancer
Breast cancer
1999
2001
12
135
10
26
2000
204
116
13
92
28
2001
222
131
133
96
27
2002
23
144
128
95
285
2003
243
149
124
94
29
2004
229
154
1255
87
29
2005
224
152
122
82
295
2006
224
136
116
75
3
COPD
Asthma
Tracheabronchial lung cancer
Oesophageal cancer
Prostate cancer
Cervical cancer
Breast cancer
1999
88
92
43
41
106
82
2000
96
95
4
43
11
81
2001
10
109
4
4
111
89
2002
10
116
4
4
112
85
2003
11
124
4
395
116
85
2004
102
1295
44
39
115
101
2005
105
128
42
38
1185
10
2006
10
12
42
32
1205
10
Based on this survey the researchers estimate that 109 of all South Africans over 2 years old were living with HIV in 2008 In 2002 and 2005 this figure was 114 and 108 respectively showing a degree of stabilisation Among those between 15 and 49 years old the estimated HIV prevalence was 169 in 2008 The survey found the prevalence among children aged 2-14 to be 25 down significantly since 2002 when prevalence was 56
Estimated HIV prevalence () among South Africans aged 2 years and older by age 2002-2008
Age
HIV +
HIV -
Children (2-14 years)
25
975
Youth (15-24 years)
87
913
Adults (25 and older)
168
832
(15-49 years)
169
831
Total (2 and older)
109
891
Estimated HIV prevalence among South Africans by age and sex 2008
Age
Male prevalence
Female prevalence
2-14
3
2
15-19
25
67
20-24
51
211
25-29
157
327
30-34
258
291
35-39
185
248
40-44
192
163
45-49
64
141
50-54
104
102
55-59
62
77
60+
35
18
Total
79
136
Among females HIV prevalence is highest in those between 25 and 29 years old among males the peak is in the group aged 30-34 years
HIV prevalence () by province 2002-2008
Province
2002
2005
2008
KwaZulu-Natal
117
165
158
Mpumalanga
141
152
154
Free State
149
126
126
North West
103
109
113
Gauteng
147
108
103
Eastern Cape
66
89
9
Limpopo
98
8
88
Northern Cape
84
54
59
Western Cape
107
19
38
National
114
108
109
The results of this study suggest that KwaZulu-Natal Mpumulanga and Free State have the highest HIV prevalence However the relatively small sample sizes may limit precision and in several cases the ranges of uncertainty overlap
HIV prevalence by population group 2008
Population group
Prevalence ()
African
136
864
White
03
997
Coloured
17
983
Indian
03
997
Studies of AIDS deaths
Latin America
Latin America
Latin America
Latin America
North America
North America
North America
North America
Eastern Europe
Eastern Europe
Eastern Europe
Eastern Europe
Western Europe
Western Europe
Western Europe
Western Europe
Asia Pacific
Asia Pacific
Asia Pacific
Asia Pacific
Africa
Africa
Africa
Africa
Country
Study starts
Subjects randomised
SubjectsStudy
USA
32
4385
13703125
Russia
20
788
394
Germany
19
1883
991052631579
UK
13
265
203846153846
South Africa
12
347
289166666667
Argentina
12
329
274166666667
Australia
11
195
177272727273
India
7
275
392857142857
Brazil
3
115
383333333333
Country
Initiation
Site activation
Recruitment
LOC setup
Unproductive sites
(Approval ndash FCI)
(FCI ndash FSFV)
(FSFV ndash LSFV)
(CPC ndash FSFV)
South Africa
19
38
153
357
21
Australia
117
63
401
239
11
Germany
16
37
401
224
21
UK
9
101
301
346
20
Russia
11
52
174
334
9
India
31
28
389
431
3
Argentina
94
67
288
32
13
Brazil
79
59
94
656
20
USA
44
31
149
26
Country
Pts Rand
Sites
Av CPP
Cost Per Country
Ethics Subm
Regulatory Fees
Add Inv Fees
CT Scan Total
Ethics + Regulatory
Total Regulatory Fees
South Africa
25
5
7250
181250
290
460
363
0
750
1113
Canada
18
4
832545
14985818
181818
0
0
1557576
181818
1818
Italy
7
2
10000
70000
2200
0
0
0
2200
2200
Germany
55
10
7000
385000
3000
0
0
12000
3000
3000
Peru
40
5
7000
280000
1500
1000
2000
60000
2500
4500
Poland
15
4
10000
150000
0
2500
2400
0
2500
4900
Spain
40
7
10500
420000
0
0
5450
0
0
5450
UK
12
4
13000
156000
0
0
5556
0
0
5556
Bulgaria
18
4
10000
180000
0
5000
1000
0
5000
6000
Taiwan
20
4
1179649
2359298
104167
313
5208
0
135467
6563
Czech Rep
10
2
10000
100000
1500
3000
3000
0
4500
7500
Greece
40
7
9000
360000
0
7500
0
0
7500
7500
Chile
15
4
10840
162600
1700
3600
3000
0
5300
8300
Belgium
25
6
12200
305000
3992
4332
0
0
8324
8324
Korea
30
3
10827
324802
1114
0
14324
0
1114
15438
Singapore
10
2
11565
115650
1750
0
17975
0
1750
19725
France
50
10
9000
450000
0
0
20000
0
0
20000
China
39
5
4978
194142
5224
0
39814
0
5224
40336
New Zealand
10
3
145244
145244
1973
0
43123
0
1973
45096
Israel
10
6
11140
111400
2060
3000
48400
16500
5060
53460
Brazil
30
6
10000
300000
2000
287356
5649202
0
487356
61366
Australia
24
6
40200
964800
0
500
82500
0
500
83000
23
543
109
532856799
3304716
26939
27700043
73748966
[1753EURO x 14 (ex rate) = $2454] [ $245416 hours=$153hour]
1095625
1095625
12271
1753
198089
198089
208514736842
South Africa
Canada
Italy
Germany
Peru
Poland
Spain
UK
Bulgaria
Taiwan
Czech Rep
Greece
Chile
Belgium
Korea
Singapore
France
China
New Zealand
Israel
Brazil
Australia
Country
Study starts
Subjects randomised
SubjectsStudy
USA
32
4385
13703125
Russia
20
788
394
Germany
19
1883
991052631579
UK
13
265
203846153846
South Africa
12
347
289166666667
Argentina
12
329
274166666667
Australia
11
195
177272727273
India
7
275
392857142857
Brazil
3
115
383333333333
Country
Initiation
Site activation
Recruitment
LOC setup
Unproductive sites
(Approval ndash FCI)
(FCI ndash FSFV)
(FSFV ndash LSFV)
(CPC ndash FSFV)
South Africa
19
38
153
357
21
Australia
117
63
401
239
11
Germany
16
37
401
224
21
UK
9
101
301
346
20
Russia
11
52
174
334
9
India
31
28
389
431
3
Argentina
94
67
288
32
13
Brazil
79
59
94
656
20
USA
44
31
149
26
Country
Pts Rand
Sites
Av CPP
Cost Per Country
Ethics Subm
Regulatory Fees
Add Inv Fees
CT Scan Total
Ethics + Regulatory
Total Regulatory Fees
China
39
5
4978
194142
522
0
39814
0
522
40336
Germany
55
10
7000
385000
3000
0
0
12000
3000
3000
Peru
40
5
7000
280000
1500
1000
2000
60000
2500
4500
South Africa
25
5
7250
181250
290
460
363
0
750
1113
Canada
18
4
8325
149858
1818
0
0
1557576
1818
1818
Greece
40
7
9000
360000
0
7500
0
0
7500
7500
France
50
10
9000
450000
0
0
20000
0
0
20000
Italy
7
2
10000
70000
2200
0
0
0
2200
2200
Poland
15
4
10000
150000
0
2500
2400
0
2500
4900
Bulgaria
18
4
10000
180000
0
5000
1000
0
5000
6000
Czech Rep
10
2
10000
100000
1500
3000
3000
0
4500
7500
Brazil
30
6
10000
300000
2000
2874
56492
0
4874
61366
Spain
40
7
10500
420000
0
0
5450
0
0
5450
Korea
30
3
10827
324802
1114
0
14324
0
1114
15438
Chile
15
4
10840
162600
1700
3600
3000
0
5300
8300
Israel
10
6
11140
111400
2060
3000
48400
16500
5060
53460
Singapore
10
2
11565
115650
1750
0
17975
0
1750
19725
Taiwan
20
4
11796
235930
1042
313
5208
0
1355
6563
Belgium
25
6
12200
305000
3992
4332
0
0
8324
8324
UK
12
4
13000
156000
0
0
5556
0
0
5556
New Zealand
10
3
14524
145244
1973
0
43123
0
1973
45096
Australia
24
6
40200
964800
0
500
82500
0
500
83000
23
543
109
5328568
33047
26939
277000
73748966
[1753EURO x 14 (ex rate) = $2454] [ $245416 hours=$153hour]
110
1095625
1227
1753
19809
20
21
China
Germany
Peru
South Africa
Canada
Greece
France
Italy
Poland
Bulgaria
Czech Rep
Brazil
Spain
Korea
Chile
Israel
Singapore
Taiwan
Belgium
UK
New Zealand
Australia
Population Group
IndianAsianOther
26
Mixed ethnicity
90
Caucasian
91
African
793
10000
IndianAsianOther
Mixed ethnicity
Caucasian
African
7
8
or helliphellip
9
10
11
or helliphellip
12
13
14
15
South African Trials
Whistle-Stop Tour
16
bull Ethnically a ldquoRainbow Nationrdquo
bull Populations representative of Africa Europe and Asia
17
Population 5495-million 1-Jul-2015 estimate
SA urbanrural profile
18
Cape Town Port Elizabeth
Durban
Pretoria
Joburg
Bloemfontein
Distribution of clinical trial sites
George
East London
Nelspruit
Richardrsquos Bay Kimberley
Welkom
19
Source Statistics South Africa 2015
3
9
979
IndianAsianOtherMixed ethnicityCaucasianAfrican
bull Young 44 aged lt 20 yrs bull Elderly 76 aged gt 60 yrs bull High number of treatment-naiumlve patients
SA Demographics
Chart1
9
0026
009
0091
0793
Sheet1
Sheet1
Sheet2
Sheet3
20
South Africa Leading Causes of Death
00
20
40
60
80
100
120
140 The ten leading underlying natural causes of death in South Africa (2009)
percentage
TB Flu amp Intest Heart Cereb Diab HIV HT Chron Immun Pneum Infect Other Vasc Mell Dis LRT Dis
Stats SA Rel P03093 Mortality and causes of death in South Africa 2009 Findings from death notification Nov-2011
Age group
TB 0-14 15-49 50-64 65+
Rank Rank Rank Rank
5 34 1 196 1 114 8 33
24
bull Well established research infrastructure bull Public and private sectors
28 teaching hospitals gt40000 tertiary care beds 140 private hospitals gt30000 beds 15 - 18 medical insurance
bull Large broad-based investigator database amp site networks bull Specialised Early Phase presence since 1970s bull GCPGLP and CLIA 88 compliant labs bull Specialist labs (biomarkers TB immunology
PKbioassay) bull Full support services (GMP-depots translations etc) bull Stringent ICH-compliant RAEC review policies
GCP is a legal requirement Informed Consent entrenched in Constitution
South Africa Advantages
25
bull Reliable (+) roads air links energy connectivity bull European Time bull Research language is English bull Inverse seasons bull Cost Currency bull Mobile-phone enabled obsessed population
South Africa Advantages
26
South Africa Track Record
bull Phase I-III data from SA included in hundreds of US amp European registration dossiers
bull Two entire NDA dossiers ndash rifapentine 1998 ndash tryptorelin (GnRH agonist) 2001) comprised SA data
bull 37 FDA inspections 1994-2009 1 OAI (27)
27
Therapeutic Indications
28
0
1
2
3
4
5
6
7
8
9
10
Belg
ium
Au
stria
Li
thua
nia
Can
ada
Luxe
mbo
urg
Mal
ta
Nor
way
Po
rtuga
l R
oman
ia
Rus
sia
Serb
ia
Swed
en
The
Net
herla
nds
USA
loca
l site
s U
SA c
entra
l site
C
zech
Rep
ublic
D
enm
ark
Esto
nia
Finl
and
Hun
gary
Ic
elan
d Ire
land
La
tvia
G
erm
any
Switz
erla
nd
Liec
hten
stei
n U
nite
d Ki
ngdo
m
Fran
ce
Italy
Au
stra
lia
Hon
g-Ko
ng
New
Zea
land
Si
ngap
ore
Taiw
an
Uga
nda
Pola
nd
Ukr
aine
C
hile
G
uate
mal
a Ja
pan
Isra
el
Slov
akia
Bu
lgar
ia
Gre
ece
Mal
aysi
a Ph
ilipp
ines
Pe
ru
Thai
land
Tu
rkey
Sl
oven
ia
Cos
ta R
ica
Mex
ico
Spai
n So
uth
Afric
a Ar
gent
ina
Sout
h Ko
rea
Col
ombi
a Pa
nam
a C
roat
ia
Indi
a Ve
nezu
ela
Braz
il C
hina
Mon
ths
Sout
h Afri
ca
Global Regulatory Review Timelines
Triclinium experience 2009-2015
Triclinium experience 2009 - 2015
29
Protocol release Country selection
Site Selection Collection of reg docs
Submission of RA application
EC application
Negotiate Site Contracts
EC Approvals
RA Approval amp Import permit
Site Initiation Import amp distribute drug
Import ancillary supplies Set up local labs
Set up EDC
Months
0
1
2
3
All EC approvals typically within 6
weeks
Site contracts signed within days
As soon as MCC approval obtained ALL sites can be initiated
Start-Up Activities in PARALLEL
GMO application (biologics)
30
0
2000
4000
6000
8000
10000
12000
14000C
hina
Ger
man
y
Per
u
Sou
th A
frica
Can
ada
Gre
ece
Fran
ce
Italy
Pol
and
Bul
garia
Cze
ch R
ep
Bra
zil
Spa
in
Kor
ea
Chi
le
Isra
el
Sin
gapo
re
Taiw
an
Bel
gium U
K
New
hellip
Aus
tralia
Source Bayer Presented SACRA Conference 2009
Aver
age
cost
per
pat
ient
(Eur
o)
Average Cost per Enrolled Participant
gt40000
Chart1
Average Cost Per Patient (Euro)
4978
7000
7000
7250
832545
9000
9000
10000
10000
10000
10000
10000
10500
10827
10840
11140
11565
1179649
12200
13000
145244
40200
Sheet1
Sheet2
Sheet2
Average Cost Per Patient (Euro)
Average Cost Per Patient
Sheet4
Ethics Subm
Regulatory Fees
Sheet3
Ethics + Regulatory
Total Ethics and Regulatory Fees
Add Inv Fees
Additional Investigator Application Fees
Total Regulatory Fees
Study starts
SubjectsStudy
31
Euro
0
10000
20000
30000
40000
50000
60000
70000
80000
90000S
outh
Afri
caC
anad
a
Italy
Ger
man
yP
eru
Pol
and
Spa
in UK
Bul
garia
Taiw
anC
zech
Rep
Gre
ece
Chi
leB
elgi
umK
orea
Sin
gapo
reFr
ance
Chi
naN
ew Z
eala
ndIs
rael
Bra
zil
Aus
tralia
Source Bayer Presented SACRA Conference 2009
Eur
os
Regulatory Application Fees
Chart1
Total Regulatory Fees
1113
181818
2200
3000
4500
4900
5450
5556
6000
656267
7500
7500
8300
8324
15438
19725
20000
403364
45096
53460
6136558
83000
Sheet1
Sheet2
Sheet2
Average Cost Per Patient (Euro)
Average Cost Per Patient
Sheet4
Ethics Subm
Regulatory Fees
Sheet3
Ethics + Regulatory
Total Ethics and Regulatory Fees
Add Inv Fees
Additional Investigator Application Fees
Total Regulatory Fees
Study starts
SubjectsStudy
32
SA Clinical Trial Regulatory Processes
Governed by SA-GCP and Declaration of Helsinki SA National Clinical Trials Register (SANCTR) Medicines Control Council (National Regulatory Authority)
o New protocols o Amendments o Additional sitesinvestigators
Ethics Committees (33 NHREC-registered) RegionalMunicipal DoH Export permits for bio samples (Nat Health Act 2003)
Clinical Trial Density Active sites million population
Nature Reviews Drug Discovery 7 13-14 (January 2008)
France 503
Germany 512 Canada
922
USA 1203
Czech Republic 776
553 sites
South Africa 119
757 sites
757 sites
533 sites
1084 sites
Argentina 269
Russia 77
China 04
India 07
34
Gateway to Africa
35
Why Africa bull Large accessible population relatively new to clinical trials
bull Experienced and willing investigators
bull Many clinical trial sites established by PDPs NGOs etc
bull Expanding therapeutic areas shifting burden of disease from
infectious to non-communicable diseases
bull Significantly improved infrastructure and accessibility
bull Rapidly evolving regulatory and ethics procedures
bull Potential for capacity building and sustainable clinical trial potential
36
Relatively young GCP culture Resident mentorships to build capacity Locations ndash accessibility for site monitoring Variable infrastructure esp electricity connectivity and
transportation Resourcing of public healthcare systems
Sub-Saharan Africa challenges
37
bull Second-largest continent
bull Spans NS and EW hemispheres
bull Second most populous continent 2014 estimate 1069 billion
bull Home to more than a quarter of the 196 independent countries
bull All 54 African countries are UN members
bull 39 urban population
bull 12 metropolitan areas gt 4m
bull gt 3000 distinct ethnicities
bull gt 2000 languages spoken
AFRICA hellip the true size
wwwcitypopulationdeworldAgglomerations 2015
38
SSV to SIV
0
5
10
15
20
25
30
35
40
45
Africa North America
Asia Pacific
Western Europe
Eastern Europe
Latin America
Source Quintiles South Africa SACRA Conference 2008
Wee
ks (A
vera
ge)
Start-Up Timelines
39
Region Median
Patients Site
of Sites
0 pts 1 - 3 pts 4 - 9 pts 10+ pts
Latin America 40 21 26 30 23
North America 30 29 29 24 18
Eastern Europe 60 15 31 26 27
Western Europe 40 15 22 29 34
Asia Pacific 40 19 30 34 18
Africa 100 4 17 28 51
Enrollment performance by region for 2008
Site Performance
Source Quintiles South Africa Presented SACRA Conference 2009
40
0 1 2 3 4 5 6 7 8 9
10
Latin America
North America
Eastern Europe
Western Europe
Asia Pacific
Africa
Num
ber o
f par
ticip
ants
MEDIAN site enrollment by region for 2008
Source Quintiles South Africa Presented SACRA Conference 2009
Site Performance
41
Source Quintiles South Africa Presented SACRA Conference 2009
s
ites
0
5
10
15
20
25
30
35
40
45
50
LatinAmerica
NorthAmerica
EasternEurope
WesternEurope
Asia Pacific Africa
0 pts
1 - 3 pts
4 - 9 pts
10+ pts
Enrollment performance by region for 2008
Site Performance
Chart1
0 pts
1 - 3 pts
4 - 9 pts
10+ pts
021
026
03
023
029
029
024
018
015
031
026
027
015
022
029
034
019
03
034
018
004
017
028
051
HIV
HIV
Resiratory amp Cancer
Male prevalence
Female prevalence
CVS
Overall death rates
Overall death rates
COPD
Asthma
Tracheabronchial lung cancer
Oesophageal cancer
prostate cancer
Trial metrics
COPD
Asthma
Tracheabronchial lung cancer
Oesophageal cancer
Prostate cancer
Cervical cancer
Breast cancer
Stroke
ill-defined heart disease
Diabetes mellitus
Ischaemic heart disease
Hypertension
Nephritisnephrosis
Stroke
ill-defined heart disease
Diabetes mellitus
Ischaemic heart disease
Hypertension
Nephritisnephrosis
Males
Female
UN - Male
SA 1997
SA 2004
UN - Female
SA 1997
SA 2004
0 pts
1 - 3 pts
4 - 9 pts
10+ pts
42
Source wwwclinicaltrialsgov 22-Oct-2010
Clinical trials registered across Africa
43
0
500
1000
1500
2000
2500
South Africa Kenya Malawi Tanzania Uganda Zambia
Selected African countries
2005
2010
2015
Source ClinTrialsgov
Trend 2005 - 2015
Source wwwclinicaltrialsgov 28-Aug-2015
44
AFRICA FOUND IN TRANSLATION
bull Vast treatment-naiumlve population bull Cost advantages (still) bull Diverse ethnicity amp morbidity bull Inverse seasonality bull Site capacity-building widely implemented bull Robust regulatory review bull Variable but generally good regulatory timelines bull Established GCP culture ndash sites and home-bred CROs
45
THANK YOU
Foliennummer 1
Triclinium A South African CRO
Collaboration with VPM SII
Vaccine Trials in SA 2015
Foliennummer 5
Foliennummer 6
Foliennummer 7
Foliennummer 8
Foliennummer 9
Foliennummer 10
Foliennummer 11
Foliennummer 12
Foliennummer 13
Foliennummer 14
Foliennummer 15
Foliennummer 16
Foliennummer 17
Distribution of clinical trial sites
Foliennummer 19
South Africa Leading Causes of Death
Foliennummer 21
Foliennummer 22
South Africa TB deaths by age group
Foliennummer 24
Foliennummer 25
Foliennummer 26
Foliennummer 27
Foliennummer 28
Foliennummer 29
Foliennummer 30
Foliennummer 31
SA Clinical Trial Regulatory Processes
Clinical Trial Density Active sites million population
Foliennummer 34
Why Africa
Foliennummer 36
AFRICA hellip the true size
SSV to SIV
Foliennummer 39
Foliennummer 40
Foliennummer 41
Foliennummer 42
Foliennummer 43
AFRICA FOUND IN TRANSLATION
Foliennummer 45
Region
Median
of Sites
Patients Site
0 pts
1 - 3 pts
4 - 9 pts
10+ pts
Latin America
4
21
26
30
23
North America
3
29
29
24
18
Eastern Europe
6
15
31
26
27
Western Europe
4
15
22
29
34
Asia Pacific
4
19
30
34
18
Africa
10
4
17
28
51
0 pts
1 - 3 pts
4 - 9 pts
10+ pts
Latin America
21
26
30
23
North America
29
29
24
18
Eastern Europe
15
31
26
27
Western Europe
15
22
29
34
Asia Pacific
19
30
34
18
Africa
4
17
28
51
Males
Female
15-19
210
150
20-24
340
205
25-29
395
300
30-34
460
360
35-39
600
405
40-44
800
500
45-49
1100
700
50-54
1600
1050
55-54
2300
1580
60-64
3340
2250
UN - Male
SA 1997
SA 2004
UN - Female
SA 1997
SA 2004
15-19
210
235
216
150
165
187
20-24
340
381
555
205
331
1085
25-29
395
625
1081
300
452
1985
30-34
460
817
2118
360
489
2267
35-39
600
916
2498
405
526
1890
40-44
800
1136
2765
500
615
1548
45-49
1100
1486
2744
700
800
1400
50-54
1600
2016
2979
1050
1116
1506
55-54
2300
2838
3270
1580
1626
1717
60-64
3340
3614
4146
2250
2201
2360
Stroke
ill-defined heart disease
Diabetes mellitus
Ischaemic heart disease
Hypertension
Nephritisnephrosis
Stroke
ill-defined heart disease
Diabetes mellitus
Ischaemic heart disease
Hypertension
Nephritisnephrosis
1999
34
345
20
248
14
10
1999
295
246
23
10
145
68
2000
36
362
218
249
152
112
2000
318
268
241
108
16
8
2001
35
372
22
25
15
125
2001
322
28
252
102
162
95
2002
405
298
24
26
147
126
2002
352
295
27
115
16
10
2003
425
32
245
285
152
15
2003
382
299
285
122
17
12
2004
39
325
255
26
165
16
2004
35
30
295
121
19
119
2005
36
328
265
26
15
162
2005
325
30
32
12
18
12
2006
35
336
27
258
155
16
2006
33
32
32
11
18
125
COPD
Asthma
Tracheabronchial lung cancer
Oesophageal cancer
prostate cancer
Cervical cancer
Breast cancer
1999
2001
12
135
10
26
2000
204
116
13
92
28
2001
222
131
133
96
27
2002
23
144
128
95
285
2003
243
149
124
94
29
2004
229
154
1255
87
29
2005
224
152
122
82
295
2006
224
136
116
75
3
COPD
Asthma
Tracheabronchial lung cancer
Oesophageal cancer
Prostate cancer
Cervical cancer
Breast cancer
1999
88
92
43
41
106
82
2000
96
95
4
43
11
81
2001
10
109
4
4
111
89
2002
10
116
4
4
112
85
2003
11
124
4
395
116
85
2004
102
1295
44
39
115
101
2005
105
128
42
38
1185
10
2006
10
12
42
32
1205
10
Based on this survey the researchers estimate that 109 of all South Africans over 2 years old were living with HIV in 2008 In 2002 and 2005 this figure was 114 and 108 respectively showing a degree of stabilisation Among those between 15 and 49 years old the estimated HIV prevalence was 169 in 2008 The survey found the prevalence among children aged 2-14 to be 25 down significantly since 2002 when prevalence was 56
Estimated HIV prevalence () among South Africans aged 2 years and older by age 2002-2008
Age
HIV +
HIV -
Children (2-14 years)
25
975
Youth (15-24 years)
87
913
Adults (25 and older)
168
832
(15-49 years)
169
831
Total (2 and older)
109
891
Estimated HIV prevalence among South Africans by age and sex 2008
Age
Male prevalence
Female prevalence
2-14
3
2
15-19
25
67
20-24
51
211
25-29
157
327
30-34
258
291
35-39
185
248
40-44
192
163
45-49
64
141
50-54
104
102
55-59
62
77
60+
35
18
Total
79
136
Among females HIV prevalence is highest in those between 25 and 29 years old among males the peak is in the group aged 30-34 years
HIV prevalence () by province 2002-2008
Province
2002
2005
2008
KwaZulu-Natal
117
165
158
Mpumalanga
141
152
154
Free State
149
126
126
North West
103
109
113
Gauteng
147
108
103
Eastern Cape
66
89
9
Limpopo
98
8
88
Northern Cape
84
54
59
Western Cape
107
19
38
National
114
108
109
The results of this study suggest that KwaZulu-Natal Mpumulanga and Free State have the highest HIV prevalence However the relatively small sample sizes may limit precision and in several cases the ranges of uncertainty overlap
HIV prevalence by population group 2008
Population group
Prevalence ()
African
136
864
White
03
997
Coloured
17
983
Indian
03
997
Studies of AIDS deaths
Latin America
Latin America
Latin America
Latin America
North America
North America
North America
North America
Eastern Europe
Eastern Europe
Eastern Europe
Eastern Europe
Western Europe
Western Europe
Western Europe
Western Europe
Asia Pacific
Asia Pacific
Asia Pacific
Asia Pacific
Africa
Africa
Africa
Africa
Country
Study starts
Subjects randomised
SubjectsStudy
USA
32
4385
13703125
Russia
20
788
394
Germany
19
1883
991052631579
UK
13
265
203846153846
South Africa
12
347
289166666667
Argentina
12
329
274166666667
Australia
11
195
177272727273
India
7
275
392857142857
Brazil
3
115
383333333333
Country
Initiation
Site activation
Recruitment
LOC setup
Unproductive sites
(Approval ndash FCI)
(FCI ndash FSFV)
(FSFV ndash LSFV)
(CPC ndash FSFV)
South Africa
19
38
153
357
21
Australia
117
63
401
239
11
Germany
16
37
401
224
21
UK
9
101
301
346
20
Russia
11
52
174
334
9
India
31
28
389
431
3
Argentina
94
67
288
32
13
Brazil
79
59
94
656
20
USA
44
31
149
26
Country
Pts Rand
Sites
Av CPP
Cost Per Country
Ethics Subm
Regulatory Fees
Add Inv Fees
CT Scan Total
Ethics + Regulatory
Total Regulatory Fees
South Africa
25
5
7250
181250
290
460
363
0
750
1113
Canada
18
4
832545
14985818
181818
0
0
1557576
181818
1818
Italy
7
2
10000
70000
2200
0
0
0
2200
2200
Germany
55
10
7000
385000
3000
0
0
12000
3000
3000
Peru
40
5
7000
280000
1500
1000
2000
60000
2500
4500
Poland
15
4
10000
150000
0
2500
2400
0
2500
4900
Spain
40
7
10500
420000
0
0
5450
0
0
5450
UK
12
4
13000
156000
0
0
5556
0
0
5556
Bulgaria
18
4
10000
180000
0
5000
1000
0
5000
6000
Taiwan
20
4
1179649
2359298
104167
313
5208
0
135467
6563
Czech Rep
10
2
10000
100000
1500
3000
3000
0
4500
7500
Greece
40
7
9000
360000
0
7500
0
0
7500
7500
Chile
15
4
10840
162600
1700
3600
3000
0
5300
8300
Belgium
25
6
12200
305000
3992
4332
0
0
8324
8324
Korea
30
3
10827
324802
1114
0
14324
0
1114
15438
Singapore
10
2
11565
115650
1750
0
17975
0
1750
19725
France
50
10
9000
450000
0
0
20000
0
0
20000
China
39
5
4978
194142
5224
0
39814
0
5224
40336
New Zealand
10
3
145244
145244
1973
0
43123
0
1973
45096
Israel
10
6
11140
111400
2060
3000
48400
16500
5060
53460
Brazil
30
6
10000
300000
2000
287356
5649202
0
487356
61366
Australia
24
6
40200
964800
0
500
82500
0
500
83000
23
543
109
532856799
3304716
26939
27700043
73748966
[1753EURO x 14 (ex rate) = $2454] [ $245416 hours=$153hour]
1095625
1095625
12271
1753
198089
198089
208514736842
South Africa
Canada
Italy
Germany
Peru
Poland
Spain
UK
Bulgaria
Taiwan
Czech Rep
Greece
Chile
Belgium
Korea
Singapore
France
China
New Zealand
Israel
Brazil
Australia
Country
Study starts
Subjects randomised
SubjectsStudy
USA
32
4385
13703125
Russia
20
788
394
Germany
19
1883
991052631579
UK
13
265
203846153846
South Africa
12
347
289166666667
Argentina
12
329
274166666667
Australia
11
195
177272727273
India
7
275
392857142857
Brazil
3
115
383333333333
Country
Initiation
Site activation
Recruitment
LOC setup
Unproductive sites
(Approval ndash FCI)
(FCI ndash FSFV)
(FSFV ndash LSFV)
(CPC ndash FSFV)
South Africa
19
38
153
357
21
Australia
117
63
401
239
11
Germany
16
37
401
224
21
UK
9
101
301
346
20
Russia
11
52
174
334
9
India
31
28
389
431
3
Argentina
94
67
288
32
13
Brazil
79
59
94
656
20
USA
44
31
149
26
Country
Pts Rand
Sites
Av CPP
Cost Per Country
Ethics Subm
Regulatory Fees
Add Inv Fees
CT Scan Total
Ethics + Regulatory
Total Regulatory Fees
China
39
5
4978
194142
522
0
39814
0
522
40336
Germany
55
10
7000
385000
3000
0
0
12000
3000
3000
Peru
40
5
7000
280000
1500
1000
2000
60000
2500
4500
South Africa
25
5
7250
181250
290
460
363
0
750
1113
Canada
18
4
8325
149858
1818
0
0
1557576
1818
1818
Greece
40
7
9000
360000
0
7500
0
0
7500
7500
France
50
10
9000
450000
0
0
20000
0
0
20000
Italy
7
2
10000
70000
2200
0
0
0
2200
2200
Poland
15
4
10000
150000
0
2500
2400
0
2500
4900
Bulgaria
18
4
10000
180000
0
5000
1000
0
5000
6000
Czech Rep
10
2
10000
100000
1500
3000
3000
0
4500
7500
Brazil
30
6
10000
300000
2000
2874
56492
0
4874
61366
Spain
40
7
10500
420000
0
0
5450
0
0
5450
Korea
30
3
10827
324802
1114
0
14324
0
1114
15438
Chile
15
4
10840
162600
1700
3600
3000
0
5300
8300
Israel
10
6
11140
111400
2060
3000
48400
16500
5060
53460
Singapore
10
2
11565
115650
1750
0
17975
0
1750
19725
Taiwan
20
4
11796
235930
1042
313
5208
0
1355
6563
Belgium
25
6
12200
305000
3992
4332
0
0
8324
8324
UK
12
4
13000
156000
0
0
5556
0
0
5556
New Zealand
10
3
14524
145244
1973
0
43123
0
1973
45096
Australia
24
6
40200
964800
0
500
82500
0
500
83000
23
543
109
5328568
33047
26939
277000
73748966
[1753EURO x 14 (ex rate) = $2454] [ $245416 hours=$153hour]
110
1095625
1227
1753
19809
20
21
China
Germany
Peru
South Africa
Canada
Greece
France
Italy
Poland
Bulgaria
Czech Rep
Brazil
Spain
Korea
Chile
Israel
Singapore
Taiwan
Belgium
UK
New Zealand
Australia
Population Group
IndianAsianOther
26
Mixed ethnicity
90
Caucasian
91
African
793
10000
IndianAsianOther
Mixed ethnicity
Caucasian
African
8
or helliphellip
9
10
11
or helliphellip
12
13
14
15
South African Trials
Whistle-Stop Tour
16
bull Ethnically a ldquoRainbow Nationrdquo
bull Populations representative of Africa Europe and Asia
17
Population 5495-million 1-Jul-2015 estimate
SA urbanrural profile
18
Cape Town Port Elizabeth
Durban
Pretoria
Joburg
Bloemfontein
Distribution of clinical trial sites
George
East London
Nelspruit
Richardrsquos Bay Kimberley
Welkom
19
Source Statistics South Africa 2015
3
9
979
IndianAsianOtherMixed ethnicityCaucasianAfrican
bull Young 44 aged lt 20 yrs bull Elderly 76 aged gt 60 yrs bull High number of treatment-naiumlve patients
SA Demographics
Chart1
9
0026
009
0091
0793
Sheet1
Sheet1
Sheet2
Sheet3
20
South Africa Leading Causes of Death
00
20
40
60
80
100
120
140 The ten leading underlying natural causes of death in South Africa (2009)
percentage
TB Flu amp Intest Heart Cereb Diab HIV HT Chron Immun Pneum Infect Other Vasc Mell Dis LRT Dis
Stats SA Rel P03093 Mortality and causes of death in South Africa 2009 Findings from death notification Nov-2011
Age group
TB 0-14 15-49 50-64 65+
Rank Rank Rank Rank
5 34 1 196 1 114 8 33
24
bull Well established research infrastructure bull Public and private sectors
28 teaching hospitals gt40000 tertiary care beds 140 private hospitals gt30000 beds 15 - 18 medical insurance
bull Large broad-based investigator database amp site networks bull Specialised Early Phase presence since 1970s bull GCPGLP and CLIA 88 compliant labs bull Specialist labs (biomarkers TB immunology
PKbioassay) bull Full support services (GMP-depots translations etc) bull Stringent ICH-compliant RAEC review policies
GCP is a legal requirement Informed Consent entrenched in Constitution
South Africa Advantages
25
bull Reliable (+) roads air links energy connectivity bull European Time bull Research language is English bull Inverse seasons bull Cost Currency bull Mobile-phone enabled obsessed population
South Africa Advantages
26
South Africa Track Record
bull Phase I-III data from SA included in hundreds of US amp European registration dossiers
bull Two entire NDA dossiers ndash rifapentine 1998 ndash tryptorelin (GnRH agonist) 2001) comprised SA data
bull 37 FDA inspections 1994-2009 1 OAI (27)
27
Therapeutic Indications
28
0
1
2
3
4
5
6
7
8
9
10
Belg
ium
Au
stria
Li
thua
nia
Can
ada
Luxe
mbo
urg
Mal
ta
Nor
way
Po
rtuga
l R
oman
ia
Rus
sia
Serb
ia
Swed
en
The
Net
herla
nds
USA
loca
l site
s U
SA c
entra
l site
C
zech
Rep
ublic
D
enm
ark
Esto
nia
Finl
and
Hun
gary
Ic
elan
d Ire
land
La
tvia
G
erm
any
Switz
erla
nd
Liec
hten
stei
n U
nite
d Ki
ngdo
m
Fran
ce
Italy
Au
stra
lia
Hon
g-Ko
ng
New
Zea
land
Si
ngap
ore
Taiw
an
Uga
nda
Pola
nd
Ukr
aine
C
hile
G
uate
mal
a Ja
pan
Isra
el
Slov
akia
Bu
lgar
ia
Gre
ece
Mal
aysi
a Ph
ilipp
ines
Pe
ru
Thai
land
Tu
rkey
Sl
oven
ia
Cos
ta R
ica
Mex
ico
Spai
n So
uth
Afric
a Ar
gent
ina
Sout
h Ko
rea
Col
ombi
a Pa
nam
a C
roat
ia
Indi
a Ve
nezu
ela
Braz
il C
hina
Mon
ths
Sout
h Afri
ca
Global Regulatory Review Timelines
Triclinium experience 2009-2015
Triclinium experience 2009 - 2015
29
Protocol release Country selection
Site Selection Collection of reg docs
Submission of RA application
EC application
Negotiate Site Contracts
EC Approvals
RA Approval amp Import permit
Site Initiation Import amp distribute drug
Import ancillary supplies Set up local labs
Set up EDC
Months
0
1
2
3
All EC approvals typically within 6
weeks
Site contracts signed within days
As soon as MCC approval obtained ALL sites can be initiated
Start-Up Activities in PARALLEL
GMO application (biologics)
30
0
2000
4000
6000
8000
10000
12000
14000C
hina
Ger
man
y
Per
u
Sou
th A
frica
Can
ada
Gre
ece
Fran
ce
Italy
Pol
and
Bul
garia
Cze
ch R
ep
Bra
zil
Spa
in
Kor
ea
Chi
le
Isra
el
Sin
gapo
re
Taiw
an
Bel
gium U
K
New
hellip
Aus
tralia
Source Bayer Presented SACRA Conference 2009
Aver
age
cost
per
pat
ient
(Eur
o)
Average Cost per Enrolled Participant
gt40000
Chart1
Average Cost Per Patient (Euro)
4978
7000
7000
7250
832545
9000
9000
10000
10000
10000
10000
10000
10500
10827
10840
11140
11565
1179649
12200
13000
145244
40200
Sheet1
Sheet2
Sheet2
Average Cost Per Patient (Euro)
Average Cost Per Patient
Sheet4
Ethics Subm
Regulatory Fees
Sheet3
Ethics + Regulatory
Total Ethics and Regulatory Fees
Add Inv Fees
Additional Investigator Application Fees
Total Regulatory Fees
Study starts
SubjectsStudy
31
Euro
0
10000
20000
30000
40000
50000
60000
70000
80000
90000S
outh
Afri
caC
anad
a
Italy
Ger
man
yP
eru
Pol
and
Spa
in UK
Bul
garia
Taiw
anC
zech
Rep
Gre
ece
Chi
leB
elgi
umK
orea
Sin
gapo
reFr
ance
Chi
naN
ew Z
eala
ndIs
rael
Bra
zil
Aus
tralia
Source Bayer Presented SACRA Conference 2009
Eur
os
Regulatory Application Fees
Chart1
Total Regulatory Fees
1113
181818
2200
3000
4500
4900
5450
5556
6000
656267
7500
7500
8300
8324
15438
19725
20000
403364
45096
53460
6136558
83000
Sheet1
Sheet2
Sheet2
Average Cost Per Patient (Euro)
Average Cost Per Patient
Sheet4
Ethics Subm
Regulatory Fees
Sheet3
Ethics + Regulatory
Total Ethics and Regulatory Fees
Add Inv Fees
Additional Investigator Application Fees
Total Regulatory Fees
Study starts
SubjectsStudy
32
SA Clinical Trial Regulatory Processes
Governed by SA-GCP and Declaration of Helsinki SA National Clinical Trials Register (SANCTR) Medicines Control Council (National Regulatory Authority)
o New protocols o Amendments o Additional sitesinvestigators
Ethics Committees (33 NHREC-registered) RegionalMunicipal DoH Export permits for bio samples (Nat Health Act 2003)
Clinical Trial Density Active sites million population
Nature Reviews Drug Discovery 7 13-14 (January 2008)
France 503
Germany 512 Canada
922
USA 1203
Czech Republic 776
553 sites
South Africa 119
757 sites
757 sites
533 sites
1084 sites
Argentina 269
Russia 77
China 04
India 07
34
Gateway to Africa
35
Why Africa bull Large accessible population relatively new to clinical trials
bull Experienced and willing investigators
bull Many clinical trial sites established by PDPs NGOs etc
bull Expanding therapeutic areas shifting burden of disease from
infectious to non-communicable diseases
bull Significantly improved infrastructure and accessibility
bull Rapidly evolving regulatory and ethics procedures
bull Potential for capacity building and sustainable clinical trial potential
36
Relatively young GCP culture Resident mentorships to build capacity Locations ndash accessibility for site monitoring Variable infrastructure esp electricity connectivity and
transportation Resourcing of public healthcare systems
Sub-Saharan Africa challenges
37
bull Second-largest continent
bull Spans NS and EW hemispheres
bull Second most populous continent 2014 estimate 1069 billion
bull Home to more than a quarter of the 196 independent countries
bull All 54 African countries are UN members
bull 39 urban population
bull 12 metropolitan areas gt 4m
bull gt 3000 distinct ethnicities
bull gt 2000 languages spoken
AFRICA hellip the true size
wwwcitypopulationdeworldAgglomerations 2015
38
SSV to SIV
0
5
10
15
20
25
30
35
40
45
Africa North America
Asia Pacific
Western Europe
Eastern Europe
Latin America
Source Quintiles South Africa SACRA Conference 2008
Wee
ks (A
vera
ge)
Start-Up Timelines
39
Region Median
Patients Site
of Sites
0 pts 1 - 3 pts 4 - 9 pts 10+ pts
Latin America 40 21 26 30 23
North America 30 29 29 24 18
Eastern Europe 60 15 31 26 27
Western Europe 40 15 22 29 34
Asia Pacific 40 19 30 34 18
Africa 100 4 17 28 51
Enrollment performance by region for 2008
Site Performance
Source Quintiles South Africa Presented SACRA Conference 2009
40
0 1 2 3 4 5 6 7 8 9
10
Latin America
North America
Eastern Europe
Western Europe
Asia Pacific
Africa
Num
ber o
f par
ticip
ants
MEDIAN site enrollment by region for 2008
Source Quintiles South Africa Presented SACRA Conference 2009
Site Performance
41
Source Quintiles South Africa Presented SACRA Conference 2009
s
ites
0
5
10
15
20
25
30
35
40
45
50
LatinAmerica
NorthAmerica
EasternEurope
WesternEurope
Asia Pacific Africa
0 pts
1 - 3 pts
4 - 9 pts
10+ pts
Enrollment performance by region for 2008
Site Performance
Chart1
0 pts
1 - 3 pts
4 - 9 pts
10+ pts
021
026
03
023
029
029
024
018
015
031
026
027
015
022
029
034
019
03
034
018
004
017
028
051
HIV
HIV
Resiratory amp Cancer
Male prevalence
Female prevalence
CVS
Overall death rates
Overall death rates
COPD
Asthma
Tracheabronchial lung cancer
Oesophageal cancer
prostate cancer
Trial metrics
COPD
Asthma
Tracheabronchial lung cancer
Oesophageal cancer
Prostate cancer
Cervical cancer
Breast cancer
Stroke
ill-defined heart disease
Diabetes mellitus
Ischaemic heart disease
Hypertension
Nephritisnephrosis
Stroke
ill-defined heart disease
Diabetes mellitus
Ischaemic heart disease
Hypertension
Nephritisnephrosis
Males
Female
UN - Male
SA 1997
SA 2004
UN - Female
SA 1997
SA 2004
0 pts
1 - 3 pts
4 - 9 pts
10+ pts
42
Source wwwclinicaltrialsgov 22-Oct-2010
Clinical trials registered across Africa
43
0
500
1000
1500
2000
2500
South Africa Kenya Malawi Tanzania Uganda Zambia
Selected African countries
2005
2010
2015
Source ClinTrialsgov
Trend 2005 - 2015
Source wwwclinicaltrialsgov 28-Aug-2015
44
AFRICA FOUND IN TRANSLATION
bull Vast treatment-naiumlve population bull Cost advantages (still) bull Diverse ethnicity amp morbidity bull Inverse seasonality bull Site capacity-building widely implemented bull Robust regulatory review bull Variable but generally good regulatory timelines bull Established GCP culture ndash sites and home-bred CROs
45
THANK YOU
Foliennummer 1
Triclinium A South African CRO
Collaboration with VPM SII
Vaccine Trials in SA 2015
Foliennummer 5
Foliennummer 6
Foliennummer 7
Foliennummer 8
Foliennummer 9
Foliennummer 10
Foliennummer 11
Foliennummer 12
Foliennummer 13
Foliennummer 14
Foliennummer 15
Foliennummer 16
Foliennummer 17
Distribution of clinical trial sites
Foliennummer 19
South Africa Leading Causes of Death
Foliennummer 21
Foliennummer 22
South Africa TB deaths by age group
Foliennummer 24
Foliennummer 25
Foliennummer 26
Foliennummer 27
Foliennummer 28
Foliennummer 29
Foliennummer 30
Foliennummer 31
SA Clinical Trial Regulatory Processes
Clinical Trial Density Active sites million population
Foliennummer 34
Why Africa
Foliennummer 36
AFRICA hellip the true size
SSV to SIV
Foliennummer 39
Foliennummer 40
Foliennummer 41
Foliennummer 42
Foliennummer 43
AFRICA FOUND IN TRANSLATION
Foliennummer 45
Region
Median
of Sites
Patients Site
0 pts
1 - 3 pts
4 - 9 pts
10+ pts
Latin America
4
21
26
30
23
North America
3
29
29
24
18
Eastern Europe
6
15
31
26
27
Western Europe
4
15
22
29
34
Asia Pacific
4
19
30
34
18
Africa
10
4
17
28
51
0 pts
1 - 3 pts
4 - 9 pts
10+ pts
Latin America
21
26
30
23
North America
29
29
24
18
Eastern Europe
15
31
26
27
Western Europe
15
22
29
34
Asia Pacific
19
30
34
18
Africa
4
17
28
51
Males
Female
15-19
210
150
20-24
340
205
25-29
395
300
30-34
460
360
35-39
600
405
40-44
800
500
45-49
1100
700
50-54
1600
1050
55-54
2300
1580
60-64
3340
2250
UN - Male
SA 1997
SA 2004
UN - Female
SA 1997
SA 2004
15-19
210
235
216
150
165
187
20-24
340
381
555
205
331
1085
25-29
395
625
1081
300
452
1985
30-34
460
817
2118
360
489
2267
35-39
600
916
2498
405
526
1890
40-44
800
1136
2765
500
615
1548
45-49
1100
1486
2744
700
800
1400
50-54
1600
2016
2979
1050
1116
1506
55-54
2300
2838
3270
1580
1626
1717
60-64
3340
3614
4146
2250
2201
2360
Stroke
ill-defined heart disease
Diabetes mellitus
Ischaemic heart disease
Hypertension
Nephritisnephrosis
Stroke
ill-defined heart disease
Diabetes mellitus
Ischaemic heart disease
Hypertension
Nephritisnephrosis
1999
34
345
20
248
14
10
1999
295
246
23
10
145
68
2000
36
362
218
249
152
112
2000
318
268
241
108
16
8
2001
35
372
22
25
15
125
2001
322
28
252
102
162
95
2002
405
298
24
26
147
126
2002
352
295
27
115
16
10
2003
425
32
245
285
152
15
2003
382
299
285
122
17
12
2004
39
325
255
26
165
16
2004
35
30
295
121
19
119
2005
36
328
265
26
15
162
2005
325
30
32
12
18
12
2006
35
336
27
258
155
16
2006
33
32
32
11
18
125
COPD
Asthma
Tracheabronchial lung cancer
Oesophageal cancer
prostate cancer
Cervical cancer
Breast cancer
1999
2001
12
135
10
26
2000
204
116
13
92
28
2001
222
131
133
96
27
2002
23
144
128
95
285
2003
243
149
124
94
29
2004
229
154
1255
87
29
2005
224
152
122
82
295
2006
224
136
116
75
3
COPD
Asthma
Tracheabronchial lung cancer
Oesophageal cancer
Prostate cancer
Cervical cancer
Breast cancer
1999
88
92
43
41
106
82
2000
96
95
4
43
11
81
2001
10
109
4
4
111
89
2002
10
116
4
4
112
85
2003
11
124
4
395
116
85
2004
102
1295
44
39
115
101
2005
105
128
42
38
1185
10
2006
10
12
42
32
1205
10
Based on this survey the researchers estimate that 109 of all South Africans over 2 years old were living with HIV in 2008 In 2002 and 2005 this figure was 114 and 108 respectively showing a degree of stabilisation Among those between 15 and 49 years old the estimated HIV prevalence was 169 in 2008 The survey found the prevalence among children aged 2-14 to be 25 down significantly since 2002 when prevalence was 56
Estimated HIV prevalence () among South Africans aged 2 years and older by age 2002-2008
Age
HIV +
HIV -
Children (2-14 years)
25
975
Youth (15-24 years)
87
913
Adults (25 and older)
168
832
(15-49 years)
169
831
Total (2 and older)
109
891
Estimated HIV prevalence among South Africans by age and sex 2008
Age
Male prevalence
Female prevalence
2-14
3
2
15-19
25
67
20-24
51
211
25-29
157
327
30-34
258
291
35-39
185
248
40-44
192
163
45-49
64
141
50-54
104
102
55-59
62
77
60+
35
18
Total
79
136
Among females HIV prevalence is highest in those between 25 and 29 years old among males the peak is in the group aged 30-34 years
HIV prevalence () by province 2002-2008
Province
2002
2005
2008
KwaZulu-Natal
117
165
158
Mpumalanga
141
152
154
Free State
149
126
126
North West
103
109
113
Gauteng
147
108
103
Eastern Cape
66
89
9
Limpopo
98
8
88
Northern Cape
84
54
59
Western Cape
107
19
38
National
114
108
109
The results of this study suggest that KwaZulu-Natal Mpumulanga and Free State have the highest HIV prevalence However the relatively small sample sizes may limit precision and in several cases the ranges of uncertainty overlap
HIV prevalence by population group 2008
Population group
Prevalence ()
African
136
864
White
03
997
Coloured
17
983
Indian
03
997
Studies of AIDS deaths
Latin America
Latin America
Latin America
Latin America
North America
North America
North America
North America
Eastern Europe
Eastern Europe
Eastern Europe
Eastern Europe
Western Europe
Western Europe
Western Europe
Western Europe
Asia Pacific
Asia Pacific
Asia Pacific
Asia Pacific
Africa
Africa
Africa
Africa
Country
Study starts
Subjects randomised
SubjectsStudy
USA
32
4385
13703125
Russia
20
788
394
Germany
19
1883
991052631579
UK
13
265
203846153846
South Africa
12
347
289166666667
Argentina
12
329
274166666667
Australia
11
195
177272727273
India
7
275
392857142857
Brazil
3
115
383333333333
Country
Initiation
Site activation
Recruitment
LOC setup
Unproductive sites
(Approval ndash FCI)
(FCI ndash FSFV)
(FSFV ndash LSFV)
(CPC ndash FSFV)
South Africa
19
38
153
357
21
Australia
117
63
401
239
11
Germany
16
37
401
224
21
UK
9
101
301
346
20
Russia
11
52
174
334
9
India
31
28
389
431
3
Argentina
94
67
288
32
13
Brazil
79
59
94
656
20
USA
44
31
149
26
Country
Pts Rand
Sites
Av CPP
Cost Per Country
Ethics Subm
Regulatory Fees
Add Inv Fees
CT Scan Total
Ethics + Regulatory
Total Regulatory Fees
South Africa
25
5
7250
181250
290
460
363
0
750
1113
Canada
18
4
832545
14985818
181818
0
0
1557576
181818
1818
Italy
7
2
10000
70000
2200
0
0
0
2200
2200
Germany
55
10
7000
385000
3000
0
0
12000
3000
3000
Peru
40
5
7000
280000
1500
1000
2000
60000
2500
4500
Poland
15
4
10000
150000
0
2500
2400
0
2500
4900
Spain
40
7
10500
420000
0
0
5450
0
0
5450
UK
12
4
13000
156000
0
0
5556
0
0
5556
Bulgaria
18
4
10000
180000
0
5000
1000
0
5000
6000
Taiwan
20
4
1179649
2359298
104167
313
5208
0
135467
6563
Czech Rep
10
2
10000
100000
1500
3000
3000
0
4500
7500
Greece
40
7
9000
360000
0
7500
0
0
7500
7500
Chile
15
4
10840
162600
1700
3600
3000
0
5300
8300
Belgium
25
6
12200
305000
3992
4332
0
0
8324
8324
Korea
30
3
10827
324802
1114
0
14324
0
1114
15438
Singapore
10
2
11565
115650
1750
0
17975
0
1750
19725
France
50
10
9000
450000
0
0
20000
0
0
20000
China
39
5
4978
194142
5224
0
39814
0
5224
40336
New Zealand
10
3
145244
145244
1973
0
43123
0
1973
45096
Israel
10
6
11140
111400
2060
3000
48400
16500
5060
53460
Brazil
30
6
10000
300000
2000
287356
5649202
0
487356
61366
Australia
24
6
40200
964800
0
500
82500
0
500
83000
23
543
109
532856799
3304716
26939
27700043
73748966
[1753EURO x 14 (ex rate) = $2454] [ $245416 hours=$153hour]
1095625
1095625
12271
1753
198089
198089
208514736842
South Africa
Canada
Italy
Germany
Peru
Poland
Spain
UK
Bulgaria
Taiwan
Czech Rep
Greece
Chile
Belgium
Korea
Singapore
France
China
New Zealand
Israel
Brazil
Australia
Country
Study starts
Subjects randomised
SubjectsStudy
USA
32
4385
13703125
Russia
20
788
394
Germany
19
1883
991052631579
UK
13
265
203846153846
South Africa
12
347
289166666667
Argentina
12
329
274166666667
Australia
11
195
177272727273
India
7
275
392857142857
Brazil
3
115
383333333333
Country
Initiation
Site activation
Recruitment
LOC setup
Unproductive sites
(Approval ndash FCI)
(FCI ndash FSFV)
(FSFV ndash LSFV)
(CPC ndash FSFV)
South Africa
19
38
153
357
21
Australia
117
63
401
239
11
Germany
16
37
401
224
21
UK
9
101
301
346
20
Russia
11
52
174
334
9
India
31
28
389
431
3
Argentina
94
67
288
32
13
Brazil
79
59
94
656
20
USA
44
31
149
26
Country
Pts Rand
Sites
Av CPP
Cost Per Country
Ethics Subm
Regulatory Fees
Add Inv Fees
CT Scan Total
Ethics + Regulatory
Total Regulatory Fees
China
39
5
4978
194142
522
0
39814
0
522
40336
Germany
55
10
7000
385000
3000
0
0
12000
3000
3000
Peru
40
5
7000
280000
1500
1000
2000
60000
2500
4500
South Africa
25
5
7250
181250
290
460
363
0
750
1113
Canada
18
4
8325
149858
1818
0
0
1557576
1818
1818
Greece
40
7
9000
360000
0
7500
0
0
7500
7500
France
50
10
9000
450000
0
0
20000
0
0
20000
Italy
7
2
10000
70000
2200
0
0
0
2200
2200
Poland
15
4
10000
150000
0
2500
2400
0
2500
4900
Bulgaria
18
4
10000
180000
0
5000
1000
0
5000
6000
Czech Rep
10
2
10000
100000
1500
3000
3000
0
4500
7500
Brazil
30
6
10000
300000
2000
2874
56492
0
4874
61366
Spain
40
7
10500
420000
0
0
5450
0
0
5450
Korea
30
3
10827
324802
1114
0
14324
0
1114
15438
Chile
15
4
10840
162600
1700
3600
3000
0
5300
8300
Israel
10
6
11140
111400
2060
3000
48400
16500
5060
53460
Singapore
10
2
11565
115650
1750
0
17975
0
1750
19725
Taiwan
20
4
11796
235930
1042
313
5208
0
1355
6563
Belgium
25
6
12200
305000
3992
4332
0
0
8324
8324
UK
12
4
13000
156000
0
0
5556
0
0
5556
New Zealand
10
3
14524
145244
1973
0
43123
0
1973
45096
Australia
24
6
40200
964800
0
500
82500
0
500
83000
23
543
109
5328568
33047
26939
277000
73748966
[1753EURO x 14 (ex rate) = $2454] [ $245416 hours=$153hour]
110
1095625
1227
1753
19809
20
21
China
Germany
Peru
South Africa
Canada
Greece
France
Italy
Poland
Bulgaria
Czech Rep
Brazil
Spain
Korea
Chile
Israel
Singapore
Taiwan
Belgium
UK
New Zealand
Australia
Population Group
IndianAsianOther
26
Mixed ethnicity
90
Caucasian
91
African
793
10000
IndianAsianOther
Mixed ethnicity
Caucasian
African
9
10
11
or helliphellip
12
13
14
15
South African Trials
Whistle-Stop Tour
16
bull Ethnically a ldquoRainbow Nationrdquo
bull Populations representative of Africa Europe and Asia
17
Population 5495-million 1-Jul-2015 estimate
SA urbanrural profile
18
Cape Town Port Elizabeth
Durban
Pretoria
Joburg
Bloemfontein
Distribution of clinical trial sites
George
East London
Nelspruit
Richardrsquos Bay Kimberley
Welkom
19
Source Statistics South Africa 2015
3
9
979
IndianAsianOtherMixed ethnicityCaucasianAfrican
bull Young 44 aged lt 20 yrs bull Elderly 76 aged gt 60 yrs bull High number of treatment-naiumlve patients
SA Demographics
Chart1
9
0026
009
0091
0793
Sheet1
Sheet1
Sheet2
Sheet3
20
South Africa Leading Causes of Death
00
20
40
60
80
100
120
140 The ten leading underlying natural causes of death in South Africa (2009)
percentage
TB Flu amp Intest Heart Cereb Diab HIV HT Chron Immun Pneum Infect Other Vasc Mell Dis LRT Dis
Stats SA Rel P03093 Mortality and causes of death in South Africa 2009 Findings from death notification Nov-2011
Age group
TB 0-14 15-49 50-64 65+
Rank Rank Rank Rank
5 34 1 196 1 114 8 33
24
bull Well established research infrastructure bull Public and private sectors
28 teaching hospitals gt40000 tertiary care beds 140 private hospitals gt30000 beds 15 - 18 medical insurance
bull Large broad-based investigator database amp site networks bull Specialised Early Phase presence since 1970s bull GCPGLP and CLIA 88 compliant labs bull Specialist labs (biomarkers TB immunology
PKbioassay) bull Full support services (GMP-depots translations etc) bull Stringent ICH-compliant RAEC review policies
GCP is a legal requirement Informed Consent entrenched in Constitution
South Africa Advantages
25
bull Reliable (+) roads air links energy connectivity bull European Time bull Research language is English bull Inverse seasons bull Cost Currency bull Mobile-phone enabled obsessed population
South Africa Advantages
26
South Africa Track Record
bull Phase I-III data from SA included in hundreds of US amp European registration dossiers
bull Two entire NDA dossiers ndash rifapentine 1998 ndash tryptorelin (GnRH agonist) 2001) comprised SA data
bull 37 FDA inspections 1994-2009 1 OAI (27)
27
Therapeutic Indications
28
0
1
2
3
4
5
6
7
8
9
10
Belg
ium
Au
stria
Li
thua
nia
Can
ada
Luxe
mbo
urg
Mal
ta
Nor
way
Po
rtuga
l R
oman
ia
Rus
sia
Serb
ia
Swed
en
The
Net
herla
nds
USA
loca
l site
s U
SA c
entra
l site
C
zech
Rep
ublic
D
enm
ark
Esto
nia
Finl
and
Hun
gary
Ic
elan
d Ire
land
La
tvia
G
erm
any
Switz
erla
nd
Liec
hten
stei
n U
nite
d Ki
ngdo
m
Fran
ce
Italy
Au
stra
lia
Hon
g-Ko
ng
New
Zea
land
Si
ngap
ore
Taiw
an
Uga
nda
Pola
nd
Ukr
aine
C
hile
G
uate
mal
a Ja
pan
Isra
el
Slov
akia
Bu
lgar
ia
Gre
ece
Mal
aysi
a Ph
ilipp
ines
Pe
ru
Thai
land
Tu
rkey
Sl
oven
ia
Cos
ta R
ica
Mex
ico
Spai
n So
uth
Afric
a Ar
gent
ina
Sout
h Ko
rea
Col
ombi
a Pa
nam
a C
roat
ia
Indi
a Ve
nezu
ela
Braz
il C
hina
Mon
ths
Sout
h Afri
ca
Global Regulatory Review Timelines
Triclinium experience 2009-2015
Triclinium experience 2009 - 2015
29
Protocol release Country selection
Site Selection Collection of reg docs
Submission of RA application
EC application
Negotiate Site Contracts
EC Approvals
RA Approval amp Import permit
Site Initiation Import amp distribute drug
Import ancillary supplies Set up local labs
Set up EDC
Months
0
1
2
3
All EC approvals typically within 6
weeks
Site contracts signed within days
As soon as MCC approval obtained ALL sites can be initiated
Start-Up Activities in PARALLEL
GMO application (biologics)
30
0
2000
4000
6000
8000
10000
12000
14000C
hina
Ger
man
y
Per
u
Sou
th A
frica
Can
ada
Gre
ece
Fran
ce
Italy
Pol
and
Bul
garia
Cze
ch R
ep
Bra
zil
Spa
in
Kor
ea
Chi
le
Isra
el
Sin
gapo
re
Taiw
an
Bel
gium U
K
New
hellip
Aus
tralia
Source Bayer Presented SACRA Conference 2009
Aver
age
cost
per
pat
ient
(Eur
o)
Average Cost per Enrolled Participant
gt40000
Chart1
Average Cost Per Patient (Euro)
4978
7000
7000
7250
832545
9000
9000
10000
10000
10000
10000
10000
10500
10827
10840
11140
11565
1179649
12200
13000
145244
40200
Sheet1
Sheet2
Sheet2
Average Cost Per Patient (Euro)
Average Cost Per Patient
Sheet4
Ethics Subm
Regulatory Fees
Sheet3
Ethics + Regulatory
Total Ethics and Regulatory Fees
Add Inv Fees
Additional Investigator Application Fees
Total Regulatory Fees
Study starts
SubjectsStudy
31
Euro
0
10000
20000
30000
40000
50000
60000
70000
80000
90000S
outh
Afri
caC
anad
a
Italy
Ger
man
yP
eru
Pol
and
Spa
in UK
Bul
garia
Taiw
anC
zech
Rep
Gre
ece
Chi
leB
elgi
umK
orea
Sin
gapo
reFr
ance
Chi
naN
ew Z
eala
ndIs
rael
Bra
zil
Aus
tralia
Source Bayer Presented SACRA Conference 2009
Eur
os
Regulatory Application Fees
Chart1
Total Regulatory Fees
1113
181818
2200
3000
4500
4900
5450
5556
6000
656267
7500
7500
8300
8324
15438
19725
20000
403364
45096
53460
6136558
83000
Sheet1
Sheet2
Sheet2
Average Cost Per Patient (Euro)
Average Cost Per Patient
Sheet4
Ethics Subm
Regulatory Fees
Sheet3
Ethics + Regulatory
Total Ethics and Regulatory Fees
Add Inv Fees
Additional Investigator Application Fees
Total Regulatory Fees
Study starts
SubjectsStudy
32
SA Clinical Trial Regulatory Processes
Governed by SA-GCP and Declaration of Helsinki SA National Clinical Trials Register (SANCTR) Medicines Control Council (National Regulatory Authority)
o New protocols o Amendments o Additional sitesinvestigators
Ethics Committees (33 NHREC-registered) RegionalMunicipal DoH Export permits for bio samples (Nat Health Act 2003)
Clinical Trial Density Active sites million population
Nature Reviews Drug Discovery 7 13-14 (January 2008)
France 503
Germany 512 Canada
922
USA 1203
Czech Republic 776
553 sites
South Africa 119
757 sites
757 sites
533 sites
1084 sites
Argentina 269
Russia 77
China 04
India 07
34
Gateway to Africa
35
Why Africa bull Large accessible population relatively new to clinical trials
bull Experienced and willing investigators
bull Many clinical trial sites established by PDPs NGOs etc
bull Expanding therapeutic areas shifting burden of disease from
infectious to non-communicable diseases
bull Significantly improved infrastructure and accessibility
bull Rapidly evolving regulatory and ethics procedures
bull Potential for capacity building and sustainable clinical trial potential
36
Relatively young GCP culture Resident mentorships to build capacity Locations ndash accessibility for site monitoring Variable infrastructure esp electricity connectivity and
transportation Resourcing of public healthcare systems
Sub-Saharan Africa challenges
37
bull Second-largest continent
bull Spans NS and EW hemispheres
bull Second most populous continent 2014 estimate 1069 billion
bull Home to more than a quarter of the 196 independent countries
bull All 54 African countries are UN members
bull 39 urban population
bull 12 metropolitan areas gt 4m
bull gt 3000 distinct ethnicities
bull gt 2000 languages spoken
AFRICA hellip the true size
wwwcitypopulationdeworldAgglomerations 2015
38
SSV to SIV
0
5
10
15
20
25
30
35
40
45
Africa North America
Asia Pacific
Western Europe
Eastern Europe
Latin America
Source Quintiles South Africa SACRA Conference 2008
Wee
ks (A
vera
ge)
Start-Up Timelines
39
Region Median
Patients Site
of Sites
0 pts 1 - 3 pts 4 - 9 pts 10+ pts
Latin America 40 21 26 30 23
North America 30 29 29 24 18
Eastern Europe 60 15 31 26 27
Western Europe 40 15 22 29 34
Asia Pacific 40 19 30 34 18
Africa 100 4 17 28 51
Enrollment performance by region for 2008
Site Performance
Source Quintiles South Africa Presented SACRA Conference 2009
40
0 1 2 3 4 5 6 7 8 9
10
Latin America
North America
Eastern Europe
Western Europe
Asia Pacific
Africa
Num
ber o
f par
ticip
ants
MEDIAN site enrollment by region for 2008
Source Quintiles South Africa Presented SACRA Conference 2009
Site Performance
41
Source Quintiles South Africa Presented SACRA Conference 2009
s
ites
0
5
10
15
20
25
30
35
40
45
50
LatinAmerica
NorthAmerica
EasternEurope
WesternEurope
Asia Pacific Africa
0 pts
1 - 3 pts
4 - 9 pts
10+ pts
Enrollment performance by region for 2008
Site Performance
Chart1
0 pts
1 - 3 pts
4 - 9 pts
10+ pts
021
026
03
023
029
029
024
018
015
031
026
027
015
022
029
034
019
03
034
018
004
017
028
051
HIV
HIV
Resiratory amp Cancer
Male prevalence
Female prevalence
CVS
Overall death rates
Overall death rates
COPD
Asthma
Tracheabronchial lung cancer
Oesophageal cancer
prostate cancer
Trial metrics
COPD
Asthma
Tracheabronchial lung cancer
Oesophageal cancer
Prostate cancer
Cervical cancer
Breast cancer
Stroke
ill-defined heart disease
Diabetes mellitus
Ischaemic heart disease
Hypertension
Nephritisnephrosis
Stroke
ill-defined heart disease
Diabetes mellitus
Ischaemic heart disease
Hypertension
Nephritisnephrosis
Males
Female
UN - Male
SA 1997
SA 2004
UN - Female
SA 1997
SA 2004
0 pts
1 - 3 pts
4 - 9 pts
10+ pts
42
Source wwwclinicaltrialsgov 22-Oct-2010
Clinical trials registered across Africa
43
0
500
1000
1500
2000
2500
South Africa Kenya Malawi Tanzania Uganda Zambia
Selected African countries
2005
2010
2015
Source ClinTrialsgov
Trend 2005 - 2015
Source wwwclinicaltrialsgov 28-Aug-2015
44
AFRICA FOUND IN TRANSLATION
bull Vast treatment-naiumlve population bull Cost advantages (still) bull Diverse ethnicity amp morbidity bull Inverse seasonality bull Site capacity-building widely implemented bull Robust regulatory review bull Variable but generally good regulatory timelines bull Established GCP culture ndash sites and home-bred CROs
45
THANK YOU
Foliennummer 1
Triclinium A South African CRO
Collaboration with VPM SII
Vaccine Trials in SA 2015
Foliennummer 5
Foliennummer 6
Foliennummer 7
Foliennummer 8
Foliennummer 9
Foliennummer 10
Foliennummer 11
Foliennummer 12
Foliennummer 13
Foliennummer 14
Foliennummer 15
Foliennummer 16
Foliennummer 17
Distribution of clinical trial sites
Foliennummer 19
South Africa Leading Causes of Death
Foliennummer 21
Foliennummer 22
South Africa TB deaths by age group
Foliennummer 24
Foliennummer 25
Foliennummer 26
Foliennummer 27
Foliennummer 28
Foliennummer 29
Foliennummer 30
Foliennummer 31
SA Clinical Trial Regulatory Processes
Clinical Trial Density Active sites million population
Foliennummer 34
Why Africa
Foliennummer 36
AFRICA hellip the true size
SSV to SIV
Foliennummer 39
Foliennummer 40
Foliennummer 41
Foliennummer 42
Foliennummer 43
AFRICA FOUND IN TRANSLATION
Foliennummer 45
Region
Median
of Sites
Patients Site
0 pts
1 - 3 pts
4 - 9 pts
10+ pts
Latin America
4
21
26
30
23
North America
3
29
29
24
18
Eastern Europe
6
15
31
26
27
Western Europe
4
15
22
29
34
Asia Pacific
4
19
30
34
18
Africa
10
4
17
28
51
0 pts
1 - 3 pts
4 - 9 pts
10+ pts
Latin America
21
26
30
23
North America
29
29
24
18
Eastern Europe
15
31
26
27
Western Europe
15
22
29
34
Asia Pacific
19
30
34
18
Africa
4
17
28
51
Males
Female
15-19
210
150
20-24
340
205
25-29
395
300
30-34
460
360
35-39
600
405
40-44
800
500
45-49
1100
700
50-54
1600
1050
55-54
2300
1580
60-64
3340
2250
UN - Male
SA 1997
SA 2004
UN - Female
SA 1997
SA 2004
15-19
210
235
216
150
165
187
20-24
340
381
555
205
331
1085
25-29
395
625
1081
300
452
1985
30-34
460
817
2118
360
489
2267
35-39
600
916
2498
405
526
1890
40-44
800
1136
2765
500
615
1548
45-49
1100
1486
2744
700
800
1400
50-54
1600
2016
2979
1050
1116
1506
55-54
2300
2838
3270
1580
1626
1717
60-64
3340
3614
4146
2250
2201
2360
Stroke
ill-defined heart disease
Diabetes mellitus
Ischaemic heart disease
Hypertension
Nephritisnephrosis
Stroke
ill-defined heart disease
Diabetes mellitus
Ischaemic heart disease
Hypertension
Nephritisnephrosis
1999
34
345
20
248
14
10
1999
295
246
23
10
145
68
2000
36
362
218
249
152
112
2000
318
268
241
108
16
8
2001
35
372
22
25
15
125
2001
322
28
252
102
162
95
2002
405
298
24
26
147
126
2002
352
295
27
115
16
10
2003
425
32
245
285
152
15
2003
382
299
285
122
17
12
2004
39
325
255
26
165
16
2004
35
30
295
121
19
119
2005
36
328
265
26
15
162
2005
325
30
32
12
18
12
2006
35
336
27
258
155
16
2006
33
32
32
11
18
125
COPD
Asthma
Tracheabronchial lung cancer
Oesophageal cancer
prostate cancer
Cervical cancer
Breast cancer
1999
2001
12
135
10
26
2000
204
116
13
92
28
2001
222
131
133
96
27
2002
23
144
128
95
285
2003
243
149
124
94
29
2004
229
154
1255
87
29
2005
224
152
122
82
295
2006
224
136
116
75
3
COPD
Asthma
Tracheabronchial lung cancer
Oesophageal cancer
Prostate cancer
Cervical cancer
Breast cancer
1999
88
92
43
41
106
82
2000
96
95
4
43
11
81
2001
10
109
4
4
111
89
2002
10
116
4
4
112
85
2003
11
124
4
395
116
85
2004
102
1295
44
39
115
101
2005
105
128
42
38
1185
10
2006
10
12
42
32
1205
10
Based on this survey the researchers estimate that 109 of all South Africans over 2 years old were living with HIV in 2008 In 2002 and 2005 this figure was 114 and 108 respectively showing a degree of stabilisation Among those between 15 and 49 years old the estimated HIV prevalence was 169 in 2008 The survey found the prevalence among children aged 2-14 to be 25 down significantly since 2002 when prevalence was 56
Estimated HIV prevalence () among South Africans aged 2 years and older by age 2002-2008
Age
HIV +
HIV -
Children (2-14 years)
25
975
Youth (15-24 years)
87
913
Adults (25 and older)
168
832
(15-49 years)
169
831
Total (2 and older)
109
891
Estimated HIV prevalence among South Africans by age and sex 2008
Age
Male prevalence
Female prevalence
2-14
3
2
15-19
25
67
20-24
51
211
25-29
157
327
30-34
258
291
35-39
185
248
40-44
192
163
45-49
64
141
50-54
104
102
55-59
62
77
60+
35
18
Total
79
136
Among females HIV prevalence is highest in those between 25 and 29 years old among males the peak is in the group aged 30-34 years
HIV prevalence () by province 2002-2008
Province
2002
2005
2008
KwaZulu-Natal
117
165
158
Mpumalanga
141
152
154
Free State
149
126
126
North West
103
109
113
Gauteng
147
108
103
Eastern Cape
66
89
9
Limpopo
98
8
88
Northern Cape
84
54
59
Western Cape
107
19
38
National
114
108
109
The results of this study suggest that KwaZulu-Natal Mpumulanga and Free State have the highest HIV prevalence However the relatively small sample sizes may limit precision and in several cases the ranges of uncertainty overlap
HIV prevalence by population group 2008
Population group
Prevalence ()
African
136
864
White
03
997
Coloured
17
983
Indian
03
997
Studies of AIDS deaths
Latin America
Latin America
Latin America
Latin America
North America
North America
North America
North America
Eastern Europe
Eastern Europe
Eastern Europe
Eastern Europe
Western Europe
Western Europe
Western Europe
Western Europe
Asia Pacific
Asia Pacific
Asia Pacific
Asia Pacific
Africa
Africa
Africa
Africa
Country
Study starts
Subjects randomised
SubjectsStudy
USA
32
4385
13703125
Russia
20
788
394
Germany
19
1883
991052631579
UK
13
265
203846153846
South Africa
12
347
289166666667
Argentina
12
329
274166666667
Australia
11
195
177272727273
India
7
275
392857142857
Brazil
3
115
383333333333
Country
Initiation
Site activation
Recruitment
LOC setup
Unproductive sites
(Approval ndash FCI)
(FCI ndash FSFV)
(FSFV ndash LSFV)
(CPC ndash FSFV)
South Africa
19
38
153
357
21
Australia
117
63
401
239
11
Germany
16
37
401
224
21
UK
9
101
301
346
20
Russia
11
52
174
334
9
India
31
28
389
431
3
Argentina
94
67
288
32
13
Brazil
79
59
94
656
20
USA
44
31
149
26
Country
Pts Rand
Sites
Av CPP
Cost Per Country
Ethics Subm
Regulatory Fees
Add Inv Fees
CT Scan Total
Ethics + Regulatory
Total Regulatory Fees
South Africa
25
5
7250
181250
290
460
363
0
750
1113
Canada
18
4
832545
14985818
181818
0
0
1557576
181818
1818
Italy
7
2
10000
70000
2200
0
0
0
2200
2200
Germany
55
10
7000
385000
3000
0
0
12000
3000
3000
Peru
40
5
7000
280000
1500
1000
2000
60000
2500
4500
Poland
15
4
10000
150000
0
2500
2400
0
2500
4900
Spain
40
7
10500
420000
0
0
5450
0
0
5450
UK
12
4
13000
156000
0
0
5556
0
0
5556
Bulgaria
18
4
10000
180000
0
5000
1000
0
5000
6000
Taiwan
20
4
1179649
2359298
104167
313
5208
0
135467
6563
Czech Rep
10
2
10000
100000
1500
3000
3000
0
4500
7500
Greece
40
7
9000
360000
0
7500
0
0
7500
7500
Chile
15
4
10840
162600
1700
3600
3000
0
5300
8300
Belgium
25
6
12200
305000
3992
4332
0
0
8324
8324
Korea
30
3
10827
324802
1114
0
14324
0
1114
15438
Singapore
10
2
11565
115650
1750
0
17975
0
1750
19725
France
50
10
9000
450000
0
0
20000
0
0
20000
China
39
5
4978
194142
5224
0
39814
0
5224
40336
New Zealand
10
3
145244
145244
1973
0
43123
0
1973
45096
Israel
10
6
11140
111400
2060
3000
48400
16500
5060
53460
Brazil
30
6
10000
300000
2000
287356
5649202
0
487356
61366
Australia
24
6
40200
964800
0
500
82500
0
500
83000
23
543
109
532856799
3304716
26939
27700043
73748966
[1753EURO x 14 (ex rate) = $2454] [ $245416 hours=$153hour]
1095625
1095625
12271
1753
198089
198089
208514736842
South Africa
Canada
Italy
Germany
Peru
Poland
Spain
UK
Bulgaria
Taiwan
Czech Rep
Greece
Chile
Belgium
Korea
Singapore
France
China
New Zealand
Israel
Brazil
Australia
Country
Study starts
Subjects randomised
SubjectsStudy
USA
32
4385
13703125
Russia
20
788
394
Germany
19
1883
991052631579
UK
13
265
203846153846
South Africa
12
347
289166666667
Argentina
12
329
274166666667
Australia
11
195
177272727273
India
7
275
392857142857
Brazil
3
115
383333333333
Country
Initiation
Site activation
Recruitment
LOC setup
Unproductive sites
(Approval ndash FCI)
(FCI ndash FSFV)
(FSFV ndash LSFV)
(CPC ndash FSFV)
South Africa
19
38
153
357
21
Australia
117
63
401
239
11
Germany
16
37
401
224
21
UK
9
101
301
346
20
Russia
11
52
174
334
9
India
31
28
389
431
3
Argentina
94
67
288
32
13
Brazil
79
59
94
656
20
USA
44
31
149
26
Country
Pts Rand
Sites
Av CPP
Cost Per Country
Ethics Subm
Regulatory Fees
Add Inv Fees
CT Scan Total
Ethics + Regulatory
Total Regulatory Fees
China
39
5
4978
194142
522
0
39814
0
522
40336
Germany
55
10
7000
385000
3000
0
0
12000
3000
3000
Peru
40
5
7000
280000
1500
1000
2000
60000
2500
4500
South Africa
25
5
7250
181250
290
460
363
0
750
1113
Canada
18
4
8325
149858
1818
0
0
1557576
1818
1818
Greece
40
7
9000
360000
0
7500
0
0
7500
7500
France
50
10
9000
450000
0
0
20000
0
0
20000
Italy
7
2
10000
70000
2200
0
0
0
2200
2200
Poland
15
4
10000
150000
0
2500
2400
0
2500
4900
Bulgaria
18
4
10000
180000
0
5000
1000
0
5000
6000
Czech Rep
10
2
10000
100000
1500
3000
3000
0
4500
7500
Brazil
30
6
10000
300000
2000
2874
56492
0
4874
61366
Spain
40
7
10500
420000
0
0
5450
0
0
5450
Korea
30
3
10827
324802
1114
0
14324
0
1114
15438
Chile
15
4
10840
162600
1700
3600
3000
0
5300
8300
Israel
10
6
11140
111400
2060
3000
48400
16500
5060
53460
Singapore
10
2
11565
115650
1750
0
17975
0
1750
19725
Taiwan
20
4
11796
235930
1042
313
5208
0
1355
6563
Belgium
25
6
12200
305000
3992
4332
0
0
8324
8324
UK
12
4
13000
156000
0
0
5556
0
0
5556
New Zealand
10
3
14524
145244
1973
0
43123
0
1973
45096
Australia
24
6
40200
964800
0
500
82500
0
500
83000
23
543
109
5328568
33047
26939
277000
73748966
[1753EURO x 14 (ex rate) = $2454] [ $245416 hours=$153hour]
110
1095625
1227
1753
19809
20
21
China
Germany
Peru
South Africa
Canada
Greece
France
Italy
Poland
Bulgaria
Czech Rep
Brazil
Spain
Korea
Chile
Israel
Singapore
Taiwan
Belgium
UK
New Zealand
Australia
Population Group
IndianAsianOther
26
Mixed ethnicity
90
Caucasian
91
African
793
10000
IndianAsianOther
Mixed ethnicity
Caucasian
African
10
11
or helliphellip
12
13
14
15
South African Trials
Whistle-Stop Tour
16
bull Ethnically a ldquoRainbow Nationrdquo
bull Populations representative of Africa Europe and Asia
17
Population 5495-million 1-Jul-2015 estimate
SA urbanrural profile
18
Cape Town Port Elizabeth
Durban
Pretoria
Joburg
Bloemfontein
Distribution of clinical trial sites
George
East London
Nelspruit
Richardrsquos Bay Kimberley
Welkom
19
Source Statistics South Africa 2015
3
9
979
IndianAsianOtherMixed ethnicityCaucasianAfrican
bull Young 44 aged lt 20 yrs bull Elderly 76 aged gt 60 yrs bull High number of treatment-naiumlve patients
SA Demographics
Chart1
9
0026
009
0091
0793
Sheet1
Sheet1
Sheet2
Sheet3
20
South Africa Leading Causes of Death
00
20
40
60
80
100
120
140 The ten leading underlying natural causes of death in South Africa (2009)
percentage
TB Flu amp Intest Heart Cereb Diab HIV HT Chron Immun Pneum Infect Other Vasc Mell Dis LRT Dis
Stats SA Rel P03093 Mortality and causes of death in South Africa 2009 Findings from death notification Nov-2011
Age group
TB 0-14 15-49 50-64 65+
Rank Rank Rank Rank
5 34 1 196 1 114 8 33
24
bull Well established research infrastructure bull Public and private sectors
28 teaching hospitals gt40000 tertiary care beds 140 private hospitals gt30000 beds 15 - 18 medical insurance
bull Large broad-based investigator database amp site networks bull Specialised Early Phase presence since 1970s bull GCPGLP and CLIA 88 compliant labs bull Specialist labs (biomarkers TB immunology
PKbioassay) bull Full support services (GMP-depots translations etc) bull Stringent ICH-compliant RAEC review policies
GCP is a legal requirement Informed Consent entrenched in Constitution
South Africa Advantages
25
bull Reliable (+) roads air links energy connectivity bull European Time bull Research language is English bull Inverse seasons bull Cost Currency bull Mobile-phone enabled obsessed population
South Africa Advantages
26
South Africa Track Record
bull Phase I-III data from SA included in hundreds of US amp European registration dossiers
bull Two entire NDA dossiers ndash rifapentine 1998 ndash tryptorelin (GnRH agonist) 2001) comprised SA data
bull 37 FDA inspections 1994-2009 1 OAI (27)
27
Therapeutic Indications
28
0
1
2
3
4
5
6
7
8
9
10
Belg
ium
Au
stria
Li
thua
nia
Can
ada
Luxe
mbo
urg
Mal
ta
Nor
way
Po
rtuga
l R
oman
ia
Rus
sia
Serb
ia
Swed
en
The
Net
herla
nds
USA
loca
l site
s U
SA c
entra
l site
C
zech
Rep
ublic
D
enm
ark
Esto
nia
Finl
and
Hun
gary
Ic
elan
d Ire
land
La
tvia
G
erm
any
Switz
erla
nd
Liec
hten
stei
n U
nite
d Ki
ngdo
m
Fran
ce
Italy
Au
stra
lia
Hon
g-Ko
ng
New
Zea
land
Si
ngap
ore
Taiw
an
Uga
nda
Pola
nd
Ukr
aine
C
hile
G
uate
mal
a Ja
pan
Isra
el
Slov
akia
Bu
lgar
ia
Gre
ece
Mal
aysi
a Ph
ilipp
ines
Pe
ru
Thai
land
Tu
rkey
Sl
oven
ia
Cos
ta R
ica
Mex
ico
Spai
n So
uth
Afric
a Ar
gent
ina
Sout
h Ko
rea
Col
ombi
a Pa
nam
a C
roat
ia
Indi
a Ve
nezu
ela
Braz
il C
hina
Mon
ths
Sout
h Afri
ca
Global Regulatory Review Timelines
Triclinium experience 2009-2015
Triclinium experience 2009 - 2015
29
Protocol release Country selection
Site Selection Collection of reg docs
Submission of RA application
EC application
Negotiate Site Contracts
EC Approvals
RA Approval amp Import permit
Site Initiation Import amp distribute drug
Import ancillary supplies Set up local labs
Set up EDC
Months
0
1
2
3
All EC approvals typically within 6
weeks
Site contracts signed within days
As soon as MCC approval obtained ALL sites can be initiated
Start-Up Activities in PARALLEL
GMO application (biologics)
30
0
2000
4000
6000
8000
10000
12000
14000C
hina
Ger
man
y
Per
u
Sou
th A
frica
Can
ada
Gre
ece
Fran
ce
Italy
Pol
and
Bul
garia
Cze
ch R
ep
Bra
zil
Spa
in
Kor
ea
Chi
le
Isra
el
Sin
gapo
re
Taiw
an
Bel
gium U
K
New
hellip
Aus
tralia
Source Bayer Presented SACRA Conference 2009
Aver
age
cost
per
pat
ient
(Eur
o)
Average Cost per Enrolled Participant
gt40000
Chart1
Average Cost Per Patient (Euro)
4978
7000
7000
7250
832545
9000
9000
10000
10000
10000
10000
10000
10500
10827
10840
11140
11565
1179649
12200
13000
145244
40200
Sheet1
Sheet2
Sheet2
Average Cost Per Patient (Euro)
Average Cost Per Patient
Sheet4
Ethics Subm
Regulatory Fees
Sheet3
Ethics + Regulatory
Total Ethics and Regulatory Fees
Add Inv Fees
Additional Investigator Application Fees
Total Regulatory Fees
Study starts
SubjectsStudy
31
Euro
0
10000
20000
30000
40000
50000
60000
70000
80000
90000S
outh
Afri
caC
anad
a
Italy
Ger
man
yP
eru
Pol
and
Spa
in UK
Bul
garia
Taiw
anC
zech
Rep
Gre
ece
Chi
leB
elgi
umK
orea
Sin
gapo
reFr
ance
Chi
naN
ew Z
eala
ndIs
rael
Bra
zil
Aus
tralia
Source Bayer Presented SACRA Conference 2009
Eur
os
Regulatory Application Fees
Chart1
Total Regulatory Fees
1113
181818
2200
3000
4500
4900
5450
5556
6000
656267
7500
7500
8300
8324
15438
19725
20000
403364
45096
53460
6136558
83000
Sheet1
Sheet2
Sheet2
Average Cost Per Patient (Euro)
Average Cost Per Patient
Sheet4
Ethics Subm
Regulatory Fees
Sheet3
Ethics + Regulatory
Total Ethics and Regulatory Fees
Add Inv Fees
Additional Investigator Application Fees
Total Regulatory Fees
Study starts
SubjectsStudy
32
SA Clinical Trial Regulatory Processes
Governed by SA-GCP and Declaration of Helsinki SA National Clinical Trials Register (SANCTR) Medicines Control Council (National Regulatory Authority)
o New protocols o Amendments o Additional sitesinvestigators
Ethics Committees (33 NHREC-registered) RegionalMunicipal DoH Export permits for bio samples (Nat Health Act 2003)
Clinical Trial Density Active sites million population
Nature Reviews Drug Discovery 7 13-14 (January 2008)
France 503
Germany 512 Canada
922
USA 1203
Czech Republic 776
553 sites
South Africa 119
757 sites
757 sites
533 sites
1084 sites
Argentina 269
Russia 77
China 04
India 07
34
Gateway to Africa
35
Why Africa bull Large accessible population relatively new to clinical trials
bull Experienced and willing investigators
bull Many clinical trial sites established by PDPs NGOs etc
bull Expanding therapeutic areas shifting burden of disease from
infectious to non-communicable diseases
bull Significantly improved infrastructure and accessibility
bull Rapidly evolving regulatory and ethics procedures
bull Potential for capacity building and sustainable clinical trial potential
36
Relatively young GCP culture Resident mentorships to build capacity Locations ndash accessibility for site monitoring Variable infrastructure esp electricity connectivity and
transportation Resourcing of public healthcare systems
Sub-Saharan Africa challenges
37
bull Second-largest continent
bull Spans NS and EW hemispheres
bull Second most populous continent 2014 estimate 1069 billion
bull Home to more than a quarter of the 196 independent countries
bull All 54 African countries are UN members
bull 39 urban population
bull 12 metropolitan areas gt 4m
bull gt 3000 distinct ethnicities
bull gt 2000 languages spoken
AFRICA hellip the true size
wwwcitypopulationdeworldAgglomerations 2015
38
SSV to SIV
0
5
10
15
20
25
30
35
40
45
Africa North America
Asia Pacific
Western Europe
Eastern Europe
Latin America
Source Quintiles South Africa SACRA Conference 2008
Wee
ks (A
vera
ge)
Start-Up Timelines
39
Region Median
Patients Site
of Sites
0 pts 1 - 3 pts 4 - 9 pts 10+ pts
Latin America 40 21 26 30 23
North America 30 29 29 24 18
Eastern Europe 60 15 31 26 27
Western Europe 40 15 22 29 34
Asia Pacific 40 19 30 34 18
Africa 100 4 17 28 51
Enrollment performance by region for 2008
Site Performance
Source Quintiles South Africa Presented SACRA Conference 2009
40
0 1 2 3 4 5 6 7 8 9
10
Latin America
North America
Eastern Europe
Western Europe
Asia Pacific
Africa
Num
ber o
f par
ticip
ants
MEDIAN site enrollment by region for 2008
Source Quintiles South Africa Presented SACRA Conference 2009
Site Performance
41
Source Quintiles South Africa Presented SACRA Conference 2009
s
ites
0
5
10
15
20
25
30
35
40
45
50
LatinAmerica
NorthAmerica
EasternEurope
WesternEurope
Asia Pacific Africa
0 pts
1 - 3 pts
4 - 9 pts
10+ pts
Enrollment performance by region for 2008
Site Performance
Chart1
0 pts
1 - 3 pts
4 - 9 pts
10+ pts
021
026
03
023
029
029
024
018
015
031
026
027
015
022
029
034
019
03
034
018
004
017
028
051
HIV
HIV
Resiratory amp Cancer
Male prevalence
Female prevalence
CVS
Overall death rates
Overall death rates
COPD
Asthma
Tracheabronchial lung cancer
Oesophageal cancer
prostate cancer
Trial metrics
COPD
Asthma
Tracheabronchial lung cancer
Oesophageal cancer
Prostate cancer
Cervical cancer
Breast cancer
Stroke
ill-defined heart disease
Diabetes mellitus
Ischaemic heart disease
Hypertension
Nephritisnephrosis
Stroke
ill-defined heart disease
Diabetes mellitus
Ischaemic heart disease
Hypertension
Nephritisnephrosis
Males
Female
UN - Male
SA 1997
SA 2004
UN - Female
SA 1997
SA 2004
0 pts
1 - 3 pts
4 - 9 pts
10+ pts
42
Source wwwclinicaltrialsgov 22-Oct-2010
Clinical trials registered across Africa
43
0
500
1000
1500
2000
2500
South Africa Kenya Malawi Tanzania Uganda Zambia
Selected African countries
2005
2010
2015
Source ClinTrialsgov
Trend 2005 - 2015
Source wwwclinicaltrialsgov 28-Aug-2015
44
AFRICA FOUND IN TRANSLATION
bull Vast treatment-naiumlve population bull Cost advantages (still) bull Diverse ethnicity amp morbidity bull Inverse seasonality bull Site capacity-building widely implemented bull Robust regulatory review bull Variable but generally good regulatory timelines bull Established GCP culture ndash sites and home-bred CROs
45
THANK YOU
Foliennummer 1
Triclinium A South African CRO
Collaboration with VPM SII
Vaccine Trials in SA 2015
Foliennummer 5
Foliennummer 6
Foliennummer 7
Foliennummer 8
Foliennummer 9
Foliennummer 10
Foliennummer 11
Foliennummer 12
Foliennummer 13
Foliennummer 14
Foliennummer 15
Foliennummer 16
Foliennummer 17
Distribution of clinical trial sites
Foliennummer 19
South Africa Leading Causes of Death
Foliennummer 21
Foliennummer 22
South Africa TB deaths by age group
Foliennummer 24
Foliennummer 25
Foliennummer 26
Foliennummer 27
Foliennummer 28
Foliennummer 29
Foliennummer 30
Foliennummer 31
SA Clinical Trial Regulatory Processes
Clinical Trial Density Active sites million population
Foliennummer 34
Why Africa
Foliennummer 36
AFRICA hellip the true size
SSV to SIV
Foliennummer 39
Foliennummer 40
Foliennummer 41
Foliennummer 42
Foliennummer 43
AFRICA FOUND IN TRANSLATION
Foliennummer 45
Region
Median
of Sites
Patients Site
0 pts
1 - 3 pts
4 - 9 pts
10+ pts
Latin America
4
21
26
30
23
North America
3
29
29
24
18
Eastern Europe
6
15
31
26
27
Western Europe
4
15
22
29
34
Asia Pacific
4
19
30
34
18
Africa
10
4
17
28
51
0 pts
1 - 3 pts
4 - 9 pts
10+ pts
Latin America
21
26
30
23
North America
29
29
24
18
Eastern Europe
15
31
26
27
Western Europe
15
22
29
34
Asia Pacific
19
30
34
18
Africa
4
17
28
51
Males
Female
15-19
210
150
20-24
340
205
25-29
395
300
30-34
460
360
35-39
600
405
40-44
800
500
45-49
1100
700
50-54
1600
1050
55-54
2300
1580
60-64
3340
2250
UN - Male
SA 1997
SA 2004
UN - Female
SA 1997
SA 2004
15-19
210
235
216
150
165
187
20-24
340
381
555
205
331
1085
25-29
395
625
1081
300
452
1985
30-34
460
817
2118
360
489
2267
35-39
600
916
2498
405
526
1890
40-44
800
1136
2765
500
615
1548
45-49
1100
1486
2744
700
800
1400
50-54
1600
2016
2979
1050
1116
1506
55-54
2300
2838
3270
1580
1626
1717
60-64
3340
3614
4146
2250
2201
2360
Stroke
ill-defined heart disease
Diabetes mellitus
Ischaemic heart disease
Hypertension
Nephritisnephrosis
Stroke
ill-defined heart disease
Diabetes mellitus
Ischaemic heart disease
Hypertension
Nephritisnephrosis
1999
34
345
20
248
14
10
1999
295
246
23
10
145
68
2000
36
362
218
249
152
112
2000
318
268
241
108
16
8
2001
35
372
22
25
15
125
2001
322
28
252
102
162
95
2002
405
298
24
26
147
126
2002
352
295
27
115
16
10
2003
425
32
245
285
152
15
2003
382
299
285
122
17
12
2004
39
325
255
26
165
16
2004
35
30
295
121
19
119
2005
36
328
265
26
15
162
2005
325
30
32
12
18
12
2006
35
336
27
258
155
16
2006
33
32
32
11
18
125
COPD
Asthma
Tracheabronchial lung cancer
Oesophageal cancer
prostate cancer
Cervical cancer
Breast cancer
1999
2001
12
135
10
26
2000
204
116
13
92
28
2001
222
131
133
96
27
2002
23
144
128
95
285
2003
243
149
124
94
29
2004
229
154
1255
87
29
2005
224
152
122
82
295
2006
224
136
116
75
3
COPD
Asthma
Tracheabronchial lung cancer
Oesophageal cancer
Prostate cancer
Cervical cancer
Breast cancer
1999
88
92
43
41
106
82
2000
96
95
4
43
11
81
2001
10
109
4
4
111
89
2002
10
116
4
4
112
85
2003
11
124
4
395
116
85
2004
102
1295
44
39
115
101
2005
105
128
42
38
1185
10
2006
10
12
42
32
1205
10
Based on this survey the researchers estimate that 109 of all South Africans over 2 years old were living with HIV in 2008 In 2002 and 2005 this figure was 114 and 108 respectively showing a degree of stabilisation Among those between 15 and 49 years old the estimated HIV prevalence was 169 in 2008 The survey found the prevalence among children aged 2-14 to be 25 down significantly since 2002 when prevalence was 56
Estimated HIV prevalence () among South Africans aged 2 years and older by age 2002-2008
Age
HIV +
HIV -
Children (2-14 years)
25
975
Youth (15-24 years)
87
913
Adults (25 and older)
168
832
(15-49 years)
169
831
Total (2 and older)
109
891
Estimated HIV prevalence among South Africans by age and sex 2008
Age
Male prevalence
Female prevalence
2-14
3
2
15-19
25
67
20-24
51
211
25-29
157
327
30-34
258
291
35-39
185
248
40-44
192
163
45-49
64
141
50-54
104
102
55-59
62
77
60+
35
18
Total
79
136
Among females HIV prevalence is highest in those between 25 and 29 years old among males the peak is in the group aged 30-34 years
HIV prevalence () by province 2002-2008
Province
2002
2005
2008
KwaZulu-Natal
117
165
158
Mpumalanga
141
152
154
Free State
149
126
126
North West
103
109
113
Gauteng
147
108
103
Eastern Cape
66
89
9
Limpopo
98
8
88
Northern Cape
84
54
59
Western Cape
107
19
38
National
114
108
109
The results of this study suggest that KwaZulu-Natal Mpumulanga and Free State have the highest HIV prevalence However the relatively small sample sizes may limit precision and in several cases the ranges of uncertainty overlap
HIV prevalence by population group 2008
Population group
Prevalence ()
African
136
864
White
03
997
Coloured
17
983
Indian
03
997
Studies of AIDS deaths
Latin America
Latin America
Latin America
Latin America
North America
North America
North America
North America
Eastern Europe
Eastern Europe
Eastern Europe
Eastern Europe
Western Europe
Western Europe
Western Europe
Western Europe
Asia Pacific
Asia Pacific
Asia Pacific
Asia Pacific
Africa
Africa
Africa
Africa
Country
Study starts
Subjects randomised
SubjectsStudy
USA
32
4385
13703125
Russia
20
788
394
Germany
19
1883
991052631579
UK
13
265
203846153846
South Africa
12
347
289166666667
Argentina
12
329
274166666667
Australia
11
195
177272727273
India
7
275
392857142857
Brazil
3
115
383333333333
Country
Initiation
Site activation
Recruitment
LOC setup
Unproductive sites
(Approval ndash FCI)
(FCI ndash FSFV)
(FSFV ndash LSFV)
(CPC ndash FSFV)
South Africa
19
38
153
357
21
Australia
117
63
401
239
11
Germany
16
37
401
224
21
UK
9
101
301
346
20
Russia
11
52
174
334
9
India
31
28
389
431
3
Argentina
94
67
288
32
13
Brazil
79
59
94
656
20
USA
44
31
149
26
Country
Pts Rand
Sites
Av CPP
Cost Per Country
Ethics Subm
Regulatory Fees
Add Inv Fees
CT Scan Total
Ethics + Regulatory
Total Regulatory Fees
South Africa
25
5
7250
181250
290
460
363
0
750
1113
Canada
18
4
832545
14985818
181818
0
0
1557576
181818
1818
Italy
7
2
10000
70000
2200
0
0
0
2200
2200
Germany
55
10
7000
385000
3000
0
0
12000
3000
3000
Peru
40
5
7000
280000
1500
1000
2000
60000
2500
4500
Poland
15
4
10000
150000
0
2500
2400
0
2500
4900
Spain
40
7
10500
420000
0
0
5450
0
0
5450
UK
12
4
13000
156000
0
0
5556
0
0
5556
Bulgaria
18
4
10000
180000
0
5000
1000
0
5000
6000
Taiwan
20
4
1179649
2359298
104167
313
5208
0
135467
6563
Czech Rep
10
2
10000
100000
1500
3000
3000
0
4500
7500
Greece
40
7
9000
360000
0
7500
0
0
7500
7500
Chile
15
4
10840
162600
1700
3600
3000
0
5300
8300
Belgium
25
6
12200
305000
3992
4332
0
0
8324
8324
Korea
30
3
10827
324802
1114
0
14324
0
1114
15438
Singapore
10
2
11565
115650
1750
0
17975
0
1750
19725
France
50
10
9000
450000
0
0
20000
0
0
20000
China
39
5
4978
194142
5224
0
39814
0
5224
40336
New Zealand
10
3
145244
145244
1973
0
43123
0
1973
45096
Israel
10
6
11140
111400
2060
3000
48400
16500
5060
53460
Brazil
30
6
10000
300000
2000
287356
5649202
0
487356
61366
Australia
24
6
40200
964800
0
500
82500
0
500
83000
23
543
109
532856799
3304716
26939
27700043
73748966
[1753EURO x 14 (ex rate) = $2454] [ $245416 hours=$153hour]
1095625
1095625
12271
1753
198089
198089
208514736842
South Africa
Canada
Italy
Germany
Peru
Poland
Spain
UK
Bulgaria
Taiwan
Czech Rep
Greece
Chile
Belgium
Korea
Singapore
France
China
New Zealand
Israel
Brazil
Australia
Country
Study starts
Subjects randomised
SubjectsStudy
USA
32
4385
13703125
Russia
20
788
394
Germany
19
1883
991052631579
UK
13
265
203846153846
South Africa
12
347
289166666667
Argentina
12
329
274166666667
Australia
11
195
177272727273
India
7
275
392857142857
Brazil
3
115
383333333333
Country
Initiation
Site activation
Recruitment
LOC setup
Unproductive sites
(Approval ndash FCI)
(FCI ndash FSFV)
(FSFV ndash LSFV)
(CPC ndash FSFV)
South Africa
19
38
153
357
21
Australia
117
63
401
239
11
Germany
16
37
401
224
21
UK
9
101
301
346
20
Russia
11
52
174
334
9
India
31
28
389
431
3
Argentina
94
67
288
32
13
Brazil
79
59
94
656
20
USA
44
31
149
26
Country
Pts Rand
Sites
Av CPP
Cost Per Country
Ethics Subm
Regulatory Fees
Add Inv Fees
CT Scan Total
Ethics + Regulatory
Total Regulatory Fees
China
39
5
4978
194142
522
0
39814
0
522
40336
Germany
55
10
7000
385000
3000
0
0
12000
3000
3000
Peru
40
5
7000
280000
1500
1000
2000
60000
2500
4500
South Africa
25
5
7250
181250
290
460
363
0
750
1113
Canada
18
4
8325
149858
1818
0
0
1557576
1818
1818
Greece
40
7
9000
360000
0
7500
0
0
7500
7500
France
50
10
9000
450000
0
0
20000
0
0
20000
Italy
7
2
10000
70000
2200
0
0
0
2200
2200
Poland
15
4
10000
150000
0
2500
2400
0
2500
4900
Bulgaria
18
4
10000
180000
0
5000
1000
0
5000
6000
Czech Rep
10
2
10000
100000
1500
3000
3000
0
4500
7500
Brazil
30
6
10000
300000
2000
2874
56492
0
4874
61366
Spain
40
7
10500
420000
0
0
5450
0
0
5450
Korea
30
3
10827
324802
1114
0
14324
0
1114
15438
Chile
15
4
10840
162600
1700
3600
3000
0
5300
8300
Israel
10
6
11140
111400
2060
3000
48400
16500
5060
53460
Singapore
10
2
11565
115650
1750
0
17975
0
1750
19725
Taiwan
20
4
11796
235930
1042
313
5208
0
1355
6563
Belgium
25
6
12200
305000
3992
4332
0
0
8324
8324
UK
12
4
13000
156000
0
0
5556
0
0
5556
New Zealand
10
3
14524
145244
1973
0
43123
0
1973
45096
Australia
24
6
40200
964800
0
500
82500
0
500
83000
23
543
109
5328568
33047
26939
277000
73748966
[1753EURO x 14 (ex rate) = $2454] [ $245416 hours=$153hour]
110
1095625
1227
1753
19809
20
21
China
Germany
Peru
South Africa
Canada
Greece
France
Italy
Poland
Bulgaria
Czech Rep
Brazil
Spain
Korea
Chile
Israel
Singapore
Taiwan
Belgium
UK
New Zealand
Australia
Population Group
IndianAsianOther
26
Mixed ethnicity
90
Caucasian
91
African
793
10000
IndianAsianOther
Mixed ethnicity
Caucasian
African
11
or helliphellip
12
13
14
15
South African Trials
Whistle-Stop Tour
16
bull Ethnically a ldquoRainbow Nationrdquo
bull Populations representative of Africa Europe and Asia
17
Population 5495-million 1-Jul-2015 estimate
SA urbanrural profile
18
Cape Town Port Elizabeth
Durban
Pretoria
Joburg
Bloemfontein
Distribution of clinical trial sites
George
East London
Nelspruit
Richardrsquos Bay Kimberley
Welkom
19
Source Statistics South Africa 2015
3
9
979
IndianAsianOtherMixed ethnicityCaucasianAfrican
bull Young 44 aged lt 20 yrs bull Elderly 76 aged gt 60 yrs bull High number of treatment-naiumlve patients
SA Demographics
Chart1
9
0026
009
0091
0793
Sheet1
Sheet1
Sheet2
Sheet3
20
South Africa Leading Causes of Death
00
20
40
60
80
100
120
140 The ten leading underlying natural causes of death in South Africa (2009)
percentage
TB Flu amp Intest Heart Cereb Diab HIV HT Chron Immun Pneum Infect Other Vasc Mell Dis LRT Dis
Stats SA Rel P03093 Mortality and causes of death in South Africa 2009 Findings from death notification Nov-2011
Age group
TB 0-14 15-49 50-64 65+
Rank Rank Rank Rank
5 34 1 196 1 114 8 33
24
bull Well established research infrastructure bull Public and private sectors
28 teaching hospitals gt40000 tertiary care beds 140 private hospitals gt30000 beds 15 - 18 medical insurance
bull Large broad-based investigator database amp site networks bull Specialised Early Phase presence since 1970s bull GCPGLP and CLIA 88 compliant labs bull Specialist labs (biomarkers TB immunology
PKbioassay) bull Full support services (GMP-depots translations etc) bull Stringent ICH-compliant RAEC review policies
GCP is a legal requirement Informed Consent entrenched in Constitution
South Africa Advantages
25
bull Reliable (+) roads air links energy connectivity bull European Time bull Research language is English bull Inverse seasons bull Cost Currency bull Mobile-phone enabled obsessed population
South Africa Advantages
26
South Africa Track Record
bull Phase I-III data from SA included in hundreds of US amp European registration dossiers
bull Two entire NDA dossiers ndash rifapentine 1998 ndash tryptorelin (GnRH agonist) 2001) comprised SA data
bull 37 FDA inspections 1994-2009 1 OAI (27)
27
Therapeutic Indications
28
0
1
2
3
4
5
6
7
8
9
10
Belg
ium
Au
stria
Li
thua
nia
Can
ada
Luxe
mbo
urg
Mal
ta
Nor
way
Po
rtuga
l R
oman
ia
Rus
sia
Serb
ia
Swed
en
The
Net
herla
nds
USA
loca
l site
s U
SA c
entra
l site
C
zech
Rep
ublic
D
enm
ark
Esto
nia
Finl
and
Hun
gary
Ic
elan
d Ire
land
La
tvia
G
erm
any
Switz
erla
nd
Liec
hten
stei
n U
nite
d Ki
ngdo
m
Fran
ce
Italy
Au
stra
lia
Hon
g-Ko
ng
New
Zea
land
Si
ngap
ore
Taiw
an
Uga
nda
Pola
nd
Ukr
aine
C
hile
G
uate
mal
a Ja
pan
Isra
el
Slov
akia
Bu
lgar
ia
Gre
ece
Mal
aysi
a Ph
ilipp
ines
Pe
ru
Thai
land
Tu
rkey
Sl
oven
ia
Cos
ta R
ica
Mex
ico
Spai
n So
uth
Afric
a Ar
gent
ina
Sout
h Ko
rea
Col
ombi
a Pa
nam
a C
roat
ia
Indi
a Ve
nezu
ela
Braz
il C
hina
Mon
ths
Sout
h Afri
ca
Global Regulatory Review Timelines
Triclinium experience 2009-2015
Triclinium experience 2009 - 2015
29
Protocol release Country selection
Site Selection Collection of reg docs
Submission of RA application
EC application
Negotiate Site Contracts
EC Approvals
RA Approval amp Import permit
Site Initiation Import amp distribute drug
Import ancillary supplies Set up local labs
Set up EDC
Months
0
1
2
3
All EC approvals typically within 6
weeks
Site contracts signed within days
As soon as MCC approval obtained ALL sites can be initiated
Start-Up Activities in PARALLEL
GMO application (biologics)
30
0
2000
4000
6000
8000
10000
12000
14000C
hina
Ger
man
y
Per
u
Sou
th A
frica
Can
ada
Gre
ece
Fran
ce
Italy
Pol
and
Bul
garia
Cze
ch R
ep
Bra
zil
Spa
in
Kor
ea
Chi
le
Isra
el
Sin
gapo
re
Taiw
an
Bel
gium U
K
New
hellip
Aus
tralia
Source Bayer Presented SACRA Conference 2009
Aver
age
cost
per
pat
ient
(Eur
o)
Average Cost per Enrolled Participant
gt40000
Chart1
Average Cost Per Patient (Euro)
4978
7000
7000
7250
832545
9000
9000
10000
10000
10000
10000
10000
10500
10827
10840
11140
11565
1179649
12200
13000
145244
40200
Sheet1
Sheet2
Sheet2
Average Cost Per Patient (Euro)
Average Cost Per Patient
Sheet4
Ethics Subm
Regulatory Fees
Sheet3
Ethics + Regulatory
Total Ethics and Regulatory Fees
Add Inv Fees
Additional Investigator Application Fees
Total Regulatory Fees
Study starts
SubjectsStudy
31
Euro
0
10000
20000
30000
40000
50000
60000
70000
80000
90000S
outh
Afri
caC
anad
a
Italy
Ger
man
yP
eru
Pol
and
Spa
in UK
Bul
garia
Taiw
anC
zech
Rep
Gre
ece
Chi
leB
elgi
umK
orea
Sin
gapo
reFr
ance
Chi
naN
ew Z
eala
ndIs
rael
Bra
zil
Aus
tralia
Source Bayer Presented SACRA Conference 2009
Eur
os
Regulatory Application Fees
Chart1
Total Regulatory Fees
1113
181818
2200
3000
4500
4900
5450
5556
6000
656267
7500
7500
8300
8324
15438
19725
20000
403364
45096
53460
6136558
83000
Sheet1
Sheet2
Sheet2
Average Cost Per Patient (Euro)
Average Cost Per Patient
Sheet4
Ethics Subm
Regulatory Fees
Sheet3
Ethics + Regulatory
Total Ethics and Regulatory Fees
Add Inv Fees
Additional Investigator Application Fees
Total Regulatory Fees
Study starts
SubjectsStudy
32
SA Clinical Trial Regulatory Processes
Governed by SA-GCP and Declaration of Helsinki SA National Clinical Trials Register (SANCTR) Medicines Control Council (National Regulatory Authority)
o New protocols o Amendments o Additional sitesinvestigators
Ethics Committees (33 NHREC-registered) RegionalMunicipal DoH Export permits for bio samples (Nat Health Act 2003)
Clinical Trial Density Active sites million population
Nature Reviews Drug Discovery 7 13-14 (January 2008)
France 503
Germany 512 Canada
922
USA 1203
Czech Republic 776
553 sites
South Africa 119
757 sites
757 sites
533 sites
1084 sites
Argentina 269
Russia 77
China 04
India 07
34
Gateway to Africa
35
Why Africa bull Large accessible population relatively new to clinical trials
bull Experienced and willing investigators
bull Many clinical trial sites established by PDPs NGOs etc
bull Expanding therapeutic areas shifting burden of disease from
infectious to non-communicable diseases
bull Significantly improved infrastructure and accessibility
bull Rapidly evolving regulatory and ethics procedures
bull Potential for capacity building and sustainable clinical trial potential
36
Relatively young GCP culture Resident mentorships to build capacity Locations ndash accessibility for site monitoring Variable infrastructure esp electricity connectivity and
transportation Resourcing of public healthcare systems
Sub-Saharan Africa challenges
37
bull Second-largest continent
bull Spans NS and EW hemispheres
bull Second most populous continent 2014 estimate 1069 billion
bull Home to more than a quarter of the 196 independent countries
bull All 54 African countries are UN members
bull 39 urban population
bull 12 metropolitan areas gt 4m
bull gt 3000 distinct ethnicities
bull gt 2000 languages spoken
AFRICA hellip the true size
wwwcitypopulationdeworldAgglomerations 2015
38
SSV to SIV
0
5
10
15
20
25
30
35
40
45
Africa North America
Asia Pacific
Western Europe
Eastern Europe
Latin America
Source Quintiles South Africa SACRA Conference 2008
Wee
ks (A
vera
ge)
Start-Up Timelines
39
Region Median
Patients Site
of Sites
0 pts 1 - 3 pts 4 - 9 pts 10+ pts
Latin America 40 21 26 30 23
North America 30 29 29 24 18
Eastern Europe 60 15 31 26 27
Western Europe 40 15 22 29 34
Asia Pacific 40 19 30 34 18
Africa 100 4 17 28 51
Enrollment performance by region for 2008
Site Performance
Source Quintiles South Africa Presented SACRA Conference 2009
40
0 1 2 3 4 5 6 7 8 9
10
Latin America
North America
Eastern Europe
Western Europe
Asia Pacific
Africa
Num
ber o
f par
ticip
ants
MEDIAN site enrollment by region for 2008
Source Quintiles South Africa Presented SACRA Conference 2009
Site Performance
41
Source Quintiles South Africa Presented SACRA Conference 2009
s
ites
0
5
10
15
20
25
30
35
40
45
50
LatinAmerica
NorthAmerica
EasternEurope
WesternEurope
Asia Pacific Africa
0 pts
1 - 3 pts
4 - 9 pts
10+ pts
Enrollment performance by region for 2008
Site Performance
Chart1
0 pts
1 - 3 pts
4 - 9 pts
10+ pts
021
026
03
023
029
029
024
018
015
031
026
027
015
022
029
034
019
03
034
018
004
017
028
051
HIV
HIV
Resiratory amp Cancer
Male prevalence
Female prevalence
CVS
Overall death rates
Overall death rates
COPD
Asthma
Tracheabronchial lung cancer
Oesophageal cancer
prostate cancer
Trial metrics
COPD
Asthma
Tracheabronchial lung cancer
Oesophageal cancer
Prostate cancer
Cervical cancer
Breast cancer
Stroke
ill-defined heart disease
Diabetes mellitus
Ischaemic heart disease
Hypertension
Nephritisnephrosis
Stroke
ill-defined heart disease
Diabetes mellitus
Ischaemic heart disease
Hypertension
Nephritisnephrosis
Males
Female
UN - Male
SA 1997
SA 2004
UN - Female
SA 1997
SA 2004
0 pts
1 - 3 pts
4 - 9 pts
10+ pts
42
Source wwwclinicaltrialsgov 22-Oct-2010
Clinical trials registered across Africa
43
0
500
1000
1500
2000
2500
South Africa Kenya Malawi Tanzania Uganda Zambia
Selected African countries
2005
2010
2015
Source ClinTrialsgov
Trend 2005 - 2015
Source wwwclinicaltrialsgov 28-Aug-2015
44
AFRICA FOUND IN TRANSLATION
bull Vast treatment-naiumlve population bull Cost advantages (still) bull Diverse ethnicity amp morbidity bull Inverse seasonality bull Site capacity-building widely implemented bull Robust regulatory review bull Variable but generally good regulatory timelines bull Established GCP culture ndash sites and home-bred CROs
45
THANK YOU
Foliennummer 1
Triclinium A South African CRO
Collaboration with VPM SII
Vaccine Trials in SA 2015
Foliennummer 5
Foliennummer 6
Foliennummer 7
Foliennummer 8
Foliennummer 9
Foliennummer 10
Foliennummer 11
Foliennummer 12
Foliennummer 13
Foliennummer 14
Foliennummer 15
Foliennummer 16
Foliennummer 17
Distribution of clinical trial sites
Foliennummer 19
South Africa Leading Causes of Death
Foliennummer 21
Foliennummer 22
South Africa TB deaths by age group
Foliennummer 24
Foliennummer 25
Foliennummer 26
Foliennummer 27
Foliennummer 28
Foliennummer 29
Foliennummer 30
Foliennummer 31
SA Clinical Trial Regulatory Processes
Clinical Trial Density Active sites million population
Foliennummer 34
Why Africa
Foliennummer 36
AFRICA hellip the true size
SSV to SIV
Foliennummer 39
Foliennummer 40
Foliennummer 41
Foliennummer 42
Foliennummer 43
AFRICA FOUND IN TRANSLATION
Foliennummer 45
Region
Median
of Sites
Patients Site
0 pts
1 - 3 pts
4 - 9 pts
10+ pts
Latin America
4
21
26
30
23
North America
3
29
29
24
18
Eastern Europe
6
15
31
26
27
Western Europe
4
15
22
29
34
Asia Pacific
4
19
30
34
18
Africa
10
4
17
28
51
0 pts
1 - 3 pts
4 - 9 pts
10+ pts
Latin America
21
26
30
23
North America
29
29
24
18
Eastern Europe
15
31
26
27
Western Europe
15
22
29
34
Asia Pacific
19
30
34
18
Africa
4
17
28
51
Males
Female
15-19
210
150
20-24
340
205
25-29
395
300
30-34
460
360
35-39
600
405
40-44
800
500
45-49
1100
700
50-54
1600
1050
55-54
2300
1580
60-64
3340
2250
UN - Male
SA 1997
SA 2004
UN - Female
SA 1997
SA 2004
15-19
210
235
216
150
165
187
20-24
340
381
555
205
331
1085
25-29
395
625
1081
300
452
1985
30-34
460
817
2118
360
489
2267
35-39
600
916
2498
405
526
1890
40-44
800
1136
2765
500
615
1548
45-49
1100
1486
2744
700
800
1400
50-54
1600
2016
2979
1050
1116
1506
55-54
2300
2838
3270
1580
1626
1717
60-64
3340
3614
4146
2250
2201
2360
Stroke
ill-defined heart disease
Diabetes mellitus
Ischaemic heart disease
Hypertension
Nephritisnephrosis
Stroke
ill-defined heart disease
Diabetes mellitus
Ischaemic heart disease
Hypertension
Nephritisnephrosis
1999
34
345
20
248
14
10
1999
295
246
23
10
145
68
2000
36
362
218
249
152
112
2000
318
268
241
108
16
8
2001
35
372
22
25
15
125
2001
322
28
252
102
162
95
2002
405
298
24
26
147
126
2002
352
295
27
115
16
10
2003
425
32
245
285
152
15
2003
382
299
285
122
17
12
2004
39
325
255
26
165
16
2004
35
30
295
121
19
119
2005
36
328
265
26
15
162
2005
325
30
32
12
18
12
2006
35
336
27
258
155
16
2006
33
32
32
11
18
125
COPD
Asthma
Tracheabronchial lung cancer
Oesophageal cancer
prostate cancer
Cervical cancer
Breast cancer
1999
2001
12
135
10
26
2000
204
116
13
92
28
2001
222
131
133
96
27
2002
23
144
128
95
285
2003
243
149
124
94
29
2004
229
154
1255
87
29
2005
224
152
122
82
295
2006
224
136
116
75
3
COPD
Asthma
Tracheabronchial lung cancer
Oesophageal cancer
Prostate cancer
Cervical cancer
Breast cancer
1999
88
92
43
41
106
82
2000
96
95
4
43
11
81
2001
10
109
4
4
111
89
2002
10
116
4
4
112
85
2003
11
124
4
395
116
85
2004
102
1295
44
39
115
101
2005
105
128
42
38
1185
10
2006
10
12
42
32
1205
10
Based on this survey the researchers estimate that 109 of all South Africans over 2 years old were living with HIV in 2008 In 2002 and 2005 this figure was 114 and 108 respectively showing a degree of stabilisation Among those between 15 and 49 years old the estimated HIV prevalence was 169 in 2008 The survey found the prevalence among children aged 2-14 to be 25 down significantly since 2002 when prevalence was 56
Estimated HIV prevalence () among South Africans aged 2 years and older by age 2002-2008
Age
HIV +
HIV -
Children (2-14 years)
25
975
Youth (15-24 years)
87
913
Adults (25 and older)
168
832
(15-49 years)
169
831
Total (2 and older)
109
891
Estimated HIV prevalence among South Africans by age and sex 2008
Age
Male prevalence
Female prevalence
2-14
3
2
15-19
25
67
20-24
51
211
25-29
157
327
30-34
258
291
35-39
185
248
40-44
192
163
45-49
64
141
50-54
104
102
55-59
62
77
60+
35
18
Total
79
136
Among females HIV prevalence is highest in those between 25 and 29 years old among males the peak is in the group aged 30-34 years
HIV prevalence () by province 2002-2008
Province
2002
2005
2008
KwaZulu-Natal
117
165
158
Mpumalanga
141
152
154
Free State
149
126
126
North West
103
109
113
Gauteng
147
108
103
Eastern Cape
66
89
9
Limpopo
98
8
88
Northern Cape
84
54
59
Western Cape
107
19
38
National
114
108
109
The results of this study suggest that KwaZulu-Natal Mpumulanga and Free State have the highest HIV prevalence However the relatively small sample sizes may limit precision and in several cases the ranges of uncertainty overlap
HIV prevalence by population group 2008
Population group
Prevalence ()
African
136
864
White
03
997
Coloured
17
983
Indian
03
997
Studies of AIDS deaths
Latin America
Latin America
Latin America
Latin America
North America
North America
North America
North America
Eastern Europe
Eastern Europe
Eastern Europe
Eastern Europe
Western Europe
Western Europe
Western Europe
Western Europe
Asia Pacific
Asia Pacific
Asia Pacific
Asia Pacific
Africa
Africa
Africa
Africa
Country
Study starts
Subjects randomised
SubjectsStudy
USA
32
4385
13703125
Russia
20
788
394
Germany
19
1883
991052631579
UK
13
265
203846153846
South Africa
12
347
289166666667
Argentina
12
329
274166666667
Australia
11
195
177272727273
India
7
275
392857142857
Brazil
3
115
383333333333
Country
Initiation
Site activation
Recruitment
LOC setup
Unproductive sites
(Approval ndash FCI)
(FCI ndash FSFV)
(FSFV ndash LSFV)
(CPC ndash FSFV)
South Africa
19
38
153
357
21
Australia
117
63
401
239
11
Germany
16
37
401
224
21
UK
9
101
301
346
20
Russia
11
52
174
334
9
India
31
28
389
431
3
Argentina
94
67
288
32
13
Brazil
79
59
94
656
20
USA
44
31
149
26
Country
Pts Rand
Sites
Av CPP
Cost Per Country
Ethics Subm
Regulatory Fees
Add Inv Fees
CT Scan Total
Ethics + Regulatory
Total Regulatory Fees
South Africa
25
5
7250
181250
290
460
363
0
750
1113
Canada
18
4
832545
14985818
181818
0
0
1557576
181818
1818
Italy
7
2
10000
70000
2200
0
0
0
2200
2200
Germany
55
10
7000
385000
3000
0
0
12000
3000
3000
Peru
40
5
7000
280000
1500
1000
2000
60000
2500
4500
Poland
15
4
10000
150000
0
2500
2400
0
2500
4900
Spain
40
7
10500
420000
0
0
5450
0
0
5450
UK
12
4
13000
156000
0
0
5556
0
0
5556
Bulgaria
18
4
10000
180000
0
5000
1000
0
5000
6000
Taiwan
20
4
1179649
2359298
104167
313
5208
0
135467
6563
Czech Rep
10
2
10000
100000
1500
3000
3000
0
4500
7500
Greece
40
7
9000
360000
0
7500
0
0
7500
7500
Chile
15
4
10840
162600
1700
3600
3000
0
5300
8300
Belgium
25
6
12200
305000
3992
4332
0
0
8324
8324
Korea
30
3
10827
324802
1114
0
14324
0
1114
15438
Singapore
10
2
11565
115650
1750
0
17975
0
1750
19725
France
50
10
9000
450000
0
0
20000
0
0
20000
China
39
5
4978
194142
5224
0
39814
0
5224
40336
New Zealand
10
3
145244
145244
1973
0
43123
0
1973
45096
Israel
10
6
11140
111400
2060
3000
48400
16500
5060
53460
Brazil
30
6
10000
300000
2000
287356
5649202
0
487356
61366
Australia
24
6
40200
964800
0
500
82500
0
500
83000
23
543
109
532856799
3304716
26939
27700043
73748966
[1753EURO x 14 (ex rate) = $2454] [ $245416 hours=$153hour]
1095625
1095625
12271
1753
198089
198089
208514736842
South Africa
Canada
Italy
Germany
Peru
Poland
Spain
UK
Bulgaria
Taiwan
Czech Rep
Greece
Chile
Belgium
Korea
Singapore
France
China
New Zealand
Israel
Brazil
Australia
Country
Study starts
Subjects randomised
SubjectsStudy
USA
32
4385
13703125
Russia
20
788
394
Germany
19
1883
991052631579
UK
13
265
203846153846
South Africa
12
347
289166666667
Argentina
12
329
274166666667
Australia
11
195
177272727273
India
7
275
392857142857
Brazil
3
115
383333333333
Country
Initiation
Site activation
Recruitment
LOC setup
Unproductive sites
(Approval ndash FCI)
(FCI ndash FSFV)
(FSFV ndash LSFV)
(CPC ndash FSFV)
South Africa
19
38
153
357
21
Australia
117
63
401
239
11
Germany
16
37
401
224
21
UK
9
101
301
346
20
Russia
11
52
174
334
9
India
31
28
389
431
3
Argentina
94
67
288
32
13
Brazil
79
59
94
656
20
USA
44
31
149
26
Country
Pts Rand
Sites
Av CPP
Cost Per Country
Ethics Subm
Regulatory Fees
Add Inv Fees
CT Scan Total
Ethics + Regulatory
Total Regulatory Fees
China
39
5
4978
194142
522
0
39814
0
522
40336
Germany
55
10
7000
385000
3000
0
0
12000
3000
3000
Peru
40
5
7000
280000
1500
1000
2000
60000
2500
4500
South Africa
25
5
7250
181250
290
460
363
0
750
1113
Canada
18
4
8325
149858
1818
0
0
1557576
1818
1818
Greece
40
7
9000
360000
0
7500
0
0
7500
7500
France
50
10
9000
450000
0
0
20000
0
0
20000
Italy
7
2
10000
70000
2200
0
0
0
2200
2200
Poland
15
4
10000
150000
0
2500
2400
0
2500
4900
Bulgaria
18
4
10000
180000
0
5000
1000
0
5000
6000
Czech Rep
10
2
10000
100000
1500
3000
3000
0
4500
7500
Brazil
30
6
10000
300000
2000
2874
56492
0
4874
61366
Spain
40
7
10500
420000
0
0
5450
0
0
5450
Korea
30
3
10827
324802
1114
0
14324
0
1114
15438
Chile
15
4
10840
162600
1700
3600
3000
0
5300
8300
Israel
10
6
11140
111400
2060
3000
48400
16500
5060
53460
Singapore
10
2
11565
115650
1750
0
17975
0
1750
19725
Taiwan
20
4
11796
235930
1042
313
5208
0
1355
6563
Belgium
25
6
12200
305000
3992
4332
0
0
8324
8324
UK
12
4
13000
156000
0
0
5556
0
0
5556
New Zealand
10
3
14524
145244
1973
0
43123
0
1973
45096
Australia
24
6
40200
964800
0
500
82500
0
500
83000
23
543
109
5328568
33047
26939
277000
73748966
[1753EURO x 14 (ex rate) = $2454] [ $245416 hours=$153hour]
110
1095625
1227
1753
19809
20
21
China
Germany
Peru
South Africa
Canada
Greece
France
Italy
Poland
Bulgaria
Czech Rep
Brazil
Spain
Korea
Chile
Israel
Singapore
Taiwan
Belgium
UK
New Zealand
Australia
Population Group
IndianAsianOther
26
Mixed ethnicity
90
Caucasian
91
African
793
10000
IndianAsianOther
Mixed ethnicity
Caucasian
African
12
13
14
15
South African Trials
Whistle-Stop Tour
16
bull Ethnically a ldquoRainbow Nationrdquo
bull Populations representative of Africa Europe and Asia
17
Population 5495-million 1-Jul-2015 estimate
SA urbanrural profile
18
Cape Town Port Elizabeth
Durban
Pretoria
Joburg
Bloemfontein
Distribution of clinical trial sites
George
East London
Nelspruit
Richardrsquos Bay Kimberley
Welkom
19
Source Statistics South Africa 2015
3
9
979
IndianAsianOtherMixed ethnicityCaucasianAfrican
bull Young 44 aged lt 20 yrs bull Elderly 76 aged gt 60 yrs bull High number of treatment-naiumlve patients
SA Demographics
Chart1
9
0026
009
0091
0793
Sheet1
Sheet1
Sheet2
Sheet3
20
South Africa Leading Causes of Death
00
20
40
60
80
100
120
140 The ten leading underlying natural causes of death in South Africa (2009)
percentage
TB Flu amp Intest Heart Cereb Diab HIV HT Chron Immun Pneum Infect Other Vasc Mell Dis LRT Dis
Stats SA Rel P03093 Mortality and causes of death in South Africa 2009 Findings from death notification Nov-2011
Age group
TB 0-14 15-49 50-64 65+
Rank Rank Rank Rank
5 34 1 196 1 114 8 33
24
bull Well established research infrastructure bull Public and private sectors
28 teaching hospitals gt40000 tertiary care beds 140 private hospitals gt30000 beds 15 - 18 medical insurance
bull Large broad-based investigator database amp site networks bull Specialised Early Phase presence since 1970s bull GCPGLP and CLIA 88 compliant labs bull Specialist labs (biomarkers TB immunology
PKbioassay) bull Full support services (GMP-depots translations etc) bull Stringent ICH-compliant RAEC review policies
GCP is a legal requirement Informed Consent entrenched in Constitution
South Africa Advantages
25
bull Reliable (+) roads air links energy connectivity bull European Time bull Research language is English bull Inverse seasons bull Cost Currency bull Mobile-phone enabled obsessed population
South Africa Advantages
26
South Africa Track Record
bull Phase I-III data from SA included in hundreds of US amp European registration dossiers
bull Two entire NDA dossiers ndash rifapentine 1998 ndash tryptorelin (GnRH agonist) 2001) comprised SA data
bull 37 FDA inspections 1994-2009 1 OAI (27)
27
Therapeutic Indications
28
0
1
2
3
4
5
6
7
8
9
10
Belg
ium
Au
stria
Li
thua
nia
Can
ada
Luxe
mbo
urg
Mal
ta
Nor
way
Po
rtuga
l R
oman
ia
Rus
sia
Serb
ia
Swed
en
The
Net
herla
nds
USA
loca
l site
s U
SA c
entra
l site
C
zech
Rep
ublic
D
enm
ark
Esto
nia
Finl
and
Hun
gary
Ic
elan
d Ire
land
La
tvia
G
erm
any
Switz
erla
nd
Liec
hten
stei
n U
nite
d Ki
ngdo
m
Fran
ce
Italy
Au
stra
lia
Hon
g-Ko
ng
New
Zea
land
Si
ngap
ore
Taiw
an
Uga
nda
Pola
nd
Ukr
aine
C
hile
G
uate
mal
a Ja
pan
Isra
el
Slov
akia
Bu
lgar
ia
Gre
ece
Mal
aysi
a Ph
ilipp
ines
Pe
ru
Thai
land
Tu
rkey
Sl
oven
ia
Cos
ta R
ica
Mex
ico
Spai
n So
uth
Afric
a Ar
gent
ina
Sout
h Ko
rea
Col
ombi
a Pa
nam
a C
roat
ia
Indi
a Ve
nezu
ela
Braz
il C
hina
Mon
ths
Sout
h Afri
ca
Global Regulatory Review Timelines
Triclinium experience 2009-2015
Triclinium experience 2009 - 2015
29
Protocol release Country selection
Site Selection Collection of reg docs
Submission of RA application
EC application
Negotiate Site Contracts
EC Approvals
RA Approval amp Import permit
Site Initiation Import amp distribute drug
Import ancillary supplies Set up local labs
Set up EDC
Months
0
1
2
3
All EC approvals typically within 6
weeks
Site contracts signed within days
As soon as MCC approval obtained ALL sites can be initiated
Start-Up Activities in PARALLEL
GMO application (biologics)
30
0
2000
4000
6000
8000
10000
12000
14000C
hina
Ger
man
y
Per
u
Sou
th A
frica
Can
ada
Gre
ece
Fran
ce
Italy
Pol
and
Bul
garia
Cze
ch R
ep
Bra
zil
Spa
in
Kor
ea
Chi
le
Isra
el
Sin
gapo
re
Taiw
an
Bel
gium U
K
New
hellip
Aus
tralia
Source Bayer Presented SACRA Conference 2009
Aver
age
cost
per
pat
ient
(Eur
o)
Average Cost per Enrolled Participant
gt40000
Chart1
Average Cost Per Patient (Euro)
4978
7000
7000
7250
832545
9000
9000
10000
10000
10000
10000
10000
10500
10827
10840
11140
11565
1179649
12200
13000
145244
40200
Sheet1
Sheet2
Sheet2
Average Cost Per Patient (Euro)
Average Cost Per Patient
Sheet4
Ethics Subm
Regulatory Fees
Sheet3
Ethics + Regulatory
Total Ethics and Regulatory Fees
Add Inv Fees
Additional Investigator Application Fees
Total Regulatory Fees
Study starts
SubjectsStudy
31
Euro
0
10000
20000
30000
40000
50000
60000
70000
80000
90000S
outh
Afri
caC
anad
a
Italy
Ger
man
yP
eru
Pol
and
Spa
in UK
Bul
garia
Taiw
anC
zech
Rep
Gre
ece
Chi
leB
elgi
umK
orea
Sin
gapo
reFr
ance
Chi
naN
ew Z
eala
ndIs
rael
Bra
zil
Aus
tralia
Source Bayer Presented SACRA Conference 2009
Eur
os
Regulatory Application Fees
Chart1
Total Regulatory Fees
1113
181818
2200
3000
4500
4900
5450
5556
6000
656267
7500
7500
8300
8324
15438
19725
20000
403364
45096
53460
6136558
83000
Sheet1
Sheet2
Sheet2
Average Cost Per Patient (Euro)
Average Cost Per Patient
Sheet4
Ethics Subm
Regulatory Fees
Sheet3
Ethics + Regulatory
Total Ethics and Regulatory Fees
Add Inv Fees
Additional Investigator Application Fees
Total Regulatory Fees
Study starts
SubjectsStudy
32
SA Clinical Trial Regulatory Processes
Governed by SA-GCP and Declaration of Helsinki SA National Clinical Trials Register (SANCTR) Medicines Control Council (National Regulatory Authority)
o New protocols o Amendments o Additional sitesinvestigators
Ethics Committees (33 NHREC-registered) RegionalMunicipal DoH Export permits for bio samples (Nat Health Act 2003)
Clinical Trial Density Active sites million population
Nature Reviews Drug Discovery 7 13-14 (January 2008)
France 503
Germany 512 Canada
922
USA 1203
Czech Republic 776
553 sites
South Africa 119
757 sites
757 sites
533 sites
1084 sites
Argentina 269
Russia 77
China 04
India 07
34
Gateway to Africa
35
Why Africa bull Large accessible population relatively new to clinical trials
bull Experienced and willing investigators
bull Many clinical trial sites established by PDPs NGOs etc
bull Expanding therapeutic areas shifting burden of disease from
infectious to non-communicable diseases
bull Significantly improved infrastructure and accessibility
bull Rapidly evolving regulatory and ethics procedures
bull Potential for capacity building and sustainable clinical trial potential
36
Relatively young GCP culture Resident mentorships to build capacity Locations ndash accessibility for site monitoring Variable infrastructure esp electricity connectivity and
transportation Resourcing of public healthcare systems
Sub-Saharan Africa challenges
37
bull Second-largest continent
bull Spans NS and EW hemispheres
bull Second most populous continent 2014 estimate 1069 billion
bull Home to more than a quarter of the 196 independent countries
bull All 54 African countries are UN members
bull 39 urban population
bull 12 metropolitan areas gt 4m
bull gt 3000 distinct ethnicities
bull gt 2000 languages spoken
AFRICA hellip the true size
wwwcitypopulationdeworldAgglomerations 2015
38
SSV to SIV
0
5
10
15
20
25
30
35
40
45
Africa North America
Asia Pacific
Western Europe
Eastern Europe
Latin America
Source Quintiles South Africa SACRA Conference 2008
Wee
ks (A
vera
ge)
Start-Up Timelines
39
Region Median
Patients Site
of Sites
0 pts 1 - 3 pts 4 - 9 pts 10+ pts
Latin America 40 21 26 30 23
North America 30 29 29 24 18
Eastern Europe 60 15 31 26 27
Western Europe 40 15 22 29 34
Asia Pacific 40 19 30 34 18
Africa 100 4 17 28 51
Enrollment performance by region for 2008
Site Performance
Source Quintiles South Africa Presented SACRA Conference 2009
40
0 1 2 3 4 5 6 7 8 9
10
Latin America
North America
Eastern Europe
Western Europe
Asia Pacific
Africa
Num
ber o
f par
ticip
ants
MEDIAN site enrollment by region for 2008
Source Quintiles South Africa Presented SACRA Conference 2009
Site Performance
41
Source Quintiles South Africa Presented SACRA Conference 2009
s
ites
0
5
10
15
20
25
30
35
40
45
50
LatinAmerica
NorthAmerica
EasternEurope
WesternEurope
Asia Pacific Africa
0 pts
1 - 3 pts
4 - 9 pts
10+ pts
Enrollment performance by region for 2008
Site Performance
Chart1
0 pts
1 - 3 pts
4 - 9 pts
10+ pts
021
026
03
023
029
029
024
018
015
031
026
027
015
022
029
034
019
03
034
018
004
017
028
051
HIV
HIV
Resiratory amp Cancer
Male prevalence
Female prevalence
CVS
Overall death rates
Overall death rates
COPD
Asthma
Tracheabronchial lung cancer
Oesophageal cancer
prostate cancer
Trial metrics
COPD
Asthma
Tracheabronchial lung cancer
Oesophageal cancer
Prostate cancer
Cervical cancer
Breast cancer
Stroke
ill-defined heart disease
Diabetes mellitus
Ischaemic heart disease
Hypertension
Nephritisnephrosis
Stroke
ill-defined heart disease
Diabetes mellitus
Ischaemic heart disease
Hypertension
Nephritisnephrosis
Males
Female
UN - Male
SA 1997
SA 2004
UN - Female
SA 1997
SA 2004
0 pts
1 - 3 pts
4 - 9 pts
10+ pts
42
Source wwwclinicaltrialsgov 22-Oct-2010
Clinical trials registered across Africa
43
0
500
1000
1500
2000
2500
South Africa Kenya Malawi Tanzania Uganda Zambia
Selected African countries
2005
2010
2015
Source ClinTrialsgov
Trend 2005 - 2015
Source wwwclinicaltrialsgov 28-Aug-2015
44
AFRICA FOUND IN TRANSLATION
bull Vast treatment-naiumlve population bull Cost advantages (still) bull Diverse ethnicity amp morbidity bull Inverse seasonality bull Site capacity-building widely implemented bull Robust regulatory review bull Variable but generally good regulatory timelines bull Established GCP culture ndash sites and home-bred CROs
45
THANK YOU
Foliennummer 1
Triclinium A South African CRO
Collaboration with VPM SII
Vaccine Trials in SA 2015
Foliennummer 5
Foliennummer 6
Foliennummer 7
Foliennummer 8
Foliennummer 9
Foliennummer 10
Foliennummer 11
Foliennummer 12
Foliennummer 13
Foliennummer 14
Foliennummer 15
Foliennummer 16
Foliennummer 17
Distribution of clinical trial sites
Foliennummer 19
South Africa Leading Causes of Death
Foliennummer 21
Foliennummer 22
South Africa TB deaths by age group
Foliennummer 24
Foliennummer 25
Foliennummer 26
Foliennummer 27
Foliennummer 28
Foliennummer 29
Foliennummer 30
Foliennummer 31
SA Clinical Trial Regulatory Processes
Clinical Trial Density Active sites million population
Foliennummer 34
Why Africa
Foliennummer 36
AFRICA hellip the true size
SSV to SIV
Foliennummer 39
Foliennummer 40
Foliennummer 41
Foliennummer 42
Foliennummer 43
AFRICA FOUND IN TRANSLATION
Foliennummer 45
Region
Median
of Sites
Patients Site
0 pts
1 - 3 pts
4 - 9 pts
10+ pts
Latin America
4
21
26
30
23
North America
3
29
29
24
18
Eastern Europe
6
15
31
26
27
Western Europe
4
15
22
29
34
Asia Pacific
4
19
30
34
18
Africa
10
4
17
28
51
0 pts
1 - 3 pts
4 - 9 pts
10+ pts
Latin America
21
26
30
23
North America
29
29
24
18
Eastern Europe
15
31
26
27
Western Europe
15
22
29
34
Asia Pacific
19
30
34
18
Africa
4
17
28
51
Males
Female
15-19
210
150
20-24
340
205
25-29
395
300
30-34
460
360
35-39
600
405
40-44
800
500
45-49
1100
700
50-54
1600
1050
55-54
2300
1580
60-64
3340
2250
UN - Male
SA 1997
SA 2004
UN - Female
SA 1997
SA 2004
15-19
210
235
216
150
165
187
20-24
340
381
555
205
331
1085
25-29
395
625
1081
300
452
1985
30-34
460
817
2118
360
489
2267
35-39
600
916
2498
405
526
1890
40-44
800
1136
2765
500
615
1548
45-49
1100
1486
2744
700
800
1400
50-54
1600
2016
2979
1050
1116
1506
55-54
2300
2838
3270
1580
1626
1717
60-64
3340
3614
4146
2250
2201
2360
Stroke
ill-defined heart disease
Diabetes mellitus
Ischaemic heart disease
Hypertension
Nephritisnephrosis
Stroke
ill-defined heart disease
Diabetes mellitus
Ischaemic heart disease
Hypertension
Nephritisnephrosis
1999
34
345
20
248
14
10
1999
295
246
23
10
145
68
2000
36
362
218
249
152
112
2000
318
268
241
108
16
8
2001
35
372
22
25
15
125
2001
322
28
252
102
162
95
2002
405
298
24
26
147
126
2002
352
295
27
115
16
10
2003
425
32
245
285
152
15
2003
382
299
285
122
17
12
2004
39
325
255
26
165
16
2004
35
30
295
121
19
119
2005
36
328
265
26
15
162
2005
325
30
32
12
18
12
2006
35
336
27
258
155
16
2006
33
32
32
11
18
125
COPD
Asthma
Tracheabronchial lung cancer
Oesophageal cancer
prostate cancer
Cervical cancer
Breast cancer
1999
2001
12
135
10
26
2000
204
116
13
92
28
2001
222
131
133
96
27
2002
23
144
128
95
285
2003
243
149
124
94
29
2004
229
154
1255
87
29
2005
224
152
122
82
295
2006
224
136
116
75
3
COPD
Asthma
Tracheabronchial lung cancer
Oesophageal cancer
Prostate cancer
Cervical cancer
Breast cancer
1999
88
92
43
41
106
82
2000
96
95
4
43
11
81
2001
10
109
4
4
111
89
2002
10
116
4
4
112
85
2003
11
124
4
395
116
85
2004
102
1295
44
39
115
101
2005
105
128
42
38
1185
10
2006
10
12
42
32
1205
10
Based on this survey the researchers estimate that 109 of all South Africans over 2 years old were living with HIV in 2008 In 2002 and 2005 this figure was 114 and 108 respectively showing a degree of stabilisation Among those between 15 and 49 years old the estimated HIV prevalence was 169 in 2008 The survey found the prevalence among children aged 2-14 to be 25 down significantly since 2002 when prevalence was 56
Estimated HIV prevalence () among South Africans aged 2 years and older by age 2002-2008
Age
HIV +
HIV -
Children (2-14 years)
25
975
Youth (15-24 years)
87
913
Adults (25 and older)
168
832
(15-49 years)
169
831
Total (2 and older)
109
891
Estimated HIV prevalence among South Africans by age and sex 2008
Age
Male prevalence
Female prevalence
2-14
3
2
15-19
25
67
20-24
51
211
25-29
157
327
30-34
258
291
35-39
185
248
40-44
192
163
45-49
64
141
50-54
104
102
55-59
62
77
60+
35
18
Total
79
136
Among females HIV prevalence is highest in those between 25 and 29 years old among males the peak is in the group aged 30-34 years
HIV prevalence () by province 2002-2008
Province
2002
2005
2008
KwaZulu-Natal
117
165
158
Mpumalanga
141
152
154
Free State
149
126
126
North West
103
109
113
Gauteng
147
108
103
Eastern Cape
66
89
9
Limpopo
98
8
88
Northern Cape
84
54
59
Western Cape
107
19
38
National
114
108
109
The results of this study suggest that KwaZulu-Natal Mpumulanga and Free State have the highest HIV prevalence However the relatively small sample sizes may limit precision and in several cases the ranges of uncertainty overlap
HIV prevalence by population group 2008
Population group
Prevalence ()
African
136
864
White
03
997
Coloured
17
983
Indian
03
997
Studies of AIDS deaths
Latin America
Latin America
Latin America
Latin America
North America
North America
North America
North America
Eastern Europe
Eastern Europe
Eastern Europe
Eastern Europe
Western Europe
Western Europe
Western Europe
Western Europe
Asia Pacific
Asia Pacific
Asia Pacific
Asia Pacific
Africa
Africa
Africa
Africa
Country
Study starts
Subjects randomised
SubjectsStudy
USA
32
4385
13703125
Russia
20
788
394
Germany
19
1883
991052631579
UK
13
265
203846153846
South Africa
12
347
289166666667
Argentina
12
329
274166666667
Australia
11
195
177272727273
India
7
275
392857142857
Brazil
3
115
383333333333
Country
Initiation
Site activation
Recruitment
LOC setup
Unproductive sites
(Approval ndash FCI)
(FCI ndash FSFV)
(FSFV ndash LSFV)
(CPC ndash FSFV)
South Africa
19
38
153
357
21
Australia
117
63
401
239
11
Germany
16
37
401
224
21
UK
9
101
301
346
20
Russia
11
52
174
334
9
India
31
28
389
431
3
Argentina
94
67
288
32
13
Brazil
79
59
94
656
20
USA
44
31
149
26
Country
Pts Rand
Sites
Av CPP
Cost Per Country
Ethics Subm
Regulatory Fees
Add Inv Fees
CT Scan Total
Ethics + Regulatory
Total Regulatory Fees
South Africa
25
5
7250
181250
290
460
363
0
750
1113
Canada
18
4
832545
14985818
181818
0
0
1557576
181818
1818
Italy
7
2
10000
70000
2200
0
0
0
2200
2200
Germany
55
10
7000
385000
3000
0
0
12000
3000
3000
Peru
40
5
7000
280000
1500
1000
2000
60000
2500
4500
Poland
15
4
10000
150000
0
2500
2400
0
2500
4900
Spain
40
7
10500
420000
0
0
5450
0
0
5450
UK
12
4
13000
156000
0
0
5556
0
0
5556
Bulgaria
18
4
10000
180000
0
5000
1000
0
5000
6000
Taiwan
20
4
1179649
2359298
104167
313
5208
0
135467
6563
Czech Rep
10
2
10000
100000
1500
3000
3000
0
4500
7500
Greece
40
7
9000
360000
0
7500
0
0
7500
7500
Chile
15
4
10840
162600
1700
3600
3000
0
5300
8300
Belgium
25
6
12200
305000
3992
4332
0
0
8324
8324
Korea
30
3
10827
324802
1114
0
14324
0
1114
15438
Singapore
10
2
11565
115650
1750
0
17975
0
1750
19725
France
50
10
9000
450000
0
0
20000
0
0
20000
China
39
5
4978
194142
5224
0
39814
0
5224
40336
New Zealand
10
3
145244
145244
1973
0
43123
0
1973
45096
Israel
10
6
11140
111400
2060
3000
48400
16500
5060
53460
Brazil
30
6
10000
300000
2000
287356
5649202
0
487356
61366
Australia
24
6
40200
964800
0
500
82500
0
500
83000
23
543
109
532856799
3304716
26939
27700043
73748966
[1753EURO x 14 (ex rate) = $2454] [ $245416 hours=$153hour]
1095625
1095625
12271
1753
198089
198089
208514736842
South Africa
Canada
Italy
Germany
Peru
Poland
Spain
UK
Bulgaria
Taiwan
Czech Rep
Greece
Chile
Belgium
Korea
Singapore
France
China
New Zealand
Israel
Brazil
Australia
Country
Study starts
Subjects randomised
SubjectsStudy
USA
32
4385
13703125
Russia
20
788
394
Germany
19
1883
991052631579
UK
13
265
203846153846
South Africa
12
347
289166666667
Argentina
12
329
274166666667
Australia
11
195
177272727273
India
7
275
392857142857
Brazil
3
115
383333333333
Country
Initiation
Site activation
Recruitment
LOC setup
Unproductive sites
(Approval ndash FCI)
(FCI ndash FSFV)
(FSFV ndash LSFV)
(CPC ndash FSFV)
South Africa
19
38
153
357
21
Australia
117
63
401
239
11
Germany
16
37
401
224
21
UK
9
101
301
346
20
Russia
11
52
174
334
9
India
31
28
389
431
3
Argentina
94
67
288
32
13
Brazil
79
59
94
656
20
USA
44
31
149
26
Country
Pts Rand
Sites
Av CPP
Cost Per Country
Ethics Subm
Regulatory Fees
Add Inv Fees
CT Scan Total
Ethics + Regulatory
Total Regulatory Fees
China
39
5
4978
194142
522
0
39814
0
522
40336
Germany
55
10
7000
385000
3000
0
0
12000
3000
3000
Peru
40
5
7000
280000
1500
1000
2000
60000
2500
4500
South Africa
25
5
7250
181250
290
460
363
0
750
1113
Canada
18
4
8325
149858
1818
0
0
1557576
1818
1818
Greece
40
7
9000
360000
0
7500
0
0
7500
7500
France
50
10
9000
450000
0
0
20000
0
0
20000
Italy
7
2
10000
70000
2200
0
0
0
2200
2200
Poland
15
4
10000
150000
0
2500
2400
0
2500
4900
Bulgaria
18
4
10000
180000
0
5000
1000
0
5000
6000
Czech Rep
10
2
10000
100000
1500
3000
3000
0
4500
7500
Brazil
30
6
10000
300000
2000
2874
56492
0
4874
61366
Spain
40
7
10500
420000
0
0
5450
0
0
5450
Korea
30
3
10827
324802
1114
0
14324
0
1114
15438
Chile
15
4
10840
162600
1700
3600
3000
0
5300
8300
Israel
10
6
11140
111400
2060
3000
48400
16500
5060
53460
Singapore
10
2
11565
115650
1750
0
17975
0
1750
19725
Taiwan
20
4
11796
235930
1042
313
5208
0
1355
6563
Belgium
25
6
12200
305000
3992
4332
0
0
8324
8324
UK
12
4
13000
156000
0
0
5556
0
0
5556
New Zealand
10
3
14524
145244
1973
0
43123
0
1973
45096
Australia
24
6
40200
964800
0
500
82500
0
500
83000
23
543
109
5328568
33047
26939
277000
73748966
[1753EURO x 14 (ex rate) = $2454] [ $245416 hours=$153hour]
110
1095625
1227
1753
19809
20
21
China
Germany
Peru
South Africa
Canada
Greece
France
Italy
Poland
Bulgaria
Czech Rep
Brazil
Spain
Korea
Chile
Israel
Singapore
Taiwan
Belgium
UK
New Zealand
Australia
Population Group
IndianAsianOther
26
Mixed ethnicity
90
Caucasian
91
African
793
10000
IndianAsianOther
Mixed ethnicity
Caucasian
African
13
14
15
South African Trials
Whistle-Stop Tour
16
bull Ethnically a ldquoRainbow Nationrdquo
bull Populations representative of Africa Europe and Asia
17
Population 5495-million 1-Jul-2015 estimate
SA urbanrural profile
18
Cape Town Port Elizabeth
Durban
Pretoria
Joburg
Bloemfontein
Distribution of clinical trial sites
George
East London
Nelspruit
Richardrsquos Bay Kimberley
Welkom
19
Source Statistics South Africa 2015
3
9
979
IndianAsianOtherMixed ethnicityCaucasianAfrican
bull Young 44 aged lt 20 yrs bull Elderly 76 aged gt 60 yrs bull High number of treatment-naiumlve patients
SA Demographics
Chart1
9
0026
009
0091
0793
Sheet1
Sheet1
Sheet2
Sheet3
20
South Africa Leading Causes of Death
00
20
40
60
80
100
120
140 The ten leading underlying natural causes of death in South Africa (2009)
percentage
TB Flu amp Intest Heart Cereb Diab HIV HT Chron Immun Pneum Infect Other Vasc Mell Dis LRT Dis
Stats SA Rel P03093 Mortality and causes of death in South Africa 2009 Findings from death notification Nov-2011
Age group
TB 0-14 15-49 50-64 65+
Rank Rank Rank Rank
5 34 1 196 1 114 8 33
24
bull Well established research infrastructure bull Public and private sectors
28 teaching hospitals gt40000 tertiary care beds 140 private hospitals gt30000 beds 15 - 18 medical insurance
bull Large broad-based investigator database amp site networks bull Specialised Early Phase presence since 1970s bull GCPGLP and CLIA 88 compliant labs bull Specialist labs (biomarkers TB immunology
PKbioassay) bull Full support services (GMP-depots translations etc) bull Stringent ICH-compliant RAEC review policies
GCP is a legal requirement Informed Consent entrenched in Constitution
South Africa Advantages
25
bull Reliable (+) roads air links energy connectivity bull European Time bull Research language is English bull Inverse seasons bull Cost Currency bull Mobile-phone enabled obsessed population
South Africa Advantages
26
South Africa Track Record
bull Phase I-III data from SA included in hundreds of US amp European registration dossiers
bull Two entire NDA dossiers ndash rifapentine 1998 ndash tryptorelin (GnRH agonist) 2001) comprised SA data
bull 37 FDA inspections 1994-2009 1 OAI (27)
27
Therapeutic Indications
28
0
1
2
3
4
5
6
7
8
9
10
Belg
ium
Au
stria
Li
thua
nia
Can
ada
Luxe
mbo
urg
Mal
ta
Nor
way
Po
rtuga
l R
oman
ia
Rus
sia
Serb
ia
Swed
en
The
Net
herla
nds
USA
loca
l site
s U
SA c
entra
l site
C
zech
Rep
ublic
D
enm
ark
Esto
nia
Finl
and
Hun
gary
Ic
elan
d Ire
land
La
tvia
G
erm
any
Switz
erla
nd
Liec
hten
stei
n U
nite
d Ki
ngdo
m
Fran
ce
Italy
Au
stra
lia
Hon
g-Ko
ng
New
Zea
land
Si
ngap
ore
Taiw
an
Uga
nda
Pola
nd
Ukr
aine
C
hile
G
uate
mal
a Ja
pan
Isra
el
Slov
akia
Bu
lgar
ia
Gre
ece
Mal
aysi
a Ph
ilipp
ines
Pe
ru
Thai
land
Tu
rkey
Sl
oven
ia
Cos
ta R
ica
Mex
ico
Spai
n So
uth
Afric
a Ar
gent
ina
Sout
h Ko
rea
Col
ombi
a Pa
nam
a C
roat
ia
Indi
a Ve
nezu
ela
Braz
il C
hina
Mon
ths
Sout
h Afri
ca
Global Regulatory Review Timelines
Triclinium experience 2009-2015
Triclinium experience 2009 - 2015
29
Protocol release Country selection
Site Selection Collection of reg docs
Submission of RA application
EC application
Negotiate Site Contracts
EC Approvals
RA Approval amp Import permit
Site Initiation Import amp distribute drug
Import ancillary supplies Set up local labs
Set up EDC
Months
0
1
2
3
All EC approvals typically within 6
weeks
Site contracts signed within days
As soon as MCC approval obtained ALL sites can be initiated
Start-Up Activities in PARALLEL
GMO application (biologics)
30
0
2000
4000
6000
8000
10000
12000
14000C
hina
Ger
man
y
Per
u
Sou
th A
frica
Can
ada
Gre
ece
Fran
ce
Italy
Pol
and
Bul
garia
Cze
ch R
ep
Bra
zil
Spa
in
Kor
ea
Chi
le
Isra
el
Sin
gapo
re
Taiw
an
Bel
gium U
K
New
hellip
Aus
tralia
Source Bayer Presented SACRA Conference 2009
Aver
age
cost
per
pat
ient
(Eur
o)
Average Cost per Enrolled Participant
gt40000
Chart1
Average Cost Per Patient (Euro)
4978
7000
7000
7250
832545
9000
9000
10000
10000
10000
10000
10000
10500
10827
10840
11140
11565
1179649
12200
13000
145244
40200
Sheet1
Sheet2
Sheet2
Average Cost Per Patient (Euro)
Average Cost Per Patient
Sheet4
Ethics Subm
Regulatory Fees
Sheet3
Ethics + Regulatory
Total Ethics and Regulatory Fees
Add Inv Fees
Additional Investigator Application Fees
Total Regulatory Fees
Study starts
SubjectsStudy
31
Euro
0
10000
20000
30000
40000
50000
60000
70000
80000
90000S
outh
Afri
caC
anad
a
Italy
Ger
man
yP
eru
Pol
and
Spa
in UK
Bul
garia
Taiw
anC
zech
Rep
Gre
ece
Chi
leB
elgi
umK
orea
Sin
gapo
reFr
ance
Chi
naN
ew Z
eala
ndIs
rael
Bra
zil
Aus
tralia
Source Bayer Presented SACRA Conference 2009
Eur
os
Regulatory Application Fees
Chart1
Total Regulatory Fees
1113
181818
2200
3000
4500
4900
5450
5556
6000
656267
7500
7500
8300
8324
15438
19725
20000
403364
45096
53460
6136558
83000
Sheet1
Sheet2
Sheet2
Average Cost Per Patient (Euro)
Average Cost Per Patient
Sheet4
Ethics Subm
Regulatory Fees
Sheet3
Ethics + Regulatory
Total Ethics and Regulatory Fees
Add Inv Fees
Additional Investigator Application Fees
Total Regulatory Fees
Study starts
SubjectsStudy
32
SA Clinical Trial Regulatory Processes
Governed by SA-GCP and Declaration of Helsinki SA National Clinical Trials Register (SANCTR) Medicines Control Council (National Regulatory Authority)
o New protocols o Amendments o Additional sitesinvestigators
Ethics Committees (33 NHREC-registered) RegionalMunicipal DoH Export permits for bio samples (Nat Health Act 2003)
Clinical Trial Density Active sites million population
Nature Reviews Drug Discovery 7 13-14 (January 2008)
France 503
Germany 512 Canada
922
USA 1203
Czech Republic 776
553 sites
South Africa 119
757 sites
757 sites
533 sites
1084 sites
Argentina 269
Russia 77
China 04
India 07
34
Gateway to Africa
35
Why Africa bull Large accessible population relatively new to clinical trials
bull Experienced and willing investigators
bull Many clinical trial sites established by PDPs NGOs etc
bull Expanding therapeutic areas shifting burden of disease from
infectious to non-communicable diseases
bull Significantly improved infrastructure and accessibility
bull Rapidly evolving regulatory and ethics procedures
bull Potential for capacity building and sustainable clinical trial potential
36
Relatively young GCP culture Resident mentorships to build capacity Locations ndash accessibility for site monitoring Variable infrastructure esp electricity connectivity and
transportation Resourcing of public healthcare systems
Sub-Saharan Africa challenges
37
bull Second-largest continent
bull Spans NS and EW hemispheres
bull Second most populous continent 2014 estimate 1069 billion
bull Home to more than a quarter of the 196 independent countries
bull All 54 African countries are UN members
bull 39 urban population
bull 12 metropolitan areas gt 4m
bull gt 3000 distinct ethnicities
bull gt 2000 languages spoken
AFRICA hellip the true size
wwwcitypopulationdeworldAgglomerations 2015
38
SSV to SIV
0
5
10
15
20
25
30
35
40
45
Africa North America
Asia Pacific
Western Europe
Eastern Europe
Latin America
Source Quintiles South Africa SACRA Conference 2008
Wee
ks (A
vera
ge)
Start-Up Timelines
39
Region Median
Patients Site
of Sites
0 pts 1 - 3 pts 4 - 9 pts 10+ pts
Latin America 40 21 26 30 23
North America 30 29 29 24 18
Eastern Europe 60 15 31 26 27
Western Europe 40 15 22 29 34
Asia Pacific 40 19 30 34 18
Africa 100 4 17 28 51
Enrollment performance by region for 2008
Site Performance
Source Quintiles South Africa Presented SACRA Conference 2009
40
0 1 2 3 4 5 6 7 8 9
10
Latin America
North America
Eastern Europe
Western Europe
Asia Pacific
Africa
Num
ber o
f par
ticip
ants
MEDIAN site enrollment by region for 2008
Source Quintiles South Africa Presented SACRA Conference 2009
Site Performance
41
Source Quintiles South Africa Presented SACRA Conference 2009
s
ites
0
5
10
15
20
25
30
35
40
45
50
LatinAmerica
NorthAmerica
EasternEurope
WesternEurope
Asia Pacific Africa
0 pts
1 - 3 pts
4 - 9 pts
10+ pts
Enrollment performance by region for 2008
Site Performance
Chart1
0 pts
1 - 3 pts
4 - 9 pts
10+ pts
021
026
03
023
029
029
024
018
015
031
026
027
015
022
029
034
019
03
034
018
004
017
028
051
HIV
HIV
Resiratory amp Cancer
Male prevalence
Female prevalence
CVS
Overall death rates
Overall death rates
COPD
Asthma
Tracheabronchial lung cancer
Oesophageal cancer
prostate cancer
Trial metrics
COPD
Asthma
Tracheabronchial lung cancer
Oesophageal cancer
Prostate cancer
Cervical cancer
Breast cancer
Stroke
ill-defined heart disease
Diabetes mellitus
Ischaemic heart disease
Hypertension
Nephritisnephrosis
Stroke
ill-defined heart disease
Diabetes mellitus
Ischaemic heart disease
Hypertension
Nephritisnephrosis
Males
Female
UN - Male
SA 1997
SA 2004
UN - Female
SA 1997
SA 2004
0 pts
1 - 3 pts
4 - 9 pts
10+ pts
42
Source wwwclinicaltrialsgov 22-Oct-2010
Clinical trials registered across Africa
43
0
500
1000
1500
2000
2500
South Africa Kenya Malawi Tanzania Uganda Zambia
Selected African countries
2005
2010
2015
Source ClinTrialsgov
Trend 2005 - 2015
Source wwwclinicaltrialsgov 28-Aug-2015
44
AFRICA FOUND IN TRANSLATION
bull Vast treatment-naiumlve population bull Cost advantages (still) bull Diverse ethnicity amp morbidity bull Inverse seasonality bull Site capacity-building widely implemented bull Robust regulatory review bull Variable but generally good regulatory timelines bull Established GCP culture ndash sites and home-bred CROs
45
THANK YOU
Foliennummer 1
Triclinium A South African CRO
Collaboration with VPM SII
Vaccine Trials in SA 2015
Foliennummer 5
Foliennummer 6
Foliennummer 7
Foliennummer 8
Foliennummer 9
Foliennummer 10
Foliennummer 11
Foliennummer 12
Foliennummer 13
Foliennummer 14
Foliennummer 15
Foliennummer 16
Foliennummer 17
Distribution of clinical trial sites
Foliennummer 19
South Africa Leading Causes of Death
Foliennummer 21
Foliennummer 22
South Africa TB deaths by age group
Foliennummer 24
Foliennummer 25
Foliennummer 26
Foliennummer 27
Foliennummer 28
Foliennummer 29
Foliennummer 30
Foliennummer 31
SA Clinical Trial Regulatory Processes
Clinical Trial Density Active sites million population
Foliennummer 34
Why Africa
Foliennummer 36
AFRICA hellip the true size
SSV to SIV
Foliennummer 39
Foliennummer 40
Foliennummer 41
Foliennummer 42
Foliennummer 43
AFRICA FOUND IN TRANSLATION
Foliennummer 45
Region
Median
of Sites
Patients Site
0 pts
1 - 3 pts
4 - 9 pts
10+ pts
Latin America
4
21
26
30
23
North America
3
29
29
24
18
Eastern Europe
6
15
31
26
27
Western Europe
4
15
22
29
34
Asia Pacific
4
19
30
34
18
Africa
10
4
17
28
51
0 pts
1 - 3 pts
4 - 9 pts
10+ pts
Latin America
21
26
30
23
North America
29
29
24
18
Eastern Europe
15
31
26
27
Western Europe
15
22
29
34
Asia Pacific
19
30
34
18
Africa
4
17
28
51
Males
Female
15-19
210
150
20-24
340
205
25-29
395
300
30-34
460
360
35-39
600
405
40-44
800
500
45-49
1100
700
50-54
1600
1050
55-54
2300
1580
60-64
3340
2250
UN - Male
SA 1997
SA 2004
UN - Female
SA 1997
SA 2004
15-19
210
235
216
150
165
187
20-24
340
381
555
205
331
1085
25-29
395
625
1081
300
452
1985
30-34
460
817
2118
360
489
2267
35-39
600
916
2498
405
526
1890
40-44
800
1136
2765
500
615
1548
45-49
1100
1486
2744
700
800
1400
50-54
1600
2016
2979
1050
1116
1506
55-54
2300
2838
3270
1580
1626
1717
60-64
3340
3614
4146
2250
2201
2360
Stroke
ill-defined heart disease
Diabetes mellitus
Ischaemic heart disease
Hypertension
Nephritisnephrosis
Stroke
ill-defined heart disease
Diabetes mellitus
Ischaemic heart disease
Hypertension
Nephritisnephrosis
1999
34
345
20
248
14
10
1999
295
246
23
10
145
68
2000
36
362
218
249
152
112
2000
318
268
241
108
16
8
2001
35
372
22
25
15
125
2001
322
28
252
102
162
95
2002
405
298
24
26
147
126
2002
352
295
27
115
16
10
2003
425
32
245
285
152
15
2003
382
299
285
122
17
12
2004
39
325
255
26
165
16
2004
35
30
295
121
19
119
2005
36
328
265
26
15
162
2005
325
30
32
12
18
12
2006
35
336
27
258
155
16
2006
33
32
32
11
18
125
COPD
Asthma
Tracheabronchial lung cancer
Oesophageal cancer
prostate cancer
Cervical cancer
Breast cancer
1999
2001
12
135
10
26
2000
204
116
13
92
28
2001
222
131
133
96
27
2002
23
144
128
95
285
2003
243
149
124
94
29
2004
229
154
1255
87
29
2005
224
152
122
82
295
2006
224
136
116
75
3
COPD
Asthma
Tracheabronchial lung cancer
Oesophageal cancer
Prostate cancer
Cervical cancer
Breast cancer
1999
88
92
43
41
106
82
2000
96
95
4
43
11
81
2001
10
109
4
4
111
89
2002
10
116
4
4
112
85
2003
11
124
4
395
116
85
2004
102
1295
44
39
115
101
2005
105
128
42
38
1185
10
2006
10
12
42
32
1205
10
Based on this survey the researchers estimate that 109 of all South Africans over 2 years old were living with HIV in 2008 In 2002 and 2005 this figure was 114 and 108 respectively showing a degree of stabilisation Among those between 15 and 49 years old the estimated HIV prevalence was 169 in 2008 The survey found the prevalence among children aged 2-14 to be 25 down significantly since 2002 when prevalence was 56
Estimated HIV prevalence () among South Africans aged 2 years and older by age 2002-2008
Age
HIV +
HIV -
Children (2-14 years)
25
975
Youth (15-24 years)
87
913
Adults (25 and older)
168
832
(15-49 years)
169
831
Total (2 and older)
109
891
Estimated HIV prevalence among South Africans by age and sex 2008
Age
Male prevalence
Female prevalence
2-14
3
2
15-19
25
67
20-24
51
211
25-29
157
327
30-34
258
291
35-39
185
248
40-44
192
163
45-49
64
141
50-54
104
102
55-59
62
77
60+
35
18
Total
79
136
Among females HIV prevalence is highest in those between 25 and 29 years old among males the peak is in the group aged 30-34 years
HIV prevalence () by province 2002-2008
Province
2002
2005
2008
KwaZulu-Natal
117
165
158
Mpumalanga
141
152
154
Free State
149
126
126
North West
103
109
113
Gauteng
147
108
103
Eastern Cape
66
89
9
Limpopo
98
8
88
Northern Cape
84
54
59
Western Cape
107
19
38
National
114
108
109
The results of this study suggest that KwaZulu-Natal Mpumulanga and Free State have the highest HIV prevalence However the relatively small sample sizes may limit precision and in several cases the ranges of uncertainty overlap
HIV prevalence by population group 2008
Population group
Prevalence ()
African
136
864
White
03
997
Coloured
17
983
Indian
03
997
Studies of AIDS deaths
Latin America
Latin America
Latin America
Latin America
North America
North America
North America
North America
Eastern Europe
Eastern Europe
Eastern Europe
Eastern Europe
Western Europe
Western Europe
Western Europe
Western Europe
Asia Pacific
Asia Pacific
Asia Pacific
Asia Pacific
Africa
Africa
Africa
Africa
Country
Study starts
Subjects randomised
SubjectsStudy
USA
32
4385
13703125
Russia
20
788
394
Germany
19
1883
991052631579
UK
13
265
203846153846
South Africa
12
347
289166666667
Argentina
12
329
274166666667
Australia
11
195
177272727273
India
7
275
392857142857
Brazil
3
115
383333333333
Country
Initiation
Site activation
Recruitment
LOC setup
Unproductive sites
(Approval ndash FCI)
(FCI ndash FSFV)
(FSFV ndash LSFV)
(CPC ndash FSFV)
South Africa
19
38
153
357
21
Australia
117
63
401
239
11
Germany
16
37
401
224
21
UK
9
101
301
346
20
Russia
11
52
174
334
9
India
31
28
389
431
3
Argentina
94
67
288
32
13
Brazil
79
59
94
656
20
USA
44
31
149
26
Country
Pts Rand
Sites
Av CPP
Cost Per Country
Ethics Subm
Regulatory Fees
Add Inv Fees
CT Scan Total
Ethics + Regulatory
Total Regulatory Fees
South Africa
25
5
7250
181250
290
460
363
0
750
1113
Canada
18
4
832545
14985818
181818
0
0
1557576
181818
1818
Italy
7
2
10000
70000
2200
0
0
0
2200
2200
Germany
55
10
7000
385000
3000
0
0
12000
3000
3000
Peru
40
5
7000
280000
1500
1000
2000
60000
2500
4500
Poland
15
4
10000
150000
0
2500
2400
0
2500
4900
Spain
40
7
10500
420000
0
0
5450
0
0
5450
UK
12
4
13000
156000
0
0
5556
0
0
5556
Bulgaria
18
4
10000
180000
0
5000
1000
0
5000
6000
Taiwan
20
4
1179649
2359298
104167
313
5208
0
135467
6563
Czech Rep
10
2
10000
100000
1500
3000
3000
0
4500
7500
Greece
40
7
9000
360000
0
7500
0
0
7500
7500
Chile
15
4
10840
162600
1700
3600
3000
0
5300
8300
Belgium
25
6
12200
305000
3992
4332
0
0
8324
8324
Korea
30
3
10827
324802
1114
0
14324
0
1114
15438
Singapore
10
2
11565
115650
1750
0
17975
0
1750
19725
France
50
10
9000
450000
0
0
20000
0
0
20000
China
39
5
4978
194142
5224
0
39814
0
5224
40336
New Zealand
10
3
145244
145244
1973
0
43123
0
1973
45096
Israel
10
6
11140
111400
2060
3000
48400
16500
5060
53460
Brazil
30
6
10000
300000
2000
287356
5649202
0
487356
61366
Australia
24
6
40200
964800
0
500
82500
0
500
83000
23
543
109
532856799
3304716
26939
27700043
73748966
[1753EURO x 14 (ex rate) = $2454] [ $245416 hours=$153hour]
1095625
1095625
12271
1753
198089
198089
208514736842
South Africa
Canada
Italy
Germany
Peru
Poland
Spain
UK
Bulgaria
Taiwan
Czech Rep
Greece
Chile
Belgium
Korea
Singapore
France
China
New Zealand
Israel
Brazil
Australia
Country
Study starts
Subjects randomised
SubjectsStudy
USA
32
4385
13703125
Russia
20
788
394
Germany
19
1883
991052631579
UK
13
265
203846153846
South Africa
12
347
289166666667
Argentina
12
329
274166666667
Australia
11
195
177272727273
India
7
275
392857142857
Brazil
3
115
383333333333
Country
Initiation
Site activation
Recruitment
LOC setup
Unproductive sites
(Approval ndash FCI)
(FCI ndash FSFV)
(FSFV ndash LSFV)
(CPC ndash FSFV)
South Africa
19
38
153
357
21
Australia
117
63
401
239
11
Germany
16
37
401
224
21
UK
9
101
301
346
20
Russia
11
52
174
334
9
India
31
28
389
431
3
Argentina
94
67
288
32
13
Brazil
79
59
94
656
20
USA
44
31
149
26
Country
Pts Rand
Sites
Av CPP
Cost Per Country
Ethics Subm
Regulatory Fees
Add Inv Fees
CT Scan Total
Ethics + Regulatory
Total Regulatory Fees
China
39
5
4978
194142
522
0
39814
0
522
40336
Germany
55
10
7000
385000
3000
0
0
12000
3000
3000
Peru
40
5
7000
280000
1500
1000
2000
60000
2500
4500
South Africa
25
5
7250
181250
290
460
363
0
750
1113
Canada
18
4
8325
149858
1818
0
0
1557576
1818
1818
Greece
40
7
9000
360000
0
7500
0
0
7500
7500
France
50
10
9000
450000
0
0
20000
0
0
20000
Italy
7
2
10000
70000
2200
0
0
0
2200
2200
Poland
15
4
10000
150000
0
2500
2400
0
2500
4900
Bulgaria
18
4
10000
180000
0
5000
1000
0
5000
6000
Czech Rep
10
2
10000
100000
1500
3000
3000
0
4500
7500
Brazil
30
6
10000
300000
2000
2874
56492
0
4874
61366
Spain
40
7
10500
420000
0
0
5450
0
0
5450
Korea
30
3
10827
324802
1114
0
14324
0
1114
15438
Chile
15
4
10840
162600
1700
3600
3000
0
5300
8300
Israel
10
6
11140
111400
2060
3000
48400
16500
5060
53460
Singapore
10
2
11565
115650
1750
0
17975
0
1750
19725
Taiwan
20
4
11796
235930
1042
313
5208
0
1355
6563
Belgium
25
6
12200
305000
3992
4332
0
0
8324
8324
UK
12
4
13000
156000
0
0
5556
0
0
5556
New Zealand
10
3
14524
145244
1973
0
43123
0
1973
45096
Australia
24
6
40200
964800
0
500
82500
0
500
83000
23
543
109
5328568
33047
26939
277000
73748966
[1753EURO x 14 (ex rate) = $2454] [ $245416 hours=$153hour]
110
1095625
1227
1753
19809
20
21
China
Germany
Peru
South Africa
Canada
Greece
France
Italy
Poland
Bulgaria
Czech Rep
Brazil
Spain
Korea
Chile
Israel
Singapore
Taiwan
Belgium
UK
New Zealand
Australia
Population Group
IndianAsianOther
26
Mixed ethnicity
90
Caucasian
91
African
793
10000
IndianAsianOther
Mixed ethnicity
Caucasian
African
14
15
South African Trials
Whistle-Stop Tour
16
bull Ethnically a ldquoRainbow Nationrdquo
bull Populations representative of Africa Europe and Asia
17
Population 5495-million 1-Jul-2015 estimate
SA urbanrural profile
18
Cape Town Port Elizabeth
Durban
Pretoria
Joburg
Bloemfontein
Distribution of clinical trial sites
George
East London
Nelspruit
Richardrsquos Bay Kimberley
Welkom
19
Source Statistics South Africa 2015
3
9
979
IndianAsianOtherMixed ethnicityCaucasianAfrican
bull Young 44 aged lt 20 yrs bull Elderly 76 aged gt 60 yrs bull High number of treatment-naiumlve patients
SA Demographics
Chart1
9
0026
009
0091
0793
Sheet1
Sheet1
Sheet2
Sheet3
20
South Africa Leading Causes of Death
00
20
40
60
80
100
120
140 The ten leading underlying natural causes of death in South Africa (2009)
percentage
TB Flu amp Intest Heart Cereb Diab HIV HT Chron Immun Pneum Infect Other Vasc Mell Dis LRT Dis
Stats SA Rel P03093 Mortality and causes of death in South Africa 2009 Findings from death notification Nov-2011
Age group
TB 0-14 15-49 50-64 65+
Rank Rank Rank Rank
5 34 1 196 1 114 8 33
24
bull Well established research infrastructure bull Public and private sectors
28 teaching hospitals gt40000 tertiary care beds 140 private hospitals gt30000 beds 15 - 18 medical insurance
bull Large broad-based investigator database amp site networks bull Specialised Early Phase presence since 1970s bull GCPGLP and CLIA 88 compliant labs bull Specialist labs (biomarkers TB immunology
PKbioassay) bull Full support services (GMP-depots translations etc) bull Stringent ICH-compliant RAEC review policies
GCP is a legal requirement Informed Consent entrenched in Constitution
South Africa Advantages
25
bull Reliable (+) roads air links energy connectivity bull European Time bull Research language is English bull Inverse seasons bull Cost Currency bull Mobile-phone enabled obsessed population
South Africa Advantages
26
South Africa Track Record
bull Phase I-III data from SA included in hundreds of US amp European registration dossiers
bull Two entire NDA dossiers ndash rifapentine 1998 ndash tryptorelin (GnRH agonist) 2001) comprised SA data
bull 37 FDA inspections 1994-2009 1 OAI (27)
27
Therapeutic Indications
28
0
1
2
3
4
5
6
7
8
9
10
Belg
ium
Au
stria
Li
thua
nia
Can
ada
Luxe
mbo
urg
Mal
ta
Nor
way
Po
rtuga
l R
oman
ia
Rus
sia
Serb
ia
Swed
en
The
Net
herla
nds
USA
loca
l site
s U
SA c
entra
l site
C
zech
Rep
ublic
D
enm
ark
Esto
nia
Finl
and
Hun
gary
Ic
elan
d Ire
land
La
tvia
G
erm
any
Switz
erla
nd
Liec
hten
stei
n U
nite
d Ki
ngdo
m
Fran
ce
Italy
Au
stra
lia
Hon
g-Ko
ng
New
Zea
land
Si
ngap
ore
Taiw
an
Uga
nda
Pola
nd
Ukr
aine
C
hile
G
uate
mal
a Ja
pan
Isra
el
Slov
akia
Bu
lgar
ia
Gre
ece
Mal
aysi
a Ph
ilipp
ines
Pe
ru
Thai
land
Tu
rkey
Sl
oven
ia
Cos
ta R
ica
Mex
ico
Spai
n So
uth
Afric
a Ar
gent
ina
Sout
h Ko
rea
Col
ombi
a Pa
nam
a C
roat
ia
Indi
a Ve
nezu
ela
Braz
il C
hina
Mon
ths
Sout
h Afri
ca
Global Regulatory Review Timelines
Triclinium experience 2009-2015
Triclinium experience 2009 - 2015
29
Protocol release Country selection
Site Selection Collection of reg docs
Submission of RA application
EC application
Negotiate Site Contracts
EC Approvals
RA Approval amp Import permit
Site Initiation Import amp distribute drug
Import ancillary supplies Set up local labs
Set up EDC
Months
0
1
2
3
All EC approvals typically within 6
weeks
Site contracts signed within days
As soon as MCC approval obtained ALL sites can be initiated
Start-Up Activities in PARALLEL
GMO application (biologics)
30
0
2000
4000
6000
8000
10000
12000
14000C
hina
Ger
man
y
Per
u
Sou
th A
frica
Can
ada
Gre
ece
Fran
ce
Italy
Pol
and
Bul
garia
Cze
ch R
ep
Bra
zil
Spa
in
Kor
ea
Chi
le
Isra
el
Sin
gapo
re
Taiw
an
Bel
gium U
K
New
hellip
Aus
tralia
Source Bayer Presented SACRA Conference 2009
Aver
age
cost
per
pat
ient
(Eur
o)
Average Cost per Enrolled Participant
gt40000
Chart1
Average Cost Per Patient (Euro)
4978
7000
7000
7250
832545
9000
9000
10000
10000
10000
10000
10000
10500
10827
10840
11140
11565
1179649
12200
13000
145244
40200
Sheet1
Sheet2
Sheet2
Average Cost Per Patient (Euro)
Average Cost Per Patient
Sheet4
Ethics Subm
Regulatory Fees
Sheet3
Ethics + Regulatory
Total Ethics and Regulatory Fees
Add Inv Fees
Additional Investigator Application Fees
Total Regulatory Fees
Study starts
SubjectsStudy
31
Euro
0
10000
20000
30000
40000
50000
60000
70000
80000
90000S
outh
Afri
caC
anad
a
Italy
Ger
man
yP
eru
Pol
and
Spa
in UK
Bul
garia
Taiw
anC
zech
Rep
Gre
ece
Chi
leB
elgi
umK
orea
Sin
gapo
reFr
ance
Chi
naN
ew Z
eala
ndIs
rael
Bra
zil
Aus
tralia
Source Bayer Presented SACRA Conference 2009
Eur
os
Regulatory Application Fees
Chart1
Total Regulatory Fees
1113
181818
2200
3000
4500
4900
5450
5556
6000
656267
7500
7500
8300
8324
15438
19725
20000
403364
45096
53460
6136558
83000
Sheet1
Sheet2
Sheet2
Average Cost Per Patient (Euro)
Average Cost Per Patient
Sheet4
Ethics Subm
Regulatory Fees
Sheet3
Ethics + Regulatory
Total Ethics and Regulatory Fees
Add Inv Fees
Additional Investigator Application Fees
Total Regulatory Fees
Study starts
SubjectsStudy
32
SA Clinical Trial Regulatory Processes
Governed by SA-GCP and Declaration of Helsinki SA National Clinical Trials Register (SANCTR) Medicines Control Council (National Regulatory Authority)
o New protocols o Amendments o Additional sitesinvestigators
Ethics Committees (33 NHREC-registered) RegionalMunicipal DoH Export permits for bio samples (Nat Health Act 2003)
Clinical Trial Density Active sites million population
Nature Reviews Drug Discovery 7 13-14 (January 2008)
France 503
Germany 512 Canada
922
USA 1203
Czech Republic 776
553 sites
South Africa 119
757 sites
757 sites
533 sites
1084 sites
Argentina 269
Russia 77
China 04
India 07
34
Gateway to Africa
35
Why Africa bull Large accessible population relatively new to clinical trials
bull Experienced and willing investigators
bull Many clinical trial sites established by PDPs NGOs etc
bull Expanding therapeutic areas shifting burden of disease from
infectious to non-communicable diseases
bull Significantly improved infrastructure and accessibility
bull Rapidly evolving regulatory and ethics procedures
bull Potential for capacity building and sustainable clinical trial potential
36
Relatively young GCP culture Resident mentorships to build capacity Locations ndash accessibility for site monitoring Variable infrastructure esp electricity connectivity and
transportation Resourcing of public healthcare systems
Sub-Saharan Africa challenges
37
bull Second-largest continent
bull Spans NS and EW hemispheres
bull Second most populous continent 2014 estimate 1069 billion
bull Home to more than a quarter of the 196 independent countries
bull All 54 African countries are UN members
bull 39 urban population
bull 12 metropolitan areas gt 4m
bull gt 3000 distinct ethnicities
bull gt 2000 languages spoken
AFRICA hellip the true size
wwwcitypopulationdeworldAgglomerations 2015
38
SSV to SIV
0
5
10
15
20
25
30
35
40
45
Africa North America
Asia Pacific
Western Europe
Eastern Europe
Latin America
Source Quintiles South Africa SACRA Conference 2008
Wee
ks (A
vera
ge)
Start-Up Timelines
39
Region Median
Patients Site
of Sites
0 pts 1 - 3 pts 4 - 9 pts 10+ pts
Latin America 40 21 26 30 23
North America 30 29 29 24 18
Eastern Europe 60 15 31 26 27
Western Europe 40 15 22 29 34
Asia Pacific 40 19 30 34 18
Africa 100 4 17 28 51
Enrollment performance by region for 2008
Site Performance
Source Quintiles South Africa Presented SACRA Conference 2009
40
0 1 2 3 4 5 6 7 8 9
10
Latin America
North America
Eastern Europe
Western Europe
Asia Pacific
Africa
Num
ber o
f par
ticip
ants
MEDIAN site enrollment by region for 2008
Source Quintiles South Africa Presented SACRA Conference 2009
Site Performance
41
Source Quintiles South Africa Presented SACRA Conference 2009
s
ites
0
5
10
15
20
25
30
35
40
45
50
LatinAmerica
NorthAmerica
EasternEurope
WesternEurope
Asia Pacific Africa
0 pts
1 - 3 pts
4 - 9 pts
10+ pts
Enrollment performance by region for 2008
Site Performance
Chart1
0 pts
1 - 3 pts
4 - 9 pts
10+ pts
021
026
03
023
029
029
024
018
015
031
026
027
015
022
029
034
019
03
034
018
004
017
028
051
HIV
HIV
Resiratory amp Cancer
Male prevalence
Female prevalence
CVS
Overall death rates
Overall death rates
COPD
Asthma
Tracheabronchial lung cancer
Oesophageal cancer
prostate cancer
Trial metrics
COPD
Asthma
Tracheabronchial lung cancer
Oesophageal cancer
Prostate cancer
Cervical cancer
Breast cancer
Stroke
ill-defined heart disease
Diabetes mellitus
Ischaemic heart disease
Hypertension
Nephritisnephrosis
Stroke
ill-defined heart disease
Diabetes mellitus
Ischaemic heart disease
Hypertension
Nephritisnephrosis
Males
Female
UN - Male
SA 1997
SA 2004
UN - Female
SA 1997
SA 2004
0 pts
1 - 3 pts
4 - 9 pts
10+ pts
42
Source wwwclinicaltrialsgov 22-Oct-2010
Clinical trials registered across Africa
43
0
500
1000
1500
2000
2500
South Africa Kenya Malawi Tanzania Uganda Zambia
Selected African countries
2005
2010
2015
Source ClinTrialsgov
Trend 2005 - 2015
Source wwwclinicaltrialsgov 28-Aug-2015
44
AFRICA FOUND IN TRANSLATION
bull Vast treatment-naiumlve population bull Cost advantages (still) bull Diverse ethnicity amp morbidity bull Inverse seasonality bull Site capacity-building widely implemented bull Robust regulatory review bull Variable but generally good regulatory timelines bull Established GCP culture ndash sites and home-bred CROs
45
THANK YOU
Foliennummer 1
Triclinium A South African CRO
Collaboration with VPM SII
Vaccine Trials in SA 2015
Foliennummer 5
Foliennummer 6
Foliennummer 7
Foliennummer 8
Foliennummer 9
Foliennummer 10
Foliennummer 11
Foliennummer 12
Foliennummer 13
Foliennummer 14
Foliennummer 15
Foliennummer 16
Foliennummer 17
Distribution of clinical trial sites
Foliennummer 19
South Africa Leading Causes of Death
Foliennummer 21
Foliennummer 22
South Africa TB deaths by age group
Foliennummer 24
Foliennummer 25
Foliennummer 26
Foliennummer 27
Foliennummer 28
Foliennummer 29
Foliennummer 30
Foliennummer 31
SA Clinical Trial Regulatory Processes
Clinical Trial Density Active sites million population
Foliennummer 34
Why Africa
Foliennummer 36
AFRICA hellip the true size
SSV to SIV
Foliennummer 39
Foliennummer 40
Foliennummer 41
Foliennummer 42
Foliennummer 43
AFRICA FOUND IN TRANSLATION
Foliennummer 45
Region
Median
of Sites
Patients Site
0 pts
1 - 3 pts
4 - 9 pts
10+ pts
Latin America
4
21
26
30
23
North America
3
29
29
24
18
Eastern Europe
6
15
31
26
27
Western Europe
4
15
22
29
34
Asia Pacific
4
19
30
34
18
Africa
10
4
17
28
51
0 pts
1 - 3 pts
4 - 9 pts
10+ pts
Latin America
21
26
30
23
North America
29
29
24
18
Eastern Europe
15
31
26
27
Western Europe
15
22
29
34
Asia Pacific
19
30
34
18
Africa
4
17
28
51
Males
Female
15-19
210
150
20-24
340
205
25-29
395
300
30-34
460
360
35-39
600
405
40-44
800
500
45-49
1100
700
50-54
1600
1050
55-54
2300
1580
60-64
3340
2250
UN - Male
SA 1997
SA 2004
UN - Female
SA 1997
SA 2004
15-19
210
235
216
150
165
187
20-24
340
381
555
205
331
1085
25-29
395
625
1081
300
452
1985
30-34
460
817
2118
360
489
2267
35-39
600
916
2498
405
526
1890
40-44
800
1136
2765
500
615
1548
45-49
1100
1486
2744
700
800
1400
50-54
1600
2016
2979
1050
1116
1506
55-54
2300
2838
3270
1580
1626
1717
60-64
3340
3614
4146
2250
2201
2360
Stroke
ill-defined heart disease
Diabetes mellitus
Ischaemic heart disease
Hypertension
Nephritisnephrosis
Stroke
ill-defined heart disease
Diabetes mellitus
Ischaemic heart disease
Hypertension
Nephritisnephrosis
1999
34
345
20
248
14
10
1999
295
246
23
10
145
68
2000
36
362
218
249
152
112
2000
318
268
241
108
16
8
2001
35
372
22
25
15
125
2001
322
28
252
102
162
95
2002
405
298
24
26
147
126
2002
352
295
27
115
16
10
2003
425
32
245
285
152
15
2003
382
299
285
122
17
12
2004
39
325
255
26
165
16
2004
35
30
295
121
19
119
2005
36
328
265
26
15
162
2005
325
30
32
12
18
12
2006
35
336
27
258
155
16
2006
33
32
32
11
18
125
COPD
Asthma
Tracheabronchial lung cancer
Oesophageal cancer
prostate cancer
Cervical cancer
Breast cancer
1999
2001
12
135
10
26
2000
204
116
13
92
28
2001
222
131
133
96
27
2002
23
144
128
95
285
2003
243
149
124
94
29
2004
229
154
1255
87
29
2005
224
152
122
82
295
2006
224
136
116
75
3
COPD
Asthma
Tracheabronchial lung cancer
Oesophageal cancer
Prostate cancer
Cervical cancer
Breast cancer
1999
88
92
43
41
106
82
2000
96
95
4
43
11
81
2001
10
109
4
4
111
89
2002
10
116
4
4
112
85
2003
11
124
4
395
116
85
2004
102
1295
44
39
115
101
2005
105
128
42
38
1185
10
2006
10
12
42
32
1205
10
Based on this survey the researchers estimate that 109 of all South Africans over 2 years old were living with HIV in 2008 In 2002 and 2005 this figure was 114 and 108 respectively showing a degree of stabilisation Among those between 15 and 49 years old the estimated HIV prevalence was 169 in 2008 The survey found the prevalence among children aged 2-14 to be 25 down significantly since 2002 when prevalence was 56
Estimated HIV prevalence () among South Africans aged 2 years and older by age 2002-2008
Age
HIV +
HIV -
Children (2-14 years)
25
975
Youth (15-24 years)
87
913
Adults (25 and older)
168
832
(15-49 years)
169
831
Total (2 and older)
109
891
Estimated HIV prevalence among South Africans by age and sex 2008
Age
Male prevalence
Female prevalence
2-14
3
2
15-19
25
67
20-24
51
211
25-29
157
327
30-34
258
291
35-39
185
248
40-44
192
163
45-49
64
141
50-54
104
102
55-59
62
77
60+
35
18
Total
79
136
Among females HIV prevalence is highest in those between 25 and 29 years old among males the peak is in the group aged 30-34 years
HIV prevalence () by province 2002-2008
Province
2002
2005
2008
KwaZulu-Natal
117
165
158
Mpumalanga
141
152
154
Free State
149
126
126
North West
103
109
113
Gauteng
147
108
103
Eastern Cape
66
89
9
Limpopo
98
8
88
Northern Cape
84
54
59
Western Cape
107
19
38
National
114
108
109
The results of this study suggest that KwaZulu-Natal Mpumulanga and Free State have the highest HIV prevalence However the relatively small sample sizes may limit precision and in several cases the ranges of uncertainty overlap
HIV prevalence by population group 2008
Population group
Prevalence ()
African
136
864
White
03
997
Coloured
17
983
Indian
03
997
Studies of AIDS deaths
Latin America
Latin America
Latin America
Latin America
North America
North America
North America
North America
Eastern Europe
Eastern Europe
Eastern Europe
Eastern Europe
Western Europe
Western Europe
Western Europe
Western Europe
Asia Pacific
Asia Pacific
Asia Pacific
Asia Pacific
Africa
Africa
Africa
Africa
Country
Study starts
Subjects randomised
SubjectsStudy
USA
32
4385
13703125
Russia
20
788
394
Germany
19
1883
991052631579
UK
13
265
203846153846
South Africa
12
347
289166666667
Argentina
12
329
274166666667
Australia
11
195
177272727273
India
7
275
392857142857
Brazil
3
115
383333333333
Country
Initiation
Site activation
Recruitment
LOC setup
Unproductive sites
(Approval ndash FCI)
(FCI ndash FSFV)
(FSFV ndash LSFV)
(CPC ndash FSFV)
South Africa
19
38
153
357
21
Australia
117
63
401
239
11
Germany
16
37
401
224
21
UK
9
101
301
346
20
Russia
11
52
174
334
9
India
31
28
389
431
3
Argentina
94
67
288
32
13
Brazil
79
59
94
656
20
USA
44
31
149
26
Country
Pts Rand
Sites
Av CPP
Cost Per Country
Ethics Subm
Regulatory Fees
Add Inv Fees
CT Scan Total
Ethics + Regulatory
Total Regulatory Fees
South Africa
25
5
7250
181250
290
460
363
0
750
1113
Canada
18
4
832545
14985818
181818
0
0
1557576
181818
1818
Italy
7
2
10000
70000
2200
0
0
0
2200
2200
Germany
55
10
7000
385000
3000
0
0
12000
3000
3000
Peru
40
5
7000
280000
1500
1000
2000
60000
2500
4500
Poland
15
4
10000
150000
0
2500
2400
0
2500
4900
Spain
40
7
10500
420000
0
0
5450
0
0
5450
UK
12
4
13000
156000
0
0
5556
0
0
5556
Bulgaria
18
4
10000
180000
0
5000
1000
0
5000
6000
Taiwan
20
4
1179649
2359298
104167
313
5208
0
135467
6563
Czech Rep
10
2
10000
100000
1500
3000
3000
0
4500
7500
Greece
40
7
9000
360000
0
7500
0
0
7500
7500
Chile
15
4
10840
162600
1700
3600
3000
0
5300
8300
Belgium
25
6
12200
305000
3992
4332
0
0
8324
8324
Korea
30
3
10827
324802
1114
0
14324
0
1114
15438
Singapore
10
2
11565
115650
1750
0
17975
0
1750
19725
France
50
10
9000
450000
0
0
20000
0
0
20000
China
39
5
4978
194142
5224
0
39814
0
5224
40336
New Zealand
10
3
145244
145244
1973
0
43123
0
1973
45096
Israel
10
6
11140
111400
2060
3000
48400
16500
5060
53460
Brazil
30
6
10000
300000
2000
287356
5649202
0
487356
61366
Australia
24
6
40200
964800
0
500
82500
0
500
83000
23
543
109
532856799
3304716
26939
27700043
73748966
[1753EURO x 14 (ex rate) = $2454] [ $245416 hours=$153hour]
1095625
1095625
12271
1753
198089
198089
208514736842
South Africa
Canada
Italy
Germany
Peru
Poland
Spain
UK
Bulgaria
Taiwan
Czech Rep
Greece
Chile
Belgium
Korea
Singapore
France
China
New Zealand
Israel
Brazil
Australia
Country
Study starts
Subjects randomised
SubjectsStudy
USA
32
4385
13703125
Russia
20
788
394
Germany
19
1883
991052631579
UK
13
265
203846153846
South Africa
12
347
289166666667
Argentina
12
329
274166666667
Australia
11
195
177272727273
India
7
275
392857142857
Brazil
3
115
383333333333
Country
Initiation
Site activation
Recruitment
LOC setup
Unproductive sites
(Approval ndash FCI)
(FCI ndash FSFV)
(FSFV ndash LSFV)
(CPC ndash FSFV)
South Africa
19
38
153
357
21
Australia
117
63
401
239
11
Germany
16
37
401
224
21
UK
9
101
301
346
20
Russia
11
52
174
334
9
India
31
28
389
431
3
Argentina
94
67
288
32
13
Brazil
79
59
94
656
20
USA
44
31
149
26
Country
Pts Rand
Sites
Av CPP
Cost Per Country
Ethics Subm
Regulatory Fees
Add Inv Fees
CT Scan Total
Ethics + Regulatory
Total Regulatory Fees
China
39
5
4978
194142
522
0
39814
0
522
40336
Germany
55
10
7000
385000
3000
0
0
12000
3000
3000
Peru
40
5
7000
280000
1500
1000
2000
60000
2500
4500
South Africa
25
5
7250
181250
290
460
363
0
750
1113
Canada
18
4
8325
149858
1818
0
0
1557576
1818
1818
Greece
40
7
9000
360000
0
7500
0
0
7500
7500
France
50
10
9000
450000
0
0
20000
0
0
20000
Italy
7
2
10000
70000
2200
0
0
0
2200
2200
Poland
15
4
10000
150000
0
2500
2400
0
2500
4900
Bulgaria
18
4
10000
180000
0
5000
1000
0
5000
6000
Czech Rep
10
2
10000
100000
1500
3000
3000
0
4500
7500
Brazil
30
6
10000
300000
2000
2874
56492
0
4874
61366
Spain
40
7
10500
420000
0
0
5450
0
0
5450
Korea
30
3
10827
324802
1114
0
14324
0
1114
15438
Chile
15
4
10840
162600
1700
3600
3000
0
5300
8300
Israel
10
6
11140
111400
2060
3000
48400
16500
5060
53460
Singapore
10
2
11565
115650
1750
0
17975
0
1750
19725
Taiwan
20
4
11796
235930
1042
313
5208
0
1355
6563
Belgium
25
6
12200
305000
3992
4332
0
0
8324
8324
UK
12
4
13000
156000
0
0
5556
0
0
5556
New Zealand
10
3
14524
145244
1973
0
43123
0
1973
45096
Australia
24
6
40200
964800
0
500
82500
0
500
83000
23
543
109
5328568
33047
26939
277000
73748966
[1753EURO x 14 (ex rate) = $2454] [ $245416 hours=$153hour]
110
1095625
1227
1753
19809
20
21
China
Germany
Peru
South Africa
Canada
Greece
France
Italy
Poland
Bulgaria
Czech Rep
Brazil
Spain
Korea
Chile
Israel
Singapore
Taiwan
Belgium
UK
New Zealand
Australia
Population Group
IndianAsianOther
26
Mixed ethnicity
90
Caucasian
91
African
793
10000
IndianAsianOther
Mixed ethnicity
Caucasian
African
15
South African Trials
Whistle-Stop Tour
16
bull Ethnically a ldquoRainbow Nationrdquo
bull Populations representative of Africa Europe and Asia
17
Population 5495-million 1-Jul-2015 estimate
SA urbanrural profile
18
Cape Town Port Elizabeth
Durban
Pretoria
Joburg
Bloemfontein
Distribution of clinical trial sites
George
East London
Nelspruit
Richardrsquos Bay Kimberley
Welkom
19
Source Statistics South Africa 2015
3
9
979
IndianAsianOtherMixed ethnicityCaucasianAfrican
bull Young 44 aged lt 20 yrs bull Elderly 76 aged gt 60 yrs bull High number of treatment-naiumlve patients
SA Demographics
Chart1
9
0026
009
0091
0793
Sheet1
Sheet1
Sheet2
Sheet3
20
South Africa Leading Causes of Death
00
20
40
60
80
100
120
140 The ten leading underlying natural causes of death in South Africa (2009)
percentage
TB Flu amp Intest Heart Cereb Diab HIV HT Chron Immun Pneum Infect Other Vasc Mell Dis LRT Dis
Stats SA Rel P03093 Mortality and causes of death in South Africa 2009 Findings from death notification Nov-2011
Age group
TB 0-14 15-49 50-64 65+
Rank Rank Rank Rank
5 34 1 196 1 114 8 33
24
bull Well established research infrastructure bull Public and private sectors
28 teaching hospitals gt40000 tertiary care beds 140 private hospitals gt30000 beds 15 - 18 medical insurance
bull Large broad-based investigator database amp site networks bull Specialised Early Phase presence since 1970s bull GCPGLP and CLIA 88 compliant labs bull Specialist labs (biomarkers TB immunology
PKbioassay) bull Full support services (GMP-depots translations etc) bull Stringent ICH-compliant RAEC review policies
GCP is a legal requirement Informed Consent entrenched in Constitution
South Africa Advantages
25
bull Reliable (+) roads air links energy connectivity bull European Time bull Research language is English bull Inverse seasons bull Cost Currency bull Mobile-phone enabled obsessed population
South Africa Advantages
26
South Africa Track Record
bull Phase I-III data from SA included in hundreds of US amp European registration dossiers
bull Two entire NDA dossiers ndash rifapentine 1998 ndash tryptorelin (GnRH agonist) 2001) comprised SA data
bull 37 FDA inspections 1994-2009 1 OAI (27)
27
Therapeutic Indications
28
0
1
2
3
4
5
6
7
8
9
10
Belg
ium
Au
stria
Li
thua
nia
Can
ada
Luxe
mbo
urg
Mal
ta
Nor
way
Po
rtuga
l R
oman
ia
Rus
sia
Serb
ia
Swed
en
The
Net
herla
nds
USA
loca
l site
s U
SA c
entra
l site
C
zech
Rep
ublic
D
enm
ark
Esto
nia
Finl
and
Hun
gary
Ic
elan
d Ire
land
La
tvia
G
erm
any
Switz
erla
nd
Liec
hten
stei
n U
nite
d Ki
ngdo
m
Fran
ce
Italy
Au
stra
lia
Hon
g-Ko
ng
New
Zea
land
Si
ngap
ore
Taiw
an
Uga
nda
Pola
nd
Ukr
aine
C
hile
G
uate
mal
a Ja
pan
Isra
el
Slov
akia
Bu
lgar
ia
Gre
ece
Mal
aysi
a Ph
ilipp
ines
Pe
ru
Thai
land
Tu
rkey
Sl
oven
ia
Cos
ta R
ica
Mex
ico
Spai
n So
uth
Afric
a Ar
gent
ina
Sout
h Ko
rea
Col
ombi
a Pa
nam
a C
roat
ia
Indi
a Ve
nezu
ela
Braz
il C
hina
Mon
ths
Sout
h Afri
ca
Global Regulatory Review Timelines
Triclinium experience 2009-2015
Triclinium experience 2009 - 2015
29
Protocol release Country selection
Site Selection Collection of reg docs
Submission of RA application
EC application
Negotiate Site Contracts
EC Approvals
RA Approval amp Import permit
Site Initiation Import amp distribute drug
Import ancillary supplies Set up local labs
Set up EDC
Months
0
1
2
3
All EC approvals typically within 6
weeks
Site contracts signed within days
As soon as MCC approval obtained ALL sites can be initiated
Start-Up Activities in PARALLEL
GMO application (biologics)
30
0
2000
4000
6000
8000
10000
12000
14000C
hina
Ger
man
y
Per
u
Sou
th A
frica
Can
ada
Gre
ece
Fran
ce
Italy
Pol
and
Bul
garia
Cze
ch R
ep
Bra
zil
Spa
in
Kor
ea
Chi
le
Isra
el
Sin
gapo
re
Taiw
an
Bel
gium U
K
New
hellip
Aus
tralia
Source Bayer Presented SACRA Conference 2009
Aver
age
cost
per
pat
ient
(Eur
o)
Average Cost per Enrolled Participant
gt40000
Chart1
Average Cost Per Patient (Euro)
4978
7000
7000
7250
832545
9000
9000
10000
10000
10000
10000
10000
10500
10827
10840
11140
11565
1179649
12200
13000
145244
40200
Sheet1
Sheet2
Sheet2
Average Cost Per Patient (Euro)
Average Cost Per Patient
Sheet4
Ethics Subm
Regulatory Fees
Sheet3
Ethics + Regulatory
Total Ethics and Regulatory Fees
Add Inv Fees
Additional Investigator Application Fees
Total Regulatory Fees
Study starts
SubjectsStudy
31
Euro
0
10000
20000
30000
40000
50000
60000
70000
80000
90000S
outh
Afri
caC
anad
a
Italy
Ger
man
yP
eru
Pol
and
Spa
in UK
Bul
garia
Taiw
anC
zech
Rep
Gre
ece
Chi
leB
elgi
umK
orea
Sin
gapo
reFr
ance
Chi
naN
ew Z
eala
ndIs
rael
Bra
zil
Aus
tralia
Source Bayer Presented SACRA Conference 2009
Eur
os
Regulatory Application Fees
Chart1
Total Regulatory Fees
1113
181818
2200
3000
4500
4900
5450
5556
6000
656267
7500
7500
8300
8324
15438
19725
20000
403364
45096
53460
6136558
83000
Sheet1
Sheet2
Sheet2
Average Cost Per Patient (Euro)
Average Cost Per Patient
Sheet4
Ethics Subm
Regulatory Fees
Sheet3
Ethics + Regulatory
Total Ethics and Regulatory Fees
Add Inv Fees
Additional Investigator Application Fees
Total Regulatory Fees
Study starts
SubjectsStudy
32
SA Clinical Trial Regulatory Processes
Governed by SA-GCP and Declaration of Helsinki SA National Clinical Trials Register (SANCTR) Medicines Control Council (National Regulatory Authority)
o New protocols o Amendments o Additional sitesinvestigators
Ethics Committees (33 NHREC-registered) RegionalMunicipal DoH Export permits for bio samples (Nat Health Act 2003)
Clinical Trial Density Active sites million population
Nature Reviews Drug Discovery 7 13-14 (January 2008)
France 503
Germany 512 Canada
922
USA 1203
Czech Republic 776
553 sites
South Africa 119
757 sites
757 sites
533 sites
1084 sites
Argentina 269
Russia 77
China 04
India 07
34
Gateway to Africa
35
Why Africa bull Large accessible population relatively new to clinical trials
bull Experienced and willing investigators
bull Many clinical trial sites established by PDPs NGOs etc
bull Expanding therapeutic areas shifting burden of disease from
infectious to non-communicable diseases
bull Significantly improved infrastructure and accessibility
bull Rapidly evolving regulatory and ethics procedures
bull Potential for capacity building and sustainable clinical trial potential
36
Relatively young GCP culture Resident mentorships to build capacity Locations ndash accessibility for site monitoring Variable infrastructure esp electricity connectivity and
transportation Resourcing of public healthcare systems
Sub-Saharan Africa challenges
37
bull Second-largest continent
bull Spans NS and EW hemispheres
bull Second most populous continent 2014 estimate 1069 billion
bull Home to more than a quarter of the 196 independent countries
bull All 54 African countries are UN members
bull 39 urban population
bull 12 metropolitan areas gt 4m
bull gt 3000 distinct ethnicities
bull gt 2000 languages spoken
AFRICA hellip the true size
wwwcitypopulationdeworldAgglomerations 2015
38
SSV to SIV
0
5
10
15
20
25
30
35
40
45
Africa North America
Asia Pacific
Western Europe
Eastern Europe
Latin America
Source Quintiles South Africa SACRA Conference 2008
Wee
ks (A
vera
ge)
Start-Up Timelines
39
Region Median
Patients Site
of Sites
0 pts 1 - 3 pts 4 - 9 pts 10+ pts
Latin America 40 21 26 30 23
North America 30 29 29 24 18
Eastern Europe 60 15 31 26 27
Western Europe 40 15 22 29 34
Asia Pacific 40 19 30 34 18
Africa 100 4 17 28 51
Enrollment performance by region for 2008
Site Performance
Source Quintiles South Africa Presented SACRA Conference 2009
40
0 1 2 3 4 5 6 7 8 9
10
Latin America
North America
Eastern Europe
Western Europe
Asia Pacific
Africa
Num
ber o
f par
ticip
ants
MEDIAN site enrollment by region for 2008
Source Quintiles South Africa Presented SACRA Conference 2009
Site Performance
41
Source Quintiles South Africa Presented SACRA Conference 2009
s
ites
0
5
10
15
20
25
30
35
40
45
50
LatinAmerica
NorthAmerica
EasternEurope
WesternEurope
Asia Pacific Africa
0 pts
1 - 3 pts
4 - 9 pts
10+ pts
Enrollment performance by region for 2008
Site Performance
Chart1
0 pts
1 - 3 pts
4 - 9 pts
10+ pts
021
026
03
023
029
029
024
018
015
031
026
027
015
022
029
034
019
03
034
018
004
017
028
051
HIV
HIV
Resiratory amp Cancer
Male prevalence
Female prevalence
CVS
Overall death rates
Overall death rates
COPD
Asthma
Tracheabronchial lung cancer
Oesophageal cancer
prostate cancer
Trial metrics
COPD
Asthma
Tracheabronchial lung cancer
Oesophageal cancer
Prostate cancer
Cervical cancer
Breast cancer
Stroke
ill-defined heart disease
Diabetes mellitus
Ischaemic heart disease
Hypertension
Nephritisnephrosis
Stroke
ill-defined heart disease
Diabetes mellitus
Ischaemic heart disease
Hypertension
Nephritisnephrosis
Males
Female
UN - Male
SA 1997
SA 2004
UN - Female
SA 1997
SA 2004
0 pts
1 - 3 pts
4 - 9 pts
10+ pts
42
Source wwwclinicaltrialsgov 22-Oct-2010
Clinical trials registered across Africa
43
0
500
1000
1500
2000
2500
South Africa Kenya Malawi Tanzania Uganda Zambia
Selected African countries
2005
2010
2015
Source ClinTrialsgov
Trend 2005 - 2015
Source wwwclinicaltrialsgov 28-Aug-2015
44
AFRICA FOUND IN TRANSLATION
bull Vast treatment-naiumlve population bull Cost advantages (still) bull Diverse ethnicity amp morbidity bull Inverse seasonality bull Site capacity-building widely implemented bull Robust regulatory review bull Variable but generally good regulatory timelines bull Established GCP culture ndash sites and home-bred CROs
45
THANK YOU
Foliennummer 1
Triclinium A South African CRO
Collaboration with VPM SII
Vaccine Trials in SA 2015
Foliennummer 5
Foliennummer 6
Foliennummer 7
Foliennummer 8
Foliennummer 9
Foliennummer 10
Foliennummer 11
Foliennummer 12
Foliennummer 13
Foliennummer 14
Foliennummer 15
Foliennummer 16
Foliennummer 17
Distribution of clinical trial sites
Foliennummer 19
South Africa Leading Causes of Death
Foliennummer 21
Foliennummer 22
South Africa TB deaths by age group
Foliennummer 24
Foliennummer 25
Foliennummer 26
Foliennummer 27
Foliennummer 28
Foliennummer 29
Foliennummer 30
Foliennummer 31
SA Clinical Trial Regulatory Processes
Clinical Trial Density Active sites million population
Foliennummer 34
Why Africa
Foliennummer 36
AFRICA hellip the true size
SSV to SIV
Foliennummer 39
Foliennummer 40
Foliennummer 41
Foliennummer 42
Foliennummer 43
AFRICA FOUND IN TRANSLATION
Foliennummer 45
Region
Median
of Sites
Patients Site
0 pts
1 - 3 pts
4 - 9 pts
10+ pts
Latin America
4
21
26
30
23
North America
3
29
29
24
18
Eastern Europe
6
15
31
26
27
Western Europe
4
15
22
29
34
Asia Pacific
4
19
30
34
18
Africa
10
4
17
28
51
0 pts
1 - 3 pts
4 - 9 pts
10+ pts
Latin America
21
26
30
23
North America
29
29
24
18
Eastern Europe
15
31
26
27
Western Europe
15
22
29
34
Asia Pacific
19
30
34
18
Africa
4
17
28
51
Males
Female
15-19
210
150
20-24
340
205
25-29
395
300
30-34
460
360
35-39
600
405
40-44
800
500
45-49
1100
700
50-54
1600
1050
55-54
2300
1580
60-64
3340
2250
UN - Male
SA 1997
SA 2004
UN - Female
SA 1997
SA 2004
15-19
210
235
216
150
165
187
20-24
340
381
555
205
331
1085
25-29
395
625
1081
300
452
1985
30-34
460
817
2118
360
489
2267
35-39
600
916
2498
405
526
1890
40-44
800
1136
2765
500
615
1548
45-49
1100
1486
2744
700
800
1400
50-54
1600
2016
2979
1050
1116
1506
55-54
2300
2838
3270
1580
1626
1717
60-64
3340
3614
4146
2250
2201
2360
Stroke
ill-defined heart disease
Diabetes mellitus
Ischaemic heart disease
Hypertension
Nephritisnephrosis
Stroke
ill-defined heart disease
Diabetes mellitus
Ischaemic heart disease
Hypertension
Nephritisnephrosis
1999
34
345
20
248
14
10
1999
295
246
23
10
145
68
2000
36
362
218
249
152
112
2000
318
268
241
108
16
8
2001
35
372
22
25
15
125
2001
322
28
252
102
162
95
2002
405
298
24
26
147
126
2002
352
295
27
115
16
10
2003
425
32
245
285
152
15
2003
382
299
285
122
17
12
2004
39
325
255
26
165
16
2004
35
30
295
121
19
119
2005
36
328
265
26
15
162
2005
325
30
32
12
18
12
2006
35
336
27
258
155
16
2006
33
32
32
11
18
125
COPD
Asthma
Tracheabronchial lung cancer
Oesophageal cancer
prostate cancer
Cervical cancer
Breast cancer
1999
2001
12
135
10
26
2000
204
116
13
92
28
2001
222
131
133
96
27
2002
23
144
128
95
285
2003
243
149
124
94
29
2004
229
154
1255
87
29
2005
224
152
122
82
295
2006
224
136
116
75
3
COPD
Asthma
Tracheabronchial lung cancer
Oesophageal cancer
Prostate cancer
Cervical cancer
Breast cancer
1999
88
92
43
41
106
82
2000
96
95
4
43
11
81
2001
10
109
4
4
111
89
2002
10
116
4
4
112
85
2003
11
124
4
395
116
85
2004
102
1295
44
39
115
101
2005
105
128
42
38
1185
10
2006
10
12
42
32
1205
10
Based on this survey the researchers estimate that 109 of all South Africans over 2 years old were living with HIV in 2008 In 2002 and 2005 this figure was 114 and 108 respectively showing a degree of stabilisation Among those between 15 and 49 years old the estimated HIV prevalence was 169 in 2008 The survey found the prevalence among children aged 2-14 to be 25 down significantly since 2002 when prevalence was 56
Estimated HIV prevalence () among South Africans aged 2 years and older by age 2002-2008
Age
HIV +
HIV -
Children (2-14 years)
25
975
Youth (15-24 years)
87
913
Adults (25 and older)
168
832
(15-49 years)
169
831
Total (2 and older)
109
891
Estimated HIV prevalence among South Africans by age and sex 2008
Age
Male prevalence
Female prevalence
2-14
3
2
15-19
25
67
20-24
51
211
25-29
157
327
30-34
258
291
35-39
185
248
40-44
192
163
45-49
64
141
50-54
104
102
55-59
62
77
60+
35
18
Total
79
136
Among females HIV prevalence is highest in those between 25 and 29 years old among males the peak is in the group aged 30-34 years
HIV prevalence () by province 2002-2008
Province
2002
2005
2008
KwaZulu-Natal
117
165
158
Mpumalanga
141
152
154
Free State
149
126
126
North West
103
109
113
Gauteng
147
108
103
Eastern Cape
66
89
9
Limpopo
98
8
88
Northern Cape
84
54
59
Western Cape
107
19
38
National
114
108
109
The results of this study suggest that KwaZulu-Natal Mpumulanga and Free State have the highest HIV prevalence However the relatively small sample sizes may limit precision and in several cases the ranges of uncertainty overlap
HIV prevalence by population group 2008
Population group
Prevalence ()
African
136
864
White
03
997
Coloured
17
983
Indian
03
997
Studies of AIDS deaths
Latin America
Latin America
Latin America
Latin America
North America
North America
North America
North America
Eastern Europe
Eastern Europe
Eastern Europe
Eastern Europe
Western Europe
Western Europe
Western Europe
Western Europe
Asia Pacific
Asia Pacific
Asia Pacific
Asia Pacific
Africa
Africa
Africa
Africa
Country
Study starts
Subjects randomised
SubjectsStudy
USA
32
4385
13703125
Russia
20
788
394
Germany
19
1883
991052631579
UK
13
265
203846153846
South Africa
12
347
289166666667
Argentina
12
329
274166666667
Australia
11
195
177272727273
India
7
275
392857142857
Brazil
3
115
383333333333
Country
Initiation
Site activation
Recruitment
LOC setup
Unproductive sites
(Approval ndash FCI)
(FCI ndash FSFV)
(FSFV ndash LSFV)
(CPC ndash FSFV)
South Africa
19
38
153
357
21
Australia
117
63
401
239
11
Germany
16
37
401
224
21
UK
9
101
301
346
20
Russia
11
52
174
334
9
India
31
28
389
431
3
Argentina
94
67
288
32
13
Brazil
79
59
94
656
20
USA
44
31
149
26
Country
Pts Rand
Sites
Av CPP
Cost Per Country
Ethics Subm
Regulatory Fees
Add Inv Fees
CT Scan Total
Ethics + Regulatory
Total Regulatory Fees
South Africa
25
5
7250
181250
290
460
363
0
750
1113
Canada
18
4
832545
14985818
181818
0
0
1557576
181818
1818
Italy
7
2
10000
70000
2200
0
0
0
2200
2200
Germany
55
10
7000
385000
3000
0
0
12000
3000
3000
Peru
40
5
7000
280000
1500
1000
2000
60000
2500
4500
Poland
15
4
10000
150000
0
2500
2400
0
2500
4900
Spain
40
7
10500
420000
0
0
5450
0
0
5450
UK
12
4
13000
156000
0
0
5556
0
0
5556
Bulgaria
18
4
10000
180000
0
5000
1000
0
5000
6000
Taiwan
20
4
1179649
2359298
104167
313
5208
0
135467
6563
Czech Rep
10
2
10000
100000
1500
3000
3000
0
4500
7500
Greece
40
7
9000
360000
0
7500
0
0
7500
7500
Chile
15
4
10840
162600
1700
3600
3000
0
5300
8300
Belgium
25
6
12200
305000
3992
4332
0
0
8324
8324
Korea
30
3
10827
324802
1114
0
14324
0
1114
15438
Singapore
10
2
11565
115650
1750
0
17975
0
1750
19725
France
50
10
9000
450000
0
0
20000
0
0
20000
China
39
5
4978
194142
5224
0
39814
0
5224
40336
New Zealand
10
3
145244
145244
1973
0
43123
0
1973
45096
Israel
10
6
11140
111400
2060
3000
48400
16500
5060
53460
Brazil
30
6
10000
300000
2000
287356
5649202
0
487356
61366
Australia
24
6
40200
964800
0
500
82500
0
500
83000
23
543
109
532856799
3304716
26939
27700043
73748966
[1753EURO x 14 (ex rate) = $2454] [ $245416 hours=$153hour]
1095625
1095625
12271
1753
198089
198089
208514736842
South Africa
Canada
Italy
Germany
Peru
Poland
Spain
UK
Bulgaria
Taiwan
Czech Rep
Greece
Chile
Belgium
Korea
Singapore
France
China
New Zealand
Israel
Brazil
Australia
Country
Study starts
Subjects randomised
SubjectsStudy
USA
32
4385
13703125
Russia
20
788
394
Germany
19
1883
991052631579
UK
13
265
203846153846
South Africa
12
347
289166666667
Argentina
12
329
274166666667
Australia
11
195
177272727273
India
7
275
392857142857
Brazil
3
115
383333333333
Country
Initiation
Site activation
Recruitment
LOC setup
Unproductive sites
(Approval ndash FCI)
(FCI ndash FSFV)
(FSFV ndash LSFV)
(CPC ndash FSFV)
South Africa
19
38
153
357
21
Australia
117
63
401
239
11
Germany
16
37
401
224
21
UK
9
101
301
346
20
Russia
11
52
174
334
9
India
31
28
389
431
3
Argentina
94
67
288
32
13
Brazil
79
59
94
656
20
USA
44
31
149
26
Country
Pts Rand
Sites
Av CPP
Cost Per Country
Ethics Subm
Regulatory Fees
Add Inv Fees
CT Scan Total
Ethics + Regulatory
Total Regulatory Fees
China
39
5
4978
194142
522
0
39814
0
522
40336
Germany
55
10
7000
385000
3000
0
0
12000
3000
3000
Peru
40
5
7000
280000
1500
1000
2000
60000
2500
4500
South Africa
25
5
7250
181250
290
460
363
0
750
1113
Canada
18
4
8325
149858
1818
0
0
1557576
1818
1818
Greece
40
7
9000
360000
0
7500
0
0
7500
7500
France
50
10
9000
450000
0
0
20000
0
0
20000
Italy
7
2
10000
70000
2200
0
0
0
2200
2200
Poland
15
4
10000
150000
0
2500
2400
0
2500
4900
Bulgaria
18
4
10000
180000
0
5000
1000
0
5000
6000
Czech Rep
10
2
10000
100000
1500
3000
3000
0
4500
7500
Brazil
30
6
10000
300000
2000
2874
56492
0
4874
61366
Spain
40
7
10500
420000
0
0
5450
0
0
5450
Korea
30
3
10827
324802
1114
0
14324
0
1114
15438
Chile
15
4
10840
162600
1700
3600
3000
0
5300
8300
Israel
10
6
11140
111400
2060
3000
48400
16500
5060
53460
Singapore
10
2
11565
115650
1750
0
17975
0
1750
19725
Taiwan
20
4
11796
235930
1042
313
5208
0
1355
6563
Belgium
25
6
12200
305000
3992
4332
0
0
8324
8324
UK
12
4
13000
156000
0
0
5556
0
0
5556
New Zealand
10
3
14524
145244
1973
0
43123
0
1973
45096
Australia
24
6
40200
964800
0
500
82500
0
500
83000
23
543
109
5328568
33047
26939
277000
73748966
[1753EURO x 14 (ex rate) = $2454] [ $245416 hours=$153hour]
110
1095625
1227
1753
19809
20
21
China
Germany
Peru
South Africa
Canada
Greece
France
Italy
Poland
Bulgaria
Czech Rep
Brazil
Spain
Korea
Chile
Israel
Singapore
Taiwan
Belgium
UK
New Zealand
Australia
Population Group
IndianAsianOther
26
Mixed ethnicity
90
Caucasian
91
African
793
10000
IndianAsianOther
Mixed ethnicity
Caucasian
African
16
bull Ethnically a ldquoRainbow Nationrdquo
bull Populations representative of Africa Europe and Asia
17
Population 5495-million 1-Jul-2015 estimate
SA urbanrural profile
18
Cape Town Port Elizabeth
Durban
Pretoria
Joburg
Bloemfontein
Distribution of clinical trial sites
George
East London
Nelspruit
Richardrsquos Bay Kimberley
Welkom
19
Source Statistics South Africa 2015
3
9
979
IndianAsianOtherMixed ethnicityCaucasianAfrican
bull Young 44 aged lt 20 yrs bull Elderly 76 aged gt 60 yrs bull High number of treatment-naiumlve patients
SA Demographics
Chart1
9
0026
009
0091
0793
Sheet1
Sheet1
Sheet2
Sheet3
20
South Africa Leading Causes of Death
00
20
40
60
80
100
120
140 The ten leading underlying natural causes of death in South Africa (2009)
percentage
TB Flu amp Intest Heart Cereb Diab HIV HT Chron Immun Pneum Infect Other Vasc Mell Dis LRT Dis
Stats SA Rel P03093 Mortality and causes of death in South Africa 2009 Findings from death notification Nov-2011
Age group
TB 0-14 15-49 50-64 65+
Rank Rank Rank Rank
5 34 1 196 1 114 8 33
24
bull Well established research infrastructure bull Public and private sectors
28 teaching hospitals gt40000 tertiary care beds 140 private hospitals gt30000 beds 15 - 18 medical insurance
bull Large broad-based investigator database amp site networks bull Specialised Early Phase presence since 1970s bull GCPGLP and CLIA 88 compliant labs bull Specialist labs (biomarkers TB immunology
PKbioassay) bull Full support services (GMP-depots translations etc) bull Stringent ICH-compliant RAEC review policies
GCP is a legal requirement Informed Consent entrenched in Constitution
South Africa Advantages
25
bull Reliable (+) roads air links energy connectivity bull European Time bull Research language is English bull Inverse seasons bull Cost Currency bull Mobile-phone enabled obsessed population
South Africa Advantages
26
South Africa Track Record
bull Phase I-III data from SA included in hundreds of US amp European registration dossiers
bull Two entire NDA dossiers ndash rifapentine 1998 ndash tryptorelin (GnRH agonist) 2001) comprised SA data
bull 37 FDA inspections 1994-2009 1 OAI (27)
27
Therapeutic Indications
28
0
1
2
3
4
5
6
7
8
9
10
Belg
ium
Au
stria
Li
thua
nia
Can
ada
Luxe
mbo
urg
Mal
ta
Nor
way
Po
rtuga
l R
oman
ia
Rus
sia
Serb
ia
Swed
en
The
Net
herla
nds
USA
loca
l site
s U
SA c
entra
l site
C
zech
Rep
ublic
D
enm
ark
Esto
nia
Finl
and
Hun
gary
Ic
elan
d Ire
land
La
tvia
G
erm
any
Switz
erla
nd
Liec
hten
stei
n U
nite
d Ki
ngdo
m
Fran
ce
Italy
Au
stra
lia
Hon
g-Ko
ng
New
Zea
land
Si
ngap
ore
Taiw
an
Uga
nda
Pola
nd
Ukr
aine
C
hile
G
uate
mal
a Ja
pan
Isra
el
Slov
akia
Bu
lgar
ia
Gre
ece
Mal
aysi
a Ph
ilipp
ines
Pe
ru
Thai
land
Tu
rkey
Sl
oven
ia
Cos
ta R
ica
Mex
ico
Spai
n So
uth
Afric
a Ar
gent
ina
Sout
h Ko
rea
Col
ombi
a Pa
nam
a C
roat
ia
Indi
a Ve
nezu
ela
Braz
il C
hina
Mon
ths
Sout
h Afri
ca
Global Regulatory Review Timelines
Triclinium experience 2009-2015
Triclinium experience 2009 - 2015
29
Protocol release Country selection
Site Selection Collection of reg docs
Submission of RA application
EC application
Negotiate Site Contracts
EC Approvals
RA Approval amp Import permit
Site Initiation Import amp distribute drug
Import ancillary supplies Set up local labs
Set up EDC
Months
0
1
2
3
All EC approvals typically within 6
weeks
Site contracts signed within days
As soon as MCC approval obtained ALL sites can be initiated
Start-Up Activities in PARALLEL
GMO application (biologics)
30
0
2000
4000
6000
8000
10000
12000
14000C
hina
Ger
man
y
Per
u
Sou
th A
frica
Can
ada
Gre
ece
Fran
ce
Italy
Pol
and
Bul
garia
Cze
ch R
ep
Bra
zil
Spa
in
Kor
ea
Chi
le
Isra
el
Sin
gapo
re
Taiw
an
Bel
gium U
K
New
hellip
Aus
tralia
Source Bayer Presented SACRA Conference 2009
Aver
age
cost
per
pat
ient
(Eur
o)
Average Cost per Enrolled Participant
gt40000
Chart1
Average Cost Per Patient (Euro)
4978
7000
7000
7250
832545
9000
9000
10000
10000
10000
10000
10000
10500
10827
10840
11140
11565
1179649
12200
13000
145244
40200
Sheet1
Sheet2
Sheet2
Average Cost Per Patient (Euro)
Average Cost Per Patient
Sheet4
Ethics Subm
Regulatory Fees
Sheet3
Ethics + Regulatory
Total Ethics and Regulatory Fees
Add Inv Fees
Additional Investigator Application Fees
Total Regulatory Fees
Study starts
SubjectsStudy
31
Euro
0
10000
20000
30000
40000
50000
60000
70000
80000
90000S
outh
Afri
caC
anad
a
Italy
Ger
man
yP
eru
Pol
and
Spa
in UK
Bul
garia
Taiw
anC
zech
Rep
Gre
ece
Chi
leB
elgi
umK
orea
Sin
gapo
reFr
ance
Chi
naN
ew Z
eala
ndIs
rael
Bra
zil
Aus
tralia
Source Bayer Presented SACRA Conference 2009
Eur
os
Regulatory Application Fees
Chart1
Total Regulatory Fees
1113
181818
2200
3000
4500
4900
5450
5556
6000
656267
7500
7500
8300
8324
15438
19725
20000
403364
45096
53460
6136558
83000
Sheet1
Sheet2
Sheet2
Average Cost Per Patient (Euro)
Average Cost Per Patient
Sheet4
Ethics Subm
Regulatory Fees
Sheet3
Ethics + Regulatory
Total Ethics and Regulatory Fees
Add Inv Fees
Additional Investigator Application Fees
Total Regulatory Fees
Study starts
SubjectsStudy
32
SA Clinical Trial Regulatory Processes
Governed by SA-GCP and Declaration of Helsinki SA National Clinical Trials Register (SANCTR) Medicines Control Council (National Regulatory Authority)
o New protocols o Amendments o Additional sitesinvestigators
Ethics Committees (33 NHREC-registered) RegionalMunicipal DoH Export permits for bio samples (Nat Health Act 2003)
Clinical Trial Density Active sites million population
Nature Reviews Drug Discovery 7 13-14 (January 2008)
France 503
Germany 512 Canada
922
USA 1203
Czech Republic 776
553 sites
South Africa 119
757 sites
757 sites
533 sites
1084 sites
Argentina 269
Russia 77
China 04
India 07
34
Gateway to Africa
35
Why Africa bull Large accessible population relatively new to clinical trials
bull Experienced and willing investigators
bull Many clinical trial sites established by PDPs NGOs etc
bull Expanding therapeutic areas shifting burden of disease from
infectious to non-communicable diseases
bull Significantly improved infrastructure and accessibility
bull Rapidly evolving regulatory and ethics procedures
bull Potential for capacity building and sustainable clinical trial potential
36
Relatively young GCP culture Resident mentorships to build capacity Locations ndash accessibility for site monitoring Variable infrastructure esp electricity connectivity and
transportation Resourcing of public healthcare systems
Sub-Saharan Africa challenges
37
bull Second-largest continent
bull Spans NS and EW hemispheres
bull Second most populous continent 2014 estimate 1069 billion
bull Home to more than a quarter of the 196 independent countries
bull All 54 African countries are UN members
bull 39 urban population
bull 12 metropolitan areas gt 4m
bull gt 3000 distinct ethnicities
bull gt 2000 languages spoken
AFRICA hellip the true size
wwwcitypopulationdeworldAgglomerations 2015
38
SSV to SIV
0
5
10
15
20
25
30
35
40
45
Africa North America
Asia Pacific
Western Europe
Eastern Europe
Latin America
Source Quintiles South Africa SACRA Conference 2008
Wee
ks (A
vera
ge)
Start-Up Timelines
39
Region Median
Patients Site
of Sites
0 pts 1 - 3 pts 4 - 9 pts 10+ pts
Latin America 40 21 26 30 23
North America 30 29 29 24 18
Eastern Europe 60 15 31 26 27
Western Europe 40 15 22 29 34
Asia Pacific 40 19 30 34 18
Africa 100 4 17 28 51
Enrollment performance by region for 2008
Site Performance
Source Quintiles South Africa Presented SACRA Conference 2009
40
0 1 2 3 4 5 6 7 8 9
10
Latin America
North America
Eastern Europe
Western Europe
Asia Pacific
Africa
Num
ber o
f par
ticip
ants
MEDIAN site enrollment by region for 2008
Source Quintiles South Africa Presented SACRA Conference 2009
Site Performance
41
Source Quintiles South Africa Presented SACRA Conference 2009
s
ites
0
5
10
15
20
25
30
35
40
45
50
LatinAmerica
NorthAmerica
EasternEurope
WesternEurope
Asia Pacific Africa
0 pts
1 - 3 pts
4 - 9 pts
10+ pts
Enrollment performance by region for 2008
Site Performance
Chart1
0 pts
1 - 3 pts
4 - 9 pts
10+ pts
021
026
03
023
029
029
024
018
015
031
026
027
015
022
029
034
019
03
034
018
004
017
028
051
HIV
HIV
Resiratory amp Cancer
Male prevalence
Female prevalence
CVS
Overall death rates
Overall death rates
COPD
Asthma
Tracheabronchial lung cancer
Oesophageal cancer
prostate cancer
Trial metrics
COPD
Asthma
Tracheabronchial lung cancer
Oesophageal cancer
Prostate cancer
Cervical cancer
Breast cancer
Stroke
ill-defined heart disease
Diabetes mellitus
Ischaemic heart disease
Hypertension
Nephritisnephrosis
Stroke
ill-defined heart disease
Diabetes mellitus
Ischaemic heart disease
Hypertension
Nephritisnephrosis
Males
Female
UN - Male
SA 1997
SA 2004
UN - Female
SA 1997
SA 2004
0 pts
1 - 3 pts
4 - 9 pts
10+ pts
42
Source wwwclinicaltrialsgov 22-Oct-2010
Clinical trials registered across Africa
43
0
500
1000
1500
2000
2500
South Africa Kenya Malawi Tanzania Uganda Zambia
Selected African countries
2005
2010
2015
Source ClinTrialsgov
Trend 2005 - 2015
Source wwwclinicaltrialsgov 28-Aug-2015
44
AFRICA FOUND IN TRANSLATION
bull Vast treatment-naiumlve population bull Cost advantages (still) bull Diverse ethnicity amp morbidity bull Inverse seasonality bull Site capacity-building widely implemented bull Robust regulatory review bull Variable but generally good regulatory timelines bull Established GCP culture ndash sites and home-bred CROs
45
THANK YOU
Foliennummer 1
Triclinium A South African CRO
Collaboration with VPM SII
Vaccine Trials in SA 2015
Foliennummer 5
Foliennummer 6
Foliennummer 7
Foliennummer 8
Foliennummer 9
Foliennummer 10
Foliennummer 11
Foliennummer 12
Foliennummer 13
Foliennummer 14
Foliennummer 15
Foliennummer 16
Foliennummer 17
Distribution of clinical trial sites
Foliennummer 19
South Africa Leading Causes of Death
Foliennummer 21
Foliennummer 22
South Africa TB deaths by age group
Foliennummer 24
Foliennummer 25
Foliennummer 26
Foliennummer 27
Foliennummer 28
Foliennummer 29
Foliennummer 30
Foliennummer 31
SA Clinical Trial Regulatory Processes
Clinical Trial Density Active sites million population
Foliennummer 34
Why Africa
Foliennummer 36
AFRICA hellip the true size
SSV to SIV
Foliennummer 39
Foliennummer 40
Foliennummer 41
Foliennummer 42
Foliennummer 43
AFRICA FOUND IN TRANSLATION
Foliennummer 45
Region
Median
of Sites
Patients Site
0 pts
1 - 3 pts
4 - 9 pts
10+ pts
Latin America
4
21
26
30
23
North America
3
29
29
24
18
Eastern Europe
6
15
31
26
27
Western Europe
4
15
22
29
34
Asia Pacific
4
19
30
34
18
Africa
10
4
17
28
51
0 pts
1 - 3 pts
4 - 9 pts
10+ pts
Latin America
21
26
30
23
North America
29
29
24
18
Eastern Europe
15
31
26
27
Western Europe
15
22
29
34
Asia Pacific
19
30
34
18
Africa
4
17
28
51
Males
Female
15-19
210
150
20-24
340
205
25-29
395
300
30-34
460
360
35-39
600
405
40-44
800
500
45-49
1100
700
50-54
1600
1050
55-54
2300
1580
60-64
3340
2250
UN - Male
SA 1997
SA 2004
UN - Female
SA 1997
SA 2004
15-19
210
235
216
150
165
187
20-24
340
381
555
205
331
1085
25-29
395
625
1081
300
452
1985
30-34
460
817
2118
360
489
2267
35-39
600
916
2498
405
526
1890
40-44
800
1136
2765
500
615
1548
45-49
1100
1486
2744
700
800
1400
50-54
1600
2016
2979
1050
1116
1506
55-54
2300
2838
3270
1580
1626
1717
60-64
3340
3614
4146
2250
2201
2360
Stroke
ill-defined heart disease
Diabetes mellitus
Ischaemic heart disease
Hypertension
Nephritisnephrosis
Stroke
ill-defined heart disease
Diabetes mellitus
Ischaemic heart disease
Hypertension
Nephritisnephrosis
1999
34
345
20
248
14
10
1999
295
246
23
10
145
68
2000
36
362
218
249
152
112
2000
318
268
241
108
16
8
2001
35
372
22
25
15
125
2001
322
28
252
102
162
95
2002
405
298
24
26
147
126
2002
352
295
27
115
16
10
2003
425
32
245
285
152
15
2003
382
299
285
122
17
12
2004
39
325
255
26
165
16
2004
35
30
295
121
19
119
2005
36
328
265
26
15
162
2005
325
30
32
12
18
12
2006
35
336
27
258
155
16
2006
33
32
32
11
18
125
COPD
Asthma
Tracheabronchial lung cancer
Oesophageal cancer
prostate cancer
Cervical cancer
Breast cancer
1999
2001
12
135
10
26
2000
204
116
13
92
28
2001
222
131
133
96
27
2002
23
144
128
95
285
2003
243
149
124
94
29
2004
229
154
1255
87
29
2005
224
152
122
82
295
2006
224
136
116
75
3
COPD
Asthma
Tracheabronchial lung cancer
Oesophageal cancer
Prostate cancer
Cervical cancer
Breast cancer
1999
88
92
43
41
106
82
2000
96
95
4
43
11
81
2001
10
109
4
4
111
89
2002
10
116
4
4
112
85
2003
11
124
4
395
116
85
2004
102
1295
44
39
115
101
2005
105
128
42
38
1185
10
2006
10
12
42
32
1205
10
Based on this survey the researchers estimate that 109 of all South Africans over 2 years old were living with HIV in 2008 In 2002 and 2005 this figure was 114 and 108 respectively showing a degree of stabilisation Among those between 15 and 49 years old the estimated HIV prevalence was 169 in 2008 The survey found the prevalence among children aged 2-14 to be 25 down significantly since 2002 when prevalence was 56
Estimated HIV prevalence () among South Africans aged 2 years and older by age 2002-2008
Age
HIV +
HIV -
Children (2-14 years)
25
975
Youth (15-24 years)
87
913
Adults (25 and older)
168
832
(15-49 years)
169
831
Total (2 and older)
109
891
Estimated HIV prevalence among South Africans by age and sex 2008
Age
Male prevalence
Female prevalence
2-14
3
2
15-19
25
67
20-24
51
211
25-29
157
327
30-34
258
291
35-39
185
248
40-44
192
163
45-49
64
141
50-54
104
102
55-59
62
77
60+
35
18
Total
79
136
Among females HIV prevalence is highest in those between 25 and 29 years old among males the peak is in the group aged 30-34 years
HIV prevalence () by province 2002-2008
Province
2002
2005
2008
KwaZulu-Natal
117
165
158
Mpumalanga
141
152
154
Free State
149
126
126
North West
103
109
113
Gauteng
147
108
103
Eastern Cape
66
89
9
Limpopo
98
8
88
Northern Cape
84
54
59
Western Cape
107
19
38
National
114
108
109
The results of this study suggest that KwaZulu-Natal Mpumulanga and Free State have the highest HIV prevalence However the relatively small sample sizes may limit precision and in several cases the ranges of uncertainty overlap
HIV prevalence by population group 2008
Population group
Prevalence ()
African
136
864
White
03
997
Coloured
17
983
Indian
03
997
Studies of AIDS deaths
Latin America
Latin America
Latin America
Latin America
North America
North America
North America
North America
Eastern Europe
Eastern Europe
Eastern Europe
Eastern Europe
Western Europe
Western Europe
Western Europe
Western Europe
Asia Pacific
Asia Pacific
Asia Pacific
Asia Pacific
Africa
Africa
Africa
Africa
Country
Study starts
Subjects randomised
SubjectsStudy
USA
32
4385
13703125
Russia
20
788
394
Germany
19
1883
991052631579
UK
13
265
203846153846
South Africa
12
347
289166666667
Argentina
12
329
274166666667
Australia
11
195
177272727273
India
7
275
392857142857
Brazil
3
115
383333333333
Country
Initiation
Site activation
Recruitment
LOC setup
Unproductive sites
(Approval ndash FCI)
(FCI ndash FSFV)
(FSFV ndash LSFV)
(CPC ndash FSFV)
South Africa
19
38
153
357
21
Australia
117
63
401
239
11
Germany
16
37
401
224
21
UK
9
101
301
346
20
Russia
11
52
174
334
9
India
31
28
389
431
3
Argentina
94
67
288
32
13
Brazil
79
59
94
656
20
USA
44
31
149
26
Country
Pts Rand
Sites
Av CPP
Cost Per Country
Ethics Subm
Regulatory Fees
Add Inv Fees
CT Scan Total
Ethics + Regulatory
Total Regulatory Fees
South Africa
25
5
7250
181250
290
460
363
0
750
1113
Canada
18
4
832545
14985818
181818
0
0
1557576
181818
1818
Italy
7
2
10000
70000
2200
0
0
0
2200
2200
Germany
55
10
7000
385000
3000
0
0
12000
3000
3000
Peru
40
5
7000
280000
1500
1000
2000
60000
2500
4500
Poland
15
4
10000
150000
0
2500
2400
0
2500
4900
Spain
40
7
10500
420000
0
0
5450
0
0
5450
UK
12
4
13000
156000
0
0
5556
0
0
5556
Bulgaria
18
4
10000
180000
0
5000
1000
0
5000
6000
Taiwan
20
4
1179649
2359298
104167
313
5208
0
135467
6563
Czech Rep
10
2
10000
100000
1500
3000
3000
0
4500
7500
Greece
40
7
9000
360000
0
7500
0
0
7500
7500
Chile
15
4
10840
162600
1700
3600
3000
0
5300
8300
Belgium
25
6
12200
305000
3992
4332
0
0
8324
8324
Korea
30
3
10827
324802
1114
0
14324
0
1114
15438
Singapore
10
2
11565
115650
1750
0
17975
0
1750
19725
France
50
10
9000
450000
0
0
20000
0
0
20000
China
39
5
4978
194142
5224
0
39814
0
5224
40336
New Zealand
10
3
145244
145244
1973
0
43123
0
1973
45096
Israel
10
6
11140
111400
2060
3000
48400
16500
5060
53460
Brazil
30
6
10000
300000
2000
287356
5649202
0
487356
61366
Australia
24
6
40200
964800
0
500
82500
0
500
83000
23
543
109
532856799
3304716
26939
27700043
73748966
[1753EURO x 14 (ex rate) = $2454] [ $245416 hours=$153hour]
1095625
1095625
12271
1753
198089
198089
208514736842
South Africa
Canada
Italy
Germany
Peru
Poland
Spain
UK
Bulgaria
Taiwan
Czech Rep
Greece
Chile
Belgium
Korea
Singapore
France
China
New Zealand
Israel
Brazil
Australia
Country
Study starts
Subjects randomised
SubjectsStudy
USA
32
4385
13703125
Russia
20
788
394
Germany
19
1883
991052631579
UK
13
265
203846153846
South Africa
12
347
289166666667
Argentina
12
329
274166666667
Australia
11
195
177272727273
India
7
275
392857142857
Brazil
3
115
383333333333
Country
Initiation
Site activation
Recruitment
LOC setup
Unproductive sites
(Approval ndash FCI)
(FCI ndash FSFV)
(FSFV ndash LSFV)
(CPC ndash FSFV)
South Africa
19
38
153
357
21
Australia
117
63
401
239
11
Germany
16
37
401
224
21
UK
9
101
301
346
20
Russia
11
52
174
334
9
India
31
28
389
431
3
Argentina
94
67
288
32
13
Brazil
79
59
94
656
20
USA
44
31
149
26
Country
Pts Rand
Sites
Av CPP
Cost Per Country
Ethics Subm
Regulatory Fees
Add Inv Fees
CT Scan Total
Ethics + Regulatory
Total Regulatory Fees
China
39
5
4978
194142
522
0
39814
0
522
40336
Germany
55
10
7000
385000
3000
0
0
12000
3000
3000
Peru
40
5
7000
280000
1500
1000
2000
60000
2500
4500
South Africa
25
5
7250
181250
290
460
363
0
750
1113
Canada
18
4
8325
149858
1818
0
0
1557576
1818
1818
Greece
40
7
9000
360000
0
7500
0
0
7500
7500
France
50
10
9000
450000
0
0
20000
0
0
20000
Italy
7
2
10000
70000
2200
0
0
0
2200
2200
Poland
15
4
10000
150000
0
2500
2400
0
2500
4900
Bulgaria
18
4
10000
180000
0
5000
1000
0
5000
6000
Czech Rep
10
2
10000
100000
1500
3000
3000
0
4500
7500
Brazil
30
6
10000
300000
2000
2874
56492
0
4874
61366
Spain
40
7
10500
420000
0
0
5450
0
0
5450
Korea
30
3
10827
324802
1114
0
14324
0
1114
15438
Chile
15
4
10840
162600
1700
3600
3000
0
5300
8300
Israel
10
6
11140
111400
2060
3000
48400
16500
5060
53460
Singapore
10
2
11565
115650
1750
0
17975
0
1750
19725
Taiwan
20
4
11796
235930
1042
313
5208
0
1355
6563
Belgium
25
6
12200
305000
3992
4332
0
0
8324
8324
UK
12
4
13000
156000
0
0
5556
0
0
5556
New Zealand
10
3
14524
145244
1973
0
43123
0
1973
45096
Australia
24
6
40200
964800
0
500
82500
0
500
83000
23
543
109
5328568
33047
26939
277000
73748966
[1753EURO x 14 (ex rate) = $2454] [ $245416 hours=$153hour]
110
1095625
1227
1753
19809
20
21
China
Germany
Peru
South Africa
Canada
Greece
France
Italy
Poland
Bulgaria
Czech Rep
Brazil
Spain
Korea
Chile
Israel
Singapore
Taiwan
Belgium
UK
New Zealand
Australia
Population Group
IndianAsianOther
26
Mixed ethnicity
90
Caucasian
91
African
793
10000
IndianAsianOther
Mixed ethnicity
Caucasian
African
17
Population 5495-million 1-Jul-2015 estimate
SA urbanrural profile
18
Cape Town Port Elizabeth
Durban
Pretoria
Joburg
Bloemfontein
Distribution of clinical trial sites
George
East London
Nelspruit
Richardrsquos Bay Kimberley
Welkom
19
Source Statistics South Africa 2015
3
9
979
IndianAsianOtherMixed ethnicityCaucasianAfrican
bull Young 44 aged lt 20 yrs bull Elderly 76 aged gt 60 yrs bull High number of treatment-naiumlve patients
SA Demographics
Chart1
9
0026
009
0091
0793
Sheet1
Sheet1
Sheet2
Sheet3
20
South Africa Leading Causes of Death
00
20
40
60
80
100
120
140 The ten leading underlying natural causes of death in South Africa (2009)
percentage
TB Flu amp Intest Heart Cereb Diab HIV HT Chron Immun Pneum Infect Other Vasc Mell Dis LRT Dis
Stats SA Rel P03093 Mortality and causes of death in South Africa 2009 Findings from death notification Nov-2011
Age group
TB 0-14 15-49 50-64 65+
Rank Rank Rank Rank
5 34 1 196 1 114 8 33
24
bull Well established research infrastructure bull Public and private sectors
28 teaching hospitals gt40000 tertiary care beds 140 private hospitals gt30000 beds 15 - 18 medical insurance
bull Large broad-based investigator database amp site networks bull Specialised Early Phase presence since 1970s bull GCPGLP and CLIA 88 compliant labs bull Specialist labs (biomarkers TB immunology
PKbioassay) bull Full support services (GMP-depots translations etc) bull Stringent ICH-compliant RAEC review policies
GCP is a legal requirement Informed Consent entrenched in Constitution
South Africa Advantages
25
bull Reliable (+) roads air links energy connectivity bull European Time bull Research language is English bull Inverse seasons bull Cost Currency bull Mobile-phone enabled obsessed population
South Africa Advantages
26
South Africa Track Record
bull Phase I-III data from SA included in hundreds of US amp European registration dossiers
bull Two entire NDA dossiers ndash rifapentine 1998 ndash tryptorelin (GnRH agonist) 2001) comprised SA data
bull 37 FDA inspections 1994-2009 1 OAI (27)
27
Therapeutic Indications
28
0
1
2
3
4
5
6
7
8
9
10
Belg
ium
Au
stria
Li
thua
nia
Can
ada
Luxe
mbo
urg
Mal
ta
Nor
way
Po
rtuga
l R
oman
ia
Rus
sia
Serb
ia
Swed
en
The
Net
herla
nds
USA
loca
l site
s U
SA c
entra
l site
C
zech
Rep
ublic
D
enm
ark
Esto
nia
Finl
and
Hun
gary
Ic
elan
d Ire
land
La
tvia
G
erm
any
Switz
erla
nd
Liec
hten
stei
n U
nite
d Ki
ngdo
m
Fran
ce
Italy
Au
stra
lia
Hon
g-Ko
ng
New
Zea
land
Si
ngap
ore
Taiw
an
Uga
nda
Pola
nd
Ukr
aine
C
hile
G
uate
mal
a Ja
pan
Isra
el
Slov
akia
Bu
lgar
ia
Gre
ece
Mal
aysi
a Ph
ilipp
ines
Pe
ru
Thai
land
Tu
rkey
Sl
oven
ia
Cos
ta R
ica
Mex
ico
Spai
n So
uth
Afric
a Ar
gent
ina
Sout
h Ko
rea
Col
ombi
a Pa
nam
a C
roat
ia
Indi
a Ve
nezu
ela
Braz
il C
hina
Mon
ths
Sout
h Afri
ca
Global Regulatory Review Timelines
Triclinium experience 2009-2015
Triclinium experience 2009 - 2015
29
Protocol release Country selection
Site Selection Collection of reg docs
Submission of RA application
EC application
Negotiate Site Contracts
EC Approvals
RA Approval amp Import permit
Site Initiation Import amp distribute drug
Import ancillary supplies Set up local labs
Set up EDC
Months
0
1
2
3
All EC approvals typically within 6
weeks
Site contracts signed within days
As soon as MCC approval obtained ALL sites can be initiated
Start-Up Activities in PARALLEL
GMO application (biologics)
30
0
2000
4000
6000
8000
10000
12000
14000C
hina
Ger
man
y
Per
u
Sou
th A
frica
Can
ada
Gre
ece
Fran
ce
Italy
Pol
and
Bul
garia
Cze
ch R
ep
Bra
zil
Spa
in
Kor
ea
Chi
le
Isra
el
Sin
gapo
re
Taiw
an
Bel
gium U
K
New
hellip
Aus
tralia
Source Bayer Presented SACRA Conference 2009
Aver
age
cost
per
pat
ient
(Eur
o)
Average Cost per Enrolled Participant
gt40000
Chart1
Average Cost Per Patient (Euro)
4978
7000
7000
7250
832545
9000
9000
10000
10000
10000
10000
10000
10500
10827
10840
11140
11565
1179649
12200
13000
145244
40200
Sheet1
Sheet2
Sheet2
Average Cost Per Patient (Euro)
Average Cost Per Patient
Sheet4
Ethics Subm
Regulatory Fees
Sheet3
Ethics + Regulatory
Total Ethics and Regulatory Fees
Add Inv Fees
Additional Investigator Application Fees
Total Regulatory Fees
Study starts
SubjectsStudy
31
Euro
0
10000
20000
30000
40000
50000
60000
70000
80000
90000S
outh
Afri
caC
anad
a
Italy
Ger
man
yP
eru
Pol
and
Spa
in UK
Bul
garia
Taiw
anC
zech
Rep
Gre
ece
Chi
leB
elgi
umK
orea
Sin
gapo
reFr
ance
Chi
naN
ew Z
eala
ndIs
rael
Bra
zil
Aus
tralia
Source Bayer Presented SACRA Conference 2009
Eur
os
Regulatory Application Fees
Chart1
Total Regulatory Fees
1113
181818
2200
3000
4500
4900
5450
5556
6000
656267
7500
7500
8300
8324
15438
19725
20000
403364
45096
53460
6136558
83000
Sheet1
Sheet2
Sheet2
Average Cost Per Patient (Euro)
Average Cost Per Patient
Sheet4
Ethics Subm
Regulatory Fees
Sheet3
Ethics + Regulatory
Total Ethics and Regulatory Fees
Add Inv Fees
Additional Investigator Application Fees
Total Regulatory Fees
Study starts
SubjectsStudy
32
SA Clinical Trial Regulatory Processes
Governed by SA-GCP and Declaration of Helsinki SA National Clinical Trials Register (SANCTR) Medicines Control Council (National Regulatory Authority)
o New protocols o Amendments o Additional sitesinvestigators
Ethics Committees (33 NHREC-registered) RegionalMunicipal DoH Export permits for bio samples (Nat Health Act 2003)
Clinical Trial Density Active sites million population
Nature Reviews Drug Discovery 7 13-14 (January 2008)
France 503
Germany 512 Canada
922
USA 1203
Czech Republic 776
553 sites
South Africa 119
757 sites
757 sites
533 sites
1084 sites
Argentina 269
Russia 77
China 04
India 07
34
Gateway to Africa
35
Why Africa bull Large accessible population relatively new to clinical trials
bull Experienced and willing investigators
bull Many clinical trial sites established by PDPs NGOs etc
bull Expanding therapeutic areas shifting burden of disease from
infectious to non-communicable diseases
bull Significantly improved infrastructure and accessibility
bull Rapidly evolving regulatory and ethics procedures
bull Potential for capacity building and sustainable clinical trial potential
36
Relatively young GCP culture Resident mentorships to build capacity Locations ndash accessibility for site monitoring Variable infrastructure esp electricity connectivity and
transportation Resourcing of public healthcare systems
Sub-Saharan Africa challenges
37
bull Second-largest continent
bull Spans NS and EW hemispheres
bull Second most populous continent 2014 estimate 1069 billion
bull Home to more than a quarter of the 196 independent countries
bull All 54 African countries are UN members
bull 39 urban population
bull 12 metropolitan areas gt 4m
bull gt 3000 distinct ethnicities
bull gt 2000 languages spoken
AFRICA hellip the true size
wwwcitypopulationdeworldAgglomerations 2015
38
SSV to SIV
0
5
10
15
20
25
30
35
40
45
Africa North America
Asia Pacific
Western Europe
Eastern Europe
Latin America
Source Quintiles South Africa SACRA Conference 2008
Wee
ks (A
vera
ge)
Start-Up Timelines
39
Region Median
Patients Site
of Sites
0 pts 1 - 3 pts 4 - 9 pts 10+ pts
Latin America 40 21 26 30 23
North America 30 29 29 24 18
Eastern Europe 60 15 31 26 27
Western Europe 40 15 22 29 34
Asia Pacific 40 19 30 34 18
Africa 100 4 17 28 51
Enrollment performance by region for 2008
Site Performance
Source Quintiles South Africa Presented SACRA Conference 2009
40
0 1 2 3 4 5 6 7 8 9
10
Latin America
North America
Eastern Europe
Western Europe
Asia Pacific
Africa
Num
ber o
f par
ticip
ants
MEDIAN site enrollment by region for 2008
Source Quintiles South Africa Presented SACRA Conference 2009
Site Performance
41
Source Quintiles South Africa Presented SACRA Conference 2009
s
ites
0
5
10
15
20
25
30
35
40
45
50
LatinAmerica
NorthAmerica
EasternEurope
WesternEurope
Asia Pacific Africa
0 pts
1 - 3 pts
4 - 9 pts
10+ pts
Enrollment performance by region for 2008
Site Performance
Chart1
0 pts
1 - 3 pts
4 - 9 pts
10+ pts
021
026
03
023
029
029
024
018
015
031
026
027
015
022
029
034
019
03
034
018
004
017
028
051
HIV
HIV
Resiratory amp Cancer
Male prevalence
Female prevalence
CVS
Overall death rates
Overall death rates
COPD
Asthma
Tracheabronchial lung cancer
Oesophageal cancer
prostate cancer
Trial metrics
COPD
Asthma
Tracheabronchial lung cancer
Oesophageal cancer
Prostate cancer
Cervical cancer
Breast cancer
Stroke
ill-defined heart disease
Diabetes mellitus
Ischaemic heart disease
Hypertension
Nephritisnephrosis
Stroke
ill-defined heart disease
Diabetes mellitus
Ischaemic heart disease
Hypertension
Nephritisnephrosis
Males
Female
UN - Male
SA 1997
SA 2004
UN - Female
SA 1997
SA 2004
0 pts
1 - 3 pts
4 - 9 pts
10+ pts
42
Source wwwclinicaltrialsgov 22-Oct-2010
Clinical trials registered across Africa
43
0
500
1000
1500
2000
2500
South Africa Kenya Malawi Tanzania Uganda Zambia
Selected African countries
2005
2010
2015
Source ClinTrialsgov
Trend 2005 - 2015
Source wwwclinicaltrialsgov 28-Aug-2015
44
AFRICA FOUND IN TRANSLATION
bull Vast treatment-naiumlve population bull Cost advantages (still) bull Diverse ethnicity amp morbidity bull Inverse seasonality bull Site capacity-building widely implemented bull Robust regulatory review bull Variable but generally good regulatory timelines bull Established GCP culture ndash sites and home-bred CROs
45
THANK YOU
Foliennummer 1
Triclinium A South African CRO
Collaboration with VPM SII
Vaccine Trials in SA 2015
Foliennummer 5
Foliennummer 6
Foliennummer 7
Foliennummer 8
Foliennummer 9
Foliennummer 10
Foliennummer 11
Foliennummer 12
Foliennummer 13
Foliennummer 14
Foliennummer 15
Foliennummer 16
Foliennummer 17
Distribution of clinical trial sites
Foliennummer 19
South Africa Leading Causes of Death
Foliennummer 21
Foliennummer 22
South Africa TB deaths by age group
Foliennummer 24
Foliennummer 25
Foliennummer 26
Foliennummer 27
Foliennummer 28
Foliennummer 29
Foliennummer 30
Foliennummer 31
SA Clinical Trial Regulatory Processes
Clinical Trial Density Active sites million population
Foliennummer 34
Why Africa
Foliennummer 36
AFRICA hellip the true size
SSV to SIV
Foliennummer 39
Foliennummer 40
Foliennummer 41
Foliennummer 42
Foliennummer 43
AFRICA FOUND IN TRANSLATION
Foliennummer 45
Region
Median
of Sites
Patients Site
0 pts
1 - 3 pts
4 - 9 pts
10+ pts
Latin America
4
21
26
30
23
North America
3
29
29
24
18
Eastern Europe
6
15
31
26
27
Western Europe
4
15
22
29
34
Asia Pacific
4
19
30
34
18
Africa
10
4
17
28
51
0 pts
1 - 3 pts
4 - 9 pts
10+ pts
Latin America
21
26
30
23
North America
29
29
24
18
Eastern Europe
15
31
26
27
Western Europe
15
22
29
34
Asia Pacific
19
30
34
18
Africa
4
17
28
51
Males
Female
15-19
210
150
20-24
340
205
25-29
395
300
30-34
460
360
35-39
600
405
40-44
800
500
45-49
1100
700
50-54
1600
1050
55-54
2300
1580
60-64
3340
2250
UN - Male
SA 1997
SA 2004
UN - Female
SA 1997
SA 2004
15-19
210
235
216
150
165
187
20-24
340
381
555
205
331
1085
25-29
395
625
1081
300
452
1985
30-34
460
817
2118
360
489
2267
35-39
600
916
2498
405
526
1890
40-44
800
1136
2765
500
615
1548
45-49
1100
1486
2744
700
800
1400
50-54
1600
2016
2979
1050
1116
1506
55-54
2300
2838
3270
1580
1626
1717
60-64
3340
3614
4146
2250
2201
2360
Stroke
ill-defined heart disease
Diabetes mellitus
Ischaemic heart disease
Hypertension
Nephritisnephrosis
Stroke
ill-defined heart disease
Diabetes mellitus
Ischaemic heart disease
Hypertension
Nephritisnephrosis
1999
34
345
20
248
14
10
1999
295
246
23
10
145
68
2000
36
362
218
249
152
112
2000
318
268
241
108
16
8
2001
35
372
22
25
15
125
2001
322
28
252
102
162
95
2002
405
298
24
26
147
126
2002
352
295
27
115
16
10
2003
425
32
245
285
152
15
2003
382
299
285
122
17
12
2004
39
325
255
26
165
16
2004
35
30
295
121
19
119
2005
36
328
265
26
15
162
2005
325
30
32
12
18
12
2006
35
336
27
258
155
16
2006
33
32
32
11
18
125
COPD
Asthma
Tracheabronchial lung cancer
Oesophageal cancer
prostate cancer
Cervical cancer
Breast cancer
1999
2001
12
135
10
26
2000
204
116
13
92
28
2001
222
131
133
96
27
2002
23
144
128
95
285
2003
243
149
124
94
29
2004
229
154
1255
87
29
2005
224
152
122
82
295
2006
224
136
116
75
3
COPD
Asthma
Tracheabronchial lung cancer
Oesophageal cancer
Prostate cancer
Cervical cancer
Breast cancer
1999
88
92
43
41
106
82
2000
96
95
4
43
11
81
2001
10
109
4
4
111
89
2002
10
116
4
4
112
85
2003
11
124
4
395
116
85
2004
102
1295
44
39
115
101
2005
105
128
42
38
1185
10
2006
10
12
42
32
1205
10
Based on this survey the researchers estimate that 109 of all South Africans over 2 years old were living with HIV in 2008 In 2002 and 2005 this figure was 114 and 108 respectively showing a degree of stabilisation Among those between 15 and 49 years old the estimated HIV prevalence was 169 in 2008 The survey found the prevalence among children aged 2-14 to be 25 down significantly since 2002 when prevalence was 56
Estimated HIV prevalence () among South Africans aged 2 years and older by age 2002-2008
Age
HIV +
HIV -
Children (2-14 years)
25
975
Youth (15-24 years)
87
913
Adults (25 and older)
168
832
(15-49 years)
169
831
Total (2 and older)
109
891
Estimated HIV prevalence among South Africans by age and sex 2008
Age
Male prevalence
Female prevalence
2-14
3
2
15-19
25
67
20-24
51
211
25-29
157
327
30-34
258
291
35-39
185
248
40-44
192
163
45-49
64
141
50-54
104
102
55-59
62
77
60+
35
18
Total
79
136
Among females HIV prevalence is highest in those between 25 and 29 years old among males the peak is in the group aged 30-34 years
HIV prevalence () by province 2002-2008
Province
2002
2005
2008
KwaZulu-Natal
117
165
158
Mpumalanga
141
152
154
Free State
149
126
126
North West
103
109
113
Gauteng
147
108
103
Eastern Cape
66
89
9
Limpopo
98
8
88
Northern Cape
84
54
59
Western Cape
107
19
38
National
114
108
109
The results of this study suggest that KwaZulu-Natal Mpumulanga and Free State have the highest HIV prevalence However the relatively small sample sizes may limit precision and in several cases the ranges of uncertainty overlap
HIV prevalence by population group 2008
Population group
Prevalence ()
African
136
864
White
03
997
Coloured
17
983
Indian
03
997
Studies of AIDS deaths
Latin America
Latin America
Latin America
Latin America
North America
North America
North America
North America
Eastern Europe
Eastern Europe
Eastern Europe
Eastern Europe
Western Europe
Western Europe
Western Europe
Western Europe
Asia Pacific
Asia Pacific
Asia Pacific
Asia Pacific
Africa
Africa
Africa
Africa
Country
Study starts
Subjects randomised
SubjectsStudy
USA
32
4385
13703125
Russia
20
788
394
Germany
19
1883
991052631579
UK
13
265
203846153846
South Africa
12
347
289166666667
Argentina
12
329
274166666667
Australia
11
195
177272727273
India
7
275
392857142857
Brazil
3
115
383333333333
Country
Initiation
Site activation
Recruitment
LOC setup
Unproductive sites
(Approval ndash FCI)
(FCI ndash FSFV)
(FSFV ndash LSFV)
(CPC ndash FSFV)
South Africa
19
38
153
357
21
Australia
117
63
401
239
11
Germany
16
37
401
224
21
UK
9
101
301
346
20
Russia
11
52
174
334
9
India
31
28
389
431
3
Argentina
94
67
288
32
13
Brazil
79
59
94
656
20
USA
44
31
149
26
Country
Pts Rand
Sites
Av CPP
Cost Per Country
Ethics Subm
Regulatory Fees
Add Inv Fees
CT Scan Total
Ethics + Regulatory
Total Regulatory Fees
South Africa
25
5
7250
181250
290
460
363
0
750
1113
Canada
18
4
832545
14985818
181818
0
0
1557576
181818
1818
Italy
7
2
10000
70000
2200
0
0
0
2200
2200
Germany
55
10
7000
385000
3000
0
0
12000
3000
3000
Peru
40
5
7000
280000
1500
1000
2000
60000
2500
4500
Poland
15
4
10000
150000
0
2500
2400
0
2500
4900
Spain
40
7
10500
420000
0
0
5450
0
0
5450
UK
12
4
13000
156000
0
0
5556
0
0
5556
Bulgaria
18
4
10000
180000
0
5000
1000
0
5000
6000
Taiwan
20
4
1179649
2359298
104167
313
5208
0
135467
6563
Czech Rep
10
2
10000
100000
1500
3000
3000
0
4500
7500
Greece
40
7
9000
360000
0
7500
0
0
7500
7500
Chile
15
4
10840
162600
1700
3600
3000
0
5300
8300
Belgium
25
6
12200
305000
3992
4332
0
0
8324
8324
Korea
30
3
10827
324802
1114
0
14324
0
1114
15438
Singapore
10
2
11565
115650
1750
0
17975
0
1750
19725
France
50
10
9000
450000
0
0
20000
0
0
20000
China
39
5
4978
194142
5224
0
39814
0
5224
40336
New Zealand
10
3
145244
145244
1973
0
43123
0
1973
45096
Israel
10
6
11140
111400
2060
3000
48400
16500
5060
53460
Brazil
30
6
10000
300000
2000
287356
5649202
0
487356
61366
Australia
24
6
40200
964800
0
500
82500
0
500
83000
23
543
109
532856799
3304716
26939
27700043
73748966
[1753EURO x 14 (ex rate) = $2454] [ $245416 hours=$153hour]
1095625
1095625
12271
1753
198089
198089
208514736842
South Africa
Canada
Italy
Germany
Peru
Poland
Spain
UK
Bulgaria
Taiwan
Czech Rep
Greece
Chile
Belgium
Korea
Singapore
France
China
New Zealand
Israel
Brazil
Australia
Country
Study starts
Subjects randomised
SubjectsStudy
USA
32
4385
13703125
Russia
20
788
394
Germany
19
1883
991052631579
UK
13
265
203846153846
South Africa
12
347
289166666667
Argentina
12
329
274166666667
Australia
11
195
177272727273
India
7
275
392857142857
Brazil
3
115
383333333333
Country
Initiation
Site activation
Recruitment
LOC setup
Unproductive sites
(Approval ndash FCI)
(FCI ndash FSFV)
(FSFV ndash LSFV)
(CPC ndash FSFV)
South Africa
19
38
153
357
21
Australia
117
63
401
239
11
Germany
16
37
401
224
21
UK
9
101
301
346
20
Russia
11
52
174
334
9
India
31
28
389
431
3
Argentina
94
67
288
32
13
Brazil
79
59
94
656
20
USA
44
31
149
26
Country
Pts Rand
Sites
Av CPP
Cost Per Country
Ethics Subm
Regulatory Fees
Add Inv Fees
CT Scan Total
Ethics + Regulatory
Total Regulatory Fees
China
39
5
4978
194142
522
0
39814
0
522
40336
Germany
55
10
7000
385000
3000
0
0
12000
3000
3000
Peru
40
5
7000
280000
1500
1000
2000
60000
2500
4500
South Africa
25
5
7250
181250
290
460
363
0
750
1113
Canada
18
4
8325
149858
1818
0
0
1557576
1818
1818
Greece
40
7
9000
360000
0
7500
0
0
7500
7500
France
50
10
9000
450000
0
0
20000
0
0
20000
Italy
7
2
10000
70000
2200
0
0
0
2200
2200
Poland
15
4
10000
150000
0
2500
2400
0
2500
4900
Bulgaria
18
4
10000
180000
0
5000
1000
0
5000
6000
Czech Rep
10
2
10000
100000
1500
3000
3000
0
4500
7500
Brazil
30
6
10000
300000
2000
2874
56492
0
4874
61366
Spain
40
7
10500
420000
0
0
5450
0
0
5450
Korea
30
3
10827
324802
1114
0
14324
0
1114
15438
Chile
15
4
10840
162600
1700
3600
3000
0
5300
8300
Israel
10
6
11140
111400
2060
3000
48400
16500
5060
53460
Singapore
10
2
11565
115650
1750
0
17975
0
1750
19725
Taiwan
20
4
11796
235930
1042
313
5208
0
1355
6563
Belgium
25
6
12200
305000
3992
4332
0
0
8324
8324
UK
12
4
13000
156000
0
0
5556
0
0
5556
New Zealand
10
3
14524
145244
1973
0
43123
0
1973
45096
Australia
24
6
40200
964800
0
500
82500
0
500
83000
23
543
109
5328568
33047
26939
277000
73748966
[1753EURO x 14 (ex rate) = $2454] [ $245416 hours=$153hour]
110
1095625
1227
1753
19809
20
21
China
Germany
Peru
South Africa
Canada
Greece
France
Italy
Poland
Bulgaria
Czech Rep
Brazil
Spain
Korea
Chile
Israel
Singapore
Taiwan
Belgium
UK
New Zealand
Australia
Population Group
IndianAsianOther
26
Mixed ethnicity
90
Caucasian
91
African
793
10000
IndianAsianOther
Mixed ethnicity
Caucasian
African
18
Cape Town Port Elizabeth
Durban
Pretoria
Joburg
Bloemfontein
Distribution of clinical trial sites
George
East London
Nelspruit
Richardrsquos Bay Kimberley
Welkom
19
Source Statistics South Africa 2015
3
9
979
IndianAsianOtherMixed ethnicityCaucasianAfrican
bull Young 44 aged lt 20 yrs bull Elderly 76 aged gt 60 yrs bull High number of treatment-naiumlve patients
SA Demographics
Chart1
9
0026
009
0091
0793
Sheet1
Sheet1
Sheet2
Sheet3
20
South Africa Leading Causes of Death
00
20
40
60
80
100
120
140 The ten leading underlying natural causes of death in South Africa (2009)
percentage
TB Flu amp Intest Heart Cereb Diab HIV HT Chron Immun Pneum Infect Other Vasc Mell Dis LRT Dis
Stats SA Rel P03093 Mortality and causes of death in South Africa 2009 Findings from death notification Nov-2011
Age group
TB 0-14 15-49 50-64 65+
Rank Rank Rank Rank
5 34 1 196 1 114 8 33
24
bull Well established research infrastructure bull Public and private sectors
28 teaching hospitals gt40000 tertiary care beds 140 private hospitals gt30000 beds 15 - 18 medical insurance
bull Large broad-based investigator database amp site networks bull Specialised Early Phase presence since 1970s bull GCPGLP and CLIA 88 compliant labs bull Specialist labs (biomarkers TB immunology
PKbioassay) bull Full support services (GMP-depots translations etc) bull Stringent ICH-compliant RAEC review policies
GCP is a legal requirement Informed Consent entrenched in Constitution
South Africa Advantages
25
bull Reliable (+) roads air links energy connectivity bull European Time bull Research language is English bull Inverse seasons bull Cost Currency bull Mobile-phone enabled obsessed population
South Africa Advantages
26
South Africa Track Record
bull Phase I-III data from SA included in hundreds of US amp European registration dossiers
bull Two entire NDA dossiers ndash rifapentine 1998 ndash tryptorelin (GnRH agonist) 2001) comprised SA data
bull 37 FDA inspections 1994-2009 1 OAI (27)
27
Therapeutic Indications
28
0
1
2
3
4
5
6
7
8
9
10
Belg
ium
Au
stria
Li
thua
nia
Can
ada
Luxe
mbo
urg
Mal
ta
Nor
way
Po
rtuga
l R
oman
ia
Rus
sia
Serb
ia
Swed
en
The
Net
herla
nds
USA
loca
l site
s U
SA c
entra
l site
C
zech
Rep
ublic
D
enm
ark
Esto
nia
Finl
and
Hun
gary
Ic
elan
d Ire
land
La
tvia
G
erm
any
Switz
erla
nd
Liec
hten
stei
n U
nite
d Ki
ngdo
m
Fran
ce
Italy
Au
stra
lia
Hon
g-Ko
ng
New
Zea
land
Si
ngap
ore
Taiw
an
Uga
nda
Pola
nd
Ukr
aine
C
hile
G
uate
mal
a Ja
pan
Isra
el
Slov
akia
Bu
lgar
ia
Gre
ece
Mal
aysi
a Ph
ilipp
ines
Pe
ru
Thai
land
Tu
rkey
Sl
oven
ia
Cos
ta R
ica
Mex
ico
Spai
n So
uth
Afric
a Ar
gent
ina
Sout
h Ko
rea
Col
ombi
a Pa
nam
a C
roat
ia
Indi
a Ve
nezu
ela
Braz
il C
hina
Mon
ths
Sout
h Afri
ca
Global Regulatory Review Timelines
Triclinium experience 2009-2015
Triclinium experience 2009 - 2015
29
Protocol release Country selection
Site Selection Collection of reg docs
Submission of RA application
EC application
Negotiate Site Contracts
EC Approvals
RA Approval amp Import permit
Site Initiation Import amp distribute drug
Import ancillary supplies Set up local labs
Set up EDC
Months
0
1
2
3
All EC approvals typically within 6
weeks
Site contracts signed within days
As soon as MCC approval obtained ALL sites can be initiated
Start-Up Activities in PARALLEL
GMO application (biologics)
30
0
2000
4000
6000
8000
10000
12000
14000C
hina
Ger
man
y
Per
u
Sou
th A
frica
Can
ada
Gre
ece
Fran
ce
Italy
Pol
and
Bul
garia
Cze
ch R
ep
Bra
zil
Spa
in
Kor
ea
Chi
le
Isra
el
Sin
gapo
re
Taiw
an
Bel
gium U
K
New
hellip
Aus
tralia
Source Bayer Presented SACRA Conference 2009
Aver
age
cost
per
pat
ient
(Eur
o)
Average Cost per Enrolled Participant
gt40000
Chart1
Average Cost Per Patient (Euro)
4978
7000
7000
7250
832545
9000
9000
10000
10000
10000
10000
10000
10500
10827
10840
11140
11565
1179649
12200
13000
145244
40200
Sheet1
Sheet2
Sheet2
Average Cost Per Patient (Euro)
Average Cost Per Patient
Sheet4
Ethics Subm
Regulatory Fees
Sheet3
Ethics + Regulatory
Total Ethics and Regulatory Fees
Add Inv Fees
Additional Investigator Application Fees
Total Regulatory Fees
Study starts
SubjectsStudy
31
Euro
0
10000
20000
30000
40000
50000
60000
70000
80000
90000S
outh
Afri
caC
anad
a
Italy
Ger
man
yP
eru
Pol
and
Spa
in UK
Bul
garia
Taiw
anC
zech
Rep
Gre
ece
Chi
leB
elgi
umK
orea
Sin
gapo
reFr
ance
Chi
naN
ew Z
eala
ndIs
rael
Bra
zil
Aus
tralia
Source Bayer Presented SACRA Conference 2009
Eur
os
Regulatory Application Fees
Chart1
Total Regulatory Fees
1113
181818
2200
3000
4500
4900
5450
5556
6000
656267
7500
7500
8300
8324
15438
19725
20000
403364
45096
53460
6136558
83000
Sheet1
Sheet2
Sheet2
Average Cost Per Patient (Euro)
Average Cost Per Patient
Sheet4
Ethics Subm
Regulatory Fees
Sheet3
Ethics + Regulatory
Total Ethics and Regulatory Fees
Add Inv Fees
Additional Investigator Application Fees
Total Regulatory Fees
Study starts
SubjectsStudy
32
SA Clinical Trial Regulatory Processes
Governed by SA-GCP and Declaration of Helsinki SA National Clinical Trials Register (SANCTR) Medicines Control Council (National Regulatory Authority)
o New protocols o Amendments o Additional sitesinvestigators
Ethics Committees (33 NHREC-registered) RegionalMunicipal DoH Export permits for bio samples (Nat Health Act 2003)
Clinical Trial Density Active sites million population
Nature Reviews Drug Discovery 7 13-14 (January 2008)
France 503
Germany 512 Canada
922
USA 1203
Czech Republic 776
553 sites
South Africa 119
757 sites
757 sites
533 sites
1084 sites
Argentina 269
Russia 77
China 04
India 07
34
Gateway to Africa
35
Why Africa bull Large accessible population relatively new to clinical trials
bull Experienced and willing investigators
bull Many clinical trial sites established by PDPs NGOs etc
bull Expanding therapeutic areas shifting burden of disease from
infectious to non-communicable diseases
bull Significantly improved infrastructure and accessibility
bull Rapidly evolving regulatory and ethics procedures
bull Potential for capacity building and sustainable clinical trial potential
36
Relatively young GCP culture Resident mentorships to build capacity Locations ndash accessibility for site monitoring Variable infrastructure esp electricity connectivity and
transportation Resourcing of public healthcare systems
Sub-Saharan Africa challenges
37
bull Second-largest continent
bull Spans NS and EW hemispheres
bull Second most populous continent 2014 estimate 1069 billion
bull Home to more than a quarter of the 196 independent countries
bull All 54 African countries are UN members
bull 39 urban population
bull 12 metropolitan areas gt 4m
bull gt 3000 distinct ethnicities
bull gt 2000 languages spoken
AFRICA hellip the true size
wwwcitypopulationdeworldAgglomerations 2015
38
SSV to SIV
0
5
10
15
20
25
30
35
40
45
Africa North America
Asia Pacific
Western Europe
Eastern Europe
Latin America
Source Quintiles South Africa SACRA Conference 2008
Wee
ks (A
vera
ge)
Start-Up Timelines
39
Region Median
Patients Site
of Sites
0 pts 1 - 3 pts 4 - 9 pts 10+ pts
Latin America 40 21 26 30 23
North America 30 29 29 24 18
Eastern Europe 60 15 31 26 27
Western Europe 40 15 22 29 34
Asia Pacific 40 19 30 34 18
Africa 100 4 17 28 51
Enrollment performance by region for 2008
Site Performance
Source Quintiles South Africa Presented SACRA Conference 2009
40
0 1 2 3 4 5 6 7 8 9
10
Latin America
North America
Eastern Europe
Western Europe
Asia Pacific
Africa
Num
ber o
f par
ticip
ants
MEDIAN site enrollment by region for 2008
Source Quintiles South Africa Presented SACRA Conference 2009
Site Performance
41
Source Quintiles South Africa Presented SACRA Conference 2009
s
ites
0
5
10
15
20
25
30
35
40
45
50
LatinAmerica
NorthAmerica
EasternEurope
WesternEurope
Asia Pacific Africa
0 pts
1 - 3 pts
4 - 9 pts
10+ pts
Enrollment performance by region for 2008
Site Performance
Chart1
0 pts
1 - 3 pts
4 - 9 pts
10+ pts
021
026
03
023
029
029
024
018
015
031
026
027
015
022
029
034
019
03
034
018
004
017
028
051
HIV
HIV
Resiratory amp Cancer
Male prevalence
Female prevalence
CVS
Overall death rates
Overall death rates
COPD
Asthma
Tracheabronchial lung cancer
Oesophageal cancer
prostate cancer
Trial metrics
COPD
Asthma
Tracheabronchial lung cancer
Oesophageal cancer
Prostate cancer
Cervical cancer
Breast cancer
Stroke
ill-defined heart disease
Diabetes mellitus
Ischaemic heart disease
Hypertension
Nephritisnephrosis
Stroke
ill-defined heart disease
Diabetes mellitus
Ischaemic heart disease
Hypertension
Nephritisnephrosis
Males
Female
UN - Male
SA 1997
SA 2004
UN - Female
SA 1997
SA 2004
0 pts
1 - 3 pts
4 - 9 pts
10+ pts
42
Source wwwclinicaltrialsgov 22-Oct-2010
Clinical trials registered across Africa
43
0
500
1000
1500
2000
2500
South Africa Kenya Malawi Tanzania Uganda Zambia
Selected African countries
2005
2010
2015
Source ClinTrialsgov
Trend 2005 - 2015
Source wwwclinicaltrialsgov 28-Aug-2015
44
AFRICA FOUND IN TRANSLATION
bull Vast treatment-naiumlve population bull Cost advantages (still) bull Diverse ethnicity amp morbidity bull Inverse seasonality bull Site capacity-building widely implemented bull Robust regulatory review bull Variable but generally good regulatory timelines bull Established GCP culture ndash sites and home-bred CROs
45
THANK YOU
Foliennummer 1
Triclinium A South African CRO
Collaboration with VPM SII
Vaccine Trials in SA 2015
Foliennummer 5
Foliennummer 6
Foliennummer 7
Foliennummer 8
Foliennummer 9
Foliennummer 10
Foliennummer 11
Foliennummer 12
Foliennummer 13
Foliennummer 14
Foliennummer 15
Foliennummer 16
Foliennummer 17
Distribution of clinical trial sites
Foliennummer 19
South Africa Leading Causes of Death
Foliennummer 21
Foliennummer 22
South Africa TB deaths by age group
Foliennummer 24
Foliennummer 25
Foliennummer 26
Foliennummer 27
Foliennummer 28
Foliennummer 29
Foliennummer 30
Foliennummer 31
SA Clinical Trial Regulatory Processes
Clinical Trial Density Active sites million population
Foliennummer 34
Why Africa
Foliennummer 36
AFRICA hellip the true size
SSV to SIV
Foliennummer 39
Foliennummer 40
Foliennummer 41
Foliennummer 42
Foliennummer 43
AFRICA FOUND IN TRANSLATION
Foliennummer 45
Region
Median
of Sites
Patients Site
0 pts
1 - 3 pts
4 - 9 pts
10+ pts
Latin America
4
21
26
30
23
North America
3
29
29
24
18
Eastern Europe
6
15
31
26
27
Western Europe
4
15
22
29
34
Asia Pacific
4
19
30
34
18
Africa
10
4
17
28
51
0 pts
1 - 3 pts
4 - 9 pts
10+ pts
Latin America
21
26
30
23
North America
29
29
24
18
Eastern Europe
15
31
26
27
Western Europe
15
22
29
34
Asia Pacific
19
30
34
18
Africa
4
17
28
51
Males
Female
15-19
210
150
20-24
340
205
25-29
395
300
30-34
460
360
35-39
600
405
40-44
800
500
45-49
1100
700
50-54
1600
1050
55-54
2300
1580
60-64
3340
2250
UN - Male
SA 1997
SA 2004
UN - Female
SA 1997
SA 2004
15-19
210
235
216
150
165
187
20-24
340
381
555
205
331
1085
25-29
395
625
1081
300
452
1985
30-34
460
817
2118
360
489
2267
35-39
600
916
2498
405
526
1890
40-44
800
1136
2765
500
615
1548
45-49
1100
1486
2744
700
800
1400
50-54
1600
2016
2979
1050
1116
1506
55-54
2300
2838
3270
1580
1626
1717
60-64
3340
3614
4146
2250
2201
2360
Stroke
ill-defined heart disease
Diabetes mellitus
Ischaemic heart disease
Hypertension
Nephritisnephrosis
Stroke
ill-defined heart disease
Diabetes mellitus
Ischaemic heart disease
Hypertension
Nephritisnephrosis
1999
34
345
20
248
14
10
1999
295
246
23
10
145
68
2000
36
362
218
249
152
112
2000
318
268
241
108
16
8
2001
35
372
22
25
15
125
2001
322
28
252
102
162
95
2002
405
298
24
26
147
126
2002
352
295
27
115
16
10
2003
425
32
245
285
152
15
2003
382
299
285
122
17
12
2004
39
325
255
26
165
16
2004
35
30
295
121
19
119
2005
36
328
265
26
15
162
2005
325
30
32
12
18
12
2006
35
336
27
258
155
16
2006
33
32
32
11
18
125
COPD
Asthma
Tracheabronchial lung cancer
Oesophageal cancer
prostate cancer
Cervical cancer
Breast cancer
1999
2001
12
135
10
26
2000
204
116
13
92
28
2001
222
131
133
96
27
2002
23
144
128
95
285
2003
243
149
124
94
29
2004
229
154
1255
87
29
2005
224
152
122
82
295
2006
224
136
116
75
3
COPD
Asthma
Tracheabronchial lung cancer
Oesophageal cancer
Prostate cancer
Cervical cancer
Breast cancer
1999
88
92
43
41
106
82
2000
96
95
4
43
11
81
2001
10
109
4
4
111
89
2002
10
116
4
4
112
85
2003
11
124
4
395
116
85
2004
102
1295
44
39
115
101
2005
105
128
42
38
1185
10
2006
10
12
42
32
1205
10
Based on this survey the researchers estimate that 109 of all South Africans over 2 years old were living with HIV in 2008 In 2002 and 2005 this figure was 114 and 108 respectively showing a degree of stabilisation Among those between 15 and 49 years old the estimated HIV prevalence was 169 in 2008 The survey found the prevalence among children aged 2-14 to be 25 down significantly since 2002 when prevalence was 56
Estimated HIV prevalence () among South Africans aged 2 years and older by age 2002-2008
Age
HIV +
HIV -
Children (2-14 years)
25
975
Youth (15-24 years)
87
913
Adults (25 and older)
168
832
(15-49 years)
169
831
Total (2 and older)
109
891
Estimated HIV prevalence among South Africans by age and sex 2008
Age
Male prevalence
Female prevalence
2-14
3
2
15-19
25
67
20-24
51
211
25-29
157
327
30-34
258
291
35-39
185
248
40-44
192
163
45-49
64
141
50-54
104
102
55-59
62
77
60+
35
18
Total
79
136
Among females HIV prevalence is highest in those between 25 and 29 years old among males the peak is in the group aged 30-34 years
HIV prevalence () by province 2002-2008
Province
2002
2005
2008
KwaZulu-Natal
117
165
158
Mpumalanga
141
152
154
Free State
149
126
126
North West
103
109
113
Gauteng
147
108
103
Eastern Cape
66
89
9
Limpopo
98
8
88
Northern Cape
84
54
59
Western Cape
107
19
38
National
114
108
109
The results of this study suggest that KwaZulu-Natal Mpumulanga and Free State have the highest HIV prevalence However the relatively small sample sizes may limit precision and in several cases the ranges of uncertainty overlap
HIV prevalence by population group 2008
Population group
Prevalence ()
African
136
864
White
03
997
Coloured
17
983
Indian
03
997
Studies of AIDS deaths
Latin America
Latin America
Latin America
Latin America
North America
North America
North America
North America
Eastern Europe
Eastern Europe
Eastern Europe
Eastern Europe
Western Europe
Western Europe
Western Europe
Western Europe
Asia Pacific
Asia Pacific
Asia Pacific
Asia Pacific
Africa
Africa
Africa
Africa
Country
Study starts
Subjects randomised
SubjectsStudy
USA
32
4385
13703125
Russia
20
788
394
Germany
19
1883
991052631579
UK
13
265
203846153846
South Africa
12
347
289166666667
Argentina
12
329
274166666667
Australia
11
195
177272727273
India
7
275
392857142857
Brazil
3
115
383333333333
Country
Initiation
Site activation
Recruitment
LOC setup
Unproductive sites
(Approval ndash FCI)
(FCI ndash FSFV)
(FSFV ndash LSFV)
(CPC ndash FSFV)
South Africa
19
38
153
357
21
Australia
117
63
401
239
11
Germany
16
37
401
224
21
UK
9
101
301
346
20
Russia
11
52
174
334
9
India
31
28
389
431
3
Argentina
94
67
288
32
13
Brazil
79
59
94
656
20
USA
44
31
149
26
Country
Pts Rand
Sites
Av CPP
Cost Per Country
Ethics Subm
Regulatory Fees
Add Inv Fees
CT Scan Total
Ethics + Regulatory
Total Regulatory Fees
South Africa
25
5
7250
181250
290
460
363
0
750
1113
Canada
18
4
832545
14985818
181818
0
0
1557576
181818
1818
Italy
7
2
10000
70000
2200
0
0
0
2200
2200
Germany
55
10
7000
385000
3000
0
0
12000
3000
3000
Peru
40
5
7000
280000
1500
1000
2000
60000
2500
4500
Poland
15
4
10000
150000
0
2500
2400
0
2500
4900
Spain
40
7
10500
420000
0
0
5450
0
0
5450
UK
12
4
13000
156000
0
0
5556
0
0
5556
Bulgaria
18
4
10000
180000
0
5000
1000
0
5000
6000
Taiwan
20
4
1179649
2359298
104167
313
5208
0
135467
6563
Czech Rep
10
2
10000
100000
1500
3000
3000
0
4500
7500
Greece
40
7
9000
360000
0
7500
0
0
7500
7500
Chile
15
4
10840
162600
1700
3600
3000
0
5300
8300
Belgium
25
6
12200
305000
3992
4332
0
0
8324
8324
Korea
30
3
10827
324802
1114
0
14324
0
1114
15438
Singapore
10
2
11565
115650
1750
0
17975
0
1750
19725
France
50
10
9000
450000
0
0
20000
0
0
20000
China
39
5
4978
194142
5224
0
39814
0
5224
40336
New Zealand
10
3
145244
145244
1973
0
43123
0
1973
45096
Israel
10
6
11140
111400
2060
3000
48400
16500
5060
53460
Brazil
30
6
10000
300000
2000
287356
5649202
0
487356
61366
Australia
24
6
40200
964800
0
500
82500
0
500
83000
23
543
109
532856799
3304716
26939
27700043
73748966
[1753EURO x 14 (ex rate) = $2454] [ $245416 hours=$153hour]
1095625
1095625
12271
1753
198089
198089
208514736842
South Africa
Canada
Italy
Germany
Peru
Poland
Spain
UK
Bulgaria
Taiwan
Czech Rep
Greece
Chile
Belgium
Korea
Singapore
France
China
New Zealand
Israel
Brazil
Australia
Country
Study starts
Subjects randomised
SubjectsStudy
USA
32
4385
13703125
Russia
20
788
394
Germany
19
1883
991052631579
UK
13
265
203846153846
South Africa
12
347
289166666667
Argentina
12
329
274166666667
Australia
11
195
177272727273
India
7
275
392857142857
Brazil
3
115
383333333333
Country
Initiation
Site activation
Recruitment
LOC setup
Unproductive sites
(Approval ndash FCI)
(FCI ndash FSFV)
(FSFV ndash LSFV)
(CPC ndash FSFV)
South Africa
19
38
153
357
21
Australia
117
63
401
239
11
Germany
16
37
401
224
21
UK
9
101
301
346
20
Russia
11
52
174
334
9
India
31
28
389
431
3
Argentina
94
67
288
32
13
Brazil
79
59
94
656
20
USA
44
31
149
26
Country
Pts Rand
Sites
Av CPP
Cost Per Country
Ethics Subm
Regulatory Fees
Add Inv Fees
CT Scan Total
Ethics + Regulatory
Total Regulatory Fees
China
39
5
4978
194142
522
0
39814
0
522
40336
Germany
55
10
7000
385000
3000
0
0
12000
3000
3000
Peru
40
5
7000
280000
1500
1000
2000
60000
2500
4500
South Africa
25
5
7250
181250
290
460
363
0
750
1113
Canada
18
4
8325
149858
1818
0
0
1557576
1818
1818
Greece
40
7
9000
360000
0
7500
0
0
7500
7500
France
50
10
9000
450000
0
0
20000
0
0
20000
Italy
7
2
10000
70000
2200
0
0
0
2200
2200
Poland
15
4
10000
150000
0
2500
2400
0
2500
4900
Bulgaria
18
4
10000
180000
0
5000
1000
0
5000
6000
Czech Rep
10
2
10000
100000
1500
3000
3000
0
4500
7500
Brazil
30
6
10000
300000
2000
2874
56492
0
4874
61366
Spain
40
7
10500
420000
0
0
5450
0
0
5450
Korea
30
3
10827
324802
1114
0
14324
0
1114
15438
Chile
15
4
10840
162600
1700
3600
3000
0
5300
8300
Israel
10
6
11140
111400
2060
3000
48400
16500
5060
53460
Singapore
10
2
11565
115650
1750
0
17975
0
1750
19725
Taiwan
20
4
11796
235930
1042
313
5208
0
1355
6563
Belgium
25
6
12200
305000
3992
4332
0
0
8324
8324
UK
12
4
13000
156000
0
0
5556
0
0
5556
New Zealand
10
3
14524
145244
1973
0
43123
0
1973
45096
Australia
24
6
40200
964800
0
500
82500
0
500
83000
23
543
109
5328568
33047
26939
277000
73748966
[1753EURO x 14 (ex rate) = $2454] [ $245416 hours=$153hour]
110
1095625
1227
1753
19809
20
21
China
Germany
Peru
South Africa
Canada
Greece
France
Italy
Poland
Bulgaria
Czech Rep
Brazil
Spain
Korea
Chile
Israel
Singapore
Taiwan
Belgium
UK
New Zealand
Australia
Population Group
IndianAsianOther
26
Mixed ethnicity
90
Caucasian
91
African
793
10000
IndianAsianOther
Mixed ethnicity
Caucasian
African
19
Source Statistics South Africa 2015
3
9
979
IndianAsianOtherMixed ethnicityCaucasianAfrican
bull Young 44 aged lt 20 yrs bull Elderly 76 aged gt 60 yrs bull High number of treatment-naiumlve patients
SA Demographics
Chart1
9
0026
009
0091
0793
Sheet1
Sheet1
Sheet2
Sheet3
20
South Africa Leading Causes of Death
00
20
40
60
80
100
120
140 The ten leading underlying natural causes of death in South Africa (2009)
percentage
TB Flu amp Intest Heart Cereb Diab HIV HT Chron Immun Pneum Infect Other Vasc Mell Dis LRT Dis
Stats SA Rel P03093 Mortality and causes of death in South Africa 2009 Findings from death notification Nov-2011
Age group
TB 0-14 15-49 50-64 65+
Rank Rank Rank Rank
5 34 1 196 1 114 8 33
24
bull Well established research infrastructure bull Public and private sectors
28 teaching hospitals gt40000 tertiary care beds 140 private hospitals gt30000 beds 15 - 18 medical insurance
bull Large broad-based investigator database amp site networks bull Specialised Early Phase presence since 1970s bull GCPGLP and CLIA 88 compliant labs bull Specialist labs (biomarkers TB immunology
PKbioassay) bull Full support services (GMP-depots translations etc) bull Stringent ICH-compliant RAEC review policies
GCP is a legal requirement Informed Consent entrenched in Constitution
South Africa Advantages
25
bull Reliable (+) roads air links energy connectivity bull European Time bull Research language is English bull Inverse seasons bull Cost Currency bull Mobile-phone enabled obsessed population
South Africa Advantages
26
South Africa Track Record
bull Phase I-III data from SA included in hundreds of US amp European registration dossiers
bull Two entire NDA dossiers ndash rifapentine 1998 ndash tryptorelin (GnRH agonist) 2001) comprised SA data
bull 37 FDA inspections 1994-2009 1 OAI (27)
27
Therapeutic Indications
28
0
1
2
3
4
5
6
7
8
9
10
Belg
ium
Au
stria
Li
thua
nia
Can
ada
Luxe
mbo
urg
Mal
ta
Nor
way
Po
rtuga
l R
oman
ia
Rus
sia
Serb
ia
Swed
en
The
Net
herla
nds
USA
loca
l site
s U
SA c
entra
l site
C
zech
Rep
ublic
D
enm
ark
Esto
nia
Finl
and
Hun
gary
Ic
elan
d Ire
land
La
tvia
G
erm
any
Switz
erla
nd
Liec
hten
stei
n U
nite
d Ki
ngdo
m
Fran
ce
Italy
Au
stra
lia
Hon
g-Ko
ng
New
Zea
land
Si
ngap
ore
Taiw
an
Uga
nda
Pola
nd
Ukr
aine
C
hile
G
uate
mal
a Ja
pan
Isra
el
Slov
akia
Bu
lgar
ia
Gre
ece
Mal
aysi
a Ph
ilipp
ines
Pe
ru
Thai
land
Tu
rkey
Sl
oven
ia
Cos
ta R
ica
Mex
ico
Spai
n So
uth
Afric
a Ar
gent
ina
Sout
h Ko
rea
Col
ombi
a Pa
nam
a C
roat
ia
Indi
a Ve
nezu
ela
Braz
il C
hina
Mon
ths
Sout
h Afri
ca
Global Regulatory Review Timelines
Triclinium experience 2009-2015
Triclinium experience 2009 - 2015
29
Protocol release Country selection
Site Selection Collection of reg docs
Submission of RA application
EC application
Negotiate Site Contracts
EC Approvals
RA Approval amp Import permit
Site Initiation Import amp distribute drug
Import ancillary supplies Set up local labs
Set up EDC
Months
0
1
2
3
All EC approvals typically within 6
weeks
Site contracts signed within days
As soon as MCC approval obtained ALL sites can be initiated
Start-Up Activities in PARALLEL
GMO application (biologics)
30
0
2000
4000
6000
8000
10000
12000
14000C
hina
Ger
man
y
Per
u
Sou
th A
frica
Can
ada
Gre
ece
Fran
ce
Italy
Pol
and
Bul
garia
Cze
ch R
ep
Bra
zil
Spa
in
Kor
ea
Chi
le
Isra
el
Sin
gapo
re
Taiw
an
Bel
gium U
K
New
hellip
Aus
tralia
Source Bayer Presented SACRA Conference 2009
Aver
age
cost
per
pat
ient
(Eur
o)
Average Cost per Enrolled Participant
gt40000
Chart1
Average Cost Per Patient (Euro)
4978
7000
7000
7250
832545
9000
9000
10000
10000
10000
10000
10000
10500
10827
10840
11140
11565
1179649
12200
13000
145244
40200
Sheet1
Sheet2
Sheet2
Average Cost Per Patient (Euro)
Average Cost Per Patient
Sheet4
Ethics Subm
Regulatory Fees
Sheet3
Ethics + Regulatory
Total Ethics and Regulatory Fees
Add Inv Fees
Additional Investigator Application Fees
Total Regulatory Fees
Study starts
SubjectsStudy
31
Euro
0
10000
20000
30000
40000
50000
60000
70000
80000
90000S
outh
Afri
caC
anad
a
Italy
Ger
man
yP
eru
Pol
and
Spa
in UK
Bul
garia
Taiw
anC
zech
Rep
Gre
ece
Chi
leB
elgi
umK
orea
Sin
gapo
reFr
ance
Chi
naN
ew Z
eala
ndIs
rael
Bra
zil
Aus
tralia
Source Bayer Presented SACRA Conference 2009
Eur
os
Regulatory Application Fees
Chart1
Total Regulatory Fees
1113
181818
2200
3000
4500
4900
5450
5556
6000
656267
7500
7500
8300
8324
15438
19725
20000
403364
45096
53460
6136558
83000
Sheet1
Sheet2
Sheet2
Average Cost Per Patient (Euro)
Average Cost Per Patient
Sheet4
Ethics Subm
Regulatory Fees
Sheet3
Ethics + Regulatory
Total Ethics and Regulatory Fees
Add Inv Fees
Additional Investigator Application Fees
Total Regulatory Fees
Study starts
SubjectsStudy
32
SA Clinical Trial Regulatory Processes
Governed by SA-GCP and Declaration of Helsinki SA National Clinical Trials Register (SANCTR) Medicines Control Council (National Regulatory Authority)
o New protocols o Amendments o Additional sitesinvestigators
Ethics Committees (33 NHREC-registered) RegionalMunicipal DoH Export permits for bio samples (Nat Health Act 2003)
Clinical Trial Density Active sites million population
Nature Reviews Drug Discovery 7 13-14 (January 2008)
France 503
Germany 512 Canada
922
USA 1203
Czech Republic 776
553 sites
South Africa 119
757 sites
757 sites
533 sites
1084 sites
Argentina 269
Russia 77
China 04
India 07
34
Gateway to Africa
35
Why Africa bull Large accessible population relatively new to clinical trials
bull Experienced and willing investigators
bull Many clinical trial sites established by PDPs NGOs etc
bull Expanding therapeutic areas shifting burden of disease from
infectious to non-communicable diseases
bull Significantly improved infrastructure and accessibility
bull Rapidly evolving regulatory and ethics procedures
bull Potential for capacity building and sustainable clinical trial potential
36
Relatively young GCP culture Resident mentorships to build capacity Locations ndash accessibility for site monitoring Variable infrastructure esp electricity connectivity and
transportation Resourcing of public healthcare systems
Sub-Saharan Africa challenges
37
bull Second-largest continent
bull Spans NS and EW hemispheres
bull Second most populous continent 2014 estimate 1069 billion
bull Home to more than a quarter of the 196 independent countries
bull All 54 African countries are UN members
bull 39 urban population
bull 12 metropolitan areas gt 4m
bull gt 3000 distinct ethnicities
bull gt 2000 languages spoken
AFRICA hellip the true size
wwwcitypopulationdeworldAgglomerations 2015
38
SSV to SIV
0
5
10
15
20
25
30
35
40
45
Africa North America
Asia Pacific
Western Europe
Eastern Europe
Latin America
Source Quintiles South Africa SACRA Conference 2008
Wee
ks (A
vera
ge)
Start-Up Timelines
39
Region Median
Patients Site
of Sites
0 pts 1 - 3 pts 4 - 9 pts 10+ pts
Latin America 40 21 26 30 23
North America 30 29 29 24 18
Eastern Europe 60 15 31 26 27
Western Europe 40 15 22 29 34
Asia Pacific 40 19 30 34 18
Africa 100 4 17 28 51
Enrollment performance by region for 2008
Site Performance
Source Quintiles South Africa Presented SACRA Conference 2009
40
0 1 2 3 4 5 6 7 8 9
10
Latin America
North America
Eastern Europe
Western Europe
Asia Pacific
Africa
Num
ber o
f par
ticip
ants
MEDIAN site enrollment by region for 2008
Source Quintiles South Africa Presented SACRA Conference 2009
Site Performance
41
Source Quintiles South Africa Presented SACRA Conference 2009
s
ites
0
5
10
15
20
25
30
35
40
45
50
LatinAmerica
NorthAmerica
EasternEurope
WesternEurope
Asia Pacific Africa
0 pts
1 - 3 pts
4 - 9 pts
10+ pts
Enrollment performance by region for 2008
Site Performance
Chart1
0 pts
1 - 3 pts
4 - 9 pts
10+ pts
021
026
03
023
029
029
024
018
015
031
026
027
015
022
029
034
019
03
034
018
004
017
028
051
HIV
HIV
Resiratory amp Cancer
Male prevalence
Female prevalence
CVS
Overall death rates
Overall death rates
COPD
Asthma
Tracheabronchial lung cancer
Oesophageal cancer
prostate cancer
Trial metrics
COPD
Asthma
Tracheabronchial lung cancer
Oesophageal cancer
Prostate cancer
Cervical cancer
Breast cancer
Stroke
ill-defined heart disease
Diabetes mellitus
Ischaemic heart disease
Hypertension
Nephritisnephrosis
Stroke
ill-defined heart disease
Diabetes mellitus
Ischaemic heart disease
Hypertension
Nephritisnephrosis
Males
Female
UN - Male
SA 1997
SA 2004
UN - Female
SA 1997
SA 2004
0 pts
1 - 3 pts
4 - 9 pts
10+ pts
42
Source wwwclinicaltrialsgov 22-Oct-2010
Clinical trials registered across Africa
43
0
500
1000
1500
2000
2500
South Africa Kenya Malawi Tanzania Uganda Zambia
Selected African countries
2005
2010
2015
Source ClinTrialsgov
Trend 2005 - 2015
Source wwwclinicaltrialsgov 28-Aug-2015
44
AFRICA FOUND IN TRANSLATION
bull Vast treatment-naiumlve population bull Cost advantages (still) bull Diverse ethnicity amp morbidity bull Inverse seasonality bull Site capacity-building widely implemented bull Robust regulatory review bull Variable but generally good regulatory timelines bull Established GCP culture ndash sites and home-bred CROs
45
THANK YOU
Foliennummer 1
Triclinium A South African CRO
Collaboration with VPM SII
Vaccine Trials in SA 2015
Foliennummer 5
Foliennummer 6
Foliennummer 7
Foliennummer 8
Foliennummer 9
Foliennummer 10
Foliennummer 11
Foliennummer 12
Foliennummer 13
Foliennummer 14
Foliennummer 15
Foliennummer 16
Foliennummer 17
Distribution of clinical trial sites
Foliennummer 19
South Africa Leading Causes of Death
Foliennummer 21
Foliennummer 22
South Africa TB deaths by age group
Foliennummer 24
Foliennummer 25
Foliennummer 26
Foliennummer 27
Foliennummer 28
Foliennummer 29
Foliennummer 30
Foliennummer 31
SA Clinical Trial Regulatory Processes
Clinical Trial Density Active sites million population
Foliennummer 34
Why Africa
Foliennummer 36
AFRICA hellip the true size
SSV to SIV
Foliennummer 39
Foliennummer 40
Foliennummer 41
Foliennummer 42
Foliennummer 43
AFRICA FOUND IN TRANSLATION
Foliennummer 45
Region
Median
of Sites
Patients Site
0 pts
1 - 3 pts
4 - 9 pts
10+ pts
Latin America
4
21
26
30
23
North America
3
29
29
24
18
Eastern Europe
6
15
31
26
27
Western Europe
4
15
22
29
34
Asia Pacific
4
19
30
34
18
Africa
10
4
17
28
51
0 pts
1 - 3 pts
4 - 9 pts
10+ pts
Latin America
21
26
30
23
North America
29
29
24
18
Eastern Europe
15
31
26
27
Western Europe
15
22
29
34
Asia Pacific
19
30
34
18
Africa
4
17
28
51
Males
Female
15-19
210
150
20-24
340
205
25-29
395
300
30-34
460
360
35-39
600
405
40-44
800
500
45-49
1100
700
50-54
1600
1050
55-54
2300
1580
60-64
3340
2250
UN - Male
SA 1997
SA 2004
UN - Female
SA 1997
SA 2004
15-19
210
235
216
150
165
187
20-24
340
381
555
205
331
1085
25-29
395
625
1081
300
452
1985
30-34
460
817
2118
360
489
2267
35-39
600
916
2498
405
526
1890
40-44
800
1136
2765
500
615
1548
45-49
1100
1486
2744
700
800
1400
50-54
1600
2016
2979
1050
1116
1506
55-54
2300
2838
3270
1580
1626
1717
60-64
3340
3614
4146
2250
2201
2360
Stroke
ill-defined heart disease
Diabetes mellitus
Ischaemic heart disease
Hypertension
Nephritisnephrosis
Stroke
ill-defined heart disease
Diabetes mellitus
Ischaemic heart disease
Hypertension
Nephritisnephrosis
1999
34
345
20
248
14
10
1999
295
246
23
10
145
68
2000
36
362
218
249
152
112
2000
318
268
241
108
16
8
2001
35
372
22
25
15
125
2001
322
28
252
102
162
95
2002
405
298
24
26
147
126
2002
352
295
27
115
16
10
2003
425
32
245
285
152
15
2003
382
299
285
122
17
12
2004
39
325
255
26
165
16
2004
35
30
295
121
19
119
2005
36
328
265
26
15
162
2005
325
30
32
12
18
12
2006
35
336
27
258
155
16
2006
33
32
32
11
18
125
COPD
Asthma
Tracheabronchial lung cancer
Oesophageal cancer
prostate cancer
Cervical cancer
Breast cancer
1999
2001
12
135
10
26
2000
204
116
13
92
28
2001
222
131
133
96
27
2002
23
144
128
95
285
2003
243
149
124
94
29
2004
229
154
1255
87
29
2005
224
152
122
82
295
2006
224
136
116
75
3
COPD
Asthma
Tracheabronchial lung cancer
Oesophageal cancer
Prostate cancer
Cervical cancer
Breast cancer
1999
88
92
43
41
106
82
2000
96
95
4
43
11
81
2001
10
109
4
4
111
89
2002
10
116
4
4
112
85
2003
11
124
4
395
116
85
2004
102
1295
44
39
115
101
2005
105
128
42
38
1185
10
2006
10
12
42
32
1205
10
Based on this survey the researchers estimate that 109 of all South Africans over 2 years old were living with HIV in 2008 In 2002 and 2005 this figure was 114 and 108 respectively showing a degree of stabilisation Among those between 15 and 49 years old the estimated HIV prevalence was 169 in 2008 The survey found the prevalence among children aged 2-14 to be 25 down significantly since 2002 when prevalence was 56
Estimated HIV prevalence () among South Africans aged 2 years and older by age 2002-2008
Age
HIV +
HIV -
Children (2-14 years)
25
975
Youth (15-24 years)
87
913
Adults (25 and older)
168
832
(15-49 years)
169
831
Total (2 and older)
109
891
Estimated HIV prevalence among South Africans by age and sex 2008
Age
Male prevalence
Female prevalence
2-14
3
2
15-19
25
67
20-24
51
211
25-29
157
327
30-34
258
291
35-39
185
248
40-44
192
163
45-49
64
141
50-54
104
102
55-59
62
77
60+
35
18
Total
79
136
Among females HIV prevalence is highest in those between 25 and 29 years old among males the peak is in the group aged 30-34 years
HIV prevalence () by province 2002-2008
Province
2002
2005
2008
KwaZulu-Natal
117
165
158
Mpumalanga
141
152
154
Free State
149
126
126
North West
103
109
113
Gauteng
147
108
103
Eastern Cape
66
89
9
Limpopo
98
8
88
Northern Cape
84
54
59
Western Cape
107
19
38
National
114
108
109
The results of this study suggest that KwaZulu-Natal Mpumulanga and Free State have the highest HIV prevalence However the relatively small sample sizes may limit precision and in several cases the ranges of uncertainty overlap
HIV prevalence by population group 2008
Population group
Prevalence ()
African
136
864
White
03
997
Coloured
17
983
Indian
03
997
Studies of AIDS deaths
Latin America
Latin America
Latin America
Latin America
North America
North America
North America
North America
Eastern Europe
Eastern Europe
Eastern Europe
Eastern Europe
Western Europe
Western Europe
Western Europe
Western Europe
Asia Pacific
Asia Pacific
Asia Pacific
Asia Pacific
Africa
Africa
Africa
Africa
Country
Study starts
Subjects randomised
SubjectsStudy
USA
32
4385
13703125
Russia
20
788
394
Germany
19
1883
991052631579
UK
13
265
203846153846
South Africa
12
347
289166666667
Argentina
12
329
274166666667
Australia
11
195
177272727273
India
7
275
392857142857
Brazil
3
115
383333333333
Country
Initiation
Site activation
Recruitment
LOC setup
Unproductive sites
(Approval ndash FCI)
(FCI ndash FSFV)
(FSFV ndash LSFV)
(CPC ndash FSFV)
South Africa
19
38
153
357
21
Australia
117
63
401
239
11
Germany
16
37
401
224
21
UK
9
101
301
346
20
Russia
11
52
174
334
9
India
31
28
389
431
3
Argentina
94
67
288
32
13
Brazil
79
59
94
656
20
USA
44
31
149
26
Country
Pts Rand
Sites
Av CPP
Cost Per Country
Ethics Subm
Regulatory Fees
Add Inv Fees
CT Scan Total
Ethics + Regulatory
Total Regulatory Fees
South Africa
25
5
7250
181250
290
460
363
0
750
1113
Canada
18
4
832545
14985818
181818
0
0
1557576
181818
1818
Italy
7
2
10000
70000
2200
0
0
0
2200
2200
Germany
55
10
7000
385000
3000
0
0
12000
3000
3000
Peru
40
5
7000
280000
1500
1000
2000
60000
2500
4500
Poland
15
4
10000
150000
0
2500
2400
0
2500
4900
Spain
40
7
10500
420000
0
0
5450
0
0
5450
UK
12
4
13000
156000
0
0
5556
0
0
5556
Bulgaria
18
4
10000
180000
0
5000
1000
0
5000
6000
Taiwan
20
4
1179649
2359298
104167
313
5208
0
135467
6563
Czech Rep
10
2
10000
100000
1500
3000
3000
0
4500
7500
Greece
40
7
9000
360000
0
7500
0
0
7500
7500
Chile
15
4
10840
162600
1700
3600
3000
0
5300
8300
Belgium
25
6
12200
305000
3992
4332
0
0
8324
8324
Korea
30
3
10827
324802
1114
0
14324
0
1114
15438
Singapore
10
2
11565
115650
1750
0
17975
0
1750
19725
France
50
10
9000
450000
0
0
20000
0
0
20000
China
39
5
4978
194142
5224
0
39814
0
5224
40336
New Zealand
10
3
145244
145244
1973
0
43123
0
1973
45096
Israel
10
6
11140
111400
2060
3000
48400
16500
5060
53460
Brazil
30
6
10000
300000
2000
287356
5649202
0
487356
61366
Australia
24
6
40200
964800
0
500
82500
0
500
83000
23
543
109
532856799
3304716
26939
27700043
73748966
[1753EURO x 14 (ex rate) = $2454] [ $245416 hours=$153hour]
1095625
1095625
12271
1753
198089
198089
208514736842
South Africa
Canada
Italy
Germany
Peru
Poland
Spain
UK
Bulgaria
Taiwan
Czech Rep
Greece
Chile
Belgium
Korea
Singapore
France
China
New Zealand
Israel
Brazil
Australia
Country
Study starts
Subjects randomised
SubjectsStudy
USA
32
4385
13703125
Russia
20
788
394
Germany
19
1883
991052631579
UK
13
265
203846153846
South Africa
12
347
289166666667
Argentina
12
329
274166666667
Australia
11
195
177272727273
India
7
275
392857142857
Brazil
3
115
383333333333
Country
Initiation
Site activation
Recruitment
LOC setup
Unproductive sites
(Approval ndash FCI)
(FCI ndash FSFV)
(FSFV ndash LSFV)
(CPC ndash FSFV)
South Africa
19
38
153
357
21
Australia
117
63
401
239
11
Germany
16
37
401
224
21
UK
9
101
301
346
20
Russia
11
52
174
334
9
India
31
28
389
431
3
Argentina
94
67
288
32
13
Brazil
79
59
94
656
20
USA
44
31
149
26
Country
Pts Rand
Sites
Av CPP
Cost Per Country
Ethics Subm
Regulatory Fees
Add Inv Fees
CT Scan Total
Ethics + Regulatory
Total Regulatory Fees
China
39
5
4978
194142
522
0
39814
0
522
40336
Germany
55
10
7000
385000
3000
0
0
12000
3000
3000
Peru
40
5
7000
280000
1500
1000
2000
60000
2500
4500
South Africa
25
5
7250
181250
290
460
363
0
750
1113
Canada
18
4
8325
149858
1818
0
0
1557576
1818
1818
Greece
40
7
9000
360000
0
7500
0
0
7500
7500
France
50
10
9000
450000
0
0
20000
0
0
20000
Italy
7
2
10000
70000
2200
0
0
0
2200
2200
Poland
15
4
10000
150000
0
2500
2400
0
2500
4900
Bulgaria
18
4
10000
180000
0
5000
1000
0
5000
6000
Czech Rep
10
2
10000
100000
1500
3000
3000
0
4500
7500
Brazil
30
6
10000
300000
2000
2874
56492
0
4874
61366
Spain
40
7
10500
420000
0
0
5450
0
0
5450
Korea
30
3
10827
324802
1114
0
14324
0
1114
15438
Chile
15
4
10840
162600
1700
3600
3000
0
5300
8300
Israel
10
6
11140
111400
2060
3000
48400
16500
5060
53460
Singapore
10
2
11565
115650
1750
0
17975
0
1750
19725
Taiwan
20
4
11796
235930
1042
313
5208
0
1355
6563
Belgium
25
6
12200
305000
3992
4332
0
0
8324
8324
UK
12
4
13000
156000
0
0
5556
0
0
5556
New Zealand
10
3
14524
145244
1973
0
43123
0
1973
45096
Australia
24
6
40200
964800
0
500
82500
0
500
83000
23
543
109
5328568
33047
26939
277000
73748966
[1753EURO x 14 (ex rate) = $2454] [ $245416 hours=$153hour]
110
1095625
1227
1753
19809
20
21
China
Germany
Peru
South Africa
Canada
Greece
France
Italy
Poland
Bulgaria
Czech Rep
Brazil
Spain
Korea
Chile
Israel
Singapore
Taiwan
Belgium
UK
New Zealand
Australia
Population Group
IndianAsianOther
26
Mixed ethnicity
90
Caucasian
91
African
793
10000
IndianAsianOther
Mixed ethnicity
Caucasian
African
Chart1
9
0026
009
0091
0793
Sheet1
Sheet1
Sheet2
Sheet3
20
South Africa Leading Causes of Death
00
20
40
60
80
100
120
140 The ten leading underlying natural causes of death in South Africa (2009)
percentage
TB Flu amp Intest Heart Cereb Diab HIV HT Chron Immun Pneum Infect Other Vasc Mell Dis LRT Dis
Stats SA Rel P03093 Mortality and causes of death in South Africa 2009 Findings from death notification Nov-2011
Age group
TB 0-14 15-49 50-64 65+
Rank Rank Rank Rank
5 34 1 196 1 114 8 33
24
bull Well established research infrastructure bull Public and private sectors
28 teaching hospitals gt40000 tertiary care beds 140 private hospitals gt30000 beds 15 - 18 medical insurance
bull Large broad-based investigator database amp site networks bull Specialised Early Phase presence since 1970s bull GCPGLP and CLIA 88 compliant labs bull Specialist labs (biomarkers TB immunology
PKbioassay) bull Full support services (GMP-depots translations etc) bull Stringent ICH-compliant RAEC review policies
GCP is a legal requirement Informed Consent entrenched in Constitution
South Africa Advantages
25
bull Reliable (+) roads air links energy connectivity bull European Time bull Research language is English bull Inverse seasons bull Cost Currency bull Mobile-phone enabled obsessed population
South Africa Advantages
26
South Africa Track Record
bull Phase I-III data from SA included in hundreds of US amp European registration dossiers
bull Two entire NDA dossiers ndash rifapentine 1998 ndash tryptorelin (GnRH agonist) 2001) comprised SA data
bull 37 FDA inspections 1994-2009 1 OAI (27)
27
Therapeutic Indications
28
0
1
2
3
4
5
6
7
8
9
10
Belg
ium
Au
stria
Li
thua
nia
Can
ada
Luxe
mbo
urg
Mal
ta
Nor
way
Po
rtuga
l R
oman
ia
Rus
sia
Serb
ia
Swed
en
The
Net
herla
nds
USA
loca
l site
s U
SA c
entra
l site
C
zech
Rep
ublic
D
enm
ark
Esto
nia
Finl
and
Hun
gary
Ic
elan
d Ire
land
La
tvia
G
erm
any
Switz
erla
nd
Liec
hten
stei
n U
nite
d Ki
ngdo
m
Fran
ce
Italy
Au
stra
lia
Hon
g-Ko
ng
New
Zea
land
Si
ngap
ore
Taiw
an
Uga
nda
Pola
nd
Ukr
aine
C
hile
G
uate
mal
a Ja
pan
Isra
el
Slov
akia
Bu
lgar
ia
Gre
ece
Mal
aysi
a Ph
ilipp
ines
Pe
ru
Thai
land
Tu
rkey
Sl
oven
ia
Cos
ta R
ica
Mex
ico
Spai
n So
uth
Afric
a Ar
gent
ina
Sout
h Ko
rea
Col
ombi
a Pa
nam
a C
roat
ia
Indi
a Ve
nezu
ela
Braz
il C
hina
Mon
ths
Sout
h Afri
ca
Global Regulatory Review Timelines
Triclinium experience 2009-2015
Triclinium experience 2009 - 2015
29
Protocol release Country selection
Site Selection Collection of reg docs
Submission of RA application
EC application
Negotiate Site Contracts
EC Approvals
RA Approval amp Import permit
Site Initiation Import amp distribute drug
Import ancillary supplies Set up local labs
Set up EDC
Months
0
1
2
3
All EC approvals typically within 6
weeks
Site contracts signed within days
As soon as MCC approval obtained ALL sites can be initiated
Start-Up Activities in PARALLEL
GMO application (biologics)
30
0
2000
4000
6000
8000
10000
12000
14000C
hina
Ger
man
y
Per
u
Sou
th A
frica
Can
ada
Gre
ece
Fran
ce
Italy
Pol
and
Bul
garia
Cze
ch R
ep
Bra
zil
Spa
in
Kor
ea
Chi
le
Isra
el
Sin
gapo
re
Taiw
an
Bel
gium U
K
New
hellip
Aus
tralia
Source Bayer Presented SACRA Conference 2009
Aver
age
cost
per
pat
ient
(Eur
o)
Average Cost per Enrolled Participant
gt40000
Chart1
Average Cost Per Patient (Euro)
4978
7000
7000
7250
832545
9000
9000
10000
10000
10000
10000
10000
10500
10827
10840
11140
11565
1179649
12200
13000
145244
40200
Sheet1
Sheet2
Sheet2
Average Cost Per Patient (Euro)
Average Cost Per Patient
Sheet4
Ethics Subm
Regulatory Fees
Sheet3
Ethics + Regulatory
Total Ethics and Regulatory Fees
Add Inv Fees
Additional Investigator Application Fees
Total Regulatory Fees
Study starts
SubjectsStudy
31
Euro
0
10000
20000
30000
40000
50000
60000
70000
80000
90000S
outh
Afri
caC
anad
a
Italy
Ger
man
yP
eru
Pol
and
Spa
in UK
Bul
garia
Taiw
anC
zech
Rep
Gre
ece
Chi
leB
elgi
umK
orea
Sin
gapo
reFr
ance
Chi
naN
ew Z
eala
ndIs
rael
Bra
zil
Aus
tralia
Source Bayer Presented SACRA Conference 2009
Eur
os
Regulatory Application Fees
Chart1
Total Regulatory Fees
1113
181818
2200
3000
4500
4900
5450
5556
6000
656267
7500
7500
8300
8324
15438
19725
20000
403364
45096
53460
6136558
83000
Sheet1
Sheet2
Sheet2
Average Cost Per Patient (Euro)
Average Cost Per Patient
Sheet4
Ethics Subm
Regulatory Fees
Sheet3
Ethics + Regulatory
Total Ethics and Regulatory Fees
Add Inv Fees
Additional Investigator Application Fees
Total Regulatory Fees
Study starts
SubjectsStudy
32
SA Clinical Trial Regulatory Processes
Governed by SA-GCP and Declaration of Helsinki SA National Clinical Trials Register (SANCTR) Medicines Control Council (National Regulatory Authority)
o New protocols o Amendments o Additional sitesinvestigators
Ethics Committees (33 NHREC-registered) RegionalMunicipal DoH Export permits for bio samples (Nat Health Act 2003)
Clinical Trial Density Active sites million population
Nature Reviews Drug Discovery 7 13-14 (January 2008)
France 503
Germany 512 Canada
922
USA 1203
Czech Republic 776
553 sites
South Africa 119
757 sites
757 sites
533 sites
1084 sites
Argentina 269
Russia 77
China 04
India 07
34
Gateway to Africa
35
Why Africa bull Large accessible population relatively new to clinical trials
bull Experienced and willing investigators
bull Many clinical trial sites established by PDPs NGOs etc
bull Expanding therapeutic areas shifting burden of disease from
infectious to non-communicable diseases
bull Significantly improved infrastructure and accessibility
bull Rapidly evolving regulatory and ethics procedures
bull Potential for capacity building and sustainable clinical trial potential
36
Relatively young GCP culture Resident mentorships to build capacity Locations ndash accessibility for site monitoring Variable infrastructure esp electricity connectivity and
transportation Resourcing of public healthcare systems
Sub-Saharan Africa challenges
37
bull Second-largest continent
bull Spans NS and EW hemispheres
bull Second most populous continent 2014 estimate 1069 billion
bull Home to more than a quarter of the 196 independent countries
bull All 54 African countries are UN members
bull 39 urban population
bull 12 metropolitan areas gt 4m
bull gt 3000 distinct ethnicities
bull gt 2000 languages spoken
AFRICA hellip the true size
wwwcitypopulationdeworldAgglomerations 2015
38
SSV to SIV
0
5
10
15
20
25
30
35
40
45
Africa North America
Asia Pacific
Western Europe
Eastern Europe
Latin America
Source Quintiles South Africa SACRA Conference 2008
Wee
ks (A
vera
ge)
Start-Up Timelines
39
Region Median
Patients Site
of Sites
0 pts 1 - 3 pts 4 - 9 pts 10+ pts
Latin America 40 21 26 30 23
North America 30 29 29 24 18
Eastern Europe 60 15 31 26 27
Western Europe 40 15 22 29 34
Asia Pacific 40 19 30 34 18
Africa 100 4 17 28 51
Enrollment performance by region for 2008
Site Performance
Source Quintiles South Africa Presented SACRA Conference 2009
40
0 1 2 3 4 5 6 7 8 9
10
Latin America
North America
Eastern Europe
Western Europe
Asia Pacific
Africa
Num
ber o
f par
ticip
ants
MEDIAN site enrollment by region for 2008
Source Quintiles South Africa Presented SACRA Conference 2009
Site Performance
41
Source Quintiles South Africa Presented SACRA Conference 2009
s
ites
0
5
10
15
20
25
30
35
40
45
50
LatinAmerica
NorthAmerica
EasternEurope
WesternEurope
Asia Pacific Africa
0 pts
1 - 3 pts
4 - 9 pts
10+ pts
Enrollment performance by region for 2008
Site Performance
Chart1
0 pts
1 - 3 pts
4 - 9 pts
10+ pts
021
026
03
023
029
029
024
018
015
031
026
027
015
022
029
034
019
03
034
018
004
017
028
051
HIV
HIV
Resiratory amp Cancer
Male prevalence
Female prevalence
CVS
Overall death rates
Overall death rates
COPD
Asthma
Tracheabronchial lung cancer
Oesophageal cancer
prostate cancer
Trial metrics
COPD
Asthma
Tracheabronchial lung cancer
Oesophageal cancer
Prostate cancer
Cervical cancer
Breast cancer
Stroke
ill-defined heart disease
Diabetes mellitus
Ischaemic heart disease
Hypertension
Nephritisnephrosis
Stroke
ill-defined heart disease
Diabetes mellitus
Ischaemic heart disease
Hypertension
Nephritisnephrosis
Males
Female
UN - Male
SA 1997
SA 2004
UN - Female
SA 1997
SA 2004
0 pts
1 - 3 pts
4 - 9 pts
10+ pts
42
Source wwwclinicaltrialsgov 22-Oct-2010
Clinical trials registered across Africa
43
0
500
1000
1500
2000
2500
South Africa Kenya Malawi Tanzania Uganda Zambia
Selected African countries
2005
2010
2015
Source ClinTrialsgov
Trend 2005 - 2015
Source wwwclinicaltrialsgov 28-Aug-2015
44
AFRICA FOUND IN TRANSLATION
bull Vast treatment-naiumlve population bull Cost advantages (still) bull Diverse ethnicity amp morbidity bull Inverse seasonality bull Site capacity-building widely implemented bull Robust regulatory review bull Variable but generally good regulatory timelines bull Established GCP culture ndash sites and home-bred CROs
45
THANK YOU
Foliennummer 1
Triclinium A South African CRO
Collaboration with VPM SII
Vaccine Trials in SA 2015
Foliennummer 5
Foliennummer 6
Foliennummer 7
Foliennummer 8
Foliennummer 9
Foliennummer 10
Foliennummer 11
Foliennummer 12
Foliennummer 13
Foliennummer 14
Foliennummer 15
Foliennummer 16
Foliennummer 17
Distribution of clinical trial sites
Foliennummer 19
South Africa Leading Causes of Death
Foliennummer 21
Foliennummer 22
South Africa TB deaths by age group
Foliennummer 24
Foliennummer 25
Foliennummer 26
Foliennummer 27
Foliennummer 28
Foliennummer 29
Foliennummer 30
Foliennummer 31
SA Clinical Trial Regulatory Processes
Clinical Trial Density Active sites million population
Foliennummer 34
Why Africa
Foliennummer 36
AFRICA hellip the true size
SSV to SIV
Foliennummer 39
Foliennummer 40
Foliennummer 41
Foliennummer 42
Foliennummer 43
AFRICA FOUND IN TRANSLATION
Foliennummer 45
Region
Median
of Sites
Patients Site
0 pts
1 - 3 pts
4 - 9 pts
10+ pts
Latin America
4
21
26
30
23
North America
3
29
29
24
18
Eastern Europe
6
15
31
26
27
Western Europe
4
15
22
29
34
Asia Pacific
4
19
30
34
18
Africa
10
4
17
28
51
0 pts
1 - 3 pts
4 - 9 pts
10+ pts
Latin America
21
26
30
23
North America
29
29
24
18
Eastern Europe
15
31
26
27
Western Europe
15
22
29
34
Asia Pacific
19
30
34
18
Africa
4
17
28
51
Males
Female
15-19
210
150
20-24
340
205
25-29
395
300
30-34
460
360
35-39
600
405
40-44
800
500
45-49
1100
700
50-54
1600
1050
55-54
2300
1580
60-64
3340
2250
UN - Male
SA 1997
SA 2004
UN - Female
SA 1997
SA 2004
15-19
210
235
216
150
165
187
20-24
340
381
555
205
331
1085
25-29
395
625
1081
300
452
1985
30-34
460
817
2118
360
489
2267
35-39
600
916
2498
405
526
1890
40-44
800
1136
2765
500
615
1548
45-49
1100
1486
2744
700
800
1400
50-54
1600
2016
2979
1050
1116
1506
55-54
2300
2838
3270
1580
1626
1717
60-64
3340
3614
4146
2250
2201
2360
Stroke
ill-defined heart disease
Diabetes mellitus
Ischaemic heart disease
Hypertension
Nephritisnephrosis
Stroke
ill-defined heart disease
Diabetes mellitus
Ischaemic heart disease
Hypertension
Nephritisnephrosis
1999
34
345
20
248
14
10
1999
295
246
23
10
145
68
2000
36
362
218
249
152
112
2000
318
268
241
108
16
8
2001
35
372
22
25
15
125
2001
322
28
252
102
162
95
2002
405
298
24
26
147
126
2002
352
295
27
115
16
10
2003
425
32
245
285
152
15
2003
382
299
285
122
17
12
2004
39
325
255
26
165
16
2004
35
30
295
121
19
119
2005
36
328
265
26
15
162
2005
325
30
32
12
18
12
2006
35
336
27
258
155
16
2006
33
32
32
11
18
125
COPD
Asthma
Tracheabronchial lung cancer
Oesophageal cancer
prostate cancer
Cervical cancer
Breast cancer
1999
2001
12
135
10
26
2000
204
116
13
92
28
2001
222
131
133
96
27
2002
23
144
128
95
285
2003
243
149
124
94
29
2004
229
154
1255
87
29
2005
224
152
122
82
295
2006
224
136
116
75
3
COPD
Asthma
Tracheabronchial lung cancer
Oesophageal cancer
Prostate cancer
Cervical cancer
Breast cancer
1999
88
92
43
41
106
82
2000
96
95
4
43
11
81
2001
10
109
4
4
111
89
2002
10
116
4
4
112
85
2003
11
124
4
395
116
85
2004
102
1295
44
39
115
101
2005
105
128
42
38
1185
10
2006
10
12
42
32
1205
10
Based on this survey the researchers estimate that 109 of all South Africans over 2 years old were living with HIV in 2008 In 2002 and 2005 this figure was 114 and 108 respectively showing a degree of stabilisation Among those between 15 and 49 years old the estimated HIV prevalence was 169 in 2008 The survey found the prevalence among children aged 2-14 to be 25 down significantly since 2002 when prevalence was 56
Estimated HIV prevalence () among South Africans aged 2 years and older by age 2002-2008
Age
HIV +
HIV -
Children (2-14 years)
25
975
Youth (15-24 years)
87
913
Adults (25 and older)
168
832
(15-49 years)
169
831
Total (2 and older)
109
891
Estimated HIV prevalence among South Africans by age and sex 2008
Age
Male prevalence
Female prevalence
2-14
3
2
15-19
25
67
20-24
51
211
25-29
157
327
30-34
258
291
35-39
185
248
40-44
192
163
45-49
64
141
50-54
104
102
55-59
62
77
60+
35
18
Total
79
136
Among females HIV prevalence is highest in those between 25 and 29 years old among males the peak is in the group aged 30-34 years
HIV prevalence () by province 2002-2008
Province
2002
2005
2008
KwaZulu-Natal
117
165
158
Mpumalanga
141
152
154
Free State
149
126
126
North West
103
109
113
Gauteng
147
108
103
Eastern Cape
66
89
9
Limpopo
98
8
88
Northern Cape
84
54
59
Western Cape
107
19
38
National
114
108
109
The results of this study suggest that KwaZulu-Natal Mpumulanga and Free State have the highest HIV prevalence However the relatively small sample sizes may limit precision and in several cases the ranges of uncertainty overlap
HIV prevalence by population group 2008
Population group
Prevalence ()
African
136
864
White
03
997
Coloured
17
983
Indian
03
997
Studies of AIDS deaths
Latin America
Latin America
Latin America
Latin America
North America
North America
North America
North America
Eastern Europe
Eastern Europe
Eastern Europe
Eastern Europe
Western Europe
Western Europe
Western Europe
Western Europe
Asia Pacific
Asia Pacific
Asia Pacific
Asia Pacific
Africa
Africa
Africa
Africa
Country
Study starts
Subjects randomised
SubjectsStudy
USA
32
4385
13703125
Russia
20
788
394
Germany
19
1883
991052631579
UK
13
265
203846153846
South Africa
12
347
289166666667
Argentina
12
329
274166666667
Australia
11
195
177272727273
India
7
275
392857142857
Brazil
3
115
383333333333
Country
Initiation
Site activation
Recruitment
LOC setup
Unproductive sites
(Approval ndash FCI)
(FCI ndash FSFV)
(FSFV ndash LSFV)
(CPC ndash FSFV)
South Africa
19
38
153
357
21
Australia
117
63
401
239
11
Germany
16
37
401
224
21
UK
9
101
301
346
20
Russia
11
52
174
334
9
India
31
28
389
431
3
Argentina
94
67
288
32
13
Brazil
79
59
94
656
20
USA
44
31
149
26
Country
Pts Rand
Sites
Av CPP
Cost Per Country
Ethics Subm
Regulatory Fees
Add Inv Fees
CT Scan Total
Ethics + Regulatory
Total Regulatory Fees
South Africa
25
5
7250
181250
290
460
363
0
750
1113
Canada
18
4
832545
14985818
181818
0
0
1557576
181818
1818
Italy
7
2
10000
70000
2200
0
0
0
2200
2200
Germany
55
10
7000
385000
3000
0
0
12000
3000
3000
Peru
40
5
7000
280000
1500
1000
2000
60000
2500
4500
Poland
15
4
10000
150000
0
2500
2400
0
2500
4900
Spain
40
7
10500
420000
0
0
5450
0
0
5450
UK
12
4
13000
156000
0
0
5556
0
0
5556
Bulgaria
18
4
10000
180000
0
5000
1000
0
5000
6000
Taiwan
20
4
1179649
2359298
104167
313
5208
0
135467
6563
Czech Rep
10
2
10000
100000
1500
3000
3000
0
4500
7500
Greece
40
7
9000
360000
0
7500
0
0
7500
7500
Chile
15
4
10840
162600
1700
3600
3000
0
5300
8300
Belgium
25
6
12200
305000
3992
4332
0
0
8324
8324
Korea
30
3
10827
324802
1114
0
14324
0
1114
15438
Singapore
10
2
11565
115650
1750
0
17975
0
1750
19725
France
50
10
9000
450000
0
0
20000
0
0
20000
China
39
5
4978
194142
5224
0
39814
0
5224
40336
New Zealand
10
3
145244
145244
1973
0
43123
0
1973
45096
Israel
10
6
11140
111400
2060
3000
48400
16500
5060
53460
Brazil
30
6
10000
300000
2000
287356
5649202
0
487356
61366
Australia
24
6
40200
964800
0
500
82500
0
500
83000
23
543
109
532856799
3304716
26939
27700043
73748966
[1753EURO x 14 (ex rate) = $2454] [ $245416 hours=$153hour]
1095625
1095625
12271
1753
198089
198089
208514736842
South Africa
Canada
Italy
Germany
Peru
Poland
Spain
UK
Bulgaria
Taiwan
Czech Rep
Greece
Chile
Belgium
Korea
Singapore
France
China
New Zealand
Israel
Brazil
Australia
Country
Study starts
Subjects randomised
SubjectsStudy
USA
32
4385
13703125
Russia
20
788
394
Germany
19
1883
991052631579
UK
13
265
203846153846
South Africa
12
347
289166666667
Argentina
12
329
274166666667
Australia
11
195
177272727273
India
7
275
392857142857
Brazil
3
115
383333333333
Country
Initiation
Site activation
Recruitment
LOC setup
Unproductive sites
(Approval ndash FCI)
(FCI ndash FSFV)
(FSFV ndash LSFV)
(CPC ndash FSFV)
South Africa
19
38
153
357
21
Australia
117
63
401
239
11
Germany
16
37
401
224
21
UK
9
101
301
346
20
Russia
11
52
174
334
9
India
31
28
389
431
3
Argentina
94
67
288
32
13
Brazil
79
59
94
656
20
USA
44
31
149
26
Country
Pts Rand
Sites
Av CPP
Cost Per Country
Ethics Subm
Regulatory Fees
Add Inv Fees
CT Scan Total
Ethics + Regulatory
Total Regulatory Fees
China
39
5
4978
194142
522
0
39814
0
522
40336
Germany
55
10
7000
385000
3000
0
0
12000
3000
3000
Peru
40
5
7000
280000
1500
1000
2000
60000
2500
4500
South Africa
25
5
7250
181250
290
460
363
0
750
1113
Canada
18
4
8325
149858
1818
0
0
1557576
1818
1818
Greece
40
7
9000
360000
0
7500
0
0
7500
7500
France
50
10
9000
450000
0
0
20000
0
0
20000
Italy
7
2
10000
70000
2200
0
0
0
2200
2200
Poland
15
4
10000
150000
0
2500
2400
0
2500
4900
Bulgaria
18
4
10000
180000
0
5000
1000
0
5000
6000
Czech Rep
10
2
10000
100000
1500
3000
3000
0
4500
7500
Brazil
30
6
10000
300000
2000
2874
56492
0
4874
61366
Spain
40
7
10500
420000
0
0
5450
0
0
5450
Korea
30
3
10827
324802
1114
0
14324
0
1114
15438
Chile
15
4
10840
162600
1700
3600
3000
0
5300
8300
Israel
10
6
11140
111400
2060
3000
48400
16500
5060
53460
Singapore
10
2
11565
115650
1750
0
17975
0
1750
19725
Taiwan
20
4
11796
235930
1042
313
5208
0
1355
6563
Belgium
25
6
12200
305000
3992
4332
0
0
8324
8324
UK
12
4
13000
156000
0
0
5556
0
0
5556
New Zealand
10
3
14524
145244
1973
0
43123
0
1973
45096
Australia
24
6
40200
964800
0
500
82500
0
500
83000
23
543
109
5328568
33047
26939
277000
73748966
[1753EURO x 14 (ex rate) = $2454] [ $245416 hours=$153hour]
110
1095625
1227
1753
19809
20
21
China
Germany
Peru
South Africa
Canada
Greece
France
Italy
Poland
Bulgaria
Czech Rep
Brazil
Spain
Korea
Chile
Israel
Singapore
Taiwan
Belgium
UK
New Zealand
Australia
Population Group
IndianAsianOther
26
Mixed ethnicity
90
Caucasian
91
African
793
10000
IndianAsianOther
Mixed ethnicity
Caucasian
African
Sheet1
Sheet1
Sheet2
Sheet3
20
South Africa Leading Causes of Death
00
20
40
60
80
100
120
140 The ten leading underlying natural causes of death in South Africa (2009)
percentage
TB Flu amp Intest Heart Cereb Diab HIV HT Chron Immun Pneum Infect Other Vasc Mell Dis LRT Dis
Stats SA Rel P03093 Mortality and causes of death in South Africa 2009 Findings from death notification Nov-2011
Age group
TB 0-14 15-49 50-64 65+
Rank Rank Rank Rank
5 34 1 196 1 114 8 33
24
bull Well established research infrastructure bull Public and private sectors
28 teaching hospitals gt40000 tertiary care beds 140 private hospitals gt30000 beds 15 - 18 medical insurance
bull Large broad-based investigator database amp site networks bull Specialised Early Phase presence since 1970s bull GCPGLP and CLIA 88 compliant labs bull Specialist labs (biomarkers TB immunology
PKbioassay) bull Full support services (GMP-depots translations etc) bull Stringent ICH-compliant RAEC review policies
GCP is a legal requirement Informed Consent entrenched in Constitution
South Africa Advantages
25
bull Reliable (+) roads air links energy connectivity bull European Time bull Research language is English bull Inverse seasons bull Cost Currency bull Mobile-phone enabled obsessed population
South Africa Advantages
26
South Africa Track Record
bull Phase I-III data from SA included in hundreds of US amp European registration dossiers
bull Two entire NDA dossiers ndash rifapentine 1998 ndash tryptorelin (GnRH agonist) 2001) comprised SA data
bull 37 FDA inspections 1994-2009 1 OAI (27)
27
Therapeutic Indications
28
0
1
2
3
4
5
6
7
8
9
10
Belg
ium
Au
stria
Li
thua
nia
Can
ada
Luxe
mbo
urg
Mal
ta
Nor
way
Po
rtuga
l R
oman
ia
Rus
sia
Serb
ia
Swed
en
The
Net
herla
nds
USA
loca
l site
s U
SA c
entra
l site
C
zech
Rep
ublic
D
enm
ark
Esto
nia
Finl
and
Hun
gary
Ic
elan
d Ire
land
La
tvia
G
erm
any
Switz
erla
nd
Liec
hten
stei
n U
nite
d Ki
ngdo
m
Fran
ce
Italy
Au
stra
lia
Hon
g-Ko
ng
New
Zea
land
Si
ngap
ore
Taiw
an
Uga
nda
Pola
nd
Ukr
aine
C
hile
G
uate
mal
a Ja
pan
Isra
el
Slov
akia
Bu
lgar
ia
Gre
ece
Mal
aysi
a Ph
ilipp
ines
Pe
ru
Thai
land
Tu
rkey
Sl
oven
ia
Cos
ta R
ica
Mex
ico
Spai
n So
uth
Afric
a Ar
gent
ina
Sout
h Ko
rea
Col
ombi
a Pa
nam
a C
roat
ia
Indi
a Ve
nezu
ela
Braz
il C
hina
Mon
ths
Sout
h Afri
ca
Global Regulatory Review Timelines
Triclinium experience 2009-2015
Triclinium experience 2009 - 2015
29
Protocol release Country selection
Site Selection Collection of reg docs
Submission of RA application
EC application
Negotiate Site Contracts
EC Approvals
RA Approval amp Import permit
Site Initiation Import amp distribute drug
Import ancillary supplies Set up local labs
Set up EDC
Months
0
1
2
3
All EC approvals typically within 6
weeks
Site contracts signed within days
As soon as MCC approval obtained ALL sites can be initiated
Start-Up Activities in PARALLEL
GMO application (biologics)
30
0
2000
4000
6000
8000
10000
12000
14000C
hina
Ger
man
y
Per
u
Sou
th A
frica
Can
ada
Gre
ece
Fran
ce
Italy
Pol
and
Bul
garia
Cze
ch R
ep
Bra
zil
Spa
in
Kor
ea
Chi
le
Isra
el
Sin
gapo
re
Taiw
an
Bel
gium U
K
New
hellip
Aus
tralia
Source Bayer Presented SACRA Conference 2009
Aver
age
cost
per
pat
ient
(Eur
o)
Average Cost per Enrolled Participant
gt40000
Chart1
Average Cost Per Patient (Euro)
4978
7000
7000
7250
832545
9000
9000
10000
10000
10000
10000
10000
10500
10827
10840
11140
11565
1179649
12200
13000
145244
40200
Sheet1
Sheet2
Sheet2
Average Cost Per Patient (Euro)
Average Cost Per Patient
Sheet4
Ethics Subm
Regulatory Fees
Sheet3
Ethics + Regulatory
Total Ethics and Regulatory Fees
Add Inv Fees
Additional Investigator Application Fees
Total Regulatory Fees
Study starts
SubjectsStudy
31
Euro
0
10000
20000
30000
40000
50000
60000
70000
80000
90000S
outh
Afri
caC
anad
a
Italy
Ger
man
yP
eru
Pol
and
Spa
in UK
Bul
garia
Taiw
anC
zech
Rep
Gre
ece
Chi
leB
elgi
umK
orea
Sin
gapo
reFr
ance
Chi
naN
ew Z
eala
ndIs
rael
Bra
zil
Aus
tralia
Source Bayer Presented SACRA Conference 2009
Eur
os
Regulatory Application Fees
Chart1
Total Regulatory Fees
1113
181818
2200
3000
4500
4900
5450
5556
6000
656267
7500
7500
8300
8324
15438
19725
20000
403364
45096
53460
6136558
83000
Sheet1
Sheet2
Sheet2
Average Cost Per Patient (Euro)
Average Cost Per Patient
Sheet4
Ethics Subm
Regulatory Fees
Sheet3
Ethics + Regulatory
Total Ethics and Regulatory Fees
Add Inv Fees
Additional Investigator Application Fees
Total Regulatory Fees
Study starts
SubjectsStudy
32
SA Clinical Trial Regulatory Processes
Governed by SA-GCP and Declaration of Helsinki SA National Clinical Trials Register (SANCTR) Medicines Control Council (National Regulatory Authority)
o New protocols o Amendments o Additional sitesinvestigators
Ethics Committees (33 NHREC-registered) RegionalMunicipal DoH Export permits for bio samples (Nat Health Act 2003)
Clinical Trial Density Active sites million population
Nature Reviews Drug Discovery 7 13-14 (January 2008)
France 503
Germany 512 Canada
922
USA 1203
Czech Republic 776
553 sites
South Africa 119
757 sites
757 sites
533 sites
1084 sites
Argentina 269
Russia 77
China 04
India 07
34
Gateway to Africa
35
Why Africa bull Large accessible population relatively new to clinical trials
bull Experienced and willing investigators
bull Many clinical trial sites established by PDPs NGOs etc
bull Expanding therapeutic areas shifting burden of disease from
infectious to non-communicable diseases
bull Significantly improved infrastructure and accessibility
bull Rapidly evolving regulatory and ethics procedures
bull Potential for capacity building and sustainable clinical trial potential
36
Relatively young GCP culture Resident mentorships to build capacity Locations ndash accessibility for site monitoring Variable infrastructure esp electricity connectivity and
transportation Resourcing of public healthcare systems
Sub-Saharan Africa challenges
37
bull Second-largest continent
bull Spans NS and EW hemispheres
bull Second most populous continent 2014 estimate 1069 billion
bull Home to more than a quarter of the 196 independent countries
bull All 54 African countries are UN members
bull 39 urban population
bull 12 metropolitan areas gt 4m
bull gt 3000 distinct ethnicities
bull gt 2000 languages spoken
AFRICA hellip the true size
wwwcitypopulationdeworldAgglomerations 2015
38
SSV to SIV
0
5
10
15
20
25
30
35
40
45
Africa North America
Asia Pacific
Western Europe
Eastern Europe
Latin America
Source Quintiles South Africa SACRA Conference 2008
Wee
ks (A
vera
ge)
Start-Up Timelines
39
Region Median
Patients Site
of Sites
0 pts 1 - 3 pts 4 - 9 pts 10+ pts
Latin America 40 21 26 30 23
North America 30 29 29 24 18
Eastern Europe 60 15 31 26 27
Western Europe 40 15 22 29 34
Asia Pacific 40 19 30 34 18
Africa 100 4 17 28 51
Enrollment performance by region for 2008
Site Performance
Source Quintiles South Africa Presented SACRA Conference 2009
40
0 1 2 3 4 5 6 7 8 9
10
Latin America
North America
Eastern Europe
Western Europe
Asia Pacific
Africa
Num
ber o
f par
ticip
ants
MEDIAN site enrollment by region for 2008
Source Quintiles South Africa Presented SACRA Conference 2009
Site Performance
41
Source Quintiles South Africa Presented SACRA Conference 2009
s
ites
0
5
10
15
20
25
30
35
40
45
50
LatinAmerica
NorthAmerica
EasternEurope
WesternEurope
Asia Pacific Africa
0 pts
1 - 3 pts
4 - 9 pts
10+ pts
Enrollment performance by region for 2008
Site Performance
Chart1
0 pts
1 - 3 pts
4 - 9 pts
10+ pts
021
026
03
023
029
029
024
018
015
031
026
027
015
022
029
034
019
03
034
018
004
017
028
051
HIV
HIV
Resiratory amp Cancer
Male prevalence
Female prevalence
CVS
Overall death rates
Overall death rates
COPD
Asthma
Tracheabronchial lung cancer
Oesophageal cancer
prostate cancer
Trial metrics
COPD
Asthma
Tracheabronchial lung cancer
Oesophageal cancer
Prostate cancer
Cervical cancer
Breast cancer
Stroke
ill-defined heart disease
Diabetes mellitus
Ischaemic heart disease
Hypertension
Nephritisnephrosis
Stroke
ill-defined heart disease
Diabetes mellitus
Ischaemic heart disease
Hypertension
Nephritisnephrosis
Males
Female
UN - Male
SA 1997
SA 2004
UN - Female
SA 1997
SA 2004
0 pts
1 - 3 pts
4 - 9 pts
10+ pts
42
Source wwwclinicaltrialsgov 22-Oct-2010
Clinical trials registered across Africa
43
0
500
1000
1500
2000
2500
South Africa Kenya Malawi Tanzania Uganda Zambia
Selected African countries
2005
2010
2015
Source ClinTrialsgov
Trend 2005 - 2015
Source wwwclinicaltrialsgov 28-Aug-2015
44
AFRICA FOUND IN TRANSLATION
bull Vast treatment-naiumlve population bull Cost advantages (still) bull Diverse ethnicity amp morbidity bull Inverse seasonality bull Site capacity-building widely implemented bull Robust regulatory review bull Variable but generally good regulatory timelines bull Established GCP culture ndash sites and home-bred CROs
45
THANK YOU
Foliennummer 1
Triclinium A South African CRO
Collaboration with VPM SII
Vaccine Trials in SA 2015
Foliennummer 5
Foliennummer 6
Foliennummer 7
Foliennummer 8
Foliennummer 9
Foliennummer 10
Foliennummer 11
Foliennummer 12
Foliennummer 13
Foliennummer 14
Foliennummer 15
Foliennummer 16
Foliennummer 17
Distribution of clinical trial sites
Foliennummer 19
South Africa Leading Causes of Death
Foliennummer 21
Foliennummer 22
South Africa TB deaths by age group
Foliennummer 24
Foliennummer 25
Foliennummer 26
Foliennummer 27
Foliennummer 28
Foliennummer 29
Foliennummer 30
Foliennummer 31
SA Clinical Trial Regulatory Processes
Clinical Trial Density Active sites million population
Foliennummer 34
Why Africa
Foliennummer 36
AFRICA hellip the true size
SSV to SIV
Foliennummer 39
Foliennummer 40
Foliennummer 41
Foliennummer 42
Foliennummer 43
AFRICA FOUND IN TRANSLATION
Foliennummer 45
Region
Median
of Sites
Patients Site
0 pts
1 - 3 pts
4 - 9 pts
10+ pts
Latin America
4
21
26
30
23
North America
3
29
29
24
18
Eastern Europe
6
15
31
26
27
Western Europe
4
15
22
29
34
Asia Pacific
4
19
30
34
18
Africa
10
4
17
28
51
0 pts
1 - 3 pts
4 - 9 pts
10+ pts
Latin America
21
26
30
23
North America
29
29
24
18
Eastern Europe
15
31
26
27
Western Europe
15
22
29
34
Asia Pacific
19
30
34
18
Africa
4
17
28
51
Males
Female
15-19
210
150
20-24
340
205
25-29
395
300
30-34
460
360
35-39
600
405
40-44
800
500
45-49
1100
700
50-54
1600
1050
55-54
2300
1580
60-64
3340
2250
UN - Male
SA 1997
SA 2004
UN - Female
SA 1997
SA 2004
15-19
210
235
216
150
165
187
20-24
340
381
555
205
331
1085
25-29
395
625
1081
300
452
1985
30-34
460
817
2118
360
489
2267
35-39
600
916
2498
405
526
1890
40-44
800
1136
2765
500
615
1548
45-49
1100
1486
2744
700
800
1400
50-54
1600
2016
2979
1050
1116
1506
55-54
2300
2838
3270
1580
1626
1717
60-64
3340
3614
4146
2250
2201
2360
Stroke
ill-defined heart disease
Diabetes mellitus
Ischaemic heart disease
Hypertension
Nephritisnephrosis
Stroke
ill-defined heart disease
Diabetes mellitus
Ischaemic heart disease
Hypertension
Nephritisnephrosis
1999
34
345
20
248
14
10
1999
295
246
23
10
145
68
2000
36
362
218
249
152
112
2000
318
268
241
108
16
8
2001
35
372
22
25
15
125
2001
322
28
252
102
162
95
2002
405
298
24
26
147
126
2002
352
295
27
115
16
10
2003
425
32
245
285
152
15
2003
382
299
285
122
17
12
2004
39
325
255
26
165
16
2004
35
30
295
121
19
119
2005
36
328
265
26
15
162
2005
325
30
32
12
18
12
2006
35
336
27
258
155
16
2006
33
32
32
11
18
125
COPD
Asthma
Tracheabronchial lung cancer
Oesophageal cancer
prostate cancer
Cervical cancer
Breast cancer
1999
2001
12
135
10
26
2000
204
116
13
92
28
2001
222
131
133
96
27
2002
23
144
128
95
285
2003
243
149
124
94
29
2004
229
154
1255
87
29
2005
224
152
122
82
295
2006
224
136
116
75
3
COPD
Asthma
Tracheabronchial lung cancer
Oesophageal cancer
Prostate cancer
Cervical cancer
Breast cancer
1999
88
92
43
41
106
82
2000
96
95
4
43
11
81
2001
10
109
4
4
111
89
2002
10
116
4
4
112
85
2003
11
124
4
395
116
85
2004
102
1295
44
39
115
101
2005
105
128
42
38
1185
10
2006
10
12
42
32
1205
10
Based on this survey the researchers estimate that 109 of all South Africans over 2 years old were living with HIV in 2008 In 2002 and 2005 this figure was 114 and 108 respectively showing a degree of stabilisation Among those between 15 and 49 years old the estimated HIV prevalence was 169 in 2008 The survey found the prevalence among children aged 2-14 to be 25 down significantly since 2002 when prevalence was 56
Estimated HIV prevalence () among South Africans aged 2 years and older by age 2002-2008
Age
HIV +
HIV -
Children (2-14 years)
25
975
Youth (15-24 years)
87
913
Adults (25 and older)
168
832
(15-49 years)
169
831
Total (2 and older)
109
891
Estimated HIV prevalence among South Africans by age and sex 2008
Age
Male prevalence
Female prevalence
2-14
3
2
15-19
25
67
20-24
51
211
25-29
157
327
30-34
258
291
35-39
185
248
40-44
192
163
45-49
64
141
50-54
104
102
55-59
62
77
60+
35
18
Total
79
136
Among females HIV prevalence is highest in those between 25 and 29 years old among males the peak is in the group aged 30-34 years
HIV prevalence () by province 2002-2008
Province
2002
2005
2008
KwaZulu-Natal
117
165
158
Mpumalanga
141
152
154
Free State
149
126
126
North West
103
109
113
Gauteng
147
108
103
Eastern Cape
66
89
9
Limpopo
98
8
88
Northern Cape
84
54
59
Western Cape
107
19
38
National
114
108
109
The results of this study suggest that KwaZulu-Natal Mpumulanga and Free State have the highest HIV prevalence However the relatively small sample sizes may limit precision and in several cases the ranges of uncertainty overlap
HIV prevalence by population group 2008
Population group
Prevalence ()
African
136
864
White
03
997
Coloured
17
983
Indian
03
997
Studies of AIDS deaths
Latin America
Latin America
Latin America
Latin America
North America
North America
North America
North America
Eastern Europe
Eastern Europe
Eastern Europe
Eastern Europe
Western Europe
Western Europe
Western Europe
Western Europe
Asia Pacific
Asia Pacific
Asia Pacific
Asia Pacific
Africa
Africa
Africa
Africa
Country
Study starts
Subjects randomised
SubjectsStudy
USA
32
4385
13703125
Russia
20
788
394
Germany
19
1883
991052631579
UK
13
265
203846153846
South Africa
12
347
289166666667
Argentina
12
329
274166666667
Australia
11
195
177272727273
India
7
275
392857142857
Brazil
3
115
383333333333
Country
Initiation
Site activation
Recruitment
LOC setup
Unproductive sites
(Approval ndash FCI)
(FCI ndash FSFV)
(FSFV ndash LSFV)
(CPC ndash FSFV)
South Africa
19
38
153
357
21
Australia
117
63
401
239
11
Germany
16
37
401
224
21
UK
9
101
301
346
20
Russia
11
52
174
334
9
India
31
28
389
431
3
Argentina
94
67
288
32
13
Brazil
79
59
94
656
20
USA
44
31
149
26
Country
Pts Rand
Sites
Av CPP
Cost Per Country
Ethics Subm
Regulatory Fees
Add Inv Fees
CT Scan Total
Ethics + Regulatory
Total Regulatory Fees
South Africa
25
5
7250
181250
290
460
363
0
750
1113
Canada
18
4
832545
14985818
181818
0
0
1557576
181818
1818
Italy
7
2
10000
70000
2200
0
0
0
2200
2200
Germany
55
10
7000
385000
3000
0
0
12000
3000
3000
Peru
40
5
7000
280000
1500
1000
2000
60000
2500
4500
Poland
15
4
10000
150000
0
2500
2400
0
2500
4900
Spain
40
7
10500
420000
0
0
5450
0
0
5450
UK
12
4
13000
156000
0
0
5556
0
0
5556
Bulgaria
18
4
10000
180000
0
5000
1000
0
5000
6000
Taiwan
20
4
1179649
2359298
104167
313
5208
0
135467
6563
Czech Rep
10
2
10000
100000
1500
3000
3000
0
4500
7500
Greece
40
7
9000
360000
0
7500
0
0
7500
7500
Chile
15
4
10840
162600
1700
3600
3000
0
5300
8300
Belgium
25
6
12200
305000
3992
4332
0
0
8324
8324
Korea
30
3
10827
324802
1114
0
14324
0
1114
15438
Singapore
10
2
11565
115650
1750
0
17975
0
1750
19725
France
50
10
9000
450000
0
0
20000
0
0
20000
China
39
5
4978
194142
5224
0
39814
0
5224
40336
New Zealand
10
3
145244
145244
1973
0
43123
0
1973
45096
Israel
10
6
11140
111400
2060
3000
48400
16500
5060
53460
Brazil
30
6
10000
300000
2000
287356
5649202
0
487356
61366
Australia
24
6
40200
964800
0
500
82500
0
500
83000
23
543
109
532856799
3304716
26939
27700043
73748966
[1753EURO x 14 (ex rate) = $2454] [ $245416 hours=$153hour]
1095625
1095625
12271
1753
198089
198089
208514736842
South Africa
Canada
Italy
Germany
Peru
Poland
Spain
UK
Bulgaria
Taiwan
Czech Rep
Greece
Chile
Belgium
Korea
Singapore
France
China
New Zealand
Israel
Brazil
Australia
Country
Study starts
Subjects randomised
SubjectsStudy
USA
32
4385
13703125
Russia
20
788
394
Germany
19
1883
991052631579
UK
13
265
203846153846
South Africa
12
347
289166666667
Argentina
12
329
274166666667
Australia
11
195
177272727273
India
7
275
392857142857
Brazil
3
115
383333333333
Country
Initiation
Site activation
Recruitment
LOC setup
Unproductive sites
(Approval ndash FCI)
(FCI ndash FSFV)
(FSFV ndash LSFV)
(CPC ndash FSFV)
South Africa
19
38
153
357
21
Australia
117
63
401
239
11
Germany
16
37
401
224
21
UK
9
101
301
346
20
Russia
11
52
174
334
9
India
31
28
389
431
3
Argentina
94
67
288
32
13
Brazil
79
59
94
656
20
USA
44
31
149
26
Country
Pts Rand
Sites
Av CPP
Cost Per Country
Ethics Subm
Regulatory Fees
Add Inv Fees
CT Scan Total
Ethics + Regulatory
Total Regulatory Fees
China
39
5
4978
194142
522
0
39814
0
522
40336
Germany
55
10
7000
385000
3000
0
0
12000
3000
3000
Peru
40
5
7000
280000
1500
1000
2000
60000
2500
4500
South Africa
25
5
7250
181250
290
460
363
0
750
1113
Canada
18
4
8325
149858
1818
0
0
1557576
1818
1818
Greece
40
7
9000
360000
0
7500
0
0
7500
7500
France
50
10
9000
450000
0
0
20000
0
0
20000
Italy
7
2
10000
70000
2200
0
0
0
2200
2200
Poland
15
4
10000
150000
0
2500
2400
0
2500
4900
Bulgaria
18
4
10000
180000
0
5000
1000
0
5000
6000
Czech Rep
10
2
10000
100000
1500
3000
3000
0
4500
7500
Brazil
30
6
10000
300000
2000
2874
56492
0
4874
61366
Spain
40
7
10500
420000
0
0
5450
0
0
5450
Korea
30
3
10827
324802
1114
0
14324
0
1114
15438
Chile
15
4
10840
162600
1700
3600
3000
0
5300
8300
Israel
10
6
11140
111400
2060
3000
48400
16500
5060
53460
Singapore
10
2
11565
115650
1750
0
17975
0
1750
19725
Taiwan
20
4
11796
235930
1042
313
5208
0
1355
6563
Belgium
25
6
12200
305000
3992
4332
0
0
8324
8324
UK
12
4
13000
156000
0
0
5556
0
0
5556
New Zealand
10
3
14524
145244
1973
0
43123
0
1973
45096
Australia
24
6
40200
964800
0
500
82500
0
500
83000
23
543
109
5328568
33047
26939
277000
73748966
[1753EURO x 14 (ex rate) = $2454] [ $245416 hours=$153hour]
110
1095625
1227
1753
19809
20
21
China
Germany
Peru
South Africa
Canada
Greece
France
Italy
Poland
Bulgaria
Czech Rep
Brazil
Spain
Korea
Chile
Israel
Singapore
Taiwan
Belgium
UK
New Zealand
Australia
Population Group
IndianAsianOther
26
Mixed ethnicity
90
Caucasian
91
African
793
10000
Sheet1
Sheet2
Sheet3
20
South Africa Leading Causes of Death
00
20
40
60
80
100
120
140 The ten leading underlying natural causes of death in South Africa (2009)
percentage
TB Flu amp Intest Heart Cereb Diab HIV HT Chron Immun Pneum Infect Other Vasc Mell Dis LRT Dis
Stats SA Rel P03093 Mortality and causes of death in South Africa 2009 Findings from death notification Nov-2011
Age group
TB 0-14 15-49 50-64 65+
Rank Rank Rank Rank
5 34 1 196 1 114 8 33
24
bull Well established research infrastructure bull Public and private sectors
28 teaching hospitals gt40000 tertiary care beds 140 private hospitals gt30000 beds 15 - 18 medical insurance
bull Large broad-based investigator database amp site networks bull Specialised Early Phase presence since 1970s bull GCPGLP and CLIA 88 compliant labs bull Specialist labs (biomarkers TB immunology
PKbioassay) bull Full support services (GMP-depots translations etc) bull Stringent ICH-compliant RAEC review policies
GCP is a legal requirement Informed Consent entrenched in Constitution
South Africa Advantages
25
bull Reliable (+) roads air links energy connectivity bull European Time bull Research language is English bull Inverse seasons bull Cost Currency bull Mobile-phone enabled obsessed population
South Africa Advantages
26
South Africa Track Record
bull Phase I-III data from SA included in hundreds of US amp European registration dossiers
bull Two entire NDA dossiers ndash rifapentine 1998 ndash tryptorelin (GnRH agonist) 2001) comprised SA data
bull 37 FDA inspections 1994-2009 1 OAI (27)
27
Therapeutic Indications
28
0
1
2
3
4
5
6
7
8
9
10
Belg
ium
Au
stria
Li
thua
nia
Can
ada
Luxe
mbo
urg
Mal
ta
Nor
way
Po
rtuga
l R
oman
ia
Rus
sia
Serb
ia
Swed
en
The
Net
herla
nds
USA
loca
l site
s U
SA c
entra
l site
C
zech
Rep
ublic
D
enm
ark
Esto
nia
Finl
and
Hun
gary
Ic
elan
d Ire
land
La
tvia
G
erm
any
Switz
erla
nd
Liec
hten
stei
n U
nite
d Ki
ngdo
m
Fran
ce
Italy
Au
stra
lia
Hon
g-Ko
ng
New
Zea
land
Si
ngap
ore
Taiw
an
Uga
nda
Pola
nd
Ukr
aine
C
hile
G
uate
mal
a Ja
pan
Isra
el
Slov
akia
Bu
lgar
ia
Gre
ece
Mal
aysi
a Ph
ilipp
ines
Pe
ru
Thai
land
Tu
rkey
Sl
oven
ia
Cos
ta R
ica
Mex
ico
Spai
n So
uth
Afric
a Ar
gent
ina
Sout
h Ko
rea
Col
ombi
a Pa
nam
a C
roat
ia
Indi
a Ve
nezu
ela
Braz
il C
hina
Mon
ths
Sout
h Afri
ca
Global Regulatory Review Timelines
Triclinium experience 2009-2015
Triclinium experience 2009 - 2015
29
Protocol release Country selection
Site Selection Collection of reg docs
Submission of RA application
EC application
Negotiate Site Contracts
EC Approvals
RA Approval amp Import permit
Site Initiation Import amp distribute drug
Import ancillary supplies Set up local labs
Set up EDC
Months
0
1
2
3
All EC approvals typically within 6
weeks
Site contracts signed within days
As soon as MCC approval obtained ALL sites can be initiated
Start-Up Activities in PARALLEL
GMO application (biologics)
30
0
2000
4000
6000
8000
10000
12000
14000C
hina
Ger
man
y
Per
u
Sou
th A
frica
Can
ada
Gre
ece
Fran
ce
Italy
Pol
and
Bul
garia
Cze
ch R
ep
Bra
zil
Spa
in
Kor
ea
Chi
le
Isra
el
Sin
gapo
re
Taiw
an
Bel
gium U
K
New
hellip
Aus
tralia
Source Bayer Presented SACRA Conference 2009
Aver
age
cost
per
pat
ient
(Eur
o)
Average Cost per Enrolled Participant
gt40000
Chart1
Average Cost Per Patient (Euro)
4978
7000
7000
7250
832545
9000
9000
10000
10000
10000
10000
10000
10500
10827
10840
11140
11565
1179649
12200
13000
145244
40200
Sheet1
Sheet2
Sheet2
Average Cost Per Patient (Euro)
Average Cost Per Patient
Sheet4
Ethics Subm
Regulatory Fees
Sheet3
Ethics + Regulatory
Total Ethics and Regulatory Fees
Add Inv Fees
Additional Investigator Application Fees
Total Regulatory Fees
Study starts
SubjectsStudy
31
Euro
0
10000
20000
30000
40000
50000
60000
70000
80000
90000S
outh
Afri
caC
anad
a
Italy
Ger
man
yP
eru
Pol
and
Spa
in UK
Bul
garia
Taiw
anC
zech
Rep
Gre
ece
Chi
leB
elgi
umK
orea
Sin
gapo
reFr
ance
Chi
naN
ew Z
eala
ndIs
rael
Bra
zil
Aus
tralia
Source Bayer Presented SACRA Conference 2009
Eur
os
Regulatory Application Fees
Chart1
Total Regulatory Fees
1113
181818
2200
3000
4500
4900
5450
5556
6000
656267
7500
7500
8300
8324
15438
19725
20000
403364
45096
53460
6136558
83000
Sheet1
Sheet2
Sheet2
Average Cost Per Patient (Euro)
Average Cost Per Patient
Sheet4
Ethics Subm
Regulatory Fees
Sheet3
Ethics + Regulatory
Total Ethics and Regulatory Fees
Add Inv Fees
Additional Investigator Application Fees
Total Regulatory Fees
Study starts
SubjectsStudy
32
SA Clinical Trial Regulatory Processes
Governed by SA-GCP and Declaration of Helsinki SA National Clinical Trials Register (SANCTR) Medicines Control Council (National Regulatory Authority)
o New protocols o Amendments o Additional sitesinvestigators
Ethics Committees (33 NHREC-registered) RegionalMunicipal DoH Export permits for bio samples (Nat Health Act 2003)
Clinical Trial Density Active sites million population
Nature Reviews Drug Discovery 7 13-14 (January 2008)
France 503
Germany 512 Canada
922
USA 1203
Czech Republic 776
553 sites
South Africa 119
757 sites
757 sites
533 sites
1084 sites
Argentina 269
Russia 77
China 04
India 07
34
Gateway to Africa
35
Why Africa bull Large accessible population relatively new to clinical trials
bull Experienced and willing investigators
bull Many clinical trial sites established by PDPs NGOs etc
bull Expanding therapeutic areas shifting burden of disease from
infectious to non-communicable diseases
bull Significantly improved infrastructure and accessibility
bull Rapidly evolving regulatory and ethics procedures
bull Potential for capacity building and sustainable clinical trial potential
36
Relatively young GCP culture Resident mentorships to build capacity Locations ndash accessibility for site monitoring Variable infrastructure esp electricity connectivity and
transportation Resourcing of public healthcare systems
Sub-Saharan Africa challenges
37
bull Second-largest continent
bull Spans NS and EW hemispheres
bull Second most populous continent 2014 estimate 1069 billion
bull Home to more than a quarter of the 196 independent countries
bull All 54 African countries are UN members
bull 39 urban population
bull 12 metropolitan areas gt 4m
bull gt 3000 distinct ethnicities
bull gt 2000 languages spoken
AFRICA hellip the true size
wwwcitypopulationdeworldAgglomerations 2015
38
SSV to SIV
0
5
10
15
20
25
30
35
40
45
Africa North America
Asia Pacific
Western Europe
Eastern Europe
Latin America
Source Quintiles South Africa SACRA Conference 2008
Wee
ks (A
vera
ge)
Start-Up Timelines
39
Region Median
Patients Site
of Sites
0 pts 1 - 3 pts 4 - 9 pts 10+ pts
Latin America 40 21 26 30 23
North America 30 29 29 24 18
Eastern Europe 60 15 31 26 27
Western Europe 40 15 22 29 34
Asia Pacific 40 19 30 34 18
Africa 100 4 17 28 51
Enrollment performance by region for 2008
Site Performance
Source Quintiles South Africa Presented SACRA Conference 2009
40
0 1 2 3 4 5 6 7 8 9
10
Latin America
North America
Eastern Europe
Western Europe
Asia Pacific
Africa
Num
ber o
f par
ticip
ants
MEDIAN site enrollment by region for 2008
Source Quintiles South Africa Presented SACRA Conference 2009
Site Performance
41
Source Quintiles South Africa Presented SACRA Conference 2009
s
ites
0
5
10
15
20
25
30
35
40
45
50
LatinAmerica
NorthAmerica
EasternEurope
WesternEurope
Asia Pacific Africa
0 pts
1 - 3 pts
4 - 9 pts
10+ pts
Enrollment performance by region for 2008
Site Performance
Chart1
0 pts
1 - 3 pts
4 - 9 pts
10+ pts
021
026
03
023
029
029
024
018
015
031
026
027
015
022
029
034
019
03
034
018
004
017
028
051
HIV
HIV
Resiratory amp Cancer
Male prevalence
Female prevalence
CVS
Overall death rates
Overall death rates
COPD
Asthma
Tracheabronchial lung cancer
Oesophageal cancer
prostate cancer
Trial metrics
COPD
Asthma
Tracheabronchial lung cancer
Oesophageal cancer
Prostate cancer
Cervical cancer
Breast cancer
Stroke
ill-defined heart disease
Diabetes mellitus
Ischaemic heart disease
Hypertension
Nephritisnephrosis
Stroke
ill-defined heart disease
Diabetes mellitus
Ischaemic heart disease
Hypertension
Nephritisnephrosis
Males
Female
UN - Male
SA 1997
SA 2004
UN - Female
SA 1997
SA 2004
0 pts
1 - 3 pts
4 - 9 pts
10+ pts
42
Source wwwclinicaltrialsgov 22-Oct-2010
Clinical trials registered across Africa
43
0
500
1000
1500
2000
2500
South Africa Kenya Malawi Tanzania Uganda Zambia
Selected African countries
2005
2010
2015
Source ClinTrialsgov
Trend 2005 - 2015
Source wwwclinicaltrialsgov 28-Aug-2015
44
AFRICA FOUND IN TRANSLATION
bull Vast treatment-naiumlve population bull Cost advantages (still) bull Diverse ethnicity amp morbidity bull Inverse seasonality bull Site capacity-building widely implemented bull Robust regulatory review bull Variable but generally good regulatory timelines bull Established GCP culture ndash sites and home-bred CROs
45
THANK YOU
Foliennummer 1
Triclinium A South African CRO
Collaboration with VPM SII
Vaccine Trials in SA 2015
Foliennummer 5
Foliennummer 6
Foliennummer 7
Foliennummer 8
Foliennummer 9
Foliennummer 10
Foliennummer 11
Foliennummer 12
Foliennummer 13
Foliennummer 14
Foliennummer 15
Foliennummer 16
Foliennummer 17
Distribution of clinical trial sites
Foliennummer 19
South Africa Leading Causes of Death
Foliennummer 21
Foliennummer 22
South Africa TB deaths by age group
Foliennummer 24
Foliennummer 25
Foliennummer 26
Foliennummer 27
Foliennummer 28
Foliennummer 29
Foliennummer 30
Foliennummer 31
SA Clinical Trial Regulatory Processes
Clinical Trial Density Active sites million population
Foliennummer 34
Why Africa
Foliennummer 36
AFRICA hellip the true size
SSV to SIV
Foliennummer 39
Foliennummer 40
Foliennummer 41
Foliennummer 42
Foliennummer 43
AFRICA FOUND IN TRANSLATION
Foliennummer 45
Region
Median
of Sites
Patients Site
0 pts
1 - 3 pts
4 - 9 pts
10+ pts
Latin America
4
21
26
30
23
North America
3
29
29
24
18
Eastern Europe
6
15
31
26
27
Western Europe
4
15
22
29
34
Asia Pacific
4
19
30
34
18
Africa
10
4
17
28
51
0 pts
1 - 3 pts
4 - 9 pts
10+ pts
Latin America
21
26
30
23
North America
29
29
24
18
Eastern Europe
15
31
26
27
Western Europe
15
22
29
34
Asia Pacific
19
30
34
18
Africa
4
17
28
51
Males
Female
15-19
210
150
20-24
340
205
25-29
395
300
30-34
460
360
35-39
600
405
40-44
800
500
45-49
1100
700
50-54
1600
1050
55-54
2300
1580
60-64
3340
2250
UN - Male
SA 1997
SA 2004
UN - Female
SA 1997
SA 2004
15-19
210
235
216
150
165
187
20-24
340
381
555
205
331
1085
25-29
395
625
1081
300
452
1985
30-34
460
817
2118
360
489
2267
35-39
600
916
2498
405
526
1890
40-44
800
1136
2765
500
615
1548
45-49
1100
1486
2744
700
800
1400
50-54
1600
2016
2979
1050
1116
1506
55-54
2300
2838
3270
1580
1626
1717
60-64
3340
3614
4146
2250
2201
2360
Stroke
ill-defined heart disease
Diabetes mellitus
Ischaemic heart disease
Hypertension
Nephritisnephrosis
Stroke
ill-defined heart disease
Diabetes mellitus
Ischaemic heart disease
Hypertension
Nephritisnephrosis
1999
34
345
20
248
14
10
1999
295
246
23
10
145
68
2000
36
362
218
249
152
112
2000
318
268
241
108
16
8
2001
35
372
22
25
15
125
2001
322
28
252
102
162
95
2002
405
298
24
26
147
126
2002
352
295
27
115
16
10
2003
425
32
245
285
152
15
2003
382
299
285
122
17
12
2004
39
325
255
26
165
16
2004
35
30
295
121
19
119
2005
36
328
265
26
15
162
2005
325
30
32
12
18
12
2006
35
336
27
258
155
16
2006
33
32
32
11
18
125
COPD
Asthma
Tracheabronchial lung cancer
Oesophageal cancer
prostate cancer
Cervical cancer
Breast cancer
1999
2001
12
135
10
26
2000
204
116
13
92
28
2001
222
131
133
96
27
2002
23
144
128
95
285
2003
243
149
124
94
29
2004
229
154
1255
87
29
2005
224
152
122
82
295
2006
224
136
116
75
3
COPD
Asthma
Tracheabronchial lung cancer
Oesophageal cancer
Prostate cancer
Cervical cancer
Breast cancer
1999
88
92
43
41
106
82
2000
96
95
4
43
11
81
2001
10
109
4
4
111
89
2002
10
116
4
4
112
85
2003
11
124
4
395
116
85
2004
102
1295
44
39
115
101
2005
105
128
42
38
1185
10
2006
10
12
42
32
1205
10
Based on this survey the researchers estimate that 109 of all South Africans over 2 years old were living with HIV in 2008 In 2002 and 2005 this figure was 114 and 108 respectively showing a degree of stabilisation Among those between 15 and 49 years old the estimated HIV prevalence was 169 in 2008 The survey found the prevalence among children aged 2-14 to be 25 down significantly since 2002 when prevalence was 56
Estimated HIV prevalence () among South Africans aged 2 years and older by age 2002-2008
Age
HIV +
HIV -
Children (2-14 years)
25
975
Youth (15-24 years)
87
913
Adults (25 and older)
168
832
(15-49 years)
169
831
Total (2 and older)
109
891
Estimated HIV prevalence among South Africans by age and sex 2008
Age
Male prevalence
Female prevalence
2-14
3
2
15-19
25
67
20-24
51
211
25-29
157
327
30-34
258
291
35-39
185
248
40-44
192
163
45-49
64
141
50-54
104
102
55-59
62
77
60+
35
18
Total
79
136
Among females HIV prevalence is highest in those between 25 and 29 years old among males the peak is in the group aged 30-34 years
HIV prevalence () by province 2002-2008
Province
2002
2005
2008
KwaZulu-Natal
117
165
158
Mpumalanga
141
152
154
Free State
149
126
126
North West
103
109
113
Gauteng
147
108
103
Eastern Cape
66
89
9
Limpopo
98
8
88
Northern Cape
84
54
59
Western Cape
107
19
38
National
114
108
109
The results of this study suggest that KwaZulu-Natal Mpumulanga and Free State have the highest HIV prevalence However the relatively small sample sizes may limit precision and in several cases the ranges of uncertainty overlap
HIV prevalence by population group 2008
Population group
Prevalence ()
African
136
864
White
03
997
Coloured
17
983
Indian
03
997
Studies of AIDS deaths
Latin America
Latin America
Latin America
Latin America
North America
North America
North America
North America
Eastern Europe
Eastern Europe
Eastern Europe
Eastern Europe
Western Europe
Western Europe
Western Europe
Western Europe
Asia Pacific
Asia Pacific
Asia Pacific
Asia Pacific
Africa
Africa
Africa
Africa
Country
Study starts
Subjects randomised
SubjectsStudy
USA
32
4385
13703125
Russia
20
788
394
Germany
19
1883
991052631579
UK
13
265
203846153846
South Africa
12
347
289166666667
Argentina
12
329
274166666667
Australia
11
195
177272727273
India
7
275
392857142857
Brazil
3
115
383333333333
Country
Initiation
Site activation
Recruitment
LOC setup
Unproductive sites
(Approval ndash FCI)
(FCI ndash FSFV)
(FSFV ndash LSFV)
(CPC ndash FSFV)
South Africa
19
38
153
357
21
Australia
117
63
401
239
11
Germany
16
37
401
224
21
UK
9
101
301
346
20
Russia
11
52
174
334
9
India
31
28
389
431
3
Argentina
94
67
288
32
13
Brazil
79
59
94
656
20
USA
44
31
149
26
Country
Pts Rand
Sites
Av CPP
Cost Per Country
Ethics Subm
Regulatory Fees
Add Inv Fees
CT Scan Total
Ethics + Regulatory
Total Regulatory Fees
South Africa
25
5
7250
181250
290
460
363
0
750
1113
Canada
18
4
832545
14985818
181818
0
0
1557576
181818
1818
Italy
7
2
10000
70000
2200
0
0
0
2200
2200
Germany
55
10
7000
385000
3000
0
0
12000
3000
3000
Peru
40
5
7000
280000
1500
1000
2000
60000
2500
4500
Poland
15
4
10000
150000
0
2500
2400
0
2500
4900
Spain
40
7
10500
420000
0
0
5450
0
0
5450
UK
12
4
13000
156000
0
0
5556
0
0
5556
Bulgaria
18
4
10000
180000
0
5000
1000
0
5000
6000
Taiwan
20
4
1179649
2359298
104167
313
5208
0
135467
6563
Czech Rep
10
2
10000
100000
1500
3000
3000
0
4500
7500
Greece
40
7
9000
360000
0
7500
0
0
7500
7500
Chile
15
4
10840
162600
1700
3600
3000
0
5300
8300
Belgium
25
6
12200
305000
3992
4332
0
0
8324
8324
Korea
30
3
10827
324802
1114
0
14324
0
1114
15438
Singapore
10
2
11565
115650
1750
0
17975
0
1750
19725
France
50
10
9000
450000
0
0
20000
0
0
20000
China
39
5
4978
194142
5224
0
39814
0
5224
40336
New Zealand
10
3
145244
145244
1973
0
43123
0
1973
45096
Israel
10
6
11140
111400
2060
3000
48400
16500
5060
53460
Brazil
30
6
10000
300000
2000
287356
5649202
0
487356
61366
Australia
24
6
40200
964800
0
500
82500
0
500
83000
23
543
109
532856799
3304716
26939
27700043
73748966
[1753EURO x 14 (ex rate) = $2454] [ $245416 hours=$153hour]
1095625
1095625
12271
1753
198089
198089
208514736842
South Africa
Canada
Italy
Germany
Peru
Poland
Spain
UK
Bulgaria
Taiwan
Czech Rep
Greece
Chile
Belgium
Korea
Singapore
France
China
New Zealand
Israel
Brazil
Australia
Country
Study starts
Subjects randomised
SubjectsStudy
USA
32
4385
13703125
Russia
20
788
394
Germany
19
1883
991052631579
UK
13
265
203846153846
South Africa
12
347
289166666667
Argentina
12
329
274166666667
Australia
11
195
177272727273
India
7
275
392857142857
Brazil
3
115
383333333333
Country
Initiation
Site activation
Recruitment
LOC setup
Unproductive sites
(Approval ndash FCI)
(FCI ndash FSFV)
(FSFV ndash LSFV)
(CPC ndash FSFV)
South Africa
19
38
153
357
21
Australia
117
63
401
239
11
Germany
16
37
401
224
21
UK
9
101
301
346
20
Russia
11
52
174
334
9
India
31
28
389
431
3
Argentina
94
67
288
32
13
Brazil
79
59
94
656
20
USA
44
31
149
26
Country
Pts Rand
Sites
Av CPP
Cost Per Country
Ethics Subm
Regulatory Fees
Add Inv Fees
CT Scan Total
Ethics + Regulatory
Total Regulatory Fees
China
39
5
4978
194142
522
0
39814
0
522
40336
Germany
55
10
7000
385000
3000
0
0
12000
3000
3000
Peru
40
5
7000
280000
1500
1000
2000
60000
2500
4500
South Africa
25
5
7250
181250
290
460
363
0
750
1113
Canada
18
4
8325
149858
1818
0
0
1557576
1818
1818
Greece
40
7
9000
360000
0
7500
0
0
7500
7500
France
50
10
9000
450000
0
0
20000
0
0
20000
Italy
7
2
10000
70000
2200
0
0
0
2200
2200
Poland
15
4
10000
150000
0
2500
2400
0
2500
4900
Bulgaria
18
4
10000
180000
0
5000
1000
0
5000
6000
Czech Rep
10
2
10000
100000
1500
3000
3000
0
4500
7500
Brazil
30
6
10000
300000
2000
2874
56492
0
4874
61366
Spain
40
7
10500
420000
0
0
5450
0
0
5450
Korea
30
3
10827
324802
1114
0
14324
0
1114
15438
Chile
15
4
10840
162600
1700
3600
3000
0
5300
8300
Israel
10
6
11140
111400
2060
3000
48400
16500
5060
53460
Singapore
10
2
11565
115650
1750
0
17975
0
1750
19725
Taiwan
20
4
11796
235930
1042
313
5208
0
1355
6563
Belgium
25
6
12200
305000
3992
4332
0
0
8324
8324
UK
12
4
13000
156000
0
0
5556
0
0
5556
New Zealand
10
3
14524
145244
1973
0
43123
0
1973
45096
Australia
24
6
40200
964800
0
500
82500
0
500
83000
23
543
109
5328568
33047
26939
277000
73748966
[1753EURO x 14 (ex rate) = $2454] [ $245416 hours=$153hour]
110
1095625
1227
1753
19809
20
21
China
Germany
Peru
South Africa
Canada
Greece
France
Italy
Poland
Bulgaria
Czech Rep
Brazil
Spain
Korea
Chile
Israel
Singapore
Taiwan
Belgium
UK
New Zealand
Australia
Sheet2
Sheet3
20
South Africa Leading Causes of Death
00
20
40
60
80
100
120
140 The ten leading underlying natural causes of death in South Africa (2009)
percentage
TB Flu amp Intest Heart Cereb Diab HIV HT Chron Immun Pneum Infect Other Vasc Mell Dis LRT Dis
Stats SA Rel P03093 Mortality and causes of death in South Africa 2009 Findings from death notification Nov-2011
Age group
TB 0-14 15-49 50-64 65+
Rank Rank Rank Rank
5 34 1 196 1 114 8 33
24
bull Well established research infrastructure bull Public and private sectors
28 teaching hospitals gt40000 tertiary care beds 140 private hospitals gt30000 beds 15 - 18 medical insurance
bull Large broad-based investigator database amp site networks bull Specialised Early Phase presence since 1970s bull GCPGLP and CLIA 88 compliant labs bull Specialist labs (biomarkers TB immunology
PKbioassay) bull Full support services (GMP-depots translations etc) bull Stringent ICH-compliant RAEC review policies
GCP is a legal requirement Informed Consent entrenched in Constitution
South Africa Advantages
25
bull Reliable (+) roads air links energy connectivity bull European Time bull Research language is English bull Inverse seasons bull Cost Currency bull Mobile-phone enabled obsessed population
South Africa Advantages
26
South Africa Track Record
bull Phase I-III data from SA included in hundreds of US amp European registration dossiers
bull Two entire NDA dossiers ndash rifapentine 1998 ndash tryptorelin (GnRH agonist) 2001) comprised SA data
bull 37 FDA inspections 1994-2009 1 OAI (27)
27
Therapeutic Indications
28
0
1
2
3
4
5
6
7
8
9
10
Belg
ium
Au
stria
Li
thua
nia
Can
ada
Luxe
mbo
urg
Mal
ta
Nor
way
Po
rtuga
l R
oman
ia
Rus
sia
Serb
ia
Swed
en
The
Net
herla
nds
USA
loca
l site
s U
SA c
entra
l site
C
zech
Rep
ublic
D
enm
ark
Esto
nia
Finl
and
Hun
gary
Ic
elan
d Ire
land
La
tvia
G
erm
any
Switz
erla
nd
Liec
hten
stei
n U
nite
d Ki
ngdo
m
Fran
ce
Italy
Au
stra
lia
Hon
g-Ko
ng
New
Zea
land
Si
ngap
ore
Taiw
an
Uga
nda
Pola
nd
Ukr
aine
C
hile
G
uate
mal
a Ja
pan
Isra
el
Slov
akia
Bu
lgar
ia
Gre
ece
Mal
aysi
a Ph
ilipp
ines
Pe
ru
Thai
land
Tu
rkey
Sl
oven
ia
Cos
ta R
ica
Mex
ico
Spai
n So
uth
Afric
a Ar
gent
ina
Sout
h Ko
rea
Col
ombi
a Pa
nam
a C
roat
ia
Indi
a Ve
nezu
ela
Braz
il C
hina
Mon
ths
Sout
h Afri
ca
Global Regulatory Review Timelines
Triclinium experience 2009-2015
Triclinium experience 2009 - 2015
29
Protocol release Country selection
Site Selection Collection of reg docs
Submission of RA application
EC application
Negotiate Site Contracts
EC Approvals
RA Approval amp Import permit
Site Initiation Import amp distribute drug
Import ancillary supplies Set up local labs
Set up EDC
Months
0
1
2
3
All EC approvals typically within 6
weeks
Site contracts signed within days
As soon as MCC approval obtained ALL sites can be initiated
Start-Up Activities in PARALLEL
GMO application (biologics)
30
0
2000
4000
6000
8000
10000
12000
14000C
hina
Ger
man
y
Per
u
Sou
th A
frica
Can
ada
Gre
ece
Fran
ce
Italy
Pol
and
Bul
garia
Cze
ch R
ep
Bra
zil
Spa
in
Kor
ea
Chi
le
Isra
el
Sin
gapo
re
Taiw
an
Bel
gium U
K
New
hellip
Aus
tralia
Source Bayer Presented SACRA Conference 2009
Aver
age
cost
per
pat
ient
(Eur
o)
Average Cost per Enrolled Participant
gt40000
Chart1
Average Cost Per Patient (Euro)
4978
7000
7000
7250
832545
9000
9000
10000
10000
10000
10000
10000
10500
10827
10840
11140
11565
1179649
12200
13000
145244
40200
Sheet1
Sheet2
Sheet2
Average Cost Per Patient (Euro)
Average Cost Per Patient
Sheet4
Ethics Subm
Regulatory Fees
Sheet3
Ethics + Regulatory
Total Ethics and Regulatory Fees
Add Inv Fees
Additional Investigator Application Fees
Total Regulatory Fees
Study starts
SubjectsStudy
31
Euro
0
10000
20000
30000
40000
50000
60000
70000
80000
90000S
outh
Afri
caC
anad
a
Italy
Ger
man
yP
eru
Pol
and
Spa
in UK
Bul
garia
Taiw
anC
zech
Rep
Gre
ece
Chi
leB
elgi
umK
orea
Sin
gapo
reFr
ance
Chi
naN
ew Z
eala
ndIs
rael
Bra
zil
Aus
tralia
Source Bayer Presented SACRA Conference 2009
Eur
os
Regulatory Application Fees
Chart1
Total Regulatory Fees
1113
181818
2200
3000
4500
4900
5450
5556
6000
656267
7500
7500
8300
8324
15438
19725
20000
403364
45096
53460
6136558
83000
Sheet1
Sheet2
Sheet2
Average Cost Per Patient (Euro)
Average Cost Per Patient
Sheet4
Ethics Subm
Regulatory Fees
Sheet3
Ethics + Regulatory
Total Ethics and Regulatory Fees
Add Inv Fees
Additional Investigator Application Fees
Total Regulatory Fees
Study starts
SubjectsStudy
32
SA Clinical Trial Regulatory Processes
Governed by SA-GCP and Declaration of Helsinki SA National Clinical Trials Register (SANCTR) Medicines Control Council (National Regulatory Authority)
o New protocols o Amendments o Additional sitesinvestigators
Ethics Committees (33 NHREC-registered) RegionalMunicipal DoH Export permits for bio samples (Nat Health Act 2003)
Clinical Trial Density Active sites million population
Nature Reviews Drug Discovery 7 13-14 (January 2008)
France 503
Germany 512 Canada
922
USA 1203
Czech Republic 776
553 sites
South Africa 119
757 sites
757 sites
533 sites
1084 sites
Argentina 269
Russia 77
China 04
India 07
34
Gateway to Africa
35
Why Africa bull Large accessible population relatively new to clinical trials
bull Experienced and willing investigators
bull Many clinical trial sites established by PDPs NGOs etc
bull Expanding therapeutic areas shifting burden of disease from
infectious to non-communicable diseases
bull Significantly improved infrastructure and accessibility
bull Rapidly evolving regulatory and ethics procedures
bull Potential for capacity building and sustainable clinical trial potential
36
Relatively young GCP culture Resident mentorships to build capacity Locations ndash accessibility for site monitoring Variable infrastructure esp electricity connectivity and
transportation Resourcing of public healthcare systems
Sub-Saharan Africa challenges
37
bull Second-largest continent
bull Spans NS and EW hemispheres
bull Second most populous continent 2014 estimate 1069 billion
bull Home to more than a quarter of the 196 independent countries
bull All 54 African countries are UN members
bull 39 urban population
bull 12 metropolitan areas gt 4m
bull gt 3000 distinct ethnicities
bull gt 2000 languages spoken
AFRICA hellip the true size
wwwcitypopulationdeworldAgglomerations 2015
38
SSV to SIV
0
5
10
15
20
25
30
35
40
45
Africa North America
Asia Pacific
Western Europe
Eastern Europe
Latin America
Source Quintiles South Africa SACRA Conference 2008
Wee
ks (A
vera
ge)
Start-Up Timelines
39
Region Median
Patients Site
of Sites
0 pts 1 - 3 pts 4 - 9 pts 10+ pts
Latin America 40 21 26 30 23
North America 30 29 29 24 18
Eastern Europe 60 15 31 26 27
Western Europe 40 15 22 29 34
Asia Pacific 40 19 30 34 18
Africa 100 4 17 28 51
Enrollment performance by region for 2008
Site Performance
Source Quintiles South Africa Presented SACRA Conference 2009
40
0 1 2 3 4 5 6 7 8 9
10
Latin America
North America
Eastern Europe
Western Europe
Asia Pacific
Africa
Num
ber o
f par
ticip
ants
MEDIAN site enrollment by region for 2008
Source Quintiles South Africa Presented SACRA Conference 2009
Site Performance
41
Source Quintiles South Africa Presented SACRA Conference 2009
s
ites
0
5
10
15
20
25
30
35
40
45
50
LatinAmerica
NorthAmerica
EasternEurope
WesternEurope
Asia Pacific Africa
0 pts
1 - 3 pts
4 - 9 pts
10+ pts
Enrollment performance by region for 2008
Site Performance
Chart1
0 pts
1 - 3 pts
4 - 9 pts
10+ pts
021
026
03
023
029
029
024
018
015
031
026
027
015
022
029
034
019
03
034
018
004
017
028
051
HIV
HIV
Resiratory amp Cancer
Male prevalence
Female prevalence
CVS
Overall death rates
Overall death rates
COPD
Asthma
Tracheabronchial lung cancer
Oesophageal cancer
prostate cancer
Trial metrics
COPD
Asthma
Tracheabronchial lung cancer
Oesophageal cancer
Prostate cancer
Cervical cancer
Breast cancer
Stroke
ill-defined heart disease
Diabetes mellitus
Ischaemic heart disease
Hypertension
Nephritisnephrosis
Stroke
ill-defined heart disease
Diabetes mellitus
Ischaemic heart disease
Hypertension
Nephritisnephrosis
Males
Female
UN - Male
SA 1997
SA 2004
UN - Female
SA 1997
SA 2004
0 pts
1 - 3 pts
4 - 9 pts
10+ pts
42
Source wwwclinicaltrialsgov 22-Oct-2010
Clinical trials registered across Africa
43
0
500
1000
1500
2000
2500
South Africa Kenya Malawi Tanzania Uganda Zambia
Selected African countries
2005
2010
2015
Source ClinTrialsgov
Trend 2005 - 2015
Source wwwclinicaltrialsgov 28-Aug-2015
44
AFRICA FOUND IN TRANSLATION
bull Vast treatment-naiumlve population bull Cost advantages (still) bull Diverse ethnicity amp morbidity bull Inverse seasonality bull Site capacity-building widely implemented bull Robust regulatory review bull Variable but generally good regulatory timelines bull Established GCP culture ndash sites and home-bred CROs
45
THANK YOU
Foliennummer 1
Triclinium A South African CRO
Collaboration with VPM SII
Vaccine Trials in SA 2015
Foliennummer 5
Foliennummer 6
Foliennummer 7
Foliennummer 8
Foliennummer 9
Foliennummer 10
Foliennummer 11
Foliennummer 12
Foliennummer 13
Foliennummer 14
Foliennummer 15
Foliennummer 16
Foliennummer 17
Distribution of clinical trial sites
Foliennummer 19
South Africa Leading Causes of Death
Foliennummer 21
Foliennummer 22
South Africa TB deaths by age group
Foliennummer 24
Foliennummer 25
Foliennummer 26
Foliennummer 27
Foliennummer 28
Foliennummer 29
Foliennummer 30
Foliennummer 31
SA Clinical Trial Regulatory Processes
Clinical Trial Density Active sites million population
Foliennummer 34
Why Africa
Foliennummer 36
AFRICA hellip the true size
SSV to SIV
Foliennummer 39
Foliennummer 40
Foliennummer 41
Foliennummer 42
Foliennummer 43
AFRICA FOUND IN TRANSLATION
Foliennummer 45
Region
Median
of Sites
Patients Site
0 pts
1 - 3 pts
4 - 9 pts
10+ pts
Latin America
4
21
26
30
23
North America
3
29
29
24
18
Eastern Europe
6
15
31
26
27
Western Europe
4
15
22
29
34
Asia Pacific
4
19
30
34
18
Africa
10
4
17
28
51
0 pts
1 - 3 pts
4 - 9 pts
10+ pts
Latin America
21
26
30
23
North America
29
29
24
18
Eastern Europe
15
31
26
27
Western Europe
15
22
29
34
Asia Pacific
19
30
34
18
Africa
4
17
28
51
Males
Female
15-19
210
150
20-24
340
205
25-29
395
300
30-34
460
360
35-39
600
405
40-44
800
500
45-49
1100
700
50-54
1600
1050
55-54
2300
1580
60-64
3340
2250
UN - Male
SA 1997
SA 2004
UN - Female
SA 1997
SA 2004
15-19
210
235
216
150
165
187
20-24
340
381
555
205
331
1085
25-29
395
625
1081
300
452
1985
30-34
460
817
2118
360
489
2267
35-39
600
916
2498
405
526
1890
40-44
800
1136
2765
500
615
1548
45-49
1100
1486
2744
700
800
1400
50-54
1600
2016
2979
1050
1116
1506
55-54
2300
2838
3270
1580
1626
1717
60-64
3340
3614
4146
2250
2201
2360
Stroke
ill-defined heart disease
Diabetes mellitus
Ischaemic heart disease
Hypertension
Nephritisnephrosis
Stroke
ill-defined heart disease
Diabetes mellitus
Ischaemic heart disease
Hypertension
Nephritisnephrosis
1999
34
345
20
248
14
10
1999
295
246
23
10
145
68
2000
36
362
218
249
152
112
2000
318
268
241
108
16
8
2001
35
372
22
25
15
125
2001
322
28
252
102
162
95
2002
405
298
24
26
147
126
2002
352
295
27
115
16
10
2003
425
32
245
285
152
15
2003
382
299
285
122
17
12
2004
39
325
255
26
165
16
2004
35
30
295
121
19
119
2005
36
328
265
26
15
162
2005
325
30
32
12
18
12
2006
35
336
27
258
155
16
2006
33
32
32
11
18
125
COPD
Asthma
Tracheabronchial lung cancer
Oesophageal cancer
prostate cancer
Cervical cancer
Breast cancer
1999
2001
12
135
10
26
2000
204
116
13
92
28
2001
222
131
133
96
27
2002
23
144
128
95
285
2003
243
149
124
94
29
2004
229
154
1255
87
29
2005
224
152
122
82
295
2006
224
136
116
75
3
COPD
Asthma
Tracheabronchial lung cancer
Oesophageal cancer
Prostate cancer
Cervical cancer
Breast cancer
1999
88
92
43
41
106
82
2000
96
95
4
43
11
81
2001
10
109
4
4
111
89
2002
10
116
4
4
112
85
2003
11
124
4
395
116
85
2004
102
1295
44
39
115
101
2005
105
128
42
38
1185
10
2006
10
12
42
32
1205
10
Based on this survey the researchers estimate that 109 of all South Africans over 2 years old were living with HIV in 2008 In 2002 and 2005 this figure was 114 and 108 respectively showing a degree of stabilisation Among those between 15 and 49 years old the estimated HIV prevalence was 169 in 2008 The survey found the prevalence among children aged 2-14 to be 25 down significantly since 2002 when prevalence was 56
Estimated HIV prevalence () among South Africans aged 2 years and older by age 2002-2008
Age
HIV +
HIV -
Children (2-14 years)
25
975
Youth (15-24 years)
87
913
Adults (25 and older)
168
832
(15-49 years)
169
831
Total (2 and older)
109
891
Estimated HIV prevalence among South Africans by age and sex 2008
Age
Male prevalence
Female prevalence
2-14
3
2
15-19
25
67
20-24
51
211
25-29
157
327
30-34
258
291
35-39
185
248
40-44
192
163
45-49
64
141
50-54
104
102
55-59
62
77
60+
35
18
Total
79
136
Among females HIV prevalence is highest in those between 25 and 29 years old among males the peak is in the group aged 30-34 years
HIV prevalence () by province 2002-2008
Province
2002
2005
2008
KwaZulu-Natal
117
165
158
Mpumalanga
141
152
154
Free State
149
126
126
North West
103
109
113
Gauteng
147
108
103
Eastern Cape
66
89
9
Limpopo
98
8
88
Northern Cape
84
54
59
Western Cape
107
19
38
National
114
108
109
The results of this study suggest that KwaZulu-Natal Mpumulanga and Free State have the highest HIV prevalence However the relatively small sample sizes may limit precision and in several cases the ranges of uncertainty overlap
HIV prevalence by population group 2008
Population group
Prevalence ()
African
136
864
White
03
997
Coloured
17
983
Indian
03
997
Studies of AIDS deaths
Latin America
Latin America
Latin America
Latin America
North America
North America
North America
North America
Eastern Europe
Eastern Europe
Eastern Europe
Eastern Europe
Western Europe
Western Europe
Western Europe
Western Europe
Asia Pacific
Asia Pacific
Asia Pacific
Asia Pacific
Africa
Africa
Africa
Africa
Country
Study starts
Subjects randomised
SubjectsStudy
USA
32
4385
13703125
Russia
20
788
394
Germany
19
1883
991052631579
UK
13
265
203846153846
South Africa
12
347
289166666667
Argentina
12
329
274166666667
Australia
11
195
177272727273
India
7
275
392857142857
Brazil
3
115
383333333333
Country
Initiation
Site activation
Recruitment
LOC setup
Unproductive sites
(Approval ndash FCI)
(FCI ndash FSFV)
(FSFV ndash LSFV)
(CPC ndash FSFV)
South Africa
19
38
153
357
21
Australia
117
63
401
239
11
Germany
16
37
401
224
21
UK
9
101
301
346
20
Russia
11
52
174
334
9
India
31
28
389
431
3
Argentina
94
67
288
32
13
Brazil
79
59
94
656
20
USA
44
31
149
26
Country
Pts Rand
Sites
Av CPP
Cost Per Country
Ethics Subm
Regulatory Fees
Add Inv Fees
CT Scan Total
Ethics + Regulatory
Total Regulatory Fees
South Africa
25
5
7250
181250
290
460
363
0
750
1113
Canada
18
4
832545
14985818
181818
0
0
1557576
181818
1818
Italy
7
2
10000
70000
2200
0
0
0
2200
2200
Germany
55
10
7000
385000
3000
0
0
12000
3000
3000
Peru
40
5
7000
280000
1500
1000
2000
60000
2500
4500
Poland
15
4
10000
150000
0
2500
2400
0
2500
4900
Spain
40
7
10500
420000
0
0
5450
0
0
5450
UK
12
4
13000
156000
0
0
5556
0
0
5556
Bulgaria
18
4
10000
180000
0
5000
1000
0
5000
6000
Taiwan
20
4
1179649
2359298
104167
313
5208
0
135467
6563
Czech Rep
10
2
10000
100000
1500
3000
3000
0
4500
7500
Greece
40
7
9000
360000
0
7500
0
0
7500
7500
Chile
15
4
10840
162600
1700
3600
3000
0
5300
8300
Belgium
25
6
12200
305000
3992
4332
0
0
8324
8324
Korea
30
3
10827
324802
1114
0
14324
0
1114
15438
Singapore
10
2
11565
115650
1750
0
17975
0
1750
19725
France
50
10
9000
450000
0
0
20000
0
0
20000
China
39
5
4978
194142
5224
0
39814
0
5224
40336
New Zealand
10
3
145244
145244
1973
0
43123
0
1973
45096
Israel
10
6
11140
111400
2060
3000
48400
16500
5060
53460
Brazil
30
6
10000
300000
2000
287356
5649202
0
487356
61366
Australia
24
6
40200
964800
0
500
82500
0
500
83000
23
543
109
532856799
3304716
26939
27700043
73748966
[1753EURO x 14 (ex rate) = $2454] [ $245416 hours=$153hour]
1095625
1095625
12271
1753
198089
198089
208514736842
South Africa
Canada
Italy
Germany
Peru
Poland
Spain
UK
Bulgaria
Taiwan
Czech Rep
Greece
Chile
Belgium
Korea
Singapore
France
China
New Zealand
Israel
Brazil
Australia
Country
Study starts
Subjects randomised
SubjectsStudy
USA
32
4385
13703125
Russia
20
788
394
Germany
19
1883
991052631579
UK
13
265
203846153846
South Africa
12
347
289166666667
Argentina
12
329
274166666667
Australia
11
195
177272727273
India
7
275
392857142857
Brazil
3
115
383333333333
Country
Initiation
Site activation
Recruitment
LOC setup
Unproductive sites
(Approval ndash FCI)
(FCI ndash FSFV)
(FSFV ndash LSFV)
(CPC ndash FSFV)
South Africa
19
38
153
357
21
Australia
117
63
401
239
11
Germany
16
37
401
224
21
UK
9
101
301
346
20
Russia
11
52
174
334
9
India
31
28
389
431
3
Argentina
94
67
288
32
13
Brazil
79
59
94
656
20
USA
44
31
149
26
Country
Pts Rand
Sites
Av CPP
Cost Per Country
Ethics Subm
Regulatory Fees
Add Inv Fees
CT Scan Total
Ethics + Regulatory
Total Regulatory Fees
China
39
5
4978
194142
522
0
39814
0
522
40336
Germany
55
10
7000
385000
3000
0
0
12000
3000
3000
Peru
40
5
7000
280000
1500
1000
2000
60000
2500
4500
South Africa
25
5
7250
181250
290
460
363
0
750
1113
Canada
18
4
8325
149858
1818
0
0
1557576
1818
1818
Greece
40
7
9000
360000
0
7500
0
0
7500
7500
France
50
10
9000
450000
0
0
20000
0
0
20000
Italy
7
2
10000
70000
2200
0
0
0
2200
2200
Poland
15
4
10000
150000
0
2500
2400
0
2500
4900
Bulgaria
18
4
10000
180000
0
5000
1000
0
5000
6000
Czech Rep
10
2
10000
100000
1500
3000
3000
0
4500
7500
Brazil
30
6
10000
300000
2000
2874
56492
0
4874
61366
Spain
40
7
10500
420000
0
0
5450
0
0
5450
Korea
30
3
10827
324802
1114
0
14324
0
1114
15438
Chile
15
4
10840
162600
1700
3600
3000
0
5300
8300
Israel
10
6
11140
111400
2060
3000
48400
16500
5060
53460
Singapore
10
2
11565
115650
1750
0
17975
0
1750
19725
Taiwan
20
4
11796
235930
1042
313
5208
0
1355
6563
Belgium
25
6
12200
305000
3992
4332
0
0
8324
8324
UK
12
4
13000
156000
0
0
5556
0
0
5556
New Zealand
10
3
14524
145244
1973
0
43123
0
1973
45096
Australia
24
6
40200
964800
0
500
82500
0
500
83000
23
543
109
5328568
33047
26939
277000
73748966
[1753EURO x 14 (ex rate) = $2454] [ $245416 hours=$153hour]
110
1095625
1227
1753
19809
20
21
China
Germany
Peru
South Africa
Canada
Greece
France
Italy
Poland
Bulgaria
Czech Rep
Brazil
Spain
Korea
Chile
Israel
Singapore
Taiwan
Belgium
UK
New Zealand
Australia
Sheet3
20
South Africa Leading Causes of Death
00
20
40
60
80
100
120
140 The ten leading underlying natural causes of death in South Africa (2009)
percentage
TB Flu amp Intest Heart Cereb Diab HIV HT Chron Immun Pneum Infect Other Vasc Mell Dis LRT Dis
Stats SA Rel P03093 Mortality and causes of death in South Africa 2009 Findings from death notification Nov-2011
Age group
TB 0-14 15-49 50-64 65+
Rank Rank Rank Rank
5 34 1 196 1 114 8 33
24
bull Well established research infrastructure bull Public and private sectors
28 teaching hospitals gt40000 tertiary care beds 140 private hospitals gt30000 beds 15 - 18 medical insurance
bull Large broad-based investigator database amp site networks bull Specialised Early Phase presence since 1970s bull GCPGLP and CLIA 88 compliant labs bull Specialist labs (biomarkers TB immunology
PKbioassay) bull Full support services (GMP-depots translations etc) bull Stringent ICH-compliant RAEC review policies
GCP is a legal requirement Informed Consent entrenched in Constitution
South Africa Advantages
25
bull Reliable (+) roads air links energy connectivity bull European Time bull Research language is English bull Inverse seasons bull Cost Currency bull Mobile-phone enabled obsessed population
South Africa Advantages
26
South Africa Track Record
bull Phase I-III data from SA included in hundreds of US amp European registration dossiers
bull Two entire NDA dossiers ndash rifapentine 1998 ndash tryptorelin (GnRH agonist) 2001) comprised SA data
bull 37 FDA inspections 1994-2009 1 OAI (27)
27
Therapeutic Indications
28
0
1
2
3
4
5
6
7
8
9
10
Belg
ium
Au
stria
Li
thua
nia
Can
ada
Luxe
mbo
urg
Mal
ta
Nor
way
Po
rtuga
l R
oman
ia
Rus
sia
Serb
ia
Swed
en
The
Net
herla
nds
USA
loca
l site
s U
SA c
entra
l site
C
zech
Rep
ublic
D
enm
ark
Esto
nia
Finl
and
Hun
gary
Ic
elan
d Ire
land
La
tvia
G
erm
any
Switz
erla
nd
Liec
hten
stei
n U
nite
d Ki
ngdo
m
Fran
ce
Italy
Au
stra
lia
Hon
g-Ko
ng
New
Zea
land
Si
ngap
ore
Taiw
an
Uga
nda
Pola
nd
Ukr
aine
C
hile
G
uate
mal
a Ja
pan
Isra
el
Slov
akia
Bu
lgar
ia
Gre
ece
Mal
aysi
a Ph
ilipp
ines
Pe
ru
Thai
land
Tu
rkey
Sl
oven
ia
Cos
ta R
ica
Mex
ico
Spai
n So
uth
Afric
a Ar
gent
ina
Sout
h Ko
rea
Col
ombi
a Pa
nam
a C
roat
ia
Indi
a Ve
nezu
ela
Braz
il C
hina
Mon
ths
Sout
h Afri
ca
Global Regulatory Review Timelines
Triclinium experience 2009-2015
Triclinium experience 2009 - 2015
29
Protocol release Country selection
Site Selection Collection of reg docs
Submission of RA application
EC application
Negotiate Site Contracts
EC Approvals
RA Approval amp Import permit
Site Initiation Import amp distribute drug
Import ancillary supplies Set up local labs
Set up EDC
Months
0
1
2
3
All EC approvals typically within 6
weeks
Site contracts signed within days
As soon as MCC approval obtained ALL sites can be initiated
Start-Up Activities in PARALLEL
GMO application (biologics)
30
0
2000
4000
6000
8000
10000
12000
14000C
hina
Ger
man
y
Per
u
Sou
th A
frica
Can
ada
Gre
ece
Fran
ce
Italy
Pol
and
Bul
garia
Cze
ch R
ep
Bra
zil
Spa
in
Kor
ea
Chi
le
Isra
el
Sin
gapo
re
Taiw
an
Bel
gium U
K
New
hellip
Aus
tralia
Source Bayer Presented SACRA Conference 2009
Aver
age
cost
per
pat
ient
(Eur
o)
Average Cost per Enrolled Participant
gt40000
Chart1
Average Cost Per Patient (Euro)
4978
7000
7000
7250
832545
9000
9000
10000
10000
10000
10000
10000
10500
10827
10840
11140
11565
1179649
12200
13000
145244
40200
Sheet1
Sheet2
Sheet2
Average Cost Per Patient (Euro)
Average Cost Per Patient
Sheet4
Ethics Subm
Regulatory Fees
Sheet3
Ethics + Regulatory
Total Ethics and Regulatory Fees
Add Inv Fees
Additional Investigator Application Fees
Total Regulatory Fees
Study starts
SubjectsStudy
31
Euro
0
10000
20000
30000
40000
50000
60000
70000
80000
90000S
outh
Afri
caC
anad
a
Italy
Ger
man
yP
eru
Pol
and
Spa
in UK
Bul
garia
Taiw
anC
zech
Rep
Gre
ece
Chi
leB
elgi
umK
orea
Sin
gapo
reFr
ance
Chi
naN
ew Z
eala
ndIs
rael
Bra
zil
Aus
tralia
Source Bayer Presented SACRA Conference 2009
Eur
os
Regulatory Application Fees
Chart1
Total Regulatory Fees
1113
181818
2200
3000
4500
4900
5450
5556
6000
656267
7500
7500
8300
8324
15438
19725
20000
403364
45096
53460
6136558
83000
Sheet1
Sheet2
Sheet2
Average Cost Per Patient (Euro)
Average Cost Per Patient
Sheet4
Ethics Subm
Regulatory Fees
Sheet3
Ethics + Regulatory
Total Ethics and Regulatory Fees
Add Inv Fees
Additional Investigator Application Fees
Total Regulatory Fees
Study starts
SubjectsStudy
32
SA Clinical Trial Regulatory Processes
Governed by SA-GCP and Declaration of Helsinki SA National Clinical Trials Register (SANCTR) Medicines Control Council (National Regulatory Authority)
o New protocols o Amendments o Additional sitesinvestigators
Ethics Committees (33 NHREC-registered) RegionalMunicipal DoH Export permits for bio samples (Nat Health Act 2003)
Clinical Trial Density Active sites million population
Nature Reviews Drug Discovery 7 13-14 (January 2008)
France 503
Germany 512 Canada
922
USA 1203
Czech Republic 776
553 sites
South Africa 119
757 sites
757 sites
533 sites
1084 sites
Argentina 269
Russia 77
China 04
India 07
34
Gateway to Africa
35
Why Africa bull Large accessible population relatively new to clinical trials
bull Experienced and willing investigators
bull Many clinical trial sites established by PDPs NGOs etc
bull Expanding therapeutic areas shifting burden of disease from
infectious to non-communicable diseases
bull Significantly improved infrastructure and accessibility
bull Rapidly evolving regulatory and ethics procedures
bull Potential for capacity building and sustainable clinical trial potential
36
Relatively young GCP culture Resident mentorships to build capacity Locations ndash accessibility for site monitoring Variable infrastructure esp electricity connectivity and
transportation Resourcing of public healthcare systems
Sub-Saharan Africa challenges
37
bull Second-largest continent
bull Spans NS and EW hemispheres
bull Second most populous continent 2014 estimate 1069 billion
bull Home to more than a quarter of the 196 independent countries
bull All 54 African countries are UN members
bull 39 urban population
bull 12 metropolitan areas gt 4m
bull gt 3000 distinct ethnicities
bull gt 2000 languages spoken
AFRICA hellip the true size
wwwcitypopulationdeworldAgglomerations 2015
38
SSV to SIV
0
5
10
15
20
25
30
35
40
45
Africa North America
Asia Pacific
Western Europe
Eastern Europe
Latin America
Source Quintiles South Africa SACRA Conference 2008
Wee
ks (A
vera
ge)
Start-Up Timelines
39
Region Median
Patients Site
of Sites
0 pts 1 - 3 pts 4 - 9 pts 10+ pts
Latin America 40 21 26 30 23
North America 30 29 29 24 18
Eastern Europe 60 15 31 26 27
Western Europe 40 15 22 29 34
Asia Pacific 40 19 30 34 18
Africa 100 4 17 28 51
Enrollment performance by region for 2008
Site Performance
Source Quintiles South Africa Presented SACRA Conference 2009
40
0 1 2 3 4 5 6 7 8 9
10
Latin America
North America
Eastern Europe
Western Europe
Asia Pacific
Africa
Num
ber o
f par
ticip
ants
MEDIAN site enrollment by region for 2008
Source Quintiles South Africa Presented SACRA Conference 2009
Site Performance
41
Source Quintiles South Africa Presented SACRA Conference 2009
s
ites
0
5
10
15
20
25
30
35
40
45
50
LatinAmerica
NorthAmerica
EasternEurope
WesternEurope
Asia Pacific Africa
0 pts
1 - 3 pts
4 - 9 pts
10+ pts
Enrollment performance by region for 2008
Site Performance
Chart1
0 pts
1 - 3 pts
4 - 9 pts
10+ pts
021
026
03
023
029
029
024
018
015
031
026
027
015
022
029
034
019
03
034
018
004
017
028
051
HIV
HIV
Resiratory amp Cancer
Male prevalence
Female prevalence
CVS
Overall death rates
Overall death rates
COPD
Asthma
Tracheabronchial lung cancer
Oesophageal cancer
prostate cancer
Trial metrics
COPD
Asthma
Tracheabronchial lung cancer
Oesophageal cancer
Prostate cancer
Cervical cancer
Breast cancer
Stroke
ill-defined heart disease
Diabetes mellitus
Ischaemic heart disease
Hypertension
Nephritisnephrosis
Stroke
ill-defined heart disease
Diabetes mellitus
Ischaemic heart disease
Hypertension
Nephritisnephrosis
Males
Female
UN - Male
SA 1997
SA 2004
UN - Female
SA 1997
SA 2004
0 pts
1 - 3 pts
4 - 9 pts
10+ pts
42
Source wwwclinicaltrialsgov 22-Oct-2010
Clinical trials registered across Africa
43
0
500
1000
1500
2000
2500
South Africa Kenya Malawi Tanzania Uganda Zambia
Selected African countries
2005
2010
2015
Source ClinTrialsgov
Trend 2005 - 2015
Source wwwclinicaltrialsgov 28-Aug-2015
44
AFRICA FOUND IN TRANSLATION
bull Vast treatment-naiumlve population bull Cost advantages (still) bull Diverse ethnicity amp morbidity bull Inverse seasonality bull Site capacity-building widely implemented bull Robust regulatory review bull Variable but generally good regulatory timelines bull Established GCP culture ndash sites and home-bred CROs
45
THANK YOU
Foliennummer 1
Triclinium A South African CRO
Collaboration with VPM SII
Vaccine Trials in SA 2015
Foliennummer 5
Foliennummer 6
Foliennummer 7
Foliennummer 8
Foliennummer 9
Foliennummer 10
Foliennummer 11
Foliennummer 12
Foliennummer 13
Foliennummer 14
Foliennummer 15
Foliennummer 16
Foliennummer 17
Distribution of clinical trial sites
Foliennummer 19
South Africa Leading Causes of Death
Foliennummer 21
Foliennummer 22
South Africa TB deaths by age group
Foliennummer 24
Foliennummer 25
Foliennummer 26
Foliennummer 27
Foliennummer 28
Foliennummer 29
Foliennummer 30
Foliennummer 31
SA Clinical Trial Regulatory Processes
Clinical Trial Density Active sites million population
Foliennummer 34
Why Africa
Foliennummer 36
AFRICA hellip the true size
SSV to SIV
Foliennummer 39
Foliennummer 40
Foliennummer 41
Foliennummer 42
Foliennummer 43
AFRICA FOUND IN TRANSLATION
Foliennummer 45
Region
Median
of Sites
Patients Site
0 pts
1 - 3 pts
4 - 9 pts
10+ pts
Latin America
4
21
26
30
23
North America
3
29
29
24
18
Eastern Europe
6
15
31
26
27
Western Europe
4
15
22
29
34
Asia Pacific
4
19
30
34
18
Africa
10
4
17
28
51
0 pts
1 - 3 pts
4 - 9 pts
10+ pts
Latin America
21
26
30
23
North America
29
29
24
18
Eastern Europe
15
31
26
27
Western Europe
15
22
29
34
Asia Pacific
19
30
34
18
Africa
4
17
28
51
Males
Female
15-19
210
150
20-24
340
205
25-29
395
300
30-34
460
360
35-39
600
405
40-44
800
500
45-49
1100
700
50-54
1600
1050
55-54
2300
1580
60-64
3340
2250
UN - Male
SA 1997
SA 2004
UN - Female
SA 1997
SA 2004
15-19
210
235
216
150
165
187
20-24
340
381
555
205
331
1085
25-29
395
625
1081
300
452
1985
30-34
460
817
2118
360
489
2267
35-39
600
916
2498
405
526
1890
40-44
800
1136
2765
500
615
1548
45-49
1100
1486
2744
700
800
1400
50-54
1600
2016
2979
1050
1116
1506
55-54
2300
2838
3270
1580
1626
1717
60-64
3340
3614
4146
2250
2201
2360
Stroke
ill-defined heart disease
Diabetes mellitus
Ischaemic heart disease
Hypertension
Nephritisnephrosis
Stroke
ill-defined heart disease
Diabetes mellitus
Ischaemic heart disease
Hypertension
Nephritisnephrosis
1999
34
345
20
248
14
10
1999
295
246
23
10
145
68
2000
36
362
218
249
152
112
2000
318
268
241
108
16
8
2001
35
372
22
25
15
125
2001
322
28
252
102
162
95
2002
405
298
24
26
147
126
2002
352
295
27
115
16
10
2003
425
32
245
285
152
15
2003
382
299
285
122
17
12
2004
39
325
255
26
165
16
2004
35
30
295
121
19
119
2005
36
328
265
26
15
162
2005
325
30
32
12
18
12
2006
35
336
27
258
155
16
2006
33
32
32
11
18
125
COPD
Asthma
Tracheabronchial lung cancer
Oesophageal cancer
prostate cancer
Cervical cancer
Breast cancer
1999
2001
12
135
10
26
2000
204
116
13
92
28
2001
222
131
133
96
27
2002
23
144
128
95
285
2003
243
149
124
94
29
2004
229
154
1255
87
29
2005
224
152
122
82
295
2006
224
136
116
75
3
COPD
Asthma
Tracheabronchial lung cancer
Oesophageal cancer
Prostate cancer
Cervical cancer
Breast cancer
1999
88
92
43
41
106
82
2000
96
95
4
43
11
81
2001
10
109
4
4
111
89
2002
10
116
4
4
112
85
2003
11
124
4
395
116
85
2004
102
1295
44
39
115
101
2005
105
128
42
38
1185
10
2006
10
12
42
32
1205
10
Based on this survey the researchers estimate that 109 of all South Africans over 2 years old were living with HIV in 2008 In 2002 and 2005 this figure was 114 and 108 respectively showing a degree of stabilisation Among those between 15 and 49 years old the estimated HIV prevalence was 169 in 2008 The survey found the prevalence among children aged 2-14 to be 25 down significantly since 2002 when prevalence was 56
Estimated HIV prevalence () among South Africans aged 2 years and older by age 2002-2008
Age
HIV +
HIV -
Children (2-14 years)
25
975
Youth (15-24 years)
87
913
Adults (25 and older)
168
832
(15-49 years)
169
831
Total (2 and older)
109
891
Estimated HIV prevalence among South Africans by age and sex 2008
Age
Male prevalence
Female prevalence
2-14
3
2
15-19
25
67
20-24
51
211
25-29
157
327
30-34
258
291
35-39
185
248
40-44
192
163
45-49
64
141
50-54
104
102
55-59
62
77
60+
35
18
Total
79
136
Among females HIV prevalence is highest in those between 25 and 29 years old among males the peak is in the group aged 30-34 years
HIV prevalence () by province 2002-2008
Province
2002
2005
2008
KwaZulu-Natal
117
165
158
Mpumalanga
141
152
154
Free State
149
126
126
North West
103
109
113
Gauteng
147
108
103
Eastern Cape
66
89
9
Limpopo
98
8
88
Northern Cape
84
54
59
Western Cape
107
19
38
National
114
108
109
The results of this study suggest that KwaZulu-Natal Mpumulanga and Free State have the highest HIV prevalence However the relatively small sample sizes may limit precision and in several cases the ranges of uncertainty overlap
HIV prevalence by population group 2008
Population group
Prevalence ()
African
136
864
White
03
997
Coloured
17
983
Indian
03
997
Studies of AIDS deaths
Latin America
Latin America
Latin America
Latin America
North America
North America
North America
North America
Eastern Europe
Eastern Europe
Eastern Europe
Eastern Europe
Western Europe
Western Europe
Western Europe
Western Europe
Asia Pacific
Asia Pacific
Asia Pacific
Asia Pacific
Africa
Africa
Africa
Africa
Country
Study starts
Subjects randomised
SubjectsStudy
USA
32
4385
13703125
Russia
20
788
394
Germany
19
1883
991052631579
UK
13
265
203846153846
South Africa
12
347
289166666667
Argentina
12
329
274166666667
Australia
11
195
177272727273
India
7
275
392857142857
Brazil
3
115
383333333333
Country
Initiation
Site activation
Recruitment
LOC setup
Unproductive sites
(Approval ndash FCI)
(FCI ndash FSFV)
(FSFV ndash LSFV)
(CPC ndash FSFV)
South Africa
19
38
153
357
21
Australia
117
63
401
239
11
Germany
16
37
401
224
21
UK
9
101
301
346
20
Russia
11
52
174
334
9
India
31
28
389
431
3
Argentina
94
67
288
32
13
Brazil
79
59
94
656
20
USA
44
31
149
26
Country
Pts Rand
Sites
Av CPP
Cost Per Country
Ethics Subm
Regulatory Fees
Add Inv Fees
CT Scan Total
Ethics + Regulatory
Total Regulatory Fees
South Africa
25
5
7250
181250
290
460
363
0
750
1113
Canada
18
4
832545
14985818
181818
0
0
1557576
181818
1818
Italy
7
2
10000
70000
2200
0
0
0
2200
2200
Germany
55
10
7000
385000
3000
0
0
12000
3000
3000
Peru
40
5
7000
280000
1500
1000
2000
60000
2500
4500
Poland
15
4
10000
150000
0
2500
2400
0
2500
4900
Spain
40
7
10500
420000
0
0
5450
0
0
5450
UK
12
4
13000
156000
0
0
5556
0
0
5556
Bulgaria
18
4
10000
180000
0
5000
1000
0
5000
6000
Taiwan
20
4
1179649
2359298
104167
313
5208
0
135467
6563
Czech Rep
10
2
10000
100000
1500
3000
3000
0
4500
7500
Greece
40
7
9000
360000
0
7500
0
0
7500
7500
Chile
15
4
10840
162600
1700
3600
3000
0
5300
8300
Belgium
25
6
12200
305000
3992
4332
0
0
8324
8324
Korea
30
3
10827
324802
1114
0
14324
0
1114
15438
Singapore
10
2
11565
115650
1750
0
17975
0
1750
19725
France
50
10
9000
450000
0
0
20000
0
0
20000
China
39
5
4978
194142
5224
0
39814
0
5224
40336
New Zealand
10
3
145244
145244
1973
0
43123
0
1973
45096
Israel
10
6
11140
111400
2060
3000
48400
16500
5060
53460
Brazil
30
6
10000
300000
2000
287356
5649202
0
487356
61366
Australia
24
6
40200
964800
0
500
82500
0
500
83000
23
543
109
532856799
3304716
26939
27700043
73748966
[1753EURO x 14 (ex rate) = $2454] [ $245416 hours=$153hour]
1095625
1095625
12271
1753
198089
198089
208514736842
South Africa
Canada
Italy
Germany
Peru
Poland
Spain
UK
Bulgaria
Taiwan
Czech Rep
Greece
Chile
Belgium
Korea
Singapore
France
China
New Zealand
Israel
Brazil
Australia
Country
Study starts
Subjects randomised
SubjectsStudy
USA
32
4385
13703125
Russia
20
788
394
Germany
19
1883
991052631579
UK
13
265
203846153846
South Africa
12
347
289166666667
Argentina
12
329
274166666667
Australia
11
195
177272727273
India
7
275
392857142857
Brazil
3
115
383333333333
Country
Initiation
Site activation
Recruitment
LOC setup
Unproductive sites
(Approval ndash FCI)
(FCI ndash FSFV)
(FSFV ndash LSFV)
(CPC ndash FSFV)
South Africa
19
38
153
357
21
Australia
117
63
401
239
11
Germany
16
37
401
224
21
UK
9
101
301
346
20
Russia
11
52
174
334
9
India
31
28
389
431
3
Argentina
94
67
288
32
13
Brazil
79
59
94
656
20
USA
44
31
149
26
Country
Pts Rand
Sites
Av CPP
Cost Per Country
Ethics Subm
Regulatory Fees
Add Inv Fees
CT Scan Total
Ethics + Regulatory
Total Regulatory Fees
China
39
5
4978
194142
522
0
39814
0
522
40336
Germany
55
10
7000
385000
3000
0
0
12000
3000
3000
Peru
40
5
7000
280000
1500
1000
2000
60000
2500
4500
South Africa
25
5
7250
181250
290
460
363
0
750
1113
Canada
18
4
8325
149858
1818
0
0
1557576
1818
1818
Greece
40
7
9000
360000
0
7500
0
0
7500
7500
France
50
10
9000
450000
0
0
20000
0
0
20000
Italy
7
2
10000
70000
2200
0
0
0
2200
2200
Poland
15
4
10000
150000
0
2500
2400
0
2500
4900
Bulgaria
18
4
10000
180000
0
5000
1000
0
5000
6000
Czech Rep
10
2
10000
100000
1500
3000
3000
0
4500
7500
Brazil
30
6
10000
300000
2000
2874
56492
0
4874
61366
Spain
40
7
10500
420000
0
0
5450
0
0
5450
Korea
30
3
10827
324802
1114
0
14324
0
1114
15438
Chile
15
4
10840
162600
1700
3600
3000
0
5300
8300
Israel
10
6
11140
111400
2060
3000
48400
16500
5060
53460
Singapore
10
2
11565
115650
1750
0
17975
0
1750
19725
Taiwan
20
4
11796
235930
1042
313
5208
0
1355
6563
Belgium
25
6
12200
305000
3992
4332
0
0
8324
8324
UK
12
4
13000
156000
0
0
5556
0
0
5556
New Zealand
10
3
14524
145244
1973
0
43123
0
1973
45096
Australia
24
6
40200
964800
0
500
82500
0
500
83000
23
543
109
5328568
33047
26939
277000
73748966
[1753EURO x 14 (ex rate) = $2454] [ $245416 hours=$153hour]
110
1095625
1227
1753
19809
20
21
China
Germany
Peru
South Africa
Canada
Greece
France
Italy
Poland
Bulgaria
Czech Rep
Brazil
Spain
Korea
Chile
Israel
Singapore
Taiwan
Belgium
UK
New Zealand
Australia
20
South Africa Leading Causes of Death
00
20
40
60
80
100
120
140 The ten leading underlying natural causes of death in South Africa (2009)
percentage
TB Flu amp Intest Heart Cereb Diab HIV HT Chron Immun Pneum Infect Other Vasc Mell Dis LRT Dis
Stats SA Rel P03093 Mortality and causes of death in South Africa 2009 Findings from death notification Nov-2011
Age group
TB 0-14 15-49 50-64 65+
Rank Rank Rank Rank
5 34 1 196 1 114 8 33
24
bull Well established research infrastructure bull Public and private sectors
28 teaching hospitals gt40000 tertiary care beds 140 private hospitals gt30000 beds 15 - 18 medical insurance
bull Large broad-based investigator database amp site networks bull Specialised Early Phase presence since 1970s bull GCPGLP and CLIA 88 compliant labs bull Specialist labs (biomarkers TB immunology
PKbioassay) bull Full support services (GMP-depots translations etc) bull Stringent ICH-compliant RAEC review policies
GCP is a legal requirement Informed Consent entrenched in Constitution
South Africa Advantages
25
bull Reliable (+) roads air links energy connectivity bull European Time bull Research language is English bull Inverse seasons bull Cost Currency bull Mobile-phone enabled obsessed population
South Africa Advantages
26
South Africa Track Record
bull Phase I-III data from SA included in hundreds of US amp European registration dossiers
bull Two entire NDA dossiers ndash rifapentine 1998 ndash tryptorelin (GnRH agonist) 2001) comprised SA data
bull 37 FDA inspections 1994-2009 1 OAI (27)
27
Therapeutic Indications
28
0
1
2
3
4
5
6
7
8
9
10
Belg
ium
Au
stria
Li
thua
nia
Can
ada
Luxe
mbo
urg
Mal
ta
Nor
way
Po
rtuga
l R
oman
ia
Rus
sia
Serb
ia
Swed
en
The
Net
herla
nds
USA
loca
l site
s U
SA c
entra
l site
C
zech
Rep
ublic
D
enm
ark
Esto
nia
Finl
and
Hun
gary
Ic
elan
d Ire
land
La
tvia
G
erm
any
Switz
erla
nd
Liec
hten
stei
n U
nite
d Ki
ngdo
m
Fran
ce
Italy
Au
stra
lia
Hon
g-Ko
ng
New
Zea
land
Si
ngap
ore
Taiw
an
Uga
nda
Pola
nd
Ukr
aine
C
hile
G
uate
mal
a Ja
pan
Isra
el
Slov
akia
Bu
lgar
ia
Gre
ece
Mal
aysi
a Ph
ilipp
ines
Pe
ru
Thai
land
Tu
rkey
Sl
oven
ia
Cos
ta R
ica
Mex
ico
Spai
n So
uth
Afric
a Ar
gent
ina
Sout
h Ko
rea
Col
ombi
a Pa
nam
a C
roat
ia
Indi
a Ve
nezu
ela
Braz
il C
hina
Mon
ths
Sout
h Afri
ca
Global Regulatory Review Timelines
Triclinium experience 2009-2015
Triclinium experience 2009 - 2015
29
Protocol release Country selection
Site Selection Collection of reg docs
Submission of RA application
EC application
Negotiate Site Contracts
EC Approvals
RA Approval amp Import permit
Site Initiation Import amp distribute drug
Import ancillary supplies Set up local labs
Set up EDC
Months
0
1
2
3
All EC approvals typically within 6
weeks
Site contracts signed within days
As soon as MCC approval obtained ALL sites can be initiated
Start-Up Activities in PARALLEL
GMO application (biologics)
30
0
2000
4000
6000
8000
10000
12000
14000C
hina
Ger
man
y
Per
u
Sou
th A
frica
Can
ada
Gre
ece
Fran
ce
Italy
Pol
and
Bul
garia
Cze
ch R
ep
Bra
zil
Spa
in
Kor
ea
Chi
le
Isra
el
Sin
gapo
re
Taiw
an
Bel
gium U
K
New
hellip
Aus
tralia
Source Bayer Presented SACRA Conference 2009
Aver
age
cost
per
pat
ient
(Eur
o)
Average Cost per Enrolled Participant
gt40000
Chart1
Average Cost Per Patient (Euro)
4978
7000
7000
7250
832545
9000
9000
10000
10000
10000
10000
10000
10500
10827
10840
11140
11565
1179649
12200
13000
145244
40200
Sheet1
Sheet2
Sheet2
Average Cost Per Patient (Euro)
Average Cost Per Patient
Sheet4
Ethics Subm
Regulatory Fees
Sheet3
Ethics + Regulatory
Total Ethics and Regulatory Fees
Add Inv Fees
Additional Investigator Application Fees
Total Regulatory Fees
Study starts
SubjectsStudy
31
Euro
0
10000
20000
30000
40000
50000
60000
70000
80000
90000S
outh
Afri
caC
anad
a
Italy
Ger
man
yP
eru
Pol
and
Spa
in UK
Bul
garia
Taiw
anC
zech
Rep
Gre
ece
Chi
leB
elgi
umK
orea
Sin
gapo
reFr
ance
Chi
naN
ew Z
eala
ndIs
rael
Bra
zil
Aus
tralia
Source Bayer Presented SACRA Conference 2009
Eur
os
Regulatory Application Fees
Chart1
Total Regulatory Fees
1113
181818
2200
3000
4500
4900
5450
5556
6000
656267
7500
7500
8300
8324
15438
19725
20000
403364
45096
53460
6136558
83000
Sheet1
Sheet2
Sheet2
Average Cost Per Patient (Euro)
Average Cost Per Patient
Sheet4
Ethics Subm
Regulatory Fees
Sheet3
Ethics + Regulatory
Total Ethics and Regulatory Fees
Add Inv Fees
Additional Investigator Application Fees
Total Regulatory Fees
Study starts
SubjectsStudy
32
SA Clinical Trial Regulatory Processes
Governed by SA-GCP and Declaration of Helsinki SA National Clinical Trials Register (SANCTR) Medicines Control Council (National Regulatory Authority)
o New protocols o Amendments o Additional sitesinvestigators
Ethics Committees (33 NHREC-registered) RegionalMunicipal DoH Export permits for bio samples (Nat Health Act 2003)
Clinical Trial Density Active sites million population
Nature Reviews Drug Discovery 7 13-14 (January 2008)
France 503
Germany 512 Canada
922
USA 1203
Czech Republic 776
553 sites
South Africa 119
757 sites
757 sites
533 sites
1084 sites
Argentina 269
Russia 77
China 04
India 07
34
Gateway to Africa
35
Why Africa bull Large accessible population relatively new to clinical trials
bull Experienced and willing investigators
bull Many clinical trial sites established by PDPs NGOs etc
bull Expanding therapeutic areas shifting burden of disease from
infectious to non-communicable diseases
bull Significantly improved infrastructure and accessibility
bull Rapidly evolving regulatory and ethics procedures
bull Potential for capacity building and sustainable clinical trial potential
36
Relatively young GCP culture Resident mentorships to build capacity Locations ndash accessibility for site monitoring Variable infrastructure esp electricity connectivity and
transportation Resourcing of public healthcare systems
Sub-Saharan Africa challenges
37
bull Second-largest continent
bull Spans NS and EW hemispheres
bull Second most populous continent 2014 estimate 1069 billion
bull Home to more than a quarter of the 196 independent countries
bull All 54 African countries are UN members
bull 39 urban population
bull 12 metropolitan areas gt 4m
bull gt 3000 distinct ethnicities
bull gt 2000 languages spoken
AFRICA hellip the true size
wwwcitypopulationdeworldAgglomerations 2015
38
SSV to SIV
0
5
10
15
20
25
30
35
40
45
Africa North America
Asia Pacific
Western Europe
Eastern Europe
Latin America
Source Quintiles South Africa SACRA Conference 2008
Wee
ks (A
vera
ge)
Start-Up Timelines
39
Region Median
Patients Site
of Sites
0 pts 1 - 3 pts 4 - 9 pts 10+ pts
Latin America 40 21 26 30 23
North America 30 29 29 24 18
Eastern Europe 60 15 31 26 27
Western Europe 40 15 22 29 34
Asia Pacific 40 19 30 34 18
Africa 100 4 17 28 51
Enrollment performance by region for 2008
Site Performance
Source Quintiles South Africa Presented SACRA Conference 2009
40
0 1 2 3 4 5 6 7 8 9
10
Latin America
North America
Eastern Europe
Western Europe
Asia Pacific
Africa
Num
ber o
f par
ticip
ants
MEDIAN site enrollment by region for 2008
Source Quintiles South Africa Presented SACRA Conference 2009
Site Performance
41
Source Quintiles South Africa Presented SACRA Conference 2009
s
ites
0
5
10
15
20
25
30
35
40
45
50
LatinAmerica
NorthAmerica
EasternEurope
WesternEurope
Asia Pacific Africa
0 pts
1 - 3 pts
4 - 9 pts
10+ pts
Enrollment performance by region for 2008
Site Performance
Chart1
0 pts
1 - 3 pts
4 - 9 pts
10+ pts
021
026
03
023
029
029
024
018
015
031
026
027
015
022
029
034
019
03
034
018
004
017
028
051
HIV
HIV
Resiratory amp Cancer
Male prevalence
Female prevalence
CVS
Overall death rates
Overall death rates
COPD
Asthma
Tracheabronchial lung cancer
Oesophageal cancer
prostate cancer
Trial metrics
COPD
Asthma
Tracheabronchial lung cancer
Oesophageal cancer
Prostate cancer
Cervical cancer
Breast cancer
Stroke
ill-defined heart disease
Diabetes mellitus
Ischaemic heart disease
Hypertension
Nephritisnephrosis
Stroke
ill-defined heart disease
Diabetes mellitus
Ischaemic heart disease
Hypertension
Nephritisnephrosis
Males
Female
UN - Male
SA 1997
SA 2004
UN - Female
SA 1997
SA 2004
0 pts
1 - 3 pts
4 - 9 pts
10+ pts
42
Source wwwclinicaltrialsgov 22-Oct-2010
Clinical trials registered across Africa
43
0
500
1000
1500
2000
2500
South Africa Kenya Malawi Tanzania Uganda Zambia
Selected African countries
2005
2010
2015
Source ClinTrialsgov
Trend 2005 - 2015
Source wwwclinicaltrialsgov 28-Aug-2015
44
AFRICA FOUND IN TRANSLATION
bull Vast treatment-naiumlve population bull Cost advantages (still) bull Diverse ethnicity amp morbidity bull Inverse seasonality bull Site capacity-building widely implemented bull Robust regulatory review bull Variable but generally good regulatory timelines bull Established GCP culture ndash sites and home-bred CROs
45
THANK YOU
Foliennummer 1
Triclinium A South African CRO
Collaboration with VPM SII
Vaccine Trials in SA 2015
Foliennummer 5
Foliennummer 6
Foliennummer 7
Foliennummer 8
Foliennummer 9
Foliennummer 10
Foliennummer 11
Foliennummer 12
Foliennummer 13
Foliennummer 14
Foliennummer 15
Foliennummer 16
Foliennummer 17
Distribution of clinical trial sites
Foliennummer 19
South Africa Leading Causes of Death
Foliennummer 21
Foliennummer 22
South Africa TB deaths by age group
Foliennummer 24
Foliennummer 25
Foliennummer 26
Foliennummer 27
Foliennummer 28
Foliennummer 29
Foliennummer 30
Foliennummer 31
SA Clinical Trial Regulatory Processes
Clinical Trial Density Active sites million population
Foliennummer 34
Why Africa
Foliennummer 36
AFRICA hellip the true size
SSV to SIV
Foliennummer 39
Foliennummer 40
Foliennummer 41
Foliennummer 42
Foliennummer 43
AFRICA FOUND IN TRANSLATION
Foliennummer 45
Region
Median
of Sites
Patients Site
0 pts
1 - 3 pts
4 - 9 pts
10+ pts
Latin America
4
21
26
30
23
North America
3
29
29
24
18
Eastern Europe
6
15
31
26
27
Western Europe
4
15
22
29
34
Asia Pacific
4
19
30
34
18
Africa
10
4
17
28
51
0 pts
1 - 3 pts
4 - 9 pts
10+ pts
Latin America
21
26
30
23
North America
29
29
24
18
Eastern Europe
15
31
26
27
Western Europe
15
22
29
34
Asia Pacific
19
30
34
18
Africa
4
17
28
51
Males
Female
15-19
210
150
20-24
340
205
25-29
395
300
30-34
460
360
35-39
600
405
40-44
800
500
45-49
1100
700
50-54
1600
1050
55-54
2300
1580
60-64
3340
2250
UN - Male
SA 1997
SA 2004
UN - Female
SA 1997
SA 2004
15-19
210
235
216
150
165
187
20-24
340
381
555
205
331
1085
25-29
395
625
1081
300
452
1985
30-34
460
817
2118
360
489
2267
35-39
600
916
2498
405
526
1890
40-44
800
1136
2765
500
615
1548
45-49
1100
1486
2744
700
800
1400
50-54
1600
2016
2979
1050
1116
1506
55-54
2300
2838
3270
1580
1626
1717
60-64
3340
3614
4146
2250
2201
2360
Stroke
ill-defined heart disease
Diabetes mellitus
Ischaemic heart disease
Hypertension
Nephritisnephrosis
Stroke
ill-defined heart disease
Diabetes mellitus
Ischaemic heart disease
Hypertension
Nephritisnephrosis
1999
34
345
20
248
14
10
1999
295
246
23
10
145
68
2000
36
362
218
249
152
112
2000
318
268
241
108
16
8
2001
35
372
22
25
15
125
2001
322
28
252
102
162
95
2002
405
298
24
26
147
126
2002
352
295
27
115
16
10
2003
425
32
245
285
152
15
2003
382
299
285
122
17
12
2004
39
325
255
26
165
16
2004
35
30
295
121
19
119
2005
36
328
265
26
15
162
2005
325
30
32
12
18
12
2006
35
336
27
258
155
16
2006
33
32
32
11
18
125
COPD
Asthma
Tracheabronchial lung cancer
Oesophageal cancer
prostate cancer
Cervical cancer
Breast cancer
1999
2001
12
135
10
26
2000
204
116
13
92
28
2001
222
131
133
96
27
2002
23
144
128
95
285
2003
243
149
124
94
29
2004
229
154
1255
87
29
2005
224
152
122
82
295
2006
224
136
116
75
3
COPD
Asthma
Tracheabronchial lung cancer
Oesophageal cancer
Prostate cancer
Cervical cancer
Breast cancer
1999
88
92
43
41
106
82
2000
96
95
4
43
11
81
2001
10
109
4
4
111
89
2002
10
116
4
4
112
85
2003
11
124
4
395
116
85
2004
102
1295
44
39
115
101
2005
105
128
42
38
1185
10
2006
10
12
42
32
1205
10
Based on this survey the researchers estimate that 109 of all South Africans over 2 years old were living with HIV in 2008 In 2002 and 2005 this figure was 114 and 108 respectively showing a degree of stabilisation Among those between 15 and 49 years old the estimated HIV prevalence was 169 in 2008 The survey found the prevalence among children aged 2-14 to be 25 down significantly since 2002 when prevalence was 56
Estimated HIV prevalence () among South Africans aged 2 years and older by age 2002-2008
Age
HIV +
HIV -
Children (2-14 years)
25
975
Youth (15-24 years)
87
913
Adults (25 and older)
168
832
(15-49 years)
169
831
Total (2 and older)
109
891
Estimated HIV prevalence among South Africans by age and sex 2008
Age
Male prevalence
Female prevalence
2-14
3
2
15-19
25
67
20-24
51
211
25-29
157
327
30-34
258
291
35-39
185
248
40-44
192
163
45-49
64
141
50-54
104
102
55-59
62
77
60+
35
18
Total
79
136
Among females HIV prevalence is highest in those between 25 and 29 years old among males the peak is in the group aged 30-34 years
HIV prevalence () by province 2002-2008
Province
2002
2005
2008
KwaZulu-Natal
117
165
158
Mpumalanga
141
152
154
Free State
149
126
126
North West
103
109
113
Gauteng
147
108
103
Eastern Cape
66
89
9
Limpopo
98
8
88
Northern Cape
84
54
59
Western Cape
107
19
38
National
114
108
109
The results of this study suggest that KwaZulu-Natal Mpumulanga and Free State have the highest HIV prevalence However the relatively small sample sizes may limit precision and in several cases the ranges of uncertainty overlap
HIV prevalence by population group 2008
Population group
Prevalence ()
African
136
864
White
03
997
Coloured
17
983
Indian
03
997
Studies of AIDS deaths
Latin America
Latin America
Latin America
Latin America
North America
North America
North America
North America
Eastern Europe
Eastern Europe
Eastern Europe
Eastern Europe
Western Europe
Western Europe
Western Europe
Western Europe
Asia Pacific
Asia Pacific
Asia Pacific
Asia Pacific
Africa
Africa
Africa
Africa
Country
Study starts
Subjects randomised
SubjectsStudy
USA
32
4385
13703125
Russia
20
788
394
Germany
19
1883
991052631579
UK
13
265
203846153846
South Africa
12
347
289166666667
Argentina
12
329
274166666667
Australia
11
195
177272727273
India
7
275
392857142857
Brazil
3
115
383333333333
Country
Initiation
Site activation
Recruitment
LOC setup
Unproductive sites
(Approval ndash FCI)
(FCI ndash FSFV)
(FSFV ndash LSFV)
(CPC ndash FSFV)
South Africa
19
38
153
357
21
Australia
117
63
401
239
11
Germany
16
37
401
224
21
UK
9
101
301
346
20
Russia
11
52
174
334
9
India
31
28
389
431
3
Argentina
94
67
288
32
13
Brazil
79
59
94
656
20
USA
44
31
149
26
Country
Pts Rand
Sites
Av CPP
Cost Per Country
Ethics Subm
Regulatory Fees
Add Inv Fees
CT Scan Total
Ethics + Regulatory
Total Regulatory Fees
South Africa
25
5
7250
181250
290
460
363
0
750
1113
Canada
18
4
832545
14985818
181818
0
0
1557576
181818
1818
Italy
7
2
10000
70000
2200
0
0
0
2200
2200
Germany
55
10
7000
385000
3000
0
0
12000
3000
3000
Peru
40
5
7000
280000
1500
1000
2000
60000
2500
4500
Poland
15
4
10000
150000
0
2500
2400
0
2500
4900
Spain
40
7
10500
420000
0
0
5450
0
0
5450
UK
12
4
13000
156000
0
0
5556
0
0
5556
Bulgaria
18
4
10000
180000
0
5000
1000
0
5000
6000
Taiwan
20
4
1179649
2359298
104167
313
5208
0
135467
6563
Czech Rep
10
2
10000
100000
1500
3000
3000
0
4500
7500
Greece
40
7
9000
360000
0
7500
0
0
7500
7500
Chile
15
4
10840
162600
1700
3600
3000
0
5300
8300
Belgium
25
6
12200
305000
3992
4332
0
0
8324
8324
Korea
30
3
10827
324802
1114
0
14324
0
1114
15438
Singapore
10
2
11565
115650
1750
0
17975
0
1750
19725
France
50
10
9000
450000
0
0
20000
0
0
20000
China
39
5
4978
194142
5224
0
39814
0
5224
40336
New Zealand
10
3
145244
145244
1973
0
43123
0
1973
45096
Israel
10
6
11140
111400
2060
3000
48400
16500
5060
53460
Brazil
30
6
10000
300000
2000
287356
5649202
0
487356
61366
Australia
24
6
40200
964800
0
500
82500
0
500
83000
23
543
109
532856799
3304716
26939
27700043
73748966
[1753EURO x 14 (ex rate) = $2454] [ $245416 hours=$153hour]
1095625
1095625
12271
1753
198089
198089
208514736842
South Africa
Canada
Italy
Germany
Peru
Poland
Spain
UK
Bulgaria
Taiwan
Czech Rep
Greece
Chile
Belgium
Korea
Singapore
France
China
New Zealand
Israel
Brazil
Australia
Country
Study starts
Subjects randomised
SubjectsStudy
USA
32
4385
13703125
Russia
20
788
394
Germany
19
1883
991052631579
UK
13
265
203846153846
South Africa
12
347
289166666667
Argentina
12
329
274166666667
Australia
11
195
177272727273
India
7
275
392857142857
Brazil
3
115
383333333333
Country
Initiation
Site activation
Recruitment
LOC setup
Unproductive sites
(Approval ndash FCI)
(FCI ndash FSFV)
(FSFV ndash LSFV)
(CPC ndash FSFV)
South Africa
19
38
153
357
21
Australia
117
63
401
239
11
Germany
16
37
401
224
21
UK
9
101
301
346
20
Russia
11
52
174
334
9
India
31
28
389
431
3
Argentina
94
67
288
32
13
Brazil
79
59
94
656
20
USA
44
31
149
26
Country
Pts Rand
Sites
Av CPP
Cost Per Country
Ethics Subm
Regulatory Fees
Add Inv Fees
CT Scan Total
Ethics + Regulatory
Total Regulatory Fees
China
39
5
4978
194142
522
0
39814
0
522
40336
Germany
55
10
7000
385000
3000
0
0
12000
3000
3000
Peru
40
5
7000
280000
1500
1000
2000
60000
2500
4500
South Africa
25
5
7250
181250
290
460
363
0
750
1113
Canada
18
4
8325
149858
1818
0
0
1557576
1818
1818
Greece
40
7
9000
360000
0
7500
0
0
7500
7500
France
50
10
9000
450000
0
0
20000
0
0
20000
Italy
7
2
10000
70000
2200
0
0
0
2200
2200
Poland
15
4
10000
150000
0
2500
2400
0
2500
4900
Bulgaria
18
4
10000
180000
0
5000
1000
0
5000
6000
Czech Rep
10
2
10000
100000
1500
3000
3000
0
4500
7500
Brazil
30
6
10000
300000
2000
2874
56492
0
4874
61366
Spain
40
7
10500
420000
0
0
5450
0
0
5450
Korea
30
3
10827
324802
1114
0
14324
0
1114
15438
Chile
15
4
10840
162600
1700
3600
3000
0
5300
8300
Israel
10
6
11140
111400
2060
3000
48400
16500
5060
53460
Singapore
10
2
11565
115650
1750
0
17975
0
1750
19725
Taiwan
20
4
11796
235930
1042
313
5208
0
1355
6563
Belgium
25
6
12200
305000
3992
4332
0
0
8324
8324
UK
12
4
13000
156000
0
0
5556
0
0
5556
New Zealand
10
3
14524
145244
1973
0
43123
0
1973
45096
Australia
24
6
40200
964800
0
500
82500
0
500
83000
23
543
109
5328568
33047
26939
277000
73748966
[1753EURO x 14 (ex rate) = $2454] [ $245416 hours=$153hour]
110
1095625
1227
1753
19809
20
21
China
Germany
Peru
South Africa
Canada
Greece
France
Italy
Poland
Bulgaria
Czech Rep
Brazil
Spain
Korea
Chile
Israel
Singapore
Taiwan
Belgium
UK
New Zealand
Australia
23
South Africa TB deaths by age group
Age group
TB Post-neonatal 1-4
Rank Rank
6 22 4 52
Stats SA Rel P03093 Mortality and causes of death in South Africa 2009 Findings from death notification Nov-2011
Age group
TB 0-14 15-49 50-64 65+
Rank Rank Rank Rank
5 34 1 196 1 114 8 33
24
bull Well established research infrastructure bull Public and private sectors
28 teaching hospitals gt40000 tertiary care beds 140 private hospitals gt30000 beds 15 - 18 medical insurance
bull Large broad-based investigator database amp site networks bull Specialised Early Phase presence since 1970s bull GCPGLP and CLIA 88 compliant labs bull Specialist labs (biomarkers TB immunology
PKbioassay) bull Full support services (GMP-depots translations etc) bull Stringent ICH-compliant RAEC review policies
GCP is a legal requirement Informed Consent entrenched in Constitution
South Africa Advantages
25
bull Reliable (+) roads air links energy connectivity bull European Time bull Research language is English bull Inverse seasons bull Cost Currency bull Mobile-phone enabled obsessed population
South Africa Advantages
26
South Africa Track Record
bull Phase I-III data from SA included in hundreds of US amp European registration dossiers
bull Two entire NDA dossiers ndash rifapentine 1998 ndash tryptorelin (GnRH agonist) 2001) comprised SA data
bull 37 FDA inspections 1994-2009 1 OAI (27)
27
Therapeutic Indications
28
0
1
2
3
4
5
6
7
8
9
10
Belg
ium
Au
stria
Li
thua
nia
Can
ada
Luxe
mbo
urg
Mal
ta
Nor
way
Po
rtuga
l R
oman
ia
Rus
sia
Serb
ia
Swed
en
The
Net
herla
nds
USA
loca
l site
s U
SA c
entra
l site
C
zech
Rep
ublic
D
enm
ark
Esto
nia
Finl
and
Hun
gary
Ic
elan
d Ire
land
La
tvia
G
erm
any
Switz
erla
nd
Liec
hten
stei
n U
nite
d Ki
ngdo
m
Fran
ce
Italy
Au
stra
lia
Hon
g-Ko
ng
New
Zea
land
Si
ngap
ore
Taiw
an
Uga
nda
Pola
nd
Ukr
aine
C
hile
G
uate
mal
a Ja
pan
Isra
el
Slov
akia
Bu
lgar
ia
Gre
ece
Mal
aysi
a Ph
ilipp
ines
Pe
ru
Thai
land
Tu
rkey
Sl
oven
ia
Cos
ta R
ica
Mex
ico
Spai
n So
uth
Afric
a Ar
gent
ina
Sout
h Ko
rea
Col
ombi
a Pa
nam
a C
roat
ia
Indi
a Ve
nezu
ela
Braz
il C
hina
Mon
ths
Sout
h Afri
ca
Global Regulatory Review Timelines
Triclinium experience 2009-2015
Triclinium experience 2009 - 2015
29
Protocol release Country selection
Site Selection Collection of reg docs
Submission of RA application
EC application
Negotiate Site Contracts
EC Approvals
RA Approval amp Import permit
Site Initiation Import amp distribute drug
Import ancillary supplies Set up local labs
Set up EDC
Months
0
1
2
3
All EC approvals typically within 6
weeks
Site contracts signed within days
As soon as MCC approval obtained ALL sites can be initiated
Start-Up Activities in PARALLEL
GMO application (biologics)
30
0
2000
4000
6000
8000
10000
12000
14000C
hina
Ger
man
y
Per
u
Sou
th A
frica
Can
ada
Gre
ece
Fran
ce
Italy
Pol
and
Bul
garia
Cze
ch R
ep
Bra
zil
Spa
in
Kor
ea
Chi
le
Isra
el
Sin
gapo
re
Taiw
an
Bel
gium U
K
New
hellip
Aus
tralia
Source Bayer Presented SACRA Conference 2009
Aver
age
cost
per
pat
ient
(Eur
o)
Average Cost per Enrolled Participant
gt40000
Chart1
Average Cost Per Patient (Euro)
4978
7000
7000
7250
832545
9000
9000
10000
10000
10000
10000
10000
10500
10827
10840
11140
11565
1179649
12200
13000
145244
40200
Sheet1
Sheet2
Sheet2
Average Cost Per Patient (Euro)
Average Cost Per Patient
Sheet4
Ethics Subm
Regulatory Fees
Sheet3
Ethics + Regulatory
Total Ethics and Regulatory Fees
Add Inv Fees
Additional Investigator Application Fees
Total Regulatory Fees
Study starts
SubjectsStudy
31
Euro
0
10000
20000
30000
40000
50000
60000
70000
80000
90000S
outh
Afri
caC
anad
a
Italy
Ger
man
yP
eru
Pol
and
Spa
in UK
Bul
garia
Taiw
anC
zech
Rep
Gre
ece
Chi
leB
elgi
umK
orea
Sin
gapo
reFr
ance
Chi
naN
ew Z
eala
ndIs
rael
Bra
zil
Aus
tralia
Source Bayer Presented SACRA Conference 2009
Eur
os
Regulatory Application Fees
Chart1
Total Regulatory Fees
1113
181818
2200
3000
4500
4900
5450
5556
6000
656267
7500
7500
8300
8324
15438
19725
20000
403364
45096
53460
6136558
83000
Sheet1
Sheet2
Sheet2
Average Cost Per Patient (Euro)
Average Cost Per Patient
Sheet4
Ethics Subm
Regulatory Fees
Sheet3
Ethics + Regulatory
Total Ethics and Regulatory Fees
Add Inv Fees
Additional Investigator Application Fees
Total Regulatory Fees
Study starts
SubjectsStudy
32
SA Clinical Trial Regulatory Processes
Governed by SA-GCP and Declaration of Helsinki SA National Clinical Trials Register (SANCTR) Medicines Control Council (National Regulatory Authority)
o New protocols o Amendments o Additional sitesinvestigators
Ethics Committees (33 NHREC-registered) RegionalMunicipal DoH Export permits for bio samples (Nat Health Act 2003)
Clinical Trial Density Active sites million population
Nature Reviews Drug Discovery 7 13-14 (January 2008)
France 503
Germany 512 Canada
922
USA 1203
Czech Republic 776
553 sites
South Africa 119
757 sites
757 sites
533 sites
1084 sites
Argentina 269
Russia 77
China 04
India 07
34
Gateway to Africa
35
Why Africa bull Large accessible population relatively new to clinical trials
bull Experienced and willing investigators
bull Many clinical trial sites established by PDPs NGOs etc
bull Expanding therapeutic areas shifting burden of disease from
infectious to non-communicable diseases
bull Significantly improved infrastructure and accessibility
bull Rapidly evolving regulatory and ethics procedures
bull Potential for capacity building and sustainable clinical trial potential
36
Relatively young GCP culture Resident mentorships to build capacity Locations ndash accessibility for site monitoring Variable infrastructure esp electricity connectivity and
transportation Resourcing of public healthcare systems
Sub-Saharan Africa challenges
37
bull Second-largest continent
bull Spans NS and EW hemispheres
bull Second most populous continent 2014 estimate 1069 billion
bull Home to more than a quarter of the 196 independent countries
bull All 54 African countries are UN members
bull 39 urban population
bull 12 metropolitan areas gt 4m
bull gt 3000 distinct ethnicities
bull gt 2000 languages spoken
AFRICA hellip the true size
wwwcitypopulationdeworldAgglomerations 2015
38
SSV to SIV
0
5
10
15
20
25
30
35
40
45
Africa North America
Asia Pacific
Western Europe
Eastern Europe
Latin America
Source Quintiles South Africa SACRA Conference 2008
Wee
ks (A
vera
ge)
Start-Up Timelines
39
Region Median
Patients Site
of Sites
0 pts 1 - 3 pts 4 - 9 pts 10+ pts
Latin America 40 21 26 30 23
North America 30 29 29 24 18
Eastern Europe 60 15 31 26 27
Western Europe 40 15 22 29 34
Asia Pacific 40 19 30 34 18
Africa 100 4 17 28 51
Enrollment performance by region for 2008
Site Performance
Source Quintiles South Africa Presented SACRA Conference 2009
40
0 1 2 3 4 5 6 7 8 9
10
Latin America
North America
Eastern Europe
Western Europe
Asia Pacific
Africa
Num
ber o
f par
ticip
ants
MEDIAN site enrollment by region for 2008
Source Quintiles South Africa Presented SACRA Conference 2009
Site Performance
41
Source Quintiles South Africa Presented SACRA Conference 2009
s
ites
0
5
10
15
20
25
30
35
40
45
50
LatinAmerica
NorthAmerica
EasternEurope
WesternEurope
Asia Pacific Africa
0 pts
1 - 3 pts
4 - 9 pts
10+ pts
Enrollment performance by region for 2008
Site Performance
Chart1
0 pts
1 - 3 pts
4 - 9 pts
10+ pts
021
026
03
023
029
029
024
018
015
031
026
027
015
022
029
034
019
03
034
018
004
017
028
051
HIV
HIV
Resiratory amp Cancer
Male prevalence
Female prevalence
CVS
Overall death rates
Overall death rates
COPD
Asthma
Tracheabronchial lung cancer
Oesophageal cancer
prostate cancer
Trial metrics
COPD
Asthma
Tracheabronchial lung cancer
Oesophageal cancer
Prostate cancer
Cervical cancer
Breast cancer
Stroke
ill-defined heart disease
Diabetes mellitus
Ischaemic heart disease
Hypertension
Nephritisnephrosis
Stroke
ill-defined heart disease
Diabetes mellitus
Ischaemic heart disease
Hypertension
Nephritisnephrosis
Males
Female
UN - Male
SA 1997
SA 2004
UN - Female
SA 1997
SA 2004
0 pts
1 - 3 pts
4 - 9 pts
10+ pts
42
Source wwwclinicaltrialsgov 22-Oct-2010
Clinical trials registered across Africa
43
0
500
1000
1500
2000
2500
South Africa Kenya Malawi Tanzania Uganda Zambia
Selected African countries
2005
2010
2015
Source ClinTrialsgov
Trend 2005 - 2015
Source wwwclinicaltrialsgov 28-Aug-2015
44
AFRICA FOUND IN TRANSLATION
bull Vast treatment-naiumlve population bull Cost advantages (still) bull Diverse ethnicity amp morbidity bull Inverse seasonality bull Site capacity-building widely implemented bull Robust regulatory review bull Variable but generally good regulatory timelines bull Established GCP culture ndash sites and home-bred CROs
45
THANK YOU
Foliennummer 1
Triclinium A South African CRO
Collaboration with VPM SII
Vaccine Trials in SA 2015
Foliennummer 5
Foliennummer 6
Foliennummer 7
Foliennummer 8
Foliennummer 9
Foliennummer 10
Foliennummer 11
Foliennummer 12
Foliennummer 13
Foliennummer 14
Foliennummer 15
Foliennummer 16
Foliennummer 17
Distribution of clinical trial sites
Foliennummer 19
South Africa Leading Causes of Death
Foliennummer 21
Foliennummer 22
South Africa TB deaths by age group
Foliennummer 24
Foliennummer 25
Foliennummer 26
Foliennummer 27
Foliennummer 28
Foliennummer 29
Foliennummer 30
Foliennummer 31
SA Clinical Trial Regulatory Processes
Clinical Trial Density Active sites million population
Foliennummer 34
Why Africa
Foliennummer 36
AFRICA hellip the true size
SSV to SIV
Foliennummer 39
Foliennummer 40
Foliennummer 41
Foliennummer 42
Foliennummer 43
AFRICA FOUND IN TRANSLATION
Foliennummer 45
Region
Median
of Sites
Patients Site
0 pts
1 - 3 pts
4 - 9 pts
10+ pts
Latin America
4
21
26
30
23
North America
3
29
29
24
18
Eastern Europe
6
15
31
26
27
Western Europe
4
15
22
29
34
Asia Pacific
4
19
30
34
18
Africa
10
4
17
28
51
0 pts
1 - 3 pts
4 - 9 pts
10+ pts
Latin America
21
26
30
23
North America
29
29
24
18
Eastern Europe
15
31
26
27
Western Europe
15
22
29
34
Asia Pacific
19
30
34
18
Africa
4
17
28
51
Males
Female
15-19
210
150
20-24
340
205
25-29
395
300
30-34
460
360
35-39
600
405
40-44
800
500
45-49
1100
700
50-54
1600
1050
55-54
2300
1580
60-64
3340
2250
UN - Male
SA 1997
SA 2004
UN - Female
SA 1997
SA 2004
15-19
210
235
216
150
165
187
20-24
340
381
555
205
331
1085
25-29
395
625
1081
300
452
1985
30-34
460
817
2118
360
489
2267
35-39
600
916
2498
405
526
1890
40-44
800
1136
2765
500
615
1548
45-49
1100
1486
2744
700
800
1400
50-54
1600
2016
2979
1050
1116
1506
55-54
2300
2838
3270
1580
1626
1717
60-64
3340
3614
4146
2250
2201
2360
Stroke
ill-defined heart disease
Diabetes mellitus
Ischaemic heart disease
Hypertension
Nephritisnephrosis
Stroke
ill-defined heart disease
Diabetes mellitus
Ischaemic heart disease
Hypertension
Nephritisnephrosis
1999
34
345
20
248
14
10
1999
295
246
23
10
145
68
2000
36
362
218
249
152
112
2000
318
268
241
108
16
8
2001
35
372
22
25
15
125
2001
322
28
252
102
162
95
2002
405
298
24
26
147
126
2002
352
295
27
115
16
10
2003
425
32
245
285
152
15
2003
382
299
285
122
17
12
2004
39
325
255
26
165
16
2004
35
30
295
121
19
119
2005
36
328
265
26
15
162
2005
325
30
32
12
18
12
2006
35
336
27
258
155
16
2006
33
32
32
11
18
125
COPD
Asthma
Tracheabronchial lung cancer
Oesophageal cancer
prostate cancer
Cervical cancer
Breast cancer
1999
2001
12
135
10
26
2000
204
116
13
92
28
2001
222
131
133
96
27
2002
23
144
128
95
285
2003
243
149
124
94
29
2004
229
154
1255
87
29
2005
224
152
122
82
295
2006
224
136
116
75
3
COPD
Asthma
Tracheabronchial lung cancer
Oesophageal cancer
Prostate cancer
Cervical cancer
Breast cancer
1999
88
92
43
41
106
82
2000
96
95
4
43
11
81
2001
10
109
4
4
111
89
2002
10
116
4
4
112
85
2003
11
124
4
395
116
85
2004
102
1295
44
39
115
101
2005
105
128
42
38
1185
10
2006
10
12
42
32
1205
10
Based on this survey the researchers estimate that 109 of all South Africans over 2 years old were living with HIV in 2008 In 2002 and 2005 this figure was 114 and 108 respectively showing a degree of stabilisation Among those between 15 and 49 years old the estimated HIV prevalence was 169 in 2008 The survey found the prevalence among children aged 2-14 to be 25 down significantly since 2002 when prevalence was 56
Estimated HIV prevalence () among South Africans aged 2 years and older by age 2002-2008
Age
HIV +
HIV -
Children (2-14 years)
25
975
Youth (15-24 years)
87
913
Adults (25 and older)
168
832
(15-49 years)
169
831
Total (2 and older)
109
891
Estimated HIV prevalence among South Africans by age and sex 2008
Age
Male prevalence
Female prevalence
2-14
3
2
15-19
25
67
20-24
51
211
25-29
157
327
30-34
258
291
35-39
185
248
40-44
192
163
45-49
64
141
50-54
104
102
55-59
62
77
60+
35
18
Total
79
136
Among females HIV prevalence is highest in those between 25 and 29 years old among males the peak is in the group aged 30-34 years
HIV prevalence () by province 2002-2008
Province
2002
2005
2008
KwaZulu-Natal
117
165
158
Mpumalanga
141
152
154
Free State
149
126
126
North West
103
109
113
Gauteng
147
108
103
Eastern Cape
66
89
9
Limpopo
98
8
88
Northern Cape
84
54
59
Western Cape
107
19
38
National
114
108
109
The results of this study suggest that KwaZulu-Natal Mpumulanga and Free State have the highest HIV prevalence However the relatively small sample sizes may limit precision and in several cases the ranges of uncertainty overlap
HIV prevalence by population group 2008
Population group
Prevalence ()
African
136
864
White
03
997
Coloured
17
983
Indian
03
997
Studies of AIDS deaths
Latin America
Latin America
Latin America
Latin America
North America
North America
North America
North America
Eastern Europe
Eastern Europe
Eastern Europe
Eastern Europe
Western Europe
Western Europe
Western Europe
Western Europe
Asia Pacific
Asia Pacific
Asia Pacific
Asia Pacific
Africa
Africa
Africa
Africa
Country
Study starts
Subjects randomised
SubjectsStudy
USA
32
4385
13703125
Russia
20
788
394
Germany
19
1883
991052631579
UK
13
265
203846153846
South Africa
12
347
289166666667
Argentina
12
329
274166666667
Australia
11
195
177272727273
India
7
275
392857142857
Brazil
3
115
383333333333
Country
Initiation
Site activation
Recruitment
LOC setup
Unproductive sites
(Approval ndash FCI)
(FCI ndash FSFV)
(FSFV ndash LSFV)
(CPC ndash FSFV)
South Africa
19
38
153
357
21
Australia
117
63
401
239
11
Germany
16
37
401
224
21
UK
9
101
301
346
20
Russia
11
52
174
334
9
India
31
28
389
431
3
Argentina
94
67
288
32
13
Brazil
79
59
94
656
20
USA
44
31
149
26
Country
Pts Rand
Sites
Av CPP
Cost Per Country
Ethics Subm
Regulatory Fees
Add Inv Fees
CT Scan Total
Ethics + Regulatory
Total Regulatory Fees
South Africa
25
5
7250
181250
290
460
363
0
750
1113
Canada
18
4
832545
14985818
181818
0
0
1557576
181818
1818
Italy
7
2
10000
70000
2200
0
0
0
2200
2200
Germany
55
10
7000
385000
3000
0
0
12000
3000
3000
Peru
40
5
7000
280000
1500
1000
2000
60000
2500
4500
Poland
15
4
10000
150000
0
2500
2400
0
2500
4900
Spain
40
7
10500
420000
0
0
5450
0
0
5450
UK
12
4
13000
156000
0
0
5556
0
0
5556
Bulgaria
18
4
10000
180000
0
5000
1000
0
5000
6000
Taiwan
20
4
1179649
2359298
104167
313
5208
0
135467
6563
Czech Rep
10
2
10000
100000
1500
3000
3000
0
4500
7500
Greece
40
7
9000
360000
0
7500
0
0
7500
7500
Chile
15
4
10840
162600
1700
3600
3000
0
5300
8300
Belgium
25
6
12200
305000
3992
4332
0
0
8324
8324
Korea
30
3
10827
324802
1114
0
14324
0
1114
15438
Singapore
10
2
11565
115650
1750
0
17975
0
1750
19725
France
50
10
9000
450000
0
0
20000
0
0
20000
China
39
5
4978
194142
5224
0
39814
0
5224
40336
New Zealand
10
3
145244
145244
1973
0
43123
0
1973
45096
Israel
10
6
11140
111400
2060
3000
48400
16500
5060
53460
Brazil
30
6
10000
300000
2000
287356
5649202
0
487356
61366
Australia
24
6
40200
964800
0
500
82500
0
500
83000
23
543
109
532856799
3304716
26939
27700043
73748966
[1753EURO x 14 (ex rate) = $2454] [ $245416 hours=$153hour]
1095625
1095625
12271
1753
198089
198089
208514736842
South Africa
Canada
Italy
Germany
Peru
Poland
Spain
UK
Bulgaria
Taiwan
Czech Rep
Greece
Chile
Belgium
Korea
Singapore
France
China
New Zealand
Israel
Brazil
Australia
Country
Study starts
Subjects randomised
SubjectsStudy
USA
32
4385
13703125
Russia
20
788
394
Germany
19
1883
991052631579
UK
13
265
203846153846
South Africa
12
347
289166666667
Argentina
12
329
274166666667
Australia
11
195
177272727273
India
7
275
392857142857
Brazil
3
115
383333333333
Country
Initiation
Site activation
Recruitment
LOC setup
Unproductive sites
(Approval ndash FCI)
(FCI ndash FSFV)
(FSFV ndash LSFV)
(CPC ndash FSFV)
South Africa
19
38
153
357
21
Australia
117
63
401
239
11
Germany
16
37
401
224
21
UK
9
101
301
346
20
Russia
11
52
174
334
9
India
31
28
389
431
3
Argentina
94
67
288
32
13
Brazil
79
59
94
656
20
USA
44
31
149
26
Country
Pts Rand
Sites
Av CPP
Cost Per Country
Ethics Subm
Regulatory Fees
Add Inv Fees
CT Scan Total
Ethics + Regulatory
Total Regulatory Fees
China
39
5
4978
194142
522
0
39814
0
522
40336
Germany
55
10
7000
385000
3000
0
0
12000
3000
3000
Peru
40
5
7000
280000
1500
1000
2000
60000
2500
4500
South Africa
25
5
7250
181250
290
460
363
0
750
1113
Canada
18
4
8325
149858
1818
0
0
1557576
1818
1818
Greece
40
7
9000
360000
0
7500
0
0
7500
7500
France
50
10
9000
450000
0
0
20000
0
0
20000
Italy
7
2
10000
70000
2200
0
0
0
2200
2200
Poland
15
4
10000
150000
0
2500
2400
0
2500
4900
Bulgaria
18
4
10000
180000
0
5000
1000
0
5000
6000
Czech Rep
10
2
10000
100000
1500
3000
3000
0
4500
7500
Brazil
30
6
10000
300000
2000
2874
56492
0
4874
61366
Spain
40
7
10500
420000
0
0
5450
0
0
5450
Korea
30
3
10827
324802
1114
0
14324
0
1114
15438
Chile
15
4
10840
162600
1700
3600
3000
0
5300
8300
Israel
10
6
11140
111400
2060
3000
48400
16500
5060
53460
Singapore
10
2
11565
115650
1750
0
17975
0
1750
19725
Taiwan
20
4
11796
235930
1042
313
5208
0
1355
6563
Belgium
25
6
12200
305000
3992
4332
0
0
8324
8324
UK
12
4
13000
156000
0
0
5556
0
0
5556
New Zealand
10
3
14524
145244
1973
0
43123
0
1973
45096
Australia
24
6
40200
964800
0
500
82500
0
500
83000
23
543
109
5328568
33047
26939
277000
73748966
[1753EURO x 14 (ex rate) = $2454] [ $245416 hours=$153hour]
110
1095625
1227
1753
19809
20
21
China
Germany
Peru
South Africa
Canada
Greece
France
Italy
Poland
Bulgaria
Czech Rep
Brazil
Spain
Korea
Chile
Israel
Singapore
Taiwan
Belgium
UK
New Zealand
Australia
24
bull Well established research infrastructure bull Public and private sectors
28 teaching hospitals gt40000 tertiary care beds 140 private hospitals gt30000 beds 15 - 18 medical insurance
bull Large broad-based investigator database amp site networks bull Specialised Early Phase presence since 1970s bull GCPGLP and CLIA 88 compliant labs bull Specialist labs (biomarkers TB immunology
PKbioassay) bull Full support services (GMP-depots translations etc) bull Stringent ICH-compliant RAEC review policies
GCP is a legal requirement Informed Consent entrenched in Constitution
South Africa Advantages
25
bull Reliable (+) roads air links energy connectivity bull European Time bull Research language is English bull Inverse seasons bull Cost Currency bull Mobile-phone enabled obsessed population
South Africa Advantages
26
South Africa Track Record
bull Phase I-III data from SA included in hundreds of US amp European registration dossiers
bull Two entire NDA dossiers ndash rifapentine 1998 ndash tryptorelin (GnRH agonist) 2001) comprised SA data
bull 37 FDA inspections 1994-2009 1 OAI (27)
27
Therapeutic Indications
28
0
1
2
3
4
5
6
7
8
9
10
Belg
ium
Au
stria
Li
thua
nia
Can
ada
Luxe
mbo
urg
Mal
ta
Nor
way
Po
rtuga
l R
oman
ia
Rus
sia
Serb
ia
Swed
en
The
Net
herla
nds
USA
loca
l site
s U
SA c
entra
l site
C
zech
Rep
ublic
D
enm
ark
Esto
nia
Finl
and
Hun
gary
Ic
elan
d Ire
land
La
tvia
G
erm
any
Switz
erla
nd
Liec
hten
stei
n U
nite
d Ki
ngdo
m
Fran
ce
Italy
Au
stra
lia
Hon
g-Ko
ng
New
Zea
land
Si
ngap
ore
Taiw
an
Uga
nda
Pola
nd
Ukr
aine
C
hile
G
uate
mal
a Ja
pan
Isra
el
Slov
akia
Bu
lgar
ia
Gre
ece
Mal
aysi
a Ph
ilipp
ines
Pe
ru
Thai
land
Tu
rkey
Sl
oven
ia
Cos
ta R
ica
Mex
ico
Spai
n So
uth
Afric
a Ar
gent
ina
Sout
h Ko
rea
Col
ombi
a Pa
nam
a C
roat
ia
Indi
a Ve
nezu
ela
Braz
il C
hina
Mon
ths
Sout
h Afri
ca
Global Regulatory Review Timelines
Triclinium experience 2009-2015
Triclinium experience 2009 - 2015
29
Protocol release Country selection
Site Selection Collection of reg docs
Submission of RA application
EC application
Negotiate Site Contracts
EC Approvals
RA Approval amp Import permit
Site Initiation Import amp distribute drug
Import ancillary supplies Set up local labs
Set up EDC
Months
0
1
2
3
All EC approvals typically within 6
weeks
Site contracts signed within days
As soon as MCC approval obtained ALL sites can be initiated
Start-Up Activities in PARALLEL
GMO application (biologics)
30
0
2000
4000
6000
8000
10000
12000
14000C
hina
Ger
man
y
Per
u
Sou
th A
frica
Can
ada
Gre
ece
Fran
ce
Italy
Pol
and
Bul
garia
Cze
ch R
ep
Bra
zil
Spa
in
Kor
ea
Chi
le
Isra
el
Sin
gapo
re
Taiw
an
Bel
gium U
K
New
hellip
Aus
tralia
Source Bayer Presented SACRA Conference 2009
Aver
age
cost
per
pat
ient
(Eur
o)
Average Cost per Enrolled Participant
gt40000
Chart1
Average Cost Per Patient (Euro)
4978
7000
7000
7250
832545
9000
9000
10000
10000
10000
10000
10000
10500
10827
10840
11140
11565
1179649
12200
13000
145244
40200
Sheet1
Sheet2
Sheet2
Average Cost Per Patient (Euro)
Average Cost Per Patient
Sheet4
Ethics Subm
Regulatory Fees
Sheet3
Ethics + Regulatory
Total Ethics and Regulatory Fees
Add Inv Fees
Additional Investigator Application Fees
Total Regulatory Fees
Study starts
SubjectsStudy
31
Euro
0
10000
20000
30000
40000
50000
60000
70000
80000
90000S
outh
Afri
caC
anad
a
Italy
Ger
man
yP
eru
Pol
and
Spa
in UK
Bul
garia
Taiw
anC
zech
Rep
Gre
ece
Chi
leB
elgi
umK
orea
Sin
gapo
reFr
ance
Chi
naN
ew Z
eala
ndIs
rael
Bra
zil
Aus
tralia
Source Bayer Presented SACRA Conference 2009
Eur
os
Regulatory Application Fees
Chart1
Total Regulatory Fees
1113
181818
2200
3000
4500
4900
5450
5556
6000
656267
7500
7500
8300
8324
15438
19725
20000
403364
45096
53460
6136558
83000
Sheet1
Sheet2
Sheet2
Average Cost Per Patient (Euro)
Average Cost Per Patient
Sheet4
Ethics Subm
Regulatory Fees
Sheet3
Ethics + Regulatory
Total Ethics and Regulatory Fees
Add Inv Fees
Additional Investigator Application Fees
Total Regulatory Fees
Study starts
SubjectsStudy
32
SA Clinical Trial Regulatory Processes
Governed by SA-GCP and Declaration of Helsinki SA National Clinical Trials Register (SANCTR) Medicines Control Council (National Regulatory Authority)
o New protocols o Amendments o Additional sitesinvestigators
Ethics Committees (33 NHREC-registered) RegionalMunicipal DoH Export permits for bio samples (Nat Health Act 2003)
Clinical Trial Density Active sites million population
Nature Reviews Drug Discovery 7 13-14 (January 2008)
France 503
Germany 512 Canada
922
USA 1203
Czech Republic 776
553 sites
South Africa 119
757 sites
757 sites
533 sites
1084 sites
Argentina 269
Russia 77
China 04
India 07
34
Gateway to Africa
35
Why Africa bull Large accessible population relatively new to clinical trials
bull Experienced and willing investigators
bull Many clinical trial sites established by PDPs NGOs etc
bull Expanding therapeutic areas shifting burden of disease from
infectious to non-communicable diseases
bull Significantly improved infrastructure and accessibility
bull Rapidly evolving regulatory and ethics procedures
bull Potential for capacity building and sustainable clinical trial potential
36
Relatively young GCP culture Resident mentorships to build capacity Locations ndash accessibility for site monitoring Variable infrastructure esp electricity connectivity and
transportation Resourcing of public healthcare systems
Sub-Saharan Africa challenges
37
bull Second-largest continent
bull Spans NS and EW hemispheres
bull Second most populous continent 2014 estimate 1069 billion
bull Home to more than a quarter of the 196 independent countries
bull All 54 African countries are UN members
bull 39 urban population
bull 12 metropolitan areas gt 4m
bull gt 3000 distinct ethnicities
bull gt 2000 languages spoken
AFRICA hellip the true size
wwwcitypopulationdeworldAgglomerations 2015
38
SSV to SIV
0
5
10
15
20
25
30
35
40
45
Africa North America
Asia Pacific
Western Europe
Eastern Europe
Latin America
Source Quintiles South Africa SACRA Conference 2008
Wee
ks (A
vera
ge)
Start-Up Timelines
39
Region Median
Patients Site
of Sites
0 pts 1 - 3 pts 4 - 9 pts 10+ pts
Latin America 40 21 26 30 23
North America 30 29 29 24 18
Eastern Europe 60 15 31 26 27
Western Europe 40 15 22 29 34
Asia Pacific 40 19 30 34 18
Africa 100 4 17 28 51
Enrollment performance by region for 2008
Site Performance
Source Quintiles South Africa Presented SACRA Conference 2009
40
0 1 2 3 4 5 6 7 8 9
10
Latin America
North America
Eastern Europe
Western Europe
Asia Pacific
Africa
Num
ber o
f par
ticip
ants
MEDIAN site enrollment by region for 2008
Source Quintiles South Africa Presented SACRA Conference 2009
Site Performance
41
Source Quintiles South Africa Presented SACRA Conference 2009
s
ites
0
5
10
15
20
25
30
35
40
45
50
LatinAmerica
NorthAmerica
EasternEurope
WesternEurope
Asia Pacific Africa
0 pts
1 - 3 pts
4 - 9 pts
10+ pts
Enrollment performance by region for 2008
Site Performance
Chart1
0 pts
1 - 3 pts
4 - 9 pts
10+ pts
021
026
03
023
029
029
024
018
015
031
026
027
015
022
029
034
019
03
034
018
004
017
028
051
HIV
HIV
Resiratory amp Cancer
Male prevalence
Female prevalence
CVS
Overall death rates
Overall death rates
COPD
Asthma
Tracheabronchial lung cancer
Oesophageal cancer
prostate cancer
Trial metrics
COPD
Asthma
Tracheabronchial lung cancer
Oesophageal cancer
Prostate cancer
Cervical cancer
Breast cancer
Stroke
ill-defined heart disease
Diabetes mellitus
Ischaemic heart disease
Hypertension
Nephritisnephrosis
Stroke
ill-defined heart disease
Diabetes mellitus
Ischaemic heart disease
Hypertension
Nephritisnephrosis
Males
Female
UN - Male
SA 1997
SA 2004
UN - Female
SA 1997
SA 2004
0 pts
1 - 3 pts
4 - 9 pts
10+ pts
42
Source wwwclinicaltrialsgov 22-Oct-2010
Clinical trials registered across Africa
43
0
500
1000
1500
2000
2500
South Africa Kenya Malawi Tanzania Uganda Zambia
Selected African countries
2005
2010
2015
Source ClinTrialsgov
Trend 2005 - 2015
Source wwwclinicaltrialsgov 28-Aug-2015
44
AFRICA FOUND IN TRANSLATION
bull Vast treatment-naiumlve population bull Cost advantages (still) bull Diverse ethnicity amp morbidity bull Inverse seasonality bull Site capacity-building widely implemented bull Robust regulatory review bull Variable but generally good regulatory timelines bull Established GCP culture ndash sites and home-bred CROs
45
THANK YOU
Foliennummer 1
Triclinium A South African CRO
Collaboration with VPM SII
Vaccine Trials in SA 2015
Foliennummer 5
Foliennummer 6
Foliennummer 7
Foliennummer 8
Foliennummer 9
Foliennummer 10
Foliennummer 11
Foliennummer 12
Foliennummer 13
Foliennummer 14
Foliennummer 15
Foliennummer 16
Foliennummer 17
Distribution of clinical trial sites
Foliennummer 19
South Africa Leading Causes of Death
Foliennummer 21
Foliennummer 22
South Africa TB deaths by age group
Foliennummer 24
Foliennummer 25
Foliennummer 26
Foliennummer 27
Foliennummer 28
Foliennummer 29
Foliennummer 30
Foliennummer 31
SA Clinical Trial Regulatory Processes
Clinical Trial Density Active sites million population
Foliennummer 34
Why Africa
Foliennummer 36
AFRICA hellip the true size
SSV to SIV
Foliennummer 39
Foliennummer 40
Foliennummer 41
Foliennummer 42
Foliennummer 43
AFRICA FOUND IN TRANSLATION
Foliennummer 45
Region
Median
of Sites
Patients Site
0 pts
1 - 3 pts
4 - 9 pts
10+ pts
Latin America
4
21
26
30
23
North America
3
29
29
24
18
Eastern Europe
6
15
31
26
27
Western Europe
4
15
22
29
34
Asia Pacific
4
19
30
34
18
Africa
10
4
17
28
51
0 pts
1 - 3 pts
4 - 9 pts
10+ pts
Latin America
21
26
30
23
North America
29
29
24
18
Eastern Europe
15
31
26
27
Western Europe
15
22
29
34
Asia Pacific
19
30
34
18
Africa
4
17
28
51
Males
Female
15-19
210
150
20-24
340
205
25-29
395
300
30-34
460
360
35-39
600
405
40-44
800
500
45-49
1100
700
50-54
1600
1050
55-54
2300
1580
60-64
3340
2250
UN - Male
SA 1997
SA 2004
UN - Female
SA 1997
SA 2004
15-19
210
235
216
150
165
187
20-24
340
381
555
205
331
1085
25-29
395
625
1081
300
452
1985
30-34
460
817
2118
360
489
2267
35-39
600
916
2498
405
526
1890
40-44
800
1136
2765
500
615
1548
45-49
1100
1486
2744
700
800
1400
50-54
1600
2016
2979
1050
1116
1506
55-54
2300
2838
3270
1580
1626
1717
60-64
3340
3614
4146
2250
2201
2360
Stroke
ill-defined heart disease
Diabetes mellitus
Ischaemic heart disease
Hypertension
Nephritisnephrosis
Stroke
ill-defined heart disease
Diabetes mellitus
Ischaemic heart disease
Hypertension
Nephritisnephrosis
1999
34
345
20
248
14
10
1999
295
246
23
10
145
68
2000
36
362
218
249
152
112
2000
318
268
241
108
16
8
2001
35
372
22
25
15
125
2001
322
28
252
102
162
95
2002
405
298
24
26
147
126
2002
352
295
27
115
16
10
2003
425
32
245
285
152
15
2003
382
299
285
122
17
12
2004
39
325
255
26
165
16
2004
35
30
295
121
19
119
2005
36
328
265
26
15
162
2005
325
30
32
12
18
12
2006
35
336
27
258
155
16
2006
33
32
32
11
18
125
COPD
Asthma
Tracheabronchial lung cancer
Oesophageal cancer
prostate cancer
Cervical cancer
Breast cancer
1999
2001
12
135
10
26
2000
204
116
13
92
28
2001
222
131
133
96
27
2002
23
144
128
95
285
2003
243
149
124
94
29
2004
229
154
1255
87
29
2005
224
152
122
82
295
2006
224
136
116
75
3
COPD
Asthma
Tracheabronchial lung cancer
Oesophageal cancer
Prostate cancer
Cervical cancer
Breast cancer
1999
88
92
43
41
106
82
2000
96
95
4
43
11
81
2001
10
109
4
4
111
89
2002
10
116
4
4
112
85
2003
11
124
4
395
116
85
2004
102
1295
44
39
115
101
2005
105
128
42
38
1185
10
2006
10
12
42
32
1205
10
Based on this survey the researchers estimate that 109 of all South Africans over 2 years old were living with HIV in 2008 In 2002 and 2005 this figure was 114 and 108 respectively showing a degree of stabilisation Among those between 15 and 49 years old the estimated HIV prevalence was 169 in 2008 The survey found the prevalence among children aged 2-14 to be 25 down significantly since 2002 when prevalence was 56
Estimated HIV prevalence () among South Africans aged 2 years and older by age 2002-2008
Age
HIV +
HIV -
Children (2-14 years)
25
975
Youth (15-24 years)
87
913
Adults (25 and older)
168
832
(15-49 years)
169
831
Total (2 and older)
109
891
Estimated HIV prevalence among South Africans by age and sex 2008
Age
Male prevalence
Female prevalence
2-14
3
2
15-19
25
67
20-24
51
211
25-29
157
327
30-34
258
291
35-39
185
248
40-44
192
163
45-49
64
141
50-54
104
102
55-59
62
77
60+
35
18
Total
79
136
Among females HIV prevalence is highest in those between 25 and 29 years old among males the peak is in the group aged 30-34 years
HIV prevalence () by province 2002-2008
Province
2002
2005
2008
KwaZulu-Natal
117
165
158
Mpumalanga
141
152
154
Free State
149
126
126
North West
103
109
113
Gauteng
147
108
103
Eastern Cape
66
89
9
Limpopo
98
8
88
Northern Cape
84
54
59
Western Cape
107
19
38
National
114
108
109
The results of this study suggest that KwaZulu-Natal Mpumulanga and Free State have the highest HIV prevalence However the relatively small sample sizes may limit precision and in several cases the ranges of uncertainty overlap
HIV prevalence by population group 2008
Population group
Prevalence ()
African
136
864
White
03
997
Coloured
17
983
Indian
03
997
Studies of AIDS deaths
Latin America
Latin America
Latin America
Latin America
North America
North America
North America
North America
Eastern Europe
Eastern Europe
Eastern Europe
Eastern Europe
Western Europe
Western Europe
Western Europe
Western Europe
Asia Pacific
Asia Pacific
Asia Pacific
Asia Pacific
Africa
Africa
Africa
Africa
Country
Study starts
Subjects randomised
SubjectsStudy
USA
32
4385
13703125
Russia
20
788
394
Germany
19
1883
991052631579
UK
13
265
203846153846
South Africa
12
347
289166666667
Argentina
12
329
274166666667
Australia
11
195
177272727273
India
7
275
392857142857
Brazil
3
115
383333333333
Country
Initiation
Site activation
Recruitment
LOC setup
Unproductive sites
(Approval ndash FCI)
(FCI ndash FSFV)
(FSFV ndash LSFV)
(CPC ndash FSFV)
South Africa
19
38
153
357
21
Australia
117
63
401
239
11
Germany
16
37
401
224
21
UK
9
101
301
346
20
Russia
11
52
174
334
9
India
31
28
389
431
3
Argentina
94
67
288
32
13
Brazil
79
59
94
656
20
USA
44
31
149
26
Country
Pts Rand
Sites
Av CPP
Cost Per Country
Ethics Subm
Regulatory Fees
Add Inv Fees
CT Scan Total
Ethics + Regulatory
Total Regulatory Fees
South Africa
25
5
7250
181250
290
460
363
0
750
1113
Canada
18
4
832545
14985818
181818
0
0
1557576
181818
1818
Italy
7
2
10000
70000
2200
0
0
0
2200
2200
Germany
55
10
7000
385000
3000
0
0
12000
3000
3000
Peru
40
5
7000
280000
1500
1000
2000
60000
2500
4500
Poland
15
4
10000
150000
0
2500
2400
0
2500
4900
Spain
40
7
10500
420000
0
0
5450
0
0
5450
UK
12
4
13000
156000
0
0
5556
0
0
5556
Bulgaria
18
4
10000
180000
0
5000
1000
0
5000
6000
Taiwan
20
4
1179649
2359298
104167
313
5208
0
135467
6563
Czech Rep
10
2
10000
100000
1500
3000
3000
0
4500
7500
Greece
40
7
9000
360000
0
7500
0
0
7500
7500
Chile
15
4
10840
162600
1700
3600
3000
0
5300
8300
Belgium
25
6
12200
305000
3992
4332
0
0
8324
8324
Korea
30
3
10827
324802
1114
0
14324
0
1114
15438
Singapore
10
2
11565
115650
1750
0
17975
0
1750
19725
France
50
10
9000
450000
0
0
20000
0
0
20000
China
39
5
4978
194142
5224
0
39814
0
5224
40336
New Zealand
10
3
145244
145244
1973
0
43123
0
1973
45096
Israel
10
6
11140
111400
2060
3000
48400
16500
5060
53460
Brazil
30
6
10000
300000
2000
287356
5649202
0
487356
61366
Australia
24
6
40200
964800
0
500
82500
0
500
83000
23
543
109
532856799
3304716
26939
27700043
73748966
[1753EURO x 14 (ex rate) = $2454] [ $245416 hours=$153hour]
1095625
1095625
12271
1753
198089
198089
208514736842
South Africa
Canada
Italy
Germany
Peru
Poland
Spain
UK
Bulgaria
Taiwan
Czech Rep
Greece
Chile
Belgium
Korea
Singapore
France
China
New Zealand
Israel
Brazil
Australia
Country
Study starts
Subjects randomised
SubjectsStudy
USA
32
4385
13703125
Russia
20
788
394
Germany
19
1883
991052631579
UK
13
265
203846153846
South Africa
12
347
289166666667
Argentina
12
329
274166666667
Australia
11
195
177272727273
India
7
275
392857142857
Brazil
3
115
383333333333
Country
Initiation
Site activation
Recruitment
LOC setup
Unproductive sites
(Approval ndash FCI)
(FCI ndash FSFV)
(FSFV ndash LSFV)
(CPC ndash FSFV)
South Africa
19
38
153
357
21
Australia
117
63
401
239
11
Germany
16
37
401
224
21
UK
9
101
301
346
20
Russia
11
52
174
334
9
India
31
28
389
431
3
Argentina
94
67
288
32
13
Brazil
79
59
94
656
20
USA
44
31
149
26
Country
Pts Rand
Sites
Av CPP
Cost Per Country
Ethics Subm
Regulatory Fees
Add Inv Fees
CT Scan Total
Ethics + Regulatory
Total Regulatory Fees
China
39
5
4978
194142
522
0
39814
0
522
40336
Germany
55
10
7000
385000
3000
0
0
12000
3000
3000
Peru
40
5
7000
280000
1500
1000
2000
60000
2500
4500
South Africa
25
5
7250
181250
290
460
363
0
750
1113
Canada
18
4
8325
149858
1818
0
0
1557576
1818
1818
Greece
40
7
9000
360000
0
7500
0
0
7500
7500
France
50
10
9000
450000
0
0
20000
0
0
20000
Italy
7
2
10000
70000
2200
0
0
0
2200
2200
Poland
15
4
10000
150000
0
2500
2400
0
2500
4900
Bulgaria
18
4
10000
180000
0
5000
1000
0
5000
6000
Czech Rep
10
2
10000
100000
1500
3000
3000
0
4500
7500
Brazil
30
6
10000
300000
2000
2874
56492
0
4874
61366
Spain
40
7
10500
420000
0
0
5450
0
0
5450
Korea
30
3
10827
324802
1114
0
14324
0
1114
15438
Chile
15
4
10840
162600
1700
3600
3000
0
5300
8300
Israel
10
6
11140
111400
2060
3000
48400
16500
5060
53460
Singapore
10
2
11565
115650
1750
0
17975
0
1750
19725
Taiwan
20
4
11796
235930
1042
313
5208
0
1355
6563
Belgium
25
6
12200
305000
3992
4332
0
0
8324
8324
UK
12
4
13000
156000
0
0
5556
0
0
5556
New Zealand
10
3
14524
145244
1973
0
43123
0
1973
45096
Australia
24
6
40200
964800
0
500
82500
0
500
83000
23
543
109
5328568
33047
26939
277000
73748966
[1753EURO x 14 (ex rate) = $2454] [ $245416 hours=$153hour]
110
1095625
1227
1753
19809
20
21
China
Germany
Peru
South Africa
Canada
Greece
France
Italy
Poland
Bulgaria
Czech Rep
Brazil
Spain
Korea
Chile
Israel
Singapore
Taiwan
Belgium
UK
New Zealand
Australia
25
bull Reliable (+) roads air links energy connectivity bull European Time bull Research language is English bull Inverse seasons bull Cost Currency bull Mobile-phone enabled obsessed population
South Africa Advantages
26
South Africa Track Record
bull Phase I-III data from SA included in hundreds of US amp European registration dossiers
bull Two entire NDA dossiers ndash rifapentine 1998 ndash tryptorelin (GnRH agonist) 2001) comprised SA data
bull 37 FDA inspections 1994-2009 1 OAI (27)
27
Therapeutic Indications
28
0
1
2
3
4
5
6
7
8
9
10
Belg
ium
Au
stria
Li
thua
nia
Can
ada
Luxe
mbo
urg
Mal
ta
Nor
way
Po
rtuga
l R
oman
ia
Rus
sia
Serb
ia
Swed
en
The
Net
herla
nds
USA
loca
l site
s U
SA c
entra
l site
C
zech
Rep
ublic
D
enm
ark
Esto
nia
Finl
and
Hun
gary
Ic
elan
d Ire
land
La
tvia
G
erm
any
Switz
erla
nd
Liec
hten
stei
n U
nite
d Ki
ngdo
m
Fran
ce
Italy
Au
stra
lia
Hon
g-Ko
ng
New
Zea
land
Si
ngap
ore
Taiw
an
Uga
nda
Pola
nd
Ukr
aine
C
hile
G
uate
mal
a Ja
pan
Isra
el
Slov
akia
Bu
lgar
ia
Gre
ece
Mal
aysi
a Ph
ilipp
ines
Pe
ru
Thai
land
Tu
rkey
Sl
oven
ia
Cos
ta R
ica
Mex
ico
Spai
n So
uth
Afric
a Ar
gent
ina
Sout
h Ko
rea
Col
ombi
a Pa
nam
a C
roat
ia
Indi
a Ve
nezu
ela
Braz
il C
hina
Mon
ths
Sout
h Afri
ca
Global Regulatory Review Timelines
Triclinium experience 2009-2015
Triclinium experience 2009 - 2015
29
Protocol release Country selection
Site Selection Collection of reg docs
Submission of RA application
EC application
Negotiate Site Contracts
EC Approvals
RA Approval amp Import permit
Site Initiation Import amp distribute drug
Import ancillary supplies Set up local labs
Set up EDC
Months
0
1
2
3
All EC approvals typically within 6
weeks
Site contracts signed within days
As soon as MCC approval obtained ALL sites can be initiated
Start-Up Activities in PARALLEL
GMO application (biologics)
30
0
2000
4000
6000
8000
10000
12000
14000C
hina
Ger
man
y
Per
u
Sou
th A
frica
Can
ada
Gre
ece
Fran
ce
Italy
Pol
and
Bul
garia
Cze
ch R
ep
Bra
zil
Spa
in
Kor
ea
Chi
le
Isra
el
Sin
gapo
re
Taiw
an
Bel
gium U
K
New
hellip
Aus
tralia
Source Bayer Presented SACRA Conference 2009
Aver
age
cost
per
pat
ient
(Eur
o)
Average Cost per Enrolled Participant
gt40000
Chart1
Average Cost Per Patient (Euro)
4978
7000
7000
7250
832545
9000
9000
10000
10000
10000
10000
10000
10500
10827
10840
11140
11565
1179649
12200
13000
145244
40200
Sheet1
Sheet2
Sheet2
Average Cost Per Patient (Euro)
Average Cost Per Patient
Sheet4
Ethics Subm
Regulatory Fees
Sheet3
Ethics + Regulatory
Total Ethics and Regulatory Fees
Add Inv Fees
Additional Investigator Application Fees
Total Regulatory Fees
Study starts
SubjectsStudy
31
Euro
0
10000
20000
30000
40000
50000
60000
70000
80000
90000S
outh
Afri
caC
anad
a
Italy
Ger
man
yP
eru
Pol
and
Spa
in UK
Bul
garia
Taiw
anC
zech
Rep
Gre
ece
Chi
leB
elgi
umK
orea
Sin
gapo
reFr
ance
Chi
naN
ew Z
eala
ndIs
rael
Bra
zil
Aus
tralia
Source Bayer Presented SACRA Conference 2009
Eur
os
Regulatory Application Fees
Chart1
Total Regulatory Fees
1113
181818
2200
3000
4500
4900
5450
5556
6000
656267
7500
7500
8300
8324
15438
19725
20000
403364
45096
53460
6136558
83000
Sheet1
Sheet2
Sheet2
Average Cost Per Patient (Euro)
Average Cost Per Patient
Sheet4
Ethics Subm
Regulatory Fees
Sheet3
Ethics + Regulatory
Total Ethics and Regulatory Fees
Add Inv Fees
Additional Investigator Application Fees
Total Regulatory Fees
Study starts
SubjectsStudy
32
SA Clinical Trial Regulatory Processes
Governed by SA-GCP and Declaration of Helsinki SA National Clinical Trials Register (SANCTR) Medicines Control Council (National Regulatory Authority)
o New protocols o Amendments o Additional sitesinvestigators
Ethics Committees (33 NHREC-registered) RegionalMunicipal DoH Export permits for bio samples (Nat Health Act 2003)
Clinical Trial Density Active sites million population
Nature Reviews Drug Discovery 7 13-14 (January 2008)
France 503
Germany 512 Canada
922
USA 1203
Czech Republic 776
553 sites
South Africa 119
757 sites
757 sites
533 sites
1084 sites
Argentina 269
Russia 77
China 04
India 07
34
Gateway to Africa
35
Why Africa bull Large accessible population relatively new to clinical trials
bull Experienced and willing investigators
bull Many clinical trial sites established by PDPs NGOs etc
bull Expanding therapeutic areas shifting burden of disease from
infectious to non-communicable diseases
bull Significantly improved infrastructure and accessibility
bull Rapidly evolving regulatory and ethics procedures
bull Potential for capacity building and sustainable clinical trial potential
36
Relatively young GCP culture Resident mentorships to build capacity Locations ndash accessibility for site monitoring Variable infrastructure esp electricity connectivity and
transportation Resourcing of public healthcare systems
Sub-Saharan Africa challenges
37
bull Second-largest continent
bull Spans NS and EW hemispheres
bull Second most populous continent 2014 estimate 1069 billion
bull Home to more than a quarter of the 196 independent countries
bull All 54 African countries are UN members
bull 39 urban population
bull 12 metropolitan areas gt 4m
bull gt 3000 distinct ethnicities
bull gt 2000 languages spoken
AFRICA hellip the true size
wwwcitypopulationdeworldAgglomerations 2015
38
SSV to SIV
0
5
10
15
20
25
30
35
40
45
Africa North America
Asia Pacific
Western Europe
Eastern Europe
Latin America
Source Quintiles South Africa SACRA Conference 2008
Wee
ks (A
vera
ge)
Start-Up Timelines
39
Region Median
Patients Site
of Sites
0 pts 1 - 3 pts 4 - 9 pts 10+ pts
Latin America 40 21 26 30 23
North America 30 29 29 24 18
Eastern Europe 60 15 31 26 27
Western Europe 40 15 22 29 34
Asia Pacific 40 19 30 34 18
Africa 100 4 17 28 51
Enrollment performance by region for 2008
Site Performance
Source Quintiles South Africa Presented SACRA Conference 2009
40
0 1 2 3 4 5 6 7 8 9
10
Latin America
North America
Eastern Europe
Western Europe
Asia Pacific
Africa
Num
ber o
f par
ticip
ants
MEDIAN site enrollment by region for 2008
Source Quintiles South Africa Presented SACRA Conference 2009
Site Performance
41
Source Quintiles South Africa Presented SACRA Conference 2009
s
ites
0
5
10
15
20
25
30
35
40
45
50
LatinAmerica
NorthAmerica
EasternEurope
WesternEurope
Asia Pacific Africa
0 pts
1 - 3 pts
4 - 9 pts
10+ pts
Enrollment performance by region for 2008
Site Performance
Chart1
0 pts
1 - 3 pts
4 - 9 pts
10+ pts
021
026
03
023
029
029
024
018
015
031
026
027
015
022
029
034
019
03
034
018
004
017
028
051
HIV
HIV
Resiratory amp Cancer
Male prevalence
Female prevalence
CVS
Overall death rates
Overall death rates
COPD
Asthma
Tracheabronchial lung cancer
Oesophageal cancer
prostate cancer
Trial metrics
COPD
Asthma
Tracheabronchial lung cancer
Oesophageal cancer
Prostate cancer
Cervical cancer
Breast cancer
Stroke
ill-defined heart disease
Diabetes mellitus
Ischaemic heart disease
Hypertension
Nephritisnephrosis
Stroke
ill-defined heart disease
Diabetes mellitus
Ischaemic heart disease
Hypertension
Nephritisnephrosis
Males
Female
UN - Male
SA 1997
SA 2004
UN - Female
SA 1997
SA 2004
0 pts
1 - 3 pts
4 - 9 pts
10+ pts
42
Source wwwclinicaltrialsgov 22-Oct-2010
Clinical trials registered across Africa
43
0
500
1000
1500
2000
2500
South Africa Kenya Malawi Tanzania Uganda Zambia
Selected African countries
2005
2010
2015
Source ClinTrialsgov
Trend 2005 - 2015
Source wwwclinicaltrialsgov 28-Aug-2015
44
AFRICA FOUND IN TRANSLATION
bull Vast treatment-naiumlve population bull Cost advantages (still) bull Diverse ethnicity amp morbidity bull Inverse seasonality bull Site capacity-building widely implemented bull Robust regulatory review bull Variable but generally good regulatory timelines bull Established GCP culture ndash sites and home-bred CROs
45
THANK YOU
Foliennummer 1
Triclinium A South African CRO
Collaboration with VPM SII
Vaccine Trials in SA 2015
Foliennummer 5
Foliennummer 6
Foliennummer 7
Foliennummer 8
Foliennummer 9
Foliennummer 10
Foliennummer 11
Foliennummer 12
Foliennummer 13
Foliennummer 14
Foliennummer 15
Foliennummer 16
Foliennummer 17
Distribution of clinical trial sites
Foliennummer 19
South Africa Leading Causes of Death
Foliennummer 21
Foliennummer 22
South Africa TB deaths by age group
Foliennummer 24
Foliennummer 25
Foliennummer 26
Foliennummer 27
Foliennummer 28
Foliennummer 29
Foliennummer 30
Foliennummer 31
SA Clinical Trial Regulatory Processes
Clinical Trial Density Active sites million population
Foliennummer 34
Why Africa
Foliennummer 36
AFRICA hellip the true size
SSV to SIV
Foliennummer 39
Foliennummer 40
Foliennummer 41
Foliennummer 42
Foliennummer 43
AFRICA FOUND IN TRANSLATION
Foliennummer 45
Region
Median
of Sites
Patients Site
0 pts
1 - 3 pts
4 - 9 pts
10+ pts
Latin America
4
21
26
30
23
North America
3
29
29
24
18
Eastern Europe
6
15
31
26
27
Western Europe
4
15
22
29
34
Asia Pacific
4
19
30
34
18
Africa
10
4
17
28
51
0 pts
1 - 3 pts
4 - 9 pts
10+ pts
Latin America
21
26
30
23
North America
29
29
24
18
Eastern Europe
15
31
26
27
Western Europe
15
22
29
34
Asia Pacific
19
30
34
18
Africa
4
17
28
51
Males
Female
15-19
210
150
20-24
340
205
25-29
395
300
30-34
460
360
35-39
600
405
40-44
800
500
45-49
1100
700
50-54
1600
1050
55-54
2300
1580
60-64
3340
2250
UN - Male
SA 1997
SA 2004
UN - Female
SA 1997
SA 2004
15-19
210
235
216
150
165
187
20-24
340
381
555
205
331
1085
25-29
395
625
1081
300
452
1985
30-34
460
817
2118
360
489
2267
35-39
600
916
2498
405
526
1890
40-44
800
1136
2765
500
615
1548
45-49
1100
1486
2744
700
800
1400
50-54
1600
2016
2979
1050
1116
1506
55-54
2300
2838
3270
1580
1626
1717
60-64
3340
3614
4146
2250
2201
2360
Stroke
ill-defined heart disease
Diabetes mellitus
Ischaemic heart disease
Hypertension
Nephritisnephrosis
Stroke
ill-defined heart disease
Diabetes mellitus
Ischaemic heart disease
Hypertension
Nephritisnephrosis
1999
34
345
20
248
14
10
1999
295
246
23
10
145
68
2000
36
362
218
249
152
112
2000
318
268
241
108
16
8
2001
35
372
22
25
15
125
2001
322
28
252
102
162
95
2002
405
298
24
26
147
126
2002
352
295
27
115
16
10
2003
425
32
245
285
152
15
2003
382
299
285
122
17
12
2004
39
325
255
26
165
16
2004
35
30
295
121
19
119
2005
36
328
265
26
15
162
2005
325
30
32
12
18
12
2006
35
336
27
258
155
16
2006
33
32
32
11
18
125
COPD
Asthma
Tracheabronchial lung cancer
Oesophageal cancer
prostate cancer
Cervical cancer
Breast cancer
1999
2001
12
135
10
26
2000
204
116
13
92
28
2001
222
131
133
96
27
2002
23
144
128
95
285
2003
243
149
124
94
29
2004
229
154
1255
87
29
2005
224
152
122
82
295
2006
224
136
116
75
3
COPD
Asthma
Tracheabronchial lung cancer
Oesophageal cancer
Prostate cancer
Cervical cancer
Breast cancer
1999
88
92
43
41
106
82
2000
96
95
4
43
11
81
2001
10
109
4
4
111
89
2002
10
116
4
4
112
85
2003
11
124
4
395
116
85
2004
102
1295
44
39
115
101
2005
105
128
42
38
1185
10
2006
10
12
42
32
1205
10
Based on this survey the researchers estimate that 109 of all South Africans over 2 years old were living with HIV in 2008 In 2002 and 2005 this figure was 114 and 108 respectively showing a degree of stabilisation Among those between 15 and 49 years old the estimated HIV prevalence was 169 in 2008 The survey found the prevalence among children aged 2-14 to be 25 down significantly since 2002 when prevalence was 56
Estimated HIV prevalence () among South Africans aged 2 years and older by age 2002-2008
Age
HIV +
HIV -
Children (2-14 years)
25
975
Youth (15-24 years)
87
913
Adults (25 and older)
168
832
(15-49 years)
169
831
Total (2 and older)
109
891
Estimated HIV prevalence among South Africans by age and sex 2008
Age
Male prevalence
Female prevalence
2-14
3
2
15-19
25
67
20-24
51
211
25-29
157
327
30-34
258
291
35-39
185
248
40-44
192
163
45-49
64
141
50-54
104
102
55-59
62
77
60+
35
18
Total
79
136
Among females HIV prevalence is highest in those between 25 and 29 years old among males the peak is in the group aged 30-34 years
HIV prevalence () by province 2002-2008
Province
2002
2005
2008
KwaZulu-Natal
117
165
158
Mpumalanga
141
152
154
Free State
149
126
126
North West
103
109
113
Gauteng
147
108
103
Eastern Cape
66
89
9
Limpopo
98
8
88
Northern Cape
84
54
59
Western Cape
107
19
38
National
114
108
109
The results of this study suggest that KwaZulu-Natal Mpumulanga and Free State have the highest HIV prevalence However the relatively small sample sizes may limit precision and in several cases the ranges of uncertainty overlap
HIV prevalence by population group 2008
Population group
Prevalence ()
African
136
864
White
03
997
Coloured
17
983
Indian
03
997
Studies of AIDS deaths
Latin America
Latin America
Latin America
Latin America
North America
North America
North America
North America
Eastern Europe
Eastern Europe
Eastern Europe
Eastern Europe
Western Europe
Western Europe
Western Europe
Western Europe
Asia Pacific
Asia Pacific
Asia Pacific
Asia Pacific
Africa
Africa
Africa
Africa
Country
Study starts
Subjects randomised
SubjectsStudy
USA
32
4385
13703125
Russia
20
788
394
Germany
19
1883
991052631579
UK
13
265
203846153846
South Africa
12
347
289166666667
Argentina
12
329
274166666667
Australia
11
195
177272727273
India
7
275
392857142857
Brazil
3
115
383333333333
Country
Initiation
Site activation
Recruitment
LOC setup
Unproductive sites
(Approval ndash FCI)
(FCI ndash FSFV)
(FSFV ndash LSFV)
(CPC ndash FSFV)
South Africa
19
38
153
357
21
Australia
117
63
401
239
11
Germany
16
37
401
224
21
UK
9
101
301
346
20
Russia
11
52
174
334
9
India
31
28
389
431
3
Argentina
94
67
288
32
13
Brazil
79
59
94
656
20
USA
44
31
149
26
Country
Pts Rand
Sites
Av CPP
Cost Per Country
Ethics Subm
Regulatory Fees
Add Inv Fees
CT Scan Total
Ethics + Regulatory
Total Regulatory Fees
South Africa
25
5
7250
181250
290
460
363
0
750
1113
Canada
18
4
832545
14985818
181818
0
0
1557576
181818
1818
Italy
7
2
10000
70000
2200
0
0
0
2200
2200
Germany
55
10
7000
385000
3000
0
0
12000
3000
3000
Peru
40
5
7000
280000
1500
1000
2000
60000
2500
4500
Poland
15
4
10000
150000
0
2500
2400
0
2500
4900
Spain
40
7
10500
420000
0
0
5450
0
0
5450
UK
12
4
13000
156000
0
0
5556
0
0
5556
Bulgaria
18
4
10000
180000
0
5000
1000
0
5000
6000
Taiwan
20
4
1179649
2359298
104167
313
5208
0
135467
6563
Czech Rep
10
2
10000
100000
1500
3000
3000
0
4500
7500
Greece
40
7
9000
360000
0
7500
0
0
7500
7500
Chile
15
4
10840
162600
1700
3600
3000
0
5300
8300
Belgium
25
6
12200
305000
3992
4332
0
0
8324
8324
Korea
30
3
10827
324802
1114
0
14324
0
1114
15438
Singapore
10
2
11565
115650
1750
0
17975
0
1750
19725
France
50
10
9000
450000
0
0
20000
0
0
20000
China
39
5
4978
194142
5224
0
39814
0
5224
40336
New Zealand
10
3
145244
145244
1973
0
43123
0
1973
45096
Israel
10
6
11140
111400
2060
3000
48400
16500
5060
53460
Brazil
30
6
10000
300000
2000
287356
5649202
0
487356
61366
Australia
24
6
40200
964800
0
500
82500
0
500
83000
23
543
109
532856799
3304716
26939
27700043
73748966
[1753EURO x 14 (ex rate) = $2454] [ $245416 hours=$153hour]
1095625
1095625
12271
1753
198089
198089
208514736842
South Africa
Canada
Italy
Germany
Peru
Poland
Spain
UK
Bulgaria
Taiwan
Czech Rep
Greece
Chile
Belgium
Korea
Singapore
France
China
New Zealand
Israel
Brazil
Australia
Country
Study starts
Subjects randomised
SubjectsStudy
USA
32
4385
13703125
Russia
20
788
394
Germany
19
1883
991052631579
UK
13
265
203846153846
South Africa
12
347
289166666667
Argentina
12
329
274166666667
Australia
11
195
177272727273
India
7
275
392857142857
Brazil
3
115
383333333333
Country
Initiation
Site activation
Recruitment
LOC setup
Unproductive sites
(Approval ndash FCI)
(FCI ndash FSFV)
(FSFV ndash LSFV)
(CPC ndash FSFV)
South Africa
19
38
153
357
21
Australia
117
63
401
239
11
Germany
16
37
401
224
21
UK
9
101
301
346
20
Russia
11
52
174
334
9
India
31
28
389
431
3
Argentina
94
67
288
32
13
Brazil
79
59
94
656
20
USA
44
31
149
26
Country
Pts Rand
Sites
Av CPP
Cost Per Country
Ethics Subm
Regulatory Fees
Add Inv Fees
CT Scan Total
Ethics + Regulatory
Total Regulatory Fees
China
39
5
4978
194142
522
0
39814
0
522
40336
Germany
55
10
7000
385000
3000
0
0
12000
3000
3000
Peru
40
5
7000
280000
1500
1000
2000
60000
2500
4500
South Africa
25
5
7250
181250
290
460
363
0
750
1113
Canada
18
4
8325
149858
1818
0
0
1557576
1818
1818
Greece
40
7
9000
360000
0
7500
0
0
7500
7500
France
50
10
9000
450000
0
0
20000
0
0
20000
Italy
7
2
10000
70000
2200
0
0
0
2200
2200
Poland
15
4
10000
150000
0
2500
2400
0
2500
4900
Bulgaria
18
4
10000
180000
0
5000
1000
0
5000
6000
Czech Rep
10
2
10000
100000
1500
3000
3000
0
4500
7500
Brazil
30
6
10000
300000
2000
2874
56492
0
4874
61366
Spain
40
7
10500
420000
0
0
5450
0
0
5450
Korea
30
3
10827
324802
1114
0
14324
0
1114
15438
Chile
15
4
10840
162600
1700
3600
3000
0
5300
8300
Israel
10
6
11140
111400
2060
3000
48400
16500
5060
53460
Singapore
10
2
11565
115650
1750
0
17975
0
1750
19725
Taiwan
20
4
11796
235930
1042
313
5208
0
1355
6563
Belgium
25
6
12200
305000
3992
4332
0
0
8324
8324
UK
12
4
13000
156000
0
0
5556
0
0
5556
New Zealand
10
3
14524
145244
1973
0
43123
0
1973
45096
Australia
24
6
40200
964800
0
500
82500
0
500
83000
23
543
109
5328568
33047
26939
277000
73748966
[1753EURO x 14 (ex rate) = $2454] [ $245416 hours=$153hour]
110
1095625
1227
1753
19809
20
21
China
Germany
Peru
South Africa
Canada
Greece
France
Italy
Poland
Bulgaria
Czech Rep
Brazil
Spain
Korea
Chile
Israel
Singapore
Taiwan
Belgium
UK
New Zealand
Australia
26
South Africa Track Record
bull Phase I-III data from SA included in hundreds of US amp European registration dossiers
bull Two entire NDA dossiers ndash rifapentine 1998 ndash tryptorelin (GnRH agonist) 2001) comprised SA data
bull 37 FDA inspections 1994-2009 1 OAI (27)
27
Therapeutic Indications
28
0
1
2
3
4
5
6
7
8
9
10
Belg
ium
Au
stria
Li
thua
nia
Can
ada
Luxe
mbo
urg
Mal
ta
Nor
way
Po
rtuga
l R
oman
ia
Rus
sia
Serb
ia
Swed
en
The
Net
herla
nds
USA
loca
l site
s U
SA c
entra
l site
C
zech
Rep
ublic
D
enm
ark
Esto
nia
Finl
and
Hun
gary
Ic
elan
d Ire
land
La
tvia
G
erm
any
Switz
erla
nd
Liec
hten
stei
n U
nite
d Ki
ngdo
m
Fran
ce
Italy
Au
stra
lia
Hon
g-Ko
ng
New
Zea
land
Si
ngap
ore
Taiw
an
Uga
nda
Pola
nd
Ukr
aine
C
hile
G
uate
mal
a Ja
pan
Isra
el
Slov
akia
Bu
lgar
ia
Gre
ece
Mal
aysi
a Ph
ilipp
ines
Pe
ru
Thai
land
Tu
rkey
Sl
oven
ia
Cos
ta R
ica
Mex
ico
Spai
n So
uth
Afric
a Ar
gent
ina
Sout
h Ko
rea
Col
ombi
a Pa
nam
a C
roat
ia
Indi
a Ve
nezu
ela
Braz
il C
hina
Mon
ths
Sout
h Afri
ca
Global Regulatory Review Timelines
Triclinium experience 2009-2015
Triclinium experience 2009 - 2015
29
Protocol release Country selection
Site Selection Collection of reg docs
Submission of RA application
EC application
Negotiate Site Contracts
EC Approvals
RA Approval amp Import permit
Site Initiation Import amp distribute drug
Import ancillary supplies Set up local labs
Set up EDC
Months
0
1
2
3
All EC approvals typically within 6
weeks
Site contracts signed within days
As soon as MCC approval obtained ALL sites can be initiated
Start-Up Activities in PARALLEL
GMO application (biologics)
30
0
2000
4000
6000
8000
10000
12000
14000C
hina
Ger
man
y
Per
u
Sou
th A
frica
Can
ada
Gre
ece
Fran
ce
Italy
Pol
and
Bul
garia
Cze
ch R
ep
Bra
zil
Spa
in
Kor
ea
Chi
le
Isra
el
Sin
gapo
re
Taiw
an
Bel
gium U
K
New
hellip
Aus
tralia
Source Bayer Presented SACRA Conference 2009
Aver
age
cost
per
pat
ient
(Eur
o)
Average Cost per Enrolled Participant
gt40000
Chart1
Average Cost Per Patient (Euro)
4978
7000
7000
7250
832545
9000
9000
10000
10000
10000
10000
10000
10500
10827
10840
11140
11565
1179649
12200
13000
145244
40200
Sheet1
Sheet2
Sheet2
Average Cost Per Patient (Euro)
Average Cost Per Patient
Sheet4
Ethics Subm
Regulatory Fees
Sheet3
Ethics + Regulatory
Total Ethics and Regulatory Fees
Add Inv Fees
Additional Investigator Application Fees
Total Regulatory Fees
Study starts
SubjectsStudy
31
Euro
0
10000
20000
30000
40000
50000
60000
70000
80000
90000S
outh
Afri
caC
anad
a
Italy
Ger
man
yP
eru
Pol
and
Spa
in UK
Bul
garia
Taiw
anC
zech
Rep
Gre
ece
Chi
leB
elgi
umK
orea
Sin
gapo
reFr
ance
Chi
naN
ew Z
eala
ndIs
rael
Bra
zil
Aus
tralia
Source Bayer Presented SACRA Conference 2009
Eur
os
Regulatory Application Fees
Chart1
Total Regulatory Fees
1113
181818
2200
3000
4500
4900
5450
5556
6000
656267
7500
7500
8300
8324
15438
19725
20000
403364
45096
53460
6136558
83000
Sheet1
Sheet2
Sheet2
Average Cost Per Patient (Euro)
Average Cost Per Patient
Sheet4
Ethics Subm
Regulatory Fees
Sheet3
Ethics + Regulatory
Total Ethics and Regulatory Fees
Add Inv Fees
Additional Investigator Application Fees
Total Regulatory Fees
Study starts
SubjectsStudy
32
SA Clinical Trial Regulatory Processes
Governed by SA-GCP and Declaration of Helsinki SA National Clinical Trials Register (SANCTR) Medicines Control Council (National Regulatory Authority)
o New protocols o Amendments o Additional sitesinvestigators
Ethics Committees (33 NHREC-registered) RegionalMunicipal DoH Export permits for bio samples (Nat Health Act 2003)
Clinical Trial Density Active sites million population
Nature Reviews Drug Discovery 7 13-14 (January 2008)
France 503
Germany 512 Canada
922
USA 1203
Czech Republic 776
553 sites
South Africa 119
757 sites
757 sites
533 sites
1084 sites
Argentina 269
Russia 77
China 04
India 07
34
Gateway to Africa
35
Why Africa bull Large accessible population relatively new to clinical trials
bull Experienced and willing investigators
bull Many clinical trial sites established by PDPs NGOs etc
bull Expanding therapeutic areas shifting burden of disease from
infectious to non-communicable diseases
bull Significantly improved infrastructure and accessibility
bull Rapidly evolving regulatory and ethics procedures
bull Potential for capacity building and sustainable clinical trial potential
36
Relatively young GCP culture Resident mentorships to build capacity Locations ndash accessibility for site monitoring Variable infrastructure esp electricity connectivity and
transportation Resourcing of public healthcare systems
Sub-Saharan Africa challenges
37
bull Second-largest continent
bull Spans NS and EW hemispheres
bull Second most populous continent 2014 estimate 1069 billion
bull Home to more than a quarter of the 196 independent countries
bull All 54 African countries are UN members
bull 39 urban population
bull 12 metropolitan areas gt 4m
bull gt 3000 distinct ethnicities
bull gt 2000 languages spoken
AFRICA hellip the true size
wwwcitypopulationdeworldAgglomerations 2015
38
SSV to SIV
0
5
10
15
20
25
30
35
40
45
Africa North America
Asia Pacific
Western Europe
Eastern Europe
Latin America
Source Quintiles South Africa SACRA Conference 2008
Wee
ks (A
vera
ge)
Start-Up Timelines
39
Region Median
Patients Site
of Sites
0 pts 1 - 3 pts 4 - 9 pts 10+ pts
Latin America 40 21 26 30 23
North America 30 29 29 24 18
Eastern Europe 60 15 31 26 27
Western Europe 40 15 22 29 34
Asia Pacific 40 19 30 34 18
Africa 100 4 17 28 51
Enrollment performance by region for 2008
Site Performance
Source Quintiles South Africa Presented SACRA Conference 2009
40
0 1 2 3 4 5 6 7 8 9
10
Latin America
North America
Eastern Europe
Western Europe
Asia Pacific
Africa
Num
ber o
f par
ticip
ants
MEDIAN site enrollment by region for 2008
Source Quintiles South Africa Presented SACRA Conference 2009
Site Performance
41
Source Quintiles South Africa Presented SACRA Conference 2009
s
ites
0
5
10
15
20
25
30
35
40
45
50
LatinAmerica
NorthAmerica
EasternEurope
WesternEurope
Asia Pacific Africa
0 pts
1 - 3 pts
4 - 9 pts
10+ pts
Enrollment performance by region for 2008
Site Performance
Chart1
0 pts
1 - 3 pts
4 - 9 pts
10+ pts
021
026
03
023
029
029
024
018
015
031
026
027
015
022
029
034
019
03
034
018
004
017
028
051
HIV
HIV
Resiratory amp Cancer
Male prevalence
Female prevalence
CVS
Overall death rates
Overall death rates
COPD
Asthma
Tracheabronchial lung cancer
Oesophageal cancer
prostate cancer
Trial metrics
COPD
Asthma
Tracheabronchial lung cancer
Oesophageal cancer
Prostate cancer
Cervical cancer
Breast cancer
Stroke
ill-defined heart disease
Diabetes mellitus
Ischaemic heart disease
Hypertension
Nephritisnephrosis
Stroke
ill-defined heart disease
Diabetes mellitus
Ischaemic heart disease
Hypertension
Nephritisnephrosis
Males
Female
UN - Male
SA 1997
SA 2004
UN - Female
SA 1997
SA 2004
0 pts
1 - 3 pts
4 - 9 pts
10+ pts
42
Source wwwclinicaltrialsgov 22-Oct-2010
Clinical trials registered across Africa
43
0
500
1000
1500
2000
2500
South Africa Kenya Malawi Tanzania Uganda Zambia
Selected African countries
2005
2010
2015
Source ClinTrialsgov
Trend 2005 - 2015
Source wwwclinicaltrialsgov 28-Aug-2015
44
AFRICA FOUND IN TRANSLATION
bull Vast treatment-naiumlve population bull Cost advantages (still) bull Diverse ethnicity amp morbidity bull Inverse seasonality bull Site capacity-building widely implemented bull Robust regulatory review bull Variable but generally good regulatory timelines bull Established GCP culture ndash sites and home-bred CROs
45
THANK YOU
Foliennummer 1
Triclinium A South African CRO
Collaboration with VPM SII
Vaccine Trials in SA 2015
Foliennummer 5
Foliennummer 6
Foliennummer 7
Foliennummer 8
Foliennummer 9
Foliennummer 10
Foliennummer 11
Foliennummer 12
Foliennummer 13
Foliennummer 14
Foliennummer 15
Foliennummer 16
Foliennummer 17
Distribution of clinical trial sites
Foliennummer 19
South Africa Leading Causes of Death
Foliennummer 21
Foliennummer 22
South Africa TB deaths by age group
Foliennummer 24
Foliennummer 25
Foliennummer 26
Foliennummer 27
Foliennummer 28
Foliennummer 29
Foliennummer 30
Foliennummer 31
SA Clinical Trial Regulatory Processes
Clinical Trial Density Active sites million population
Foliennummer 34
Why Africa
Foliennummer 36
AFRICA hellip the true size
SSV to SIV
Foliennummer 39
Foliennummer 40
Foliennummer 41
Foliennummer 42
Foliennummer 43
AFRICA FOUND IN TRANSLATION
Foliennummer 45
Region
Median
of Sites
Patients Site
0 pts
1 - 3 pts
4 - 9 pts
10+ pts
Latin America
4
21
26
30
23
North America
3
29
29
24
18
Eastern Europe
6
15
31
26
27
Western Europe
4
15
22
29
34
Asia Pacific
4
19
30
34
18
Africa
10
4
17
28
51
0 pts
1 - 3 pts
4 - 9 pts
10+ pts
Latin America
21
26
30
23
North America
29
29
24
18
Eastern Europe
15
31
26
27
Western Europe
15
22
29
34
Asia Pacific
19
30
34
18
Africa
4
17
28
51
Males
Female
15-19
210
150
20-24
340
205
25-29
395
300
30-34
460
360
35-39
600
405
40-44
800
500
45-49
1100
700
50-54
1600
1050
55-54
2300
1580
60-64
3340
2250
UN - Male
SA 1997
SA 2004
UN - Female
SA 1997
SA 2004
15-19
210
235
216
150
165
187
20-24
340
381
555
205
331
1085
25-29
395
625
1081
300
452
1985
30-34
460
817
2118
360
489
2267
35-39
600
916
2498
405
526
1890
40-44
800
1136
2765
500
615
1548
45-49
1100
1486
2744
700
800
1400
50-54
1600
2016
2979
1050
1116
1506
55-54
2300
2838
3270
1580
1626
1717
60-64
3340
3614
4146
2250
2201
2360
Stroke
ill-defined heart disease
Diabetes mellitus
Ischaemic heart disease
Hypertension
Nephritisnephrosis
Stroke
ill-defined heart disease
Diabetes mellitus
Ischaemic heart disease
Hypertension
Nephritisnephrosis
1999
34
345
20
248
14
10
1999
295
246
23
10
145
68
2000
36
362
218
249
152
112
2000
318
268
241
108
16
8
2001
35
372
22
25
15
125
2001
322
28
252
102
162
95
2002
405
298
24
26
147
126
2002
352
295
27
115
16
10
2003
425
32
245
285
152
15
2003
382
299
285
122
17
12
2004
39
325
255
26
165
16
2004
35
30
295
121
19
119
2005
36
328
265
26
15
162
2005
325
30
32
12
18
12
2006
35
336
27
258
155
16
2006
33
32
32
11
18
125
COPD
Asthma
Tracheabronchial lung cancer
Oesophageal cancer
prostate cancer
Cervical cancer
Breast cancer
1999
2001
12
135
10
26
2000
204
116
13
92
28
2001
222
131
133
96
27
2002
23
144
128
95
285
2003
243
149
124
94
29
2004
229
154
1255
87
29
2005
224
152
122
82
295
2006
224
136
116
75
3
COPD
Asthma
Tracheabronchial lung cancer
Oesophageal cancer
Prostate cancer
Cervical cancer
Breast cancer
1999
88
92
43
41
106
82
2000
96
95
4
43
11
81
2001
10
109
4
4
111
89
2002
10
116
4
4
112
85
2003
11
124
4
395
116
85
2004
102
1295
44
39
115
101
2005
105
128
42
38
1185
10
2006
10
12
42
32
1205
10
Based on this survey the researchers estimate that 109 of all South Africans over 2 years old were living with HIV in 2008 In 2002 and 2005 this figure was 114 and 108 respectively showing a degree of stabilisation Among those between 15 and 49 years old the estimated HIV prevalence was 169 in 2008 The survey found the prevalence among children aged 2-14 to be 25 down significantly since 2002 when prevalence was 56
Estimated HIV prevalence () among South Africans aged 2 years and older by age 2002-2008
Age
HIV +
HIV -
Children (2-14 years)
25
975
Youth (15-24 years)
87
913
Adults (25 and older)
168
832
(15-49 years)
169
831
Total (2 and older)
109
891
Estimated HIV prevalence among South Africans by age and sex 2008
Age
Male prevalence
Female prevalence
2-14
3
2
15-19
25
67
20-24
51
211
25-29
157
327
30-34
258
291
35-39
185
248
40-44
192
163
45-49
64
141
50-54
104
102
55-59
62
77
60+
35
18
Total
79
136
Among females HIV prevalence is highest in those between 25 and 29 years old among males the peak is in the group aged 30-34 years
HIV prevalence () by province 2002-2008
Province
2002
2005
2008
KwaZulu-Natal
117
165
158
Mpumalanga
141
152
154
Free State
149
126
126
North West
103
109
113
Gauteng
147
108
103
Eastern Cape
66
89
9
Limpopo
98
8
88
Northern Cape
84
54
59
Western Cape
107
19
38
National
114
108
109
The results of this study suggest that KwaZulu-Natal Mpumulanga and Free State have the highest HIV prevalence However the relatively small sample sizes may limit precision and in several cases the ranges of uncertainty overlap
HIV prevalence by population group 2008
Population group
Prevalence ()
African
136
864
White
03
997
Coloured
17
983
Indian
03
997
Studies of AIDS deaths
Latin America
Latin America
Latin America
Latin America
North America
North America
North America
North America
Eastern Europe
Eastern Europe
Eastern Europe
Eastern Europe
Western Europe
Western Europe
Western Europe
Western Europe
Asia Pacific
Asia Pacific
Asia Pacific
Asia Pacific
Africa
Africa
Africa
Africa
Country
Study starts
Subjects randomised
SubjectsStudy
USA
32
4385
13703125
Russia
20
788
394
Germany
19
1883
991052631579
UK
13
265
203846153846
South Africa
12
347
289166666667
Argentina
12
329
274166666667
Australia
11
195
177272727273
India
7
275
392857142857
Brazil
3
115
383333333333
Country
Initiation
Site activation
Recruitment
LOC setup
Unproductive sites
(Approval ndash FCI)
(FCI ndash FSFV)
(FSFV ndash LSFV)
(CPC ndash FSFV)
South Africa
19
38
153
357
21
Australia
117
63
401
239
11
Germany
16
37
401
224
21
UK
9
101
301
346
20
Russia
11
52
174
334
9
India
31
28
389
431
3
Argentina
94
67
288
32
13
Brazil
79
59
94
656
20
USA
44
31
149
26
Country
Pts Rand
Sites
Av CPP
Cost Per Country
Ethics Subm
Regulatory Fees
Add Inv Fees
CT Scan Total
Ethics + Regulatory
Total Regulatory Fees
South Africa
25
5
7250
181250
290
460
363
0
750
1113
Canada
18
4
832545
14985818
181818
0
0
1557576
181818
1818
Italy
7
2
10000
70000
2200
0
0
0
2200
2200
Germany
55
10
7000
385000
3000
0
0
12000
3000
3000
Peru
40
5
7000
280000
1500
1000
2000
60000
2500
4500
Poland
15
4
10000
150000
0
2500
2400
0
2500
4900
Spain
40
7
10500
420000
0
0
5450
0
0
5450
UK
12
4
13000
156000
0
0
5556
0
0
5556
Bulgaria
18
4
10000
180000
0
5000
1000
0
5000
6000
Taiwan
20
4
1179649
2359298
104167
313
5208
0
135467
6563
Czech Rep
10
2
10000
100000
1500
3000
3000
0
4500
7500
Greece
40
7
9000
360000
0
7500
0
0
7500
7500
Chile
15
4
10840
162600
1700
3600
3000
0
5300
8300
Belgium
25
6
12200
305000
3992
4332
0
0
8324
8324
Korea
30
3
10827
324802
1114
0
14324
0
1114
15438
Singapore
10
2
11565
115650
1750
0
17975
0
1750
19725
France
50
10
9000
450000
0
0
20000
0
0
20000
China
39
5
4978
194142
5224
0
39814
0
5224
40336
New Zealand
10
3
145244
145244
1973
0
43123
0
1973
45096
Israel
10
6
11140
111400
2060
3000
48400
16500
5060
53460
Brazil
30
6
10000
300000
2000
287356
5649202
0
487356
61366
Australia
24
6
40200
964800
0
500
82500
0
500
83000
23
543
109
532856799
3304716
26939
27700043
73748966
[1753EURO x 14 (ex rate) = $2454] [ $245416 hours=$153hour]
1095625
1095625
12271
1753
198089
198089
208514736842
South Africa
Canada
Italy
Germany
Peru
Poland
Spain
UK
Bulgaria
Taiwan
Czech Rep
Greece
Chile
Belgium
Korea
Singapore
France
China
New Zealand
Israel
Brazil
Australia
Country
Study starts
Subjects randomised
SubjectsStudy
USA
32
4385
13703125
Russia
20
788
394
Germany
19
1883
991052631579
UK
13
265
203846153846
South Africa
12
347
289166666667
Argentina
12
329
274166666667
Australia
11
195
177272727273
India
7
275
392857142857
Brazil
3
115
383333333333
Country
Initiation
Site activation
Recruitment
LOC setup
Unproductive sites
(Approval ndash FCI)
(FCI ndash FSFV)
(FSFV ndash LSFV)
(CPC ndash FSFV)
South Africa
19
38
153
357
21
Australia
117
63
401
239
11
Germany
16
37
401
224
21
UK
9
101
301
346
20
Russia
11
52
174
334
9
India
31
28
389
431
3
Argentina
94
67
288
32
13
Brazil
79
59
94
656
20
USA
44
31
149
26
Country
Pts Rand
Sites
Av CPP
Cost Per Country
Ethics Subm
Regulatory Fees
Add Inv Fees
CT Scan Total
Ethics + Regulatory
Total Regulatory Fees
China
39
5
4978
194142
522
0
39814
0
522
40336
Germany
55
10
7000
385000
3000
0
0
12000
3000
3000
Peru
40
5
7000
280000
1500
1000
2000
60000
2500
4500
South Africa
25
5
7250
181250
290
460
363
0
750
1113
Canada
18
4
8325
149858
1818
0
0
1557576
1818
1818
Greece
40
7
9000
360000
0
7500
0
0
7500
7500
France
50
10
9000
450000
0
0
20000
0
0
20000
Italy
7
2
10000
70000
2200
0
0
0
2200
2200
Poland
15
4
10000
150000
0
2500
2400
0
2500
4900
Bulgaria
18
4
10000
180000
0
5000
1000
0
5000
6000
Czech Rep
10
2
10000
100000
1500
3000
3000
0
4500
7500
Brazil
30
6
10000
300000
2000
2874
56492
0
4874
61366
Spain
40
7
10500
420000
0
0
5450
0
0
5450
Korea
30
3
10827
324802
1114
0
14324
0
1114
15438
Chile
15
4
10840
162600
1700
3600
3000
0
5300
8300
Israel
10
6
11140
111400
2060
3000
48400
16500
5060
53460
Singapore
10
2
11565
115650
1750
0
17975
0
1750
19725
Taiwan
20
4
11796
235930
1042
313
5208
0
1355
6563
Belgium
25
6
12200
305000
3992
4332
0
0
8324
8324
UK
12
4
13000
156000
0
0
5556
0
0
5556
New Zealand
10
3
14524
145244
1973
0
43123
0
1973
45096
Australia
24
6
40200
964800
0
500
82500
0
500
83000
23
543
109
5328568
33047
26939
277000
73748966
[1753EURO x 14 (ex rate) = $2454] [ $245416 hours=$153hour]
110
1095625
1227
1753
19809
20
21
China
Germany
Peru
South Africa
Canada
Greece
France
Italy
Poland
Bulgaria
Czech Rep
Brazil
Spain
Korea
Chile
Israel
Singapore
Taiwan
Belgium
UK
New Zealand
Australia
27
Therapeutic Indications
28
0
1
2
3
4
5
6
7
8
9
10
Belg
ium
Au
stria
Li
thua
nia
Can
ada
Luxe
mbo
urg
Mal
ta
Nor
way
Po
rtuga
l R
oman
ia
Rus
sia
Serb
ia
Swed
en
The
Net
herla
nds
USA
loca
l site
s U
SA c
entra
l site
C
zech
Rep
ublic
D
enm
ark
Esto
nia
Finl
and
Hun
gary
Ic
elan
d Ire
land
La
tvia
G
erm
any
Switz
erla
nd
Liec
hten
stei
n U
nite
d Ki
ngdo
m
Fran
ce
Italy
Au
stra
lia
Hon
g-Ko
ng
New
Zea
land
Si
ngap
ore
Taiw
an
Uga
nda
Pola
nd
Ukr
aine
C
hile
G
uate
mal
a Ja
pan
Isra
el
Slov
akia
Bu
lgar
ia
Gre
ece
Mal
aysi
a Ph
ilipp
ines
Pe
ru
Thai
land
Tu
rkey
Sl
oven
ia
Cos
ta R
ica
Mex
ico
Spai
n So
uth
Afric
a Ar
gent
ina
Sout
h Ko
rea
Col
ombi
a Pa
nam
a C
roat
ia
Indi
a Ve
nezu
ela
Braz
il C
hina
Mon
ths
Sout
h Afri
ca
Global Regulatory Review Timelines
Triclinium experience 2009-2015
Triclinium experience 2009 - 2015
29
Protocol release Country selection
Site Selection Collection of reg docs
Submission of RA application
EC application
Negotiate Site Contracts
EC Approvals
RA Approval amp Import permit
Site Initiation Import amp distribute drug
Import ancillary supplies Set up local labs
Set up EDC
Months
0
1
2
3
All EC approvals typically within 6
weeks
Site contracts signed within days
As soon as MCC approval obtained ALL sites can be initiated
Start-Up Activities in PARALLEL
GMO application (biologics)
30
0
2000
4000
6000
8000
10000
12000
14000C
hina
Ger
man
y
Per
u
Sou
th A
frica
Can
ada
Gre
ece
Fran
ce
Italy
Pol
and
Bul
garia
Cze
ch R
ep
Bra
zil
Spa
in
Kor
ea
Chi
le
Isra
el
Sin
gapo
re
Taiw
an
Bel
gium U
K
New
hellip
Aus
tralia
Source Bayer Presented SACRA Conference 2009
Aver
age
cost
per
pat
ient
(Eur
o)
Average Cost per Enrolled Participant
gt40000
Chart1
Average Cost Per Patient (Euro)
4978
7000
7000
7250
832545
9000
9000
10000
10000
10000
10000
10000
10500
10827
10840
11140
11565
1179649
12200
13000
145244
40200
Sheet1
Sheet2
Sheet2
Average Cost Per Patient (Euro)
Average Cost Per Patient
Sheet4
Ethics Subm
Regulatory Fees
Sheet3
Ethics + Regulatory
Total Ethics and Regulatory Fees
Add Inv Fees
Additional Investigator Application Fees
Total Regulatory Fees
Study starts
SubjectsStudy
31
Euro
0
10000
20000
30000
40000
50000
60000
70000
80000
90000S
outh
Afri
caC
anad
a
Italy
Ger
man
yP
eru
Pol
and
Spa
in UK
Bul
garia
Taiw
anC
zech
Rep
Gre
ece
Chi
leB
elgi
umK
orea
Sin
gapo
reFr
ance
Chi
naN
ew Z
eala
ndIs
rael
Bra
zil
Aus
tralia
Source Bayer Presented SACRA Conference 2009
Eur
os
Regulatory Application Fees
Chart1
Total Regulatory Fees
1113
181818
2200
3000
4500
4900
5450
5556
6000
656267
7500
7500
8300
8324
15438
19725
20000
403364
45096
53460
6136558
83000
Sheet1
Sheet2
Sheet2
Average Cost Per Patient (Euro)
Average Cost Per Patient
Sheet4
Ethics Subm
Regulatory Fees
Sheet3
Ethics + Regulatory
Total Ethics and Regulatory Fees
Add Inv Fees
Additional Investigator Application Fees
Total Regulatory Fees
Study starts
SubjectsStudy
32
SA Clinical Trial Regulatory Processes
Governed by SA-GCP and Declaration of Helsinki SA National Clinical Trials Register (SANCTR) Medicines Control Council (National Regulatory Authority)
o New protocols o Amendments o Additional sitesinvestigators
Ethics Committees (33 NHREC-registered) RegionalMunicipal DoH Export permits for bio samples (Nat Health Act 2003)
Clinical Trial Density Active sites million population
Nature Reviews Drug Discovery 7 13-14 (January 2008)
France 503
Germany 512 Canada
922
USA 1203
Czech Republic 776
553 sites
South Africa 119
757 sites
757 sites
533 sites
1084 sites
Argentina 269
Russia 77
China 04
India 07
34
Gateway to Africa
35
Why Africa bull Large accessible population relatively new to clinical trials
bull Experienced and willing investigators
bull Many clinical trial sites established by PDPs NGOs etc
bull Expanding therapeutic areas shifting burden of disease from
infectious to non-communicable diseases
bull Significantly improved infrastructure and accessibility
bull Rapidly evolving regulatory and ethics procedures
bull Potential for capacity building and sustainable clinical trial potential
36
Relatively young GCP culture Resident mentorships to build capacity Locations ndash accessibility for site monitoring Variable infrastructure esp electricity connectivity and
transportation Resourcing of public healthcare systems
Sub-Saharan Africa challenges
37
bull Second-largest continent
bull Spans NS and EW hemispheres
bull Second most populous continent 2014 estimate 1069 billion
bull Home to more than a quarter of the 196 independent countries
bull All 54 African countries are UN members
bull 39 urban population
bull 12 metropolitan areas gt 4m
bull gt 3000 distinct ethnicities
bull gt 2000 languages spoken
AFRICA hellip the true size
wwwcitypopulationdeworldAgglomerations 2015
38
SSV to SIV
0
5
10
15
20
25
30
35
40
45
Africa North America
Asia Pacific
Western Europe
Eastern Europe
Latin America
Source Quintiles South Africa SACRA Conference 2008
Wee
ks (A
vera
ge)
Start-Up Timelines
39
Region Median
Patients Site
of Sites
0 pts 1 - 3 pts 4 - 9 pts 10+ pts
Latin America 40 21 26 30 23
North America 30 29 29 24 18
Eastern Europe 60 15 31 26 27
Western Europe 40 15 22 29 34
Asia Pacific 40 19 30 34 18
Africa 100 4 17 28 51
Enrollment performance by region for 2008
Site Performance
Source Quintiles South Africa Presented SACRA Conference 2009
40
0 1 2 3 4 5 6 7 8 9
10
Latin America
North America
Eastern Europe
Western Europe
Asia Pacific
Africa
Num
ber o
f par
ticip
ants
MEDIAN site enrollment by region for 2008
Source Quintiles South Africa Presented SACRA Conference 2009
Site Performance
41
Source Quintiles South Africa Presented SACRA Conference 2009
s
ites
0
5
10
15
20
25
30
35
40
45
50
LatinAmerica
NorthAmerica
EasternEurope
WesternEurope
Asia Pacific Africa
0 pts
1 - 3 pts
4 - 9 pts
10+ pts
Enrollment performance by region for 2008
Site Performance
Chart1
0 pts
1 - 3 pts
4 - 9 pts
10+ pts
021
026
03
023
029
029
024
018
015
031
026
027
015
022
029
034
019
03
034
018
004
017
028
051
HIV
HIV
Resiratory amp Cancer
Male prevalence
Female prevalence
CVS
Overall death rates
Overall death rates
COPD
Asthma
Tracheabronchial lung cancer
Oesophageal cancer
prostate cancer
Trial metrics
COPD
Asthma
Tracheabronchial lung cancer
Oesophageal cancer
Prostate cancer
Cervical cancer
Breast cancer
Stroke
ill-defined heart disease
Diabetes mellitus
Ischaemic heart disease
Hypertension
Nephritisnephrosis
Stroke
ill-defined heart disease
Diabetes mellitus
Ischaemic heart disease
Hypertension
Nephritisnephrosis
Males
Female
UN - Male
SA 1997
SA 2004
UN - Female
SA 1997
SA 2004
0 pts
1 - 3 pts
4 - 9 pts
10+ pts
42
Source wwwclinicaltrialsgov 22-Oct-2010
Clinical trials registered across Africa
43
0
500
1000
1500
2000
2500
South Africa Kenya Malawi Tanzania Uganda Zambia
Selected African countries
2005
2010
2015
Source ClinTrialsgov
Trend 2005 - 2015
Source wwwclinicaltrialsgov 28-Aug-2015
44
AFRICA FOUND IN TRANSLATION
bull Vast treatment-naiumlve population bull Cost advantages (still) bull Diverse ethnicity amp morbidity bull Inverse seasonality bull Site capacity-building widely implemented bull Robust regulatory review bull Variable but generally good regulatory timelines bull Established GCP culture ndash sites and home-bred CROs
45
THANK YOU
Foliennummer 1
Triclinium A South African CRO
Collaboration with VPM SII
Vaccine Trials in SA 2015
Foliennummer 5
Foliennummer 6
Foliennummer 7
Foliennummer 8
Foliennummer 9
Foliennummer 10
Foliennummer 11
Foliennummer 12
Foliennummer 13
Foliennummer 14
Foliennummer 15
Foliennummer 16
Foliennummer 17
Distribution of clinical trial sites
Foliennummer 19
South Africa Leading Causes of Death
Foliennummer 21
Foliennummer 22
South Africa TB deaths by age group
Foliennummer 24
Foliennummer 25
Foliennummer 26
Foliennummer 27
Foliennummer 28
Foliennummer 29
Foliennummer 30
Foliennummer 31
SA Clinical Trial Regulatory Processes
Clinical Trial Density Active sites million population
Foliennummer 34
Why Africa
Foliennummer 36
AFRICA hellip the true size
SSV to SIV
Foliennummer 39
Foliennummer 40
Foliennummer 41
Foliennummer 42
Foliennummer 43
AFRICA FOUND IN TRANSLATION
Foliennummer 45
Region
Median
of Sites
Patients Site
0 pts
1 - 3 pts
4 - 9 pts
10+ pts
Latin America
4
21
26
30
23
North America
3
29
29
24
18
Eastern Europe
6
15
31
26
27
Western Europe
4
15
22
29
34
Asia Pacific
4
19
30
34
18
Africa
10
4
17
28
51
0 pts
1 - 3 pts
4 - 9 pts
10+ pts
Latin America
21
26
30
23
North America
29
29
24
18
Eastern Europe
15
31
26
27
Western Europe
15
22
29
34
Asia Pacific
19
30
34
18
Africa
4
17
28
51
Males
Female
15-19
210
150
20-24
340
205
25-29
395
300
30-34
460
360
35-39
600
405
40-44
800
500
45-49
1100
700
50-54
1600
1050
55-54
2300
1580
60-64
3340
2250
UN - Male
SA 1997
SA 2004
UN - Female
SA 1997
SA 2004
15-19
210
235
216
150
165
187
20-24
340
381
555
205
331
1085
25-29
395
625
1081
300
452
1985
30-34
460
817
2118
360
489
2267
35-39
600
916
2498
405
526
1890
40-44
800
1136
2765
500
615
1548
45-49
1100
1486
2744
700
800
1400
50-54
1600
2016
2979
1050
1116
1506
55-54
2300
2838
3270
1580
1626
1717
60-64
3340
3614
4146
2250
2201
2360
Stroke
ill-defined heart disease
Diabetes mellitus
Ischaemic heart disease
Hypertension
Nephritisnephrosis
Stroke
ill-defined heart disease
Diabetes mellitus
Ischaemic heart disease
Hypertension
Nephritisnephrosis
1999
34
345
20
248
14
10
1999
295
246
23
10
145
68
2000
36
362
218
249
152
112
2000
318
268
241
108
16
8
2001
35
372
22
25
15
125
2001
322
28
252
102
162
95
2002
405
298
24
26
147
126
2002
352
295
27
115
16
10
2003
425
32
245
285
152
15
2003
382
299
285
122
17
12
2004
39
325
255
26
165
16
2004
35
30
295
121
19
119
2005
36
328
265
26
15
162
2005
325
30
32
12
18
12
2006
35
336
27
258
155
16
2006
33
32
32
11
18
125
COPD
Asthma
Tracheabronchial lung cancer
Oesophageal cancer
prostate cancer
Cervical cancer
Breast cancer
1999
2001
12
135
10
26
2000
204
116
13
92
28
2001
222
131
133
96
27
2002
23
144
128
95
285
2003
243
149
124
94
29
2004
229
154
1255
87
29
2005
224
152
122
82
295
2006
224
136
116
75
3
COPD
Asthma
Tracheabronchial lung cancer
Oesophageal cancer
Prostate cancer
Cervical cancer
Breast cancer
1999
88
92
43
41
106
82
2000
96
95
4
43
11
81
2001
10
109
4
4
111
89
2002
10
116
4
4
112
85
2003
11
124
4
395
116
85
2004
102
1295
44
39
115
101
2005
105
128
42
38
1185
10
2006
10
12
42
32
1205
10
Based on this survey the researchers estimate that 109 of all South Africans over 2 years old were living with HIV in 2008 In 2002 and 2005 this figure was 114 and 108 respectively showing a degree of stabilisation Among those between 15 and 49 years old the estimated HIV prevalence was 169 in 2008 The survey found the prevalence among children aged 2-14 to be 25 down significantly since 2002 when prevalence was 56
Estimated HIV prevalence () among South Africans aged 2 years and older by age 2002-2008
Age
HIV +
HIV -
Children (2-14 years)
25
975
Youth (15-24 years)
87
913
Adults (25 and older)
168
832
(15-49 years)
169
831
Total (2 and older)
109
891
Estimated HIV prevalence among South Africans by age and sex 2008
Age
Male prevalence
Female prevalence
2-14
3
2
15-19
25
67
20-24
51
211
25-29
157
327
30-34
258
291
35-39
185
248
40-44
192
163
45-49
64
141
50-54
104
102
55-59
62
77
60+
35
18
Total
79
136
Among females HIV prevalence is highest in those between 25 and 29 years old among males the peak is in the group aged 30-34 years
HIV prevalence () by province 2002-2008
Province
2002
2005
2008
KwaZulu-Natal
117
165
158
Mpumalanga
141
152
154
Free State
149
126
126
North West
103
109
113
Gauteng
147
108
103
Eastern Cape
66
89
9
Limpopo
98
8
88
Northern Cape
84
54
59
Western Cape
107
19
38
National
114
108
109
The results of this study suggest that KwaZulu-Natal Mpumulanga and Free State have the highest HIV prevalence However the relatively small sample sizes may limit precision and in several cases the ranges of uncertainty overlap
HIV prevalence by population group 2008
Population group
Prevalence ()
African
136
864
White
03
997
Coloured
17
983
Indian
03
997
Studies of AIDS deaths
Latin America
Latin America
Latin America
Latin America
North America
North America
North America
North America
Eastern Europe
Eastern Europe
Eastern Europe
Eastern Europe
Western Europe
Western Europe
Western Europe
Western Europe
Asia Pacific
Asia Pacific
Asia Pacific
Asia Pacific
Africa
Africa
Africa
Africa
Country
Study starts
Subjects randomised
SubjectsStudy
USA
32
4385
13703125
Russia
20
788
394
Germany
19
1883
991052631579
UK
13
265
203846153846
South Africa
12
347
289166666667
Argentina
12
329
274166666667
Australia
11
195
177272727273
India
7
275
392857142857
Brazil
3
115
383333333333
Country
Initiation
Site activation
Recruitment
LOC setup
Unproductive sites
(Approval ndash FCI)
(FCI ndash FSFV)
(FSFV ndash LSFV)
(CPC ndash FSFV)
South Africa
19
38
153
357
21
Australia
117
63
401
239
11
Germany
16
37
401
224
21
UK
9
101
301
346
20
Russia
11
52
174
334
9
India
31
28
389
431
3
Argentina
94
67
288
32
13
Brazil
79
59
94
656
20
USA
44
31
149
26
Country
Pts Rand
Sites
Av CPP
Cost Per Country
Ethics Subm
Regulatory Fees
Add Inv Fees
CT Scan Total
Ethics + Regulatory
Total Regulatory Fees
South Africa
25
5
7250
181250
290
460
363
0
750
1113
Canada
18
4
832545
14985818
181818
0
0
1557576
181818
1818
Italy
7
2
10000
70000
2200
0
0
0
2200
2200
Germany
55
10
7000
385000
3000
0
0
12000
3000
3000
Peru
40
5
7000
280000
1500
1000
2000
60000
2500
4500
Poland
15
4
10000
150000
0
2500
2400
0
2500
4900
Spain
40
7
10500
420000
0
0
5450
0
0
5450
UK
12
4
13000
156000
0
0
5556
0
0
5556
Bulgaria
18
4
10000
180000
0
5000
1000
0
5000
6000
Taiwan
20
4
1179649
2359298
104167
313
5208
0
135467
6563
Czech Rep
10
2
10000
100000
1500
3000
3000
0
4500
7500
Greece
40
7
9000
360000
0
7500
0
0
7500
7500
Chile
15
4
10840
162600
1700
3600
3000
0
5300
8300
Belgium
25
6
12200
305000
3992
4332
0
0
8324
8324
Korea
30
3
10827
324802
1114
0
14324
0
1114
15438
Singapore
10
2
11565
115650
1750
0
17975
0
1750
19725
France
50
10
9000
450000
0
0
20000
0
0
20000
China
39
5
4978
194142
5224
0
39814
0
5224
40336
New Zealand
10
3
145244
145244
1973
0
43123
0
1973
45096
Israel
10
6
11140
111400
2060
3000
48400
16500
5060
53460
Brazil
30
6
10000
300000
2000
287356
5649202
0
487356
61366
Australia
24
6
40200
964800
0
500
82500
0
500
83000
23
543
109
532856799
3304716
26939
27700043
73748966
[1753EURO x 14 (ex rate) = $2454] [ $245416 hours=$153hour]
1095625
1095625
12271
1753
198089
198089
208514736842
South Africa
Canada
Italy
Germany
Peru
Poland
Spain
UK
Bulgaria
Taiwan
Czech Rep
Greece
Chile
Belgium
Korea
Singapore
France
China
New Zealand
Israel
Brazil
Australia
Country
Study starts
Subjects randomised
SubjectsStudy
USA
32
4385
13703125
Russia
20
788
394
Germany
19
1883
991052631579
UK
13
265
203846153846
South Africa
12
347
289166666667
Argentina
12
329
274166666667
Australia
11
195
177272727273
India
7
275
392857142857
Brazil
3
115
383333333333
Country
Initiation
Site activation
Recruitment
LOC setup
Unproductive sites
(Approval ndash FCI)
(FCI ndash FSFV)
(FSFV ndash LSFV)
(CPC ndash FSFV)
South Africa
19
38
153
357
21
Australia
117
63
401
239
11
Germany
16
37
401
224
21
UK
9
101
301
346
20
Russia
11
52
174
334
9
India
31
28
389
431
3
Argentina
94
67
288
32
13
Brazil
79
59
94
656
20
USA
44
31
149
26
Country
Pts Rand
Sites
Av CPP
Cost Per Country
Ethics Subm
Regulatory Fees
Add Inv Fees
CT Scan Total
Ethics + Regulatory
Total Regulatory Fees
China
39
5
4978
194142
522
0
39814
0
522
40336
Germany
55
10
7000
385000
3000
0
0
12000
3000
3000
Peru
40
5
7000
280000
1500
1000
2000
60000
2500
4500
South Africa
25
5
7250
181250
290
460
363
0
750
1113
Canada
18
4
8325
149858
1818
0
0
1557576
1818
1818
Greece
40
7
9000
360000
0
7500
0
0
7500
7500
France
50
10
9000
450000
0
0
20000
0
0
20000
Italy
7
2
10000
70000
2200
0
0
0
2200
2200
Poland
15
4
10000
150000
0
2500
2400
0
2500
4900
Bulgaria
18
4
10000
180000
0
5000
1000
0
5000
6000
Czech Rep
10
2
10000
100000
1500
3000
3000
0
4500
7500
Brazil
30
6
10000
300000
2000
2874
56492
0
4874
61366
Spain
40
7
10500
420000
0
0
5450
0
0
5450
Korea
30
3
10827
324802
1114
0
14324
0
1114
15438
Chile
15
4
10840
162600
1700
3600
3000
0
5300
8300
Israel
10
6
11140
111400
2060
3000
48400
16500
5060
53460
Singapore
10
2
11565
115650
1750
0
17975
0
1750
19725
Taiwan
20
4
11796
235930
1042
313
5208
0
1355
6563
Belgium
25
6
12200
305000
3992
4332
0
0
8324
8324
UK
12
4
13000
156000
0
0
5556
0
0
5556
New Zealand
10
3
14524
145244
1973
0
43123
0
1973
45096
Australia
24
6
40200
964800
0
500
82500
0
500
83000
23
543
109
5328568
33047
26939
277000
73748966
[1753EURO x 14 (ex rate) = $2454] [ $245416 hours=$153hour]
110
1095625
1227
1753
19809
20
21
China
Germany
Peru
South Africa
Canada
Greece
France
Italy
Poland
Bulgaria
Czech Rep
Brazil
Spain
Korea
Chile
Israel
Singapore
Taiwan
Belgium
UK
New Zealand
Australia
28
0
1
2
3
4
5
6
7
8
9
10
Belg
ium
Au
stria
Li
thua
nia
Can
ada
Luxe
mbo
urg
Mal
ta
Nor
way
Po
rtuga
l R
oman
ia
Rus
sia
Serb
ia
Swed
en
The
Net
herla
nds
USA
loca
l site
s U
SA c
entra
l site
C
zech
Rep
ublic
D
enm
ark
Esto
nia
Finl
and
Hun
gary
Ic
elan
d Ire
land
La
tvia
G
erm
any
Switz
erla
nd
Liec
hten
stei
n U
nite
d Ki
ngdo
m
Fran
ce
Italy
Au
stra
lia
Hon
g-Ko
ng
New
Zea
land
Si
ngap
ore
Taiw
an
Uga
nda
Pola
nd
Ukr
aine
C
hile
G
uate
mal
a Ja
pan
Isra
el
Slov
akia
Bu
lgar
ia
Gre
ece
Mal
aysi
a Ph
ilipp
ines
Pe
ru
Thai
land
Tu
rkey
Sl
oven
ia
Cos
ta R
ica
Mex
ico
Spai
n So
uth
Afric
a Ar
gent
ina
Sout
h Ko
rea
Col
ombi
a Pa
nam
a C
roat
ia
Indi
a Ve
nezu
ela
Braz
il C
hina
Mon
ths
Sout
h Afri
ca
Global Regulatory Review Timelines
Triclinium experience 2009-2015
Triclinium experience 2009 - 2015
29
Protocol release Country selection
Site Selection Collection of reg docs
Submission of RA application
EC application
Negotiate Site Contracts
EC Approvals
RA Approval amp Import permit
Site Initiation Import amp distribute drug
Import ancillary supplies Set up local labs
Set up EDC
Months
0
1
2
3
All EC approvals typically within 6
weeks
Site contracts signed within days
As soon as MCC approval obtained ALL sites can be initiated
Start-Up Activities in PARALLEL
GMO application (biologics)
30
0
2000
4000
6000
8000
10000
12000
14000C
hina
Ger
man
y
Per
u
Sou
th A
frica
Can
ada
Gre
ece
Fran
ce
Italy
Pol
and
Bul
garia
Cze
ch R
ep
Bra
zil
Spa
in
Kor
ea
Chi
le
Isra
el
Sin
gapo
re
Taiw
an
Bel
gium U
K
New
hellip
Aus
tralia
Source Bayer Presented SACRA Conference 2009
Aver
age
cost
per
pat
ient
(Eur
o)
Average Cost per Enrolled Participant
gt40000
Chart1
Average Cost Per Patient (Euro)
4978
7000
7000
7250
832545
9000
9000
10000
10000
10000
10000
10000
10500
10827
10840
11140
11565
1179649
12200
13000
145244
40200
Sheet1
Sheet2
Sheet2
Average Cost Per Patient (Euro)
Average Cost Per Patient
Sheet4
Ethics Subm
Regulatory Fees
Sheet3
Ethics + Regulatory
Total Ethics and Regulatory Fees
Add Inv Fees
Additional Investigator Application Fees
Total Regulatory Fees
Study starts
SubjectsStudy
31
Euro
0
10000
20000
30000
40000
50000
60000
70000
80000
90000S
outh
Afri
caC
anad
a
Italy
Ger
man
yP
eru
Pol
and
Spa
in UK
Bul
garia
Taiw
anC
zech
Rep
Gre
ece
Chi
leB
elgi
umK
orea
Sin
gapo
reFr
ance
Chi
naN
ew Z
eala
ndIs
rael
Bra
zil
Aus
tralia
Source Bayer Presented SACRA Conference 2009
Eur
os
Regulatory Application Fees
Chart1
Total Regulatory Fees
1113
181818
2200
3000
4500
4900
5450
5556
6000
656267
7500
7500
8300
8324
15438
19725
20000
403364
45096
53460
6136558
83000
Sheet1
Sheet2
Sheet2
Average Cost Per Patient (Euro)
Average Cost Per Patient
Sheet4
Ethics Subm
Regulatory Fees
Sheet3
Ethics + Regulatory
Total Ethics and Regulatory Fees
Add Inv Fees
Additional Investigator Application Fees
Total Regulatory Fees
Study starts
SubjectsStudy
32
SA Clinical Trial Regulatory Processes
Governed by SA-GCP and Declaration of Helsinki SA National Clinical Trials Register (SANCTR) Medicines Control Council (National Regulatory Authority)
o New protocols o Amendments o Additional sitesinvestigators
Ethics Committees (33 NHREC-registered) RegionalMunicipal DoH Export permits for bio samples (Nat Health Act 2003)
Clinical Trial Density Active sites million population
Nature Reviews Drug Discovery 7 13-14 (January 2008)
France 503
Germany 512 Canada
922
USA 1203
Czech Republic 776
553 sites
South Africa 119
757 sites
757 sites
533 sites
1084 sites
Argentina 269
Russia 77
China 04
India 07
34
Gateway to Africa
35
Why Africa bull Large accessible population relatively new to clinical trials
bull Experienced and willing investigators
bull Many clinical trial sites established by PDPs NGOs etc
bull Expanding therapeutic areas shifting burden of disease from
infectious to non-communicable diseases
bull Significantly improved infrastructure and accessibility
bull Rapidly evolving regulatory and ethics procedures
bull Potential for capacity building and sustainable clinical trial potential
36
Relatively young GCP culture Resident mentorships to build capacity Locations ndash accessibility for site monitoring Variable infrastructure esp electricity connectivity and
transportation Resourcing of public healthcare systems
Sub-Saharan Africa challenges
37
bull Second-largest continent
bull Spans NS and EW hemispheres
bull Second most populous continent 2014 estimate 1069 billion
bull Home to more than a quarter of the 196 independent countries
bull All 54 African countries are UN members
bull 39 urban population
bull 12 metropolitan areas gt 4m
bull gt 3000 distinct ethnicities
bull gt 2000 languages spoken
AFRICA hellip the true size
wwwcitypopulationdeworldAgglomerations 2015
38
SSV to SIV
0
5
10
15
20
25
30
35
40
45
Africa North America
Asia Pacific
Western Europe
Eastern Europe
Latin America
Source Quintiles South Africa SACRA Conference 2008
Wee
ks (A
vera
ge)
Start-Up Timelines
39
Region Median
Patients Site
of Sites
0 pts 1 - 3 pts 4 - 9 pts 10+ pts
Latin America 40 21 26 30 23
North America 30 29 29 24 18
Eastern Europe 60 15 31 26 27
Western Europe 40 15 22 29 34
Asia Pacific 40 19 30 34 18
Africa 100 4 17 28 51
Enrollment performance by region for 2008
Site Performance
Source Quintiles South Africa Presented SACRA Conference 2009
40
0 1 2 3 4 5 6 7 8 9
10
Latin America
North America
Eastern Europe
Western Europe
Asia Pacific
Africa
Num
ber o
f par
ticip
ants
MEDIAN site enrollment by region for 2008
Source Quintiles South Africa Presented SACRA Conference 2009
Site Performance
41
Source Quintiles South Africa Presented SACRA Conference 2009
s
ites
0
5
10
15
20
25
30
35
40
45
50
LatinAmerica
NorthAmerica
EasternEurope
WesternEurope
Asia Pacific Africa
0 pts
1 - 3 pts
4 - 9 pts
10+ pts
Enrollment performance by region for 2008
Site Performance
Chart1
0 pts
1 - 3 pts
4 - 9 pts
10+ pts
021
026
03
023
029
029
024
018
015
031
026
027
015
022
029
034
019
03
034
018
004
017
028
051
HIV
HIV
Resiratory amp Cancer
Male prevalence
Female prevalence
CVS
Overall death rates
Overall death rates
COPD
Asthma
Tracheabronchial lung cancer
Oesophageal cancer
prostate cancer
Trial metrics
COPD
Asthma
Tracheabronchial lung cancer
Oesophageal cancer
Prostate cancer
Cervical cancer
Breast cancer
Stroke
ill-defined heart disease
Diabetes mellitus
Ischaemic heart disease
Hypertension
Nephritisnephrosis
Stroke
ill-defined heart disease
Diabetes mellitus
Ischaemic heart disease
Hypertension
Nephritisnephrosis
Males
Female
UN - Male
SA 1997
SA 2004
UN - Female
SA 1997
SA 2004
0 pts
1 - 3 pts
4 - 9 pts
10+ pts
42
Source wwwclinicaltrialsgov 22-Oct-2010
Clinical trials registered across Africa
43
0
500
1000
1500
2000
2500
South Africa Kenya Malawi Tanzania Uganda Zambia
Selected African countries
2005
2010
2015
Source ClinTrialsgov
Trend 2005 - 2015
Source wwwclinicaltrialsgov 28-Aug-2015
44
AFRICA FOUND IN TRANSLATION
bull Vast treatment-naiumlve population bull Cost advantages (still) bull Diverse ethnicity amp morbidity bull Inverse seasonality bull Site capacity-building widely implemented bull Robust regulatory review bull Variable but generally good regulatory timelines bull Established GCP culture ndash sites and home-bred CROs
45
THANK YOU
Foliennummer 1
Triclinium A South African CRO
Collaboration with VPM SII
Vaccine Trials in SA 2015
Foliennummer 5
Foliennummer 6
Foliennummer 7
Foliennummer 8
Foliennummer 9
Foliennummer 10
Foliennummer 11
Foliennummer 12
Foliennummer 13
Foliennummer 14
Foliennummer 15
Foliennummer 16
Foliennummer 17
Distribution of clinical trial sites
Foliennummer 19
South Africa Leading Causes of Death
Foliennummer 21
Foliennummer 22
South Africa TB deaths by age group
Foliennummer 24
Foliennummer 25
Foliennummer 26
Foliennummer 27
Foliennummer 28
Foliennummer 29
Foliennummer 30
Foliennummer 31
SA Clinical Trial Regulatory Processes
Clinical Trial Density Active sites million population
Foliennummer 34
Why Africa
Foliennummer 36
AFRICA hellip the true size
SSV to SIV
Foliennummer 39
Foliennummer 40
Foliennummer 41
Foliennummer 42
Foliennummer 43
AFRICA FOUND IN TRANSLATION
Foliennummer 45
Region
Median
of Sites
Patients Site
0 pts
1 - 3 pts
4 - 9 pts
10+ pts
Latin America
4
21
26
30
23
North America
3
29
29
24
18
Eastern Europe
6
15
31
26
27
Western Europe
4
15
22
29
34
Asia Pacific
4
19
30
34
18
Africa
10
4
17
28
51
0 pts
1 - 3 pts
4 - 9 pts
10+ pts
Latin America
21
26
30
23
North America
29
29
24
18
Eastern Europe
15
31
26
27
Western Europe
15
22
29
34
Asia Pacific
19
30
34
18
Africa
4
17
28
51
Males
Female
15-19
210
150
20-24
340
205
25-29
395
300
30-34
460
360
35-39
600
405
40-44
800
500
45-49
1100
700
50-54
1600
1050
55-54
2300
1580
60-64
3340
2250
UN - Male
SA 1997
SA 2004
UN - Female
SA 1997
SA 2004
15-19
210
235
216
150
165
187
20-24
340
381
555
205
331
1085
25-29
395
625
1081
300
452
1985
30-34
460
817
2118
360
489
2267
35-39
600
916
2498
405
526
1890
40-44
800
1136
2765
500
615
1548
45-49
1100
1486
2744
700
800
1400
50-54
1600
2016
2979
1050
1116
1506
55-54
2300
2838
3270
1580
1626
1717
60-64
3340
3614
4146
2250
2201
2360
Stroke
ill-defined heart disease
Diabetes mellitus
Ischaemic heart disease
Hypertension
Nephritisnephrosis
Stroke
ill-defined heart disease
Diabetes mellitus
Ischaemic heart disease
Hypertension
Nephritisnephrosis
1999
34
345
20
248
14
10
1999
295
246
23
10
145
68
2000
36
362
218
249
152
112
2000
318
268
241
108
16
8
2001
35
372
22
25
15
125
2001
322
28
252
102
162
95
2002
405
298
24
26
147
126
2002
352
295
27
115
16
10
2003
425
32
245
285
152
15
2003
382
299
285
122
17
12
2004
39
325
255
26
165
16
2004
35
30
295
121
19
119
2005
36
328
265
26
15
162
2005
325
30
32
12
18
12
2006
35
336
27
258
155
16
2006
33
32
32
11
18
125
COPD
Asthma
Tracheabronchial lung cancer
Oesophageal cancer
prostate cancer
Cervical cancer
Breast cancer
1999
2001
12
135
10
26
2000
204
116
13
92
28
2001
222
131
133
96
27
2002
23
144
128
95
285
2003
243
149
124
94
29
2004
229
154
1255
87
29
2005
224
152
122
82
295
2006
224
136
116
75
3
COPD
Asthma
Tracheabronchial lung cancer
Oesophageal cancer
Prostate cancer
Cervical cancer
Breast cancer
1999
88
92
43
41
106
82
2000
96
95
4
43
11
81
2001
10
109
4
4
111
89
2002
10
116
4
4
112
85
2003
11
124
4
395
116
85
2004
102
1295
44
39
115
101
2005
105
128
42
38
1185
10
2006
10
12
42
32
1205
10
Based on this survey the researchers estimate that 109 of all South Africans over 2 years old were living with HIV in 2008 In 2002 and 2005 this figure was 114 and 108 respectively showing a degree of stabilisation Among those between 15 and 49 years old the estimated HIV prevalence was 169 in 2008 The survey found the prevalence among children aged 2-14 to be 25 down significantly since 2002 when prevalence was 56
Estimated HIV prevalence () among South Africans aged 2 years and older by age 2002-2008
Age
HIV +
HIV -
Children (2-14 years)
25
975
Youth (15-24 years)
87
913
Adults (25 and older)
168
832
(15-49 years)
169
831
Total (2 and older)
109
891
Estimated HIV prevalence among South Africans by age and sex 2008
Age
Male prevalence
Female prevalence
2-14
3
2
15-19
25
67
20-24
51
211
25-29
157
327
30-34
258
291
35-39
185
248
40-44
192
163
45-49
64
141
50-54
104
102
55-59
62
77
60+
35
18
Total
79
136
Among females HIV prevalence is highest in those between 25 and 29 years old among males the peak is in the group aged 30-34 years
HIV prevalence () by province 2002-2008
Province
2002
2005
2008
KwaZulu-Natal
117
165
158
Mpumalanga
141
152
154
Free State
149
126
126
North West
103
109
113
Gauteng
147
108
103
Eastern Cape
66
89
9
Limpopo
98
8
88
Northern Cape
84
54
59
Western Cape
107
19
38
National
114
108
109
The results of this study suggest that KwaZulu-Natal Mpumulanga and Free State have the highest HIV prevalence However the relatively small sample sizes may limit precision and in several cases the ranges of uncertainty overlap
HIV prevalence by population group 2008
Population group
Prevalence ()
African
136
864
White
03
997
Coloured
17
983
Indian
03
997
Studies of AIDS deaths
Latin America
Latin America
Latin America
Latin America
North America
North America
North America
North America
Eastern Europe
Eastern Europe
Eastern Europe
Eastern Europe
Western Europe
Western Europe
Western Europe
Western Europe
Asia Pacific
Asia Pacific
Asia Pacific
Asia Pacific
Africa
Africa
Africa
Africa
Country
Study starts
Subjects randomised
SubjectsStudy
USA
32
4385
13703125
Russia
20
788
394
Germany
19
1883
991052631579
UK
13
265
203846153846
South Africa
12
347
289166666667
Argentina
12
329
274166666667
Australia
11
195
177272727273
India
7
275
392857142857
Brazil
3
115
383333333333
Country
Initiation
Site activation
Recruitment
LOC setup
Unproductive sites
(Approval ndash FCI)
(FCI ndash FSFV)
(FSFV ndash LSFV)
(CPC ndash FSFV)
South Africa
19
38
153
357
21
Australia
117
63
401
239
11
Germany
16
37
401
224
21
UK
9
101
301
346
20
Russia
11
52
174
334
9
India
31
28
389
431
3
Argentina
94
67
288
32
13
Brazil
79
59
94
656
20
USA
44
31
149
26
Country
Pts Rand
Sites
Av CPP
Cost Per Country
Ethics Subm
Regulatory Fees
Add Inv Fees
CT Scan Total
Ethics + Regulatory
Total Regulatory Fees
South Africa
25
5
7250
181250
290
460
363
0
750
1113
Canada
18
4
832545
14985818
181818
0
0
1557576
181818
1818
Italy
7
2
10000
70000
2200
0
0
0
2200
2200
Germany
55
10
7000
385000
3000
0
0
12000
3000
3000
Peru
40
5
7000
280000
1500
1000
2000
60000
2500
4500
Poland
15
4
10000
150000
0
2500
2400
0
2500
4900
Spain
40
7
10500
420000
0
0
5450
0
0
5450
UK
12
4
13000
156000
0
0
5556
0
0
5556
Bulgaria
18
4
10000
180000
0
5000
1000
0
5000
6000
Taiwan
20
4
1179649
2359298
104167
313
5208
0
135467
6563
Czech Rep
10
2
10000
100000
1500
3000
3000
0
4500
7500
Greece
40
7
9000
360000
0
7500
0
0
7500
7500
Chile
15
4
10840
162600
1700
3600
3000
0
5300
8300
Belgium
25
6
12200
305000
3992
4332
0
0
8324
8324
Korea
30
3
10827
324802
1114
0
14324
0
1114
15438
Singapore
10
2
11565
115650
1750
0
17975
0
1750
19725
France
50
10
9000
450000
0
0
20000
0
0
20000
China
39
5
4978
194142
5224
0
39814
0
5224
40336
New Zealand
10
3
145244
145244
1973
0
43123
0
1973
45096
Israel
10
6
11140
111400
2060
3000
48400
16500
5060
53460
Brazil
30
6
10000
300000
2000
287356
5649202
0
487356
61366
Australia
24
6
40200
964800
0
500
82500
0
500
83000
23
543
109
532856799
3304716
26939
27700043
73748966
[1753EURO x 14 (ex rate) = $2454] [ $245416 hours=$153hour]
1095625
1095625
12271
1753
198089
198089
208514736842
South Africa
Canada
Italy
Germany
Peru
Poland
Spain
UK
Bulgaria
Taiwan
Czech Rep
Greece
Chile
Belgium
Korea
Singapore
France
China
New Zealand
Israel
Brazil
Australia
Country
Study starts
Subjects randomised
SubjectsStudy
USA
32
4385
13703125
Russia
20
788
394
Germany
19
1883
991052631579
UK
13
265
203846153846
South Africa
12
347
289166666667
Argentina
12
329
274166666667
Australia
11
195
177272727273
India
7
275
392857142857
Brazil
3
115
383333333333
Country
Initiation
Site activation
Recruitment
LOC setup
Unproductive sites
(Approval ndash FCI)
(FCI ndash FSFV)
(FSFV ndash LSFV)
(CPC ndash FSFV)
South Africa
19
38
153
357
21
Australia
117
63
401
239
11
Germany
16
37
401
224
21
UK
9
101
301
346
20
Russia
11
52
174
334
9
India
31
28
389
431
3
Argentina
94
67
288
32
13
Brazil
79
59
94
656
20
USA
44
31
149
26
Country
Pts Rand
Sites
Av CPP
Cost Per Country
Ethics Subm
Regulatory Fees
Add Inv Fees
CT Scan Total
Ethics + Regulatory
Total Regulatory Fees
China
39
5
4978
194142
522
0
39814
0
522
40336
Germany
55
10
7000
385000
3000
0
0
12000
3000
3000
Peru
40
5
7000
280000
1500
1000
2000
60000
2500
4500
South Africa
25
5
7250
181250
290
460
363
0
750
1113
Canada
18
4
8325
149858
1818
0
0
1557576
1818
1818
Greece
40
7
9000
360000
0
7500
0
0
7500
7500
France
50
10
9000
450000
0
0
20000
0
0
20000
Italy
7
2
10000
70000
2200
0
0
0
2200
2200
Poland
15
4
10000
150000
0
2500
2400
0
2500
4900
Bulgaria
18
4
10000
180000
0
5000
1000
0
5000
6000
Czech Rep
10
2
10000
100000
1500
3000
3000
0
4500
7500
Brazil
30
6
10000
300000
2000
2874
56492
0
4874
61366
Spain
40
7
10500
420000
0
0
5450
0
0
5450
Korea
30
3
10827
324802
1114
0
14324
0
1114
15438
Chile
15
4
10840
162600
1700
3600
3000
0
5300
8300
Israel
10
6
11140
111400
2060
3000
48400
16500
5060
53460
Singapore
10
2
11565
115650
1750
0
17975
0
1750
19725
Taiwan
20
4
11796
235930
1042
313
5208
0
1355
6563
Belgium
25
6
12200
305000
3992
4332
0
0
8324
8324
UK
12
4
13000
156000
0
0
5556
0
0
5556
New Zealand
10
3
14524
145244
1973
0
43123
0
1973
45096
Australia
24
6
40200
964800
0
500
82500
0
500
83000
23
543
109
5328568
33047
26939
277000
73748966
[1753EURO x 14 (ex rate) = $2454] [ $245416 hours=$153hour]
110
1095625
1227
1753
19809
20
21
China
Germany
Peru
South Africa
Canada
Greece
France
Italy
Poland
Bulgaria
Czech Rep
Brazil
Spain
Korea
Chile
Israel
Singapore
Taiwan
Belgium
UK
New Zealand
Australia
29
Protocol release Country selection
Site Selection Collection of reg docs
Submission of RA application
EC application
Negotiate Site Contracts
EC Approvals
RA Approval amp Import permit
Site Initiation Import amp distribute drug
Import ancillary supplies Set up local labs
Set up EDC
Months
0
1
2
3
All EC approvals typically within 6
weeks
Site contracts signed within days
As soon as MCC approval obtained ALL sites can be initiated
Start-Up Activities in PARALLEL
GMO application (biologics)
30
0
2000
4000
6000
8000
10000
12000
14000C
hina
Ger
man
y
Per
u
Sou
th A
frica
Can
ada
Gre
ece
Fran
ce
Italy
Pol
and
Bul
garia
Cze
ch R
ep
Bra
zil
Spa
in
Kor
ea
Chi
le
Isra
el
Sin
gapo
re
Taiw
an
Bel
gium U
K
New
hellip
Aus
tralia
Source Bayer Presented SACRA Conference 2009
Aver
age
cost
per
pat
ient
(Eur
o)
Average Cost per Enrolled Participant
gt40000
Chart1
Average Cost Per Patient (Euro)
4978
7000
7000
7250
832545
9000
9000
10000
10000
10000
10000
10000
10500
10827
10840
11140
11565
1179649
12200
13000
145244
40200
Sheet1
Sheet2
Sheet2
Average Cost Per Patient (Euro)
Average Cost Per Patient
Sheet4
Ethics Subm
Regulatory Fees
Sheet3
Ethics + Regulatory
Total Ethics and Regulatory Fees
Add Inv Fees
Additional Investigator Application Fees
Total Regulatory Fees
Study starts
SubjectsStudy
31
Euro
0
10000
20000
30000
40000
50000
60000
70000
80000
90000S
outh
Afri
caC
anad
a
Italy
Ger
man
yP
eru
Pol
and
Spa
in UK
Bul
garia
Taiw
anC
zech
Rep
Gre
ece
Chi
leB
elgi
umK
orea
Sin
gapo
reFr
ance
Chi
naN
ew Z
eala
ndIs
rael
Bra
zil
Aus
tralia
Source Bayer Presented SACRA Conference 2009
Eur
os
Regulatory Application Fees
Chart1
Total Regulatory Fees
1113
181818
2200
3000
4500
4900
5450
5556
6000
656267
7500
7500
8300
8324
15438
19725
20000
403364
45096
53460
6136558
83000
Sheet1
Sheet2
Sheet2
Average Cost Per Patient (Euro)
Average Cost Per Patient
Sheet4
Ethics Subm
Regulatory Fees
Sheet3
Ethics + Regulatory
Total Ethics and Regulatory Fees
Add Inv Fees
Additional Investigator Application Fees
Total Regulatory Fees
Study starts
SubjectsStudy
32
SA Clinical Trial Regulatory Processes
Governed by SA-GCP and Declaration of Helsinki SA National Clinical Trials Register (SANCTR) Medicines Control Council (National Regulatory Authority)
o New protocols o Amendments o Additional sitesinvestigators
Ethics Committees (33 NHREC-registered) RegionalMunicipal DoH Export permits for bio samples (Nat Health Act 2003)
Clinical Trial Density Active sites million population
Nature Reviews Drug Discovery 7 13-14 (January 2008)
France 503
Germany 512 Canada
922
USA 1203
Czech Republic 776
553 sites
South Africa 119
757 sites
757 sites
533 sites
1084 sites
Argentina 269
Russia 77
China 04
India 07
34
Gateway to Africa
35
Why Africa bull Large accessible population relatively new to clinical trials
bull Experienced and willing investigators
bull Many clinical trial sites established by PDPs NGOs etc
bull Expanding therapeutic areas shifting burden of disease from
infectious to non-communicable diseases
bull Significantly improved infrastructure and accessibility
bull Rapidly evolving regulatory and ethics procedures
bull Potential for capacity building and sustainable clinical trial potential
36
Relatively young GCP culture Resident mentorships to build capacity Locations ndash accessibility for site monitoring Variable infrastructure esp electricity connectivity and
transportation Resourcing of public healthcare systems
Sub-Saharan Africa challenges
37
bull Second-largest continent
bull Spans NS and EW hemispheres
bull Second most populous continent 2014 estimate 1069 billion
bull Home to more than a quarter of the 196 independent countries
bull All 54 African countries are UN members
bull 39 urban population
bull 12 metropolitan areas gt 4m
bull gt 3000 distinct ethnicities
bull gt 2000 languages spoken
AFRICA hellip the true size
wwwcitypopulationdeworldAgglomerations 2015
38
SSV to SIV
0
5
10
15
20
25
30
35
40
45
Africa North America
Asia Pacific
Western Europe
Eastern Europe
Latin America
Source Quintiles South Africa SACRA Conference 2008
Wee
ks (A
vera
ge)
Start-Up Timelines
39
Region Median
Patients Site
of Sites
0 pts 1 - 3 pts 4 - 9 pts 10+ pts
Latin America 40 21 26 30 23
North America 30 29 29 24 18
Eastern Europe 60 15 31 26 27
Western Europe 40 15 22 29 34
Asia Pacific 40 19 30 34 18
Africa 100 4 17 28 51
Enrollment performance by region for 2008
Site Performance
Source Quintiles South Africa Presented SACRA Conference 2009
40
0 1 2 3 4 5 6 7 8 9
10
Latin America
North America
Eastern Europe
Western Europe
Asia Pacific
Africa
Num
ber o
f par
ticip
ants
MEDIAN site enrollment by region for 2008
Source Quintiles South Africa Presented SACRA Conference 2009
Site Performance
41
Source Quintiles South Africa Presented SACRA Conference 2009
s
ites
0
5
10
15
20
25
30
35
40
45
50
LatinAmerica
NorthAmerica
EasternEurope
WesternEurope
Asia Pacific Africa
0 pts
1 - 3 pts
4 - 9 pts
10+ pts
Enrollment performance by region for 2008
Site Performance
Chart1
0 pts
1 - 3 pts
4 - 9 pts
10+ pts
021
026
03
023
029
029
024
018
015
031
026
027
015
022
029
034
019
03
034
018
004
017
028
051
HIV
HIV
Resiratory amp Cancer
Male prevalence
Female prevalence
CVS
Overall death rates
Overall death rates
COPD
Asthma
Tracheabronchial lung cancer
Oesophageal cancer
prostate cancer
Trial metrics
COPD
Asthma
Tracheabronchial lung cancer
Oesophageal cancer
Prostate cancer
Cervical cancer
Breast cancer
Stroke
ill-defined heart disease
Diabetes mellitus
Ischaemic heart disease
Hypertension
Nephritisnephrosis
Stroke
ill-defined heart disease
Diabetes mellitus
Ischaemic heart disease
Hypertension
Nephritisnephrosis
Males
Female
UN - Male
SA 1997
SA 2004
UN - Female
SA 1997
SA 2004
0 pts
1 - 3 pts
4 - 9 pts
10+ pts
42
Source wwwclinicaltrialsgov 22-Oct-2010
Clinical trials registered across Africa
43
0
500
1000
1500
2000
2500
South Africa Kenya Malawi Tanzania Uganda Zambia
Selected African countries
2005
2010
2015
Source ClinTrialsgov
Trend 2005 - 2015
Source wwwclinicaltrialsgov 28-Aug-2015
44
AFRICA FOUND IN TRANSLATION
bull Vast treatment-naiumlve population bull Cost advantages (still) bull Diverse ethnicity amp morbidity bull Inverse seasonality bull Site capacity-building widely implemented bull Robust regulatory review bull Variable but generally good regulatory timelines bull Established GCP culture ndash sites and home-bred CROs
45
THANK YOU
Foliennummer 1
Triclinium A South African CRO
Collaboration with VPM SII
Vaccine Trials in SA 2015
Foliennummer 5
Foliennummer 6
Foliennummer 7
Foliennummer 8
Foliennummer 9
Foliennummer 10
Foliennummer 11
Foliennummer 12
Foliennummer 13
Foliennummer 14
Foliennummer 15
Foliennummer 16
Foliennummer 17
Distribution of clinical trial sites
Foliennummer 19
South Africa Leading Causes of Death
Foliennummer 21
Foliennummer 22
South Africa TB deaths by age group
Foliennummer 24
Foliennummer 25
Foliennummer 26
Foliennummer 27
Foliennummer 28
Foliennummer 29
Foliennummer 30
Foliennummer 31
SA Clinical Trial Regulatory Processes
Clinical Trial Density Active sites million population
Foliennummer 34
Why Africa
Foliennummer 36
AFRICA hellip the true size
SSV to SIV
Foliennummer 39
Foliennummer 40
Foliennummer 41
Foliennummer 42
Foliennummer 43
AFRICA FOUND IN TRANSLATION
Foliennummer 45
Region
Median
of Sites
Patients Site
0 pts
1 - 3 pts
4 - 9 pts
10+ pts
Latin America
4
21
26
30
23
North America
3
29
29
24
18
Eastern Europe
6
15
31
26
27
Western Europe
4
15
22
29
34
Asia Pacific
4
19
30
34
18
Africa
10
4
17
28
51
0 pts
1 - 3 pts
4 - 9 pts
10+ pts
Latin America
21
26
30
23
North America
29
29
24
18
Eastern Europe
15
31
26
27
Western Europe
15
22
29
34
Asia Pacific
19
30
34
18
Africa
4
17
28
51
Males
Female
15-19
210
150
20-24
340
205
25-29
395
300
30-34
460
360
35-39
600
405
40-44
800
500
45-49
1100
700
50-54
1600
1050
55-54
2300
1580
60-64
3340
2250
UN - Male
SA 1997
SA 2004
UN - Female
SA 1997
SA 2004
15-19
210
235
216
150
165
187
20-24
340
381
555
205
331
1085
25-29
395
625
1081
300
452
1985
30-34
460
817
2118
360
489
2267
35-39
600
916
2498
405
526
1890
40-44
800
1136
2765
500
615
1548
45-49
1100
1486
2744
700
800
1400
50-54
1600
2016
2979
1050
1116
1506
55-54
2300
2838
3270
1580
1626
1717
60-64
3340
3614
4146
2250
2201
2360
Stroke
ill-defined heart disease
Diabetes mellitus
Ischaemic heart disease
Hypertension
Nephritisnephrosis
Stroke
ill-defined heart disease
Diabetes mellitus
Ischaemic heart disease
Hypertension
Nephritisnephrosis
1999
34
345
20
248
14
10
1999
295
246
23
10
145
68
2000
36
362
218
249
152
112
2000
318
268
241
108
16
8
2001
35
372
22
25
15
125
2001
322
28
252
102
162
95
2002
405
298
24
26
147
126
2002
352
295
27
115
16
10
2003
425
32
245
285
152
15
2003
382
299
285
122
17
12
2004
39
325
255
26
165
16
2004
35
30
295
121
19
119
2005
36
328
265
26
15
162
2005
325
30
32
12
18
12
2006
35
336
27
258
155
16
2006
33
32
32
11
18
125
COPD
Asthma
Tracheabronchial lung cancer
Oesophageal cancer
prostate cancer
Cervical cancer
Breast cancer
1999
2001
12
135
10
26
2000
204
116
13
92
28
2001
222
131
133
96
27
2002
23
144
128
95
285
2003
243
149
124
94
29
2004
229
154
1255
87
29
2005
224
152
122
82
295
2006
224
136
116
75
3
COPD
Asthma
Tracheabronchial lung cancer
Oesophageal cancer
Prostate cancer
Cervical cancer
Breast cancer
1999
88
92
43
41
106
82
2000
96
95
4
43
11
81
2001
10
109
4
4
111
89
2002
10
116
4
4
112
85
2003
11
124
4
395
116
85
2004
102
1295
44
39
115
101
2005
105
128
42
38
1185
10
2006
10
12
42
32
1205
10
Based on this survey the researchers estimate that 109 of all South Africans over 2 years old were living with HIV in 2008 In 2002 and 2005 this figure was 114 and 108 respectively showing a degree of stabilisation Among those between 15 and 49 years old the estimated HIV prevalence was 169 in 2008 The survey found the prevalence among children aged 2-14 to be 25 down significantly since 2002 when prevalence was 56
Estimated HIV prevalence () among South Africans aged 2 years and older by age 2002-2008
Age
HIV +
HIV -
Children (2-14 years)
25
975
Youth (15-24 years)
87
913
Adults (25 and older)
168
832
(15-49 years)
169
831
Total (2 and older)
109
891
Estimated HIV prevalence among South Africans by age and sex 2008
Age
Male prevalence
Female prevalence
2-14
3
2
15-19
25
67
20-24
51
211
25-29
157
327
30-34
258
291
35-39
185
248
40-44
192
163
45-49
64
141
50-54
104
102
55-59
62
77
60+
35
18
Total
79
136
Among females HIV prevalence is highest in those between 25 and 29 years old among males the peak is in the group aged 30-34 years
HIV prevalence () by province 2002-2008
Province
2002
2005
2008
KwaZulu-Natal
117
165
158
Mpumalanga
141
152
154
Free State
149
126
126
North West
103
109
113
Gauteng
147
108
103
Eastern Cape
66
89
9
Limpopo
98
8
88
Northern Cape
84
54
59
Western Cape
107
19
38
National
114
108
109
The results of this study suggest that KwaZulu-Natal Mpumulanga and Free State have the highest HIV prevalence However the relatively small sample sizes may limit precision and in several cases the ranges of uncertainty overlap
HIV prevalence by population group 2008
Population group
Prevalence ()
African
136
864
White
03
997
Coloured
17
983
Indian
03
997
Studies of AIDS deaths
Latin America
Latin America
Latin America
Latin America
North America
North America
North America
North America
Eastern Europe
Eastern Europe
Eastern Europe
Eastern Europe
Western Europe
Western Europe
Western Europe
Western Europe
Asia Pacific
Asia Pacific
Asia Pacific
Asia Pacific
Africa
Africa
Africa
Africa
Country
Study starts
Subjects randomised
SubjectsStudy
USA
32
4385
13703125
Russia
20
788
394
Germany
19
1883
991052631579
UK
13
265
203846153846
South Africa
12
347
289166666667
Argentina
12
329
274166666667
Australia
11
195
177272727273
India
7
275
392857142857
Brazil
3
115
383333333333
Country
Initiation
Site activation
Recruitment
LOC setup
Unproductive sites
(Approval ndash FCI)
(FCI ndash FSFV)
(FSFV ndash LSFV)
(CPC ndash FSFV)
South Africa
19
38
153
357
21
Australia
117
63
401
239
11
Germany
16
37
401
224
21
UK
9
101
301
346
20
Russia
11
52
174
334
9
India
31
28
389
431
3
Argentina
94
67
288
32
13
Brazil
79
59
94
656
20
USA
44
31
149
26
Country
Pts Rand
Sites
Av CPP
Cost Per Country
Ethics Subm
Regulatory Fees
Add Inv Fees
CT Scan Total
Ethics + Regulatory
Total Regulatory Fees
South Africa
25
5
7250
181250
290
460
363
0
750
1113
Canada
18
4
832545
14985818
181818
0
0
1557576
181818
1818
Italy
7
2
10000
70000
2200
0
0
0
2200
2200
Germany
55
10
7000
385000
3000
0
0
12000
3000
3000
Peru
40
5
7000
280000
1500
1000
2000
60000
2500
4500
Poland
15
4
10000
150000
0
2500
2400
0
2500
4900
Spain
40
7
10500
420000
0
0
5450
0
0
5450
UK
12
4
13000
156000
0
0
5556
0
0
5556
Bulgaria
18
4
10000
180000
0
5000
1000
0
5000
6000
Taiwan
20
4
1179649
2359298
104167
313
5208
0
135467
6563
Czech Rep
10
2
10000
100000
1500
3000
3000
0
4500
7500
Greece
40
7
9000
360000
0
7500
0
0
7500
7500
Chile
15
4
10840
162600
1700
3600
3000
0
5300
8300
Belgium
25
6
12200
305000
3992
4332
0
0
8324
8324
Korea
30
3
10827
324802
1114
0
14324
0
1114
15438
Singapore
10
2
11565
115650
1750
0
17975
0
1750
19725
France
50
10
9000
450000
0
0
20000
0
0
20000
China
39
5
4978
194142
5224
0
39814
0
5224
40336
New Zealand
10
3
145244
145244
1973
0
43123
0
1973
45096
Israel
10
6
11140
111400
2060
3000
48400
16500
5060
53460
Brazil
30
6
10000
300000
2000
287356
5649202
0
487356
61366
Australia
24
6
40200
964800
0
500
82500
0
500
83000
23
543
109
532856799
3304716
26939
27700043
73748966
[1753EURO x 14 (ex rate) = $2454] [ $245416 hours=$153hour]
1095625
1095625
12271
1753
198089
198089
208514736842
South Africa
Canada
Italy
Germany
Peru
Poland
Spain
UK
Bulgaria
Taiwan
Czech Rep
Greece
Chile
Belgium
Korea
Singapore
France
China
New Zealand
Israel
Brazil
Australia
Country
Study starts
Subjects randomised
SubjectsStudy
USA
32
4385
13703125
Russia
20
788
394
Germany
19
1883
991052631579
UK
13
265
203846153846
South Africa
12
347
289166666667
Argentina
12
329
274166666667
Australia
11
195
177272727273
India
7
275
392857142857
Brazil
3
115
383333333333
Country
Initiation
Site activation
Recruitment
LOC setup
Unproductive sites
(Approval ndash FCI)
(FCI ndash FSFV)
(FSFV ndash LSFV)
(CPC ndash FSFV)
South Africa
19
38
153
357
21
Australia
117
63
401
239
11
Germany
16
37
401
224
21
UK
9
101
301
346
20
Russia
11
52
174
334
9
India
31
28
389
431
3
Argentina
94
67
288
32
13
Brazil
79
59
94
656
20
USA
44
31
149
26
Country
Pts Rand
Sites
Av CPP
Cost Per Country
Ethics Subm
Regulatory Fees
Add Inv Fees
CT Scan Total
Ethics + Regulatory
Total Regulatory Fees
China
39
5
4978
194142
522
0
39814
0
522
40336
Germany
55
10
7000
385000
3000
0
0
12000
3000
3000
Peru
40
5
7000
280000
1500
1000
2000
60000
2500
4500
South Africa
25
5
7250
181250
290
460
363
0
750
1113
Canada
18
4
8325
149858
1818
0
0
1557576
1818
1818
Greece
40
7
9000
360000
0
7500
0
0
7500
7500
France
50
10
9000
450000
0
0
20000
0
0
20000
Italy
7
2
10000
70000
2200
0
0
0
2200
2200
Poland
15
4
10000
150000
0
2500
2400
0
2500
4900
Bulgaria
18
4
10000
180000
0
5000
1000
0
5000
6000
Czech Rep
10
2
10000
100000
1500
3000
3000
0
4500
7500
Brazil
30
6
10000
300000
2000
2874
56492
0
4874
61366
Spain
40
7
10500
420000
0
0
5450
0
0
5450
Korea
30
3
10827
324802
1114
0
14324
0
1114
15438
Chile
15
4
10840
162600
1700
3600
3000
0
5300
8300
Israel
10
6
11140
111400
2060
3000
48400
16500
5060
53460
Singapore
10
2
11565
115650
1750
0
17975
0
1750
19725
Taiwan
20
4
11796
235930
1042
313
5208
0
1355
6563
Belgium
25
6
12200
305000
3992
4332
0
0
8324
8324
UK
12
4
13000
156000
0
0
5556
0
0
5556
New Zealand
10
3
14524
145244
1973
0
43123
0
1973
45096
Australia
24
6
40200
964800
0
500
82500
0
500
83000
23
543
109
5328568
33047
26939
277000
73748966
[1753EURO x 14 (ex rate) = $2454] [ $245416 hours=$153hour]
110
1095625
1227
1753
19809
20
21
China
Germany
Peru
South Africa
Canada
Greece
France
Italy
Poland
Bulgaria
Czech Rep
Brazil
Spain
Korea
Chile
Israel
Singapore
Taiwan
Belgium
UK
New Zealand
Australia
30
0
2000
4000
6000
8000
10000
12000
14000C
hina
Ger
man
y
Per
u
Sou
th A
frica
Can
ada
Gre
ece
Fran
ce
Italy
Pol
and
Bul
garia
Cze
ch R
ep
Bra
zil
Spa
in
Kor
ea
Chi
le
Isra
el
Sin
gapo
re
Taiw
an
Bel
gium U
K
New
hellip
Aus
tralia
Source Bayer Presented SACRA Conference 2009
Aver
age
cost
per
pat
ient
(Eur
o)
Average Cost per Enrolled Participant
gt40000
Chart1
Average Cost Per Patient (Euro)
4978
7000
7000
7250
832545
9000
9000
10000
10000
10000
10000
10000
10500
10827
10840
11140
11565
1179649
12200
13000
145244
40200
Sheet1
Sheet2
Sheet2
Average Cost Per Patient (Euro)
Average Cost Per Patient
Sheet4
Ethics Subm
Regulatory Fees
Sheet3
Ethics + Regulatory
Total Ethics and Regulatory Fees
Add Inv Fees
Additional Investigator Application Fees
Total Regulatory Fees
Study starts
SubjectsStudy
31
Euro
0
10000
20000
30000
40000
50000
60000
70000
80000
90000S
outh
Afri
caC
anad
a
Italy
Ger
man
yP
eru
Pol
and
Spa
in UK
Bul
garia
Taiw
anC
zech
Rep
Gre
ece
Chi
leB
elgi
umK
orea
Sin
gapo
reFr
ance
Chi
naN
ew Z
eala
ndIs
rael
Bra
zil
Aus
tralia
Source Bayer Presented SACRA Conference 2009
Eur
os
Regulatory Application Fees
Chart1
Total Regulatory Fees
1113
181818
2200
3000
4500
4900
5450
5556
6000
656267
7500
7500
8300
8324
15438
19725
20000
403364
45096
53460
6136558
83000
Sheet1
Sheet2
Sheet2
Average Cost Per Patient (Euro)
Average Cost Per Patient
Sheet4
Ethics Subm
Regulatory Fees
Sheet3
Ethics + Regulatory
Total Ethics and Regulatory Fees
Add Inv Fees
Additional Investigator Application Fees
Total Regulatory Fees
Study starts
SubjectsStudy
32
SA Clinical Trial Regulatory Processes
Governed by SA-GCP and Declaration of Helsinki SA National Clinical Trials Register (SANCTR) Medicines Control Council (National Regulatory Authority)
o New protocols o Amendments o Additional sitesinvestigators
Ethics Committees (33 NHREC-registered) RegionalMunicipal DoH Export permits for bio samples (Nat Health Act 2003)
Clinical Trial Density Active sites million population
Nature Reviews Drug Discovery 7 13-14 (January 2008)
France 503
Germany 512 Canada
922
USA 1203
Czech Republic 776
553 sites
South Africa 119
757 sites
757 sites
533 sites
1084 sites
Argentina 269
Russia 77
China 04
India 07
34
Gateway to Africa
35
Why Africa bull Large accessible population relatively new to clinical trials
bull Experienced and willing investigators
bull Many clinical trial sites established by PDPs NGOs etc
bull Expanding therapeutic areas shifting burden of disease from
infectious to non-communicable diseases
bull Significantly improved infrastructure and accessibility
bull Rapidly evolving regulatory and ethics procedures
bull Potential for capacity building and sustainable clinical trial potential
36
Relatively young GCP culture Resident mentorships to build capacity Locations ndash accessibility for site monitoring Variable infrastructure esp electricity connectivity and
transportation Resourcing of public healthcare systems
Sub-Saharan Africa challenges
37
bull Second-largest continent
bull Spans NS and EW hemispheres
bull Second most populous continent 2014 estimate 1069 billion
bull Home to more than a quarter of the 196 independent countries
bull All 54 African countries are UN members
bull 39 urban population
bull 12 metropolitan areas gt 4m
bull gt 3000 distinct ethnicities
bull gt 2000 languages spoken
AFRICA hellip the true size
wwwcitypopulationdeworldAgglomerations 2015
38
SSV to SIV
0
5
10
15
20
25
30
35
40
45
Africa North America
Asia Pacific
Western Europe
Eastern Europe
Latin America
Source Quintiles South Africa SACRA Conference 2008
Wee
ks (A
vera
ge)
Start-Up Timelines
39
Region Median
Patients Site
of Sites
0 pts 1 - 3 pts 4 - 9 pts 10+ pts
Latin America 40 21 26 30 23
North America 30 29 29 24 18
Eastern Europe 60 15 31 26 27
Western Europe 40 15 22 29 34
Asia Pacific 40 19 30 34 18
Africa 100 4 17 28 51
Enrollment performance by region for 2008
Site Performance
Source Quintiles South Africa Presented SACRA Conference 2009
40
0 1 2 3 4 5 6 7 8 9
10
Latin America
North America
Eastern Europe
Western Europe
Asia Pacific
Africa
Num
ber o
f par
ticip
ants
MEDIAN site enrollment by region for 2008
Source Quintiles South Africa Presented SACRA Conference 2009
Site Performance
41
Source Quintiles South Africa Presented SACRA Conference 2009
s
ites
0
5
10
15
20
25
30
35
40
45
50
LatinAmerica
NorthAmerica
EasternEurope
WesternEurope
Asia Pacific Africa
0 pts
1 - 3 pts
4 - 9 pts
10+ pts
Enrollment performance by region for 2008
Site Performance
Chart1
0 pts
1 - 3 pts
4 - 9 pts
10+ pts
021
026
03
023
029
029
024
018
015
031
026
027
015
022
029
034
019
03
034
018
004
017
028
051
HIV
HIV
Resiratory amp Cancer
Male prevalence
Female prevalence
CVS
Overall death rates
Overall death rates
COPD
Asthma
Tracheabronchial lung cancer
Oesophageal cancer
prostate cancer
Trial metrics
COPD
Asthma
Tracheabronchial lung cancer
Oesophageal cancer
Prostate cancer
Cervical cancer
Breast cancer
Stroke
ill-defined heart disease
Diabetes mellitus
Ischaemic heart disease
Hypertension
Nephritisnephrosis
Stroke
ill-defined heart disease
Diabetes mellitus
Ischaemic heart disease
Hypertension
Nephritisnephrosis
Males
Female
UN - Male
SA 1997
SA 2004
UN - Female
SA 1997
SA 2004
0 pts
1 - 3 pts
4 - 9 pts
10+ pts
42
Source wwwclinicaltrialsgov 22-Oct-2010
Clinical trials registered across Africa
43
0
500
1000
1500
2000
2500
South Africa Kenya Malawi Tanzania Uganda Zambia
Selected African countries
2005
2010
2015
Source ClinTrialsgov
Trend 2005 - 2015
Source wwwclinicaltrialsgov 28-Aug-2015
44
AFRICA FOUND IN TRANSLATION
bull Vast treatment-naiumlve population bull Cost advantages (still) bull Diverse ethnicity amp morbidity bull Inverse seasonality bull Site capacity-building widely implemented bull Robust regulatory review bull Variable but generally good regulatory timelines bull Established GCP culture ndash sites and home-bred CROs
45
THANK YOU
Foliennummer 1
Triclinium A South African CRO
Collaboration with VPM SII
Vaccine Trials in SA 2015
Foliennummer 5
Foliennummer 6
Foliennummer 7
Foliennummer 8
Foliennummer 9
Foliennummer 10
Foliennummer 11
Foliennummer 12
Foliennummer 13
Foliennummer 14
Foliennummer 15
Foliennummer 16
Foliennummer 17
Distribution of clinical trial sites
Foliennummer 19
South Africa Leading Causes of Death
Foliennummer 21
Foliennummer 22
South Africa TB deaths by age group
Foliennummer 24
Foliennummer 25
Foliennummer 26
Foliennummer 27
Foliennummer 28
Foliennummer 29
Foliennummer 30
Foliennummer 31
SA Clinical Trial Regulatory Processes
Clinical Trial Density Active sites million population
Foliennummer 34
Why Africa
Foliennummer 36
AFRICA hellip the true size
SSV to SIV
Foliennummer 39
Foliennummer 40
Foliennummer 41
Foliennummer 42
Foliennummer 43
AFRICA FOUND IN TRANSLATION
Foliennummer 45
Region
Median
of Sites
Patients Site
0 pts
1 - 3 pts
4 - 9 pts
10+ pts
Latin America
4
21
26
30
23
North America
3
29
29
24
18
Eastern Europe
6
15
31
26
27
Western Europe
4
15
22
29
34
Asia Pacific
4
19
30
34
18
Africa
10
4
17
28
51
0 pts
1 - 3 pts
4 - 9 pts
10+ pts
Latin America
21
26
30
23
North America
29
29
24
18
Eastern Europe
15
31
26
27
Western Europe
15
22
29
34
Asia Pacific
19
30
34
18
Africa
4
17
28
51
Males
Female
15-19
210
150
20-24
340
205
25-29
395
300
30-34
460
360
35-39
600
405
40-44
800
500
45-49
1100
700
50-54
1600
1050
55-54
2300
1580
60-64
3340
2250
UN - Male
SA 1997
SA 2004
UN - Female
SA 1997
SA 2004
15-19
210
235
216
150
165
187
20-24
340
381
555
205
331
1085
25-29
395
625
1081
300
452
1985
30-34
460
817
2118
360
489
2267
35-39
600
916
2498
405
526
1890
40-44
800
1136
2765
500
615
1548
45-49
1100
1486
2744
700
800
1400
50-54
1600
2016
2979
1050
1116
1506
55-54
2300
2838
3270
1580
1626
1717
60-64
3340
3614
4146
2250
2201
2360
Stroke
ill-defined heart disease
Diabetes mellitus
Ischaemic heart disease
Hypertension
Nephritisnephrosis
Stroke
ill-defined heart disease
Diabetes mellitus
Ischaemic heart disease
Hypertension
Nephritisnephrosis
1999
34
345
20
248
14
10
1999
295
246
23
10
145
68
2000
36
362
218
249
152
112
2000
318
268
241
108
16
8
2001
35
372
22
25
15
125
2001
322
28
252
102
162
95
2002
405
298
24
26
147
126
2002
352
295
27
115
16
10
2003
425
32
245
285
152
15
2003
382
299
285
122
17
12
2004
39
325
255
26
165
16
2004
35
30
295
121
19
119
2005
36
328
265
26
15
162
2005
325
30
32
12
18
12
2006
35
336
27
258
155
16
2006
33
32
32
11
18
125
COPD
Asthma
Tracheabronchial lung cancer
Oesophageal cancer
prostate cancer
Cervical cancer
Breast cancer
1999
2001
12
135
10
26
2000
204
116
13
92
28
2001
222
131
133
96
27
2002
23
144
128
95
285
2003
243
149
124
94
29
2004
229
154
1255
87
29
2005
224
152
122
82
295
2006
224
136
116
75
3
COPD
Asthma
Tracheabronchial lung cancer
Oesophageal cancer
Prostate cancer
Cervical cancer
Breast cancer
1999
88
92
43
41
106
82
2000
96
95
4
43
11
81
2001
10
109
4
4
111
89
2002
10
116
4
4
112
85
2003
11
124
4
395
116
85
2004
102
1295
44
39
115
101
2005
105
128
42
38
1185
10
2006
10
12
42
32
1205
10
Based on this survey the researchers estimate that 109 of all South Africans over 2 years old were living with HIV in 2008 In 2002 and 2005 this figure was 114 and 108 respectively showing a degree of stabilisation Among those between 15 and 49 years old the estimated HIV prevalence was 169 in 2008 The survey found the prevalence among children aged 2-14 to be 25 down significantly since 2002 when prevalence was 56
Estimated HIV prevalence () among South Africans aged 2 years and older by age 2002-2008
Age
HIV +
HIV -
Children (2-14 years)
25
975
Youth (15-24 years)
87
913
Adults (25 and older)
168
832
(15-49 years)
169
831
Total (2 and older)
109
891
Estimated HIV prevalence among South Africans by age and sex 2008
Age
Male prevalence
Female prevalence
2-14
3
2
15-19
25
67
20-24
51
211
25-29
157
327
30-34
258
291
35-39
185
248
40-44
192
163
45-49
64
141
50-54
104
102
55-59
62
77
60+
35
18
Total
79
136
Among females HIV prevalence is highest in those between 25 and 29 years old among males the peak is in the group aged 30-34 years
HIV prevalence () by province 2002-2008
Province
2002
2005
2008
KwaZulu-Natal
117
165
158
Mpumalanga
141
152
154
Free State
149
126
126
North West
103
109
113
Gauteng
147
108
103
Eastern Cape
66
89
9
Limpopo
98
8
88
Northern Cape
84
54
59
Western Cape
107
19
38
National
114
108
109
The results of this study suggest that KwaZulu-Natal Mpumulanga and Free State have the highest HIV prevalence However the relatively small sample sizes may limit precision and in several cases the ranges of uncertainty overlap
HIV prevalence by population group 2008
Population group
Prevalence ()
African
136
864
White
03
997
Coloured
17
983
Indian
03
997
Studies of AIDS deaths
Latin America
Latin America
Latin America
Latin America
North America
North America
North America
North America
Eastern Europe
Eastern Europe
Eastern Europe
Eastern Europe
Western Europe
Western Europe
Western Europe
Western Europe
Asia Pacific
Asia Pacific
Asia Pacific
Asia Pacific
Africa
Africa
Africa
Africa
Country
Study starts
Subjects randomised
SubjectsStudy
USA
32
4385
13703125
Russia
20
788
394
Germany
19
1883
991052631579
UK
13
265
203846153846
South Africa
12
347
289166666667
Argentina
12
329
274166666667
Australia
11
195
177272727273
India
7
275
392857142857
Brazil
3
115
383333333333
Country
Initiation
Site activation
Recruitment
LOC setup
Unproductive sites
(Approval ndash FCI)
(FCI ndash FSFV)
(FSFV ndash LSFV)
(CPC ndash FSFV)
South Africa
19
38
153
357
21
Australia
117
63
401
239
11
Germany
16
37
401
224
21
UK
9
101
301
346
20
Russia
11
52
174
334
9
India
31
28
389
431
3
Argentina
94
67
288
32
13
Brazil
79
59
94
656
20
USA
44
31
149
26
Country
Pts Rand
Sites
Av CPP
Cost Per Country
Ethics Subm
Regulatory Fees
Add Inv Fees
CT Scan Total
Ethics + Regulatory
Total Regulatory Fees
South Africa
25
5
7250
181250
290
460
363
0
750
1113
Canada
18
4
832545
14985818
181818
0
0
1557576
181818
1818
Italy
7
2
10000
70000
2200
0
0
0
2200
2200
Germany
55
10
7000
385000
3000
0
0
12000
3000
3000
Peru
40
5
7000
280000
1500
1000
2000
60000
2500
4500
Poland
15
4
10000
150000
0
2500
2400
0
2500
4900
Spain
40
7
10500
420000
0
0
5450
0
0
5450
UK
12
4
13000
156000
0
0
5556
0
0
5556
Bulgaria
18
4
10000
180000
0
5000
1000
0
5000
6000
Taiwan
20
4
1179649
2359298
104167
313
5208
0
135467
6563
Czech Rep
10
2
10000
100000
1500
3000
3000
0
4500
7500
Greece
40
7
9000
360000
0
7500
0
0
7500
7500
Chile
15
4
10840
162600
1700
3600
3000
0
5300
8300
Belgium
25
6
12200
305000
3992
4332
0
0
8324
8324
Korea
30
3
10827
324802
1114
0
14324
0
1114
15438
Singapore
10
2
11565
115650
1750
0
17975
0
1750
19725
France
50
10
9000
450000
0
0
20000
0
0
20000
China
39
5
4978
194142
5224
0
39814
0
5224
40336
New Zealand
10
3
145244
145244
1973
0
43123
0
1973
45096
Israel
10
6
11140
111400
2060
3000
48400
16500
5060
53460
Brazil
30
6
10000
300000
2000
287356
5649202
0
487356
61366
Australia
24
6
40200
964800
0
500
82500
0
500
83000
23
543
109
532856799
3304716
26939
27700043
73748966
[1753EURO x 14 (ex rate) = $2454] [ $245416 hours=$153hour]
1095625
1095625
12271
1753
198089
198089
208514736842
South Africa
Canada
Italy
Germany
Peru
Poland
Spain
UK
Bulgaria
Taiwan
Czech Rep
Greece
Chile
Belgium
Korea
Singapore
France
China
New Zealand
Israel
Brazil
Australia
Country
Study starts
Subjects randomised
SubjectsStudy
USA
32
4385
13703125
Russia
20
788
394
Germany
19
1883
991052631579
UK
13
265
203846153846
South Africa
12
347
289166666667
Argentina
12
329
274166666667
Australia
11
195
177272727273
India
7
275
392857142857
Brazil
3
115
383333333333
Country
Initiation
Site activation
Recruitment
LOC setup
Unproductive sites
(Approval ndash FCI)
(FCI ndash FSFV)
(FSFV ndash LSFV)
(CPC ndash FSFV)
South Africa
19
38
153
357
21
Australia
117
63
401
239
11
Germany
16
37
401
224
21
UK
9
101
301
346
20
Russia
11
52
174
334
9
India
31
28
389
431
3
Argentina
94
67
288
32
13
Brazil
79
59
94
656
20
USA
44
31
149
26
Country
Pts Rand
Sites
Av CPP
Cost Per Country
Ethics Subm
Regulatory Fees
Add Inv Fees
CT Scan Total
Ethics + Regulatory
Total Regulatory Fees
China
39
5
4978
194142
522
0
39814
0
522
40336
Germany
55
10
7000
385000
3000
0
0
12000
3000
3000
Peru
40
5
7000
280000
1500
1000
2000
60000
2500
4500
South Africa
25
5
7250
181250
290
460
363
0
750
1113
Canada
18
4
8325
149858
1818
0
0
1557576
1818
1818
Greece
40
7
9000
360000
0
7500
0
0
7500
7500
France
50
10
9000
450000
0
0
20000
0
0
20000
Italy
7
2
10000
70000
2200
0
0
0
2200
2200
Poland
15
4
10000
150000
0
2500
2400
0
2500
4900
Bulgaria
18
4
10000
180000
0
5000
1000
0
5000
6000
Czech Rep
10
2
10000
100000
1500
3000
3000
0
4500
7500
Brazil
30
6
10000
300000
2000
2874
56492
0
4874
61366
Spain
40
7
10500
420000
0
0
5450
0
0
5450
Korea
30
3
10827
324802
1114
0
14324
0
1114
15438
Chile
15
4
10840
162600
1700
3600
3000
0
5300
8300
Israel
10
6
11140
111400
2060
3000
48400
16500
5060
53460
Singapore
10
2
11565
115650
1750
0
17975
0
1750
19725
Taiwan
20
4
11796
235930
1042
313
5208
0
1355
6563
Belgium
25
6
12200
305000
3992
4332
0
0
8324
8324
UK
12
4
13000
156000
0
0
5556
0
0
5556
New Zealand
10
3
14524
145244
1973
0
43123
0
1973
45096
Australia
24
6
40200
964800
0
500
82500
0
500
83000
23
543
109
5328568
33047
26939
277000
73748966
[1753EURO x 14 (ex rate) = $2454] [ $245416 hours=$153hour]
110
1095625
1227
1753
19809
20
21
China
Germany
Peru
South Africa
Canada
Greece
France
Italy
Poland
Bulgaria
Czech Rep
Brazil
Spain
Korea
Chile
Israel
Singapore
Taiwan
Belgium
UK
New Zealand
Australia
Chart1
Average Cost Per Patient (Euro)
4978
7000
7000
7250
832545
9000
9000
10000
10000
10000
10000
10000
10500
10827
10840
11140
11565
1179649
12200
13000
145244
40200
Sheet1
Sheet2
Sheet2
Average Cost Per Patient (Euro)
Average Cost Per Patient
Sheet4
Ethics Subm
Regulatory Fees
Sheet3
Ethics + Regulatory
Total Ethics and Regulatory Fees
Add Inv Fees
Additional Investigator Application Fees
Total Regulatory Fees
Study starts
SubjectsStudy
31
Euro
0
10000
20000
30000
40000
50000
60000
70000
80000
90000S
outh
Afri
caC
anad
a
Italy
Ger
man
yP
eru
Pol
and
Spa
in UK
Bul
garia
Taiw
anC
zech
Rep
Gre
ece
Chi
leB
elgi
umK
orea
Sin
gapo
reFr
ance
Chi
naN
ew Z
eala
ndIs
rael
Bra
zil
Aus
tralia
Source Bayer Presented SACRA Conference 2009
Eur
os
Regulatory Application Fees
Chart1
Total Regulatory Fees
1113
181818
2200
3000
4500
4900
5450
5556
6000
656267
7500
7500
8300
8324
15438
19725
20000
403364
45096
53460
6136558
83000
Sheet1
Sheet2
Sheet2
Average Cost Per Patient (Euro)
Average Cost Per Patient
Sheet4
Ethics Subm
Regulatory Fees
Sheet3
Ethics + Regulatory
Total Ethics and Regulatory Fees
Add Inv Fees
Additional Investigator Application Fees
Total Regulatory Fees
Study starts
SubjectsStudy
32
SA Clinical Trial Regulatory Processes
Governed by SA-GCP and Declaration of Helsinki SA National Clinical Trials Register (SANCTR) Medicines Control Council (National Regulatory Authority)
o New protocols o Amendments o Additional sitesinvestigators
Ethics Committees (33 NHREC-registered) RegionalMunicipal DoH Export permits for bio samples (Nat Health Act 2003)
Clinical Trial Density Active sites million population
Nature Reviews Drug Discovery 7 13-14 (January 2008)
France 503
Germany 512 Canada
922
USA 1203
Czech Republic 776
553 sites
South Africa 119
757 sites
757 sites
533 sites
1084 sites
Argentina 269
Russia 77
China 04
India 07
34
Gateway to Africa
35
Why Africa bull Large accessible population relatively new to clinical trials
bull Experienced and willing investigators
bull Many clinical trial sites established by PDPs NGOs etc
bull Expanding therapeutic areas shifting burden of disease from
infectious to non-communicable diseases
bull Significantly improved infrastructure and accessibility
bull Rapidly evolving regulatory and ethics procedures
bull Potential for capacity building and sustainable clinical trial potential
36
Relatively young GCP culture Resident mentorships to build capacity Locations ndash accessibility for site monitoring Variable infrastructure esp electricity connectivity and
transportation Resourcing of public healthcare systems
Sub-Saharan Africa challenges
37
bull Second-largest continent
bull Spans NS and EW hemispheres
bull Second most populous continent 2014 estimate 1069 billion
bull Home to more than a quarter of the 196 independent countries
bull All 54 African countries are UN members
bull 39 urban population
bull 12 metropolitan areas gt 4m
bull gt 3000 distinct ethnicities
bull gt 2000 languages spoken
AFRICA hellip the true size
wwwcitypopulationdeworldAgglomerations 2015
38
SSV to SIV
0
5
10
15
20
25
30
35
40
45
Africa North America
Asia Pacific
Western Europe
Eastern Europe
Latin America
Source Quintiles South Africa SACRA Conference 2008
Wee
ks (A
vera
ge)
Start-Up Timelines
39
Region Median
Patients Site
of Sites
0 pts 1 - 3 pts 4 - 9 pts 10+ pts
Latin America 40 21 26 30 23
North America 30 29 29 24 18
Eastern Europe 60 15 31 26 27
Western Europe 40 15 22 29 34
Asia Pacific 40 19 30 34 18
Africa 100 4 17 28 51
Enrollment performance by region for 2008
Site Performance
Source Quintiles South Africa Presented SACRA Conference 2009
40
0 1 2 3 4 5 6 7 8 9
10
Latin America
North America
Eastern Europe
Western Europe
Asia Pacific
Africa
Num
ber o
f par
ticip
ants
MEDIAN site enrollment by region for 2008
Source Quintiles South Africa Presented SACRA Conference 2009
Site Performance
41
Source Quintiles South Africa Presented SACRA Conference 2009
s
ites
0
5
10
15
20
25
30
35
40
45
50
LatinAmerica
NorthAmerica
EasternEurope
WesternEurope
Asia Pacific Africa
0 pts
1 - 3 pts
4 - 9 pts
10+ pts
Enrollment performance by region for 2008
Site Performance
Chart1
0 pts
1 - 3 pts
4 - 9 pts
10+ pts
021
026
03
023
029
029
024
018
015
031
026
027
015
022
029
034
019
03
034
018
004
017
028
051
HIV
HIV
Resiratory amp Cancer
Male prevalence
Female prevalence
CVS
Overall death rates
Overall death rates
COPD
Asthma
Tracheabronchial lung cancer
Oesophageal cancer
prostate cancer
Trial metrics
COPD
Asthma
Tracheabronchial lung cancer
Oesophageal cancer
Prostate cancer
Cervical cancer
Breast cancer
Stroke
ill-defined heart disease
Diabetes mellitus
Ischaemic heart disease
Hypertension
Nephritisnephrosis
Stroke
ill-defined heart disease
Diabetes mellitus
Ischaemic heart disease
Hypertension
Nephritisnephrosis
Males
Female
UN - Male
SA 1997
SA 2004
UN - Female
SA 1997
SA 2004
0 pts
1 - 3 pts
4 - 9 pts
10+ pts
42
Source wwwclinicaltrialsgov 22-Oct-2010
Clinical trials registered across Africa
43
0
500
1000
1500
2000
2500
South Africa Kenya Malawi Tanzania Uganda Zambia
Selected African countries
2005
2010
2015
Source ClinTrialsgov
Trend 2005 - 2015
Source wwwclinicaltrialsgov 28-Aug-2015
44
AFRICA FOUND IN TRANSLATION
bull Vast treatment-naiumlve population bull Cost advantages (still) bull Diverse ethnicity amp morbidity bull Inverse seasonality bull Site capacity-building widely implemented bull Robust regulatory review bull Variable but generally good regulatory timelines bull Established GCP culture ndash sites and home-bred CROs
45
THANK YOU
Foliennummer 1
Triclinium A South African CRO
Collaboration with VPM SII
Vaccine Trials in SA 2015
Foliennummer 5
Foliennummer 6
Foliennummer 7
Foliennummer 8
Foliennummer 9
Foliennummer 10
Foliennummer 11
Foliennummer 12
Foliennummer 13
Foliennummer 14
Foliennummer 15
Foliennummer 16
Foliennummer 17
Distribution of clinical trial sites
Foliennummer 19
South Africa Leading Causes of Death
Foliennummer 21
Foliennummer 22
South Africa TB deaths by age group
Foliennummer 24
Foliennummer 25
Foliennummer 26
Foliennummer 27
Foliennummer 28
Foliennummer 29
Foliennummer 30
Foliennummer 31
SA Clinical Trial Regulatory Processes
Clinical Trial Density Active sites million population
Foliennummer 34
Why Africa
Foliennummer 36
AFRICA hellip the true size
SSV to SIV
Foliennummer 39
Foliennummer 40
Foliennummer 41
Foliennummer 42
Foliennummer 43
AFRICA FOUND IN TRANSLATION
Foliennummer 45
Region
Median
of Sites
Patients Site
0 pts
1 - 3 pts
4 - 9 pts
10+ pts
Latin America
4
21
26
30
23
North America
3
29
29
24
18
Eastern Europe
6
15
31
26
27
Western Europe
4
15
22
29
34
Asia Pacific
4
19
30
34
18
Africa
10
4
17
28
51
0 pts
1 - 3 pts
4 - 9 pts
10+ pts
Latin America
21
26
30
23
North America
29
29
24
18
Eastern Europe
15
31
26
27
Western Europe
15
22
29
34
Asia Pacific
19
30
34
18
Africa
4
17
28
51
Males
Female
15-19
210
150
20-24
340
205
25-29
395
300
30-34
460
360
35-39
600
405
40-44
800
500
45-49
1100
700
50-54
1600
1050
55-54
2300
1580
60-64
3340
2250
UN - Male
SA 1997
SA 2004
UN - Female
SA 1997
SA 2004
15-19
210
235
216
150
165
187
20-24
340
381
555
205
331
1085
25-29
395
625
1081
300
452
1985
30-34
460
817
2118
360
489
2267
35-39
600
916
2498
405
526
1890
40-44
800
1136
2765
500
615
1548
45-49
1100
1486
2744
700
800
1400
50-54
1600
2016
2979
1050
1116
1506
55-54
2300
2838
3270
1580
1626
1717
60-64
3340
3614
4146
2250
2201
2360
Stroke
ill-defined heart disease
Diabetes mellitus
Ischaemic heart disease
Hypertension
Nephritisnephrosis
Stroke
ill-defined heart disease
Diabetes mellitus
Ischaemic heart disease
Hypertension
Nephritisnephrosis
1999
34
345
20
248
14
10
1999
295
246
23
10
145
68
2000
36
362
218
249
152
112
2000
318
268
241
108
16
8
2001
35
372
22
25
15
125
2001
322
28
252
102
162
95
2002
405
298
24
26
147
126
2002
352
295
27
115
16
10
2003
425
32
245
285
152
15
2003
382
299
285
122
17
12
2004
39
325
255
26
165
16
2004
35
30
295
121
19
119
2005
36
328
265
26
15
162
2005
325
30
32
12
18
12
2006
35
336
27
258
155
16
2006
33
32
32
11
18
125
COPD
Asthma
Tracheabronchial lung cancer
Oesophageal cancer
prostate cancer
Cervical cancer
Breast cancer
1999
2001
12
135
10
26
2000
204
116
13
92
28
2001
222
131
133
96
27
2002
23
144
128
95
285
2003
243
149
124
94
29
2004
229
154
1255
87
29
2005
224
152
122
82
295
2006
224
136
116
75
3
COPD
Asthma
Tracheabronchial lung cancer
Oesophageal cancer
Prostate cancer
Cervical cancer
Breast cancer
1999
88
92
43
41
106
82
2000
96
95
4
43
11
81
2001
10
109
4
4
111
89
2002
10
116
4
4
112
85
2003
11
124
4
395
116
85
2004
102
1295
44
39
115
101
2005
105
128
42
38
1185
10
2006
10
12
42
32
1205
10
Based on this survey the researchers estimate that 109 of all South Africans over 2 years old were living with HIV in 2008 In 2002 and 2005 this figure was 114 and 108 respectively showing a degree of stabilisation Among those between 15 and 49 years old the estimated HIV prevalence was 169 in 2008 The survey found the prevalence among children aged 2-14 to be 25 down significantly since 2002 when prevalence was 56
Estimated HIV prevalence () among South Africans aged 2 years and older by age 2002-2008
Age
HIV +
HIV -
Children (2-14 years)
25
975
Youth (15-24 years)
87
913
Adults (25 and older)
168
832
(15-49 years)
169
831
Total (2 and older)
109
891
Estimated HIV prevalence among South Africans by age and sex 2008
Age
Male prevalence
Female prevalence
2-14
3
2
15-19
25
67
20-24
51
211
25-29
157
327
30-34
258
291
35-39
185
248
40-44
192
163
45-49
64
141
50-54
104
102
55-59
62
77
60+
35
18
Total
79
136
Among females HIV prevalence is highest in those between 25 and 29 years old among males the peak is in the group aged 30-34 years
HIV prevalence () by province 2002-2008
Province
2002
2005
2008
KwaZulu-Natal
117
165
158
Mpumalanga
141
152
154
Free State
149
126
126
North West
103
109
113
Gauteng
147
108
103
Eastern Cape
66
89
9
Limpopo
98
8
88
Northern Cape
84
54
59
Western Cape
107
19
38
National
114
108
109
The results of this study suggest that KwaZulu-Natal Mpumulanga and Free State have the highest HIV prevalence However the relatively small sample sizes may limit precision and in several cases the ranges of uncertainty overlap
HIV prevalence by population group 2008
Population group
Prevalence ()
African
136
864
White
03
997
Coloured
17
983
Indian
03
997
Studies of AIDS deaths
Latin America
Latin America
Latin America
Latin America
North America
North America
North America
North America
Eastern Europe
Eastern Europe
Eastern Europe
Eastern Europe
Western Europe
Western Europe
Western Europe
Western Europe
Asia Pacific
Asia Pacific
Asia Pacific
Asia Pacific
Africa
Africa
Africa
Africa
Country
Study starts
Subjects randomised
SubjectsStudy
USA
32
4385
13703125
Russia
20
788
394
Germany
19
1883
991052631579
UK
13
265
203846153846
South Africa
12
347
289166666667
Argentina
12
329
274166666667
Australia
11
195
177272727273
India
7
275
392857142857
Brazil
3
115
383333333333
Country
Initiation
Site activation
Recruitment
LOC setup
Unproductive sites
(Approval ndash FCI)
(FCI ndash FSFV)
(FSFV ndash LSFV)
(CPC ndash FSFV)
South Africa
19
38
153
357
21
Australia
117
63
401
239
11
Germany
16
37
401
224
21
UK
9
101
301
346
20
Russia
11
52
174
334
9
India
31
28
389
431
3
Argentina
94
67
288
32
13
Brazil
79
59
94
656
20
USA
44
31
149
26
Country
Pts Rand
Sites
Av CPP
Cost Per Country
Ethics Subm
Regulatory Fees
Add Inv Fees
CT Scan Total
Ethics + Regulatory
Total Regulatory Fees
South Africa
25
5
7250
181250
290
460
363
0
750
1113
Canada
18
4
832545
14985818
181818
0
0
1557576
181818
1818
Italy
7
2
10000
70000
2200
0
0
0
2200
2200
Germany
55
10
7000
385000
3000
0
0
12000
3000
3000
Peru
40
5
7000
280000
1500
1000
2000
60000
2500
4500
Poland
15
4
10000
150000
0
2500
2400
0
2500
4900
Spain
40
7
10500
420000
0
0
5450
0
0
5450
UK
12
4
13000
156000
0
0
5556
0
0
5556
Bulgaria
18
4
10000
180000
0
5000
1000
0
5000
6000
Taiwan
20
4
1179649
2359298
104167
313
5208
0
135467
6563
Czech Rep
10
2
10000
100000
1500
3000
3000
0
4500
7500
Greece
40
7
9000
360000
0
7500
0
0
7500
7500
Chile
15
4
10840
162600
1700
3600
3000
0
5300
8300
Belgium
25
6
12200
305000
3992
4332
0
0
8324
8324
Korea
30
3
10827
324802
1114
0
14324
0
1114
15438
Singapore
10
2
11565
115650
1750
0
17975
0
1750
19725
France
50
10
9000
450000
0
0
20000
0
0
20000
China
39
5
4978
194142
5224
0
39814
0
5224
40336
New Zealand
10
3
145244
145244
1973
0
43123
0
1973
45096
Israel
10
6
11140
111400
2060
3000
48400
16500
5060
53460
Brazil
30
6
10000
300000
2000
287356
5649202
0
487356
61366
Australia
24
6
40200
964800
0
500
82500
0
500
83000
23
543
109
532856799
3304716
26939
27700043
73748966
[1753EURO x 14 (ex rate) = $2454] [ $245416 hours=$153hour]
1095625
1095625
12271
1753
198089
198089
208514736842
South Africa
Canada
Italy
Germany
Peru
Poland
Spain
UK
Bulgaria
Taiwan
Czech Rep
Greece
Chile
Belgium
Korea
Singapore
France
China
New Zealand
Israel
Brazil
Australia
Country
Study starts
Subjects randomised
SubjectsStudy
USA
32
4385
13703125
Russia
20
788
394
Germany
19
1883
991052631579
UK
13
265
203846153846
South Africa
12
347
289166666667
Argentina
12
329
274166666667
Australia
11
195
177272727273
India
7
275
392857142857
Brazil
3
115
383333333333
Country
Initiation
Site activation
Recruitment
LOC setup
Unproductive sites
(Approval ndash FCI)
(FCI ndash FSFV)
(FSFV ndash LSFV)
(CPC ndash FSFV)
South Africa
19
38
153
357
21
Australia
117
63
401
239
11
Germany
16
37
401
224
21
UK
9
101
301
346
20
Russia
11
52
174
334
9
India
31
28
389
431
3
Argentina
94
67
288
32
13
Brazil
79
59
94
656
20
USA
44
31
149
26
Country
Pts Rand
Sites
Av CPP
Cost Per Country
Ethics Subm
Regulatory Fees
Add Inv Fees
CT Scan Total
Ethics + Regulatory
Total Regulatory Fees
China
39
5
4978
194142
522
0
39814
0
522
40336
Germany
55
10
7000
385000
3000
0
0
12000
3000
3000
Peru
40
5
7000
280000
1500
1000
2000
60000
2500
4500
South Africa
25
5
7250
181250
290
460
363
0
750
1113
Canada
18
4
8325
149858
1818
0
0
1557576
1818
1818
Greece
40
7
9000
360000
0
7500
0
0
7500
7500
France
50
10
9000
450000
0
0
20000
0
0
20000
Italy
7
2
10000
70000
2200
0
0
0
2200
2200
Poland
15
4
10000
150000
0
2500
2400
0
2500
4900
Bulgaria
18
4
10000
180000
0
5000
1000
0
5000
6000
Czech Rep
10
2
10000
100000
1500
3000
3000
0
4500
7500
Brazil
30
6
10000
300000
2000
2874
56492
0
4874
61366
Spain
40
7
10500
420000
0
0
5450
0
0
5450
Korea
30
3
10827
324802
1114
0
14324
0
1114
15438
Chile
15
4
10840
162600
1700
3600
3000
0
5300
8300
Israel
10
6
11140
111400
2060
3000
48400
16500
5060
53460
Singapore
10
2
11565
115650
1750
0
17975
0
1750
19725
Taiwan
20
4
11796
235930
1042
313
5208
0
1355
6563
Belgium
25
6
12200
305000
3992
4332
0
0
8324
8324
UK
12
4
13000
156000
0
0
5556
0
0
5556
New Zealand
10
3
14524
145244
1973
0
43123
0
1973
45096
Australia
24
6
40200
964800
0
500
82500
0
500
83000
23
543
109
5328568
33047
26939
277000
73748966
[1753EURO x 14 (ex rate) = $2454] [ $245416 hours=$153hour]
110
1095625
1227
1753
19809
20
21
China
Germany
Peru
South Africa
Canada
Greece
France
Italy
Poland
Bulgaria
Czech Rep
Brazil
Spain
Korea
Chile
Israel
Singapore
Taiwan
Belgium
UK
New Zealand
Australia
Sheet1
Sheet2
Sheet2
Average Cost Per Patient (Euro)
Average Cost Per Patient
Sheet4
Ethics Subm
Regulatory Fees
Sheet3
Ethics + Regulatory
Total Ethics and Regulatory Fees
Add Inv Fees
Additional Investigator Application Fees
Total Regulatory Fees
Study starts
SubjectsStudy
31
Euro
0
10000
20000
30000
40000
50000
60000
70000
80000
90000S
outh
Afri
caC
anad
a
Italy
Ger
man
yP
eru
Pol
and
Spa
in UK
Bul
garia
Taiw
anC
zech
Rep
Gre
ece
Chi
leB
elgi
umK
orea
Sin
gapo
reFr
ance
Chi
naN
ew Z
eala
ndIs
rael
Bra
zil
Aus
tralia
Source Bayer Presented SACRA Conference 2009
Eur
os
Regulatory Application Fees
Chart1
Total Regulatory Fees
1113
181818
2200
3000
4500
4900
5450
5556
6000
656267
7500
7500
8300
8324
15438
19725
20000
403364
45096
53460
6136558
83000
Sheet1
Sheet2
Sheet2
Average Cost Per Patient (Euro)
Average Cost Per Patient
Sheet4
Ethics Subm
Regulatory Fees
Sheet3
Ethics + Regulatory
Total Ethics and Regulatory Fees
Add Inv Fees
Additional Investigator Application Fees
Total Regulatory Fees
Study starts
SubjectsStudy
32
SA Clinical Trial Regulatory Processes
Governed by SA-GCP and Declaration of Helsinki SA National Clinical Trials Register (SANCTR) Medicines Control Council (National Regulatory Authority)
o New protocols o Amendments o Additional sitesinvestigators
Ethics Committees (33 NHREC-registered) RegionalMunicipal DoH Export permits for bio samples (Nat Health Act 2003)
Clinical Trial Density Active sites million population
Nature Reviews Drug Discovery 7 13-14 (January 2008)
France 503
Germany 512 Canada
922
USA 1203
Czech Republic 776
553 sites
South Africa 119
757 sites
757 sites
533 sites
1084 sites
Argentina 269
Russia 77
China 04
India 07
34
Gateway to Africa
35
Why Africa bull Large accessible population relatively new to clinical trials
bull Experienced and willing investigators
bull Many clinical trial sites established by PDPs NGOs etc
bull Expanding therapeutic areas shifting burden of disease from
infectious to non-communicable diseases
bull Significantly improved infrastructure and accessibility
bull Rapidly evolving regulatory and ethics procedures
bull Potential for capacity building and sustainable clinical trial potential
36
Relatively young GCP culture Resident mentorships to build capacity Locations ndash accessibility for site monitoring Variable infrastructure esp electricity connectivity and
transportation Resourcing of public healthcare systems
Sub-Saharan Africa challenges
37
bull Second-largest continent
bull Spans NS and EW hemispheres
bull Second most populous continent 2014 estimate 1069 billion
bull Home to more than a quarter of the 196 independent countries
bull All 54 African countries are UN members
bull 39 urban population
bull 12 metropolitan areas gt 4m
bull gt 3000 distinct ethnicities
bull gt 2000 languages spoken
AFRICA hellip the true size
wwwcitypopulationdeworldAgglomerations 2015
38
SSV to SIV
0
5
10
15
20
25
30
35
40
45
Africa North America
Asia Pacific
Western Europe
Eastern Europe
Latin America
Source Quintiles South Africa SACRA Conference 2008
Wee
ks (A
vera
ge)
Start-Up Timelines
39
Region Median
Patients Site
of Sites
0 pts 1 - 3 pts 4 - 9 pts 10+ pts
Latin America 40 21 26 30 23
North America 30 29 29 24 18
Eastern Europe 60 15 31 26 27
Western Europe 40 15 22 29 34
Asia Pacific 40 19 30 34 18
Africa 100 4 17 28 51
Enrollment performance by region for 2008
Site Performance
Source Quintiles South Africa Presented SACRA Conference 2009
40
0 1 2 3 4 5 6 7 8 9
10
Latin America
North America
Eastern Europe
Western Europe
Asia Pacific
Africa
Num
ber o
f par
ticip
ants
MEDIAN site enrollment by region for 2008
Source Quintiles South Africa Presented SACRA Conference 2009
Site Performance
41
Source Quintiles South Africa Presented SACRA Conference 2009
s
ites
0
5
10
15
20
25
30
35
40
45
50
LatinAmerica
NorthAmerica
EasternEurope
WesternEurope
Asia Pacific Africa
0 pts
1 - 3 pts
4 - 9 pts
10+ pts
Enrollment performance by region for 2008
Site Performance
Chart1
0 pts
1 - 3 pts
4 - 9 pts
10+ pts
021
026
03
023
029
029
024
018
015
031
026
027
015
022
029
034
019
03
034
018
004
017
028
051
HIV
HIV
Resiratory amp Cancer
Male prevalence
Female prevalence
CVS
Overall death rates
Overall death rates
COPD
Asthma
Tracheabronchial lung cancer
Oesophageal cancer
prostate cancer
Trial metrics
COPD
Asthma
Tracheabronchial lung cancer
Oesophageal cancer
Prostate cancer
Cervical cancer
Breast cancer
Stroke
ill-defined heart disease
Diabetes mellitus
Ischaemic heart disease
Hypertension
Nephritisnephrosis
Stroke
ill-defined heart disease
Diabetes mellitus
Ischaemic heart disease
Hypertension
Nephritisnephrosis
Males
Female
UN - Male
SA 1997
SA 2004
UN - Female
SA 1997
SA 2004
0 pts
1 - 3 pts
4 - 9 pts
10+ pts
42
Source wwwclinicaltrialsgov 22-Oct-2010
Clinical trials registered across Africa
43
0
500
1000
1500
2000
2500
South Africa Kenya Malawi Tanzania Uganda Zambia
Selected African countries
2005
2010
2015
Source ClinTrialsgov
Trend 2005 - 2015
Source wwwclinicaltrialsgov 28-Aug-2015
44
AFRICA FOUND IN TRANSLATION
bull Vast treatment-naiumlve population bull Cost advantages (still) bull Diverse ethnicity amp morbidity bull Inverse seasonality bull Site capacity-building widely implemented bull Robust regulatory review bull Variable but generally good regulatory timelines bull Established GCP culture ndash sites and home-bred CROs
45
THANK YOU
Foliennummer 1
Triclinium A South African CRO
Collaboration with VPM SII
Vaccine Trials in SA 2015
Foliennummer 5
Foliennummer 6
Foliennummer 7
Foliennummer 8
Foliennummer 9
Foliennummer 10
Foliennummer 11
Foliennummer 12
Foliennummer 13
Foliennummer 14
Foliennummer 15
Foliennummer 16
Foliennummer 17
Distribution of clinical trial sites
Foliennummer 19
South Africa Leading Causes of Death
Foliennummer 21
Foliennummer 22
South Africa TB deaths by age group
Foliennummer 24
Foliennummer 25
Foliennummer 26
Foliennummer 27
Foliennummer 28
Foliennummer 29
Foliennummer 30
Foliennummer 31
SA Clinical Trial Regulatory Processes
Clinical Trial Density Active sites million population
Foliennummer 34
Why Africa
Foliennummer 36
AFRICA hellip the true size
SSV to SIV
Foliennummer 39
Foliennummer 40
Foliennummer 41
Foliennummer 42
Foliennummer 43
AFRICA FOUND IN TRANSLATION
Foliennummer 45
Region
Median
of Sites
Patients Site
0 pts
1 - 3 pts
4 - 9 pts
10+ pts
Latin America
4
21
26
30
23
North America
3
29
29
24
18
Eastern Europe
6
15
31
26
27
Western Europe
4
15
22
29
34
Asia Pacific
4
19
30
34
18
Africa
10
4
17
28
51
0 pts
1 - 3 pts
4 - 9 pts
10+ pts
Latin America
21
26
30
23
North America
29
29
24
18
Eastern Europe
15
31
26
27
Western Europe
15
22
29
34
Asia Pacific
19
30
34
18
Africa
4
17
28
51
Males
Female
15-19
210
150
20-24
340
205
25-29
395
300
30-34
460
360
35-39
600
405
40-44
800
500
45-49
1100
700
50-54
1600
1050
55-54
2300
1580
60-64
3340
2250
UN - Male
SA 1997
SA 2004
UN - Female
SA 1997
SA 2004
15-19
210
235
216
150
165
187
20-24
340
381
555
205
331
1085
25-29
395
625
1081
300
452
1985
30-34
460
817
2118
360
489
2267
35-39
600
916
2498
405
526
1890
40-44
800
1136
2765
500
615
1548
45-49
1100
1486
2744
700
800
1400
50-54
1600
2016
2979
1050
1116
1506
55-54
2300
2838
3270
1580
1626
1717
60-64
3340
3614
4146
2250
2201
2360
Stroke
ill-defined heart disease
Diabetes mellitus
Ischaemic heart disease
Hypertension
Nephritisnephrosis
Stroke
ill-defined heart disease
Diabetes mellitus
Ischaemic heart disease
Hypertension
Nephritisnephrosis
1999
34
345
20
248
14
10
1999
295
246
23
10
145
68
2000
36
362
218
249
152
112
2000
318
268
241
108
16
8
2001
35
372
22
25
15
125
2001
322
28
252
102
162
95
2002
405
298
24
26
147
126
2002
352
295
27
115
16
10
2003
425
32
245
285
152
15
2003
382
299
285
122
17
12
2004
39
325
255
26
165
16
2004
35
30
295
121
19
119
2005
36
328
265
26
15
162
2005
325
30
32
12
18
12
2006
35
336
27
258
155
16
2006
33
32
32
11
18
125
COPD
Asthma
Tracheabronchial lung cancer
Oesophageal cancer
prostate cancer
Cervical cancer
Breast cancer
1999
2001
12
135
10
26
2000
204
116
13
92
28
2001
222
131
133
96
27
2002
23
144
128
95
285
2003
243
149
124
94
29
2004
229
154
1255
87
29
2005
224
152
122
82
295
2006
224
136
116
75
3
COPD
Asthma
Tracheabronchial lung cancer
Oesophageal cancer
Prostate cancer
Cervical cancer
Breast cancer
1999
88
92
43
41
106
82
2000
96
95
4
43
11
81
2001
10
109
4
4
111
89
2002
10
116
4
4
112
85
2003
11
124
4
395
116
85
2004
102
1295
44
39
115
101
2005
105
128
42
38
1185
10
2006
10
12
42
32
1205
10
Based on this survey the researchers estimate that 109 of all South Africans over 2 years old were living with HIV in 2008 In 2002 and 2005 this figure was 114 and 108 respectively showing a degree of stabilisation Among those between 15 and 49 years old the estimated HIV prevalence was 169 in 2008 The survey found the prevalence among children aged 2-14 to be 25 down significantly since 2002 when prevalence was 56
Estimated HIV prevalence () among South Africans aged 2 years and older by age 2002-2008
Age
HIV +
HIV -
Children (2-14 years)
25
975
Youth (15-24 years)
87
913
Adults (25 and older)
168
832
(15-49 years)
169
831
Total (2 and older)
109
891
Estimated HIV prevalence among South Africans by age and sex 2008
Age
Male prevalence
Female prevalence
2-14
3
2
15-19
25
67
20-24
51
211
25-29
157
327
30-34
258
291
35-39
185
248
40-44
192
163
45-49
64
141
50-54
104
102
55-59
62
77
60+
35
18
Total
79
136
Among females HIV prevalence is highest in those between 25 and 29 years old among males the peak is in the group aged 30-34 years
HIV prevalence () by province 2002-2008
Province
2002
2005
2008
KwaZulu-Natal
117
165
158
Mpumalanga
141
152
154
Free State
149
126
126
North West
103
109
113
Gauteng
147
108
103
Eastern Cape
66
89
9
Limpopo
98
8
88
Northern Cape
84
54
59
Western Cape
107
19
38
National
114
108
109
The results of this study suggest that KwaZulu-Natal Mpumulanga and Free State have the highest HIV prevalence However the relatively small sample sizes may limit precision and in several cases the ranges of uncertainty overlap
HIV prevalence by population group 2008
Population group
Prevalence ()
African
136
864
White
03
997
Coloured
17
983
Indian
03
997
Studies of AIDS deaths
Latin America
Latin America
Latin America
Latin America
North America
North America
North America
North America
Eastern Europe
Eastern Europe
Eastern Europe
Eastern Europe
Western Europe
Western Europe
Western Europe
Western Europe
Asia Pacific
Asia Pacific
Asia Pacific
Asia Pacific
Africa
Africa
Africa
Africa
Country
Study starts
Subjects randomised
SubjectsStudy
USA
32
4385
13703125
Russia
20
788
394
Germany
19
1883
991052631579
UK
13
265
203846153846
South Africa
12
347
289166666667
Argentina
12
329
274166666667
Australia
11
195
177272727273
India
7
275
392857142857
Brazil
3
115
383333333333
Country
Initiation
Site activation
Recruitment
LOC setup
Unproductive sites
(Approval ndash FCI)
(FCI ndash FSFV)
(FSFV ndash LSFV)
(CPC ndash FSFV)
South Africa
19
38
153
357
21
Australia
117
63
401
239
11
Germany
16
37
401
224
21
UK
9
101
301
346
20
Russia
11
52
174
334
9
India
31
28
389
431
3
Argentina
94
67
288
32
13
Brazil
79
59
94
656
20
USA
44
31
149
26
Country
Pts Rand
Sites
Av CPP
Cost Per Country
Ethics Subm
Regulatory Fees
Add Inv Fees
CT Scan Total
Ethics + Regulatory
Total Regulatory Fees
South Africa
25
5
7250
181250
290
460
363
0
750
1113
Canada
18
4
832545
14985818
181818
0
0
1557576
181818
1818
Italy
7
2
10000
70000
2200
0
0
0
2200
2200
Germany
55
10
7000
385000
3000
0
0
12000
3000
3000
Peru
40
5
7000
280000
1500
1000
2000
60000
2500
4500
Poland
15
4
10000
150000
0
2500
2400
0
2500
4900
Spain
40
7
10500
420000
0
0
5450
0
0
5450
UK
12
4
13000
156000
0
0
5556
0
0
5556
Bulgaria
18
4
10000
180000
0
5000
1000
0
5000
6000
Taiwan
20
4
1179649
2359298
104167
313
5208
0
135467
6563
Czech Rep
10
2
10000
100000
1500
3000
3000
0
4500
7500
Greece
40
7
9000
360000
0
7500
0
0
7500
7500
Chile
15
4
10840
162600
1700
3600
3000
0
5300
8300
Belgium
25
6
12200
305000
3992
4332
0
0
8324
8324
Korea
30
3
10827
324802
1114
0
14324
0
1114
15438
Singapore
10
2
11565
115650
1750
0
17975
0
1750
19725
France
50
10
9000
450000
0
0
20000
0
0
20000
China
39
5
4978
194142
5224
0
39814
0
5224
40336
New Zealand
10
3
145244
145244
1973
0
43123
0
1973
45096
Israel
10
6
11140
111400
2060
3000
48400
16500
5060
53460
Brazil
30
6
10000
300000
2000
287356
5649202
0
487356
61366
Australia
24
6
40200
964800
0
500
82500
0
500
83000
23
543
109
532856799
3304716
26939
27700043
73748966
[1753EURO x 14 (ex rate) = $2454] [ $245416 hours=$153hour]
1095625
1095625
12271
1753
198089
198089
208514736842
South Africa
Canada
Italy
Germany
Peru
Poland
Spain
UK
Bulgaria
Taiwan
Czech Rep
Greece
Chile
Belgium
Korea
Singapore
France
China
New Zealand
Israel
Brazil
Australia
Country
Study starts
Subjects randomised
SubjectsStudy
USA
32
4385
13703125
Russia
20
788
394
Germany
19
1883
991052631579
UK
13
265
203846153846
South Africa
12
347
289166666667
Argentina
12
329
274166666667
Australia
11
195
177272727273
India
7
275
392857142857
Brazil
3
115
383333333333
Country
Initiation
Site activation
Recruitment
LOC setup
Unproductive sites
(Approval ndash FCI)
(FCI ndash FSFV)
(FSFV ndash LSFV)
(CPC ndash FSFV)
South Africa
19
38
153
357
21
Australia
117
63
401
239
11
Germany
16
37
401
224
21
UK
9
101
301
346
20
Russia
11
52
174
334
9
India
31
28
389
431
3
Argentina
94
67
288
32
13
Brazil
79
59
94
656
20
USA
44
31
149
26
Country
Pts Rand
Sites
Av CPP
Cost Per Country
Ethics Subm
Regulatory Fees
Add Inv Fees
CT Scan Total
Ethics + Regulatory
Total Regulatory Fees
China
39
5
4978
194142
522
0
39814
0
522
40336
Germany
55
10
7000
385000
3000
0
0
12000
3000
3000
Peru
40
5
7000
280000
1500
1000
2000
60000
2500
4500
South Africa
25
5
7250
181250
290
460
363
0
750
1113
Canada
18
4
8325
149858
1818
0
0
1557576
1818
1818
Greece
40
7
9000
360000
0
7500
0
0
7500
7500
France
50
10
9000
450000
0
0
20000
0
0
20000
Italy
7
2
10000
70000
2200
0
0
0
2200
2200
Poland
15
4
10000
150000
0
2500
2400
0
2500
4900
Bulgaria
18
4
10000
180000
0
5000
1000
0
5000
6000
Czech Rep
10
2
10000
100000
1500
3000
3000
0
4500
7500
Brazil
30
6
10000
300000
2000
2874
56492
0
4874
61366
Spain
40
7
10500
420000
0
0
5450
0
0
5450
Korea
30
3
10827
324802
1114
0
14324
0
1114
15438
Chile
15
4
10840
162600
1700
3600
3000
0
5300
8300
Israel
10
6
11140
111400
2060
3000
48400
16500
5060
53460
Singapore
10
2
11565
115650
1750
0
17975
0
1750
19725
Taiwan
20
4
11796
235930
1042
313
5208
0
1355
6563
Belgium
25
6
12200
305000
3992
4332
0
0
8324
8324
UK
12
4
13000
156000
0
0
5556
0
0
5556
New Zealand
10
3
14524
145244
1973
0
43123
0
1973
45096
Australia
24
6
40200
964800
0
500
82500
0
500
83000
23
543
109
5328568
33047
26939
277000
73748966
[1753EURO x 14 (ex rate) = $2454] [ $245416 hours=$153hour]
110
1095625
1227
1753
19809
20
21
Sheet2
Sheet2
Average Cost Per Patient (Euro)
Average Cost Per Patient
Sheet4
Ethics Subm
Regulatory Fees
Sheet3
Ethics + Regulatory
Total Ethics and Regulatory Fees
Add Inv Fees
Additional Investigator Application Fees
Total Regulatory Fees
Study starts
SubjectsStudy
31
Euro
0
10000
20000
30000
40000
50000
60000
70000
80000
90000S
outh
Afri
caC
anad
a
Italy
Ger
man
yP
eru
Pol
and
Spa
in UK
Bul
garia
Taiw
anC
zech
Rep
Gre
ece
Chi
leB
elgi
umK
orea
Sin
gapo
reFr
ance
Chi
naN
ew Z
eala
ndIs
rael
Bra
zil
Aus
tralia
Source Bayer Presented SACRA Conference 2009
Eur
os
Regulatory Application Fees
Chart1
Total Regulatory Fees
1113
181818
2200
3000
4500
4900
5450
5556
6000
656267
7500
7500
8300
8324
15438
19725
20000
403364
45096
53460
6136558
83000
Sheet1
Sheet2
Sheet2
Average Cost Per Patient (Euro)
Average Cost Per Patient
Sheet4
Ethics Subm
Regulatory Fees
Sheet3
Ethics + Regulatory
Total Ethics and Regulatory Fees
Add Inv Fees
Additional Investigator Application Fees
Total Regulatory Fees
Study starts
SubjectsStudy
32
SA Clinical Trial Regulatory Processes
Governed by SA-GCP and Declaration of Helsinki SA National Clinical Trials Register (SANCTR) Medicines Control Council (National Regulatory Authority)
o New protocols o Amendments o Additional sitesinvestigators
Ethics Committees (33 NHREC-registered) RegionalMunicipal DoH Export permits for bio samples (Nat Health Act 2003)
Clinical Trial Density Active sites million population
Nature Reviews Drug Discovery 7 13-14 (January 2008)
France 503
Germany 512 Canada
922
USA 1203
Czech Republic 776
553 sites
South Africa 119
757 sites
757 sites
533 sites
1084 sites
Argentina 269
Russia 77
China 04
India 07
34
Gateway to Africa
35
Why Africa bull Large accessible population relatively new to clinical trials
bull Experienced and willing investigators
bull Many clinical trial sites established by PDPs NGOs etc
bull Expanding therapeutic areas shifting burden of disease from
infectious to non-communicable diseases
bull Significantly improved infrastructure and accessibility
bull Rapidly evolving regulatory and ethics procedures
bull Potential for capacity building and sustainable clinical trial potential
36
Relatively young GCP culture Resident mentorships to build capacity Locations ndash accessibility for site monitoring Variable infrastructure esp electricity connectivity and
transportation Resourcing of public healthcare systems
Sub-Saharan Africa challenges
37
bull Second-largest continent
bull Spans NS and EW hemispheres
bull Second most populous continent 2014 estimate 1069 billion
bull Home to more than a quarter of the 196 independent countries
bull All 54 African countries are UN members
bull 39 urban population
bull 12 metropolitan areas gt 4m
bull gt 3000 distinct ethnicities
bull gt 2000 languages spoken
AFRICA hellip the true size
wwwcitypopulationdeworldAgglomerations 2015
38
SSV to SIV
0
5
10
15
20
25
30
35
40
45
Africa North America
Asia Pacific
Western Europe
Eastern Europe
Latin America
Source Quintiles South Africa SACRA Conference 2008
Wee
ks (A
vera
ge)
Start-Up Timelines
39
Region Median
Patients Site
of Sites
0 pts 1 - 3 pts 4 - 9 pts 10+ pts
Latin America 40 21 26 30 23
North America 30 29 29 24 18
Eastern Europe 60 15 31 26 27
Western Europe 40 15 22 29 34
Asia Pacific 40 19 30 34 18
Africa 100 4 17 28 51
Enrollment performance by region for 2008
Site Performance
Source Quintiles South Africa Presented SACRA Conference 2009
40
0 1 2 3 4 5 6 7 8 9
10
Latin America
North America
Eastern Europe
Western Europe
Asia Pacific
Africa
Num
ber o
f par
ticip
ants
MEDIAN site enrollment by region for 2008
Source Quintiles South Africa Presented SACRA Conference 2009
Site Performance
41
Source Quintiles South Africa Presented SACRA Conference 2009
s
ites
0
5
10
15
20
25
30
35
40
45
50
LatinAmerica
NorthAmerica
EasternEurope
WesternEurope
Asia Pacific Africa
0 pts
1 - 3 pts
4 - 9 pts
10+ pts
Enrollment performance by region for 2008
Site Performance
Chart1
0 pts
1 - 3 pts
4 - 9 pts
10+ pts
021
026
03
023
029
029
024
018
015
031
026
027
015
022
029
034
019
03
034
018
004
017
028
051
HIV
HIV
Resiratory amp Cancer
Male prevalence
Female prevalence
CVS
Overall death rates
Overall death rates
COPD
Asthma
Tracheabronchial lung cancer
Oesophageal cancer
prostate cancer
Trial metrics
COPD
Asthma
Tracheabronchial lung cancer
Oesophageal cancer
Prostate cancer
Cervical cancer
Breast cancer
Stroke
ill-defined heart disease
Diabetes mellitus
Ischaemic heart disease
Hypertension
Nephritisnephrosis
Stroke
ill-defined heart disease
Diabetes mellitus
Ischaemic heart disease
Hypertension
Nephritisnephrosis
Males
Female
UN - Male
SA 1997
SA 2004
UN - Female
SA 1997
SA 2004
0 pts
1 - 3 pts
4 - 9 pts
10+ pts
42
Source wwwclinicaltrialsgov 22-Oct-2010
Clinical trials registered across Africa
43
0
500
1000
1500
2000
2500
South Africa Kenya Malawi Tanzania Uganda Zambia
Selected African countries
2005
2010
2015
Source ClinTrialsgov
Trend 2005 - 2015
Source wwwclinicaltrialsgov 28-Aug-2015
44
AFRICA FOUND IN TRANSLATION
bull Vast treatment-naiumlve population bull Cost advantages (still) bull Diverse ethnicity amp morbidity bull Inverse seasonality bull Site capacity-building widely implemented bull Robust regulatory review bull Variable but generally good regulatory timelines bull Established GCP culture ndash sites and home-bred CROs
45
THANK YOU
Foliennummer 1
Triclinium A South African CRO
Collaboration with VPM SII
Vaccine Trials in SA 2015
Foliennummer 5
Foliennummer 6
Foliennummer 7
Foliennummer 8
Foliennummer 9
Foliennummer 10
Foliennummer 11
Foliennummer 12
Foliennummer 13
Foliennummer 14
Foliennummer 15
Foliennummer 16
Foliennummer 17
Distribution of clinical trial sites
Foliennummer 19
South Africa Leading Causes of Death
Foliennummer 21
Foliennummer 22
South Africa TB deaths by age group
Foliennummer 24
Foliennummer 25
Foliennummer 26
Foliennummer 27
Foliennummer 28
Foliennummer 29
Foliennummer 30
Foliennummer 31
SA Clinical Trial Regulatory Processes
Clinical Trial Density Active sites million population
Foliennummer 34
Why Africa
Foliennummer 36
AFRICA hellip the true size
SSV to SIV
Foliennummer 39
Foliennummer 40
Foliennummer 41
Foliennummer 42
Foliennummer 43
AFRICA FOUND IN TRANSLATION
Foliennummer 45
Region
Median
of Sites
Patients Site
0 pts
1 - 3 pts
4 - 9 pts
10+ pts
Latin America
4
21
26
30
23
North America
3
29
29
24
18
Eastern Europe
6
15
31
26
27
Western Europe
4
15
22
29
34
Asia Pacific
4
19
30
34
18
Africa
10
4
17
28
51
0 pts
1 - 3 pts
4 - 9 pts
10+ pts
Latin America
21
26
30
23
North America
29
29
24
18
Eastern Europe
15
31
26
27
Western Europe
15
22
29
34
Asia Pacific
19
30
34
18
Africa
4
17
28
51
Males
Female
15-19
210
150
20-24
340
205
25-29
395
300
30-34
460
360
35-39
600
405
40-44
800
500
45-49
1100
700
50-54
1600
1050
55-54
2300
1580
60-64
3340
2250
UN - Male
SA 1997
SA 2004
UN - Female
SA 1997
SA 2004
15-19
210
235
216
150
165
187
20-24
340
381
555
205
331
1085
25-29
395
625
1081
300
452
1985
30-34
460
817
2118
360
489
2267
35-39
600
916
2498
405
526
1890
40-44
800
1136
2765
500
615
1548
45-49
1100
1486
2744
700
800
1400
50-54
1600
2016
2979
1050
1116
1506
55-54
2300
2838
3270
1580
1626
1717
60-64
3340
3614
4146
2250
2201
2360
Stroke
ill-defined heart disease
Diabetes mellitus
Ischaemic heart disease
Hypertension
Nephritisnephrosis
Stroke
ill-defined heart disease
Diabetes mellitus
Ischaemic heart disease
Hypertension
Nephritisnephrosis
1999
34
345
20
248
14
10
1999
295
246
23
10
145
68
2000
36
362
218
249
152
112
2000
318
268
241
108
16
8
2001
35
372
22
25
15
125
2001
322
28
252
102
162
95
2002
405
298
24
26
147
126
2002
352
295
27
115
16
10
2003
425
32
245
285
152
15
2003
382
299
285
122
17
12
2004
39
325
255
26
165
16
2004
35
30
295
121
19
119
2005
36
328
265
26
15
162
2005
325
30
32
12
18
12
2006
35
336
27
258
155
16
2006
33
32
32
11
18
125
COPD
Asthma
Tracheabronchial lung cancer
Oesophageal cancer
prostate cancer
Cervical cancer
Breast cancer
1999
2001
12
135
10
26
2000
204
116
13
92
28
2001
222
131
133
96
27
2002
23
144
128
95
285
2003
243
149
124
94
29
2004
229
154
1255
87
29
2005
224
152
122
82
295
2006
224
136
116
75
3
COPD
Asthma
Tracheabronchial lung cancer
Oesophageal cancer
Prostate cancer
Cervical cancer
Breast cancer
1999
88
92
43
41
106
82
2000
96
95
4
43
11
81
2001
10
109
4
4
111
89
2002
10
116
4
4
112
85
2003
11
124
4
395
116
85
2004
102
1295
44
39
115
101
2005
105
128
42
38
1185
10
2006
10
12
42
32
1205
10
Based on this survey the researchers estimate that 109 of all South Africans over 2 years old were living with HIV in 2008 In 2002 and 2005 this figure was 114 and 108 respectively showing a degree of stabilisation Among those between 15 and 49 years old the estimated HIV prevalence was 169 in 2008 The survey found the prevalence among children aged 2-14 to be 25 down significantly since 2002 when prevalence was 56
Estimated HIV prevalence () among South Africans aged 2 years and older by age 2002-2008
Age
HIV +
HIV -
Children (2-14 years)
25
975
Youth (15-24 years)
87
913
Adults (25 and older)
168
832
(15-49 years)
169
831
Total (2 and older)
109
891
Estimated HIV prevalence among South Africans by age and sex 2008
Age
Male prevalence
Female prevalence
2-14
3
2
15-19
25
67
20-24
51
211
25-29
157
327
30-34
258
291
35-39
185
248
40-44
192
163
45-49
64
141
50-54
104
102
55-59
62
77
60+
35
18
Total
79
136
Among females HIV prevalence is highest in those between 25 and 29 years old among males the peak is in the group aged 30-34 years
HIV prevalence () by province 2002-2008
Province
2002
2005
2008
KwaZulu-Natal
117
165
158
Mpumalanga
141
152
154
Free State
149
126
126
North West
103
109
113
Gauteng
147
108
103
Eastern Cape
66
89
9
Limpopo
98
8
88
Northern Cape
84
54
59
Western Cape
107
19
38
National
114
108
109
The results of this study suggest that KwaZulu-Natal Mpumulanga and Free State have the highest HIV prevalence However the relatively small sample sizes may limit precision and in several cases the ranges of uncertainty overlap
HIV prevalence by population group 2008
Population group
Prevalence ()
African
136
864
White
03
997
Coloured
17
983
Indian
03
997
Studies of AIDS deaths
Latin America
Latin America
Latin America
Latin America
North America
North America
North America
North America
Eastern Europe
Eastern Europe
Eastern Europe
Eastern Europe
Western Europe
Western Europe
Western Europe
Western Europe
Asia Pacific
Asia Pacific
Asia Pacific
Asia Pacific
Africa
Africa
Africa
Africa
Country
Study starts
Subjects randomised
SubjectsStudy
USA
32
4385
13703125
Russia
20
788
394
Germany
19
1883
991052631579
UK
13
265
203846153846
South Africa
12
347
289166666667
Argentina
12
329
274166666667
Australia
11
195
177272727273
India
7
275
392857142857
Brazil
3
115
383333333333
Country
Initiation
Site activation
Recruitment
LOC setup
Unproductive sites
(Approval ndash FCI)
(FCI ndash FSFV)
(FSFV ndash LSFV)
(CPC ndash FSFV)
South Africa
19
38
153
357
21
Australia
117
63
401
239
11
Germany
16
37
401
224
21
UK
9
101
301
346
20
Russia
11
52
174
334
9
India
31
28
389
431
3
Argentina
94
67
288
32
13
Brazil
79
59
94
656
20
USA
44
31
149
26
Country
Pts Rand
Sites
Av CPP
Cost Per Country
Ethics Subm
Regulatory Fees
Add Inv Fees
CT Scan Total
Ethics + Regulatory
Total Regulatory Fees
South Africa
25
5
7250
181250
290
460
363
0
750
1113
Canada
18
4
832545
14985818
181818
0
0
1557576
181818
1818
Italy
7
2
10000
70000
2200
0
0
0
2200
2200
Germany
55
10
7000
385000
3000
0
0
12000
3000
3000
Peru
40
5
7000
280000
1500
1000
2000
60000
2500
4500
Poland
15
4
10000
150000
0
2500
2400
0
2500
4900
Spain
40
7
10500
420000
0
0
5450
0
0
5450
UK
12
4
13000
156000
0
0
5556
0
0
5556
Bulgaria
18
4
10000
180000
0
5000
1000
0
5000
6000
Taiwan
20
4
1179649
2359298
104167
313
5208
0
135467
6563
Czech Rep
10
2
10000
100000
1500
3000
3000
0
4500
7500
Greece
40
7
9000
360000
0
7500
0
0
7500
7500
Chile
15
4
10840
162600
1700
3600
3000
0
5300
8300
Belgium
25
6
12200
305000
3992
4332
0
0
8324
8324
Korea
30
3
10827
324802
1114
0
14324
0
1114
15438
Singapore
10
2
11565
115650
1750
0
17975
0
1750
19725
France
50
10
9000
450000
0
0
20000
0
0
20000
China
39
5
4978
194142
5224
0
39814
0
5224
40336
New Zealand
10
3
145244
145244
1973
0
43123
0
1973
45096
Israel
10
6
11140
111400
2060
3000
48400
16500
5060
53460
Brazil
30
6
10000
300000
2000
287356
5649202
0
487356
61366
Australia
24
6
40200
964800
0
500
82500
0
500
83000
23
543
109
532856799
3304716
26939
27700043
73748966
[1753EURO x 14 (ex rate) = $2454] [ $245416 hours=$153hour]
1095625
1095625
12271
1753
198089
198089
208514736842
South Africa
Canada
Italy
Germany
Peru
Poland
Spain
UK
Bulgaria
Taiwan
Czech Rep
Greece
Chile
Belgium
Korea
Singapore
France
China
New Zealand
Israel
Brazil
Australia
Country
Study starts
Subjects randomised
SubjectsStudy
USA
32
4385
13703125
Russia
20
788
394
Germany
19
1883
991052631579
UK
13
265
203846153846
South Africa
12
347
289166666667
Argentina
12
329
274166666667
Australia
11
195
177272727273
India
7
275
392857142857
Brazil
3
115
383333333333
Country
Initiation
Site activation
Recruitment
LOC setup
Unproductive sites
(Approval ndash FCI)
(FCI ndash FSFV)
(FSFV ndash LSFV)
(CPC ndash FSFV)
South Africa
19
38
153
357
21
Australia
117
63
401
239
11
Germany
16
37
401
224
21
UK
9
101
301
346
20
Russia
11
52
174
334
9
India
31
28
389
431
3
Argentina
94
67
288
32
13
Brazil
79
59
94
656
20
USA
44
31
149
26
Country
Pts Rand
Sites
Av CPP
Cost Per Country
Ethics Subm
Regulatory Fees
Add Inv Fees
CT Scan Total
Ethics + Regulatory
Total Regulatory Fees
China
39
5
4978
194142
522
0
39814
0
522
40336
Germany
55
10
7000
385000
3000
0
0
12000
3000
3000
Peru
40
5
7000
280000
1500
1000
2000
60000
2500
4500
South Africa
25
5
7250
181250
290
460
363
0
750
1113
Canada
18
4
8325
149858
1818
0
0
1557576
1818
1818
Greece
40
7
9000
360000
0
7500
0
0
7500
7500
France
50
10
9000
450000
0
0
20000
0
0
20000
Italy
7
2
10000
70000
2200
0
0
0
2200
2200
Poland
15
4
10000
150000
0
2500
2400
0
2500
4900
Bulgaria
18
4
10000
180000
0
5000
1000
0
5000
6000
Czech Rep
10
2
10000
100000
1500
3000
3000
0
4500
7500
Brazil
30
6
10000
300000
2000
2874
56492
0
4874
61366
Spain
40
7
10500
420000
0
0
5450
0
0
5450
Korea
30
3
10827
324802
1114
0
14324
0
1114
15438
Chile
15
4
10840
162600
1700
3600
3000
0
5300
8300
Israel
10
6
11140
111400
2060
3000
48400
16500
5060
53460
Singapore
10
2
11565
115650
1750
0
17975
0
1750
19725
Taiwan
20
4
11796
235930
1042
313
5208
0
1355
6563
Belgium
25
6
12200
305000
3992
4332
0
0
8324
8324
UK
12
4
13000
156000
0
0
5556
0
0
5556
New Zealand
10
3
14524
145244
1973
0
43123
0
1973
45096
Australia
24
6
40200
964800
0
500
82500
0
500
83000
23
543
109
5328568
33047
26939
277000
73748966
Sheet2
Average Cost Per Patient (Euro)
Average Cost Per Patient
Sheet4
Ethics Subm
Regulatory Fees
Sheet3
Ethics + Regulatory
Total Ethics and Regulatory Fees
Add Inv Fees
Additional Investigator Application Fees
Total Regulatory Fees
Study starts
SubjectsStudy
31
Euro
0
10000
20000
30000
40000
50000
60000
70000
80000
90000S
outh
Afri
caC
anad
a
Italy
Ger
man
yP
eru
Pol
and
Spa
in UK
Bul
garia
Taiw
anC
zech
Rep
Gre
ece
Chi
leB
elgi
umK
orea
Sin
gapo
reFr
ance
Chi
naN
ew Z
eala
ndIs
rael
Bra
zil
Aus
tralia
Source Bayer Presented SACRA Conference 2009
Eur
os
Regulatory Application Fees
Chart1
Total Regulatory Fees
1113
181818
2200
3000
4500
4900
5450
5556
6000
656267
7500
7500
8300
8324
15438
19725
20000
403364
45096
53460
6136558
83000
Sheet1
Sheet2
Sheet2
Average Cost Per Patient (Euro)
Average Cost Per Patient
Sheet4
Ethics Subm
Regulatory Fees
Sheet3
Ethics + Regulatory
Total Ethics and Regulatory Fees
Add Inv Fees
Additional Investigator Application Fees
Total Regulatory Fees
Study starts
SubjectsStudy
32
SA Clinical Trial Regulatory Processes
Governed by SA-GCP and Declaration of Helsinki SA National Clinical Trials Register (SANCTR) Medicines Control Council (National Regulatory Authority)
o New protocols o Amendments o Additional sitesinvestigators
Ethics Committees (33 NHREC-registered) RegionalMunicipal DoH Export permits for bio samples (Nat Health Act 2003)
Clinical Trial Density Active sites million population
Nature Reviews Drug Discovery 7 13-14 (January 2008)
France 503
Germany 512 Canada
922
USA 1203
Czech Republic 776
553 sites
South Africa 119
757 sites
757 sites
533 sites
1084 sites
Argentina 269
Russia 77
China 04
India 07
34
Gateway to Africa
35
Why Africa bull Large accessible population relatively new to clinical trials
bull Experienced and willing investigators
bull Many clinical trial sites established by PDPs NGOs etc
bull Expanding therapeutic areas shifting burden of disease from
infectious to non-communicable diseases
bull Significantly improved infrastructure and accessibility
bull Rapidly evolving regulatory and ethics procedures
bull Potential for capacity building and sustainable clinical trial potential
36
Relatively young GCP culture Resident mentorships to build capacity Locations ndash accessibility for site monitoring Variable infrastructure esp electricity connectivity and
transportation Resourcing of public healthcare systems
Sub-Saharan Africa challenges
37
bull Second-largest continent
bull Spans NS and EW hemispheres
bull Second most populous continent 2014 estimate 1069 billion
bull Home to more than a quarter of the 196 independent countries
bull All 54 African countries are UN members
bull 39 urban population
bull 12 metropolitan areas gt 4m
bull gt 3000 distinct ethnicities
bull gt 2000 languages spoken
AFRICA hellip the true size
wwwcitypopulationdeworldAgglomerations 2015
38
SSV to SIV
0
5
10
15
20
25
30
35
40
45
Africa North America
Asia Pacific
Western Europe
Eastern Europe
Latin America
Source Quintiles South Africa SACRA Conference 2008
Wee
ks (A
vera
ge)
Start-Up Timelines
39
Region Median
Patients Site
of Sites
0 pts 1 - 3 pts 4 - 9 pts 10+ pts
Latin America 40 21 26 30 23
North America 30 29 29 24 18
Eastern Europe 60 15 31 26 27
Western Europe 40 15 22 29 34
Asia Pacific 40 19 30 34 18
Africa 100 4 17 28 51
Enrollment performance by region for 2008
Site Performance
Source Quintiles South Africa Presented SACRA Conference 2009
40
0 1 2 3 4 5 6 7 8 9
10
Latin America
North America
Eastern Europe
Western Europe
Asia Pacific
Africa
Num
ber o
f par
ticip
ants
MEDIAN site enrollment by region for 2008
Source Quintiles South Africa Presented SACRA Conference 2009
Site Performance
41
Source Quintiles South Africa Presented SACRA Conference 2009
s
ites
0
5
10
15
20
25
30
35
40
45
50
LatinAmerica
NorthAmerica
EasternEurope
WesternEurope
Asia Pacific Africa
0 pts
1 - 3 pts
4 - 9 pts
10+ pts
Enrollment performance by region for 2008
Site Performance
Chart1
0 pts
1 - 3 pts
4 - 9 pts
10+ pts
021
026
03
023
029
029
024
018
015
031
026
027
015
022
029
034
019
03
034
018
004
017
028
051
HIV
HIV
Resiratory amp Cancer
Male prevalence
Female prevalence
CVS
Overall death rates
Overall death rates
COPD
Asthma
Tracheabronchial lung cancer
Oesophageal cancer
prostate cancer
Trial metrics
COPD
Asthma
Tracheabronchial lung cancer
Oesophageal cancer
Prostate cancer
Cervical cancer
Breast cancer
Stroke
ill-defined heart disease
Diabetes mellitus
Ischaemic heart disease
Hypertension
Nephritisnephrosis
Stroke
ill-defined heart disease
Diabetes mellitus
Ischaemic heart disease
Hypertension
Nephritisnephrosis
Males
Female
UN - Male
SA 1997
SA 2004
UN - Female
SA 1997
SA 2004
0 pts
1 - 3 pts
4 - 9 pts
10+ pts
42
Source wwwclinicaltrialsgov 22-Oct-2010
Clinical trials registered across Africa
43
0
500
1000
1500
2000
2500
South Africa Kenya Malawi Tanzania Uganda Zambia
Selected African countries
2005
2010
2015
Source ClinTrialsgov
Trend 2005 - 2015
Source wwwclinicaltrialsgov 28-Aug-2015
44
AFRICA FOUND IN TRANSLATION
bull Vast treatment-naiumlve population bull Cost advantages (still) bull Diverse ethnicity amp morbidity bull Inverse seasonality bull Site capacity-building widely implemented bull Robust regulatory review bull Variable but generally good regulatory timelines bull Established GCP culture ndash sites and home-bred CROs
45
THANK YOU
Foliennummer 1
Triclinium A South African CRO
Collaboration with VPM SII
Vaccine Trials in SA 2015
Foliennummer 5
Foliennummer 6
Foliennummer 7
Foliennummer 8
Foliennummer 9
Foliennummer 10
Foliennummer 11
Foliennummer 12
Foliennummer 13
Foliennummer 14
Foliennummer 15
Foliennummer 16
Foliennummer 17
Distribution of clinical trial sites
Foliennummer 19
South Africa Leading Causes of Death
Foliennummer 21
Foliennummer 22
South Africa TB deaths by age group
Foliennummer 24
Foliennummer 25
Foliennummer 26
Foliennummer 27
Foliennummer 28
Foliennummer 29
Foliennummer 30
Foliennummer 31
SA Clinical Trial Regulatory Processes
Clinical Trial Density Active sites million population
Foliennummer 34
Why Africa
Foliennummer 36
AFRICA hellip the true size
SSV to SIV
Foliennummer 39
Foliennummer 40
Foliennummer 41
Foliennummer 42
Foliennummer 43
AFRICA FOUND IN TRANSLATION
Foliennummer 45
Region
Median
of Sites
Patients Site
0 pts
1 - 3 pts
4 - 9 pts
10+ pts
Latin America
4
21
26
30
23
North America
3
29
29
24
18
Eastern Europe
6
15
31
26
27
Western Europe
4
15
22
29
34
Asia Pacific
4
19
30
34
18
Africa
10
4
17
28
51
0 pts
1 - 3 pts
4 - 9 pts
10+ pts
Latin America
21
26
30
23
North America
29
29
24
18
Eastern Europe
15
31
26
27
Western Europe
15
22
29
34
Asia Pacific
19
30
34
18
Africa
4
17
28
51
Males
Female
15-19
210
150
20-24
340
205
25-29
395
300
30-34
460
360
35-39
600
405
40-44
800
500
45-49
1100
700
50-54
1600
1050
55-54
2300
1580
60-64
3340
2250
UN - Male
SA 1997
SA 2004
UN - Female
SA 1997
SA 2004
15-19
210
235
216
150
165
187
20-24
340
381
555
205
331
1085
25-29
395
625
1081
300
452
1985
30-34
460
817
2118
360
489
2267
35-39
600
916
2498
405
526
1890
40-44
800
1136
2765
500
615
1548
45-49
1100
1486
2744
700
800
1400
50-54
1600
2016
2979
1050
1116
1506
55-54
2300
2838
3270
1580
1626
1717
60-64
3340
3614
4146
2250
2201
2360
Stroke
ill-defined heart disease
Diabetes mellitus
Ischaemic heart disease
Hypertension
Nephritisnephrosis
Stroke
ill-defined heart disease
Diabetes mellitus
Ischaemic heart disease
Hypertension
Nephritisnephrosis
1999
34
345
20
248
14
10
1999
295
246
23
10
145
68
2000
36
362
218
249
152
112
2000
318
268
241
108
16
8
2001
35
372
22
25
15
125
2001
322
28
252
102
162
95
2002
405
298
24
26
147
126
2002
352
295
27
115
16
10
2003
425
32
245
285
152
15
2003
382
299
285
122
17
12
2004
39
325
255
26
165
16
2004
35
30
295
121
19
119
2005
36
328
265
26
15
162
2005
325
30
32
12
18
12
2006
35
336
27
258
155
16
2006
33
32
32
11
18
125
COPD
Asthma
Tracheabronchial lung cancer
Oesophageal cancer
prostate cancer
Cervical cancer
Breast cancer
1999
2001
12
135
10
26
2000
204
116
13
92
28
2001
222
131
133
96
27
2002
23
144
128
95
285
2003
243
149
124
94
29
2004
229
154
1255
87
29
2005
224
152
122
82
295
2006
224
136
116
75
3
COPD
Asthma
Tracheabronchial lung cancer
Oesophageal cancer
Prostate cancer
Cervical cancer
Breast cancer
1999
88
92
43
41
106
82
2000
96
95
4
43
11
81
2001
10
109
4
4
111
89
2002
10
116
4
4
112
85
2003
11
124
4
395
116
85
2004
102
1295
44
39
115
101
2005
105
128
42
38
1185
10
2006
10
12
42
32
1205
10
Based on this survey the researchers estimate that 109 of all South Africans over 2 years old were living with HIV in 2008 In 2002 and 2005 this figure was 114 and 108 respectively showing a degree of stabilisation Among those between 15 and 49 years old the estimated HIV prevalence was 169 in 2008 The survey found the prevalence among children aged 2-14 to be 25 down significantly since 2002 when prevalence was 56
Estimated HIV prevalence () among South Africans aged 2 years and older by age 2002-2008
Age
HIV +
HIV -
Children (2-14 years)
25
975
Youth (15-24 years)
87
913
Adults (25 and older)
168
832
(15-49 years)
169
831
Total (2 and older)
109
891
Estimated HIV prevalence among South Africans by age and sex 2008
Age
Male prevalence
Female prevalence
2-14
3
2
15-19
25
67
20-24
51
211
25-29
157
327
30-34
258
291
35-39
185
248
40-44
192
163
45-49
64
141
50-54
104
102
55-59
62
77
60+
35
18
Total
79
136
Among females HIV prevalence is highest in those between 25 and 29 years old among males the peak is in the group aged 30-34 years
HIV prevalence () by province 2002-2008
Province
2002
2005
2008
KwaZulu-Natal
117
165
158
Mpumalanga
141
152
154
Free State
149
126
126
North West
103
109
113
Gauteng
147
108
103
Eastern Cape
66
89
9
Limpopo
98
8
88
Northern Cape
84
54
59
Western Cape
107
19
38
National
114
108
109
The results of this study suggest that KwaZulu-Natal Mpumulanga and Free State have the highest HIV prevalence However the relatively small sample sizes may limit precision and in several cases the ranges of uncertainty overlap
HIV prevalence by population group 2008
Population group
Prevalence ()
African
136
864
White
03
997
Coloured
17
983
Indian
03
997
Studies of AIDS deaths
Latin America
Latin America
Latin America
Latin America
North America
North America
North America
North America
Eastern Europe
Eastern Europe
Eastern Europe
Eastern Europe
Western Europe
Western Europe
Western Europe
Western Europe
Asia Pacific
Asia Pacific
Asia Pacific
Asia Pacific
Africa
Africa
Africa
Africa
Country
Study starts
Subjects randomised
SubjectsStudy
USA
32
4385
13703125
Russia
20
788
394
Germany
19
1883
991052631579
UK
13
265
203846153846
South Africa
12
347
289166666667
Argentina
12
329
274166666667
Australia
11
195
177272727273
India
7
275
392857142857
Brazil
3
115
383333333333
Country
Initiation
Site activation
Recruitment
LOC setup
Unproductive sites
(Approval ndash FCI)
(FCI ndash FSFV)
(FSFV ndash LSFV)
(CPC ndash FSFV)
South Africa
19
38
153
357
21
Australia
117
63
401
239
11
Germany
16
37
401
224
21
UK
9
101
301
346
20
Russia
11
52
174
334
9
India
31
28
389
431
3
Argentina
94
67
288
32
13
Brazil
79
59
94
656
20
USA
44
31
149
26
Country
Pts Rand
Sites
Av CPP
Cost Per Country
Ethics Subm
Regulatory Fees
Add Inv Fees
CT Scan Total
Ethics + Regulatory
Total Regulatory Fees
South Africa
25
5
7250
181250
290
460
363
0
750
1113
Canada
18
4
832545
14985818
181818
0
0
1557576
181818
1818
Italy
7
2
10000
70000
2200
0
0
0
2200
2200
Germany
55
10
7000
385000
3000
0
0
12000
3000
3000
Peru
40
5
7000
280000
1500
1000
2000
60000
2500
4500
Poland
15
4
10000
150000
0
2500
2400
0
2500
4900
Spain
40
7
10500
420000
0
0
5450
0
0
5450
UK
12
4
13000
156000
0
0
5556
0
0
5556
Bulgaria
18
4
10000
180000
0
5000
1000
0
5000
6000
Taiwan
20
4
1179649
2359298
104167
313
5208
0
135467
6563
Czech Rep
10
2
10000
100000
1500
3000
3000
0
4500
7500
Greece
40
7
9000
360000
0
7500
0
0
7500
7500
Chile
15
4
10840
162600
1700
3600
3000
0
5300
8300
Belgium
25
6
12200
305000
3992
4332
0
0
8324
8324
Korea
30
3
10827
324802
1114
0
14324
0
1114
15438
Singapore
10
2
11565
115650
1750
0
17975
0
1750
19725
France
50
10
9000
450000
0
0
20000
0
0
20000
China
39
5
4978
194142
5224
0
39814
0
5224
40336
New Zealand
10
3
145244
145244
1973
0
43123
0
1973
45096
Israel
10
6
11140
111400
2060
3000
48400
16500
5060
53460
Brazil
30
6
10000
300000
2000
287356
5649202
0
487356
61366
Australia
24
6
40200
964800
0
500
82500
0
500
83000
23
543
109
532856799
3304716
26939
27700043
73748966
[1753EURO x 14 (ex rate) = $2454] [ $245416 hours=$153hour]
1095625
1095625
12271
1753
198089
198089
208514736842
South Africa
Canada
Italy
Germany
Peru
Poland
Spain
UK
Bulgaria
Taiwan
Czech Rep
Greece
Chile
Belgium
Korea
Singapore
France
China
New Zealand
Israel
Brazil
Australia
Country
Study starts
Subjects randomised
SubjectsStudy
USA
32
4385
13703125
Russia
20
788
394
Germany
19
1883
991052631579
UK
13
265
203846153846
South Africa
12
347
289166666667
Argentina
12
329
274166666667
Australia
11
195
177272727273
India
7
275
392857142857
Brazil
3
115
383333333333
Country
Initiation
Site activation
Recruitment
LOC setup
Unproductive sites
(Approval ndash FCI)
(FCI ndash FSFV)
(FSFV ndash LSFV)
(CPC ndash FSFV)
South Africa
19
38
153
357
21
Australia
117
63
401
239
11
Germany
16
37
401
224
21
UK
9
101
301
346
20
Russia
11
52
174
334
9
India
31
28
389
431
3
Argentina
94
67
288
32
13
Brazil
79
59
94
656
20
USA
44
31
149
26
Sheet4
Ethics Subm
Regulatory Fees
Sheet3
Ethics + Regulatory
Total Ethics and Regulatory Fees
Add Inv Fees
Additional Investigator Application Fees
Total Regulatory Fees
Study starts
SubjectsStudy
31
Euro
0
10000
20000
30000
40000
50000
60000
70000
80000
90000S
outh
Afri
caC
anad
a
Italy
Ger
man
yP
eru
Pol
and
Spa
in UK
Bul
garia
Taiw
anC
zech
Rep
Gre
ece
Chi
leB
elgi
umK
orea
Sin
gapo
reFr
ance
Chi
naN
ew Z
eala
ndIs
rael
Bra
zil
Aus
tralia
Source Bayer Presented SACRA Conference 2009
Eur
os
Regulatory Application Fees
Chart1
Total Regulatory Fees
1113
181818
2200
3000
4500
4900
5450
5556
6000
656267
7500
7500
8300
8324
15438
19725
20000
403364
45096
53460
6136558
83000
Sheet1
Sheet2
Sheet2
Average Cost Per Patient (Euro)
Average Cost Per Patient
Sheet4
Ethics Subm
Regulatory Fees
Sheet3
Ethics + Regulatory
Total Ethics and Regulatory Fees
Add Inv Fees
Additional Investigator Application Fees
Total Regulatory Fees
Study starts
SubjectsStudy
32
SA Clinical Trial Regulatory Processes
Governed by SA-GCP and Declaration of Helsinki SA National Clinical Trials Register (SANCTR) Medicines Control Council (National Regulatory Authority)
o New protocols o Amendments o Additional sitesinvestigators
Ethics Committees (33 NHREC-registered) RegionalMunicipal DoH Export permits for bio samples (Nat Health Act 2003)
Clinical Trial Density Active sites million population
Nature Reviews Drug Discovery 7 13-14 (January 2008)
France 503
Germany 512 Canada
922
USA 1203
Czech Republic 776
553 sites
South Africa 119
757 sites
757 sites
533 sites
1084 sites
Argentina 269
Russia 77
China 04
India 07
34
Gateway to Africa
35
Why Africa bull Large accessible population relatively new to clinical trials
bull Experienced and willing investigators
bull Many clinical trial sites established by PDPs NGOs etc
bull Expanding therapeutic areas shifting burden of disease from
infectious to non-communicable diseases
bull Significantly improved infrastructure and accessibility
bull Rapidly evolving regulatory and ethics procedures
bull Potential for capacity building and sustainable clinical trial potential
36
Relatively young GCP culture Resident mentorships to build capacity Locations ndash accessibility for site monitoring Variable infrastructure esp electricity connectivity and
transportation Resourcing of public healthcare systems
Sub-Saharan Africa challenges
37
bull Second-largest continent
bull Spans NS and EW hemispheres
bull Second most populous continent 2014 estimate 1069 billion
bull Home to more than a quarter of the 196 independent countries
bull All 54 African countries are UN members
bull 39 urban population
bull 12 metropolitan areas gt 4m
bull gt 3000 distinct ethnicities
bull gt 2000 languages spoken
AFRICA hellip the true size
wwwcitypopulationdeworldAgglomerations 2015
38
SSV to SIV
0
5
10
15
20
25
30
35
40
45
Africa North America
Asia Pacific
Western Europe
Eastern Europe
Latin America
Source Quintiles South Africa SACRA Conference 2008
Wee
ks (A
vera
ge)
Start-Up Timelines
39
Region Median
Patients Site
of Sites
0 pts 1 - 3 pts 4 - 9 pts 10+ pts
Latin America 40 21 26 30 23
North America 30 29 29 24 18
Eastern Europe 60 15 31 26 27
Western Europe 40 15 22 29 34
Asia Pacific 40 19 30 34 18
Africa 100 4 17 28 51
Enrollment performance by region for 2008
Site Performance
Source Quintiles South Africa Presented SACRA Conference 2009
40
0 1 2 3 4 5 6 7 8 9
10
Latin America
North America
Eastern Europe
Western Europe
Asia Pacific
Africa
Num
ber o
f par
ticip
ants
MEDIAN site enrollment by region for 2008
Source Quintiles South Africa Presented SACRA Conference 2009
Site Performance
41
Source Quintiles South Africa Presented SACRA Conference 2009
s
ites
0
5
10
15
20
25
30
35
40
45
50
LatinAmerica
NorthAmerica
EasternEurope
WesternEurope
Asia Pacific Africa
0 pts
1 - 3 pts
4 - 9 pts
10+ pts
Enrollment performance by region for 2008
Site Performance
Chart1
0 pts
1 - 3 pts
4 - 9 pts
10+ pts
021
026
03
023
029
029
024
018
015
031
026
027
015
022
029
034
019
03
034
018
004
017
028
051
HIV
HIV
Resiratory amp Cancer
Male prevalence
Female prevalence
CVS
Overall death rates
Overall death rates
COPD
Asthma
Tracheabronchial lung cancer
Oesophageal cancer
prostate cancer
Trial metrics
COPD
Asthma
Tracheabronchial lung cancer
Oesophageal cancer
Prostate cancer
Cervical cancer
Breast cancer
Stroke
ill-defined heart disease
Diabetes mellitus
Ischaemic heart disease
Hypertension
Nephritisnephrosis
Stroke
ill-defined heart disease
Diabetes mellitus
Ischaemic heart disease
Hypertension
Nephritisnephrosis
Males
Female
UN - Male
SA 1997
SA 2004
UN - Female
SA 1997
SA 2004
0 pts
1 - 3 pts
4 - 9 pts
10+ pts
42
Source wwwclinicaltrialsgov 22-Oct-2010
Clinical trials registered across Africa
43
0
500
1000
1500
2000
2500
South Africa Kenya Malawi Tanzania Uganda Zambia
Selected African countries
2005
2010
2015
Source ClinTrialsgov
Trend 2005 - 2015
Source wwwclinicaltrialsgov 28-Aug-2015
44
AFRICA FOUND IN TRANSLATION
bull Vast treatment-naiumlve population bull Cost advantages (still) bull Diverse ethnicity amp morbidity bull Inverse seasonality bull Site capacity-building widely implemented bull Robust regulatory review bull Variable but generally good regulatory timelines bull Established GCP culture ndash sites and home-bred CROs
45
THANK YOU
Foliennummer 1
Triclinium A South African CRO
Collaboration with VPM SII
Vaccine Trials in SA 2015
Foliennummer 5
Foliennummer 6
Foliennummer 7
Foliennummer 8
Foliennummer 9
Foliennummer 10
Foliennummer 11
Foliennummer 12
Foliennummer 13
Foliennummer 14
Foliennummer 15
Foliennummer 16
Foliennummer 17
Distribution of clinical trial sites
Foliennummer 19
South Africa Leading Causes of Death
Foliennummer 21
Foliennummer 22
South Africa TB deaths by age group
Foliennummer 24
Foliennummer 25
Foliennummer 26
Foliennummer 27
Foliennummer 28
Foliennummer 29
Foliennummer 30
Foliennummer 31
SA Clinical Trial Regulatory Processes
Clinical Trial Density Active sites million population
Foliennummer 34
Why Africa
Foliennummer 36
AFRICA hellip the true size
SSV to SIV
Foliennummer 39
Foliennummer 40
Foliennummer 41
Foliennummer 42
Foliennummer 43
AFRICA FOUND IN TRANSLATION
Foliennummer 45
Region
Median
of Sites
Patients Site
0 pts
1 - 3 pts
4 - 9 pts
10+ pts
Latin America
4
21
26
30
23
North America
3
29
29
24
18
Eastern Europe
6
15
31
26
27
Western Europe
4
15
22
29
34
Asia Pacific
4
19
30
34
18
Africa
10
4
17
28
51
0 pts
1 - 3 pts
4 - 9 pts
10+ pts
Latin America
21
26
30
23
North America
29
29
24
18
Eastern Europe
15
31
26
27
Western Europe
15
22
29
34
Asia Pacific
19
30
34
18
Africa
4
17
28
51
Males
Female
15-19
210
150
20-24
340
205
25-29
395
300
30-34
460
360
35-39
600
405
40-44
800
500
45-49
1100
700
50-54
1600
1050
55-54
2300
1580
60-64
3340
2250
UN - Male
SA 1997
SA 2004
UN - Female
SA 1997
SA 2004
15-19
210
235
216
150
165
187
20-24
340
381
555
205
331
1085
25-29
395
625
1081
300
452
1985
30-34
460
817
2118
360
489
2267
35-39
600
916
2498
405
526
1890
40-44
800
1136
2765
500
615
1548
45-49
1100
1486
2744
700
800
1400
50-54
1600
2016
2979
1050
1116
1506
55-54
2300
2838
3270
1580
1626
1717
60-64
3340
3614
4146
2250
2201
2360
Stroke
ill-defined heart disease
Diabetes mellitus
Ischaemic heart disease
Hypertension
Nephritisnephrosis
Stroke
ill-defined heart disease
Diabetes mellitus
Ischaemic heart disease
Hypertension
Nephritisnephrosis
1999
34
345
20
248
14
10
1999
295
246
23
10
145
68
2000
36
362
218
249
152
112
2000
318
268
241
108
16
8
2001
35
372
22
25
15
125
2001
322
28
252
102
162
95
2002
405
298
24
26
147
126
2002
352
295
27
115
16
10
2003
425
32
245
285
152
15
2003
382
299
285
122
17
12
2004
39
325
255
26
165
16
2004
35
30
295
121
19
119
2005
36
328
265
26
15
162
2005
325
30
32
12
18
12
2006
35
336
27
258
155
16
2006
33
32
32
11
18
125
COPD
Asthma
Tracheabronchial lung cancer
Oesophageal cancer
prostate cancer
Cervical cancer
Breast cancer
1999
2001
12
135
10
26
2000
204
116
13
92
28
2001
222
131
133
96
27
2002
23
144
128
95
285
2003
243
149
124
94
29
2004
229
154
1255
87
29
2005
224
152
122
82
295
2006
224
136
116
75
3
COPD
Asthma
Tracheabronchial lung cancer
Oesophageal cancer
Prostate cancer
Cervical cancer
Breast cancer
1999
88
92
43
41
106
82
2000
96
95
4
43
11
81
2001
10
109
4
4
111
89
2002
10
116
4
4
112
85
2003
11
124
4
395
116
85
2004
102
1295
44
39
115
101
2005
105
128
42
38
1185
10
2006
10
12
42
32
1205
10
Based on this survey the researchers estimate that 109 of all South Africans over 2 years old were living with HIV in 2008 In 2002 and 2005 this figure was 114 and 108 respectively showing a degree of stabilisation Among those between 15 and 49 years old the estimated HIV prevalence was 169 in 2008 The survey found the prevalence among children aged 2-14 to be 25 down significantly since 2002 when prevalence was 56
Estimated HIV prevalence () among South Africans aged 2 years and older by age 2002-2008
Age
HIV +
HIV -
Children (2-14 years)
25
975
Youth (15-24 years)
87
913
Adults (25 and older)
168
832
(15-49 years)
169
831
Total (2 and older)
109
891
Estimated HIV prevalence among South Africans by age and sex 2008
Age
Male prevalence
Female prevalence
2-14
3
2
15-19
25
67
20-24
51
211
25-29
157
327
30-34
258
291
35-39
185
248
40-44
192
163
45-49
64
141
50-54
104
102
55-59
62
77
60+
35
18
Total
79
136
Among females HIV prevalence is highest in those between 25 and 29 years old among males the peak is in the group aged 30-34 years
HIV prevalence () by province 2002-2008
Province
2002
2005
2008
KwaZulu-Natal
117
165
158
Mpumalanga
141
152
154
Free State
149
126
126
North West
103
109
113
Gauteng
147
108
103
Eastern Cape
66
89
9
Limpopo
98
8
88
Northern Cape
84
54
59
Western Cape
107
19
38
National
114
108
109
The results of this study suggest that KwaZulu-Natal Mpumulanga and Free State have the highest HIV prevalence However the relatively small sample sizes may limit precision and in several cases the ranges of uncertainty overlap
HIV prevalence by population group 2008
Population group
Prevalence ()
African
136
864
White
03
997
Coloured
17
983
Indian
03
997
Studies of AIDS deaths
Latin America
Latin America
Latin America
Latin America
North America
North America
North America
North America
Eastern Europe
Eastern Europe
Eastern Europe
Eastern Europe
Western Europe
Western Europe
Western Europe
Western Europe
Asia Pacific
Asia Pacific
Asia Pacific
Asia Pacific
Africa
Africa
Africa
Africa
Country
Study starts
Subjects randomised
SubjectsStudy
USA
32
4385
13703125
Russia
20
788
394
Germany
19
1883
991052631579
UK
13
265
203846153846
South Africa
12
347
289166666667
Argentina
12
329
274166666667
Australia
11
195
177272727273
India
7
275
392857142857
Brazil
3
115
383333333333
Country
Initiation
Site activation
Recruitment
LOC setup
Unproductive sites
(Approval ndash FCI)
(FCI ndash FSFV)
(FSFV ndash LSFV)
(CPC ndash FSFV)
South Africa
19
38
153
357
21
Australia
117
63
401
239
11
Germany
16
37
401
224
21
UK
9
101
301
346
20
Russia
11
52
174
334
9
India
31
28
389
431
3
Argentina
94
67
288
32
13
Brazil
79
59
94
656
20
USA
44
31
149
26
Country
Pts Rand
Sites
Av CPP
Cost Per Country
Ethics Subm
Regulatory Fees
Add Inv Fees
CT Scan Total
Ethics + Regulatory
Total Regulatory Fees
South Africa
25
5
7250
181250
290
460
363
0
750
1113
Canada
18
4
832545
14985818
181818
0
0
1557576
181818
1818
Italy
7
2
10000
70000
2200
0
0
0
2200
2200
Germany
55
10
7000
385000
3000
0
0
12000
3000
3000
Peru
40
5
7000
280000
1500
1000
2000
60000
2500
4500
Poland
15
4
10000
150000
0
2500
2400
0
2500
4900
Spain
40
7
10500
420000
0
0
5450
0
0
5450
UK
12
4
13000
156000
0
0
5556
0
0
5556
Bulgaria
18
4
10000
180000
0
5000
1000
0
5000
6000
Taiwan
20
4
1179649
2359298
104167
313
5208
0
135467
6563
Czech Rep
10
2
10000
100000
1500
3000
3000
0
4500
7500
Greece
40
7
9000
360000
0
7500
0
0
7500
7500
Chile
15
4
10840
162600
1700
3600
3000
0
5300
8300
Belgium
25
6
12200
305000
3992
4332
0
0
8324
8324
Korea
30
3
10827
324802
1114
0
14324
0
1114
15438
Singapore
10
2
11565
115650
1750
0
17975
0
1750
19725
France
50
10
9000
450000
0
0
20000
0
0
20000
China
39
5
4978
194142
5224
0
39814
0
5224
40336
New Zealand
10
3
145244
145244
1973
0
43123
0
1973
45096
Israel
10
6
11140
111400
2060
3000
48400
16500
5060
53460
Brazil
30
6
10000
300000
2000
287356
5649202
0
487356
61366
Australia
24
6
40200
964800
0
500
82500
0
500
83000
23
543
109
532856799
3304716
26939
27700043
73748966
[1753EURO x 14 (ex rate) = $2454] [ $245416 hours=$153hour]
1095625
1095625
12271
1753
198089
198089
208514736842
South Africa
Canada
Italy
Germany
Peru
Poland
Spain
UK
Bulgaria
Taiwan
Czech Rep
Greece
Chile
Belgium
Korea
Singapore
France
China
New Zealand
Israel
Brazil
Australia
Country
Study starts
Subjects randomised
SubjectsStudy
USA
32
4385
13703125
Russia
20
788
394
Germany
19
1883
991052631579
UK
13
265
203846153846
South Africa
12
347
289166666667
Argentina
12
329
274166666667
Australia
11
195
177272727273
India
7
275
392857142857
Brazil
3
115
383333333333
Country
Initiation
Site activation
Recruitment
LOC setup
Unproductive sites
(Approval ndash FCI)
(FCI ndash FSFV)
(FSFV ndash LSFV)
(CPC ndash FSFV)
South Africa
19
38
153
357
21
Australia
117
63
401
239
11
Germany
16
37
401
224
21
UK
9
101
301
346
20
Russia
11
52
174
334
9
India
31
28
389
431
3
Argentina
94
67
288
32
13
Brazil
79
59
94
656
20
USA
44
31
149
26
Sheet3
Ethics + Regulatory
Total Ethics and Regulatory Fees
Add Inv Fees
Additional Investigator Application Fees
Total Regulatory Fees
Study starts
SubjectsStudy
31
Euro
0
10000
20000
30000
40000
50000
60000
70000
80000
90000S
outh
Afri
caC
anad
a
Italy
Ger
man
yP
eru
Pol
and
Spa
in UK
Bul
garia
Taiw
anC
zech
Rep
Gre
ece
Chi
leB
elgi
umK
orea
Sin
gapo
reFr
ance
Chi
naN
ew Z
eala
ndIs
rael
Bra
zil
Aus
tralia
Source Bayer Presented SACRA Conference 2009
Eur
os
Regulatory Application Fees
Chart1
Total Regulatory Fees
1113
181818
2200
3000
4500
4900
5450
5556
6000
656267
7500
7500
8300
8324
15438
19725
20000
403364
45096
53460
6136558
83000
Sheet1
Sheet2
Sheet2
Average Cost Per Patient (Euro)
Average Cost Per Patient
Sheet4
Ethics Subm
Regulatory Fees
Sheet3
Ethics + Regulatory
Total Ethics and Regulatory Fees
Add Inv Fees
Additional Investigator Application Fees
Total Regulatory Fees
Study starts
SubjectsStudy
32
SA Clinical Trial Regulatory Processes
Governed by SA-GCP and Declaration of Helsinki SA National Clinical Trials Register (SANCTR) Medicines Control Council (National Regulatory Authority)
o New protocols o Amendments o Additional sitesinvestigators
Ethics Committees (33 NHREC-registered) RegionalMunicipal DoH Export permits for bio samples (Nat Health Act 2003)
Clinical Trial Density Active sites million population
Nature Reviews Drug Discovery 7 13-14 (January 2008)
France 503
Germany 512 Canada
922
USA 1203
Czech Republic 776
553 sites
South Africa 119
757 sites
757 sites
533 sites
1084 sites
Argentina 269
Russia 77
China 04
India 07
34
Gateway to Africa
35
Why Africa bull Large accessible population relatively new to clinical trials
bull Experienced and willing investigators
bull Many clinical trial sites established by PDPs NGOs etc
bull Expanding therapeutic areas shifting burden of disease from
infectious to non-communicable diseases
bull Significantly improved infrastructure and accessibility
bull Rapidly evolving regulatory and ethics procedures
bull Potential for capacity building and sustainable clinical trial potential
36
Relatively young GCP culture Resident mentorships to build capacity Locations ndash accessibility for site monitoring Variable infrastructure esp electricity connectivity and
transportation Resourcing of public healthcare systems
Sub-Saharan Africa challenges
37
bull Second-largest continent
bull Spans NS and EW hemispheres
bull Second most populous continent 2014 estimate 1069 billion
bull Home to more than a quarter of the 196 independent countries
bull All 54 African countries are UN members
bull 39 urban population
bull 12 metropolitan areas gt 4m
bull gt 3000 distinct ethnicities
bull gt 2000 languages spoken
AFRICA hellip the true size
wwwcitypopulationdeworldAgglomerations 2015
38
SSV to SIV
0
5
10
15
20
25
30
35
40
45
Africa North America
Asia Pacific
Western Europe
Eastern Europe
Latin America
Source Quintiles South Africa SACRA Conference 2008
Wee
ks (A
vera
ge)
Start-Up Timelines
39
Region Median
Patients Site
of Sites
0 pts 1 - 3 pts 4 - 9 pts 10+ pts
Latin America 40 21 26 30 23
North America 30 29 29 24 18
Eastern Europe 60 15 31 26 27
Western Europe 40 15 22 29 34
Asia Pacific 40 19 30 34 18
Africa 100 4 17 28 51
Enrollment performance by region for 2008
Site Performance
Source Quintiles South Africa Presented SACRA Conference 2009
40
0 1 2 3 4 5 6 7 8 9
10
Latin America
North America
Eastern Europe
Western Europe
Asia Pacific
Africa
Num
ber o
f par
ticip
ants
MEDIAN site enrollment by region for 2008
Source Quintiles South Africa Presented SACRA Conference 2009
Site Performance
41
Source Quintiles South Africa Presented SACRA Conference 2009
s
ites
0
5
10
15
20
25
30
35
40
45
50
LatinAmerica
NorthAmerica
EasternEurope
WesternEurope
Asia Pacific Africa
0 pts
1 - 3 pts
4 - 9 pts
10+ pts
Enrollment performance by region for 2008
Site Performance
Chart1
0 pts
1 - 3 pts
4 - 9 pts
10+ pts
021
026
03
023
029
029
024
018
015
031
026
027
015
022
029
034
019
03
034
018
004
017
028
051
HIV
HIV
Resiratory amp Cancer
Male prevalence
Female prevalence
CVS
Overall death rates
Overall death rates
COPD
Asthma
Tracheabronchial lung cancer
Oesophageal cancer
prostate cancer
Trial metrics
COPD
Asthma
Tracheabronchial lung cancer
Oesophageal cancer
Prostate cancer
Cervical cancer
Breast cancer
Stroke
ill-defined heart disease
Diabetes mellitus
Ischaemic heart disease
Hypertension
Nephritisnephrosis
Stroke
ill-defined heart disease
Diabetes mellitus
Ischaemic heart disease
Hypertension
Nephritisnephrosis
Males
Female
UN - Male
SA 1997
SA 2004
UN - Female
SA 1997
SA 2004
0 pts
1 - 3 pts
4 - 9 pts
10+ pts
42
Source wwwclinicaltrialsgov 22-Oct-2010
Clinical trials registered across Africa
43
0
500
1000
1500
2000
2500
South Africa Kenya Malawi Tanzania Uganda Zambia
Selected African countries
2005
2010
2015
Source ClinTrialsgov
Trend 2005 - 2015
Source wwwclinicaltrialsgov 28-Aug-2015
44
AFRICA FOUND IN TRANSLATION
bull Vast treatment-naiumlve population bull Cost advantages (still) bull Diverse ethnicity amp morbidity bull Inverse seasonality bull Site capacity-building widely implemented bull Robust regulatory review bull Variable but generally good regulatory timelines bull Established GCP culture ndash sites and home-bred CROs
45
THANK YOU
Foliennummer 1
Triclinium A South African CRO
Collaboration with VPM SII
Vaccine Trials in SA 2015
Foliennummer 5
Foliennummer 6
Foliennummer 7
Foliennummer 8
Foliennummer 9
Foliennummer 10
Foliennummer 11
Foliennummer 12
Foliennummer 13
Foliennummer 14
Foliennummer 15
Foliennummer 16
Foliennummer 17
Distribution of clinical trial sites
Foliennummer 19
South Africa Leading Causes of Death
Foliennummer 21
Foliennummer 22
South Africa TB deaths by age group
Foliennummer 24
Foliennummer 25
Foliennummer 26
Foliennummer 27
Foliennummer 28
Foliennummer 29
Foliennummer 30
Foliennummer 31
SA Clinical Trial Regulatory Processes
Clinical Trial Density Active sites million population
Foliennummer 34
Why Africa
Foliennummer 36
AFRICA hellip the true size
SSV to SIV
Foliennummer 39
Foliennummer 40
Foliennummer 41
Foliennummer 42
Foliennummer 43
AFRICA FOUND IN TRANSLATION
Foliennummer 45
Region
Median
of Sites
Patients Site
0 pts
1 - 3 pts
4 - 9 pts
10+ pts
Latin America
4
21
26
30
23
North America
3
29
29
24
18
Eastern Europe
6
15
31
26
27
Western Europe
4
15
22
29
34
Asia Pacific
4
19
30
34
18
Africa
10
4
17
28
51
0 pts
1 - 3 pts
4 - 9 pts
10+ pts
Latin America
21
26
30
23
North America
29
29
24
18
Eastern Europe
15
31
26
27
Western Europe
15
22
29
34
Asia Pacific
19
30
34
18
Africa
4
17
28
51
Males
Female
15-19
210
150
20-24
340
205
25-29
395
300
30-34
460
360
35-39
600
405
40-44
800
500
45-49
1100
700
50-54
1600
1050
55-54
2300
1580
60-64
3340
2250
UN - Male
SA 1997
SA 2004
UN - Female
SA 1997
SA 2004
15-19
210
235
216
150
165
187
20-24
340
381
555
205
331
1085
25-29
395
625
1081
300
452
1985
30-34
460
817
2118
360
489
2267
35-39
600
916
2498
405
526
1890
40-44
800
1136
2765
500
615
1548
45-49
1100
1486
2744
700
800
1400
50-54
1600
2016
2979
1050
1116
1506
55-54
2300
2838
3270
1580
1626
1717
60-64
3340
3614
4146
2250
2201
2360
Stroke
ill-defined heart disease
Diabetes mellitus
Ischaemic heart disease
Hypertension
Nephritisnephrosis
Stroke
ill-defined heart disease
Diabetes mellitus
Ischaemic heart disease
Hypertension
Nephritisnephrosis
1999
34
345
20
248
14
10
1999
295
246
23
10
145
68
2000
36
362
218
249
152
112
2000
318
268
241
108
16
8
2001
35
372
22
25
15
125
2001
322
28
252
102
162
95
2002
405
298
24
26
147
126
2002
352
295
27
115
16
10
2003
425
32
245
285
152
15
2003
382
299
285
122
17
12
2004
39
325
255
26
165
16
2004
35
30
295
121
19
119
2005
36
328
265
26
15
162
2005
325
30
32
12
18
12
2006
35
336
27
258
155
16
2006
33
32
32
11
18
125
COPD
Asthma
Tracheabronchial lung cancer
Oesophageal cancer
prostate cancer
Cervical cancer
Breast cancer
1999
2001
12
135
10
26
2000
204
116
13
92
28
2001
222
131
133
96
27
2002
23
144
128
95
285
2003
243
149
124
94
29
2004
229
154
1255
87
29
2005
224
152
122
82
295
2006
224
136
116
75
3
COPD
Asthma
Tracheabronchial lung cancer
Oesophageal cancer
Prostate cancer
Cervical cancer
Breast cancer
1999
88
92
43
41
106
82
2000
96
95
4
43
11
81
2001
10
109
4
4
111
89
2002
10
116
4
4
112
85
2003
11
124
4
395
116
85
2004
102
1295
44
39
115
101
2005
105
128
42
38
1185
10
2006
10
12
42
32
1205
10
Based on this survey the researchers estimate that 109 of all South Africans over 2 years old were living with HIV in 2008 In 2002 and 2005 this figure was 114 and 108 respectively showing a degree of stabilisation Among those between 15 and 49 years old the estimated HIV prevalence was 169 in 2008 The survey found the prevalence among children aged 2-14 to be 25 down significantly since 2002 when prevalence was 56
Estimated HIV prevalence () among South Africans aged 2 years and older by age 2002-2008
Age
HIV +
HIV -
Children (2-14 years)
25
975
Youth (15-24 years)
87
913
Adults (25 and older)
168
832
(15-49 years)
169
831
Total (2 and older)
109
891
Estimated HIV prevalence among South Africans by age and sex 2008
Age
Male prevalence
Female prevalence
2-14
3
2
15-19
25
67
20-24
51
211
25-29
157
327
30-34
258
291
35-39
185
248
40-44
192
163
45-49
64
141
50-54
104
102
55-59
62
77
60+
35
18
Total
79
136
Among females HIV prevalence is highest in those between 25 and 29 years old among males the peak is in the group aged 30-34 years
HIV prevalence () by province 2002-2008
Province
2002
2005
2008
KwaZulu-Natal
117
165
158
Mpumalanga
141
152
154
Free State
149
126
126
North West
103
109
113
Gauteng
147
108
103
Eastern Cape
66
89
9
Limpopo
98
8
88
Northern Cape
84
54
59
Western Cape
107
19
38
National
114
108
109
The results of this study suggest that KwaZulu-Natal Mpumulanga and Free State have the highest HIV prevalence However the relatively small sample sizes may limit precision and in several cases the ranges of uncertainty overlap
HIV prevalence by population group 2008
Population group
Prevalence ()
African
136
864
White
03
997
Coloured
17
983
Indian
03
997
Studies of AIDS deaths
Latin America
Latin America
Latin America
Latin America
North America
North America
North America
North America
Eastern Europe
Eastern Europe
Eastern Europe
Eastern Europe
Western Europe
Western Europe
Western Europe
Western Europe
Asia Pacific
Asia Pacific
Asia Pacific
Asia Pacific
Africa
Africa
Africa
Africa
Country
Study starts
Subjects randomised
SubjectsStudy
USA
32
4385
13703125
Russia
20
788
394
Germany
19
1883
991052631579
UK
13
265
203846153846
South Africa
12
347
289166666667
Argentina
12
329
274166666667
Australia
11
195
177272727273
India
7
275
392857142857
Brazil
3
115
383333333333
Country
Initiation
Site activation
Recruitment
LOC setup
Unproductive sites
(Approval ndash FCI)
(FCI ndash FSFV)
(FSFV ndash LSFV)
(CPC ndash FSFV)
South Africa
19
38
153
357
21
Australia
117
63
401
239
11
Germany
16
37
401
224
21
UK
9
101
301
346
20
Russia
11
52
174
334
9
India
31
28
389
431
3
Argentina
94
67
288
32
13
Brazil
79
59
94
656
20
USA
44
31
149
26
Country
Pts Rand
Sites
Av CPP
Cost Per Country
Ethics Subm
Regulatory Fees
Add Inv Fees
CT Scan Total
Ethics + Regulatory
Total Regulatory Fees
South Africa
25
5
7250
181250
290
460
363
0
750
1113
Canada
18
4
832545
14985818
181818
0
0
1557576
181818
1818
Italy
7
2
10000
70000
2200
0
0
0
2200
2200
Germany
55
10
7000
385000
3000
0
0
12000
3000
3000
Peru
40
5
7000
280000
1500
1000
2000
60000
2500
4500
Poland
15
4
10000
150000
0
2500
2400
0
2500
4900
Spain
40
7
10500
420000
0
0
5450
0
0
5450
UK
12
4
13000
156000
0
0
5556
0
0
5556
Bulgaria
18
4
10000
180000
0
5000
1000
0
5000
6000
Taiwan
20
4
1179649
2359298
104167
313
5208
0
135467
6563
Czech Rep
10
2
10000
100000
1500
3000
3000
0
4500
7500
Greece
40
7
9000
360000
0
7500
0
0
7500
7500
Chile
15
4
10840
162600
1700
3600
3000
0
5300
8300
Belgium
25
6
12200
305000
3992
4332
0
0
8324
8324
Korea
30
3
10827
324802
1114
0
14324
0
1114
15438
Singapore
10
2
11565
115650
1750
0
17975
0
1750
19725
France
50
10
9000
450000
0
0
20000
0
0
20000
China
39
5
4978
194142
5224
0
39814
0
5224
40336
New Zealand
10
3
145244
145244
1973
0
43123
0
1973
45096
Israel
10
6
11140
111400
2060
3000
48400
16500
5060
53460
Brazil
30
6
10000
300000
2000
287356
5649202
0
487356
61366
Australia
24
6
40200
964800
0
500
82500
0
500
83000
23
543
109
532856799
3304716
26939
27700043
73748966
[1753EURO x 14 (ex rate) = $2454] [ $245416 hours=$153hour]
1095625
1095625
12271
1753
198089
198089
208514736842
South Africa
Canada
Italy
Germany
Peru
Poland
Spain
UK
Bulgaria
Taiwan
Czech Rep
Greece
Chile
Belgium
Korea
Singapore
France
China
New Zealand
Israel
Brazil
Australia
Country
Study starts
Subjects randomised
SubjectsStudy
USA
32
4385
13703125
Russia
20
788
394
Germany
19
1883
991052631579
UK
13
265
203846153846
South Africa
12
347
289166666667
Argentina
12
329
274166666667
Australia
11
195
177272727273
India
7
275
392857142857
Brazil
3
115
383333333333
Country
Initiation
Site activation
Recruitment
LOC setup
Unproductive sites
(Approval ndash FCI)
(FCI ndash FSFV)
(FSFV ndash LSFV)
(CPC ndash FSFV)
South Africa
19
38
153
357
21
Australia
117
63
401
239
11
Germany
16
37
401
224
21
UK
9
101
301
346
20
Russia
11
52
174
334
9
India
31
28
389
431
3
Argentina
94
67
288
32
13
Brazil
79
59
94
656
20
USA
44
31
149
26
Add Inv Fees
Additional Investigator Application Fees
Total Regulatory Fees
Study starts
SubjectsStudy
31
Euro
0
10000
20000
30000
40000
50000
60000
70000
80000
90000S
outh
Afri
caC
anad
a
Italy
Ger
man
yP
eru
Pol
and
Spa
in UK
Bul
garia
Taiw
anC
zech
Rep
Gre
ece
Chi
leB
elgi
umK
orea
Sin
gapo
reFr
ance
Chi
naN
ew Z
eala
ndIs
rael
Bra
zil
Aus
tralia
Source Bayer Presented SACRA Conference 2009
Eur
os
Regulatory Application Fees
Chart1
Total Regulatory Fees
1113
181818
2200
3000
4500
4900
5450
5556
6000
656267
7500
7500
8300
8324
15438
19725
20000
403364
45096
53460
6136558
83000
Sheet1
Sheet2
Sheet2
Average Cost Per Patient (Euro)
Average Cost Per Patient
Sheet4
Ethics Subm
Regulatory Fees
Sheet3
Ethics + Regulatory
Total Ethics and Regulatory Fees
Add Inv Fees
Additional Investigator Application Fees
Total Regulatory Fees
Study starts
SubjectsStudy
32
SA Clinical Trial Regulatory Processes
Governed by SA-GCP and Declaration of Helsinki SA National Clinical Trials Register (SANCTR) Medicines Control Council (National Regulatory Authority)
o New protocols o Amendments o Additional sitesinvestigators
Ethics Committees (33 NHREC-registered) RegionalMunicipal DoH Export permits for bio samples (Nat Health Act 2003)
Clinical Trial Density Active sites million population
Nature Reviews Drug Discovery 7 13-14 (January 2008)
France 503
Germany 512 Canada
922
USA 1203
Czech Republic 776
553 sites
South Africa 119
757 sites
757 sites
533 sites
1084 sites
Argentina 269
Russia 77
China 04
India 07
34
Gateway to Africa
35
Why Africa bull Large accessible population relatively new to clinical trials
bull Experienced and willing investigators
bull Many clinical trial sites established by PDPs NGOs etc
bull Expanding therapeutic areas shifting burden of disease from
infectious to non-communicable diseases
bull Significantly improved infrastructure and accessibility
bull Rapidly evolving regulatory and ethics procedures
bull Potential for capacity building and sustainable clinical trial potential
36
Relatively young GCP culture Resident mentorships to build capacity Locations ndash accessibility for site monitoring Variable infrastructure esp electricity connectivity and
transportation Resourcing of public healthcare systems
Sub-Saharan Africa challenges
37
bull Second-largest continent
bull Spans NS and EW hemispheres
bull Second most populous continent 2014 estimate 1069 billion
bull Home to more than a quarter of the 196 independent countries
bull All 54 African countries are UN members
bull 39 urban population
bull 12 metropolitan areas gt 4m
bull gt 3000 distinct ethnicities
bull gt 2000 languages spoken
AFRICA hellip the true size
wwwcitypopulationdeworldAgglomerations 2015
38
SSV to SIV
0
5
10
15
20
25
30
35
40
45
Africa North America
Asia Pacific
Western Europe
Eastern Europe
Latin America
Source Quintiles South Africa SACRA Conference 2008
Wee
ks (A
vera
ge)
Start-Up Timelines
39
Region Median
Patients Site
of Sites
0 pts 1 - 3 pts 4 - 9 pts 10+ pts
Latin America 40 21 26 30 23
North America 30 29 29 24 18
Eastern Europe 60 15 31 26 27
Western Europe 40 15 22 29 34
Asia Pacific 40 19 30 34 18
Africa 100 4 17 28 51
Enrollment performance by region for 2008
Site Performance
Source Quintiles South Africa Presented SACRA Conference 2009
40
0 1 2 3 4 5 6 7 8 9
10
Latin America
North America
Eastern Europe
Western Europe
Asia Pacific
Africa
Num
ber o
f par
ticip
ants
MEDIAN site enrollment by region for 2008
Source Quintiles South Africa Presented SACRA Conference 2009
Site Performance
41
Source Quintiles South Africa Presented SACRA Conference 2009
s
ites
0
5
10
15
20
25
30
35
40
45
50
LatinAmerica
NorthAmerica
EasternEurope
WesternEurope
Asia Pacific Africa
0 pts
1 - 3 pts
4 - 9 pts
10+ pts
Enrollment performance by region for 2008
Site Performance
Chart1
0 pts
1 - 3 pts
4 - 9 pts
10+ pts
021
026
03
023
029
029
024
018
015
031
026
027
015
022
029
034
019
03
034
018
004
017
028
051
HIV
HIV
Resiratory amp Cancer
Male prevalence
Female prevalence
CVS
Overall death rates
Overall death rates
COPD
Asthma
Tracheabronchial lung cancer
Oesophageal cancer
prostate cancer
Trial metrics
COPD
Asthma
Tracheabronchial lung cancer
Oesophageal cancer
Prostate cancer
Cervical cancer
Breast cancer
Stroke
ill-defined heart disease
Diabetes mellitus
Ischaemic heart disease
Hypertension
Nephritisnephrosis
Stroke
ill-defined heart disease
Diabetes mellitus
Ischaemic heart disease
Hypertension
Nephritisnephrosis
Males
Female
UN - Male
SA 1997
SA 2004
UN - Female
SA 1997
SA 2004
0 pts
1 - 3 pts
4 - 9 pts
10+ pts
42
Source wwwclinicaltrialsgov 22-Oct-2010
Clinical trials registered across Africa
43
0
500
1000
1500
2000
2500
South Africa Kenya Malawi Tanzania Uganda Zambia
Selected African countries
2005
2010
2015
Source ClinTrialsgov
Trend 2005 - 2015
Source wwwclinicaltrialsgov 28-Aug-2015
44
AFRICA FOUND IN TRANSLATION
bull Vast treatment-naiumlve population bull Cost advantages (still) bull Diverse ethnicity amp morbidity bull Inverse seasonality bull Site capacity-building widely implemented bull Robust regulatory review bull Variable but generally good regulatory timelines bull Established GCP culture ndash sites and home-bred CROs
45
THANK YOU
Foliennummer 1
Triclinium A South African CRO
Collaboration with VPM SII
Vaccine Trials in SA 2015
Foliennummer 5
Foliennummer 6
Foliennummer 7
Foliennummer 8
Foliennummer 9
Foliennummer 10
Foliennummer 11
Foliennummer 12
Foliennummer 13
Foliennummer 14
Foliennummer 15
Foliennummer 16
Foliennummer 17
Distribution of clinical trial sites
Foliennummer 19
South Africa Leading Causes of Death
Foliennummer 21
Foliennummer 22
South Africa TB deaths by age group
Foliennummer 24
Foliennummer 25
Foliennummer 26
Foliennummer 27
Foliennummer 28
Foliennummer 29
Foliennummer 30
Foliennummer 31
SA Clinical Trial Regulatory Processes
Clinical Trial Density Active sites million population
Foliennummer 34
Why Africa
Foliennummer 36
AFRICA hellip the true size
SSV to SIV
Foliennummer 39
Foliennummer 40
Foliennummer 41
Foliennummer 42
Foliennummer 43
AFRICA FOUND IN TRANSLATION
Foliennummer 45
Region
Median
of Sites
Patients Site
0 pts
1 - 3 pts
4 - 9 pts
10+ pts
Latin America
4
21
26
30
23
North America
3
29
29
24
18
Eastern Europe
6
15
31
26
27
Western Europe
4
15
22
29
34
Asia Pacific
4
19
30
34
18
Africa
10
4
17
28
51
0 pts
1 - 3 pts
4 - 9 pts
10+ pts
Latin America
21
26
30
23
North America
29
29
24
18
Eastern Europe
15
31
26
27
Western Europe
15
22
29
34
Asia Pacific
19
30
34
18
Africa
4
17
28
51
Males
Female
15-19
210
150
20-24
340
205
25-29
395
300
30-34
460
360
35-39
600
405
40-44
800
500
45-49
1100
700
50-54
1600
1050
55-54
2300
1580
60-64
3340
2250
UN - Male
SA 1997
SA 2004
UN - Female
SA 1997
SA 2004
15-19
210
235
216
150
165
187
20-24
340
381
555
205
331
1085
25-29
395
625
1081
300
452
1985
30-34
460
817
2118
360
489
2267
35-39
600
916
2498
405
526
1890
40-44
800
1136
2765
500
615
1548
45-49
1100
1486
2744
700
800
1400
50-54
1600
2016
2979
1050
1116
1506
55-54
2300
2838
3270
1580
1626
1717
60-64
3340
3614
4146
2250
2201
2360
Stroke
ill-defined heart disease
Diabetes mellitus
Ischaemic heart disease
Hypertension
Nephritisnephrosis
Stroke
ill-defined heart disease
Diabetes mellitus
Ischaemic heart disease
Hypertension
Nephritisnephrosis
1999
34
345
20
248
14
10
1999
295
246
23
10
145
68
2000
36
362
218
249
152
112
2000
318
268
241
108
16
8
2001
35
372
22
25
15
125
2001
322
28
252
102
162
95
2002
405
298
24
26
147
126
2002
352
295
27
115
16
10
2003
425
32
245
285
152
15
2003
382
299
285
122
17
12
2004
39
325
255
26
165
16
2004
35
30
295
121
19
119
2005
36
328
265
26
15
162
2005
325
30
32
12
18
12
2006
35
336
27
258
155
16
2006
33
32
32
11
18
125
COPD
Asthma
Tracheabronchial lung cancer
Oesophageal cancer
prostate cancer
Cervical cancer
Breast cancer
1999
2001
12
135
10
26
2000
204
116
13
92
28
2001
222
131
133
96
27
2002
23
144
128
95
285
2003
243
149
124
94
29
2004
229
154
1255
87
29
2005
224
152
122
82
295
2006
224
136
116
75
3
COPD
Asthma
Tracheabronchial lung cancer
Oesophageal cancer
Prostate cancer
Cervical cancer
Breast cancer
1999
88
92
43
41
106
82
2000
96
95
4
43
11
81
2001
10
109
4
4
111
89
2002
10
116
4
4
112
85
2003
11
124
4
395
116
85
2004
102
1295
44
39
115
101
2005
105
128
42
38
1185
10
2006
10
12
42
32
1205
10
Based on this survey the researchers estimate that 109 of all South Africans over 2 years old were living with HIV in 2008 In 2002 and 2005 this figure was 114 and 108 respectively showing a degree of stabilisation Among those between 15 and 49 years old the estimated HIV prevalence was 169 in 2008 The survey found the prevalence among children aged 2-14 to be 25 down significantly since 2002 when prevalence was 56
Estimated HIV prevalence () among South Africans aged 2 years and older by age 2002-2008
Age
HIV +
HIV -
Children (2-14 years)
25
975
Youth (15-24 years)
87
913
Adults (25 and older)
168
832
(15-49 years)
169
831
Total (2 and older)
109
891
Estimated HIV prevalence among South Africans by age and sex 2008
Age
Male prevalence
Female prevalence
2-14
3
2
15-19
25
67
20-24
51
211
25-29
157
327
30-34
258
291
35-39
185
248
40-44
192
163
45-49
64
141
50-54
104
102
55-59
62
77
60+
35
18
Total
79
136
Among females HIV prevalence is highest in those between 25 and 29 years old among males the peak is in the group aged 30-34 years
HIV prevalence () by province 2002-2008
Province
2002
2005
2008
KwaZulu-Natal
117
165
158
Mpumalanga
141
152
154
Free State
149
126
126
North West
103
109
113
Gauteng
147
108
103
Eastern Cape
66
89
9
Limpopo
98
8
88
Northern Cape
84
54
59
Western Cape
107
19
38
National
114
108
109
The results of this study suggest that KwaZulu-Natal Mpumulanga and Free State have the highest HIV prevalence However the relatively small sample sizes may limit precision and in several cases the ranges of uncertainty overlap
HIV prevalence by population group 2008
Population group
Prevalence ()
African
136
864
White
03
997
Coloured
17
983
Indian
03
997
Studies of AIDS deaths
Latin America
Latin America
Latin America
Latin America
North America
North America
North America
North America
Eastern Europe
Eastern Europe
Eastern Europe
Eastern Europe
Western Europe
Western Europe
Western Europe
Western Europe
Asia Pacific
Asia Pacific
Asia Pacific
Asia Pacific
Africa
Africa
Africa
Africa
Country
Study starts
Subjects randomised
SubjectsStudy
USA
32
4385
13703125
Russia
20
788
394
Germany
19
1883
991052631579
UK
13
265
203846153846
South Africa
12
347
289166666667
Argentina
12
329
274166666667
Australia
11
195
177272727273
India
7
275
392857142857
Brazil
3
115
383333333333
Country
Initiation
Site activation
Recruitment
LOC setup
Unproductive sites
(Approval ndash FCI)
(FCI ndash FSFV)
(FSFV ndash LSFV)
(CPC ndash FSFV)
South Africa
19
38
153
357
21
Australia
117
63
401
239
11
Germany
16
37
401
224
21
UK
9
101
301
346
20
Russia
11
52
174
334
9
India
31
28
389
431
3
Argentina
94
67
288
32
13
Brazil
79
59
94
656
20
USA
44
31
149
26
Country
Pts Rand
Sites
Av CPP
Cost Per Country
Ethics Subm
Regulatory Fees
Add Inv Fees
CT Scan Total
Ethics + Regulatory
Total Regulatory Fees
South Africa
25
5
7250
181250
290
460
363
0
750
1113
Canada
18
4
832545
14985818
181818
0
0
1557576
181818
1818
Italy
7
2
10000
70000
2200
0
0
0
2200
2200
Germany
55
10
7000
385000
3000
0
0
12000
3000
3000
Peru
40
5
7000
280000
1500
1000
2000
60000
2500
4500
Poland
15
4
10000
150000
0
2500
2400
0
2500
4900
Spain
40
7
10500
420000
0
0
5450
0
0
5450
UK
12
4
13000
156000
0
0
5556
0
0
5556
Bulgaria
18
4
10000
180000
0
5000
1000
0
5000
6000
Taiwan
20
4
1179649
2359298
104167
313
5208
0
135467
6563
Czech Rep
10
2
10000
100000
1500
3000
3000
0
4500
7500
Greece
40
7
9000
360000
0
7500
0
0
7500
7500
Chile
15
4
10840
162600
1700
3600
3000
0
5300
8300
Belgium
25
6
12200
305000
3992
4332
0
0
8324
8324
Korea
30
3
10827
324802
1114
0
14324
0
1114
15438
Singapore
10
2
11565
115650
1750
0
17975
0
1750
19725
France
50
10
9000
450000
0
0
20000
0
0
20000
China
39
5
4978
194142
5224
0
39814
0
5224
40336
New Zealand
10
3
145244
145244
1973
0
43123
0
1973
45096
Israel
10
6
11140
111400
2060
3000
48400
16500
5060
53460
Brazil
30
6
10000
300000
2000
287356
5649202
0
487356
61366
Australia
24
6
40200
964800
0
500
82500
0
500
83000
23
543
109
532856799
3304716
26939
27700043
73748966
[1753EURO x 14 (ex rate) = $2454] [ $245416 hours=$153hour]
1095625
1095625
12271
1753
198089
198089
208514736842
South Africa
Canada
Italy
Germany
Peru
Poland
Spain
UK
Bulgaria
Taiwan
Czech Rep
Greece
Chile
Belgium
Korea
Singapore
France
China
New Zealand
Israel
Brazil
Australia
Country
Study starts
Subjects randomised
SubjectsStudy
USA
32
4385
13703125
Russia
20
788
394
Germany
19
1883
991052631579
UK
13
265
203846153846
South Africa
12
347
289166666667
Argentina
12
329
274166666667
Australia
11
195
177272727273
India
7
275
392857142857
Brazil
3
115
383333333333
Country
Initiation
Site activation
Recruitment
LOC setup
Unproductive sites
(Approval ndash FCI)
(FCI ndash FSFV)
(FSFV ndash LSFV)
(CPC ndash FSFV)
South Africa
19
38
153
357
21
Australia
117
63
401
239
11
Germany
16
37
401
224
21
UK
9
101
301
346
20
Russia
11
52
174
334
9
India
31
28
389
431
3
Argentina
94
67
288
32
13
Brazil
79
59
94
656
20
USA
44
31
149
26
Total Regulatory Fees
Study starts
SubjectsStudy
31
Euro
0
10000
20000
30000
40000
50000
60000
70000
80000
90000S
outh
Afri
caC
anad
a
Italy
Ger
man
yP
eru
Pol
and
Spa
in UK
Bul
garia
Taiw
anC
zech
Rep
Gre
ece
Chi
leB
elgi
umK
orea
Sin
gapo
reFr
ance
Chi
naN
ew Z
eala
ndIs
rael
Bra
zil
Aus
tralia
Source Bayer Presented SACRA Conference 2009
Eur
os
Regulatory Application Fees
Chart1
Total Regulatory Fees
1113
181818
2200
3000
4500
4900
5450
5556
6000
656267
7500
7500
8300
8324
15438
19725
20000
403364
45096
53460
6136558
83000
Sheet1
Sheet2
Sheet2
Average Cost Per Patient (Euro)
Average Cost Per Patient
Sheet4
Ethics Subm
Regulatory Fees
Sheet3
Ethics + Regulatory
Total Ethics and Regulatory Fees
Add Inv Fees
Additional Investigator Application Fees
Total Regulatory Fees
Study starts
SubjectsStudy
32
SA Clinical Trial Regulatory Processes
Governed by SA-GCP and Declaration of Helsinki SA National Clinical Trials Register (SANCTR) Medicines Control Council (National Regulatory Authority)
o New protocols o Amendments o Additional sitesinvestigators
Ethics Committees (33 NHREC-registered) RegionalMunicipal DoH Export permits for bio samples (Nat Health Act 2003)
Clinical Trial Density Active sites million population
Nature Reviews Drug Discovery 7 13-14 (January 2008)
France 503
Germany 512 Canada
922
USA 1203
Czech Republic 776
553 sites
South Africa 119
757 sites
757 sites
533 sites
1084 sites
Argentina 269
Russia 77
China 04
India 07
34
Gateway to Africa
35
Why Africa bull Large accessible population relatively new to clinical trials
bull Experienced and willing investigators
bull Many clinical trial sites established by PDPs NGOs etc
bull Expanding therapeutic areas shifting burden of disease from
infectious to non-communicable diseases
bull Significantly improved infrastructure and accessibility
bull Rapidly evolving regulatory and ethics procedures
bull Potential for capacity building and sustainable clinical trial potential
36
Relatively young GCP culture Resident mentorships to build capacity Locations ndash accessibility for site monitoring Variable infrastructure esp electricity connectivity and
transportation Resourcing of public healthcare systems
Sub-Saharan Africa challenges
37
bull Second-largest continent
bull Spans NS and EW hemispheres
bull Second most populous continent 2014 estimate 1069 billion
bull Home to more than a quarter of the 196 independent countries
bull All 54 African countries are UN members
bull 39 urban population
bull 12 metropolitan areas gt 4m
bull gt 3000 distinct ethnicities
bull gt 2000 languages spoken
AFRICA hellip the true size
wwwcitypopulationdeworldAgglomerations 2015
38
SSV to SIV
0
5
10
15
20
25
30
35
40
45
Africa North America
Asia Pacific
Western Europe
Eastern Europe
Latin America
Source Quintiles South Africa SACRA Conference 2008
Wee
ks (A
vera
ge)
Start-Up Timelines
39
Region Median
Patients Site
of Sites
0 pts 1 - 3 pts 4 - 9 pts 10+ pts
Latin America 40 21 26 30 23
North America 30 29 29 24 18
Eastern Europe 60 15 31 26 27
Western Europe 40 15 22 29 34
Asia Pacific 40 19 30 34 18
Africa 100 4 17 28 51
Enrollment performance by region for 2008
Site Performance
Source Quintiles South Africa Presented SACRA Conference 2009
40
0 1 2 3 4 5 6 7 8 9
10
Latin America
North America
Eastern Europe
Western Europe
Asia Pacific
Africa
Num
ber o
f par
ticip
ants
MEDIAN site enrollment by region for 2008
Source Quintiles South Africa Presented SACRA Conference 2009
Site Performance
41
Source Quintiles South Africa Presented SACRA Conference 2009
s
ites
0
5
10
15
20
25
30
35
40
45
50
LatinAmerica
NorthAmerica
EasternEurope
WesternEurope
Asia Pacific Africa
0 pts
1 - 3 pts
4 - 9 pts
10+ pts
Enrollment performance by region for 2008
Site Performance
Chart1
0 pts
1 - 3 pts
4 - 9 pts
10+ pts
021
026
03
023
029
029
024
018
015
031
026
027
015
022
029
034
019
03
034
018
004
017
028
051
HIV
HIV
Resiratory amp Cancer
Male prevalence
Female prevalence
CVS
Overall death rates
Overall death rates
COPD
Asthma
Tracheabronchial lung cancer
Oesophageal cancer
prostate cancer
Trial metrics
COPD
Asthma
Tracheabronchial lung cancer
Oesophageal cancer
Prostate cancer
Cervical cancer
Breast cancer
Stroke
ill-defined heart disease
Diabetes mellitus
Ischaemic heart disease
Hypertension
Nephritisnephrosis
Stroke
ill-defined heart disease
Diabetes mellitus
Ischaemic heart disease
Hypertension
Nephritisnephrosis
Males
Female
UN - Male
SA 1997
SA 2004
UN - Female
SA 1997
SA 2004
0 pts
1 - 3 pts
4 - 9 pts
10+ pts
42
Source wwwclinicaltrialsgov 22-Oct-2010
Clinical trials registered across Africa
43
0
500
1000
1500
2000
2500
South Africa Kenya Malawi Tanzania Uganda Zambia
Selected African countries
2005
2010
2015
Source ClinTrialsgov
Trend 2005 - 2015
Source wwwclinicaltrialsgov 28-Aug-2015
44
AFRICA FOUND IN TRANSLATION
bull Vast treatment-naiumlve population bull Cost advantages (still) bull Diverse ethnicity amp morbidity bull Inverse seasonality bull Site capacity-building widely implemented bull Robust regulatory review bull Variable but generally good regulatory timelines bull Established GCP culture ndash sites and home-bred CROs
45
THANK YOU
Foliennummer 1
Triclinium A South African CRO
Collaboration with VPM SII
Vaccine Trials in SA 2015
Foliennummer 5
Foliennummer 6
Foliennummer 7
Foliennummer 8
Foliennummer 9
Foliennummer 10
Foliennummer 11
Foliennummer 12
Foliennummer 13
Foliennummer 14
Foliennummer 15
Foliennummer 16
Foliennummer 17
Distribution of clinical trial sites
Foliennummer 19
South Africa Leading Causes of Death
Foliennummer 21
Foliennummer 22
South Africa TB deaths by age group
Foliennummer 24
Foliennummer 25
Foliennummer 26
Foliennummer 27
Foliennummer 28
Foliennummer 29
Foliennummer 30
Foliennummer 31
SA Clinical Trial Regulatory Processes
Clinical Trial Density Active sites million population
Foliennummer 34
Why Africa
Foliennummer 36
AFRICA hellip the true size
SSV to SIV
Foliennummer 39
Foliennummer 40
Foliennummer 41
Foliennummer 42
Foliennummer 43
AFRICA FOUND IN TRANSLATION
Foliennummer 45
Region
Median
of Sites
Patients Site
0 pts
1 - 3 pts
4 - 9 pts
10+ pts
Latin America
4
21
26
30
23
North America
3
29
29
24
18
Eastern Europe
6
15
31
26
27
Western Europe
4
15
22
29
34
Asia Pacific
4
19
30
34
18
Africa
10
4
17
28
51
0 pts
1 - 3 pts
4 - 9 pts
10+ pts
Latin America
21
26
30
23
North America
29
29
24
18
Eastern Europe
15
31
26
27
Western Europe
15
22
29
34
Asia Pacific
19
30
34
18
Africa
4
17
28
51
Males
Female
15-19
210
150
20-24
340
205
25-29
395
300
30-34
460
360
35-39
600
405
40-44
800
500
45-49
1100
700
50-54
1600
1050
55-54
2300
1580
60-64
3340
2250
UN - Male
SA 1997
SA 2004
UN - Female
SA 1997
SA 2004
15-19
210
235
216
150
165
187
20-24
340
381
555
205
331
1085
25-29
395
625
1081
300
452
1985
30-34
460
817
2118
360
489
2267
35-39
600
916
2498
405
526
1890
40-44
800
1136
2765
500
615
1548
45-49
1100
1486
2744
700
800
1400
50-54
1600
2016
2979
1050
1116
1506
55-54
2300
2838
3270
1580
1626
1717
60-64
3340
3614
4146
2250
2201
2360
Stroke
ill-defined heart disease
Diabetes mellitus
Ischaemic heart disease
Hypertension
Nephritisnephrosis
Stroke
ill-defined heart disease
Diabetes mellitus
Ischaemic heart disease
Hypertension
Nephritisnephrosis
1999
34
345
20
248
14
10
1999
295
246
23
10
145
68
2000
36
362
218
249
152
112
2000
318
268
241
108
16
8
2001
35
372
22
25
15
125
2001
322
28
252
102
162
95
2002
405
298
24
26
147
126
2002
352
295
27
115
16
10
2003
425
32
245
285
152
15
2003
382
299
285
122
17
12
2004
39
325
255
26
165
16
2004
35
30
295
121
19
119
2005
36
328
265
26
15
162
2005
325
30
32
12
18
12
2006
35
336
27
258
155
16
2006
33
32
32
11
18
125
COPD
Asthma
Tracheabronchial lung cancer
Oesophageal cancer
prostate cancer
Cervical cancer
Breast cancer
1999
2001
12
135
10
26
2000
204
116
13
92
28
2001
222
131
133
96
27
2002
23
144
128
95
285
2003
243
149
124
94
29
2004
229
154
1255
87
29
2005
224
152
122
82
295
2006
224
136
116
75
3
COPD
Asthma
Tracheabronchial lung cancer
Oesophageal cancer
Prostate cancer
Cervical cancer
Breast cancer
1999
88
92
43
41
106
82
2000
96
95
4
43
11
81
2001
10
109
4
4
111
89
2002
10
116
4
4
112
85
2003
11
124
4
395
116
85
2004
102
1295
44
39
115
101
2005
105
128
42
38
1185
10
2006
10
12
42
32
1205
10
Based on this survey the researchers estimate that 109 of all South Africans over 2 years old were living with HIV in 2008 In 2002 and 2005 this figure was 114 and 108 respectively showing a degree of stabilisation Among those between 15 and 49 years old the estimated HIV prevalence was 169 in 2008 The survey found the prevalence among children aged 2-14 to be 25 down significantly since 2002 when prevalence was 56
Estimated HIV prevalence () among South Africans aged 2 years and older by age 2002-2008
Age
HIV +
HIV -
Children (2-14 years)
25
975
Youth (15-24 years)
87
913
Adults (25 and older)
168
832
(15-49 years)
169
831
Total (2 and older)
109
891
Estimated HIV prevalence among South Africans by age and sex 2008
Age
Male prevalence
Female prevalence
2-14
3
2
15-19
25
67
20-24
51
211
25-29
157
327
30-34
258
291
35-39
185
248
40-44
192
163
45-49
64
141
50-54
104
102
55-59
62
77
60+
35
18
Total
79
136
Among females HIV prevalence is highest in those between 25 and 29 years old among males the peak is in the group aged 30-34 years
HIV prevalence () by province 2002-2008
Province
2002
2005
2008
KwaZulu-Natal
117
165
158
Mpumalanga
141
152
154
Free State
149
126
126
North West
103
109
113
Gauteng
147
108
103
Eastern Cape
66
89
9
Limpopo
98
8
88
Northern Cape
84
54
59
Western Cape
107
19
38
National
114
108
109
The results of this study suggest that KwaZulu-Natal Mpumulanga and Free State have the highest HIV prevalence However the relatively small sample sizes may limit precision and in several cases the ranges of uncertainty overlap
HIV prevalence by population group 2008
Population group
Prevalence ()
African
136
864
White
03
997
Coloured
17
983
Indian
03
997
Studies of AIDS deaths
Latin America
Latin America
Latin America
Latin America
North America
North America
North America
North America
Eastern Europe
Eastern Europe
Eastern Europe
Eastern Europe
Western Europe
Western Europe
Western Europe
Western Europe
Asia Pacific
Asia Pacific
Asia Pacific
Asia Pacific
Africa
Africa
Africa
Africa
Country
Study starts
Subjects randomised
SubjectsStudy
USA
32
4385
13703125
Russia
20
788
394
Germany
19
1883
991052631579
UK
13
265
203846153846
South Africa
12
347
289166666667
Argentina
12
329
274166666667
Australia
11
195
177272727273
India
7
275
392857142857
Brazil
3
115
383333333333
Country
Initiation
Site activation
Recruitment
LOC setup
Unproductive sites
(Approval ndash FCI)
(FCI ndash FSFV)
(FSFV ndash LSFV)
(CPC ndash FSFV)
South Africa
19
38
153
357
21
Australia
117
63
401
239
11
Germany
16
37
401
224
21
UK
9
101
301
346
20
Russia
11
52
174
334
9
India
31
28
389
431
3
Argentina
94
67
288
32
13
Brazil
79
59
94
656
20
USA
44
31
149
26
Country
Pts Rand
Sites
Av CPP
Cost Per Country
Ethics Subm
Regulatory Fees
Add Inv Fees
CT Scan Total
Ethics + Regulatory
Total Regulatory Fees
South Africa
25
5
7250
181250
290
460
363
0
750
1113
Canada
18
4
832545
14985818
181818
0
0
1557576
181818
1818
Italy
7
2
10000
70000
2200
0
0
0
2200
2200
Germany
55
10
7000
385000
3000
0
0
12000
3000
3000
Peru
40
5
7000
280000
1500
1000
2000
60000
2500
4500
Poland
15
4
10000
150000
0
2500
2400
0
2500
4900
Spain
40
7
10500
420000
0
0
5450
0
0
5450
UK
12
4
13000
156000
0
0
5556
0
0
5556
Bulgaria
18
4
10000
180000
0
5000
1000
0
5000
6000
Taiwan
20
4
1179649
2359298
104167
313
5208
0
135467
6563
Czech Rep
10
2
10000
100000
1500
3000
3000
0
4500
7500
Greece
40
7
9000
360000
0
7500
0
0
7500
7500
Chile
15
4
10840
162600
1700
3600
3000
0
5300
8300
Belgium
25
6
12200
305000
3992
4332
0
0
8324
8324
Korea
30
3
10827
324802
1114
0
14324
0
1114
15438
Singapore
10
2
11565
115650
1750
0
17975
0
1750
19725
France
50
10
9000
450000
0
0
20000
0
0
20000
China
39
5
4978
194142
5224
0
39814
0
5224
40336
New Zealand
10
3
145244
145244
1973
0
43123
0
1973
45096
Israel
10
6
11140
111400
2060
3000
48400
16500
5060
53460
Brazil
30
6
10000
300000
2000
287356
5649202
0
487356
61366
Australia
24
6
40200
964800
0
500
82500
0
500
83000
23
543
109
532856799
3304716
26939
27700043
73748966
[1753EURO x 14 (ex rate) = $2454] [ $245416 hours=$153hour]
1095625
1095625
12271
1753
198089
198089
208514736842
South Africa
Canada
Italy
Germany
Peru
Poland
Spain
UK
Bulgaria
Taiwan
Czech Rep
Greece
Chile
Belgium
Korea
Singapore
France
China
New Zealand
Israel
Brazil
Australia
Country
Study starts
Subjects randomised
SubjectsStudy
USA
32
4385
13703125
Russia
20
788
394
Germany
19
1883
991052631579
UK
13
265
203846153846
South Africa
12
347
289166666667
Argentina
12
329
274166666667
Australia
11
195
177272727273
India
7
275
392857142857
Brazil
3
115
383333333333
Country
Initiation
Site activation
Recruitment
LOC setup
Unproductive sites
(Approval ndash FCI)
(FCI ndash FSFV)
(FSFV ndash LSFV)
(CPC ndash FSFV)
South Africa
19
38
153
357
21
Australia
117
63
401
239
11
Germany
16
37
401
224
21
UK
9
101
301
346
20
Russia
11
52
174
334
9
India
31
28
389
431
3
Argentina
94
67
288
32
13
Brazil
79
59
94
656
20
USA
44
31
149
26
Study starts
SubjectsStudy
31
Euro
0
10000
20000
30000
40000
50000
60000
70000
80000
90000S
outh
Afri
caC
anad
a
Italy
Ger
man
yP
eru
Pol
and
Spa
in UK
Bul
garia
Taiw
anC
zech
Rep
Gre
ece
Chi
leB
elgi
umK
orea
Sin
gapo
reFr
ance
Chi
naN
ew Z
eala
ndIs
rael
Bra
zil
Aus
tralia
Source Bayer Presented SACRA Conference 2009
Eur
os
Regulatory Application Fees
Chart1
Total Regulatory Fees
1113
181818
2200
3000
4500
4900
5450
5556
6000
656267
7500
7500
8300
8324
15438
19725
20000
403364
45096
53460
6136558
83000
Sheet1
Sheet2
Sheet2
Average Cost Per Patient (Euro)
Average Cost Per Patient
Sheet4
Ethics Subm
Regulatory Fees
Sheet3
Ethics + Regulatory
Total Ethics and Regulatory Fees
Add Inv Fees
Additional Investigator Application Fees
Total Regulatory Fees
Study starts
SubjectsStudy
32
SA Clinical Trial Regulatory Processes
Governed by SA-GCP and Declaration of Helsinki SA National Clinical Trials Register (SANCTR) Medicines Control Council (National Regulatory Authority)
o New protocols o Amendments o Additional sitesinvestigators
Ethics Committees (33 NHREC-registered) RegionalMunicipal DoH Export permits for bio samples (Nat Health Act 2003)
Clinical Trial Density Active sites million population
Nature Reviews Drug Discovery 7 13-14 (January 2008)
France 503
Germany 512 Canada
922
USA 1203
Czech Republic 776
553 sites
South Africa 119
757 sites
757 sites
533 sites
1084 sites
Argentina 269
Russia 77
China 04
India 07
34
Gateway to Africa
35
Why Africa bull Large accessible population relatively new to clinical trials
bull Experienced and willing investigators
bull Many clinical trial sites established by PDPs NGOs etc
bull Expanding therapeutic areas shifting burden of disease from
infectious to non-communicable diseases
bull Significantly improved infrastructure and accessibility
bull Rapidly evolving regulatory and ethics procedures
bull Potential for capacity building and sustainable clinical trial potential
36
Relatively young GCP culture Resident mentorships to build capacity Locations ndash accessibility for site monitoring Variable infrastructure esp electricity connectivity and
transportation Resourcing of public healthcare systems
Sub-Saharan Africa challenges
37
bull Second-largest continent
bull Spans NS and EW hemispheres
bull Second most populous continent 2014 estimate 1069 billion
bull Home to more than a quarter of the 196 independent countries
bull All 54 African countries are UN members
bull 39 urban population
bull 12 metropolitan areas gt 4m
bull gt 3000 distinct ethnicities
bull gt 2000 languages spoken
AFRICA hellip the true size
wwwcitypopulationdeworldAgglomerations 2015
38
SSV to SIV
0
5
10
15
20
25
30
35
40
45
Africa North America
Asia Pacific
Western Europe
Eastern Europe
Latin America
Source Quintiles South Africa SACRA Conference 2008
Wee
ks (A
vera
ge)
Start-Up Timelines
39
Region Median
Patients Site
of Sites
0 pts 1 - 3 pts 4 - 9 pts 10+ pts
Latin America 40 21 26 30 23
North America 30 29 29 24 18
Eastern Europe 60 15 31 26 27
Western Europe 40 15 22 29 34
Asia Pacific 40 19 30 34 18
Africa 100 4 17 28 51
Enrollment performance by region for 2008
Site Performance
Source Quintiles South Africa Presented SACRA Conference 2009
40
0 1 2 3 4 5 6 7 8 9
10
Latin America
North America
Eastern Europe
Western Europe
Asia Pacific
Africa
Num
ber o
f par
ticip
ants
MEDIAN site enrollment by region for 2008
Source Quintiles South Africa Presented SACRA Conference 2009
Site Performance
41
Source Quintiles South Africa Presented SACRA Conference 2009
s
ites
0
5
10
15
20
25
30
35
40
45
50
LatinAmerica
NorthAmerica
EasternEurope
WesternEurope
Asia Pacific Africa
0 pts
1 - 3 pts
4 - 9 pts
10+ pts
Enrollment performance by region for 2008
Site Performance
Chart1
0 pts
1 - 3 pts
4 - 9 pts
10+ pts
021
026
03
023
029
029
024
018
015
031
026
027
015
022
029
034
019
03
034
018
004
017
028
051
HIV
HIV
Resiratory amp Cancer
Male prevalence
Female prevalence
CVS
Overall death rates
Overall death rates
COPD
Asthma
Tracheabronchial lung cancer
Oesophageal cancer
prostate cancer
Trial metrics
COPD
Asthma
Tracheabronchial lung cancer
Oesophageal cancer
Prostate cancer
Cervical cancer
Breast cancer
Stroke
ill-defined heart disease
Diabetes mellitus
Ischaemic heart disease
Hypertension
Nephritisnephrosis
Stroke
ill-defined heart disease
Diabetes mellitus
Ischaemic heart disease
Hypertension
Nephritisnephrosis
Males
Female
UN - Male
SA 1997
SA 2004
UN - Female
SA 1997
SA 2004
0 pts
1 - 3 pts
4 - 9 pts
10+ pts
42
Source wwwclinicaltrialsgov 22-Oct-2010
Clinical trials registered across Africa
43
0
500
1000
1500
2000
2500
South Africa Kenya Malawi Tanzania Uganda Zambia
Selected African countries
2005
2010
2015
Source ClinTrialsgov
Trend 2005 - 2015
Source wwwclinicaltrialsgov 28-Aug-2015
44
AFRICA FOUND IN TRANSLATION
bull Vast treatment-naiumlve population bull Cost advantages (still) bull Diverse ethnicity amp morbidity bull Inverse seasonality bull Site capacity-building widely implemented bull Robust regulatory review bull Variable but generally good regulatory timelines bull Established GCP culture ndash sites and home-bred CROs
45
THANK YOU
Foliennummer 1
Triclinium A South African CRO
Collaboration with VPM SII
Vaccine Trials in SA 2015
Foliennummer 5
Foliennummer 6
Foliennummer 7
Foliennummer 8
Foliennummer 9
Foliennummer 10
Foliennummer 11
Foliennummer 12
Foliennummer 13
Foliennummer 14
Foliennummer 15
Foliennummer 16
Foliennummer 17
Distribution of clinical trial sites
Foliennummer 19
South Africa Leading Causes of Death
Foliennummer 21
Foliennummer 22
South Africa TB deaths by age group
Foliennummer 24
Foliennummer 25
Foliennummer 26
Foliennummer 27
Foliennummer 28
Foliennummer 29
Foliennummer 30
Foliennummer 31
SA Clinical Trial Regulatory Processes
Clinical Trial Density Active sites million population
Foliennummer 34
Why Africa
Foliennummer 36
AFRICA hellip the true size
SSV to SIV
Foliennummer 39
Foliennummer 40
Foliennummer 41
Foliennummer 42
Foliennummer 43
AFRICA FOUND IN TRANSLATION
Foliennummer 45
Region
Median
of Sites
Patients Site
0 pts
1 - 3 pts
4 - 9 pts
10+ pts
Latin America
4
21
26
30
23
North America
3
29
29
24
18
Eastern Europe
6
15
31
26
27
Western Europe
4
15
22
29
34
Asia Pacific
4
19
30
34
18
Africa
10
4
17
28
51
0 pts
1 - 3 pts
4 - 9 pts
10+ pts
Latin America
21
26
30
23
North America
29
29
24
18
Eastern Europe
15
31
26
27
Western Europe
15
22
29
34
Asia Pacific
19
30
34
18
Africa
4
17
28
51
Males
Female
15-19
210
150
20-24
340
205
25-29
395
300
30-34
460
360
35-39
600
405
40-44
800
500
45-49
1100
700
50-54
1600
1050
55-54
2300
1580
60-64
3340
2250
UN - Male
SA 1997
SA 2004
UN - Female
SA 1997
SA 2004
15-19
210
235
216
150
165
187
20-24
340
381
555
205
331
1085
25-29
395
625
1081
300
452
1985
30-34
460
817
2118
360
489
2267
35-39
600
916
2498
405
526
1890
40-44
800
1136
2765
500
615
1548
45-49
1100
1486
2744
700
800
1400
50-54
1600
2016
2979
1050
1116
1506
55-54
2300
2838
3270
1580
1626
1717
60-64
3340
3614
4146
2250
2201
2360
Stroke
ill-defined heart disease
Diabetes mellitus
Ischaemic heart disease
Hypertension
Nephritisnephrosis
Stroke
ill-defined heart disease
Diabetes mellitus
Ischaemic heart disease
Hypertension
Nephritisnephrosis
1999
34
345
20
248
14
10
1999
295
246
23
10
145
68
2000
36
362
218
249
152
112
2000
318
268
241
108
16
8
2001
35
372
22
25
15
125
2001
322
28
252
102
162
95
2002
405
298
24
26
147
126
2002
352
295
27
115
16
10
2003
425
32
245
285
152
15
2003
382
299
285
122
17
12
2004
39
325
255
26
165
16
2004
35
30
295
121
19
119
2005
36
328
265
26
15
162
2005
325
30
32
12
18
12
2006
35
336
27
258
155
16
2006
33
32
32
11
18
125
COPD
Asthma
Tracheabronchial lung cancer
Oesophageal cancer
prostate cancer
Cervical cancer
Breast cancer
1999
2001
12
135
10
26
2000
204
116
13
92
28
2001
222
131
133
96
27
2002
23
144
128
95
285
2003
243
149
124
94
29
2004
229
154
1255
87
29
2005
224
152
122
82
295
2006
224
136
116
75
3
COPD
Asthma
Tracheabronchial lung cancer
Oesophageal cancer
Prostate cancer
Cervical cancer
Breast cancer
1999
88
92
43
41
106
82
2000
96
95
4
43
11
81
2001
10
109
4
4
111
89
2002
10
116
4
4
112
85
2003
11
124
4
395
116
85
2004
102
1295
44
39
115
101
2005
105
128
42
38
1185
10
2006
10
12
42
32
1205
10
Based on this survey the researchers estimate that 109 of all South Africans over 2 years old were living with HIV in 2008 In 2002 and 2005 this figure was 114 and 108 respectively showing a degree of stabilisation Among those between 15 and 49 years old the estimated HIV prevalence was 169 in 2008 The survey found the prevalence among children aged 2-14 to be 25 down significantly since 2002 when prevalence was 56
Estimated HIV prevalence () among South Africans aged 2 years and older by age 2002-2008
Age
HIV +
HIV -
Children (2-14 years)
25
975
Youth (15-24 years)
87
913
Adults (25 and older)
168
832
(15-49 years)
169
831
Total (2 and older)
109
891
Estimated HIV prevalence among South Africans by age and sex 2008
Age
Male prevalence
Female prevalence
2-14
3
2
15-19
25
67
20-24
51
211
25-29
157
327
30-34
258
291
35-39
185
248
40-44
192
163
45-49
64
141
50-54
104
102
55-59
62
77
60+
35
18
Total
79
136
Among females HIV prevalence is highest in those between 25 and 29 years old among males the peak is in the group aged 30-34 years
HIV prevalence () by province 2002-2008
Province
2002
2005
2008
KwaZulu-Natal
117
165
158
Mpumalanga
141
152
154
Free State
149
126
126
North West
103
109
113
Gauteng
147
108
103
Eastern Cape
66
89
9
Limpopo
98
8
88
Northern Cape
84
54
59
Western Cape
107
19
38
National
114
108
109
The results of this study suggest that KwaZulu-Natal Mpumulanga and Free State have the highest HIV prevalence However the relatively small sample sizes may limit precision and in several cases the ranges of uncertainty overlap
HIV prevalence by population group 2008
Population group
Prevalence ()
African
136
864
White
03
997
Coloured
17
983
Indian
03
997
Studies of AIDS deaths
Latin America
Latin America
Latin America
Latin America
North America
North America
North America
North America
Eastern Europe
Eastern Europe
Eastern Europe
Eastern Europe
Western Europe
Western Europe
Western Europe
Western Europe
Asia Pacific
Asia Pacific
Asia Pacific
Asia Pacific
Africa
Africa
Africa
Africa
Country
Study starts
Subjects randomised
SubjectsStudy
USA
32
4385
13703125
Russia
20
788
394
Germany
19
1883
991052631579
UK
13
265
203846153846
South Africa
12
347
289166666667
Argentina
12
329
274166666667
Australia
11
195
177272727273
India
7
275
392857142857
Brazil
3
115
383333333333
Country
Initiation
Site activation
Recruitment
LOC setup
Unproductive sites
(Approval ndash FCI)
(FCI ndash FSFV)
(FSFV ndash LSFV)
(CPC ndash FSFV)
South Africa
19
38
153
357
21
Australia
117
63
401
239
11
Germany
16
37
401
224
21
UK
9
101
301
346
20
Russia
11
52
174
334
9
India
31
28
389
431
3
Argentina
94
67
288
32
13
Brazil
79
59
94
656
20
USA
44
31
149
26
Country
Pts Rand
Sites
Av CPP
Cost Per Country
Ethics Subm
Regulatory Fees
Add Inv Fees
CT Scan Total
Ethics + Regulatory
Total Regulatory Fees
South Africa
25
5
7250
181250
290
460
363
0
750
1113
Canada
18
4
832545
14985818
181818
0
0
1557576
181818
1818
Italy
7
2
10000
70000
2200
0
0
0
2200
2200
Germany
55
10
7000
385000
3000
0
0
12000
3000
3000
Peru
40
5
7000
280000
1500
1000
2000
60000
2500
4500
Poland
15
4
10000
150000
0
2500
2400
0
2500
4900
Spain
40
7
10500
420000
0
0
5450
0
0
5450
UK
12
4
13000
156000
0
0
5556
0
0
5556
Bulgaria
18
4
10000
180000
0
5000
1000
0
5000
6000
Taiwan
20
4
1179649
2359298
104167
313
5208
0
135467
6563
Czech Rep
10
2
10000
100000
1500
3000
3000
0
4500
7500
Greece
40
7
9000
360000
0
7500
0
0
7500
7500
Chile
15
4
10840
162600
1700
3600
3000
0
5300
8300
Belgium
25
6
12200
305000
3992
4332
0
0
8324
8324
Korea
30
3
10827
324802
1114
0
14324
0
1114
15438
Singapore
10
2
11565
115650
1750
0
17975
0
1750
19725
France
50
10
9000
450000
0
0
20000
0
0
20000
China
39
5
4978
194142
5224
0
39814
0
5224
40336
New Zealand
10
3
145244
145244
1973
0
43123
0
1973
45096
Israel
10
6
11140
111400
2060
3000
48400
16500
5060
53460
Brazil
30
6
10000
300000
2000
287356
5649202
0
487356
61366
Australia
24
6
40200
964800
0
500
82500
0
500
83000
23
543
109
532856799
3304716
26939
27700043
73748966
[1753EURO x 14 (ex rate) = $2454] [ $245416 hours=$153hour]
1095625
1095625
12271
1753
198089
198089
208514736842
South Africa
Canada
Italy
Germany
Peru
Poland
Spain
UK
Bulgaria
Taiwan
Czech Rep
Greece
Chile
Belgium
Korea
Singapore
France
China
New Zealand
Israel
Brazil
Australia
Country
Study starts
Subjects randomised
SubjectsStudy
USA
32
4385
13703125
Russia
20
788
394
Germany
19
1883
991052631579
UK
13
265
203846153846
South Africa
12
347
289166666667
Argentina
12
329
274166666667
Australia
11
195
177272727273
India
7
275
392857142857
Brazil
3
115
383333333333
Study starts
SubjectsStudy
31
Euro
0
10000
20000
30000
40000
50000
60000
70000
80000
90000S
outh
Afri
caC
anad
a
Italy
Ger
man
yP
eru
Pol
and
Spa
in UK
Bul
garia
Taiw
anC
zech
Rep
Gre
ece
Chi
leB
elgi
umK
orea
Sin
gapo
reFr
ance
Chi
naN
ew Z
eala
ndIs
rael
Bra
zil
Aus
tralia
Source Bayer Presented SACRA Conference 2009
Eur
os
Regulatory Application Fees
Chart1
Total Regulatory Fees
1113
181818
2200
3000
4500
4900
5450
5556
6000
656267
7500
7500
8300
8324
15438
19725
20000
403364
45096
53460
6136558
83000
Sheet1
Sheet2
Sheet2
Average Cost Per Patient (Euro)
Average Cost Per Patient
Sheet4
Ethics Subm
Regulatory Fees
Sheet3
Ethics + Regulatory
Total Ethics and Regulatory Fees
Add Inv Fees
Additional Investigator Application Fees
Total Regulatory Fees
Study starts
SubjectsStudy
32
SA Clinical Trial Regulatory Processes
Governed by SA-GCP and Declaration of Helsinki SA National Clinical Trials Register (SANCTR) Medicines Control Council (National Regulatory Authority)
o New protocols o Amendments o Additional sitesinvestigators
Ethics Committees (33 NHREC-registered) RegionalMunicipal DoH Export permits for bio samples (Nat Health Act 2003)
Clinical Trial Density Active sites million population
Nature Reviews Drug Discovery 7 13-14 (January 2008)
France 503
Germany 512 Canada
922
USA 1203
Czech Republic 776
553 sites
South Africa 119
757 sites
757 sites
533 sites
1084 sites
Argentina 269
Russia 77
China 04
India 07
34
Gateway to Africa
35
Why Africa bull Large accessible population relatively new to clinical trials
bull Experienced and willing investigators
bull Many clinical trial sites established by PDPs NGOs etc
bull Expanding therapeutic areas shifting burden of disease from
infectious to non-communicable diseases
bull Significantly improved infrastructure and accessibility
bull Rapidly evolving regulatory and ethics procedures
bull Potential for capacity building and sustainable clinical trial potential
36
Relatively young GCP culture Resident mentorships to build capacity Locations ndash accessibility for site monitoring Variable infrastructure esp electricity connectivity and
transportation Resourcing of public healthcare systems
Sub-Saharan Africa challenges
37
bull Second-largest continent
bull Spans NS and EW hemispheres
bull Second most populous continent 2014 estimate 1069 billion
bull Home to more than a quarter of the 196 independent countries
bull All 54 African countries are UN members
bull 39 urban population
bull 12 metropolitan areas gt 4m
bull gt 3000 distinct ethnicities
bull gt 2000 languages spoken
AFRICA hellip the true size
wwwcitypopulationdeworldAgglomerations 2015
38
SSV to SIV
0
5
10
15
20
25
30
35
40
45
Africa North America
Asia Pacific
Western Europe
Eastern Europe
Latin America
Source Quintiles South Africa SACRA Conference 2008
Wee
ks (A
vera
ge)
Start-Up Timelines
39
Region Median
Patients Site
of Sites
0 pts 1 - 3 pts 4 - 9 pts 10+ pts
Latin America 40 21 26 30 23
North America 30 29 29 24 18
Eastern Europe 60 15 31 26 27
Western Europe 40 15 22 29 34
Asia Pacific 40 19 30 34 18
Africa 100 4 17 28 51
Enrollment performance by region for 2008
Site Performance
Source Quintiles South Africa Presented SACRA Conference 2009
40
0 1 2 3 4 5 6 7 8 9
10
Latin America
North America
Eastern Europe
Western Europe
Asia Pacific
Africa
Num
ber o
f par
ticip
ants
MEDIAN site enrollment by region for 2008
Source Quintiles South Africa Presented SACRA Conference 2009
Site Performance
41
Source Quintiles South Africa Presented SACRA Conference 2009
s
ites
0
5
10
15
20
25
30
35
40
45
50
LatinAmerica
NorthAmerica
EasternEurope
WesternEurope
Asia Pacific Africa
0 pts
1 - 3 pts
4 - 9 pts
10+ pts
Enrollment performance by region for 2008
Site Performance
Chart1
0 pts
1 - 3 pts
4 - 9 pts
10+ pts
021
026
03
023
029
029
024
018
015
031
026
027
015
022
029
034
019
03
034
018
004
017
028
051
HIV
HIV
Resiratory amp Cancer
Male prevalence
Female prevalence
CVS
Overall death rates
Overall death rates
COPD
Asthma
Tracheabronchial lung cancer
Oesophageal cancer
prostate cancer
Trial metrics
COPD
Asthma
Tracheabronchial lung cancer
Oesophageal cancer
Prostate cancer
Cervical cancer
Breast cancer
Stroke
ill-defined heart disease
Diabetes mellitus
Ischaemic heart disease
Hypertension
Nephritisnephrosis
Stroke
ill-defined heart disease
Diabetes mellitus
Ischaemic heart disease
Hypertension
Nephritisnephrosis
Males
Female
UN - Male
SA 1997
SA 2004
UN - Female
SA 1997
SA 2004
0 pts
1 - 3 pts
4 - 9 pts
10+ pts
42
Source wwwclinicaltrialsgov 22-Oct-2010
Clinical trials registered across Africa
43
0
500
1000
1500
2000
2500
South Africa Kenya Malawi Tanzania Uganda Zambia
Selected African countries
2005
2010
2015
Source ClinTrialsgov
Trend 2005 - 2015
Source wwwclinicaltrialsgov 28-Aug-2015
44
AFRICA FOUND IN TRANSLATION
bull Vast treatment-naiumlve population bull Cost advantages (still) bull Diverse ethnicity amp morbidity bull Inverse seasonality bull Site capacity-building widely implemented bull Robust regulatory review bull Variable but generally good regulatory timelines bull Established GCP culture ndash sites and home-bred CROs
45
THANK YOU
Foliennummer 1
Triclinium A South African CRO
Collaboration with VPM SII
Vaccine Trials in SA 2015
Foliennummer 5
Foliennummer 6
Foliennummer 7
Foliennummer 8
Foliennummer 9
Foliennummer 10
Foliennummer 11
Foliennummer 12
Foliennummer 13
Foliennummer 14
Foliennummer 15
Foliennummer 16
Foliennummer 17
Distribution of clinical trial sites
Foliennummer 19
South Africa Leading Causes of Death
Foliennummer 21
Foliennummer 22
South Africa TB deaths by age group
Foliennummer 24
Foliennummer 25
Foliennummer 26
Foliennummer 27
Foliennummer 28
Foliennummer 29
Foliennummer 30
Foliennummer 31
SA Clinical Trial Regulatory Processes
Clinical Trial Density Active sites million population
Foliennummer 34
Why Africa
Foliennummer 36
AFRICA hellip the true size
SSV to SIV
Foliennummer 39
Foliennummer 40
Foliennummer 41
Foliennummer 42
Foliennummer 43
AFRICA FOUND IN TRANSLATION
Foliennummer 45
Region
Median
of Sites
Patients Site
0 pts
1 - 3 pts
4 - 9 pts
10+ pts
Latin America
4
21
26
30
23
North America
3
29
29
24
18
Eastern Europe
6
15
31
26
27
Western Europe
4
15
22
29
34
Asia Pacific
4
19
30
34
18
Africa
10
4
17
28
51
0 pts
1 - 3 pts
4 - 9 pts
10+ pts
Latin America
21
26
30
23
North America
29
29
24
18
Eastern Europe
15
31
26
27
Western Europe
15
22
29
34
Asia Pacific
19
30
34
18
Africa
4
17
28
51
Males
Female
15-19
210
150
20-24
340
205
25-29
395
300
30-34
460
360
35-39
600
405
40-44
800
500
45-49
1100
700
50-54
1600
1050
55-54
2300
1580
60-64
3340
2250
UN - Male
SA 1997
SA 2004
UN - Female
SA 1997
SA 2004
15-19
210
235
216
150
165
187
20-24
340
381
555
205
331
1085
25-29
395
625
1081
300
452
1985
30-34
460
817
2118
360
489
2267
35-39
600
916
2498
405
526
1890
40-44
800
1136
2765
500
615
1548
45-49
1100
1486
2744
700
800
1400
50-54
1600
2016
2979
1050
1116
1506
55-54
2300
2838
3270
1580
1626
1717
60-64
3340
3614
4146
2250
2201
2360
Stroke
ill-defined heart disease
Diabetes mellitus
Ischaemic heart disease
Hypertension
Nephritisnephrosis
Stroke
ill-defined heart disease
Diabetes mellitus
Ischaemic heart disease
Hypertension
Nephritisnephrosis
1999
34
345
20
248
14
10
1999
295
246
23
10
145
68
2000
36
362
218
249
152
112
2000
318
268
241
108
16
8
2001
35
372
22
25
15
125
2001
322
28
252
102
162
95
2002
405
298
24
26
147
126
2002
352
295
27
115
16
10
2003
425
32
245
285
152
15
2003
382
299
285
122
17
12
2004
39
325
255
26
165
16
2004
35
30
295
121
19
119
2005
36
328
265
26
15
162
2005
325
30
32
12
18
12
2006
35
336
27
258
155
16
2006
33
32
32
11
18
125
COPD
Asthma
Tracheabronchial lung cancer
Oesophageal cancer
prostate cancer
Cervical cancer
Breast cancer
1999
2001
12
135
10
26
2000
204
116
13
92
28
2001
222
131
133
96
27
2002
23
144
128
95
285
2003
243
149
124
94
29
2004
229
154
1255
87
29
2005
224
152
122
82
295
2006
224
136
116
75
3
COPD
Asthma
Tracheabronchial lung cancer
Oesophageal cancer
Prostate cancer
Cervical cancer
Breast cancer
1999
88
92
43
41
106
82
2000
96
95
4
43
11
81
2001
10
109
4
4
111
89
2002
10
116
4
4
112
85
2003
11
124
4
395
116
85
2004
102
1295
44
39
115
101
2005
105
128
42
38
1185
10
2006
10
12
42
32
1205
10
Based on this survey the researchers estimate that 109 of all South Africans over 2 years old were living with HIV in 2008 In 2002 and 2005 this figure was 114 and 108 respectively showing a degree of stabilisation Among those between 15 and 49 years old the estimated HIV prevalence was 169 in 2008 The survey found the prevalence among children aged 2-14 to be 25 down significantly since 2002 when prevalence was 56
Estimated HIV prevalence () among South Africans aged 2 years and older by age 2002-2008
Age
HIV +
HIV -
Children (2-14 years)
25
975
Youth (15-24 years)
87
913
Adults (25 and older)
168
832
(15-49 years)
169
831
Total (2 and older)
109
891
Estimated HIV prevalence among South Africans by age and sex 2008
Age
Male prevalence
Female prevalence
2-14
3
2
15-19
25
67
20-24
51
211
25-29
157
327
30-34
258
291
35-39
185
248
40-44
192
163
45-49
64
141
50-54
104
102
55-59
62
77
60+
35
18
Total
79
136
Among females HIV prevalence is highest in those between 25 and 29 years old among males the peak is in the group aged 30-34 years
HIV prevalence () by province 2002-2008
Province
2002
2005
2008
KwaZulu-Natal
117
165
158
Mpumalanga
141
152
154
Free State
149
126
126
North West
103
109
113
Gauteng
147
108
103
Eastern Cape
66
89
9
Limpopo
98
8
88
Northern Cape
84
54
59
Western Cape
107
19
38
National
114
108
109
The results of this study suggest that KwaZulu-Natal Mpumulanga and Free State have the highest HIV prevalence However the relatively small sample sizes may limit precision and in several cases the ranges of uncertainty overlap
HIV prevalence by population group 2008
Population group
Prevalence ()
African
136
864
White
03
997
Coloured
17
983
Indian
03
997
Studies of AIDS deaths
Latin America
Latin America
Latin America
Latin America
North America
North America
North America
North America
Eastern Europe
Eastern Europe
Eastern Europe
Eastern Europe
Western Europe
Western Europe
Western Europe
Western Europe
Asia Pacific
Asia Pacific
Asia Pacific
Asia Pacific
Africa
Africa
Africa
Africa
Country
Study starts
Subjects randomised
SubjectsStudy
USA
32
4385
13703125
Russia
20
788
394
Germany
19
1883
991052631579
UK
13
265
203846153846
South Africa
12
347
289166666667
Argentina
12
329
274166666667
Australia
11
195
177272727273
India
7
275
392857142857
Brazil
3
115
383333333333
Country
Initiation
Site activation
Recruitment
LOC setup
Unproductive sites
(Approval ndash FCI)
(FCI ndash FSFV)
(FSFV ndash LSFV)
(CPC ndash FSFV)
South Africa
19
38
153
357
21
Australia
117
63
401
239
11
Germany
16
37
401
224
21
UK
9
101
301
346
20
Russia
11
52
174
334
9
India
31
28
389
431
3
Argentina
94
67
288
32
13
Brazil
79
59
94
656
20
USA
44
31
149
26
Country
Pts Rand
Sites
Av CPP
Cost Per Country
Ethics Subm
Regulatory Fees
Add Inv Fees
CT Scan Total
Ethics + Regulatory
Total Regulatory Fees
South Africa
25
5
7250
181250
290
460
363
0
750
1113
Canada
18
4
832545
14985818
181818
0
0
1557576
181818
1818
Italy
7
2
10000
70000
2200
0
0
0
2200
2200
Germany
55
10
7000
385000
3000
0
0
12000
3000
3000
Peru
40
5
7000
280000
1500
1000
2000
60000
2500
4500
Poland
15
4
10000
150000
0
2500
2400
0
2500
4900
Spain
40
7
10500
420000
0
0
5450
0
0
5450
UK
12
4
13000
156000
0
0
5556
0
0
5556
Bulgaria
18
4
10000
180000
0
5000
1000
0
5000
6000
Taiwan
20
4
1179649
2359298
104167
313
5208
0
135467
6563
Czech Rep
10
2
10000
100000
1500
3000
3000
0
4500
7500
Greece
40
7
9000
360000
0
7500
0
0
7500
7500
Chile
15
4
10840
162600
1700
3600
3000
0
5300
8300
Belgium
25
6
12200
305000
3992
4332
0
0
8324
8324
Korea
30
3
10827
324802
1114
0
14324
0
1114
15438
Singapore
10
2
11565
115650
1750
0
17975
0
1750
19725
France
50
10
9000
450000
0
0
20000
0
0
20000
China
39
5
4978
194142
5224
0
39814
0
5224
40336
New Zealand
10
3
145244
145244
1973
0
43123
0
1973
45096
Israel
10
6
11140
111400
2060
3000
48400
16500
5060
53460
Brazil
30
6
10000
300000
2000
287356
5649202
0
487356
61366
Australia
24
6
40200
964800
0
500
82500
0
500
83000
23
543
109
532856799
3304716
26939
27700043
73748966
[1753EURO x 14 (ex rate) = $2454] [ $245416 hours=$153hour]
1095625
1095625
12271
1753
198089
198089
208514736842
South Africa
Canada
Italy
Germany
Peru
Poland
Spain
UK
Bulgaria
Taiwan
Czech Rep
Greece
Chile
Belgium
Korea
Singapore
France
China
New Zealand
Israel
Brazil
Australia
31
Euro
0
10000
20000
30000
40000
50000
60000
70000
80000
90000S
outh
Afri
caC
anad
a
Italy
Ger
man
yP
eru
Pol
and
Spa
in UK
Bul
garia
Taiw
anC
zech
Rep
Gre
ece
Chi
leB
elgi
umK
orea
Sin
gapo
reFr
ance
Chi
naN
ew Z
eala
ndIs
rael
Bra
zil
Aus
tralia
Source Bayer Presented SACRA Conference 2009
Eur
os
Regulatory Application Fees
Chart1
Total Regulatory Fees
1113
181818
2200
3000
4500
4900
5450
5556
6000
656267
7500
7500
8300
8324
15438
19725
20000
403364
45096
53460
6136558
83000
Sheet1
Sheet2
Sheet2
Average Cost Per Patient (Euro)
Average Cost Per Patient
Sheet4
Ethics Subm
Regulatory Fees
Sheet3
Ethics + Regulatory
Total Ethics and Regulatory Fees
Add Inv Fees
Additional Investigator Application Fees
Total Regulatory Fees
Study starts
SubjectsStudy
32
SA Clinical Trial Regulatory Processes
Governed by SA-GCP and Declaration of Helsinki SA National Clinical Trials Register (SANCTR) Medicines Control Council (National Regulatory Authority)
o New protocols o Amendments o Additional sitesinvestigators
Ethics Committees (33 NHREC-registered) RegionalMunicipal DoH Export permits for bio samples (Nat Health Act 2003)
Clinical Trial Density Active sites million population
Nature Reviews Drug Discovery 7 13-14 (January 2008)
France 503
Germany 512 Canada
922
USA 1203
Czech Republic 776
553 sites
South Africa 119
757 sites
757 sites
533 sites
1084 sites
Argentina 269
Russia 77
China 04
India 07
34
Gateway to Africa
35
Why Africa bull Large accessible population relatively new to clinical trials
bull Experienced and willing investigators
bull Many clinical trial sites established by PDPs NGOs etc
bull Expanding therapeutic areas shifting burden of disease from
infectious to non-communicable diseases
bull Significantly improved infrastructure and accessibility
bull Rapidly evolving regulatory and ethics procedures
bull Potential for capacity building and sustainable clinical trial potential
36
Relatively young GCP culture Resident mentorships to build capacity Locations ndash accessibility for site monitoring Variable infrastructure esp electricity connectivity and
transportation Resourcing of public healthcare systems
Sub-Saharan Africa challenges
37
bull Second-largest continent
bull Spans NS and EW hemispheres
bull Second most populous continent 2014 estimate 1069 billion
bull Home to more than a quarter of the 196 independent countries
bull All 54 African countries are UN members
bull 39 urban population
bull 12 metropolitan areas gt 4m
bull gt 3000 distinct ethnicities
bull gt 2000 languages spoken
AFRICA hellip the true size
wwwcitypopulationdeworldAgglomerations 2015
38
SSV to SIV
0
5
10
15
20
25
30
35
40
45
Africa North America
Asia Pacific
Western Europe
Eastern Europe
Latin America
Source Quintiles South Africa SACRA Conference 2008
Wee
ks (A
vera
ge)
Start-Up Timelines
39
Region Median
Patients Site
of Sites
0 pts 1 - 3 pts 4 - 9 pts 10+ pts
Latin America 40 21 26 30 23
North America 30 29 29 24 18
Eastern Europe 60 15 31 26 27
Western Europe 40 15 22 29 34
Asia Pacific 40 19 30 34 18
Africa 100 4 17 28 51
Enrollment performance by region for 2008
Site Performance
Source Quintiles South Africa Presented SACRA Conference 2009
40
0 1 2 3 4 5 6 7 8 9
10
Latin America
North America
Eastern Europe
Western Europe
Asia Pacific
Africa
Num
ber o
f par
ticip
ants
MEDIAN site enrollment by region for 2008
Source Quintiles South Africa Presented SACRA Conference 2009
Site Performance
41
Source Quintiles South Africa Presented SACRA Conference 2009
s
ites
0
5
10
15
20
25
30
35
40
45
50
LatinAmerica
NorthAmerica
EasternEurope
WesternEurope
Asia Pacific Africa
0 pts
1 - 3 pts
4 - 9 pts
10+ pts
Enrollment performance by region for 2008
Site Performance
Chart1
0 pts
1 - 3 pts
4 - 9 pts
10+ pts
021
026
03
023
029
029
024
018
015
031
026
027
015
022
029
034
019
03
034
018
004
017
028
051
HIV
HIV
Resiratory amp Cancer
Male prevalence
Female prevalence
CVS
Overall death rates
Overall death rates
COPD
Asthma
Tracheabronchial lung cancer
Oesophageal cancer
prostate cancer
Trial metrics
COPD
Asthma
Tracheabronchial lung cancer
Oesophageal cancer
Prostate cancer
Cervical cancer
Breast cancer
Stroke
ill-defined heart disease
Diabetes mellitus
Ischaemic heart disease
Hypertension
Nephritisnephrosis
Stroke
ill-defined heart disease
Diabetes mellitus
Ischaemic heart disease
Hypertension
Nephritisnephrosis
Males
Female
UN - Male
SA 1997
SA 2004
UN - Female
SA 1997
SA 2004
0 pts
1 - 3 pts
4 - 9 pts
10+ pts
42
Source wwwclinicaltrialsgov 22-Oct-2010
Clinical trials registered across Africa
43
0
500
1000
1500
2000
2500
South Africa Kenya Malawi Tanzania Uganda Zambia
Selected African countries
2005
2010
2015
Source ClinTrialsgov
Trend 2005 - 2015
Source wwwclinicaltrialsgov 28-Aug-2015
44
AFRICA FOUND IN TRANSLATION
bull Vast treatment-naiumlve population bull Cost advantages (still) bull Diverse ethnicity amp morbidity bull Inverse seasonality bull Site capacity-building widely implemented bull Robust regulatory review bull Variable but generally good regulatory timelines bull Established GCP culture ndash sites and home-bred CROs
45
THANK YOU
Foliennummer 1
Triclinium A South African CRO
Collaboration with VPM SII
Vaccine Trials in SA 2015
Foliennummer 5
Foliennummer 6
Foliennummer 7
Foliennummer 8
Foliennummer 9
Foliennummer 10
Foliennummer 11
Foliennummer 12
Foliennummer 13
Foliennummer 14
Foliennummer 15
Foliennummer 16
Foliennummer 17
Distribution of clinical trial sites
Foliennummer 19
South Africa Leading Causes of Death
Foliennummer 21
Foliennummer 22
South Africa TB deaths by age group
Foliennummer 24
Foliennummer 25
Foliennummer 26
Foliennummer 27
Foliennummer 28
Foliennummer 29
Foliennummer 30
Foliennummer 31
SA Clinical Trial Regulatory Processes
Clinical Trial Density Active sites million population
Foliennummer 34
Why Africa
Foliennummer 36
AFRICA hellip the true size
SSV to SIV
Foliennummer 39
Foliennummer 40
Foliennummer 41
Foliennummer 42
Foliennummer 43
AFRICA FOUND IN TRANSLATION
Foliennummer 45
Region
Median
of Sites
Patients Site
0 pts
1 - 3 pts
4 - 9 pts
10+ pts
Latin America
4
21
26
30
23
North America
3
29
29
24
18
Eastern Europe
6
15
31
26
27
Western Europe
4
15
22
29
34
Asia Pacific
4
19
30
34
18
Africa
10
4
17
28
51
0 pts
1 - 3 pts
4 - 9 pts
10+ pts
Latin America
21
26
30
23
North America
29
29
24
18
Eastern Europe
15
31
26
27
Western Europe
15
22
29
34
Asia Pacific
19
30
34
18
Africa
4
17
28
51
Males
Female
15-19
210
150
20-24
340
205
25-29
395
300
30-34
460
360
35-39
600
405
40-44
800
500
45-49
1100
700
50-54
1600
1050
55-54
2300
1580
60-64
3340
2250
UN - Male
SA 1997
SA 2004
UN - Female
SA 1997
SA 2004
15-19
210
235
216
150
165
187
20-24
340
381
555
205
331
1085
25-29
395
625
1081
300
452
1985
30-34
460
817
2118
360
489
2267
35-39
600
916
2498
405
526
1890
40-44
800
1136
2765
500
615
1548
45-49
1100
1486
2744
700
800
1400
50-54
1600
2016
2979
1050
1116
1506
55-54
2300
2838
3270
1580
1626
1717
60-64
3340
3614
4146
2250
2201
2360
Stroke
ill-defined heart disease
Diabetes mellitus
Ischaemic heart disease
Hypertension
Nephritisnephrosis
Stroke
ill-defined heart disease
Diabetes mellitus
Ischaemic heart disease
Hypertension
Nephritisnephrosis
1999
34
345
20
248
14
10
1999
295
246
23
10
145
68
2000
36
362
218
249
152
112
2000
318
268
241
108
16
8
2001
35
372
22
25
15
125
2001
322
28
252
102
162
95
2002
405
298
24
26
147
126
2002
352
295
27
115
16
10
2003
425
32
245
285
152
15
2003
382
299
285
122
17
12
2004
39
325
255
26
165
16
2004
35
30
295
121
19
119
2005
36
328
265
26
15
162
2005
325
30
32
12
18
12
2006
35
336
27
258
155
16
2006
33
32
32
11
18
125
COPD
Asthma
Tracheabronchial lung cancer
Oesophageal cancer
prostate cancer
Cervical cancer
Breast cancer
1999
2001
12
135
10
26
2000
204
116
13
92
28
2001
222
131
133
96
27
2002
23
144
128
95
285
2003
243
149
124
94
29
2004
229
154
1255
87
29
2005
224
152
122
82
295
2006
224
136
116
75
3
COPD
Asthma
Tracheabronchial lung cancer
Oesophageal cancer
Prostate cancer
Cervical cancer
Breast cancer
1999
88
92
43
41
106
82
2000
96
95
4
43
11
81
2001
10
109
4
4
111
89
2002
10
116
4
4
112
85
2003
11
124
4
395
116
85
2004
102
1295
44
39
115
101
2005
105
128
42
38
1185
10
2006
10
12
42
32
1205
10
Based on this survey the researchers estimate that 109 of all South Africans over 2 years old were living with HIV in 2008 In 2002 and 2005 this figure was 114 and 108 respectively showing a degree of stabilisation Among those between 15 and 49 years old the estimated HIV prevalence was 169 in 2008 The survey found the prevalence among children aged 2-14 to be 25 down significantly since 2002 when prevalence was 56
Estimated HIV prevalence () among South Africans aged 2 years and older by age 2002-2008
Age
HIV +
HIV -
Children (2-14 years)
25
975
Youth (15-24 years)
87
913
Adults (25 and older)
168
832
(15-49 years)
169
831
Total (2 and older)
109
891
Estimated HIV prevalence among South Africans by age and sex 2008
Age
Male prevalence
Female prevalence
2-14
3
2
15-19
25
67
20-24
51
211
25-29
157
327
30-34
258
291
35-39
185
248
40-44
192
163
45-49
64
141
50-54
104
102
55-59
62
77
60+
35
18
Total
79
136
Among females HIV prevalence is highest in those between 25 and 29 years old among males the peak is in the group aged 30-34 years
HIV prevalence () by province 2002-2008
Province
2002
2005
2008
KwaZulu-Natal
117
165
158
Mpumalanga
141
152
154
Free State
149
126
126
North West
103
109
113
Gauteng
147
108
103
Eastern Cape
66
89
9
Limpopo
98
8
88
Northern Cape
84
54
59
Western Cape
107
19
38
National
114
108
109
The results of this study suggest that KwaZulu-Natal Mpumulanga and Free State have the highest HIV prevalence However the relatively small sample sizes may limit precision and in several cases the ranges of uncertainty overlap
HIV prevalence by population group 2008
Population group
Prevalence ()
African
136
864
White
03
997
Coloured
17
983
Indian
03
997
Studies of AIDS deaths
Latin America
Latin America
Latin America
Latin America
North America
North America
North America
North America
Eastern Europe
Eastern Europe
Eastern Europe
Eastern Europe
Western Europe
Western Europe
Western Europe
Western Europe
Asia Pacific
Asia Pacific
Asia Pacific
Asia Pacific
Africa
Africa
Africa
Africa
Country
Study starts
Subjects randomised
SubjectsStudy
USA
32
4385
13703125
Russia
20
788
394
Germany
19
1883
991052631579
UK
13
265
203846153846
South Africa
12
347
289166666667
Argentina
12
329
274166666667
Australia
11
195
177272727273
India
7
275
392857142857
Brazil
3
115
383333333333
Country
Initiation
Site activation
Recruitment
LOC setup
Unproductive sites
(Approval ndash FCI)
(FCI ndash FSFV)
(FSFV ndash LSFV)
(CPC ndash FSFV)
South Africa
19
38
153
357
21
Australia
117
63
401
239
11
Germany
16
37
401
224
21
UK
9
101
301
346
20
Russia
11
52
174
334
9
India
31
28
389
431
3
Argentina
94
67
288
32
13
Brazil
79
59
94
656
20
USA
44
31
149
26
Country
Pts Rand
Sites
Av CPP
Cost Per Country
Ethics Subm
Regulatory Fees
Add Inv Fees
CT Scan Total
Ethics + Regulatory
Total Regulatory Fees
South Africa
25
5
7250
181250
290
460
363
0
750
1113
Canada
18
4
832545
14985818
181818
0
0
1557576
181818
1818
Italy
7
2
10000
70000
2200
0
0
0
2200
2200
Germany
55
10
7000
385000
3000
0
0
12000
3000
3000
Peru
40
5
7000
280000
1500
1000
2000
60000
2500
4500
Poland
15
4
10000
150000
0
2500
2400
0
2500
4900
Spain
40
7
10500
420000
0
0
5450
0
0
5450
UK
12
4
13000
156000
0
0
5556
0
0
5556
Bulgaria
18
4
10000
180000
0
5000
1000
0
5000
6000
Taiwan
20
4
1179649
2359298
104167
313
5208
0
135467
6563
Czech Rep
10
2
10000
100000
1500
3000
3000
0
4500
7500
Greece
40
7
9000
360000
0
7500
0
0
7500
7500
Chile
15
4
10840
162600
1700
3600
3000
0
5300
8300
Belgium
25
6
12200
305000
3992
4332
0
0
8324
8324
Korea
30
3
10827
324802
1114
0
14324
0
1114
15438
Singapore
10
2
11565
115650
1750
0
17975
0
1750
19725
France
50
10
9000
450000
0
0
20000
0
0
20000
China
39
5
4978
194142
5224
0
39814
0
5224
40336
New Zealand
10
3
145244
145244
1973
0
43123
0
1973
45096
Israel
10
6
11140
111400
2060
3000
48400
16500
5060
53460
Brazil
30
6
10000
300000
2000
287356
5649202
0
487356
61366
Australia
24
6
40200
964800
0
500
82500
0
500
83000
23
543
109
532856799
3304716
26939
27700043
73748966
[1753EURO x 14 (ex rate) = $2454] [ $245416 hours=$153hour]
1095625
1095625
12271
1753
198089
198089
208514736842
South Africa
Canada
Italy
Germany
Peru
Poland
Spain
UK
Bulgaria
Taiwan
Czech Rep
Greece
Chile
Belgium
Korea
Singapore
France
China
New Zealand
Israel
Brazil
Australia
Chart1
Total Regulatory Fees
1113
181818
2200
3000
4500
4900
5450
5556
6000
656267
7500
7500
8300
8324
15438
19725
20000
403364
45096
53460
6136558
83000
Sheet1
Sheet2
Sheet2
Average Cost Per Patient (Euro)
Average Cost Per Patient
Sheet4
Ethics Subm
Regulatory Fees
Sheet3
Ethics + Regulatory
Total Ethics and Regulatory Fees
Add Inv Fees
Additional Investigator Application Fees
Total Regulatory Fees
Study starts
SubjectsStudy
32
SA Clinical Trial Regulatory Processes
Governed by SA-GCP and Declaration of Helsinki SA National Clinical Trials Register (SANCTR) Medicines Control Council (National Regulatory Authority)
o New protocols o Amendments o Additional sitesinvestigators
Ethics Committees (33 NHREC-registered) RegionalMunicipal DoH Export permits for bio samples (Nat Health Act 2003)
Clinical Trial Density Active sites million population
Nature Reviews Drug Discovery 7 13-14 (January 2008)
France 503
Germany 512 Canada
922
USA 1203
Czech Republic 776
553 sites
South Africa 119
757 sites
757 sites
533 sites
1084 sites
Argentina 269
Russia 77
China 04
India 07
34
Gateway to Africa
35
Why Africa bull Large accessible population relatively new to clinical trials
bull Experienced and willing investigators
bull Many clinical trial sites established by PDPs NGOs etc
bull Expanding therapeutic areas shifting burden of disease from
infectious to non-communicable diseases
bull Significantly improved infrastructure and accessibility
bull Rapidly evolving regulatory and ethics procedures
bull Potential for capacity building and sustainable clinical trial potential
36
Relatively young GCP culture Resident mentorships to build capacity Locations ndash accessibility for site monitoring Variable infrastructure esp electricity connectivity and
transportation Resourcing of public healthcare systems
Sub-Saharan Africa challenges
37
bull Second-largest continent
bull Spans NS and EW hemispheres
bull Second most populous continent 2014 estimate 1069 billion
bull Home to more than a quarter of the 196 independent countries
bull All 54 African countries are UN members
bull 39 urban population
bull 12 metropolitan areas gt 4m
bull gt 3000 distinct ethnicities
bull gt 2000 languages spoken
AFRICA hellip the true size
wwwcitypopulationdeworldAgglomerations 2015
38
SSV to SIV
0
5
10
15
20
25
30
35
40
45
Africa North America
Asia Pacific
Western Europe
Eastern Europe
Latin America
Source Quintiles South Africa SACRA Conference 2008
Wee
ks (A
vera
ge)
Start-Up Timelines
39
Region Median
Patients Site
of Sites
0 pts 1 - 3 pts 4 - 9 pts 10+ pts
Latin America 40 21 26 30 23
North America 30 29 29 24 18
Eastern Europe 60 15 31 26 27
Western Europe 40 15 22 29 34
Asia Pacific 40 19 30 34 18
Africa 100 4 17 28 51
Enrollment performance by region for 2008
Site Performance
Source Quintiles South Africa Presented SACRA Conference 2009
40
0 1 2 3 4 5 6 7 8 9
10
Latin America
North America
Eastern Europe
Western Europe
Asia Pacific
Africa
Num
ber o
f par
ticip
ants
MEDIAN site enrollment by region for 2008
Source Quintiles South Africa Presented SACRA Conference 2009
Site Performance
41
Source Quintiles South Africa Presented SACRA Conference 2009
s
ites
0
5
10
15
20
25
30
35
40
45
50
LatinAmerica
NorthAmerica
EasternEurope
WesternEurope
Asia Pacific Africa
0 pts
1 - 3 pts
4 - 9 pts
10+ pts
Enrollment performance by region for 2008
Site Performance
Chart1
0 pts
1 - 3 pts
4 - 9 pts
10+ pts
021
026
03
023
029
029
024
018
015
031
026
027
015
022
029
034
019
03
034
018
004
017
028
051
HIV
HIV
Resiratory amp Cancer
Male prevalence
Female prevalence
CVS
Overall death rates
Overall death rates
COPD
Asthma
Tracheabronchial lung cancer
Oesophageal cancer
prostate cancer
Trial metrics
COPD
Asthma
Tracheabronchial lung cancer
Oesophageal cancer
Prostate cancer
Cervical cancer
Breast cancer
Stroke
ill-defined heart disease
Diabetes mellitus
Ischaemic heart disease
Hypertension
Nephritisnephrosis
Stroke
ill-defined heart disease
Diabetes mellitus
Ischaemic heart disease
Hypertension
Nephritisnephrosis
Males
Female
UN - Male
SA 1997
SA 2004
UN - Female
SA 1997
SA 2004
0 pts
1 - 3 pts
4 - 9 pts
10+ pts
42
Source wwwclinicaltrialsgov 22-Oct-2010
Clinical trials registered across Africa
43
0
500
1000
1500
2000
2500
South Africa Kenya Malawi Tanzania Uganda Zambia
Selected African countries
2005
2010
2015
Source ClinTrialsgov
Trend 2005 - 2015
Source wwwclinicaltrialsgov 28-Aug-2015
44
AFRICA FOUND IN TRANSLATION
bull Vast treatment-naiumlve population bull Cost advantages (still) bull Diverse ethnicity amp morbidity bull Inverse seasonality bull Site capacity-building widely implemented bull Robust regulatory review bull Variable but generally good regulatory timelines bull Established GCP culture ndash sites and home-bred CROs
45
THANK YOU
Foliennummer 1
Triclinium A South African CRO
Collaboration with VPM SII
Vaccine Trials in SA 2015
Foliennummer 5
Foliennummer 6
Foliennummer 7
Foliennummer 8
Foliennummer 9
Foliennummer 10
Foliennummer 11
Foliennummer 12
Foliennummer 13
Foliennummer 14
Foliennummer 15
Foliennummer 16
Foliennummer 17
Distribution of clinical trial sites
Foliennummer 19
South Africa Leading Causes of Death
Foliennummer 21
Foliennummer 22
South Africa TB deaths by age group
Foliennummer 24
Foliennummer 25
Foliennummer 26
Foliennummer 27
Foliennummer 28
Foliennummer 29
Foliennummer 30
Foliennummer 31
SA Clinical Trial Regulatory Processes
Clinical Trial Density Active sites million population
Foliennummer 34
Why Africa
Foliennummer 36
AFRICA hellip the true size
SSV to SIV
Foliennummer 39
Foliennummer 40
Foliennummer 41
Foliennummer 42
Foliennummer 43
AFRICA FOUND IN TRANSLATION
Foliennummer 45
Region
Median
of Sites
Patients Site
0 pts
1 - 3 pts
4 - 9 pts
10+ pts
Latin America
4
21
26
30
23
North America
3
29
29
24
18
Eastern Europe
6
15
31
26
27
Western Europe
4
15
22
29
34
Asia Pacific
4
19
30
34
18
Africa
10
4
17
28
51
0 pts
1 - 3 pts
4 - 9 pts
10+ pts
Latin America
21
26
30
23
North America
29
29
24
18
Eastern Europe
15
31
26
27
Western Europe
15
22
29
34
Asia Pacific
19
30
34
18
Africa
4
17
28
51
Males
Female
15-19
210
150
20-24
340
205
25-29
395
300
30-34
460
360
35-39
600
405
40-44
800
500
45-49
1100
700
50-54
1600
1050
55-54
2300
1580
60-64
3340
2250
UN - Male
SA 1997
SA 2004
UN - Female
SA 1997
SA 2004
15-19
210
235
216
150
165
187
20-24
340
381
555
205
331
1085
25-29
395
625
1081
300
452
1985
30-34
460
817
2118
360
489
2267
35-39
600
916
2498
405
526
1890
40-44
800
1136
2765
500
615
1548
45-49
1100
1486
2744
700
800
1400
50-54
1600
2016
2979
1050
1116
1506
55-54
2300
2838
3270
1580
1626
1717
60-64
3340
3614
4146
2250
2201
2360
Stroke
ill-defined heart disease
Diabetes mellitus
Ischaemic heart disease
Hypertension
Nephritisnephrosis
Stroke
ill-defined heart disease
Diabetes mellitus
Ischaemic heart disease
Hypertension
Nephritisnephrosis
1999
34
345
20
248
14
10
1999
295
246
23
10
145
68
2000
36
362
218
249
152
112
2000
318
268
241
108
16
8
2001
35
372
22
25
15
125
2001
322
28
252
102
162
95
2002
405
298
24
26
147
126
2002
352
295
27
115
16
10
2003
425
32
245
285
152
15
2003
382
299
285
122
17
12
2004
39
325
255
26
165
16
2004
35
30
295
121
19
119
2005
36
328
265
26
15
162
2005
325
30
32
12
18
12
2006
35
336
27
258
155
16
2006
33
32
32
11
18
125
COPD
Asthma
Tracheabronchial lung cancer
Oesophageal cancer
prostate cancer
Cervical cancer
Breast cancer
1999
2001
12
135
10
26
2000
204
116
13
92
28
2001
222
131
133
96
27
2002
23
144
128
95
285
2003
243
149
124
94
29
2004
229
154
1255
87
29
2005
224
152
122
82
295
2006
224
136
116
75
3
COPD
Asthma
Tracheabronchial lung cancer
Oesophageal cancer
Prostate cancer
Cervical cancer
Breast cancer
1999
88
92
43
41
106
82
2000
96
95
4
43
11
81
2001
10
109
4
4
111
89
2002
10
116
4
4
112
85
2003
11
124
4
395
116
85
2004
102
1295
44
39
115
101
2005
105
128
42
38
1185
10
2006
10
12
42
32
1205
10
Based on this survey the researchers estimate that 109 of all South Africans over 2 years old were living with HIV in 2008 In 2002 and 2005 this figure was 114 and 108 respectively showing a degree of stabilisation Among those between 15 and 49 years old the estimated HIV prevalence was 169 in 2008 The survey found the prevalence among children aged 2-14 to be 25 down significantly since 2002 when prevalence was 56
Estimated HIV prevalence () among South Africans aged 2 years and older by age 2002-2008
Age
HIV +
HIV -
Children (2-14 years)
25
975
Youth (15-24 years)
87
913
Adults (25 and older)
168
832
(15-49 years)
169
831
Total (2 and older)
109
891
Estimated HIV prevalence among South Africans by age and sex 2008
Age
Male prevalence
Female prevalence
2-14
3
2
15-19
25
67
20-24
51
211
25-29
157
327
30-34
258
291
35-39
185
248
40-44
192
163
45-49
64
141
50-54
104
102
55-59
62
77
60+
35
18
Total
79
136
Among females HIV prevalence is highest in those between 25 and 29 years old among males the peak is in the group aged 30-34 years
HIV prevalence () by province 2002-2008
Province
2002
2005
2008
KwaZulu-Natal
117
165
158
Mpumalanga
141
152
154
Free State
149
126
126
North West
103
109
113
Gauteng
147
108
103
Eastern Cape
66
89
9
Limpopo
98
8
88
Northern Cape
84
54
59
Western Cape
107
19
38
National
114
108
109
The results of this study suggest that KwaZulu-Natal Mpumulanga and Free State have the highest HIV prevalence However the relatively small sample sizes may limit precision and in several cases the ranges of uncertainty overlap
HIV prevalence by population group 2008
Population group
Prevalence ()
African
136
864
White
03
997
Coloured
17
983
Indian
03
997
Studies of AIDS deaths
Latin America
Latin America
Latin America
Latin America
North America
North America
North America
North America
Eastern Europe
Eastern Europe
Eastern Europe
Eastern Europe
Western Europe
Western Europe
Western Europe
Western Europe
Asia Pacific
Asia Pacific
Asia Pacific
Asia Pacific
Africa
Africa
Africa
Africa
Country
Study starts
Subjects randomised
SubjectsStudy
USA
32
4385
13703125
Russia
20
788
394
Germany
19
1883
991052631579
UK
13
265
203846153846
South Africa
12
347
289166666667
Argentina
12
329
274166666667
Australia
11
195
177272727273
India
7
275
392857142857
Brazil
3
115
383333333333
Country
Initiation
Site activation
Recruitment
LOC setup
Unproductive sites
(Approval ndash FCI)
(FCI ndash FSFV)
(FSFV ndash LSFV)
(CPC ndash FSFV)
South Africa
19
38
153
357
21
Australia
117
63
401
239
11
Germany
16
37
401
224
21
UK
9
101
301
346
20
Russia
11
52
174
334
9
India
31
28
389
431
3
Argentina
94
67
288
32
13
Brazil
79
59
94
656
20
USA
44
31
149
26
Country
Pts Rand
Sites
Av CPP
Cost Per Country
Ethics Subm
Regulatory Fees
Add Inv Fees
CT Scan Total
Ethics + Regulatory
Total Regulatory Fees
South Africa
25
5
7250
181250
290
460
363
0
750
1113
Canada
18
4
832545
14985818
181818
0
0
1557576
181818
1818
Italy
7
2
10000
70000
2200
0
0
0
2200
2200
Germany
55
10
7000
385000
3000
0
0
12000
3000
3000
Peru
40
5
7000
280000
1500
1000
2000
60000
2500
4500
Poland
15
4
10000
150000
0
2500
2400
0
2500
4900
Spain
40
7
10500
420000
0
0
5450
0
0
5450
UK
12
4
13000
156000
0
0
5556
0
0
5556
Bulgaria
18
4
10000
180000
0
5000
1000
0
5000
6000
Taiwan
20
4
1179649
2359298
104167
313
5208
0
135467
6563
Czech Rep
10
2
10000
100000
1500
3000
3000
0
4500
7500
Greece
40
7
9000
360000
0
7500
0
0
7500
7500
Chile
15
4
10840
162600
1700
3600
3000
0
5300
8300
Belgium
25
6
12200
305000
3992
4332
0
0
8324
8324
Korea
30
3
10827
324802
1114
0
14324
0
1114
15438
Singapore
10
2
11565
115650
1750
0
17975
0
1750
19725
France
50
10
9000
450000
0
0
20000
0
0
20000
China
39
5
4978
194142
5224
0
39814
0
5224
40336
New Zealand
10
3
145244
145244
1973
0
43123
0
1973
45096
Israel
10
6
11140
111400
2060
3000
48400
16500
5060
53460
Brazil
30
6
10000
300000
2000
287356
5649202
0
487356
61366
Australia
24
6
40200
964800
0
500
82500
0
500
83000
23
543
109
532856799
3304716
26939
27700043
73748966
[1753EURO x 14 (ex rate) = $2454] [ $245416 hours=$153hour]
1095625
1095625
12271
1753
198089
198089
208514736842
South Africa
Canada
Italy
Germany
Peru
Poland
Spain
UK
Bulgaria
Taiwan
Czech Rep
Greece
Chile
Belgium
Korea
Singapore
France
China
New Zealand
Israel
Brazil
Australia
Sheet1
Sheet2
Sheet2
Average Cost Per Patient (Euro)
Average Cost Per Patient
Sheet4
Ethics Subm
Regulatory Fees
Sheet3
Ethics + Regulatory
Total Ethics and Regulatory Fees
Add Inv Fees
Additional Investigator Application Fees
Total Regulatory Fees
Study starts
SubjectsStudy
32
SA Clinical Trial Regulatory Processes
Governed by SA-GCP and Declaration of Helsinki SA National Clinical Trials Register (SANCTR) Medicines Control Council (National Regulatory Authority)
o New protocols o Amendments o Additional sitesinvestigators
Ethics Committees (33 NHREC-registered) RegionalMunicipal DoH Export permits for bio samples (Nat Health Act 2003)
Clinical Trial Density Active sites million population
Nature Reviews Drug Discovery 7 13-14 (January 2008)
France 503
Germany 512 Canada
922
USA 1203
Czech Republic 776
553 sites
South Africa 119
757 sites
757 sites
533 sites
1084 sites
Argentina 269
Russia 77
China 04
India 07
34
Gateway to Africa
35
Why Africa bull Large accessible population relatively new to clinical trials
bull Experienced and willing investigators
bull Many clinical trial sites established by PDPs NGOs etc
bull Expanding therapeutic areas shifting burden of disease from
infectious to non-communicable diseases
bull Significantly improved infrastructure and accessibility
bull Rapidly evolving regulatory and ethics procedures
bull Potential for capacity building and sustainable clinical trial potential
36
Relatively young GCP culture Resident mentorships to build capacity Locations ndash accessibility for site monitoring Variable infrastructure esp electricity connectivity and
transportation Resourcing of public healthcare systems
Sub-Saharan Africa challenges
37
bull Second-largest continent
bull Spans NS and EW hemispheres
bull Second most populous continent 2014 estimate 1069 billion
bull Home to more than a quarter of the 196 independent countries
bull All 54 African countries are UN members
bull 39 urban population
bull 12 metropolitan areas gt 4m
bull gt 3000 distinct ethnicities
bull gt 2000 languages spoken
AFRICA hellip the true size
wwwcitypopulationdeworldAgglomerations 2015
38
SSV to SIV
0
5
10
15
20
25
30
35
40
45
Africa North America
Asia Pacific
Western Europe
Eastern Europe
Latin America
Source Quintiles South Africa SACRA Conference 2008
Wee
ks (A
vera
ge)
Start-Up Timelines
39
Region Median
Patients Site
of Sites
0 pts 1 - 3 pts 4 - 9 pts 10+ pts
Latin America 40 21 26 30 23
North America 30 29 29 24 18
Eastern Europe 60 15 31 26 27
Western Europe 40 15 22 29 34
Asia Pacific 40 19 30 34 18
Africa 100 4 17 28 51
Enrollment performance by region for 2008
Site Performance
Source Quintiles South Africa Presented SACRA Conference 2009
40
0 1 2 3 4 5 6 7 8 9
10
Latin America
North America
Eastern Europe
Western Europe
Asia Pacific
Africa
Num
ber o
f par
ticip
ants
MEDIAN site enrollment by region for 2008
Source Quintiles South Africa Presented SACRA Conference 2009
Site Performance
41
Source Quintiles South Africa Presented SACRA Conference 2009
s
ites
0
5
10
15
20
25
30
35
40
45
50
LatinAmerica
NorthAmerica
EasternEurope
WesternEurope
Asia Pacific Africa
0 pts
1 - 3 pts
4 - 9 pts
10+ pts
Enrollment performance by region for 2008
Site Performance
Chart1
0 pts
1 - 3 pts
4 - 9 pts
10+ pts
021
026
03
023
029
029
024
018
015
031
026
027
015
022
029
034
019
03
034
018
004
017
028
051
HIV
HIV
Resiratory amp Cancer
Male prevalence
Female prevalence
CVS
Overall death rates
Overall death rates
COPD
Asthma
Tracheabronchial lung cancer
Oesophageal cancer
prostate cancer
Trial metrics
COPD
Asthma
Tracheabronchial lung cancer
Oesophageal cancer
Prostate cancer
Cervical cancer
Breast cancer
Stroke
ill-defined heart disease
Diabetes mellitus
Ischaemic heart disease
Hypertension
Nephritisnephrosis
Stroke
ill-defined heart disease
Diabetes mellitus
Ischaemic heart disease
Hypertension
Nephritisnephrosis
Males
Female
UN - Male
SA 1997
SA 2004
UN - Female
SA 1997
SA 2004
0 pts
1 - 3 pts
4 - 9 pts
10+ pts
42
Source wwwclinicaltrialsgov 22-Oct-2010
Clinical trials registered across Africa
43
0
500
1000
1500
2000
2500
South Africa Kenya Malawi Tanzania Uganda Zambia
Selected African countries
2005
2010
2015
Source ClinTrialsgov
Trend 2005 - 2015
Source wwwclinicaltrialsgov 28-Aug-2015
44
AFRICA FOUND IN TRANSLATION
bull Vast treatment-naiumlve population bull Cost advantages (still) bull Diverse ethnicity amp morbidity bull Inverse seasonality bull Site capacity-building widely implemented bull Robust regulatory review bull Variable but generally good regulatory timelines bull Established GCP culture ndash sites and home-bred CROs
45
THANK YOU
Foliennummer 1
Triclinium A South African CRO
Collaboration with VPM SII
Vaccine Trials in SA 2015
Foliennummer 5
Foliennummer 6
Foliennummer 7
Foliennummer 8
Foliennummer 9
Foliennummer 10
Foliennummer 11
Foliennummer 12
Foliennummer 13
Foliennummer 14
Foliennummer 15
Foliennummer 16
Foliennummer 17
Distribution of clinical trial sites
Foliennummer 19
South Africa Leading Causes of Death
Foliennummer 21
Foliennummer 22
South Africa TB deaths by age group
Foliennummer 24
Foliennummer 25
Foliennummer 26
Foliennummer 27
Foliennummer 28
Foliennummer 29
Foliennummer 30
Foliennummer 31
SA Clinical Trial Regulatory Processes
Clinical Trial Density Active sites million population
Foliennummer 34
Why Africa
Foliennummer 36
AFRICA hellip the true size
SSV to SIV
Foliennummer 39
Foliennummer 40
Foliennummer 41
Foliennummer 42
Foliennummer 43
AFRICA FOUND IN TRANSLATION
Foliennummer 45
Region
Median
of Sites
Patients Site
0 pts
1 - 3 pts
4 - 9 pts
10+ pts
Latin America
4
21
26
30
23
North America
3
29
29
24
18
Eastern Europe
6
15
31
26
27
Western Europe
4
15
22
29
34
Asia Pacific
4
19
30
34
18
Africa
10
4
17
28
51
0 pts
1 - 3 pts
4 - 9 pts
10+ pts
Latin America
21
26
30
23
North America
29
29
24
18
Eastern Europe
15
31
26
27
Western Europe
15
22
29
34
Asia Pacific
19
30
34
18
Africa
4
17
28
51
Males
Female
15-19
210
150
20-24
340
205
25-29
395
300
30-34
460
360
35-39
600
405
40-44
800
500
45-49
1100
700
50-54
1600
1050
55-54
2300
1580
60-64
3340
2250
UN - Male
SA 1997
SA 2004
UN - Female
SA 1997
SA 2004
15-19
210
235
216
150
165
187
20-24
340
381
555
205
331
1085
25-29
395
625
1081
300
452
1985
30-34
460
817
2118
360
489
2267
35-39
600
916
2498
405
526
1890
40-44
800
1136
2765
500
615
1548
45-49
1100
1486
2744
700
800
1400
50-54
1600
2016
2979
1050
1116
1506
55-54
2300
2838
3270
1580
1626
1717
60-64
3340
3614
4146
2250
2201
2360
Stroke
ill-defined heart disease
Diabetes mellitus
Ischaemic heart disease
Hypertension
Nephritisnephrosis
Stroke
ill-defined heart disease
Diabetes mellitus
Ischaemic heart disease
Hypertension
Nephritisnephrosis
1999
34
345
20
248
14
10
1999
295
246
23
10
145
68
2000
36
362
218
249
152
112
2000
318
268
241
108
16
8
2001
35
372
22
25
15
125
2001
322
28
252
102
162
95
2002
405
298
24
26
147
126
2002
352
295
27
115
16
10
2003
425
32
245
285
152
15
2003
382
299
285
122
17
12
2004
39
325
255
26
165
16
2004
35
30
295
121
19
119
2005
36
328
265
26
15
162
2005
325
30
32
12
18
12
2006
35
336
27
258
155
16
2006
33
32
32
11
18
125
COPD
Asthma
Tracheabronchial lung cancer
Oesophageal cancer
prostate cancer
Cervical cancer
Breast cancer
1999
2001
12
135
10
26
2000
204
116
13
92
28
2001
222
131
133
96
27
2002
23
144
128
95
285
2003
243
149
124
94
29
2004
229
154
1255
87
29
2005
224
152
122
82
295
2006
224
136
116
75
3
COPD
Asthma
Tracheabronchial lung cancer
Oesophageal cancer
Prostate cancer
Cervical cancer
Breast cancer
1999
88
92
43
41
106
82
2000
96
95
4
43
11
81
2001
10
109
4
4
111
89
2002
10
116
4
4
112
85
2003
11
124
4
395
116
85
2004
102
1295
44
39
115
101
2005
105
128
42
38
1185
10
2006
10
12
42
32
1205
10
Based on this survey the researchers estimate that 109 of all South Africans over 2 years old were living with HIV in 2008 In 2002 and 2005 this figure was 114 and 108 respectively showing a degree of stabilisation Among those between 15 and 49 years old the estimated HIV prevalence was 169 in 2008 The survey found the prevalence among children aged 2-14 to be 25 down significantly since 2002 when prevalence was 56
Estimated HIV prevalence () among South Africans aged 2 years and older by age 2002-2008
Age
HIV +
HIV -
Children (2-14 years)
25
975
Youth (15-24 years)
87
913
Adults (25 and older)
168
832
(15-49 years)
169
831
Total (2 and older)
109
891
Estimated HIV prevalence among South Africans by age and sex 2008
Age
Male prevalence
Female prevalence
2-14
3
2
15-19
25
67
20-24
51
211
25-29
157
327
30-34
258
291
35-39
185
248
40-44
192
163
45-49
64
141
50-54
104
102
55-59
62
77
60+
35
18
Total
79
136
Among females HIV prevalence is highest in those between 25 and 29 years old among males the peak is in the group aged 30-34 years
HIV prevalence () by province 2002-2008
Province
2002
2005
2008
KwaZulu-Natal
117
165
158
Mpumalanga
141
152
154
Free State
149
126
126
North West
103
109
113
Gauteng
147
108
103
Eastern Cape
66
89
9
Limpopo
98
8
88
Northern Cape
84
54
59
Western Cape
107
19
38
National
114
108
109
The results of this study suggest that KwaZulu-Natal Mpumulanga and Free State have the highest HIV prevalence However the relatively small sample sizes may limit precision and in several cases the ranges of uncertainty overlap
HIV prevalence by population group 2008
Population group
Prevalence ()
African
136
864
White
03
997
Coloured
17
983
Indian
03
997
Studies of AIDS deaths
Latin America
Latin America
Latin America
Latin America
North America
North America
North America
North America
Eastern Europe
Eastern Europe
Eastern Europe
Eastern Europe
Western Europe
Western Europe
Western Europe
Western Europe
Asia Pacific
Asia Pacific
Asia Pacific
Asia Pacific
Africa
Africa
Africa
Africa
Country
Study starts
Subjects randomised
SubjectsStudy
USA
32
4385
13703125
Russia
20
788
394
Germany
19
1883
991052631579
UK
13
265
203846153846
South Africa
12
347
289166666667
Argentina
12
329
274166666667
Australia
11
195
177272727273
India
7
275
392857142857
Brazil
3
115
383333333333
Country
Initiation
Site activation
Recruitment
LOC setup
Unproductive sites
(Approval ndash FCI)
(FCI ndash FSFV)
(FSFV ndash LSFV)
(CPC ndash FSFV)
South Africa
19
38
153
357
21
Australia
117
63
401
239
11
Germany
16
37
401
224
21
UK
9
101
301
346
20
Russia
11
52
174
334
9
India
31
28
389
431
3
Argentina
94
67
288
32
13
Brazil
79
59
94
656
20
USA
44
31
149
26
Country
Pts Rand
Sites
Av CPP
Cost Per Country
Ethics Subm
Regulatory Fees
Add Inv Fees
CT Scan Total
Ethics + Regulatory
Total Regulatory Fees
South Africa
25
5
7250
181250
290
460
363
0
750
1113
Canada
18
4
832545
14985818
181818
0
0
1557576
181818
1818
Italy
7
2
10000
70000
2200
0
0
0
2200
2200
Germany
55
10
7000
385000
3000
0
0
12000
3000
3000
Peru
40
5
7000
280000
1500
1000
2000
60000
2500
4500
Poland
15
4
10000
150000
0
2500
2400
0
2500
4900
Spain
40
7
10500
420000
0
0
5450
0
0
5450
UK
12
4
13000
156000
0
0
5556
0
0
5556
Bulgaria
18
4
10000
180000
0
5000
1000
0
5000
6000
Taiwan
20
4
1179649
2359298
104167
313
5208
0
135467
6563
Czech Rep
10
2
10000
100000
1500
3000
3000
0
4500
7500
Greece
40
7
9000
360000
0
7500
0
0
7500
7500
Chile
15
4
10840
162600
1700
3600
3000
0
5300
8300
Belgium
25
6
12200
305000
3992
4332
0
0
8324
8324
Korea
30
3
10827
324802
1114
0
14324
0
1114
15438
Singapore
10
2
11565
115650
1750
0
17975
0
1750
19725
France
50
10
9000
450000
0
0
20000
0
0
20000
China
39
5
4978
194142
5224
0
39814
0
5224
40336
New Zealand
10
3
145244
145244
1973
0
43123
0
1973
45096
Israel
10
6
11140
111400
2060
3000
48400
16500
5060
53460
Brazil
30
6
10000
300000
2000
287356
5649202
0
487356
61366
Australia
24
6
40200
964800
0
500
82500
0
500
83000
23
543
109
532856799
3304716
26939
27700043
73748966
[1753EURO x 14 (ex rate) = $2454] [ $245416 hours=$153hour]
1095625
1095625
12271
1753
198089
198089
208514736842
Sheet2
Sheet2
Average Cost Per Patient (Euro)
Average Cost Per Patient
Sheet4
Ethics Subm
Regulatory Fees
Sheet3
Ethics + Regulatory
Total Ethics and Regulatory Fees
Add Inv Fees
Additional Investigator Application Fees
Total Regulatory Fees
Study starts
SubjectsStudy
32
SA Clinical Trial Regulatory Processes
Governed by SA-GCP and Declaration of Helsinki SA National Clinical Trials Register (SANCTR) Medicines Control Council (National Regulatory Authority)
o New protocols o Amendments o Additional sitesinvestigators
Ethics Committees (33 NHREC-registered) RegionalMunicipal DoH Export permits for bio samples (Nat Health Act 2003)
Clinical Trial Density Active sites million population
Nature Reviews Drug Discovery 7 13-14 (January 2008)
France 503
Germany 512 Canada
922
USA 1203
Czech Republic 776
553 sites
South Africa 119
757 sites
757 sites
533 sites
1084 sites
Argentina 269
Russia 77
China 04
India 07
34
Gateway to Africa
35
Why Africa bull Large accessible population relatively new to clinical trials
bull Experienced and willing investigators
bull Many clinical trial sites established by PDPs NGOs etc
bull Expanding therapeutic areas shifting burden of disease from
infectious to non-communicable diseases
bull Significantly improved infrastructure and accessibility
bull Rapidly evolving regulatory and ethics procedures
bull Potential for capacity building and sustainable clinical trial potential
36
Relatively young GCP culture Resident mentorships to build capacity Locations ndash accessibility for site monitoring Variable infrastructure esp electricity connectivity and
transportation Resourcing of public healthcare systems
Sub-Saharan Africa challenges
37
bull Second-largest continent
bull Spans NS and EW hemispheres
bull Second most populous continent 2014 estimate 1069 billion
bull Home to more than a quarter of the 196 independent countries
bull All 54 African countries are UN members
bull 39 urban population
bull 12 metropolitan areas gt 4m
bull gt 3000 distinct ethnicities
bull gt 2000 languages spoken
AFRICA hellip the true size
wwwcitypopulationdeworldAgglomerations 2015
38
SSV to SIV
0
5
10
15
20
25
30
35
40
45
Africa North America
Asia Pacific
Western Europe
Eastern Europe
Latin America
Source Quintiles South Africa SACRA Conference 2008
Wee
ks (A
vera
ge)
Start-Up Timelines
39
Region Median
Patients Site
of Sites
0 pts 1 - 3 pts 4 - 9 pts 10+ pts
Latin America 40 21 26 30 23
North America 30 29 29 24 18
Eastern Europe 60 15 31 26 27
Western Europe 40 15 22 29 34
Asia Pacific 40 19 30 34 18
Africa 100 4 17 28 51
Enrollment performance by region for 2008
Site Performance
Source Quintiles South Africa Presented SACRA Conference 2009
40
0 1 2 3 4 5 6 7 8 9
10
Latin America
North America
Eastern Europe
Western Europe
Asia Pacific
Africa
Num
ber o
f par
ticip
ants
MEDIAN site enrollment by region for 2008
Source Quintiles South Africa Presented SACRA Conference 2009
Site Performance
41
Source Quintiles South Africa Presented SACRA Conference 2009
s
ites
0
5
10
15
20
25
30
35
40
45
50
LatinAmerica
NorthAmerica
EasternEurope
WesternEurope
Asia Pacific Africa
0 pts
1 - 3 pts
4 - 9 pts
10+ pts
Enrollment performance by region for 2008
Site Performance
Chart1
0 pts
1 - 3 pts
4 - 9 pts
10+ pts
021
026
03
023
029
029
024
018
015
031
026
027
015
022
029
034
019
03
034
018
004
017
028
051
HIV
HIV
Resiratory amp Cancer
Male prevalence
Female prevalence
CVS
Overall death rates
Overall death rates
COPD
Asthma
Tracheabronchial lung cancer
Oesophageal cancer
prostate cancer
Trial metrics
COPD
Asthma
Tracheabronchial lung cancer
Oesophageal cancer
Prostate cancer
Cervical cancer
Breast cancer
Stroke
ill-defined heart disease
Diabetes mellitus
Ischaemic heart disease
Hypertension
Nephritisnephrosis
Stroke
ill-defined heart disease
Diabetes mellitus
Ischaemic heart disease
Hypertension
Nephritisnephrosis
Males
Female
UN - Male
SA 1997
SA 2004
UN - Female
SA 1997
SA 2004
0 pts
1 - 3 pts
4 - 9 pts
10+ pts
42
Source wwwclinicaltrialsgov 22-Oct-2010
Clinical trials registered across Africa
43
0
500
1000
1500
2000
2500
South Africa Kenya Malawi Tanzania Uganda Zambia
Selected African countries
2005
2010
2015
Source ClinTrialsgov
Trend 2005 - 2015
Source wwwclinicaltrialsgov 28-Aug-2015
44
AFRICA FOUND IN TRANSLATION
bull Vast treatment-naiumlve population bull Cost advantages (still) bull Diverse ethnicity amp morbidity bull Inverse seasonality bull Site capacity-building widely implemented bull Robust regulatory review bull Variable but generally good regulatory timelines bull Established GCP culture ndash sites and home-bred CROs
45
THANK YOU
Foliennummer 1
Triclinium A South African CRO
Collaboration with VPM SII
Vaccine Trials in SA 2015
Foliennummer 5
Foliennummer 6
Foliennummer 7
Foliennummer 8
Foliennummer 9
Foliennummer 10
Foliennummer 11
Foliennummer 12
Foliennummer 13
Foliennummer 14
Foliennummer 15
Foliennummer 16
Foliennummer 17
Distribution of clinical trial sites
Foliennummer 19
South Africa Leading Causes of Death
Foliennummer 21
Foliennummer 22
South Africa TB deaths by age group
Foliennummer 24
Foliennummer 25
Foliennummer 26
Foliennummer 27
Foliennummer 28
Foliennummer 29
Foliennummer 30
Foliennummer 31
SA Clinical Trial Regulatory Processes
Clinical Trial Density Active sites million population
Foliennummer 34
Why Africa
Foliennummer 36
AFRICA hellip the true size
SSV to SIV
Foliennummer 39
Foliennummer 40
Foliennummer 41
Foliennummer 42
Foliennummer 43
AFRICA FOUND IN TRANSLATION
Foliennummer 45
Region
Median
of Sites
Patients Site
0 pts
1 - 3 pts
4 - 9 pts
10+ pts
Latin America
4
21
26
30
23
North America
3
29
29
24
18
Eastern Europe
6
15
31
26
27
Western Europe
4
15
22
29
34
Asia Pacific
4
19
30
34
18
Africa
10
4
17
28
51
0 pts
1 - 3 pts
4 - 9 pts
10+ pts
Latin America
21
26
30
23
North America
29
29
24
18
Eastern Europe
15
31
26
27
Western Europe
15
22
29
34
Asia Pacific
19
30
34
18
Africa
4
17
28
51
Males
Female
15-19
210
150
20-24
340
205
25-29
395
300
30-34
460
360
35-39
600
405
40-44
800
500
45-49
1100
700
50-54
1600
1050
55-54
2300
1580
60-64
3340
2250
UN - Male
SA 1997
SA 2004
UN - Female
SA 1997
SA 2004
15-19
210
235
216
150
165
187
20-24
340
381
555
205
331
1085
25-29
395
625
1081
300
452
1985
30-34
460
817
2118
360
489
2267
35-39
600
916
2498
405
526
1890
40-44
800
1136
2765
500
615
1548
45-49
1100
1486
2744
700
800
1400
50-54
1600
2016
2979
1050
1116
1506
55-54
2300
2838
3270
1580
1626
1717
60-64
3340
3614
4146
2250
2201
2360
Stroke
ill-defined heart disease
Diabetes mellitus
Ischaemic heart disease
Hypertension
Nephritisnephrosis
Stroke
ill-defined heart disease
Diabetes mellitus
Ischaemic heart disease
Hypertension
Nephritisnephrosis
1999
34
345
20
248
14
10
1999
295
246
23
10
145
68
2000
36
362
218
249
152
112
2000
318
268
241
108
16
8
2001
35
372
22
25
15
125
2001
322
28
252
102
162
95
2002
405
298
24
26
147
126
2002
352
295
27
115
16
10
2003
425
32
245
285
152
15
2003
382
299
285
122
17
12
2004
39
325
255
26
165
16
2004
35
30
295
121
19
119
2005
36
328
265
26
15
162
2005
325
30
32
12
18
12
2006
35
336
27
258
155
16
2006
33
32
32
11
18
125
COPD
Asthma
Tracheabronchial lung cancer
Oesophageal cancer
prostate cancer
Cervical cancer
Breast cancer
1999
2001
12
135
10
26
2000
204
116
13
92
28
2001
222
131
133
96
27
2002
23
144
128
95
285
2003
243
149
124
94
29
2004
229
154
1255
87
29
2005
224
152
122
82
295
2006
224
136
116
75
3
COPD
Asthma
Tracheabronchial lung cancer
Oesophageal cancer
Prostate cancer
Cervical cancer
Breast cancer
1999
88
92
43
41
106
82
2000
96
95
4
43
11
81
2001
10
109
4
4
111
89
2002
10
116
4
4
112
85
2003
11
124
4
395
116
85
2004
102
1295
44
39
115
101
2005
105
128
42
38
1185
10
2006
10
12
42
32
1205
10
Based on this survey the researchers estimate that 109 of all South Africans over 2 years old were living with HIV in 2008 In 2002 and 2005 this figure was 114 and 108 respectively showing a degree of stabilisation Among those between 15 and 49 years old the estimated HIV prevalence was 169 in 2008 The survey found the prevalence among children aged 2-14 to be 25 down significantly since 2002 when prevalence was 56
Estimated HIV prevalence () among South Africans aged 2 years and older by age 2002-2008
Age
HIV +
HIV -
Children (2-14 years)
25
975
Youth (15-24 years)
87
913
Adults (25 and older)
168
832
(15-49 years)
169
831
Total (2 and older)
109
891
Estimated HIV prevalence among South Africans by age and sex 2008
Age
Male prevalence
Female prevalence
2-14
3
2
15-19
25
67
20-24
51
211
25-29
157
327
30-34
258
291
35-39
185
248
40-44
192
163
45-49
64
141
50-54
104
102
55-59
62
77
60+
35
18
Total
79
136
Among females HIV prevalence is highest in those between 25 and 29 years old among males the peak is in the group aged 30-34 years
HIV prevalence () by province 2002-2008
Province
2002
2005
2008
KwaZulu-Natal
117
165
158
Mpumalanga
141
152
154
Free State
149
126
126
North West
103
109
113
Gauteng
147
108
103
Eastern Cape
66
89
9
Limpopo
98
8
88
Northern Cape
84
54
59
Western Cape
107
19
38
National
114
108
109
The results of this study suggest that KwaZulu-Natal Mpumulanga and Free State have the highest HIV prevalence However the relatively small sample sizes may limit precision and in several cases the ranges of uncertainty overlap
HIV prevalence by population group 2008
Population group
Prevalence ()
African
136
864
White
03
997
Coloured
17
983
Indian
03
997
Studies of AIDS deaths
Latin America
Latin America
Latin America
Latin America
North America
North America
North America
North America
Eastern Europe
Eastern Europe
Eastern Europe
Eastern Europe
Western Europe
Western Europe
Western Europe
Western Europe
Asia Pacific
Asia Pacific
Asia Pacific
Asia Pacific
Africa
Africa
Africa
Africa
Country
Study starts
Subjects randomised
SubjectsStudy
USA
32
4385
13703125
Russia
20
788
394
Germany
19
1883
991052631579
UK
13
265
203846153846
South Africa
12
347
289166666667
Argentina
12
329
274166666667
Australia
11
195
177272727273
India
7
275
392857142857
Brazil
3
115
383333333333
Country
Initiation
Site activation
Recruitment
LOC setup
Unproductive sites
(Approval ndash FCI)
(FCI ndash FSFV)
(FSFV ndash LSFV)
(CPC ndash FSFV)
South Africa
19
38
153
357
21
Australia
117
63
401
239
11
Germany
16
37
401
224
21
UK
9
101
301
346
20
Russia
11
52
174
334
9
India
31
28
389
431
3
Argentina
94
67
288
32
13
Brazil
79
59
94
656
20
USA
44
31
149
26
Country
Pts Rand
Sites
Av CPP
Cost Per Country
Ethics Subm
Regulatory Fees
Add Inv Fees
CT Scan Total
Ethics + Regulatory
Total Regulatory Fees
South Africa
25
5
7250
181250
290
460
363
0
750
1113
Canada
18
4
832545
14985818
181818
0
0
1557576
181818
1818
Italy
7
2
10000
70000
2200
0
0
0
2200
2200
Germany
55
10
7000
385000
3000
0
0
12000
3000
3000
Peru
40
5
7000
280000
1500
1000
2000
60000
2500
4500
Poland
15
4
10000
150000
0
2500
2400
0
2500
4900
Spain
40
7
10500
420000
0
0
5450
0
0
5450
UK
12
4
13000
156000
0
0
5556
0
0
5556
Bulgaria
18
4
10000
180000
0
5000
1000
0
5000
6000
Taiwan
20
4
1179649
2359298
104167
313
5208
0
135467
6563
Czech Rep
10
2
10000
100000
1500
3000
3000
0
4500
7500
Greece
40
7
9000
360000
0
7500
0
0
7500
7500
Chile
15
4
10840
162600
1700
3600
3000
0
5300
8300
Belgium
25
6
12200
305000
3992
4332
0
0
8324
8324
Korea
30
3
10827
324802
1114
0
14324
0
1114
15438
Singapore
10
2
11565
115650
1750
0
17975
0
1750
19725
France
50
10
9000
450000
0
0
20000
0
0
20000
China
39
5
4978
194142
5224
0
39814
0
5224
40336
New Zealand
10
3
145244
145244
1973
0
43123
0
1973
45096
Israel
10
6
11140
111400
2060
3000
48400
16500
5060
53460
Brazil
30
6
10000
300000
2000
287356
5649202
0
487356
61366
Australia
24
6
40200
964800
0
500
82500
0
500
83000
23
543
109
532856799
3304716
26939
27700043
73748966
Sheet2
Average Cost Per Patient (Euro)
Average Cost Per Patient
Sheet4
Ethics Subm
Regulatory Fees
Sheet3
Ethics + Regulatory
Total Ethics and Regulatory Fees
Add Inv Fees
Additional Investigator Application Fees
Total Regulatory Fees
Study starts
SubjectsStudy
32
SA Clinical Trial Regulatory Processes
Governed by SA-GCP and Declaration of Helsinki SA National Clinical Trials Register (SANCTR) Medicines Control Council (National Regulatory Authority)
o New protocols o Amendments o Additional sitesinvestigators
Ethics Committees (33 NHREC-registered) RegionalMunicipal DoH Export permits for bio samples (Nat Health Act 2003)
Clinical Trial Density Active sites million population
Nature Reviews Drug Discovery 7 13-14 (January 2008)
France 503
Germany 512 Canada
922
USA 1203
Czech Republic 776
553 sites
South Africa 119
757 sites
757 sites
533 sites
1084 sites
Argentina 269
Russia 77
China 04
India 07
34
Gateway to Africa
35
Why Africa bull Large accessible population relatively new to clinical trials
bull Experienced and willing investigators
bull Many clinical trial sites established by PDPs NGOs etc
bull Expanding therapeutic areas shifting burden of disease from
infectious to non-communicable diseases
bull Significantly improved infrastructure and accessibility
bull Rapidly evolving regulatory and ethics procedures
bull Potential for capacity building and sustainable clinical trial potential
36
Relatively young GCP culture Resident mentorships to build capacity Locations ndash accessibility for site monitoring Variable infrastructure esp electricity connectivity and
transportation Resourcing of public healthcare systems
Sub-Saharan Africa challenges
37
bull Second-largest continent
bull Spans NS and EW hemispheres
bull Second most populous continent 2014 estimate 1069 billion
bull Home to more than a quarter of the 196 independent countries
bull All 54 African countries are UN members
bull 39 urban population
bull 12 metropolitan areas gt 4m
bull gt 3000 distinct ethnicities
bull gt 2000 languages spoken
AFRICA hellip the true size
wwwcitypopulationdeworldAgglomerations 2015
38
SSV to SIV
0
5
10
15
20
25
30
35
40
45
Africa North America
Asia Pacific
Western Europe
Eastern Europe
Latin America
Source Quintiles South Africa SACRA Conference 2008
Wee
ks (A
vera
ge)
Start-Up Timelines
39
Region Median
Patients Site
of Sites
0 pts 1 - 3 pts 4 - 9 pts 10+ pts
Latin America 40 21 26 30 23
North America 30 29 29 24 18
Eastern Europe 60 15 31 26 27
Western Europe 40 15 22 29 34
Asia Pacific 40 19 30 34 18
Africa 100 4 17 28 51
Enrollment performance by region for 2008
Site Performance
Source Quintiles South Africa Presented SACRA Conference 2009
40
0 1 2 3 4 5 6 7 8 9
10
Latin America
North America
Eastern Europe
Western Europe
Asia Pacific
Africa
Num
ber o
f par
ticip
ants
MEDIAN site enrollment by region for 2008
Source Quintiles South Africa Presented SACRA Conference 2009
Site Performance
41
Source Quintiles South Africa Presented SACRA Conference 2009
s
ites
0
5
10
15
20
25
30
35
40
45
50
LatinAmerica
NorthAmerica
EasternEurope
WesternEurope
Asia Pacific Africa
0 pts
1 - 3 pts
4 - 9 pts
10+ pts
Enrollment performance by region for 2008
Site Performance
Chart1
0 pts
1 - 3 pts
4 - 9 pts
10+ pts
021
026
03
023
029
029
024
018
015
031
026
027
015
022
029
034
019
03
034
018
004
017
028
051
HIV
HIV
Resiratory amp Cancer
Male prevalence
Female prevalence
CVS
Overall death rates
Overall death rates
COPD
Asthma
Tracheabronchial lung cancer
Oesophageal cancer
prostate cancer
Trial metrics
COPD
Asthma
Tracheabronchial lung cancer
Oesophageal cancer
Prostate cancer
Cervical cancer
Breast cancer
Stroke
ill-defined heart disease
Diabetes mellitus
Ischaemic heart disease
Hypertension
Nephritisnephrosis
Stroke
ill-defined heart disease
Diabetes mellitus
Ischaemic heart disease
Hypertension
Nephritisnephrosis
Males
Female
UN - Male
SA 1997
SA 2004
UN - Female
SA 1997
SA 2004
0 pts
1 - 3 pts
4 - 9 pts
10+ pts
42
Source wwwclinicaltrialsgov 22-Oct-2010
Clinical trials registered across Africa
43
0
500
1000
1500
2000
2500
South Africa Kenya Malawi Tanzania Uganda Zambia
Selected African countries
2005
2010
2015
Source ClinTrialsgov
Trend 2005 - 2015
Source wwwclinicaltrialsgov 28-Aug-2015
44
AFRICA FOUND IN TRANSLATION
bull Vast treatment-naiumlve population bull Cost advantages (still) bull Diverse ethnicity amp morbidity bull Inverse seasonality bull Site capacity-building widely implemented bull Robust regulatory review bull Variable but generally good regulatory timelines bull Established GCP culture ndash sites and home-bred CROs
45
THANK YOU
Foliennummer 1
Triclinium A South African CRO
Collaboration with VPM SII
Vaccine Trials in SA 2015
Foliennummer 5
Foliennummer 6
Foliennummer 7
Foliennummer 8
Foliennummer 9
Foliennummer 10
Foliennummer 11
Foliennummer 12
Foliennummer 13
Foliennummer 14
Foliennummer 15
Foliennummer 16
Foliennummer 17
Distribution of clinical trial sites
Foliennummer 19
South Africa Leading Causes of Death
Foliennummer 21
Foliennummer 22
South Africa TB deaths by age group
Foliennummer 24
Foliennummer 25
Foliennummer 26
Foliennummer 27
Foliennummer 28
Foliennummer 29
Foliennummer 30
Foliennummer 31
SA Clinical Trial Regulatory Processes
Clinical Trial Density Active sites million population
Foliennummer 34
Why Africa
Foliennummer 36
AFRICA hellip the true size
SSV to SIV
Foliennummer 39
Foliennummer 40
Foliennummer 41
Foliennummer 42
Foliennummer 43
AFRICA FOUND IN TRANSLATION
Foliennummer 45
Region
Median
of Sites
Patients Site
0 pts
1 - 3 pts
4 - 9 pts
10+ pts
Latin America
4
21
26
30
23
North America
3
29
29
24
18
Eastern Europe
6
15
31
26
27
Western Europe
4
15
22
29
34
Asia Pacific
4
19
30
34
18
Africa
10
4
17
28
51
0 pts
1 - 3 pts
4 - 9 pts
10+ pts
Latin America
21
26
30
23
North America
29
29
24
18
Eastern Europe
15
31
26
27
Western Europe
15
22
29
34
Asia Pacific
19
30
34
18
Africa
4
17
28
51
Males
Female
15-19
210
150
20-24
340
205
25-29
395
300
30-34
460
360
35-39
600
405
40-44
800
500
45-49
1100
700
50-54
1600
1050
55-54
2300
1580
60-64
3340
2250
UN - Male
SA 1997
SA 2004
UN - Female
SA 1997
SA 2004
15-19
210
235
216
150
165
187
20-24
340
381
555
205
331
1085
25-29
395
625
1081
300
452
1985
30-34
460
817
2118
360
489
2267
35-39
600
916
2498
405
526
1890
40-44
800
1136
2765
500
615
1548
45-49
1100
1486
2744
700
800
1400
50-54
1600
2016
2979
1050
1116
1506
55-54
2300
2838
3270
1580
1626
1717
60-64
3340
3614
4146
2250
2201
2360
Stroke
ill-defined heart disease
Diabetes mellitus
Ischaemic heart disease
Hypertension
Nephritisnephrosis
Stroke
ill-defined heart disease
Diabetes mellitus
Ischaemic heart disease
Hypertension
Nephritisnephrosis
1999
34
345
20
248
14
10
1999
295
246
23
10
145
68
2000
36
362
218
249
152
112
2000
318
268
241
108
16
8
2001
35
372
22
25
15
125
2001
322
28
252
102
162
95
2002
405
298
24
26
147
126
2002
352
295
27
115
16
10
2003
425
32
245
285
152
15
2003
382
299
285
122
17
12
2004
39
325
255
26
165
16
2004
35
30
295
121
19
119
2005
36
328
265
26
15
162
2005
325
30
32
12
18
12
2006
35
336
27
258
155
16
2006
33
32
32
11
18
125
COPD
Asthma
Tracheabronchial lung cancer
Oesophageal cancer
prostate cancer
Cervical cancer
Breast cancer
1999
2001
12
135
10
26
2000
204
116
13
92
28
2001
222
131
133
96
27
2002
23
144
128
95
285
2003
243
149
124
94
29
2004
229
154
1255
87
29
2005
224
152
122
82
295
2006
224
136
116
75
3
COPD
Asthma
Tracheabronchial lung cancer
Oesophageal cancer
Prostate cancer
Cervical cancer
Breast cancer
1999
88
92
43
41
106
82
2000
96
95
4
43
11
81
2001
10
109
4
4
111
89
2002
10
116
4
4
112
85
2003
11
124
4
395
116
85
2004
102
1295
44
39
115
101
2005
105
128
42
38
1185
10
2006
10
12
42
32
1205
10
Based on this survey the researchers estimate that 109 of all South Africans over 2 years old were living with HIV in 2008 In 2002 and 2005 this figure was 114 and 108 respectively showing a degree of stabilisation Among those between 15 and 49 years old the estimated HIV prevalence was 169 in 2008 The survey found the prevalence among children aged 2-14 to be 25 down significantly since 2002 when prevalence was 56
Estimated HIV prevalence () among South Africans aged 2 years and older by age 2002-2008
Age
HIV +
HIV -
Children (2-14 years)
25
975
Youth (15-24 years)
87
913
Adults (25 and older)
168
832
(15-49 years)
169
831
Total (2 and older)
109
891
Estimated HIV prevalence among South Africans by age and sex 2008
Age
Male prevalence
Female prevalence
2-14
3
2
15-19
25
67
20-24
51
211
25-29
157
327
30-34
258
291
35-39
185
248
40-44
192
163
45-49
64
141
50-54
104
102
55-59
62
77
60+
35
18
Total
79
136
Among females HIV prevalence is highest in those between 25 and 29 years old among males the peak is in the group aged 30-34 years
HIV prevalence () by province 2002-2008
Province
2002
2005
2008
KwaZulu-Natal
117
165
158
Mpumalanga
141
152
154
Free State
149
126
126
North West
103
109
113
Gauteng
147
108
103
Eastern Cape
66
89
9
Limpopo
98
8
88
Northern Cape
84
54
59
Western Cape
107
19
38
National
114
108
109
The results of this study suggest that KwaZulu-Natal Mpumulanga and Free State have the highest HIV prevalence However the relatively small sample sizes may limit precision and in several cases the ranges of uncertainty overlap
HIV prevalence by population group 2008
Population group
Prevalence ()
African
136
864
White
03
997
Coloured
17
983
Indian
03
997
Studies of AIDS deaths
Latin America
Latin America
Latin America
Latin America
North America
North America
North America
North America
Eastern Europe
Eastern Europe
Eastern Europe
Eastern Europe
Western Europe
Western Europe
Western Europe
Western Europe
Asia Pacific
Asia Pacific
Asia Pacific
Asia Pacific
Africa
Africa
Africa
Africa
Country
Study starts
Subjects randomised
SubjectsStudy
USA
32
4385
13703125
Russia
20
788
394
Germany
19
1883
991052631579
UK
13
265
203846153846
South Africa
12
347
289166666667
Argentina
12
329
274166666667
Australia
11
195
177272727273
India
7
275
392857142857
Brazil
3
115
383333333333
Country
Initiation
Site activation
Recruitment
LOC setup
Unproductive sites
(Approval ndash FCI)
(FCI ndash FSFV)
(FSFV ndash LSFV)
(CPC ndash FSFV)
South Africa
19
38
153
357
21
Australia
117
63
401
239
11
Germany
16
37
401
224
21
UK
9
101
301
346
20
Russia
11
52
174
334
9
India
31
28
389
431
3
Argentina
94
67
288
32
13
Brazil
79
59
94
656
20
USA
44
31
149
26
Study starts
SubjectsStudy
32
SA Clinical Trial Regulatory Processes
Governed by SA-GCP and Declaration of Helsinki SA National Clinical Trials Register (SANCTR) Medicines Control Council (National Regulatory Authority)
o New protocols o Amendments o Additional sitesinvestigators
Ethics Committees (33 NHREC-registered) RegionalMunicipal DoH Export permits for bio samples (Nat Health Act 2003)
Clinical Trial Density Active sites million population
Nature Reviews Drug Discovery 7 13-14 (January 2008)
France 503
Germany 512 Canada
922
USA 1203
Czech Republic 776
553 sites
South Africa 119
757 sites
757 sites
533 sites
1084 sites
Argentina 269
Russia 77
China 04
India 07
34
Gateway to Africa
35
Why Africa bull Large accessible population relatively new to clinical trials
bull Experienced and willing investigators
bull Many clinical trial sites established by PDPs NGOs etc
bull Expanding therapeutic areas shifting burden of disease from
infectious to non-communicable diseases
bull Significantly improved infrastructure and accessibility
bull Rapidly evolving regulatory and ethics procedures
bull Potential for capacity building and sustainable clinical trial potential
36
Relatively young GCP culture Resident mentorships to build capacity Locations ndash accessibility for site monitoring Variable infrastructure esp electricity connectivity and
transportation Resourcing of public healthcare systems
Sub-Saharan Africa challenges
37
bull Second-largest continent
bull Spans NS and EW hemispheres
bull Second most populous continent 2014 estimate 1069 billion
bull Home to more than a quarter of the 196 independent countries
bull All 54 African countries are UN members
bull 39 urban population
bull 12 metropolitan areas gt 4m
bull gt 3000 distinct ethnicities
bull gt 2000 languages spoken
AFRICA hellip the true size
wwwcitypopulationdeworldAgglomerations 2015
38
SSV to SIV
0
5
10
15
20
25
30
35
40
45
Africa North America
Asia Pacific
Western Europe
Eastern Europe
Latin America
Source Quintiles South Africa SACRA Conference 2008
Wee
ks (A
vera
ge)
Start-Up Timelines
39
Region Median
Patients Site
of Sites
0 pts 1 - 3 pts 4 - 9 pts 10+ pts
Latin America 40 21 26 30 23
North America 30 29 29 24 18
Eastern Europe 60 15 31 26 27
Western Europe 40 15 22 29 34
Asia Pacific 40 19 30 34 18
Africa 100 4 17 28 51
Enrollment performance by region for 2008
Site Performance
Source Quintiles South Africa Presented SACRA Conference 2009
40
0 1 2 3 4 5 6 7 8 9
10
Latin America
North America
Eastern Europe
Western Europe
Asia Pacific
Africa
Num
ber o
f par
ticip
ants
MEDIAN site enrollment by region for 2008
Source Quintiles South Africa Presented SACRA Conference 2009
Site Performance
41
Source Quintiles South Africa Presented SACRA Conference 2009
s
ites
0
5
10
15
20
25
30
35
40
45
50
LatinAmerica
NorthAmerica
EasternEurope
WesternEurope
Asia Pacific Africa
0 pts
1 - 3 pts
4 - 9 pts
10+ pts
Enrollment performance by region for 2008
Site Performance
Chart1
0 pts
1 - 3 pts
4 - 9 pts
10+ pts
021
026
03
023
029
029
024
018
015
031
026
027
015
022
029
034
019
03
034
018
004
017
028
051
HIV
HIV
Resiratory amp Cancer
Male prevalence
Female prevalence
CVS
Overall death rates
Overall death rates
COPD
Asthma
Tracheabronchial lung cancer
Oesophageal cancer
prostate cancer
Trial metrics
COPD
Asthma
Tracheabronchial lung cancer
Oesophageal cancer
Prostate cancer
Cervical cancer
Breast cancer
Stroke
ill-defined heart disease
Diabetes mellitus
Ischaemic heart disease
Hypertension
Nephritisnephrosis
Stroke
ill-defined heart disease
Diabetes mellitus
Ischaemic heart disease
Hypertension
Nephritisnephrosis
Males
Female
UN - Male
SA 1997
SA 2004
UN - Female
SA 1997
SA 2004
0 pts
1 - 3 pts
4 - 9 pts
10+ pts
42
Source wwwclinicaltrialsgov 22-Oct-2010
Clinical trials registered across Africa
43
0
500
1000
1500
2000
2500
South Africa Kenya Malawi Tanzania Uganda Zambia
Selected African countries
2005
2010
2015
Source ClinTrialsgov
Trend 2005 - 2015
Source wwwclinicaltrialsgov 28-Aug-2015
44
AFRICA FOUND IN TRANSLATION
bull Vast treatment-naiumlve population bull Cost advantages (still) bull Diverse ethnicity amp morbidity bull Inverse seasonality bull Site capacity-building widely implemented bull Robust regulatory review bull Variable but generally good regulatory timelines bull Established GCP culture ndash sites and home-bred CROs
45
THANK YOU
Foliennummer 1
Triclinium A South African CRO
Collaboration with VPM SII
Vaccine Trials in SA 2015
Foliennummer 5
Foliennummer 6
Foliennummer 7
Foliennummer 8
Foliennummer 9
Foliennummer 10
Foliennummer 11
Foliennummer 12
Foliennummer 13
Foliennummer 14
Foliennummer 15
Foliennummer 16
Foliennummer 17
Distribution of clinical trial sites
Foliennummer 19
South Africa Leading Causes of Death
Foliennummer 21
Foliennummer 22
South Africa TB deaths by age group
Foliennummer 24
Foliennummer 25
Foliennummer 26
Foliennummer 27
Foliennummer 28
Foliennummer 29
Foliennummer 30
Foliennummer 31
SA Clinical Trial Regulatory Processes
Clinical Trial Density Active sites million population
Foliennummer 34
Why Africa
Foliennummer 36
AFRICA hellip the true size
SSV to SIV
Foliennummer 39
Foliennummer 40
Foliennummer 41
Foliennummer 42
Foliennummer 43
AFRICA FOUND IN TRANSLATION
Foliennummer 45
Region
Median
of Sites
Patients Site
0 pts
1 - 3 pts
4 - 9 pts
10+ pts
Latin America
4
21
26
30
23
North America
3
29
29
24
18
Eastern Europe
6
15
31
26
27
Western Europe
4
15
22
29
34
Asia Pacific
4
19
30
34
18
Africa
10
4
17
28
51
0 pts
1 - 3 pts
4 - 9 pts
10+ pts
Latin America
21
26
30
23
North America
29
29
24
18
Eastern Europe
15
31
26
27
Western Europe
15
22
29
34
Asia Pacific
19
30
34
18
Africa
4
17
28
51
Males
Female
15-19
210
150
20-24
340
205
25-29
395
300
30-34
460
360
35-39
600
405
40-44
800
500
45-49
1100
700
50-54
1600
1050
55-54
2300
1580
60-64
3340
2250
UN - Male
SA 1997
SA 2004
UN - Female
SA 1997
SA 2004
15-19
210
235
216
150
165
187
20-24
340
381
555
205
331
1085
25-29
395
625
1081
300
452
1985
30-34
460
817
2118
360
489
2267
35-39
600
916
2498
405
526
1890
40-44
800
1136
2765
500
615
1548
45-49
1100
1486
2744
700
800
1400
50-54
1600
2016
2979
1050
1116
1506
55-54
2300
2838
3270
1580
1626
1717
60-64
3340
3614
4146
2250
2201
2360
Stroke
ill-defined heart disease
Diabetes mellitus
Ischaemic heart disease
Hypertension
Nephritisnephrosis
Stroke
ill-defined heart disease
Diabetes mellitus
Ischaemic heart disease
Hypertension
Nephritisnephrosis
1999
34
345
20
248
14
10
1999
295
246
23
10
145
68
2000
36
362
218
249
152
112
2000
318
268
241
108
16
8
2001
35
372
22
25
15
125
2001
322
28
252
102
162
95
2002
405
298
24
26
147
126
2002
352
295
27
115
16
10
2003
425
32
245
285
152
15
2003
382
299
285
122
17
12
2004
39
325
255
26
165
16
2004
35
30
295
121
19
119
2005
36
328
265
26
15
162
2005
325
30
32
12
18
12
2006
35
336
27
258
155
16
2006
33
32
32
11
18
125
COPD
Asthma
Tracheabronchial lung cancer
Oesophageal cancer
prostate cancer
Cervical cancer
Breast cancer
1999
2001
12
135
10
26
2000
204
116
13
92
28
2001
222
131
133
96
27
2002
23
144
128
95
285
2003
243
149
124
94
29
2004
229
154
1255
87
29
2005
224
152
122
82
295
2006
224
136
116
75
3
COPD
Asthma
Tracheabronchial lung cancer
Oesophageal cancer
Prostate cancer
Cervical cancer
Breast cancer
1999
88
92
43
41
106
82
2000
96
95
4
43
11
81
2001
10
109
4
4
111
89
2002
10
116
4
4
112
85
2003
11
124
4
395
116
85
2004
102
1295
44
39
115
101
2005
105
128
42
38
1185
10
2006
10
12
42
32
1205
10
Based on this survey the researchers estimate that 109 of all South Africans over 2 years old were living with HIV in 2008 In 2002 and 2005 this figure was 114 and 108 respectively showing a degree of stabilisation Among those between 15 and 49 years old the estimated HIV prevalence was 169 in 2008 The survey found the prevalence among children aged 2-14 to be 25 down significantly since 2002 when prevalence was 56
Estimated HIV prevalence () among South Africans aged 2 years and older by age 2002-2008
Age
HIV +
HIV -
Children (2-14 years)
25
975
Youth (15-24 years)
87
913
Adults (25 and older)
168
832
(15-49 years)
169
831
Total (2 and older)
109
891
Estimated HIV prevalence among South Africans by age and sex 2008
Age
Male prevalence
Female prevalence
2-14
3
2
15-19
25
67
20-24
51
211
25-29
157
327
30-34
258
291
35-39
185
248
40-44
192
163
45-49
64
141
50-54
104
102
55-59
62
77
60+
35
18
Total
79
136
Among females HIV prevalence is highest in those between 25 and 29 years old among males the peak is in the group aged 30-34 years
HIV prevalence () by province 2002-2008
Province
2002
2005
2008
KwaZulu-Natal
117
165
158
Mpumalanga
141
152
154
Free State
149
126
126
North West
103
109
113
Gauteng
147
108
103
Eastern Cape
66
89
9
Limpopo
98
8
88
Northern Cape
84
54
59
Western Cape
107
19
38
National
114
108
109
The results of this study suggest that KwaZulu-Natal Mpumulanga and Free State have the highest HIV prevalence However the relatively small sample sizes may limit precision and in several cases the ranges of uncertainty overlap
HIV prevalence by population group 2008
Population group
Prevalence ()
African
136
864
White
03
997
Coloured
17
983
Indian
03
997
Studies of AIDS deaths
Latin America
Latin America
Latin America
Latin America
North America
North America
North America
North America
Eastern Europe
Eastern Europe
Eastern Europe
Eastern Europe
Western Europe
Western Europe
Western Europe
Western Europe
Asia Pacific
Asia Pacific
Asia Pacific
Asia Pacific
Africa
Africa
Africa
Africa
Country
Study starts
Subjects randomised
SubjectsStudy
USA
32
4385
13703125
Russia
20
788
394
Germany
19
1883
991052631579
UK
13
265
203846153846
South Africa
12
347
289166666667
Argentina
12
329
274166666667
Australia
11
195
177272727273
India
7
275
392857142857
Brazil
3
115
383333333333
Study starts
SubjectsStudy
32
SA Clinical Trial Regulatory Processes
Governed by SA-GCP and Declaration of Helsinki SA National Clinical Trials Register (SANCTR) Medicines Control Council (National Regulatory Authority)
o New protocols o Amendments o Additional sitesinvestigators
Ethics Committees (33 NHREC-registered) RegionalMunicipal DoH Export permits for bio samples (Nat Health Act 2003)
Clinical Trial Density Active sites million population
Nature Reviews Drug Discovery 7 13-14 (January 2008)
France 503
Germany 512 Canada
922
USA 1203
Czech Republic 776
553 sites
South Africa 119
757 sites
757 sites
533 sites
1084 sites
Argentina 269
Russia 77
China 04
India 07
34
Gateway to Africa
35
Why Africa bull Large accessible population relatively new to clinical trials
bull Experienced and willing investigators
bull Many clinical trial sites established by PDPs NGOs etc
bull Expanding therapeutic areas shifting burden of disease from
infectious to non-communicable diseases
bull Significantly improved infrastructure and accessibility
bull Rapidly evolving regulatory and ethics procedures
bull Potential for capacity building and sustainable clinical trial potential
36
Relatively young GCP culture Resident mentorships to build capacity Locations ndash accessibility for site monitoring Variable infrastructure esp electricity connectivity and
transportation Resourcing of public healthcare systems
Sub-Saharan Africa challenges
37
bull Second-largest continent
bull Spans NS and EW hemispheres
bull Second most populous continent 2014 estimate 1069 billion
bull Home to more than a quarter of the 196 independent countries
bull All 54 African countries are UN members
bull 39 urban population
bull 12 metropolitan areas gt 4m
bull gt 3000 distinct ethnicities
bull gt 2000 languages spoken
AFRICA hellip the true size
wwwcitypopulationdeworldAgglomerations 2015
38
SSV to SIV
0
5
10
15
20
25
30
35
40
45
Africa North America
Asia Pacific
Western Europe
Eastern Europe
Latin America
Source Quintiles South Africa SACRA Conference 2008
Wee
ks (A
vera
ge)
Start-Up Timelines
39
Region Median
Patients Site
of Sites
0 pts 1 - 3 pts 4 - 9 pts 10+ pts
Latin America 40 21 26 30 23
North America 30 29 29 24 18
Eastern Europe 60 15 31 26 27
Western Europe 40 15 22 29 34
Asia Pacific 40 19 30 34 18
Africa 100 4 17 28 51
Enrollment performance by region for 2008
Site Performance
Source Quintiles South Africa Presented SACRA Conference 2009
40
0 1 2 3 4 5 6 7 8 9
10
Latin America
North America
Eastern Europe
Western Europe
Asia Pacific
Africa
Num
ber o
f par
ticip
ants
MEDIAN site enrollment by region for 2008
Source Quintiles South Africa Presented SACRA Conference 2009
Site Performance
41
Source Quintiles South Africa Presented SACRA Conference 2009
s
ites
0
5
10
15
20
25
30
35
40
45
50
LatinAmerica
NorthAmerica
EasternEurope
WesternEurope
Asia Pacific Africa
0 pts
1 - 3 pts
4 - 9 pts
10+ pts
Enrollment performance by region for 2008
Site Performance
Chart1
0 pts
1 - 3 pts
4 - 9 pts
10+ pts
021
026
03
023
029
029
024
018
015
031
026
027
015
022
029
034
019
03
034
018
004
017
028
051
HIV
HIV
Resiratory amp Cancer
Male prevalence
Female prevalence
CVS
Overall death rates
Overall death rates
COPD
Asthma
Tracheabronchial lung cancer
Oesophageal cancer
prostate cancer
Trial metrics
COPD
Asthma
Tracheabronchial lung cancer
Oesophageal cancer
Prostate cancer
Cervical cancer
Breast cancer
Stroke
ill-defined heart disease
Diabetes mellitus
Ischaemic heart disease
Hypertension
Nephritisnephrosis
Stroke
ill-defined heart disease
Diabetes mellitus
Ischaemic heart disease
Hypertension
Nephritisnephrosis
Males
Female
UN - Male
SA 1997
SA 2004
UN - Female
SA 1997
SA 2004
0 pts
1 - 3 pts
4 - 9 pts
10+ pts
42
Source wwwclinicaltrialsgov 22-Oct-2010
Clinical trials registered across Africa
43
0
500
1000
1500
2000
2500
South Africa Kenya Malawi Tanzania Uganda Zambia
Selected African countries
2005
2010
2015
Source ClinTrialsgov
Trend 2005 - 2015
Source wwwclinicaltrialsgov 28-Aug-2015
44
AFRICA FOUND IN TRANSLATION
bull Vast treatment-naiumlve population bull Cost advantages (still) bull Diverse ethnicity amp morbidity bull Inverse seasonality bull Site capacity-building widely implemented bull Robust regulatory review bull Variable but generally good regulatory timelines bull Established GCP culture ndash sites and home-bred CROs
45
THANK YOU
Foliennummer 1
Triclinium A South African CRO
Collaboration with VPM SII
Vaccine Trials in SA 2015
Foliennummer 5
Foliennummer 6
Foliennummer 7
Foliennummer 8
Foliennummer 9
Foliennummer 10
Foliennummer 11
Foliennummer 12
Foliennummer 13
Foliennummer 14
Foliennummer 15
Foliennummer 16
Foliennummer 17
Distribution of clinical trial sites
Foliennummer 19
South Africa Leading Causes of Death
Foliennummer 21
Foliennummer 22
South Africa TB deaths by age group
Foliennummer 24
Foliennummer 25
Foliennummer 26
Foliennummer 27
Foliennummer 28
Foliennummer 29
Foliennummer 30
Foliennummer 31
SA Clinical Trial Regulatory Processes
Clinical Trial Density Active sites million population
Foliennummer 34
Why Africa
Foliennummer 36
AFRICA hellip the true size
SSV to SIV
Foliennummer 39
Foliennummer 40
Foliennummer 41
Foliennummer 42
Foliennummer 43
AFRICA FOUND IN TRANSLATION
Foliennummer 45
Region
Median
of Sites
Patients Site
0 pts
1 - 3 pts
4 - 9 pts
10+ pts
Latin America
4
21
26
30
23
North America
3
29
29
24
18
Eastern Europe
6
15
31
26
27
Western Europe
4
15
22
29
34
Asia Pacific
4
19
30
34
18
Africa
10
4
17
28
51
0 pts
1 - 3 pts
4 - 9 pts
10+ pts
Latin America
21
26
30
23
North America
29
29
24
18
Eastern Europe
15
31
26
27
Western Europe
15
22
29
34
Asia Pacific
19
30
34
18
Africa
4
17
28
51
Males
Female
15-19
210
150
20-24
340
205
25-29
395
300
30-34
460
360
35-39
600
405
40-44
800
500
45-49
1100
700
50-54
1600
1050
55-54
2300
1580
60-64
3340
2250
UN - Male
SA 1997
SA 2004
UN - Female
SA 1997
SA 2004
15-19
210
235
216
150
165
187
20-24
340
381
555
205
331
1085
25-29
395
625
1081
300
452
1985
30-34
460
817
2118
360
489
2267
35-39
600
916
2498
405
526
1890
40-44
800
1136
2765
500
615
1548
45-49
1100
1486
2744
700
800
1400
50-54
1600
2016
2979
1050
1116
1506
55-54
2300
2838
3270
1580
1626
1717
60-64
3340
3614
4146
2250
2201
2360
Stroke
ill-defined heart disease
Diabetes mellitus
Ischaemic heart disease
Hypertension
Nephritisnephrosis
Stroke
ill-defined heart disease
Diabetes mellitus
Ischaemic heart disease
Hypertension
Nephritisnephrosis
1999
34
345
20
248
14
10
1999
295
246
23
10
145
68
2000
36
362
218
249
152
112
2000
318
268
241
108
16
8
2001
35
372
22
25
15
125
2001
322
28
252
102
162
95
2002
405
298
24
26
147
126
2002
352
295
27
115
16
10
2003
425
32
245
285
152
15
2003
382
299
285
122
17
12
2004
39
325
255
26
165
16
2004
35
30
295
121
19
119
2005
36
328
265
26
15
162
2005
325
30
32
12
18
12
2006
35
336
27
258
155
16
2006
33
32
32
11
18
125
COPD
Asthma
Tracheabronchial lung cancer
Oesophageal cancer
prostate cancer
Cervical cancer
Breast cancer
1999
2001
12
135
10
26
2000
204
116
13
92
28
2001
222
131
133
96
27
2002
23
144
128
95
285
2003
243
149
124
94
29
2004
229
154
1255
87
29
2005
224
152
122
82
295
2006
224
136
116
75
3
COPD
Asthma
Tracheabronchial lung cancer
Oesophageal cancer
Prostate cancer
Cervical cancer
Breast cancer
1999
88
92
43
41
106
82
2000
96
95
4
43
11
81
2001
10
109
4
4
111
89
2002
10
116
4
4
112
85
2003
11
124
4
395
116
85
2004
102
1295
44
39
115
101
2005
105
128
42
38
1185
10
2006
10
12
42
32
1205
10
Based on this survey the researchers estimate that 109 of all South Africans over 2 years old were living with HIV in 2008 In 2002 and 2005 this figure was 114 and 108 respectively showing a degree of stabilisation Among those between 15 and 49 years old the estimated HIV prevalence was 169 in 2008 The survey found the prevalence among children aged 2-14 to be 25 down significantly since 2002 when prevalence was 56
Estimated HIV prevalence () among South Africans aged 2 years and older by age 2002-2008
Age
HIV +
HIV -
Children (2-14 years)
25
975
Youth (15-24 years)
87
913
Adults (25 and older)
168
832
(15-49 years)
169
831
Total (2 and older)
109
891
Estimated HIV prevalence among South Africans by age and sex 2008
Age
Male prevalence
Female prevalence
2-14
3
2
15-19
25
67
20-24
51
211
25-29
157
327
30-34
258
291
35-39
185
248
40-44
192
163
45-49
64
141
50-54
104
102
55-59
62
77
60+
35
18
Total
79
136
Among females HIV prevalence is highest in those between 25 and 29 years old among males the peak is in the group aged 30-34 years
HIV prevalence () by province 2002-2008
Province
2002
2005
2008
KwaZulu-Natal
117
165
158
Mpumalanga
141
152
154
Free State
149
126
126
North West
103
109
113
Gauteng
147
108
103
Eastern Cape
66
89
9
Limpopo
98
8
88
Northern Cape
84
54
59
Western Cape
107
19
38
National
114
108
109
The results of this study suggest that KwaZulu-Natal Mpumulanga and Free State have the highest HIV prevalence However the relatively small sample sizes may limit precision and in several cases the ranges of uncertainty overlap
HIV prevalence by population group 2008
Population group
Prevalence ()
African
136
864
White
03
997
Coloured
17
983
Indian
03
997
Studies of AIDS deaths
Latin America
Latin America
Latin America
Latin America
North America
North America
North America
North America
Eastern Europe
Eastern Europe
Eastern Europe
Eastern Europe
Western Europe
Western Europe
Western Europe
Western Europe
Asia Pacific
Asia Pacific
Asia Pacific
Asia Pacific
Africa
Africa
Africa
Africa
32
SA Clinical Trial Regulatory Processes
Governed by SA-GCP and Declaration of Helsinki SA National Clinical Trials Register (SANCTR) Medicines Control Council (National Regulatory Authority)
o New protocols o Amendments o Additional sitesinvestigators
Ethics Committees (33 NHREC-registered) RegionalMunicipal DoH Export permits for bio samples (Nat Health Act 2003)
Clinical Trial Density Active sites million population
Nature Reviews Drug Discovery 7 13-14 (January 2008)
France 503
Germany 512 Canada
922
USA 1203
Czech Republic 776
553 sites
South Africa 119
757 sites
757 sites
533 sites
1084 sites
Argentina 269
Russia 77
China 04
India 07
34
Gateway to Africa
35
Why Africa bull Large accessible population relatively new to clinical trials
bull Experienced and willing investigators
bull Many clinical trial sites established by PDPs NGOs etc
bull Expanding therapeutic areas shifting burden of disease from
infectious to non-communicable diseases
bull Significantly improved infrastructure and accessibility
bull Rapidly evolving regulatory and ethics procedures
bull Potential for capacity building and sustainable clinical trial potential
36
Relatively young GCP culture Resident mentorships to build capacity Locations ndash accessibility for site monitoring Variable infrastructure esp electricity connectivity and
transportation Resourcing of public healthcare systems
Sub-Saharan Africa challenges
37
bull Second-largest continent
bull Spans NS and EW hemispheres
bull Second most populous continent 2014 estimate 1069 billion
bull Home to more than a quarter of the 196 independent countries
bull All 54 African countries are UN members
bull 39 urban population
bull 12 metropolitan areas gt 4m
bull gt 3000 distinct ethnicities
bull gt 2000 languages spoken
AFRICA hellip the true size
wwwcitypopulationdeworldAgglomerations 2015
38
SSV to SIV
0
5
10
15
20
25
30
35
40
45
Africa North America
Asia Pacific
Western Europe
Eastern Europe
Latin America
Source Quintiles South Africa SACRA Conference 2008
Wee
ks (A
vera
ge)
Start-Up Timelines
39
Region Median
Patients Site
of Sites
0 pts 1 - 3 pts 4 - 9 pts 10+ pts
Latin America 40 21 26 30 23
North America 30 29 29 24 18
Eastern Europe 60 15 31 26 27
Western Europe 40 15 22 29 34
Asia Pacific 40 19 30 34 18
Africa 100 4 17 28 51
Enrollment performance by region for 2008
Site Performance
Source Quintiles South Africa Presented SACRA Conference 2009
40
0 1 2 3 4 5 6 7 8 9
10
Latin America
North America
Eastern Europe
Western Europe
Asia Pacific
Africa
Num
ber o
f par
ticip
ants
MEDIAN site enrollment by region for 2008
Source Quintiles South Africa Presented SACRA Conference 2009
Site Performance
41
Source Quintiles South Africa Presented SACRA Conference 2009
s
ites
0
5
10
15
20
25
30
35
40
45
50
LatinAmerica
NorthAmerica
EasternEurope
WesternEurope
Asia Pacific Africa
0 pts
1 - 3 pts
4 - 9 pts
10+ pts
Enrollment performance by region for 2008
Site Performance
Chart1
0 pts
1 - 3 pts
4 - 9 pts
10+ pts
021
026
03
023
029
029
024
018
015
031
026
027
015
022
029
034
019
03
034
018
004
017
028
051
HIV
HIV
Resiratory amp Cancer
Male prevalence
Female prevalence
CVS
Overall death rates
Overall death rates
COPD
Asthma
Tracheabronchial lung cancer
Oesophageal cancer
prostate cancer
Trial metrics
COPD
Asthma
Tracheabronchial lung cancer
Oesophageal cancer
Prostate cancer
Cervical cancer
Breast cancer
Stroke
ill-defined heart disease
Diabetes mellitus
Ischaemic heart disease
Hypertension
Nephritisnephrosis
Stroke
ill-defined heart disease
Diabetes mellitus
Ischaemic heart disease
Hypertension
Nephritisnephrosis
Males
Female
UN - Male
SA 1997
SA 2004
UN - Female
SA 1997
SA 2004
0 pts
1 - 3 pts
4 - 9 pts
10+ pts
42
Source wwwclinicaltrialsgov 22-Oct-2010
Clinical trials registered across Africa
43
0
500
1000
1500
2000
2500
South Africa Kenya Malawi Tanzania Uganda Zambia
Selected African countries
2005
2010
2015
Source ClinTrialsgov
Trend 2005 - 2015
Source wwwclinicaltrialsgov 28-Aug-2015
44
AFRICA FOUND IN TRANSLATION
bull Vast treatment-naiumlve population bull Cost advantages (still) bull Diverse ethnicity amp morbidity bull Inverse seasonality bull Site capacity-building widely implemented bull Robust regulatory review bull Variable but generally good regulatory timelines bull Established GCP culture ndash sites and home-bred CROs
45
THANK YOU
Foliennummer 1
Triclinium A South African CRO
Collaboration with VPM SII
Vaccine Trials in SA 2015
Foliennummer 5
Foliennummer 6
Foliennummer 7
Foliennummer 8
Foliennummer 9
Foliennummer 10
Foliennummer 11
Foliennummer 12
Foliennummer 13
Foliennummer 14
Foliennummer 15
Foliennummer 16
Foliennummer 17
Distribution of clinical trial sites
Foliennummer 19
South Africa Leading Causes of Death
Foliennummer 21
Foliennummer 22
South Africa TB deaths by age group
Foliennummer 24
Foliennummer 25
Foliennummer 26
Foliennummer 27
Foliennummer 28
Foliennummer 29
Foliennummer 30
Foliennummer 31
SA Clinical Trial Regulatory Processes
Clinical Trial Density Active sites million population
Foliennummer 34
Why Africa
Foliennummer 36
AFRICA hellip the true size
SSV to SIV
Foliennummer 39
Foliennummer 40
Foliennummer 41
Foliennummer 42
Foliennummer 43
AFRICA FOUND IN TRANSLATION
Foliennummer 45
Region
Median
of Sites
Patients Site
0 pts
1 - 3 pts
4 - 9 pts
10+ pts
Latin America
4
21
26
30
23
North America
3
29
29
24
18
Eastern Europe
6
15
31
26
27
Western Europe
4
15
22
29
34
Asia Pacific
4
19
30
34
18
Africa
10
4
17
28
51
0 pts
1 - 3 pts
4 - 9 pts
10+ pts
Latin America
21
26
30
23
North America
29
29
24
18
Eastern Europe
15
31
26
27
Western Europe
15
22
29
34
Asia Pacific
19
30
34
18
Africa
4
17
28
51
Males
Female
15-19
210
150
20-24
340
205
25-29
395
300
30-34
460
360
35-39
600
405
40-44
800
500
45-49
1100
700
50-54
1600
1050
55-54
2300
1580
60-64
3340
2250
UN - Male
SA 1997
SA 2004
UN - Female
SA 1997
SA 2004
15-19
210
235
216
150
165
187
20-24
340
381
555
205
331
1085
25-29
395
625
1081
300
452
1985
30-34
460
817
2118
360
489
2267
35-39
600
916
2498
405
526
1890
40-44
800
1136
2765
500
615
1548
45-49
1100
1486
2744
700
800
1400
50-54
1600
2016
2979
1050
1116
1506
55-54
2300
2838
3270
1580
1626
1717
60-64
3340
3614
4146
2250
2201
2360
Stroke
ill-defined heart disease
Diabetes mellitus
Ischaemic heart disease
Hypertension
Nephritisnephrosis
Stroke
ill-defined heart disease
Diabetes mellitus
Ischaemic heart disease
Hypertension
Nephritisnephrosis
1999
34
345
20
248
14
10
1999
295
246
23
10
145
68
2000
36
362
218
249
152
112
2000
318
268
241
108
16
8
2001
35
372
22
25
15
125
2001
322
28
252
102
162
95
2002
405
298
24
26
147
126
2002
352
295
27
115
16
10
2003
425
32
245
285
152
15
2003
382
299
285
122
17
12
2004
39
325
255
26
165
16
2004
35
30
295
121
19
119
2005
36
328
265
26
15
162
2005
325
30
32
12
18
12
2006
35
336
27
258
155
16
2006
33
32
32
11
18
125
COPD
Asthma
Tracheabronchial lung cancer
Oesophageal cancer
prostate cancer
Cervical cancer
Breast cancer
1999
2001
12
135
10
26
2000
204
116
13
92
28
2001
222
131
133
96
27
2002
23
144
128
95
285
2003
243
149
124
94
29
2004
229
154
1255
87
29
2005
224
152
122
82
295
2006
224
136
116
75
3
COPD
Asthma
Tracheabronchial lung cancer
Oesophageal cancer
Prostate cancer
Cervical cancer
Breast cancer
1999
88
92
43
41
106
82
2000
96
95
4
43
11
81
2001
10
109
4
4
111
89
2002
10
116
4
4
112
85
2003
11
124
4
395
116
85
2004
102
1295
44
39
115
101
2005
105
128
42
38
1185
10
2006
10
12
42
32
1205
10
Based on this survey the researchers estimate that 109 of all South Africans over 2 years old were living with HIV in 2008 In 2002 and 2005 this figure was 114 and 108 respectively showing a degree of stabilisation Among those between 15 and 49 years old the estimated HIV prevalence was 169 in 2008 The survey found the prevalence among children aged 2-14 to be 25 down significantly since 2002 when prevalence was 56
Estimated HIV prevalence () among South Africans aged 2 years and older by age 2002-2008
Age
HIV +
HIV -
Children (2-14 years)
25
975
Youth (15-24 years)
87
913
Adults (25 and older)
168
832
(15-49 years)
169
831
Total (2 and older)
109
891
Estimated HIV prevalence among South Africans by age and sex 2008
Age
Male prevalence
Female prevalence
2-14
3
2
15-19
25
67
20-24
51
211
25-29
157
327
30-34
258
291
35-39
185
248
40-44
192
163
45-49
64
141
50-54
104
102
55-59
62
77
60+
35
18
Total
79
136
Among females HIV prevalence is highest in those between 25 and 29 years old among males the peak is in the group aged 30-34 years
HIV prevalence () by province 2002-2008
Province
2002
2005
2008
KwaZulu-Natal
117
165
158
Mpumalanga
141
152
154
Free State
149
126
126
North West
103
109
113
Gauteng
147
108
103
Eastern Cape
66
89
9
Limpopo
98
8
88
Northern Cape
84
54
59
Western Cape
107
19
38
National
114
108
109
The results of this study suggest that KwaZulu-Natal Mpumulanga and Free State have the highest HIV prevalence However the relatively small sample sizes may limit precision and in several cases the ranges of uncertainty overlap
HIV prevalence by population group 2008
Population group
Prevalence ()
African
136
864
White
03
997
Coloured
17
983
Indian
03
997
Studies of AIDS deaths
Latin America
Latin America
Latin America
Latin America
North America
North America
North America
North America
Eastern Europe
Eastern Europe
Eastern Europe
Eastern Europe
Western Europe
Western Europe
Western Europe
Western Europe
Asia Pacific
Asia Pacific
Asia Pacific
Asia Pacific
Africa
Africa
Africa
Africa
33
Clinical Trial Density Active sites million population
Nature Reviews Drug Discovery 7 13-14 (January 2008)
France 503
Germany 512 Canada
922
USA 1203
Czech Republic 776
553 sites
South Africa 119
757 sites
757 sites
533 sites
1084 sites
Argentina 269
Russia 77
China 04
India 07
34
Gateway to Africa
35
Why Africa bull Large accessible population relatively new to clinical trials
bull Experienced and willing investigators
bull Many clinical trial sites established by PDPs NGOs etc
bull Expanding therapeutic areas shifting burden of disease from
infectious to non-communicable diseases
bull Significantly improved infrastructure and accessibility
bull Rapidly evolving regulatory and ethics procedures
bull Potential for capacity building and sustainable clinical trial potential
36
Relatively young GCP culture Resident mentorships to build capacity Locations ndash accessibility for site monitoring Variable infrastructure esp electricity connectivity and
transportation Resourcing of public healthcare systems
Sub-Saharan Africa challenges
37
bull Second-largest continent
bull Spans NS and EW hemispheres
bull Second most populous continent 2014 estimate 1069 billion
bull Home to more than a quarter of the 196 independent countries
bull All 54 African countries are UN members
bull 39 urban population
bull 12 metropolitan areas gt 4m
bull gt 3000 distinct ethnicities
bull gt 2000 languages spoken
AFRICA hellip the true size
wwwcitypopulationdeworldAgglomerations 2015
38
SSV to SIV
0
5
10
15
20
25
30
35
40
45
Africa North America
Asia Pacific
Western Europe
Eastern Europe
Latin America
Source Quintiles South Africa SACRA Conference 2008
Wee
ks (A
vera
ge)
Start-Up Timelines
39
Region Median
Patients Site
of Sites
0 pts 1 - 3 pts 4 - 9 pts 10+ pts
Latin America 40 21 26 30 23
North America 30 29 29 24 18
Eastern Europe 60 15 31 26 27
Western Europe 40 15 22 29 34
Asia Pacific 40 19 30 34 18
Africa 100 4 17 28 51
Enrollment performance by region for 2008
Site Performance
Source Quintiles South Africa Presented SACRA Conference 2009
40
0 1 2 3 4 5 6 7 8 9
10
Latin America
North America
Eastern Europe
Western Europe
Asia Pacific
Africa
Num
ber o
f par
ticip
ants
MEDIAN site enrollment by region for 2008
Source Quintiles South Africa Presented SACRA Conference 2009
Site Performance
41
Source Quintiles South Africa Presented SACRA Conference 2009
s
ites
0
5
10
15
20
25
30
35
40
45
50
LatinAmerica
NorthAmerica
EasternEurope
WesternEurope
Asia Pacific Africa
0 pts
1 - 3 pts
4 - 9 pts
10+ pts
Enrollment performance by region for 2008
Site Performance
Chart1
0 pts
1 - 3 pts
4 - 9 pts
10+ pts
021
026
03
023
029
029
024
018
015
031
026
027
015
022
029
034
019
03
034
018
004
017
028
051
HIV
HIV
Resiratory amp Cancer
Male prevalence
Female prevalence
CVS
Overall death rates
Overall death rates
COPD
Asthma
Tracheabronchial lung cancer
Oesophageal cancer
prostate cancer
Trial metrics
COPD
Asthma
Tracheabronchial lung cancer
Oesophageal cancer
Prostate cancer
Cervical cancer
Breast cancer
Stroke
ill-defined heart disease
Diabetes mellitus
Ischaemic heart disease
Hypertension
Nephritisnephrosis
Stroke
ill-defined heart disease
Diabetes mellitus
Ischaemic heart disease
Hypertension
Nephritisnephrosis
Males
Female
UN - Male
SA 1997
SA 2004
UN - Female
SA 1997
SA 2004
0 pts
1 - 3 pts
4 - 9 pts
10+ pts
42
Source wwwclinicaltrialsgov 22-Oct-2010
Clinical trials registered across Africa
43
0
500
1000
1500
2000
2500
South Africa Kenya Malawi Tanzania Uganda Zambia
Selected African countries
2005
2010
2015
Source ClinTrialsgov
Trend 2005 - 2015
Source wwwclinicaltrialsgov 28-Aug-2015
44
AFRICA FOUND IN TRANSLATION
bull Vast treatment-naiumlve population bull Cost advantages (still) bull Diverse ethnicity amp morbidity bull Inverse seasonality bull Site capacity-building widely implemented bull Robust regulatory review bull Variable but generally good regulatory timelines bull Established GCP culture ndash sites and home-bred CROs
45
THANK YOU
Foliennummer 1
Triclinium A South African CRO
Collaboration with VPM SII
Vaccine Trials in SA 2015
Foliennummer 5
Foliennummer 6
Foliennummer 7
Foliennummer 8
Foliennummer 9
Foliennummer 10
Foliennummer 11
Foliennummer 12
Foliennummer 13
Foliennummer 14
Foliennummer 15
Foliennummer 16
Foliennummer 17
Distribution of clinical trial sites
Foliennummer 19
South Africa Leading Causes of Death
Foliennummer 21
Foliennummer 22
South Africa TB deaths by age group
Foliennummer 24
Foliennummer 25
Foliennummer 26
Foliennummer 27
Foliennummer 28
Foliennummer 29
Foliennummer 30
Foliennummer 31
SA Clinical Trial Regulatory Processes
Clinical Trial Density Active sites million population
Foliennummer 34
Why Africa
Foliennummer 36
AFRICA hellip the true size
SSV to SIV
Foliennummer 39
Foliennummer 40
Foliennummer 41
Foliennummer 42
Foliennummer 43
AFRICA FOUND IN TRANSLATION
Foliennummer 45
Region
Median
of Sites
Patients Site
0 pts
1 - 3 pts
4 - 9 pts
10+ pts
Latin America
4
21
26
30
23
North America
3
29
29
24
18
Eastern Europe
6
15
31
26
27
Western Europe
4
15
22
29
34
Asia Pacific
4
19
30
34
18
Africa
10
4
17
28
51
0 pts
1 - 3 pts
4 - 9 pts
10+ pts
Latin America
21
26
30
23
North America
29
29
24
18
Eastern Europe
15
31
26
27
Western Europe
15
22
29
34
Asia Pacific
19
30
34
18
Africa
4
17
28
51
Males
Female
15-19
210
150
20-24
340
205
25-29
395
300
30-34
460
360
35-39
600
405
40-44
800
500
45-49
1100
700
50-54
1600
1050
55-54
2300
1580
60-64
3340
2250
UN - Male
SA 1997
SA 2004
UN - Female
SA 1997
SA 2004
15-19
210
235
216
150
165
187
20-24
340
381
555
205
331
1085
25-29
395
625
1081
300
452
1985
30-34
460
817
2118
360
489
2267
35-39
600
916
2498
405
526
1890
40-44
800
1136
2765
500
615
1548
45-49
1100
1486
2744
700
800
1400
50-54
1600
2016
2979
1050
1116
1506
55-54
2300
2838
3270
1580
1626
1717
60-64
3340
3614
4146
2250
2201
2360
Stroke
ill-defined heart disease
Diabetes mellitus
Ischaemic heart disease
Hypertension
Nephritisnephrosis
Stroke
ill-defined heart disease
Diabetes mellitus
Ischaemic heart disease
Hypertension
Nephritisnephrosis
1999
34
345
20
248
14
10
1999
295
246
23
10
145
68
2000
36
362
218
249
152
112
2000
318
268
241
108
16
8
2001
35
372
22
25
15
125
2001
322
28
252
102
162
95
2002
405
298
24
26
147
126
2002
352
295
27
115
16
10
2003
425
32
245
285
152
15
2003
382
299
285
122
17
12
2004
39
325
255
26
165
16
2004
35
30
295
121
19
119
2005
36
328
265
26
15
162
2005
325
30
32
12
18
12
2006
35
336
27
258
155
16
2006
33
32
32
11
18
125
COPD
Asthma
Tracheabronchial lung cancer
Oesophageal cancer
prostate cancer
Cervical cancer
Breast cancer
1999
2001
12
135
10
26
2000
204
116
13
92
28
2001
222
131
133
96
27
2002
23
144
128
95
285
2003
243
149
124
94
29
2004
229
154
1255
87
29
2005
224
152
122
82
295
2006
224
136
116
75
3
COPD
Asthma
Tracheabronchial lung cancer
Oesophageal cancer
Prostate cancer
Cervical cancer
Breast cancer
1999
88
92
43
41
106
82
2000
96
95
4
43
11
81
2001
10
109
4
4
111
89
2002
10
116
4
4
112
85
2003
11
124
4
395
116
85
2004
102
1295
44
39
115
101
2005
105
128
42
38
1185
10
2006
10
12
42
32
1205
10
Based on this survey the researchers estimate that 109 of all South Africans over 2 years old were living with HIV in 2008 In 2002 and 2005 this figure was 114 and 108 respectively showing a degree of stabilisation Among those between 15 and 49 years old the estimated HIV prevalence was 169 in 2008 The survey found the prevalence among children aged 2-14 to be 25 down significantly since 2002 when prevalence was 56
Estimated HIV prevalence () among South Africans aged 2 years and older by age 2002-2008
Age
HIV +
HIV -
Children (2-14 years)
25
975
Youth (15-24 years)
87
913
Adults (25 and older)
168
832
(15-49 years)
169
831
Total (2 and older)
109
891
Estimated HIV prevalence among South Africans by age and sex 2008
Age
Male prevalence
Female prevalence
2-14
3
2
15-19
25
67
20-24
51
211
25-29
157
327
30-34
258
291
35-39
185
248
40-44
192
163
45-49
64
141
50-54
104
102
55-59
62
77
60+
35
18
Total
79
136
Among females HIV prevalence is highest in those between 25 and 29 years old among males the peak is in the group aged 30-34 years
HIV prevalence () by province 2002-2008
Province
2002
2005
2008
KwaZulu-Natal
117
165
158
Mpumalanga
141
152
154
Free State
149
126
126
North West
103
109
113
Gauteng
147
108
103
Eastern Cape
66
89
9
Limpopo
98
8
88
Northern Cape
84
54
59
Western Cape
107
19
38
National
114
108
109
The results of this study suggest that KwaZulu-Natal Mpumulanga and Free State have the highest HIV prevalence However the relatively small sample sizes may limit precision and in several cases the ranges of uncertainty overlap
HIV prevalence by population group 2008
Population group
Prevalence ()
African
136
864
White
03
997
Coloured
17
983
Indian
03
997
Studies of AIDS deaths
Latin America
Latin America
Latin America
Latin America
North America
North America
North America
North America
Eastern Europe
Eastern Europe
Eastern Europe
Eastern Europe
Western Europe
Western Europe
Western Europe
Western Europe
Asia Pacific
Asia Pacific
Asia Pacific
Asia Pacific
Africa
Africa
Africa
Africa
34
Gateway to Africa
35
Why Africa bull Large accessible population relatively new to clinical trials
bull Experienced and willing investigators
bull Many clinical trial sites established by PDPs NGOs etc
bull Expanding therapeutic areas shifting burden of disease from
infectious to non-communicable diseases
bull Significantly improved infrastructure and accessibility
bull Rapidly evolving regulatory and ethics procedures
bull Potential for capacity building and sustainable clinical trial potential
36
Relatively young GCP culture Resident mentorships to build capacity Locations ndash accessibility for site monitoring Variable infrastructure esp electricity connectivity and
transportation Resourcing of public healthcare systems
Sub-Saharan Africa challenges
37
bull Second-largest continent
bull Spans NS and EW hemispheres
bull Second most populous continent 2014 estimate 1069 billion
bull Home to more than a quarter of the 196 independent countries
bull All 54 African countries are UN members
bull 39 urban population
bull 12 metropolitan areas gt 4m
bull gt 3000 distinct ethnicities
bull gt 2000 languages spoken
AFRICA hellip the true size
wwwcitypopulationdeworldAgglomerations 2015
38
SSV to SIV
0
5
10
15
20
25
30
35
40
45
Africa North America
Asia Pacific
Western Europe
Eastern Europe
Latin America
Source Quintiles South Africa SACRA Conference 2008
Wee
ks (A
vera
ge)
Start-Up Timelines
39
Region Median
Patients Site
of Sites
0 pts 1 - 3 pts 4 - 9 pts 10+ pts
Latin America 40 21 26 30 23
North America 30 29 29 24 18
Eastern Europe 60 15 31 26 27
Western Europe 40 15 22 29 34
Asia Pacific 40 19 30 34 18
Africa 100 4 17 28 51
Enrollment performance by region for 2008
Site Performance
Source Quintiles South Africa Presented SACRA Conference 2009
40
0 1 2 3 4 5 6 7 8 9
10
Latin America
North America
Eastern Europe
Western Europe
Asia Pacific
Africa
Num
ber o
f par
ticip
ants
MEDIAN site enrollment by region for 2008
Source Quintiles South Africa Presented SACRA Conference 2009
Site Performance
41
Source Quintiles South Africa Presented SACRA Conference 2009
s
ites
0
5
10
15
20
25
30
35
40
45
50
LatinAmerica
NorthAmerica
EasternEurope
WesternEurope
Asia Pacific Africa
0 pts
1 - 3 pts
4 - 9 pts
10+ pts
Enrollment performance by region for 2008
Site Performance
Chart1
0 pts
1 - 3 pts
4 - 9 pts
10+ pts
021
026
03
023
029
029
024
018
015
031
026
027
015
022
029
034
019
03
034
018
004
017
028
051
HIV
HIV
Resiratory amp Cancer
Male prevalence
Female prevalence
CVS
Overall death rates
Overall death rates
COPD
Asthma
Tracheabronchial lung cancer
Oesophageal cancer
prostate cancer
Trial metrics
COPD
Asthma
Tracheabronchial lung cancer
Oesophageal cancer
Prostate cancer
Cervical cancer
Breast cancer
Stroke
ill-defined heart disease
Diabetes mellitus
Ischaemic heart disease
Hypertension
Nephritisnephrosis
Stroke
ill-defined heart disease
Diabetes mellitus
Ischaemic heart disease
Hypertension
Nephritisnephrosis
Males
Female
UN - Male
SA 1997
SA 2004
UN - Female
SA 1997
SA 2004
0 pts
1 - 3 pts
4 - 9 pts
10+ pts
42
Source wwwclinicaltrialsgov 22-Oct-2010
Clinical trials registered across Africa
43
0
500
1000
1500
2000
2500
South Africa Kenya Malawi Tanzania Uganda Zambia
Selected African countries
2005
2010
2015
Source ClinTrialsgov
Trend 2005 - 2015
Source wwwclinicaltrialsgov 28-Aug-2015
44
AFRICA FOUND IN TRANSLATION
bull Vast treatment-naiumlve population bull Cost advantages (still) bull Diverse ethnicity amp morbidity bull Inverse seasonality bull Site capacity-building widely implemented bull Robust regulatory review bull Variable but generally good regulatory timelines bull Established GCP culture ndash sites and home-bred CROs
45
THANK YOU
Foliennummer 1
Triclinium A South African CRO
Collaboration with VPM SII
Vaccine Trials in SA 2015
Foliennummer 5
Foliennummer 6
Foliennummer 7
Foliennummer 8
Foliennummer 9
Foliennummer 10
Foliennummer 11
Foliennummer 12
Foliennummer 13
Foliennummer 14
Foliennummer 15
Foliennummer 16
Foliennummer 17
Distribution of clinical trial sites
Foliennummer 19
South Africa Leading Causes of Death
Foliennummer 21
Foliennummer 22
South Africa TB deaths by age group
Foliennummer 24
Foliennummer 25
Foliennummer 26
Foliennummer 27
Foliennummer 28
Foliennummer 29
Foliennummer 30
Foliennummer 31
SA Clinical Trial Regulatory Processes
Clinical Trial Density Active sites million population
Foliennummer 34
Why Africa
Foliennummer 36
AFRICA hellip the true size
SSV to SIV
Foliennummer 39
Foliennummer 40
Foliennummer 41
Foliennummer 42
Foliennummer 43
AFRICA FOUND IN TRANSLATION
Foliennummer 45
Region
Median
of Sites
Patients Site
0 pts
1 - 3 pts
4 - 9 pts
10+ pts
Latin America
4
21
26
30
23
North America
3
29
29
24
18
Eastern Europe
6
15
31
26
27
Western Europe
4
15
22
29
34
Asia Pacific
4
19
30
34
18
Africa
10
4
17
28
51
0 pts
1 - 3 pts
4 - 9 pts
10+ pts
Latin America
21
26
30
23
North America
29
29
24
18
Eastern Europe
15
31
26
27
Western Europe
15
22
29
34
Asia Pacific
19
30
34
18
Africa
4
17
28
51
Males
Female
15-19
210
150
20-24
340
205
25-29
395
300
30-34
460
360
35-39
600
405
40-44
800
500
45-49
1100
700
50-54
1600
1050
55-54
2300
1580
60-64
3340
2250
UN - Male
SA 1997
SA 2004
UN - Female
SA 1997
SA 2004
15-19
210
235
216
150
165
187
20-24
340
381
555
205
331
1085
25-29
395
625
1081
300
452
1985
30-34
460
817
2118
360
489
2267
35-39
600
916
2498
405
526
1890
40-44
800
1136
2765
500
615
1548
45-49
1100
1486
2744
700
800
1400
50-54
1600
2016
2979
1050
1116
1506
55-54
2300
2838
3270
1580
1626
1717
60-64
3340
3614
4146
2250
2201
2360
Stroke
ill-defined heart disease
Diabetes mellitus
Ischaemic heart disease
Hypertension
Nephritisnephrosis
Stroke
ill-defined heart disease
Diabetes mellitus
Ischaemic heart disease
Hypertension
Nephritisnephrosis
1999
34
345
20
248
14
10
1999
295
246
23
10
145
68
2000
36
362
218
249
152
112
2000
318
268
241
108
16
8
2001
35
372
22
25
15
125
2001
322
28
252
102
162
95
2002
405
298
24
26
147
126
2002
352
295
27
115
16
10
2003
425
32
245
285
152
15
2003
382
299
285
122
17
12
2004
39
325
255
26
165
16
2004
35
30
295
121
19
119
2005
36
328
265
26
15
162
2005
325
30
32
12
18
12
2006
35
336
27
258
155
16
2006
33
32
32
11
18
125
COPD
Asthma
Tracheabronchial lung cancer
Oesophageal cancer
prostate cancer
Cervical cancer
Breast cancer
1999
2001
12
135
10
26
2000
204
116
13
92
28
2001
222
131
133
96
27
2002
23
144
128
95
285
2003
243
149
124
94
29
2004
229
154
1255
87
29
2005
224
152
122
82
295
2006
224
136
116
75
3
COPD
Asthma
Tracheabronchial lung cancer
Oesophageal cancer
Prostate cancer
Cervical cancer
Breast cancer
1999
88
92
43
41
106
82
2000
96
95
4
43
11
81
2001
10
109
4
4
111
89
2002
10
116
4
4
112
85
2003
11
124
4
395
116
85
2004
102
1295
44
39
115
101
2005
105
128
42
38
1185
10
2006
10
12
42
32
1205
10
Based on this survey the researchers estimate that 109 of all South Africans over 2 years old were living with HIV in 2008 In 2002 and 2005 this figure was 114 and 108 respectively showing a degree of stabilisation Among those between 15 and 49 years old the estimated HIV prevalence was 169 in 2008 The survey found the prevalence among children aged 2-14 to be 25 down significantly since 2002 when prevalence was 56
Estimated HIV prevalence () among South Africans aged 2 years and older by age 2002-2008
Age
HIV +
HIV -
Children (2-14 years)
25
975
Youth (15-24 years)
87
913
Adults (25 and older)
168
832
(15-49 years)
169
831
Total (2 and older)
109
891
Estimated HIV prevalence among South Africans by age and sex 2008
Age
Male prevalence
Female prevalence
2-14
3
2
15-19
25
67
20-24
51
211
25-29
157
327
30-34
258
291
35-39
185
248
40-44
192
163
45-49
64
141
50-54
104
102
55-59
62
77
60+
35
18
Total
79
136
Among females HIV prevalence is highest in those between 25 and 29 years old among males the peak is in the group aged 30-34 years
HIV prevalence () by province 2002-2008
Province
2002
2005
2008
KwaZulu-Natal
117
165
158
Mpumalanga
141
152
154
Free State
149
126
126
North West
103
109
113
Gauteng
147
108
103
Eastern Cape
66
89
9
Limpopo
98
8
88
Northern Cape
84
54
59
Western Cape
107
19
38
National
114
108
109
The results of this study suggest that KwaZulu-Natal Mpumulanga and Free State have the highest HIV prevalence However the relatively small sample sizes may limit precision and in several cases the ranges of uncertainty overlap
HIV prevalence by population group 2008
Population group
Prevalence ()
African
136
864
White
03
997
Coloured
17
983
Indian
03
997
Studies of AIDS deaths
Latin America
Latin America
Latin America
Latin America
North America
North America
North America
North America
Eastern Europe
Eastern Europe
Eastern Europe
Eastern Europe
Western Europe
Western Europe
Western Europe
Western Europe
Asia Pacific
Asia Pacific
Asia Pacific
Asia Pacific
Africa
Africa
Africa
Africa
35
Why Africa bull Large accessible population relatively new to clinical trials
bull Experienced and willing investigators
bull Many clinical trial sites established by PDPs NGOs etc
bull Expanding therapeutic areas shifting burden of disease from
infectious to non-communicable diseases
bull Significantly improved infrastructure and accessibility
bull Rapidly evolving regulatory and ethics procedures
bull Potential for capacity building and sustainable clinical trial potential
36
Relatively young GCP culture Resident mentorships to build capacity Locations ndash accessibility for site monitoring Variable infrastructure esp electricity connectivity and
transportation Resourcing of public healthcare systems
Sub-Saharan Africa challenges
37
bull Second-largest continent
bull Spans NS and EW hemispheres
bull Second most populous continent 2014 estimate 1069 billion
bull Home to more than a quarter of the 196 independent countries
bull All 54 African countries are UN members
bull 39 urban population
bull 12 metropolitan areas gt 4m
bull gt 3000 distinct ethnicities
bull gt 2000 languages spoken
AFRICA hellip the true size
wwwcitypopulationdeworldAgglomerations 2015
38
SSV to SIV
0
5
10
15
20
25
30
35
40
45
Africa North America
Asia Pacific
Western Europe
Eastern Europe
Latin America
Source Quintiles South Africa SACRA Conference 2008
Wee
ks (A
vera
ge)
Start-Up Timelines
39
Region Median
Patients Site
of Sites
0 pts 1 - 3 pts 4 - 9 pts 10+ pts
Latin America 40 21 26 30 23
North America 30 29 29 24 18
Eastern Europe 60 15 31 26 27
Western Europe 40 15 22 29 34
Asia Pacific 40 19 30 34 18
Africa 100 4 17 28 51
Enrollment performance by region for 2008
Site Performance
Source Quintiles South Africa Presented SACRA Conference 2009
40
0 1 2 3 4 5 6 7 8 9
10
Latin America
North America
Eastern Europe
Western Europe
Asia Pacific
Africa
Num
ber o
f par
ticip
ants
MEDIAN site enrollment by region for 2008
Source Quintiles South Africa Presented SACRA Conference 2009
Site Performance
41
Source Quintiles South Africa Presented SACRA Conference 2009
s
ites
0
5
10
15
20
25
30
35
40
45
50
LatinAmerica
NorthAmerica
EasternEurope
WesternEurope
Asia Pacific Africa
0 pts
1 - 3 pts
4 - 9 pts
10+ pts
Enrollment performance by region for 2008
Site Performance
Chart1
0 pts
1 - 3 pts
4 - 9 pts
10+ pts
021
026
03
023
029
029
024
018
015
031
026
027
015
022
029
034
019
03
034
018
004
017
028
051
HIV
HIV
Resiratory amp Cancer
Male prevalence
Female prevalence
CVS
Overall death rates
Overall death rates
COPD
Asthma
Tracheabronchial lung cancer
Oesophageal cancer
prostate cancer
Trial metrics
COPD
Asthma
Tracheabronchial lung cancer
Oesophageal cancer
Prostate cancer
Cervical cancer
Breast cancer
Stroke
ill-defined heart disease
Diabetes mellitus
Ischaemic heart disease
Hypertension
Nephritisnephrosis
Stroke
ill-defined heart disease
Diabetes mellitus
Ischaemic heart disease
Hypertension
Nephritisnephrosis
Males
Female
UN - Male
SA 1997
SA 2004
UN - Female
SA 1997
SA 2004
0 pts
1 - 3 pts
4 - 9 pts
10+ pts
42
Source wwwclinicaltrialsgov 22-Oct-2010
Clinical trials registered across Africa
43
0
500
1000
1500
2000
2500
South Africa Kenya Malawi Tanzania Uganda Zambia
Selected African countries
2005
2010
2015
Source ClinTrialsgov
Trend 2005 - 2015
Source wwwclinicaltrialsgov 28-Aug-2015
44
AFRICA FOUND IN TRANSLATION
bull Vast treatment-naiumlve population bull Cost advantages (still) bull Diverse ethnicity amp morbidity bull Inverse seasonality bull Site capacity-building widely implemented bull Robust regulatory review bull Variable but generally good regulatory timelines bull Established GCP culture ndash sites and home-bred CROs
45
THANK YOU
Foliennummer 1
Triclinium A South African CRO
Collaboration with VPM SII
Vaccine Trials in SA 2015
Foliennummer 5
Foliennummer 6
Foliennummer 7
Foliennummer 8
Foliennummer 9
Foliennummer 10
Foliennummer 11
Foliennummer 12
Foliennummer 13
Foliennummer 14
Foliennummer 15
Foliennummer 16
Foliennummer 17
Distribution of clinical trial sites
Foliennummer 19
South Africa Leading Causes of Death
Foliennummer 21
Foliennummer 22
South Africa TB deaths by age group
Foliennummer 24
Foliennummer 25
Foliennummer 26
Foliennummer 27
Foliennummer 28
Foliennummer 29
Foliennummer 30
Foliennummer 31
SA Clinical Trial Regulatory Processes
Clinical Trial Density Active sites million population
Foliennummer 34
Why Africa
Foliennummer 36
AFRICA hellip the true size
SSV to SIV
Foliennummer 39
Foliennummer 40
Foliennummer 41
Foliennummer 42
Foliennummer 43
AFRICA FOUND IN TRANSLATION
Foliennummer 45
Region
Median
of Sites
Patients Site
0 pts
1 - 3 pts
4 - 9 pts
10+ pts
Latin America
4
21
26
30
23
North America
3
29
29
24
18
Eastern Europe
6
15
31
26
27
Western Europe
4
15
22
29
34
Asia Pacific
4
19
30
34
18
Africa
10
4
17
28
51
0 pts
1 - 3 pts
4 - 9 pts
10+ pts
Latin America
21
26
30
23
North America
29
29
24
18
Eastern Europe
15
31
26
27
Western Europe
15
22
29
34
Asia Pacific
19
30
34
18
Africa
4
17
28
51
Males
Female
15-19
210
150
20-24
340
205
25-29
395
300
30-34
460
360
35-39
600
405
40-44
800
500
45-49
1100
700
50-54
1600
1050
55-54
2300
1580
60-64
3340
2250
UN - Male
SA 1997
SA 2004
UN - Female
SA 1997
SA 2004
15-19
210
235
216
150
165
187
20-24
340
381
555
205
331
1085
25-29
395
625
1081
300
452
1985
30-34
460
817
2118
360
489
2267
35-39
600
916
2498
405
526
1890
40-44
800
1136
2765
500
615
1548
45-49
1100
1486
2744
700
800
1400
50-54
1600
2016
2979
1050
1116
1506
55-54
2300
2838
3270
1580
1626
1717
60-64
3340
3614
4146
2250
2201
2360
Stroke
ill-defined heart disease
Diabetes mellitus
Ischaemic heart disease
Hypertension
Nephritisnephrosis
Stroke
ill-defined heart disease
Diabetes mellitus
Ischaemic heart disease
Hypertension
Nephritisnephrosis
1999
34
345
20
248
14
10
1999
295
246
23
10
145
68
2000
36
362
218
249
152
112
2000
318
268
241
108
16
8
2001
35
372
22
25
15
125
2001
322
28
252
102
162
95
2002
405
298
24
26
147
126
2002
352
295
27
115
16
10
2003
425
32
245
285
152
15
2003
382
299
285
122
17
12
2004
39
325
255
26
165
16
2004
35
30
295
121
19
119
2005
36
328
265
26
15
162
2005
325
30
32
12
18
12
2006
35
336
27
258
155
16
2006
33
32
32
11
18
125
COPD
Asthma
Tracheabronchial lung cancer
Oesophageal cancer
prostate cancer
Cervical cancer
Breast cancer
1999
2001
12
135
10
26
2000
204
116
13
92
28
2001
222
131
133
96
27
2002
23
144
128
95
285
2003
243
149
124
94
29
2004
229
154
1255
87
29
2005
224
152
122
82
295
2006
224
136
116
75
3
COPD
Asthma
Tracheabronchial lung cancer
Oesophageal cancer
Prostate cancer
Cervical cancer
Breast cancer
1999
88
92
43
41
106
82
2000
96
95
4
43
11
81
2001
10
109
4
4
111
89
2002
10
116
4
4
112
85
2003
11
124
4
395
116
85
2004
102
1295
44
39
115
101
2005
105
128
42
38
1185
10
2006
10
12
42
32
1205
10
Based on this survey the researchers estimate that 109 of all South Africans over 2 years old were living with HIV in 2008 In 2002 and 2005 this figure was 114 and 108 respectively showing a degree of stabilisation Among those between 15 and 49 years old the estimated HIV prevalence was 169 in 2008 The survey found the prevalence among children aged 2-14 to be 25 down significantly since 2002 when prevalence was 56
Estimated HIV prevalence () among South Africans aged 2 years and older by age 2002-2008
Age
HIV +
HIV -
Children (2-14 years)
25
975
Youth (15-24 years)
87
913
Adults (25 and older)
168
832
(15-49 years)
169
831
Total (2 and older)
109
891
Estimated HIV prevalence among South Africans by age and sex 2008
Age
Male prevalence
Female prevalence
2-14
3
2
15-19
25
67
20-24
51
211
25-29
157
327
30-34
258
291
35-39
185
248
40-44
192
163
45-49
64
141
50-54
104
102
55-59
62
77
60+
35
18
Total
79
136
Among females HIV prevalence is highest in those between 25 and 29 years old among males the peak is in the group aged 30-34 years
HIV prevalence () by province 2002-2008
Province
2002
2005
2008
KwaZulu-Natal
117
165
158
Mpumalanga
141
152
154
Free State
149
126
126
North West
103
109
113
Gauteng
147
108
103
Eastern Cape
66
89
9
Limpopo
98
8
88
Northern Cape
84
54
59
Western Cape
107
19
38
National
114
108
109
The results of this study suggest that KwaZulu-Natal Mpumulanga and Free State have the highest HIV prevalence However the relatively small sample sizes may limit precision and in several cases the ranges of uncertainty overlap
HIV prevalence by population group 2008
Population group
Prevalence ()
African
136
864
White
03
997
Coloured
17
983
Indian
03
997
Studies of AIDS deaths
Latin America
Latin America
Latin America
Latin America
North America
North America
North America
North America
Eastern Europe
Eastern Europe
Eastern Europe
Eastern Europe
Western Europe
Western Europe
Western Europe
Western Europe
Asia Pacific
Asia Pacific
Asia Pacific
Asia Pacific
Africa
Africa
Africa
Africa
36
Relatively young GCP culture Resident mentorships to build capacity Locations ndash accessibility for site monitoring Variable infrastructure esp electricity connectivity and
transportation Resourcing of public healthcare systems
Sub-Saharan Africa challenges
37
bull Second-largest continent
bull Spans NS and EW hemispheres
bull Second most populous continent 2014 estimate 1069 billion
bull Home to more than a quarter of the 196 independent countries
bull All 54 African countries are UN members
bull 39 urban population
bull 12 metropolitan areas gt 4m
bull gt 3000 distinct ethnicities
bull gt 2000 languages spoken
AFRICA hellip the true size
wwwcitypopulationdeworldAgglomerations 2015
38
SSV to SIV
0
5
10
15
20
25
30
35
40
45
Africa North America
Asia Pacific
Western Europe
Eastern Europe
Latin America
Source Quintiles South Africa SACRA Conference 2008
Wee
ks (A
vera
ge)
Start-Up Timelines
39
Region Median
Patients Site
of Sites
0 pts 1 - 3 pts 4 - 9 pts 10+ pts
Latin America 40 21 26 30 23
North America 30 29 29 24 18
Eastern Europe 60 15 31 26 27
Western Europe 40 15 22 29 34
Asia Pacific 40 19 30 34 18
Africa 100 4 17 28 51
Enrollment performance by region for 2008
Site Performance
Source Quintiles South Africa Presented SACRA Conference 2009
40
0 1 2 3 4 5 6 7 8 9
10
Latin America
North America
Eastern Europe
Western Europe
Asia Pacific
Africa
Num
ber o
f par
ticip
ants
MEDIAN site enrollment by region for 2008
Source Quintiles South Africa Presented SACRA Conference 2009
Site Performance
41
Source Quintiles South Africa Presented SACRA Conference 2009
s
ites
0
5
10
15
20
25
30
35
40
45
50
LatinAmerica
NorthAmerica
EasternEurope
WesternEurope
Asia Pacific Africa
0 pts
1 - 3 pts
4 - 9 pts
10+ pts
Enrollment performance by region for 2008
Site Performance
Chart1
0 pts
1 - 3 pts
4 - 9 pts
10+ pts
021
026
03
023
029
029
024
018
015
031
026
027
015
022
029
034
019
03
034
018
004
017
028
051
HIV
HIV
Resiratory amp Cancer
Male prevalence
Female prevalence
CVS
Overall death rates
Overall death rates
COPD
Asthma
Tracheabronchial lung cancer
Oesophageal cancer
prostate cancer
Trial metrics
COPD
Asthma
Tracheabronchial lung cancer
Oesophageal cancer
Prostate cancer
Cervical cancer
Breast cancer
Stroke
ill-defined heart disease
Diabetes mellitus
Ischaemic heart disease
Hypertension
Nephritisnephrosis
Stroke
ill-defined heart disease
Diabetes mellitus
Ischaemic heart disease
Hypertension
Nephritisnephrosis
Males
Female
UN - Male
SA 1997
SA 2004
UN - Female
SA 1997
SA 2004
0 pts
1 - 3 pts
4 - 9 pts
10+ pts
42
Source wwwclinicaltrialsgov 22-Oct-2010
Clinical trials registered across Africa
43
0
500
1000
1500
2000
2500
South Africa Kenya Malawi Tanzania Uganda Zambia
Selected African countries
2005
2010
2015
Source ClinTrialsgov
Trend 2005 - 2015
Source wwwclinicaltrialsgov 28-Aug-2015
44
AFRICA FOUND IN TRANSLATION
bull Vast treatment-naiumlve population bull Cost advantages (still) bull Diverse ethnicity amp morbidity bull Inverse seasonality bull Site capacity-building widely implemented bull Robust regulatory review bull Variable but generally good regulatory timelines bull Established GCP culture ndash sites and home-bred CROs
45
THANK YOU
Foliennummer 1
Triclinium A South African CRO
Collaboration with VPM SII
Vaccine Trials in SA 2015
Foliennummer 5
Foliennummer 6
Foliennummer 7
Foliennummer 8
Foliennummer 9
Foliennummer 10
Foliennummer 11
Foliennummer 12
Foliennummer 13
Foliennummer 14
Foliennummer 15
Foliennummer 16
Foliennummer 17
Distribution of clinical trial sites
Foliennummer 19
South Africa Leading Causes of Death
Foliennummer 21
Foliennummer 22
South Africa TB deaths by age group
Foliennummer 24
Foliennummer 25
Foliennummer 26
Foliennummer 27
Foliennummer 28
Foliennummer 29
Foliennummer 30
Foliennummer 31
SA Clinical Trial Regulatory Processes
Clinical Trial Density Active sites million population
Foliennummer 34
Why Africa
Foliennummer 36
AFRICA hellip the true size
SSV to SIV
Foliennummer 39
Foliennummer 40
Foliennummer 41
Foliennummer 42
Foliennummer 43
AFRICA FOUND IN TRANSLATION
Foliennummer 45
Region
Median
of Sites
Patients Site
0 pts
1 - 3 pts
4 - 9 pts
10+ pts
Latin America
4
21
26
30
23
North America
3
29
29
24
18
Eastern Europe
6
15
31
26
27
Western Europe
4
15
22
29
34
Asia Pacific
4
19
30
34
18
Africa
10
4
17
28
51
0 pts
1 - 3 pts
4 - 9 pts
10+ pts
Latin America
21
26
30
23
North America
29
29
24
18
Eastern Europe
15
31
26
27
Western Europe
15
22
29
34
Asia Pacific
19
30
34
18
Africa
4
17
28
51
Males
Female
15-19
210
150
20-24
340
205
25-29
395
300
30-34
460
360
35-39
600
405
40-44
800
500
45-49
1100
700
50-54
1600
1050
55-54
2300
1580
60-64
3340
2250
UN - Male
SA 1997
SA 2004
UN - Female
SA 1997
SA 2004
15-19
210
235
216
150
165
187
20-24
340
381
555
205
331
1085
25-29
395
625
1081
300
452
1985
30-34
460
817
2118
360
489
2267
35-39
600
916
2498
405
526
1890
40-44
800
1136
2765
500
615
1548
45-49
1100
1486
2744
700
800
1400
50-54
1600
2016
2979
1050
1116
1506
55-54
2300
2838
3270
1580
1626
1717
60-64
3340
3614
4146
2250
2201
2360
Stroke
ill-defined heart disease
Diabetes mellitus
Ischaemic heart disease
Hypertension
Nephritisnephrosis
Stroke
ill-defined heart disease
Diabetes mellitus
Ischaemic heart disease
Hypertension
Nephritisnephrosis
1999
34
345
20
248
14
10
1999
295
246
23
10
145
68
2000
36
362
218
249
152
112
2000
318
268
241
108
16
8
2001
35
372
22
25
15
125
2001
322
28
252
102
162
95
2002
405
298
24
26
147
126
2002
352
295
27
115
16
10
2003
425
32
245
285
152
15
2003
382
299
285
122
17
12
2004
39
325
255
26
165
16
2004
35
30
295
121
19
119
2005
36
328
265
26
15
162
2005
325
30
32
12
18
12
2006
35
336
27
258
155
16
2006
33
32
32
11
18
125
COPD
Asthma
Tracheabronchial lung cancer
Oesophageal cancer
prostate cancer
Cervical cancer
Breast cancer
1999
2001
12
135
10
26
2000
204
116
13
92
28
2001
222
131
133
96
27
2002
23
144
128
95
285
2003
243
149
124
94
29
2004
229
154
1255
87
29
2005
224
152
122
82
295
2006
224
136
116
75
3
COPD
Asthma
Tracheabronchial lung cancer
Oesophageal cancer
Prostate cancer
Cervical cancer
Breast cancer
1999
88
92
43
41
106
82
2000
96
95
4
43
11
81
2001
10
109
4
4
111
89
2002
10
116
4
4
112
85
2003
11
124
4
395
116
85
2004
102
1295
44
39
115
101
2005
105
128
42
38
1185
10
2006
10
12
42
32
1205
10
Based on this survey the researchers estimate that 109 of all South Africans over 2 years old were living with HIV in 2008 In 2002 and 2005 this figure was 114 and 108 respectively showing a degree of stabilisation Among those between 15 and 49 years old the estimated HIV prevalence was 169 in 2008 The survey found the prevalence among children aged 2-14 to be 25 down significantly since 2002 when prevalence was 56
Estimated HIV prevalence () among South Africans aged 2 years and older by age 2002-2008
Age
HIV +
HIV -
Children (2-14 years)
25
975
Youth (15-24 years)
87
913
Adults (25 and older)
168
832
(15-49 years)
169
831
Total (2 and older)
109
891
Estimated HIV prevalence among South Africans by age and sex 2008
Age
Male prevalence
Female prevalence
2-14
3
2
15-19
25
67
20-24
51
211
25-29
157
327
30-34
258
291
35-39
185
248
40-44
192
163
45-49
64
141
50-54
104
102
55-59
62
77
60+
35
18
Total
79
136
Among females HIV prevalence is highest in those between 25 and 29 years old among males the peak is in the group aged 30-34 years
HIV prevalence () by province 2002-2008
Province
2002
2005
2008
KwaZulu-Natal
117
165
158
Mpumalanga
141
152
154
Free State
149
126
126
North West
103
109
113
Gauteng
147
108
103
Eastern Cape
66
89
9
Limpopo
98
8
88
Northern Cape
84
54
59
Western Cape
107
19
38
National
114
108
109
The results of this study suggest that KwaZulu-Natal Mpumulanga and Free State have the highest HIV prevalence However the relatively small sample sizes may limit precision and in several cases the ranges of uncertainty overlap
HIV prevalence by population group 2008
Population group
Prevalence ()
African
136
864
White
03
997
Coloured
17
983
Indian
03
997
Studies of AIDS deaths
Latin America
Latin America
Latin America
Latin America
North America
North America
North America
North America
Eastern Europe
Eastern Europe
Eastern Europe
Eastern Europe
Western Europe
Western Europe
Western Europe
Western Europe
Asia Pacific
Asia Pacific
Asia Pacific
Asia Pacific
Africa
Africa
Africa
Africa
38
SSV to SIV
0
5
10
15
20
25
30
35
40
45
Africa North America
Asia Pacific
Western Europe
Eastern Europe
Latin America
Source Quintiles South Africa SACRA Conference 2008
Wee
ks (A
vera
ge)
Start-Up Timelines
39
Region Median
Patients Site
of Sites
0 pts 1 - 3 pts 4 - 9 pts 10+ pts
Latin America 40 21 26 30 23
North America 30 29 29 24 18
Eastern Europe 60 15 31 26 27
Western Europe 40 15 22 29 34
Asia Pacific 40 19 30 34 18
Africa 100 4 17 28 51
Enrollment performance by region for 2008
Site Performance
Source Quintiles South Africa Presented SACRA Conference 2009
40
0 1 2 3 4 5 6 7 8 9
10
Latin America
North America
Eastern Europe
Western Europe
Asia Pacific
Africa
Num
ber o
f par
ticip
ants
MEDIAN site enrollment by region for 2008
Source Quintiles South Africa Presented SACRA Conference 2009
Site Performance
41
Source Quintiles South Africa Presented SACRA Conference 2009
s
ites
0
5
10
15
20
25
30
35
40
45
50
LatinAmerica
NorthAmerica
EasternEurope
WesternEurope
Asia Pacific Africa
0 pts
1 - 3 pts
4 - 9 pts
10+ pts
Enrollment performance by region for 2008
Site Performance
Chart1
0 pts
1 - 3 pts
4 - 9 pts
10+ pts
021
026
03
023
029
029
024
018
015
031
026
027
015
022
029
034
019
03
034
018
004
017
028
051
HIV
HIV
Resiratory amp Cancer
Male prevalence
Female prevalence
CVS
Overall death rates
Overall death rates
COPD
Asthma
Tracheabronchial lung cancer
Oesophageal cancer
prostate cancer
Trial metrics
COPD
Asthma
Tracheabronchial lung cancer
Oesophageal cancer
Prostate cancer
Cervical cancer
Breast cancer
Stroke
ill-defined heart disease
Diabetes mellitus
Ischaemic heart disease
Hypertension
Nephritisnephrosis
Stroke
ill-defined heart disease
Diabetes mellitus
Ischaemic heart disease
Hypertension
Nephritisnephrosis
Males
Female
UN - Male
SA 1997
SA 2004
UN - Female
SA 1997
SA 2004
0 pts
1 - 3 pts
4 - 9 pts
10+ pts
42
Source wwwclinicaltrialsgov 22-Oct-2010
Clinical trials registered across Africa
43
0
500
1000
1500
2000
2500
South Africa Kenya Malawi Tanzania Uganda Zambia
Selected African countries
2005
2010
2015
Source ClinTrialsgov
Trend 2005 - 2015
Source wwwclinicaltrialsgov 28-Aug-2015
44
AFRICA FOUND IN TRANSLATION
bull Vast treatment-naiumlve population bull Cost advantages (still) bull Diverse ethnicity amp morbidity bull Inverse seasonality bull Site capacity-building widely implemented bull Robust regulatory review bull Variable but generally good regulatory timelines bull Established GCP culture ndash sites and home-bred CROs
45
THANK YOU
Foliennummer 1
Triclinium A South African CRO
Collaboration with VPM SII
Vaccine Trials in SA 2015
Foliennummer 5
Foliennummer 6
Foliennummer 7
Foliennummer 8
Foliennummer 9
Foliennummer 10
Foliennummer 11
Foliennummer 12
Foliennummer 13
Foliennummer 14
Foliennummer 15
Foliennummer 16
Foliennummer 17
Distribution of clinical trial sites
Foliennummer 19
South Africa Leading Causes of Death
Foliennummer 21
Foliennummer 22
South Africa TB deaths by age group
Foliennummer 24
Foliennummer 25
Foliennummer 26
Foliennummer 27
Foliennummer 28
Foliennummer 29
Foliennummer 30
Foliennummer 31
SA Clinical Trial Regulatory Processes
Clinical Trial Density Active sites million population
Foliennummer 34
Why Africa
Foliennummer 36
AFRICA hellip the true size
SSV to SIV
Foliennummer 39
Foliennummer 40
Foliennummer 41
Foliennummer 42
Foliennummer 43
AFRICA FOUND IN TRANSLATION
Foliennummer 45
Region
Median
of Sites
Patients Site
0 pts
1 - 3 pts
4 - 9 pts
10+ pts
Latin America
4
21
26
30
23
North America
3
29
29
24
18
Eastern Europe
6
15
31
26
27
Western Europe
4
15
22
29
34
Asia Pacific
4
19
30
34
18
Africa
10
4
17
28
51
0 pts
1 - 3 pts
4 - 9 pts
10+ pts
Latin America
21
26
30
23
North America
29
29
24
18
Eastern Europe
15
31
26
27
Western Europe
15
22
29
34
Asia Pacific
19
30
34
18
Africa
4
17
28
51
Males
Female
15-19
210
150
20-24
340
205
25-29
395
300
30-34
460
360
35-39
600
405
40-44
800
500
45-49
1100
700
50-54
1600
1050
55-54
2300
1580
60-64
3340
2250
UN - Male
SA 1997
SA 2004
UN - Female
SA 1997
SA 2004
15-19
210
235
216
150
165
187
20-24
340
381
555
205
331
1085
25-29
395
625
1081
300
452
1985
30-34
460
817
2118
360
489
2267
35-39
600
916
2498
405
526
1890
40-44
800
1136
2765
500
615
1548
45-49
1100
1486
2744
700
800
1400
50-54
1600
2016
2979
1050
1116
1506
55-54
2300
2838
3270
1580
1626
1717
60-64
3340
3614
4146
2250
2201
2360
Stroke
ill-defined heart disease
Diabetes mellitus
Ischaemic heart disease
Hypertension
Nephritisnephrosis
Stroke
ill-defined heart disease
Diabetes mellitus
Ischaemic heart disease
Hypertension
Nephritisnephrosis
1999
34
345
20
248
14
10
1999
295
246
23
10
145
68
2000
36
362
218
249
152
112
2000
318
268
241
108
16
8
2001
35
372
22
25
15
125
2001
322
28
252
102
162
95
2002
405
298
24
26
147
126
2002
352
295
27
115
16
10
2003
425
32
245
285
152
15
2003
382
299
285
122
17
12
2004
39
325
255
26
165
16
2004
35
30
295
121
19
119
2005
36
328
265
26
15
162
2005
325
30
32
12
18
12
2006
35
336
27
258
155
16
2006
33
32
32
11
18
125
COPD
Asthma
Tracheabronchial lung cancer
Oesophageal cancer
prostate cancer
Cervical cancer
Breast cancer
1999
2001
12
135
10
26
2000
204
116
13
92
28
2001
222
131
133
96
27
2002
23
144
128
95
285
2003
243
149
124
94
29
2004
229
154
1255
87
29
2005
224
152
122
82
295
2006
224
136
116
75
3
COPD
Asthma
Tracheabronchial lung cancer
Oesophageal cancer
Prostate cancer
Cervical cancer
Breast cancer
1999
88
92
43
41
106
82
2000
96
95
4
43
11
81
2001
10
109
4
4
111
89
2002
10
116
4
4
112
85
2003
11
124
4
395
116
85
2004
102
1295
44
39
115
101
2005
105
128
42
38
1185
10
2006
10
12
42
32
1205
10
Based on this survey the researchers estimate that 109 of all South Africans over 2 years old were living with HIV in 2008 In 2002 and 2005 this figure was 114 and 108 respectively showing a degree of stabilisation Among those between 15 and 49 years old the estimated HIV prevalence was 169 in 2008 The survey found the prevalence among children aged 2-14 to be 25 down significantly since 2002 when prevalence was 56
Estimated HIV prevalence () among South Africans aged 2 years and older by age 2002-2008
Age
HIV +
HIV -
Children (2-14 years)
25
975
Youth (15-24 years)
87
913
Adults (25 and older)
168
832
(15-49 years)
169
831
Total (2 and older)
109
891
Estimated HIV prevalence among South Africans by age and sex 2008
Age
Male prevalence
Female prevalence
2-14
3
2
15-19
25
67
20-24
51
211
25-29
157
327
30-34
258
291
35-39
185
248
40-44
192
163
45-49
64
141
50-54
104
102
55-59
62
77
60+
35
18
Total
79
136
Among females HIV prevalence is highest in those between 25 and 29 years old among males the peak is in the group aged 30-34 years
HIV prevalence () by province 2002-2008
Province
2002
2005
2008
KwaZulu-Natal
117
165
158
Mpumalanga
141
152
154
Free State
149
126
126
North West
103
109
113
Gauteng
147
108
103
Eastern Cape
66
89
9
Limpopo
98
8
88
Northern Cape
84
54
59
Western Cape
107
19
38
National
114
108
109
The results of this study suggest that KwaZulu-Natal Mpumulanga and Free State have the highest HIV prevalence However the relatively small sample sizes may limit precision and in several cases the ranges of uncertainty overlap
HIV prevalence by population group 2008
Population group
Prevalence ()
African
136
864
White
03
997
Coloured
17
983
Indian
03
997
Studies of AIDS deaths
Latin America
Latin America
Latin America
Latin America
North America
North America
North America
North America
Eastern Europe
Eastern Europe
Eastern Europe
Eastern Europe
Western Europe
Western Europe
Western Europe
Western Europe
Asia Pacific
Asia Pacific
Asia Pacific
Asia Pacific
Africa
Africa
Africa
Africa
39
Region Median
Patients Site
of Sites
0 pts 1 - 3 pts 4 - 9 pts 10+ pts
Latin America 40 21 26 30 23
North America 30 29 29 24 18
Eastern Europe 60 15 31 26 27
Western Europe 40 15 22 29 34
Asia Pacific 40 19 30 34 18
Africa 100 4 17 28 51
Enrollment performance by region for 2008
Site Performance
Source Quintiles South Africa Presented SACRA Conference 2009
40
0 1 2 3 4 5 6 7 8 9
10
Latin America
North America
Eastern Europe
Western Europe
Asia Pacific
Africa
Num
ber o
f par
ticip
ants
MEDIAN site enrollment by region for 2008
Source Quintiles South Africa Presented SACRA Conference 2009
Site Performance
41
Source Quintiles South Africa Presented SACRA Conference 2009
s
ites
0
5
10
15
20
25
30
35
40
45
50
LatinAmerica
NorthAmerica
EasternEurope
WesternEurope
Asia Pacific Africa
0 pts
1 - 3 pts
4 - 9 pts
10+ pts
Enrollment performance by region for 2008
Site Performance
Chart1
0 pts
1 - 3 pts
4 - 9 pts
10+ pts
021
026
03
023
029
029
024
018
015
031
026
027
015
022
029
034
019
03
034
018
004
017
028
051
HIV
HIV
Resiratory amp Cancer
Male prevalence
Female prevalence
CVS
Overall death rates
Overall death rates
COPD
Asthma
Tracheabronchial lung cancer
Oesophageal cancer
prostate cancer
Trial metrics
COPD
Asthma
Tracheabronchial lung cancer
Oesophageal cancer
Prostate cancer
Cervical cancer
Breast cancer
Stroke
ill-defined heart disease
Diabetes mellitus
Ischaemic heart disease
Hypertension
Nephritisnephrosis
Stroke
ill-defined heart disease
Diabetes mellitus
Ischaemic heart disease
Hypertension
Nephritisnephrosis
Males
Female
UN - Male
SA 1997
SA 2004
UN - Female
SA 1997
SA 2004
0 pts
1 - 3 pts
4 - 9 pts
10+ pts
42
Source wwwclinicaltrialsgov 22-Oct-2010
Clinical trials registered across Africa
43
0
500
1000
1500
2000
2500
South Africa Kenya Malawi Tanzania Uganda Zambia
Selected African countries
2005
2010
2015
Source ClinTrialsgov
Trend 2005 - 2015
Source wwwclinicaltrialsgov 28-Aug-2015
44
AFRICA FOUND IN TRANSLATION
bull Vast treatment-naiumlve population bull Cost advantages (still) bull Diverse ethnicity amp morbidity bull Inverse seasonality bull Site capacity-building widely implemented bull Robust regulatory review bull Variable but generally good regulatory timelines bull Established GCP culture ndash sites and home-bred CROs
45
THANK YOU
Foliennummer 1
Triclinium A South African CRO
Collaboration with VPM SII
Vaccine Trials in SA 2015
Foliennummer 5
Foliennummer 6
Foliennummer 7
Foliennummer 8
Foliennummer 9
Foliennummer 10
Foliennummer 11
Foliennummer 12
Foliennummer 13
Foliennummer 14
Foliennummer 15
Foliennummer 16
Foliennummer 17
Distribution of clinical trial sites
Foliennummer 19
South Africa Leading Causes of Death
Foliennummer 21
Foliennummer 22
South Africa TB deaths by age group
Foliennummer 24
Foliennummer 25
Foliennummer 26
Foliennummer 27
Foliennummer 28
Foliennummer 29
Foliennummer 30
Foliennummer 31
SA Clinical Trial Regulatory Processes
Clinical Trial Density Active sites million population
Foliennummer 34
Why Africa
Foliennummer 36
AFRICA hellip the true size
SSV to SIV
Foliennummer 39
Foliennummer 40
Foliennummer 41
Foliennummer 42
Foliennummer 43
AFRICA FOUND IN TRANSLATION
Foliennummer 45
Region
Median
of Sites
Patients Site
0 pts
1 - 3 pts
4 - 9 pts
10+ pts
Latin America
4
21
26
30
23
North America
3
29
29
24
18
Eastern Europe
6
15
31
26
27
Western Europe
4
15
22
29
34
Asia Pacific
4
19
30
34
18
Africa
10
4
17
28
51
0 pts
1 - 3 pts
4 - 9 pts
10+ pts
Latin America
21
26
30
23
North America
29
29
24
18
Eastern Europe
15
31
26
27
Western Europe
15
22
29
34
Asia Pacific
19
30
34
18
Africa
4
17
28
51
Males
Female
15-19
210
150
20-24
340
205
25-29
395
300
30-34
460
360
35-39
600
405
40-44
800
500
45-49
1100
700
50-54
1600
1050
55-54
2300
1580
60-64
3340
2250
UN - Male
SA 1997
SA 2004
UN - Female
SA 1997
SA 2004
15-19
210
235
216
150
165
187
20-24
340
381
555
205
331
1085
25-29
395
625
1081
300
452
1985
30-34
460
817
2118
360
489
2267
35-39
600
916
2498
405
526
1890
40-44
800
1136
2765
500
615
1548
45-49
1100
1486
2744
700
800
1400
50-54
1600
2016
2979
1050
1116
1506
55-54
2300
2838
3270
1580
1626
1717
60-64
3340
3614
4146
2250
2201
2360
Stroke
ill-defined heart disease
Diabetes mellitus
Ischaemic heart disease
Hypertension
Nephritisnephrosis
Stroke
ill-defined heart disease
Diabetes mellitus
Ischaemic heart disease
Hypertension
Nephritisnephrosis
1999
34
345
20
248
14
10
1999
295
246
23
10
145
68
2000
36
362
218
249
152
112
2000
318
268
241
108
16
8
2001
35
372
22
25
15
125
2001
322
28
252
102
162
95
2002
405
298
24
26
147
126
2002
352
295
27
115
16
10
2003
425
32
245
285
152
15
2003
382
299
285
122
17
12
2004
39
325
255
26
165
16
2004
35
30
295
121
19
119
2005
36
328
265
26
15
162
2005
325
30
32
12
18
12
2006
35
336
27
258
155
16
2006
33
32
32
11
18
125
COPD
Asthma
Tracheabronchial lung cancer
Oesophageal cancer
prostate cancer
Cervical cancer
Breast cancer
1999
2001
12
135
10
26
2000
204
116
13
92
28
2001
222
131
133
96
27
2002
23
144
128
95
285
2003
243
149
124
94
29
2004
229
154
1255
87
29
2005
224
152
122
82
295
2006
224
136
116
75
3
COPD
Asthma
Tracheabronchial lung cancer
Oesophageal cancer
Prostate cancer
Cervical cancer
Breast cancer
1999
88
92
43
41
106
82
2000
96
95
4
43
11
81
2001
10
109
4
4
111
89
2002
10
116
4
4
112
85
2003
11
124
4
395
116
85
2004
102
1295
44
39
115
101
2005
105
128
42
38
1185
10
2006
10
12
42
32
1205
10
Based on this survey the researchers estimate that 109 of all South Africans over 2 years old were living with HIV in 2008 In 2002 and 2005 this figure was 114 and 108 respectively showing a degree of stabilisation Among those between 15 and 49 years old the estimated HIV prevalence was 169 in 2008 The survey found the prevalence among children aged 2-14 to be 25 down significantly since 2002 when prevalence was 56
Estimated HIV prevalence () among South Africans aged 2 years and older by age 2002-2008
Age
HIV +
HIV -
Children (2-14 years)
25
975
Youth (15-24 years)
87
913
Adults (25 and older)
168
832
(15-49 years)
169
831
Total (2 and older)
109
891
Estimated HIV prevalence among South Africans by age and sex 2008
Age
Male prevalence
Female prevalence
2-14
3
2
15-19
25
67
20-24
51
211
25-29
157
327
30-34
258
291
35-39
185
248
40-44
192
163
45-49
64
141
50-54
104
102
55-59
62
77
60+
35
18
Total
79
136
Among females HIV prevalence is highest in those between 25 and 29 years old among males the peak is in the group aged 30-34 years
HIV prevalence () by province 2002-2008
Province
2002
2005
2008
KwaZulu-Natal
117
165
158
Mpumalanga
141
152
154
Free State
149
126
126
North West
103
109
113
Gauteng
147
108
103
Eastern Cape
66
89
9
Limpopo
98
8
88
Northern Cape
84
54
59
Western Cape
107
19
38
National
114
108
109
The results of this study suggest that KwaZulu-Natal Mpumulanga and Free State have the highest HIV prevalence However the relatively small sample sizes may limit precision and in several cases the ranges of uncertainty overlap
HIV prevalence by population group 2008
Population group
Prevalence ()
African
136
864
White
03
997
Coloured
17
983
Indian
03
997
Studies of AIDS deaths
Latin America
Latin America
Latin America
Latin America
North America
North America
North America
North America
Eastern Europe
Eastern Europe
Eastern Europe
Eastern Europe
Western Europe
Western Europe
Western Europe
Western Europe
Asia Pacific
Asia Pacific
Asia Pacific
Asia Pacific
Africa
Africa
Africa
Africa
40
0 1 2 3 4 5 6 7 8 9
10
Latin America
North America
Eastern Europe
Western Europe
Asia Pacific
Africa
Num
ber o
f par
ticip
ants
MEDIAN site enrollment by region for 2008
Source Quintiles South Africa Presented SACRA Conference 2009
Site Performance
41
Source Quintiles South Africa Presented SACRA Conference 2009
s
ites
0
5
10
15
20
25
30
35
40
45
50
LatinAmerica
NorthAmerica
EasternEurope
WesternEurope
Asia Pacific Africa
0 pts
1 - 3 pts
4 - 9 pts
10+ pts
Enrollment performance by region for 2008
Site Performance
Chart1
0 pts
1 - 3 pts
4 - 9 pts
10+ pts
021
026
03
023
029
029
024
018
015
031
026
027
015
022
029
034
019
03
034
018
004
017
028
051
HIV
HIV
Resiratory amp Cancer
Male prevalence
Female prevalence
CVS
Overall death rates
Overall death rates
COPD
Asthma
Tracheabronchial lung cancer
Oesophageal cancer
prostate cancer
Trial metrics
COPD
Asthma
Tracheabronchial lung cancer
Oesophageal cancer
Prostate cancer
Cervical cancer
Breast cancer
Stroke
ill-defined heart disease
Diabetes mellitus
Ischaemic heart disease
Hypertension
Nephritisnephrosis
Stroke
ill-defined heart disease
Diabetes mellitus
Ischaemic heart disease
Hypertension
Nephritisnephrosis
Males
Female
UN - Male
SA 1997
SA 2004
UN - Female
SA 1997
SA 2004
0 pts
1 - 3 pts
4 - 9 pts
10+ pts
42
Source wwwclinicaltrialsgov 22-Oct-2010
Clinical trials registered across Africa
43
0
500
1000
1500
2000
2500
South Africa Kenya Malawi Tanzania Uganda Zambia
Selected African countries
2005
2010
2015
Source ClinTrialsgov
Trend 2005 - 2015
Source wwwclinicaltrialsgov 28-Aug-2015
44
AFRICA FOUND IN TRANSLATION
bull Vast treatment-naiumlve population bull Cost advantages (still) bull Diverse ethnicity amp morbidity bull Inverse seasonality bull Site capacity-building widely implemented bull Robust regulatory review bull Variable but generally good regulatory timelines bull Established GCP culture ndash sites and home-bred CROs
45
THANK YOU
Foliennummer 1
Triclinium A South African CRO
Collaboration with VPM SII
Vaccine Trials in SA 2015
Foliennummer 5
Foliennummer 6
Foliennummer 7
Foliennummer 8
Foliennummer 9
Foliennummer 10
Foliennummer 11
Foliennummer 12
Foliennummer 13
Foliennummer 14
Foliennummer 15
Foliennummer 16
Foliennummer 17
Distribution of clinical trial sites
Foliennummer 19
South Africa Leading Causes of Death
Foliennummer 21
Foliennummer 22
South Africa TB deaths by age group
Foliennummer 24
Foliennummer 25
Foliennummer 26
Foliennummer 27
Foliennummer 28
Foliennummer 29
Foliennummer 30
Foliennummer 31
SA Clinical Trial Regulatory Processes
Clinical Trial Density Active sites million population
Foliennummer 34
Why Africa
Foliennummer 36
AFRICA hellip the true size
SSV to SIV
Foliennummer 39
Foliennummer 40
Foliennummer 41
Foliennummer 42
Foliennummer 43
AFRICA FOUND IN TRANSLATION
Foliennummer 45
Region
Median
of Sites
Patients Site
0 pts
1 - 3 pts
4 - 9 pts
10+ pts
Latin America
4
21
26
30
23
North America
3
29
29
24
18
Eastern Europe
6
15
31
26
27
Western Europe
4
15
22
29
34
Asia Pacific
4
19
30
34
18
Africa
10
4
17
28
51
0 pts
1 - 3 pts
4 - 9 pts
10+ pts
Latin America
21
26
30
23
North America
29
29
24
18
Eastern Europe
15
31
26
27
Western Europe
15
22
29
34
Asia Pacific
19
30
34
18
Africa
4
17
28
51
Males
Female
15-19
210
150
20-24
340
205
25-29
395
300
30-34
460
360
35-39
600
405
40-44
800
500
45-49
1100
700
50-54
1600
1050
55-54
2300
1580
60-64
3340
2250
UN - Male
SA 1997
SA 2004
UN - Female
SA 1997
SA 2004
15-19
210
235
216
150
165
187
20-24
340
381
555
205
331
1085
25-29
395
625
1081
300
452
1985
30-34
460
817
2118
360
489
2267
35-39
600
916
2498
405
526
1890
40-44
800
1136
2765
500
615
1548
45-49
1100
1486
2744
700
800
1400
50-54
1600
2016
2979
1050
1116
1506
55-54
2300
2838
3270
1580
1626
1717
60-64
3340
3614
4146
2250
2201
2360
Stroke
ill-defined heart disease
Diabetes mellitus
Ischaemic heart disease
Hypertension
Nephritisnephrosis
Stroke
ill-defined heart disease
Diabetes mellitus
Ischaemic heart disease
Hypertension
Nephritisnephrosis
1999
34
345
20
248
14
10
1999
295
246
23
10
145
68
2000
36
362
218
249
152
112
2000
318
268
241
108
16
8
2001
35
372
22
25
15
125
2001
322
28
252
102
162
95
2002
405
298
24
26
147
126
2002
352
295
27
115
16
10
2003
425
32
245
285
152
15
2003
382
299
285
122
17
12
2004
39
325
255
26
165
16
2004
35
30
295
121
19
119
2005
36
328
265
26
15
162
2005
325
30
32
12
18
12
2006
35
336
27
258
155
16
2006
33
32
32
11
18
125
COPD
Asthma
Tracheabronchial lung cancer
Oesophageal cancer
prostate cancer
Cervical cancer
Breast cancer
1999
2001
12
135
10
26
2000
204
116
13
92
28
2001
222
131
133
96
27
2002
23
144
128
95
285
2003
243
149
124
94
29
2004
229
154
1255
87
29
2005
224
152
122
82
295
2006
224
136
116
75
3
COPD
Asthma
Tracheabronchial lung cancer
Oesophageal cancer
Prostate cancer
Cervical cancer
Breast cancer
1999
88
92
43
41
106
82
2000
96
95
4
43
11
81
2001
10
109
4
4
111
89
2002
10
116
4
4
112
85
2003
11
124
4
395
116
85
2004
102
1295
44
39
115
101
2005
105
128
42
38
1185
10
2006
10
12
42
32
1205
10
Based on this survey the researchers estimate that 109 of all South Africans over 2 years old were living with HIV in 2008 In 2002 and 2005 this figure was 114 and 108 respectively showing a degree of stabilisation Among those between 15 and 49 years old the estimated HIV prevalence was 169 in 2008 The survey found the prevalence among children aged 2-14 to be 25 down significantly since 2002 when prevalence was 56
Estimated HIV prevalence () among South Africans aged 2 years and older by age 2002-2008
Age
HIV +
HIV -
Children (2-14 years)
25
975
Youth (15-24 years)
87
913
Adults (25 and older)
168
832
(15-49 years)
169
831
Total (2 and older)
109
891
Estimated HIV prevalence among South Africans by age and sex 2008
Age
Male prevalence
Female prevalence
2-14
3
2
15-19
25
67
20-24
51
211
25-29
157
327
30-34
258
291
35-39
185
248
40-44
192
163
45-49
64
141
50-54
104
102
55-59
62
77
60+
35
18
Total
79
136
Among females HIV prevalence is highest in those between 25 and 29 years old among males the peak is in the group aged 30-34 years
HIV prevalence () by province 2002-2008
Province
2002
2005
2008
KwaZulu-Natal
117
165
158
Mpumalanga
141
152
154
Free State
149
126
126
North West
103
109
113
Gauteng
147
108
103
Eastern Cape
66
89
9
Limpopo
98
8
88
Northern Cape
84
54
59
Western Cape
107
19
38
National
114
108
109
The results of this study suggest that KwaZulu-Natal Mpumulanga and Free State have the highest HIV prevalence However the relatively small sample sizes may limit precision and in several cases the ranges of uncertainty overlap
HIV prevalence by population group 2008
Population group
Prevalence ()
African
136
864
White
03
997
Coloured
17
983
Indian
03
997
Studies of AIDS deaths
Latin America
Latin America
Latin America
Latin America
North America
North America
North America
North America
Eastern Europe
Eastern Europe
Eastern Europe
Eastern Europe
Western Europe
Western Europe
Western Europe
Western Europe
Asia Pacific
Asia Pacific
Asia Pacific
Asia Pacific
Africa
Africa
Africa
Africa
41
Source Quintiles South Africa Presented SACRA Conference 2009
s
ites
0
5
10
15
20
25
30
35
40
45
50
LatinAmerica
NorthAmerica
EasternEurope
WesternEurope
Asia Pacific Africa
0 pts
1 - 3 pts
4 - 9 pts
10+ pts
Enrollment performance by region for 2008
Site Performance
Chart1
0 pts
1 - 3 pts
4 - 9 pts
10+ pts
021
026
03
023
029
029
024
018
015
031
026
027
015
022
029
034
019
03
034
018
004
017
028
051
HIV
HIV
Resiratory amp Cancer
Male prevalence
Female prevalence
CVS
Overall death rates
Overall death rates
COPD
Asthma
Tracheabronchial lung cancer
Oesophageal cancer
prostate cancer
Trial metrics
COPD
Asthma
Tracheabronchial lung cancer
Oesophageal cancer
Prostate cancer
Cervical cancer
Breast cancer
Stroke
ill-defined heart disease
Diabetes mellitus
Ischaemic heart disease
Hypertension
Nephritisnephrosis
Stroke
ill-defined heart disease
Diabetes mellitus
Ischaemic heart disease
Hypertension
Nephritisnephrosis
Males
Female
UN - Male
SA 1997
SA 2004
UN - Female
SA 1997
SA 2004
0 pts
1 - 3 pts
4 - 9 pts
10+ pts
42
Source wwwclinicaltrialsgov 22-Oct-2010
Clinical trials registered across Africa
43
0
500
1000
1500
2000
2500
South Africa Kenya Malawi Tanzania Uganda Zambia
Selected African countries
2005
2010
2015
Source ClinTrialsgov
Trend 2005 - 2015
Source wwwclinicaltrialsgov 28-Aug-2015
44
AFRICA FOUND IN TRANSLATION
bull Vast treatment-naiumlve population bull Cost advantages (still) bull Diverse ethnicity amp morbidity bull Inverse seasonality bull Site capacity-building widely implemented bull Robust regulatory review bull Variable but generally good regulatory timelines bull Established GCP culture ndash sites and home-bred CROs
45
THANK YOU
Foliennummer 1
Triclinium A South African CRO
Collaboration with VPM SII
Vaccine Trials in SA 2015
Foliennummer 5
Foliennummer 6
Foliennummer 7
Foliennummer 8
Foliennummer 9
Foliennummer 10
Foliennummer 11
Foliennummer 12
Foliennummer 13
Foliennummer 14
Foliennummer 15
Foliennummer 16
Foliennummer 17
Distribution of clinical trial sites
Foliennummer 19
South Africa Leading Causes of Death
Foliennummer 21
Foliennummer 22
South Africa TB deaths by age group
Foliennummer 24
Foliennummer 25
Foliennummer 26
Foliennummer 27
Foliennummer 28
Foliennummer 29
Foliennummer 30
Foliennummer 31
SA Clinical Trial Regulatory Processes
Clinical Trial Density Active sites million population
Foliennummer 34
Why Africa
Foliennummer 36
AFRICA hellip the true size
SSV to SIV
Foliennummer 39
Foliennummer 40
Foliennummer 41
Foliennummer 42
Foliennummer 43
AFRICA FOUND IN TRANSLATION
Foliennummer 45
Region
Median
of Sites
Patients Site
0 pts
1 - 3 pts
4 - 9 pts
10+ pts
Latin America
4
21
26
30
23
North America
3
29
29
24
18
Eastern Europe
6
15
31
26
27
Western Europe
4
15
22
29
34
Asia Pacific
4
19
30
34
18
Africa
10
4
17
28
51
0 pts
1 - 3 pts
4 - 9 pts
10+ pts
Latin America
21
26
30
23
North America
29
29
24
18
Eastern Europe
15
31
26
27
Western Europe
15
22
29
34
Asia Pacific
19
30
34
18
Africa
4
17
28
51
Males
Female
15-19
210
150
20-24
340
205
25-29
395
300
30-34
460
360
35-39
600
405
40-44
800
500
45-49
1100
700
50-54
1600
1050
55-54
2300
1580
60-64
3340
2250
UN - Male
SA 1997
SA 2004
UN - Female
SA 1997
SA 2004
15-19
210
235
216
150
165
187
20-24
340
381
555
205
331
1085
25-29
395
625
1081
300
452
1985
30-34
460
817
2118
360
489
2267
35-39
600
916
2498
405
526
1890
40-44
800
1136
2765
500
615
1548
45-49
1100
1486
2744
700
800
1400
50-54
1600
2016
2979
1050
1116
1506
55-54
2300
2838
3270
1580
1626
1717
60-64
3340
3614
4146
2250
2201
2360
Stroke
ill-defined heart disease
Diabetes mellitus
Ischaemic heart disease
Hypertension
Nephritisnephrosis
Stroke
ill-defined heart disease
Diabetes mellitus
Ischaemic heart disease
Hypertension
Nephritisnephrosis
1999
34
345
20
248
14
10
1999
295
246
23
10
145
68
2000
36
362
218
249
152
112
2000
318
268
241
108
16
8
2001
35
372
22
25
15
125
2001
322
28
252
102
162
95
2002
405
298
24
26
147
126
2002
352
295
27
115
16
10
2003
425
32
245
285
152
15
2003
382
299
285
122
17
12
2004
39
325
255
26
165
16
2004
35
30
295
121
19
119
2005
36
328
265
26
15
162
2005
325
30
32
12
18
12
2006
35
336
27
258
155
16
2006
33
32
32
11
18
125
COPD
Asthma
Tracheabronchial lung cancer
Oesophageal cancer
prostate cancer
Cervical cancer
Breast cancer
1999
2001
12
135
10
26
2000
204
116
13
92
28
2001
222
131
133
96
27
2002
23
144
128
95
285
2003
243
149
124
94
29
2004
229
154
1255
87
29
2005
224
152
122
82
295
2006
224
136
116
75
3
COPD
Asthma
Tracheabronchial lung cancer
Oesophageal cancer
Prostate cancer
Cervical cancer
Breast cancer
1999
88
92
43
41
106
82
2000
96
95
4
43
11
81
2001
10
109
4
4
111
89
2002
10
116
4
4
112
85
2003
11
124
4
395
116
85
2004
102
1295
44
39
115
101
2005
105
128
42
38
1185
10
2006
10
12
42
32
1205
10
Based on this survey the researchers estimate that 109 of all South Africans over 2 years old were living with HIV in 2008 In 2002 and 2005 this figure was 114 and 108 respectively showing a degree of stabilisation Among those between 15 and 49 years old the estimated HIV prevalence was 169 in 2008 The survey found the prevalence among children aged 2-14 to be 25 down significantly since 2002 when prevalence was 56
Estimated HIV prevalence () among South Africans aged 2 years and older by age 2002-2008
Age
HIV +
HIV -
Children (2-14 years)
25
975
Youth (15-24 years)
87
913
Adults (25 and older)
168
832
(15-49 years)
169
831
Total (2 and older)
109
891
Estimated HIV prevalence among South Africans by age and sex 2008
Age
Male prevalence
Female prevalence
2-14
3
2
15-19
25
67
20-24
51
211
25-29
157
327
30-34
258
291
35-39
185
248
40-44
192
163
45-49
64
141
50-54
104
102
55-59
62
77
60+
35
18
Total
79
136
Among females HIV prevalence is highest in those between 25 and 29 years old among males the peak is in the group aged 30-34 years
HIV prevalence () by province 2002-2008
Province
2002
2005
2008
KwaZulu-Natal
117
165
158
Mpumalanga
141
152
154
Free State
149
126
126
North West
103
109
113
Gauteng
147
108
103
Eastern Cape
66
89
9
Limpopo
98
8
88
Northern Cape
84
54
59
Western Cape
107
19
38
National
114
108
109
The results of this study suggest that KwaZulu-Natal Mpumulanga and Free State have the highest HIV prevalence However the relatively small sample sizes may limit precision and in several cases the ranges of uncertainty overlap
HIV prevalence by population group 2008
Population group
Prevalence ()
African
136
864
White
03
997
Coloured
17
983
Indian
03
997
Studies of AIDS deaths
Latin America
Latin America
Latin America
Latin America
North America
North America
North America
North America
Eastern Europe
Eastern Europe
Eastern Europe
Eastern Europe
Western Europe
Western Europe
Western Europe
Western Europe
Asia Pacific
Asia Pacific
Asia Pacific
Asia Pacific
Africa
Africa
Africa
Africa
HIV
HIV
Resiratory amp Cancer
Male prevalence
Female prevalence
CVS
Overall death rates
Overall death rates
COPD
Asthma
Tracheabronchial lung cancer
Oesophageal cancer
prostate cancer
Trial metrics
COPD
Asthma
Tracheabronchial lung cancer
Oesophageal cancer
Prostate cancer
Cervical cancer
Breast cancer
Stroke
ill-defined heart disease
Diabetes mellitus
Ischaemic heart disease
Hypertension
Nephritisnephrosis
Stroke
ill-defined heart disease
Diabetes mellitus
Ischaemic heart disease
Hypertension
Nephritisnephrosis
Males
Female
UN - Male
SA 1997
SA 2004
UN - Female
SA 1997
SA 2004
0 pts
1 - 3 pts
4 - 9 pts
10+ pts
42
Source wwwclinicaltrialsgov 22-Oct-2010
Clinical trials registered across Africa
43
0
500
1000
1500
2000
2500
South Africa Kenya Malawi Tanzania Uganda Zambia
Selected African countries
2005
2010
2015
Source ClinTrialsgov
Trend 2005 - 2015
Source wwwclinicaltrialsgov 28-Aug-2015
44
AFRICA FOUND IN TRANSLATION
bull Vast treatment-naiumlve population bull Cost advantages (still) bull Diverse ethnicity amp morbidity bull Inverse seasonality bull Site capacity-building widely implemented bull Robust regulatory review bull Variable but generally good regulatory timelines bull Established GCP culture ndash sites and home-bred CROs
45
THANK YOU
Foliennummer 1
Triclinium A South African CRO
Collaboration with VPM SII
Vaccine Trials in SA 2015
Foliennummer 5
Foliennummer 6
Foliennummer 7
Foliennummer 8
Foliennummer 9
Foliennummer 10
Foliennummer 11
Foliennummer 12
Foliennummer 13
Foliennummer 14
Foliennummer 15
Foliennummer 16
Foliennummer 17
Distribution of clinical trial sites
Foliennummer 19
South Africa Leading Causes of Death
Foliennummer 21
Foliennummer 22
South Africa TB deaths by age group
Foliennummer 24
Foliennummer 25
Foliennummer 26
Foliennummer 27
Foliennummer 28
Foliennummer 29
Foliennummer 30
Foliennummer 31
SA Clinical Trial Regulatory Processes
Clinical Trial Density Active sites million population
Foliennummer 34
Why Africa
Foliennummer 36
AFRICA hellip the true size
SSV to SIV
Foliennummer 39
Foliennummer 40
Foliennummer 41
Foliennummer 42
Foliennummer 43
AFRICA FOUND IN TRANSLATION
Foliennummer 45
Region
Median
of Sites
Patients Site
0 pts
1 - 3 pts
4 - 9 pts
10+ pts
Latin America
4
21
26
30
23
North America
3
29
29
24
18
Eastern Europe
6
15
31
26
27
Western Europe
4
15
22
29
34
Asia Pacific
4
19
30
34
18
Africa
10
4
17
28
51
0 pts
1 - 3 pts
4 - 9 pts
10+ pts
Latin America
21
26
30
23
North America
29
29
24
18
Eastern Europe
15
31
26
27
Western Europe
15
22
29
34
Asia Pacific
19
30
34
18
Africa
4
17
28
51
Males
Female
15-19
210
150
20-24
340
205
25-29
395
300
30-34
460
360
35-39
600
405
40-44
800
500
45-49
1100
700
50-54
1600
1050
55-54
2300
1580
60-64
3340
2250
UN - Male
SA 1997
SA 2004
UN - Female
SA 1997
SA 2004
15-19
210
235
216
150
165
187
20-24
340
381
555
205
331
1085
25-29
395
625
1081
300
452
1985
30-34
460
817
2118
360
489
2267
35-39
600
916
2498
405
526
1890
40-44
800
1136
2765
500
615
1548
45-49
1100
1486
2744
700
800
1400
50-54
1600
2016
2979
1050
1116
1506
55-54
2300
2838
3270
1580
1626
1717
60-64
3340
3614
4146
2250
2201
2360
Stroke
ill-defined heart disease
Diabetes mellitus
Ischaemic heart disease
Hypertension
Nephritisnephrosis
Stroke
ill-defined heart disease
Diabetes mellitus
Ischaemic heart disease
Hypertension
Nephritisnephrosis
1999
34
345
20
248
14
10
1999
295
246
23
10
145
68
2000
36
362
218
249
152
112
2000
318
268
241
108
16
8
2001
35
372
22
25
15
125
2001
322
28
252
102
162
95
2002
405
298
24
26
147
126
2002
352
295
27
115
16
10
2003
425
32
245
285
152
15
2003
382
299
285
122
17
12
2004
39
325
255
26
165
16
2004
35
30
295
121
19
119
2005
36
328
265
26
15
162
2005
325
30
32
12
18
12
2006
35
336
27
258
155
16
2006
33
32
32
11
18
125
COPD
Asthma
Tracheabronchial lung cancer
Oesophageal cancer
prostate cancer
Cervical cancer
Breast cancer
1999
2001
12
135
10
26
2000
204
116
13
92
28
2001
222
131
133
96
27
2002
23
144
128
95
285
2003
243
149
124
94
29
2004
229
154
1255
87
29
2005
224
152
122
82
295
2006
224
136
116
75
3
COPD
Asthma
Tracheabronchial lung cancer
Oesophageal cancer
Prostate cancer
Cervical cancer
Breast cancer
1999
88
92
43
41
106
82
2000
96
95
4
43
11
81
2001
10
109
4
4
111
89
2002
10
116
4
4
112
85
2003
11
124
4
395
116
85
2004
102
1295
44
39
115
101
2005
105
128
42
38
1185
10
2006
10
12
42
32
1205
10
Based on this survey the researchers estimate that 109 of all South Africans over 2 years old were living with HIV in 2008 In 2002 and 2005 this figure was 114 and 108 respectively showing a degree of stabilisation Among those between 15 and 49 years old the estimated HIV prevalence was 169 in 2008 The survey found the prevalence among children aged 2-14 to be 25 down significantly since 2002 when prevalence was 56
Estimated HIV prevalence () among South Africans aged 2 years and older by age 2002-2008
Age
HIV +
HIV -
Children (2-14 years)
25
975
Youth (15-24 years)
87
913
Adults (25 and older)
168
832
(15-49 years)
169
831
Total (2 and older)
109
891
Estimated HIV prevalence among South Africans by age and sex 2008
Age
Male prevalence
Female prevalence
2-14
3
2
15-19
25
67
20-24
51
211
25-29
157
327
30-34
258
291
35-39
185
248
40-44
192
163
45-49
64
141
50-54
104
102
55-59
62
77
60+
35
18
Total
79
136
Among females HIV prevalence is highest in those between 25 and 29 years old among males the peak is in the group aged 30-34 years
HIV prevalence () by province 2002-2008
Province
2002
2005
2008
KwaZulu-Natal
117
165
158
Mpumalanga
141
152
154
Free State
149
126
126
North West
103
109
113
Gauteng
147
108
103
Eastern Cape
66
89
9
Limpopo
98
8
88
Northern Cape
84
54
59
Western Cape
107
19
38
National
114
108
109
The results of this study suggest that KwaZulu-Natal Mpumulanga and Free State have the highest HIV prevalence However the relatively small sample sizes may limit precision and in several cases the ranges of uncertainty overlap
HIV prevalence by population group 2008
Population group
Prevalence ()
African
136
864
White
03
997
Coloured
17
983
Indian
03
997
Studies of AIDS deaths
HIV
Resiratory amp Cancer
Male prevalence
Female prevalence
CVS
Overall death rates
Overall death rates
COPD
Asthma
Tracheabronchial lung cancer
Oesophageal cancer
prostate cancer
Trial metrics
COPD
Asthma
Tracheabronchial lung cancer
Oesophageal cancer
Prostate cancer
Cervical cancer
Breast cancer
Stroke
ill-defined heart disease
Diabetes mellitus
Ischaemic heart disease
Hypertension
Nephritisnephrosis
Stroke
ill-defined heart disease
Diabetes mellitus
Ischaemic heart disease
Hypertension
Nephritisnephrosis
Males
Female
UN - Male
SA 1997
SA 2004
UN - Female
SA 1997
SA 2004
0 pts
1 - 3 pts
4 - 9 pts
10+ pts
42
Source wwwclinicaltrialsgov 22-Oct-2010
Clinical trials registered across Africa
43
0
500
1000
1500
2000
2500
South Africa Kenya Malawi Tanzania Uganda Zambia
Selected African countries
2005
2010
2015
Source ClinTrialsgov
Trend 2005 - 2015
Source wwwclinicaltrialsgov 28-Aug-2015
44
AFRICA FOUND IN TRANSLATION
bull Vast treatment-naiumlve population bull Cost advantages (still) bull Diverse ethnicity amp morbidity bull Inverse seasonality bull Site capacity-building widely implemented bull Robust regulatory review bull Variable but generally good regulatory timelines bull Established GCP culture ndash sites and home-bred CROs
45
THANK YOU
Foliennummer 1
Triclinium A South African CRO
Collaboration with VPM SII
Vaccine Trials in SA 2015
Foliennummer 5
Foliennummer 6
Foliennummer 7
Foliennummer 8
Foliennummer 9
Foliennummer 10
Foliennummer 11
Foliennummer 12
Foliennummer 13
Foliennummer 14
Foliennummer 15
Foliennummer 16
Foliennummer 17
Distribution of clinical trial sites
Foliennummer 19
South Africa Leading Causes of Death
Foliennummer 21
Foliennummer 22
South Africa TB deaths by age group
Foliennummer 24
Foliennummer 25
Foliennummer 26
Foliennummer 27
Foliennummer 28
Foliennummer 29
Foliennummer 30
Foliennummer 31
SA Clinical Trial Regulatory Processes
Clinical Trial Density Active sites million population
Foliennummer 34
Why Africa
Foliennummer 36
AFRICA hellip the true size
SSV to SIV
Foliennummer 39
Foliennummer 40
Foliennummer 41
Foliennummer 42
Foliennummer 43
AFRICA FOUND IN TRANSLATION
Foliennummer 45
Region
Median
of Sites
Patients Site
0 pts
1 - 3 pts
4 - 9 pts
10+ pts
Latin America
4
21
26
30
23
North America
3
29
29
24
18
Eastern Europe
6
15
31
26
27
Western Europe
4
15
22
29
34
Asia Pacific
4
19
30
34
18
Africa
10
4
17
28
51
0 pts
1 - 3 pts
4 - 9 pts
10+ pts
Latin America
21
26
30
23
North America
29
29
24
18
Eastern Europe
15
31
26
27
Western Europe
15
22
29
34
Asia Pacific
19
30
34
18
Africa
4
17
28
51
Males
Female
15-19
210
150
20-24
340
205
25-29
395
300
30-34
460
360
35-39
600
405
40-44
800
500
45-49
1100
700
50-54
1600
1050
55-54
2300
1580
60-64
3340
2250
UN - Male
SA 1997
SA 2004
UN - Female
SA 1997
SA 2004
15-19
210
235
216
150
165
187
20-24
340
381
555
205
331
1085
25-29
395
625
1081
300
452
1985
30-34
460
817
2118
360
489
2267
35-39
600
916
2498
405
526
1890
40-44
800
1136
2765
500
615
1548
45-49
1100
1486
2744
700
800
1400
50-54
1600
2016
2979
1050
1116
1506
55-54
2300
2838
3270
1580
1626
1717
60-64
3340
3614
4146
2250
2201
2360
Stroke
ill-defined heart disease
Diabetes mellitus
Ischaemic heart disease
Hypertension
Nephritisnephrosis
Stroke
ill-defined heart disease
Diabetes mellitus
Ischaemic heart disease
Hypertension
Nephritisnephrosis
1999
34
345
20
248
14
10
1999
295
246
23
10
145
68
2000
36
362
218
249
152
112
2000
318
268
241
108
16
8
2001
35
372
22
25
15
125
2001
322
28
252
102
162
95
2002
405
298
24
26
147
126
2002
352
295
27
115
16
10
2003
425
32
245
285
152
15
2003
382
299
285
122
17
12
2004
39
325
255
26
165
16
2004
35
30
295
121
19
119
2005
36
328
265
26
15
162
2005
325
30
32
12
18
12
2006
35
336
27
258
155
16
2006
33
32
32
11
18
125
COPD
Asthma
Tracheabronchial lung cancer
Oesophageal cancer
prostate cancer
Cervical cancer
Breast cancer
1999
2001
12
135
10
26
2000
204
116
13
92
28
2001
222
131
133
96
27
2002
23
144
128
95
285
2003
243
149
124
94
29
2004
229
154
1255
87
29
2005
224
152
122
82
295
2006
224
136
116
75
3
COPD
Asthma
Tracheabronchial lung cancer
Oesophageal cancer
Prostate cancer
Cervical cancer
Breast cancer
1999
88
92
43
41
106
82
2000
96
95
4
43
11
81
2001
10
109
4
4
111
89
2002
10
116
4
4
112
85
2003
11
124
4
395
116
85
2004
102
1295
44
39
115
101
2005
105
128
42
38
1185
10
2006
10
12
42
32
1205
10
Overall death rates
Overall death rates
COPD
Asthma
Tracheabronchial lung cancer
Oesophageal cancer
prostate cancer
Trial metrics
COPD
Asthma
Tracheabronchial lung cancer
Oesophageal cancer
Prostate cancer
Cervical cancer
Breast cancer
Stroke
ill-defined heart disease
Diabetes mellitus
Ischaemic heart disease
Hypertension
Nephritisnephrosis
Stroke
ill-defined heart disease
Diabetes mellitus
Ischaemic heart disease
Hypertension
Nephritisnephrosis
Males
Female
UN - Male
SA 1997
SA 2004
UN - Female
SA 1997
SA 2004
0 pts
1 - 3 pts
4 - 9 pts
10+ pts
42
Source wwwclinicaltrialsgov 22-Oct-2010
Clinical trials registered across Africa
43
0
500
1000
1500
2000
2500
South Africa Kenya Malawi Tanzania Uganda Zambia
Selected African countries
2005
2010
2015
Source ClinTrialsgov
Trend 2005 - 2015
Source wwwclinicaltrialsgov 28-Aug-2015
44
AFRICA FOUND IN TRANSLATION
bull Vast treatment-naiumlve population bull Cost advantages (still) bull Diverse ethnicity amp morbidity bull Inverse seasonality bull Site capacity-building widely implemented bull Robust regulatory review bull Variable but generally good regulatory timelines bull Established GCP culture ndash sites and home-bred CROs
45
THANK YOU
Foliennummer 1
Triclinium A South African CRO
Collaboration with VPM SII
Vaccine Trials in SA 2015
Foliennummer 5
Foliennummer 6
Foliennummer 7
Foliennummer 8
Foliennummer 9
Foliennummer 10
Foliennummer 11
Foliennummer 12
Foliennummer 13
Foliennummer 14
Foliennummer 15
Foliennummer 16
Foliennummer 17
Distribution of clinical trial sites
Foliennummer 19
South Africa Leading Causes of Death
Foliennummer 21
Foliennummer 22
South Africa TB deaths by age group
Foliennummer 24
Foliennummer 25
Foliennummer 26
Foliennummer 27
Foliennummer 28
Foliennummer 29
Foliennummer 30
Foliennummer 31
SA Clinical Trial Regulatory Processes
Clinical Trial Density Active sites million population
Foliennummer 34
Why Africa
Foliennummer 36
AFRICA hellip the true size
SSV to SIV
Foliennummer 39
Foliennummer 40
Foliennummer 41
Foliennummer 42
Foliennummer 43
AFRICA FOUND IN TRANSLATION
Foliennummer 45
Region
Median
of Sites
Patients Site
0 pts
1 - 3 pts
4 - 9 pts
10+ pts
Latin America
4
21
26
30
23
North America
3
29
29
24
18
Eastern Europe
6
15
31
26
27
Western Europe
4
15
22
29
34
Asia Pacific
4
19
30
34
18
Africa
10
4
17
28
51
0 pts
1 - 3 pts
4 - 9 pts
10+ pts
Latin America
21
26
30
23
North America
29
29
24
18
Eastern Europe
15
31
26
27
Western Europe
15
22
29
34
Asia Pacific
19
30
34
18
Africa
4
17
28
51
Males
Female
15-19
210
150
20-24
340
205
25-29
395
300
30-34
460
360
35-39
600
405
40-44
800
500
45-49
1100
700
50-54
1600
1050
55-54
2300
1580
60-64
3340
2250
UN - Male
SA 1997
SA 2004
UN - Female
SA 1997
SA 2004
15-19
210
235
216
150
165
187
20-24
340
381
555
205
331
1085
25-29
395
625
1081
300
452
1985
30-34
460
817
2118
360
489
2267
35-39
600
916
2498
405
526
1890
40-44
800
1136
2765
500
615
1548
45-49
1100
1486
2744
700
800
1400
50-54
1600
2016
2979
1050
1116
1506
55-54
2300
2838
3270
1580
1626
1717
60-64
3340
3614
4146
2250
2201
2360
Stroke
ill-defined heart disease
Diabetes mellitus
Ischaemic heart disease
Hypertension
Nephritisnephrosis
Stroke
ill-defined heart disease
Diabetes mellitus
Ischaemic heart disease
Hypertension
Nephritisnephrosis
1999
34
345
20
248
14
10
1999
295
246
23
10
145
68
2000
36
362
218
249
152
112
2000
318
268
241
108
16
8
2001
35
372
22
25
15
125
2001
322
28
252
102
162
95
2002
405
298
24
26
147
126
2002
352
295
27
115
16
10
2003
425
32
245
285
152
15
2003
382
299
285
122
17
12
2004
39
325
255
26
165
16
2004
35
30
295
121
19
119
2005
36
328
265
26
15
162
2005
325
30
32
12
18
12
2006
35
336
27
258
155
16
2006
33
32
32
11
18
125
COPD
Asthma
Tracheabronchial lung cancer
Oesophageal cancer
prostate cancer
Cervical cancer
Breast cancer
1999
2001
12
135
10
26
2000
204
116
13
92
28
2001
222
131
133
96
27
2002
23
144
128
95
285
2003
243
149
124
94
29
2004
229
154
1255
87
29
2005
224
152
122
82
295
2006
224
136
116
75
3
COPD
Asthma
Tracheabronchial lung cancer
Oesophageal cancer
Prostate cancer
Cervical cancer
Breast cancer
1999
88
92
43
41
106
82
2000
96
95
4
43
11
81
2001
10
109
4
4
111
89
2002
10
116
4
4
112
85
2003
11
124
4
395
116
85
2004
102
1295
44
39
115
101
2005
105
128
42
38
1185
10
2006
10
12
42
32
1205
10
Overall death rates
COPD
Asthma
Tracheabronchial lung cancer
Oesophageal cancer
prostate cancer
Trial metrics
COPD
Asthma
Tracheabronchial lung cancer
Oesophageal cancer
Prostate cancer
Cervical cancer
Breast cancer
Stroke
ill-defined heart disease
Diabetes mellitus
Ischaemic heart disease
Hypertension
Nephritisnephrosis
Stroke
ill-defined heart disease
Diabetes mellitus
Ischaemic heart disease
Hypertension
Nephritisnephrosis
Males
Female
UN - Male
SA 1997
SA 2004
UN - Female
SA 1997
SA 2004
0 pts
1 - 3 pts
4 - 9 pts
10+ pts
42
Source wwwclinicaltrialsgov 22-Oct-2010
Clinical trials registered across Africa
43
0
500
1000
1500
2000
2500
South Africa Kenya Malawi Tanzania Uganda Zambia
Selected African countries
2005
2010
2015
Source ClinTrialsgov
Trend 2005 - 2015
Source wwwclinicaltrialsgov 28-Aug-2015
44
AFRICA FOUND IN TRANSLATION
bull Vast treatment-naiumlve population bull Cost advantages (still) bull Diverse ethnicity amp morbidity bull Inverse seasonality bull Site capacity-building widely implemented bull Robust regulatory review bull Variable but generally good regulatory timelines bull Established GCP culture ndash sites and home-bred CROs
45
THANK YOU
Foliennummer 1
Triclinium A South African CRO
Collaboration with VPM SII
Vaccine Trials in SA 2015
Foliennummer 5
Foliennummer 6
Foliennummer 7
Foliennummer 8
Foliennummer 9
Foliennummer 10
Foliennummer 11
Foliennummer 12
Foliennummer 13
Foliennummer 14
Foliennummer 15
Foliennummer 16
Foliennummer 17
Distribution of clinical trial sites
Foliennummer 19
South Africa Leading Causes of Death
Foliennummer 21
Foliennummer 22
South Africa TB deaths by age group
Foliennummer 24
Foliennummer 25
Foliennummer 26
Foliennummer 27
Foliennummer 28
Foliennummer 29
Foliennummer 30
Foliennummer 31
SA Clinical Trial Regulatory Processes
Clinical Trial Density Active sites million population
Foliennummer 34
Why Africa
Foliennummer 36
AFRICA hellip the true size
SSV to SIV
Foliennummer 39
Foliennummer 40
Foliennummer 41
Foliennummer 42
Foliennummer 43
AFRICA FOUND IN TRANSLATION
Foliennummer 45
Region
Median
of Sites
Patients Site
0 pts
1 - 3 pts
4 - 9 pts
10+ pts
Latin America
4
21
26
30
23
North America
3
29
29
24
18
Eastern Europe
6
15
31
26
27
Western Europe
4
15
22
29
34
Asia Pacific
4
19
30
34
18
Africa
10
4
17
28
51
0 pts
1 - 3 pts
4 - 9 pts
10+ pts
Latin America
21
26
30
23
North America
29
29
24
18
Eastern Europe
15
31
26
27
Western Europe
15
22
29
34
Asia Pacific
19
30
34
18
Africa
4
17
28
51
Males
Female
15-19
210
150
20-24
340
205
25-29
395
300
30-34
460
360
35-39
600
405
40-44
800
500
45-49
1100
700
50-54
1600
1050
55-54
2300
1580
60-64
3340
2250
UN - Male
SA 1997
SA 2004
UN - Female
SA 1997
SA 2004
15-19
210
235
216
150
165
187
20-24
340
381
555
205
331
1085
25-29
395
625
1081
300
452
1985
30-34
460
817
2118
360
489
2267
35-39
600
916
2498
405
526
1890
40-44
800
1136
2765
500
615
1548
45-49
1100
1486
2744
700
800
1400
50-54
1600
2016
2979
1050
1116
1506
55-54
2300
2838
3270
1580
1626
1717
60-64
3340
3614
4146
2250
2201
2360
Stroke
ill-defined heart disease
Diabetes mellitus
Ischaemic heart disease
Hypertension
Nephritisnephrosis
Stroke
ill-defined heart disease
Diabetes mellitus
Ischaemic heart disease
Hypertension
Nephritisnephrosis
1999
34
345
20
248
14
10
1999
295
246
23
10
145
68
2000
36
362
218
249
152
112
2000
318
268
241
108
16
8
2001
35
372
22
25
15
125
2001
322
28
252
102
162
95
2002
405
298
24
26
147
126
2002
352
295
27
115
16
10
2003
425
32
245
285
152
15
2003
382
299
285
122
17
12
2004
39
325
255
26
165
16
2004
35
30
295
121
19
119
2005
36
328
265
26
15
162
2005
325
30
32
12
18
12
2006
35
336
27
258
155
16
2006
33
32
32
11
18
125
Stroke
ill-defined heart disease
Diabetes mellitus
Ischaemic heart disease
Hypertension
Nephritisnephrosis
Stroke
ill-defined heart disease
Diabetes mellitus
Ischaemic heart disease
Hypertension
Nephritisnephrosis
Males
Female
UN - Male
SA 1997
SA 2004
UN - Female
SA 1997
SA 2004
0 pts
1 - 3 pts
4 - 9 pts
10+ pts
42
Source wwwclinicaltrialsgov 22-Oct-2010
Clinical trials registered across Africa
43
0
500
1000
1500
2000
2500
South Africa Kenya Malawi Tanzania Uganda Zambia
Selected African countries
2005
2010
2015
Source ClinTrialsgov
Trend 2005 - 2015
Source wwwclinicaltrialsgov 28-Aug-2015
44
AFRICA FOUND IN TRANSLATION
bull Vast treatment-naiumlve population bull Cost advantages (still) bull Diverse ethnicity amp morbidity bull Inverse seasonality bull Site capacity-building widely implemented bull Robust regulatory review bull Variable but generally good regulatory timelines bull Established GCP culture ndash sites and home-bred CROs
45
THANK YOU
Foliennummer 1
Triclinium A South African CRO
Collaboration with VPM SII
Vaccine Trials in SA 2015
Foliennummer 5
Foliennummer 6
Foliennummer 7
Foliennummer 8
Foliennummer 9
Foliennummer 10
Foliennummer 11
Foliennummer 12
Foliennummer 13
Foliennummer 14
Foliennummer 15
Foliennummer 16
Foliennummer 17
Distribution of clinical trial sites
Foliennummer 19
South Africa Leading Causes of Death
Foliennummer 21
Foliennummer 22
South Africa TB deaths by age group
Foliennummer 24
Foliennummer 25
Foliennummer 26
Foliennummer 27
Foliennummer 28
Foliennummer 29
Foliennummer 30
Foliennummer 31
SA Clinical Trial Regulatory Processes
Clinical Trial Density Active sites million population
Foliennummer 34
Why Africa
Foliennummer 36
AFRICA hellip the true size
SSV to SIV
Foliennummer 39
Foliennummer 40
Foliennummer 41
Foliennummer 42
Foliennummer 43
AFRICA FOUND IN TRANSLATION
Foliennummer 45
Region
Median
of Sites
Patients Site
0 pts
1 - 3 pts
4 - 9 pts
10+ pts
Latin America
4
21
26
30
23
North America
3
29
29
24
18
Eastern Europe
6
15
31
26
27
Western Europe
4
15
22
29
34
Asia Pacific
4
19
30
34
18
Africa
10
4
17
28
51
0 pts
1 - 3 pts
4 - 9 pts
10+ pts
Latin America
21
26
30
23
North America
29
29
24
18
Eastern Europe
15
31
26
27
Western Europe
15
22
29
34
Asia Pacific
19
30
34
18
Africa
4
17
28
51
Males
Female
15-19
210
150
20-24
340
205
25-29
395
300
30-34
460
360
35-39
600
405
40-44
800
500
45-49
1100
700
50-54
1600
1050
55-54
2300
1580
60-64
3340
2250
UN - Male
SA 1997
SA 2004
UN - Female
SA 1997
SA 2004
15-19
210
235
216
150
165
187
20-24
340
381
555
205
331
1085
25-29
395
625
1081
300
452
1985
30-34
460
817
2118
360
489
2267
35-39
600
916
2498
405
526
1890
40-44
800
1136
2765
500
615
1548
45-49
1100
1486
2744
700
800
1400
50-54
1600
2016
2979
1050
1116
1506
55-54
2300
2838
3270
1580
1626
1717
60-64
3340
3614
4146
2250
2201
2360
Stroke
ill-defined heart disease
Diabetes mellitus
Ischaemic heart disease
Hypertension
Nephritisnephrosis
Males
Female
UN - Male
SA 1997
SA 2004
UN - Female
SA 1997
SA 2004
0 pts
1 - 3 pts
4 - 9 pts
10+ pts
42
Source wwwclinicaltrialsgov 22-Oct-2010
Clinical trials registered across Africa
43
0
500
1000
1500
2000
2500
South Africa Kenya Malawi Tanzania Uganda Zambia
Selected African countries
2005
2010
2015
Source ClinTrialsgov
Trend 2005 - 2015
Source wwwclinicaltrialsgov 28-Aug-2015
44
AFRICA FOUND IN TRANSLATION
bull Vast treatment-naiumlve population bull Cost advantages (still) bull Diverse ethnicity amp morbidity bull Inverse seasonality bull Site capacity-building widely implemented bull Robust regulatory review bull Variable but generally good regulatory timelines bull Established GCP culture ndash sites and home-bred CROs
45
THANK YOU
Foliennummer 1
Triclinium A South African CRO
Collaboration with VPM SII
Vaccine Trials in SA 2015
Foliennummer 5
Foliennummer 6
Foliennummer 7
Foliennummer 8
Foliennummer 9
Foliennummer 10
Foliennummer 11
Foliennummer 12
Foliennummer 13
Foliennummer 14
Foliennummer 15
Foliennummer 16
Foliennummer 17
Distribution of clinical trial sites
Foliennummer 19
South Africa Leading Causes of Death
Foliennummer 21
Foliennummer 22
South Africa TB deaths by age group
Foliennummer 24
Foliennummer 25
Foliennummer 26
Foliennummer 27
Foliennummer 28
Foliennummer 29
Foliennummer 30
Foliennummer 31
SA Clinical Trial Regulatory Processes
Clinical Trial Density Active sites million population
Foliennummer 34
Why Africa
Foliennummer 36
AFRICA hellip the true size
SSV to SIV
Foliennummer 39
Foliennummer 40
Foliennummer 41
Foliennummer 42
Foliennummer 43
AFRICA FOUND IN TRANSLATION
Foliennummer 45
Region
Median
of Sites
Patients Site
0 pts
1 - 3 pts
4 - 9 pts
10+ pts
Latin America
4
21
26
30
23
North America
3
29
29
24
18
Eastern Europe
6
15
31
26
27
Western Europe
4
15
22
29
34
Asia Pacific
4
19
30
34
18
Africa
10
4
17
28
51
0 pts
1 - 3 pts
4 - 9 pts
10+ pts
Latin America
21
26
30
23
North America
29
29
24
18
Eastern Europe
15
31
26
27
Western Europe
15
22
29
34
Asia Pacific
19
30
34
18
Africa
4
17
28
51
Males
Female
15-19
210
150
20-24
340
205
25-29
395
300
30-34
460
360
35-39
600
405
40-44
800
500
45-49
1100
700
50-54
1600
1050
55-54
2300
1580
60-64
3340
2250
UN - Male
SA 1997
SA 2004
UN - Female
SA 1997
SA 2004
15-19
210
235
216
150
165
187
20-24
340
381
555
205
331
1085
25-29
395
625
1081
300
452
1985
30-34
460
817
2118
360
489
2267
35-39
600
916
2498
405
526
1890
40-44
800
1136
2765
500
615
1548
45-49
1100
1486
2744
700
800
1400
50-54
1600
2016
2979
1050
1116
1506
55-54
2300
2838
3270
1580
1626
1717
60-64
3340
3614
4146
2250
2201
2360
Males
Female
UN - Male
SA 1997
SA 2004
UN - Female
SA 1997
SA 2004
0 pts
1 - 3 pts
4 - 9 pts
10+ pts
42
Source wwwclinicaltrialsgov 22-Oct-2010
Clinical trials registered across Africa
43
0
500
1000
1500
2000
2500
South Africa Kenya Malawi Tanzania Uganda Zambia
Selected African countries
2005
2010
2015
Source ClinTrialsgov
Trend 2005 - 2015
Source wwwclinicaltrialsgov 28-Aug-2015
44
AFRICA FOUND IN TRANSLATION
bull Vast treatment-naiumlve population bull Cost advantages (still) bull Diverse ethnicity amp morbidity bull Inverse seasonality bull Site capacity-building widely implemented bull Robust regulatory review bull Variable but generally good regulatory timelines bull Established GCP culture ndash sites and home-bred CROs
45
THANK YOU
Foliennummer 1
Triclinium A South African CRO
Collaboration with VPM SII
Vaccine Trials in SA 2015
Foliennummer 5
Foliennummer 6
Foliennummer 7
Foliennummer 8
Foliennummer 9
Foliennummer 10
Foliennummer 11
Foliennummer 12
Foliennummer 13
Foliennummer 14
Foliennummer 15
Foliennummer 16
Foliennummer 17
Distribution of clinical trial sites
Foliennummer 19
South Africa Leading Causes of Death
Foliennummer 21
Foliennummer 22
South Africa TB deaths by age group
Foliennummer 24
Foliennummer 25
Foliennummer 26
Foliennummer 27
Foliennummer 28
Foliennummer 29
Foliennummer 30
Foliennummer 31
SA Clinical Trial Regulatory Processes
Clinical Trial Density Active sites million population
Foliennummer 34
Why Africa
Foliennummer 36
AFRICA hellip the true size
SSV to SIV
Foliennummer 39
Foliennummer 40
Foliennummer 41
Foliennummer 42
Foliennummer 43
AFRICA FOUND IN TRANSLATION
Foliennummer 45
Region
Median
of Sites
Patients Site
0 pts
1 - 3 pts
4 - 9 pts
10+ pts
Latin America
4
21
26
30
23
North America
3
29
29
24
18
Eastern Europe
6
15
31
26
27
Western Europe
4
15
22
29
34
Asia Pacific
4
19
30
34
18
Africa
10
4
17
28
51
0 pts
1 - 3 pts
4 - 9 pts
10+ pts
Latin America
21
26
30
23
North America
29
29
24
18
Eastern Europe
15
31
26
27
Western Europe
15
22
29
34
Asia Pacific
19
30
34
18
Africa
4
17
28
51
0 pts
1 - 3 pts
4 - 9 pts
10+ pts
42
Source wwwclinicaltrialsgov 22-Oct-2010
Clinical trials registered across Africa
43
0
500
1000
1500
2000
2500
South Africa Kenya Malawi Tanzania Uganda Zambia
Selected African countries
2005
2010
2015
Source ClinTrialsgov
Trend 2005 - 2015
Source wwwclinicaltrialsgov 28-Aug-2015
44
AFRICA FOUND IN TRANSLATION
bull Vast treatment-naiumlve population bull Cost advantages (still) bull Diverse ethnicity amp morbidity bull Inverse seasonality bull Site capacity-building widely implemented bull Robust regulatory review bull Variable but generally good regulatory timelines bull Established GCP culture ndash sites and home-bred CROs
45
THANK YOU
Foliennummer 1
Triclinium A South African CRO
Collaboration with VPM SII
Vaccine Trials in SA 2015
Foliennummer 5
Foliennummer 6
Foliennummer 7
Foliennummer 8
Foliennummer 9
Foliennummer 10
Foliennummer 11
Foliennummer 12
Foliennummer 13
Foliennummer 14
Foliennummer 15
Foliennummer 16
Foliennummer 17
Distribution of clinical trial sites
Foliennummer 19
South Africa Leading Causes of Death
Foliennummer 21
Foliennummer 22
South Africa TB deaths by age group
Foliennummer 24
Foliennummer 25
Foliennummer 26
Foliennummer 27
Foliennummer 28
Foliennummer 29
Foliennummer 30
Foliennummer 31
SA Clinical Trial Regulatory Processes
Clinical Trial Density Active sites million population
Foliennummer 34
Why Africa
Foliennummer 36
AFRICA hellip the true size
SSV to SIV
Foliennummer 39
Foliennummer 40
Foliennummer 41
Foliennummer 42
Foliennummer 43
AFRICA FOUND IN TRANSLATION
Foliennummer 45
45
THANK YOU
Foliennummer 1
Triclinium A South African CRO
Collaboration with VPM SII
Vaccine Trials in SA 2015
Foliennummer 5
Foliennummer 6
Foliennummer 7
Foliennummer 8
Foliennummer 9
Foliennummer 10
Foliennummer 11
Foliennummer 12
Foliennummer 13
Foliennummer 14
Foliennummer 15
Foliennummer 16
Foliennummer 17
Distribution of clinical trial sites
Foliennummer 19
South Africa Leading Causes of Death
Foliennummer 21
Foliennummer 22
South Africa TB deaths by age group
Foliennummer 24
Foliennummer 25
Foliennummer 26
Foliennummer 27
Foliennummer 28
Foliennummer 29
Foliennummer 30
Foliennummer 31
SA Clinical Trial Regulatory Processes
Clinical Trial Density Active sites million population