current state of cre lending 051410 - access …accesscm.com/resources/current state of cre...
TRANSCRIPT
Current State of CRE Lending for CMBS
Marielle Jan de BeurSenior AnalystHead of Structured Products ResearchCMBS and Real Estate [email protected](212) 214-8047
May 13, 2010
Please see the disclosure appendix of this publication for certification and disclosure information

1
Estimated Commercial Mortgage Maturities
CMBS Accounts for 10%-15% of 2009-2010 CRE Debt Maturities
• Approximately $1 trillion of the $2.7 trillion in commercial real estate debt is coming due over the next three years. Near-term maturities are concentrated in bank loans, which have more flexible modification language than CMBS loans.
($billion) 2010E 2011E 2012E
Banks 227.8 250.5 275.6
Insurance Companies 23.7 26.7 27.3
CMBS Total 48.5 54.2 59.9
TOTAL 299.9 331.5 362.7
Source: ACLI, Federal Reserve Board of Governors and
Wells Fargo Securities, LLC's estimates.
*CMBS total includes large-loan floating rate to first maturity.
2
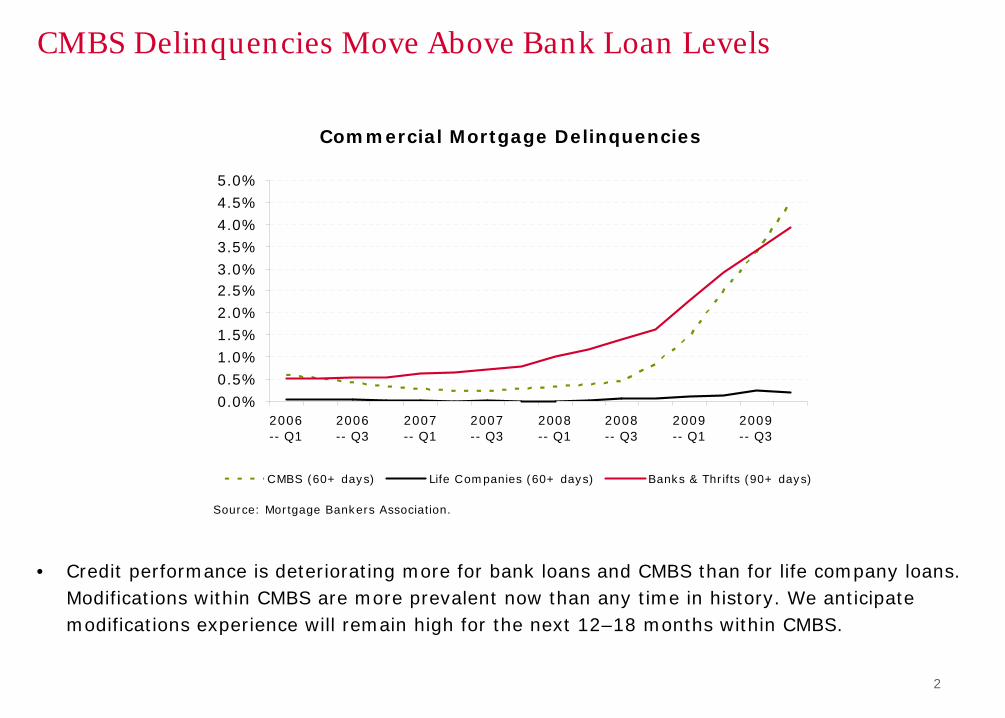
Commercial Mortgage Delinquencies
CMBS Delinquencies Move Above Bank Loan Levels
• Credit performance is deteriorating more for bank loans and CMBS than for life company loans. Modifications within CMBS are more prevalent now than any time in history. We anticipate modifications experience will remain high for the next 12–18 months within CMBS.
0.0%0.5%1.0%1.5%2.0%2.5%3.0%3.5%4.0%4.5%5.0%
2006-- Q1
2006-- Q3
2007-- Q1
2007-- Q3
2008-- Q1
2008-- Q3
2009-- Q1
2009-- Q3
CMBS (60+ days) Life Companies (60+ days) Banks & Thrifts (90+ days)
Source: Mortgage Bankers Association.
3
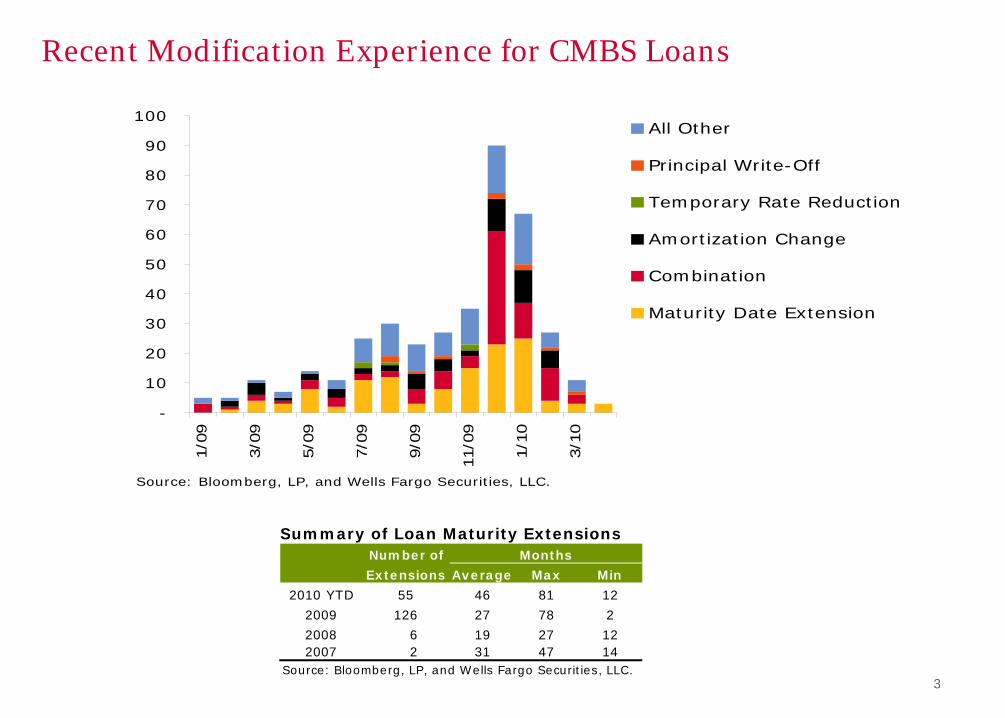
Recent Modification Experience for CMBS Loans
-
10
20
30
40
50
60
70
80
90
100
1/0
9
3/0
9
5/0
9
7/0
9
9/0
9
11/0
9
1/1
0
3/1
0
All Other
Principal Write-Off
Temporary Rate Reduction
Amortization Change
Combination
Maturity Date Extension
Source: Bloomberg, LP, and Wells Fargo Securities, LLC.
Summary of Loan Maturity ExtensionsNumber of
Extensions Average Max Min
2010 YTD 55 46 81 12
2009 126 27 78 2
2008 6 19 27 122007 2 31 47 14
Source: Bloomberg, LP, and Wells Fargo Securities, LLC.
Months
4
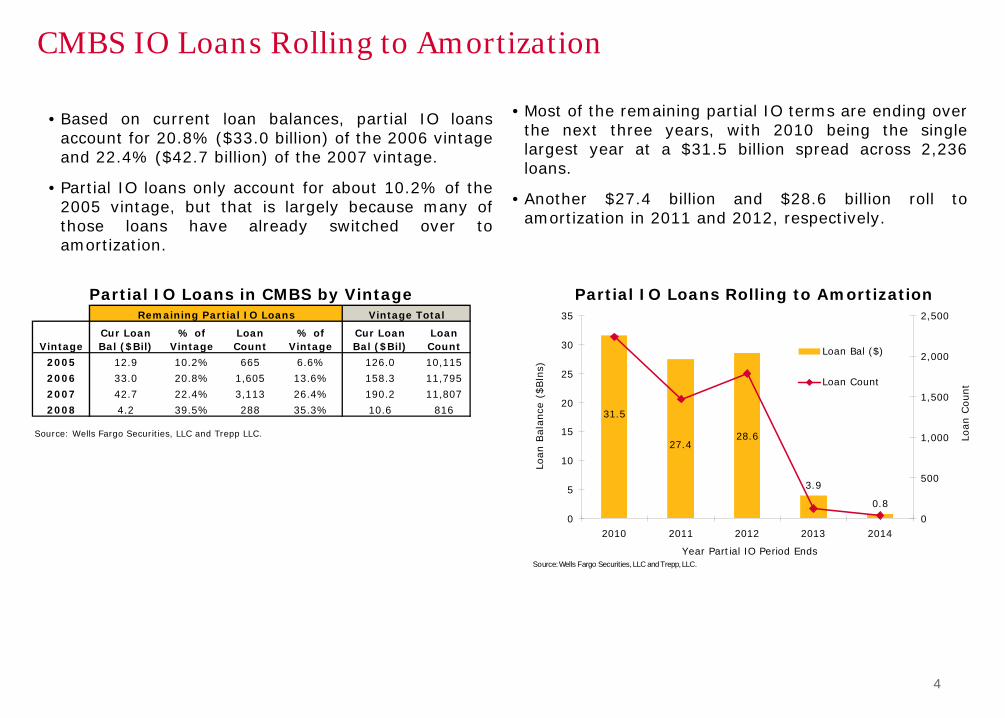
CMBS IO Loans Rolling to Amortization
VintageCur Loan Bal ($Bil)
% of Vintage
Loan Count
% of Vintage
Cur Loan Bal ($Bil)
Loan Count
2005 12.9 10.2% 665 6.6% 126.0 10,115
2006 33.0 20.8% 1,605 13.6% 158.3 11,795
2007 42.7 22.4% 3,113 26.4% 190.2 11,807
2008 4.2 39.5% 288 35.3% 10.6 816
Source: Wells Fargo Securities, LLC and Trepp LLC.
Remaining Partial IO Loans Vintage Total
Partial IO Loans in CMBS by Vintage Partial IO Loans Rolling to Amortization
3.9
0.8
31.5
27.428.6
0
5
10
15
20
25
30
35
2010 2011 2012 2013 2014
Year Partial IO Period EndsLo
an B
ala
nce
($Bln
s)
0
500
1,000
1,500
2,000
2,500
Loan C
ount
Loan Bal ($)
Loan Count
Source: Wells Fargo Securities, LLC and Trepp, LLC.
• Based on current loan balances, partial IO loans account for 20.8% ($33.0 billion) of the 2006 vintage and 22.4% ($42.7 billion) of the 2007 vintage.
• Partial IO loans only account for about 10.2% of the 2005 vintage, but that is largely because many of those loans have already switched over to amortization.
• Most of the remaining partial IO terms are ending over the next three years, with 2010 being the single largest year at a $31.5 billion spread across 2,236 loans.
• Another $27.4 billion and $28.6 billion roll to amortization in 2011 and 2012, respectively.

5
CMBS Underwater Performing Loans
0.00%
2.00%
4.00%
6.00%
8.00%
10.00%
12.00%
14.00%
16.00%
18.00%
20.00%
22.00%
24.00%
2000 2001 2002 2003 2004 2005 2006 2007 2008
% o
f O
uts
tandin
g B
al B
elow
1.0
DSCR % Delinquent
% Current
VintageTotal Bal ($Bln)
Below 1.0x DSCR ($Bln)
% Below 1.0x
Below 1.0x and Current ($Bln)
% CurrentBelow 1.0x and
Delinquent ($Bln)% Delinquent
2000 7.63 1.73 22.7% 0.94 54.7% 0.78 45.3%2001 16.61 2.84 17.1% 2.07 72.9% 0.77 27.1%2002 18.80 2.45 13.0% 1.89 77.4% 0.55 22.6%2003 32.41 2.90 8.9% 2.25 77.7% 0.65 22.3%2004 51.21 5.33 10.4% 4.20 78.7% 1.14 21.3%2005 120.23 12.67 10.5% 8.52 67.3% 4.15 32.7%2006 157.95 20.43 12.9% 14.46 70.8% 5.97 29.2%2007 190.01 40.76 21.5% 33.20 81.4% 7.56 18.6%2008 10.63 1.04 9.8% 0.80 76.8% 0.24 23.2%Total 605.49 90.15 14.9% 68.35 75.8% 21.81 24.2%
Notes: Data includes loans from 2000 - 2008 and excludes defeased loans. Used the most recent NCF DSCR figures.Source: Wells Fargo Securities, LLC and Trepp LLC, Inc.
Vintage Trends - Loans with Below 1.0x DSCR• Among the more recent vintages, the percentage of
loans with DSCRs below 1.0x is highest in the 2007 vintage with 21.5%, while the rest of the vintages are in the 10%-12% range.
• The 2007 vintage also has the highest percentage of loans with DSCRs below 1.0x that are still performing at 81.4%.
• This compares with the 2005 and 2006 vintages in which only 67.3% and 70.8% of the loans, respectively, with DSCRs below 1.0x are still performing.

6
2009 NOI Trends by Property Type for CMBS Loans
YOY Percentage Change in NOI by Property Type
• With about 45% of the loans reporting year-end 2009 financials, NOI on a year-over-year basis isdown 2.3% on average from year-end 2008.
• Hotels suffered the greatest decline in NOI at 26% when comparing year-end 2009 to year-end 2008.
• Multifamily, office and manufactured housing were the only property types to have positive NOI growth.
-5.9%
-0.8%
1.3%
-0.6%
2.4% 2.5%
-26.0%
-4.8%-3.0% -2.6%
-1.6%
4.6%
1.0% 0.8%0.5% 0.6%
-30%
-26%
-22%
-18%
-14%
-10%
-6%
-2%
2%
6%
10%
14%
Hotel SelfStorage
Mixed Use Retail Industrial Multifamily Office Manuf.Housing
YO
Y %
Change in N
OI
YE 07 to YE 08
YE 08 to YE 09
Source: Wells Fargo Securities, LLC and Trepp LLC.
7
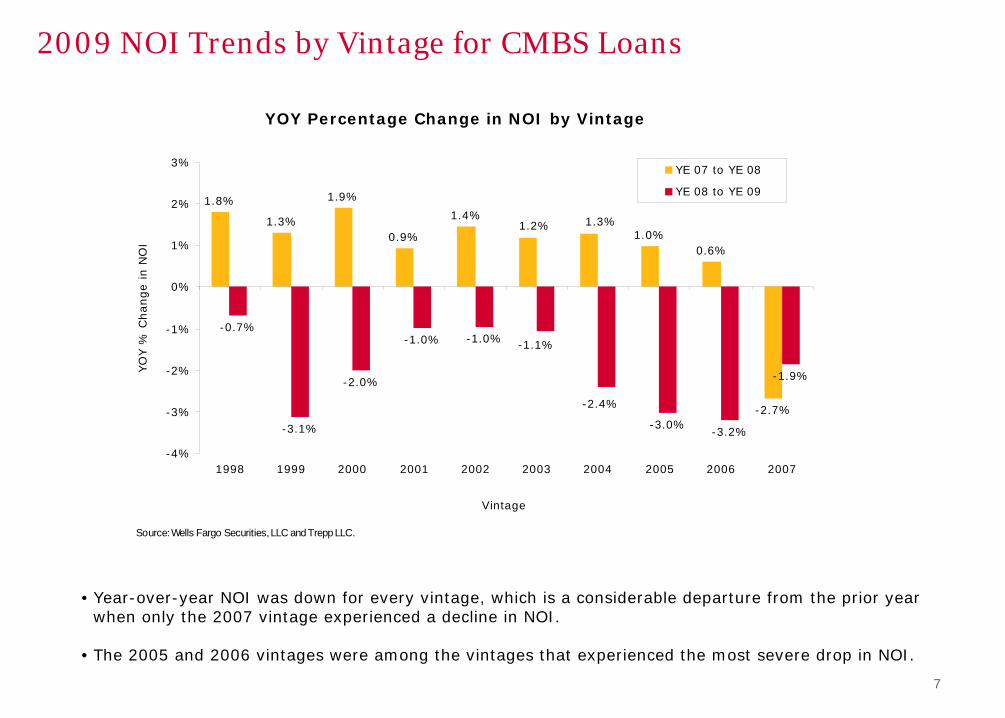
2009 NOI Trends by Vintage for CMBS Loans
YOY Percentage Change in NOI by Vintage
• Year-over-year NOI was down for every vintage, which is a considerable departure from the prior year when only the 2007 vintage experienced a decline in NOI.
• The 2005 and 2006 vintages were among the vintages that experienced the most severe drop in NOI.
1.8%
1.3%
1.9%
0.9%
1.4%
1.0%0.6%
-2.7%
-0.7%
-3.1%
-2.0%
-1.0% -1.0%
-3.0%-3.2%
-1.9%
1.2% 1.3%
-1.1%
-2.4%
-4%
-3%
-2%
-1%
0%
1%
2%
3%
1998 1999 2000 2001 2002 2003 2004 2005 2006 2007
Vintage
YO
Y %
Change in N
OI
YE 07 to YE 08
YE 08 to YE 09
Source: Wells Fargo Securities, LLC and Trepp LLC.
8
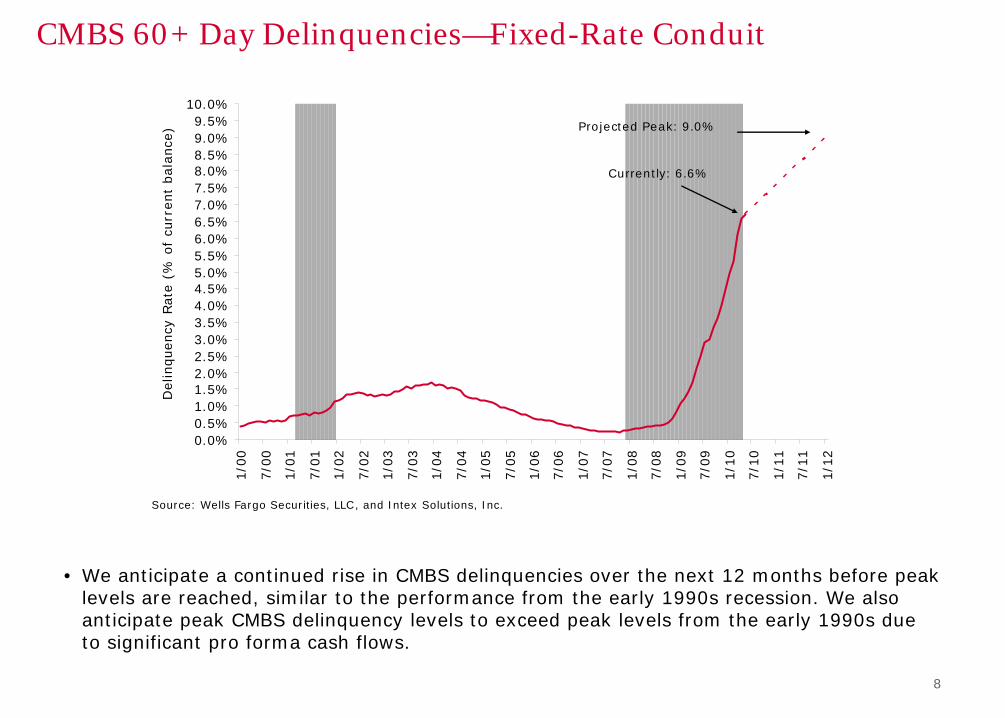
CMBS 60+ Day Delinquencies—Fixed-Rate Conduit
• We anticipate a continued rise in CMBS delinquencies over the next 12 months before peak levels are reached, similar to the performance from the early 1990s recession. We also anticipate peak CMBS delinquency levels to exceed peak levels from the early 1990s due to significant pro forma cash flows.
0.0%0.5%1.0%1.5%2.0%2.5%3.0%3.5%4.0%4.5%5.0%5.5%6.0%6.5%7.0%7.5%8.0%8.5%9.0%9.5%
10.0%
1/0
0
7/0
0
1/0
1
7/0
1
1/0
2
7/0
2
1/0
3
7/0
3
1/0
4
7/0
4
1/0
5
7/0
5
1/0
6
7/0
6
1/0
7
7/0
7
1/0
8
7/0
8
1/0
9
7/0
9
1/1
0
7/1
0
1/1
1
7/1
1
1/1
2
Delinquency
Rate
(%
of
curr
ent
bala
nce
)
Source: Wells Fargo Securities, LLC, and Intex Solutions, Inc.
Currently: 6.6%
Projected Peak: 9.0%
9
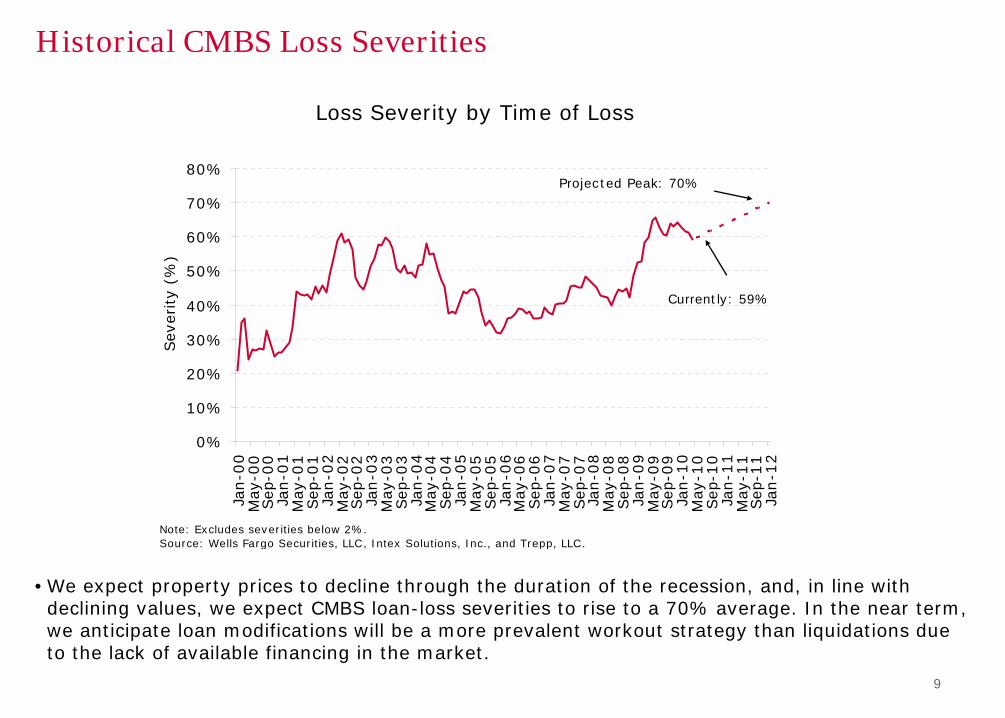
•We expect property prices to decline through the duration of the recession, and, in line with declining values, we expect CMBS loan-loss severities to rise to a 70% average. In the near term, we anticipate loan modifications will be a more prevalent workout strategy than liquidations due to the lack of available financing in the market.
Historical CMBS Loss Severities
Loss Severity by Time of Loss
0%
10%
20%
30%
40%
50%
60%
70%
80%
Jan-0
0M
ay-0
0Sep
-00
Jan-0
1M
ay-0
1Sep
-01
Jan-0
2M
ay-0
2Sep
-02
Jan-0
3M
ay-0
3Sep
-03
Jan-0
4M
ay-0
4Sep
-04
Jan-0
5M
ay-0
5Sep
-05
Jan-0
6M
ay-0
6Sep
-06
Jan-0
7M
ay-0
7Sep
-07
Jan-0
8M
ay-0
8Sep
-08
Jan-0
9M
ay-0
9Sep
-09
Jan-1
0M
ay-1
0Sep
-10
Jan-1
1M
ay-1
1Sep
-11
Jan-1
2
Sev
erity
(%)
Note: Excludes severities below 2%.Source: Wells Fargo Securities, LLC, Intex Solutions, Inc., and Trepp, LLC.
Projected Peak: 70%
Currently: 59%
10
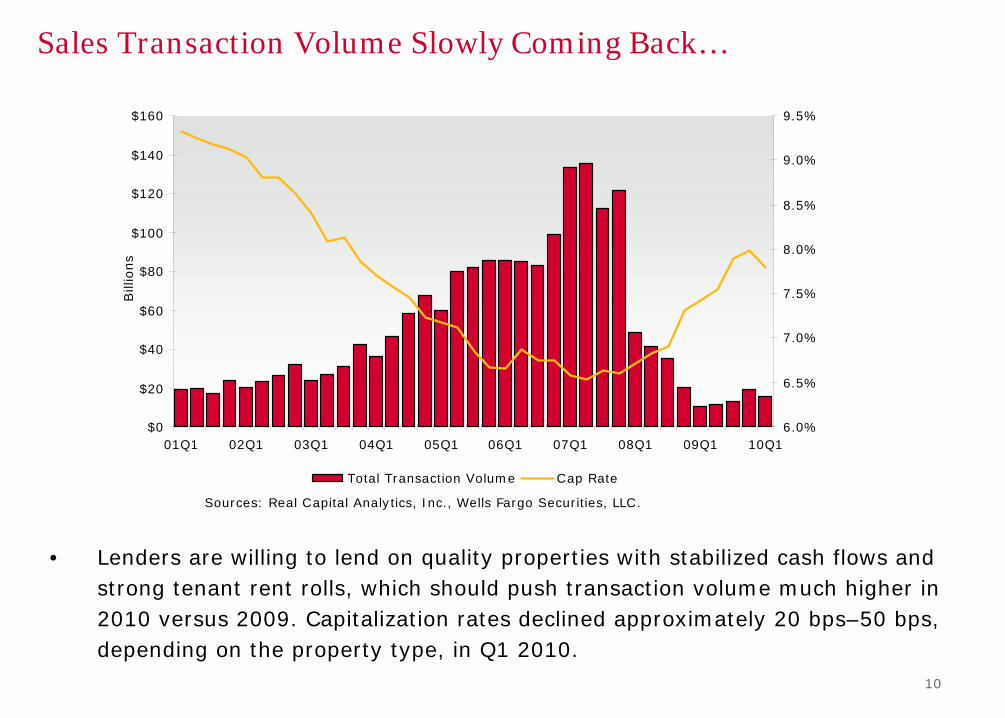
Sales Transaction Volume Slowly Coming Back…
• Lenders are willing to lend on quality properties with stabilized cash flows and strong tenant rent rolls, which should push transaction volume much higher in 2010 versus 2009. Capitalization rates declined approximately 20 bps–50 bps, depending on the property type, in Q1 2010.
$0
$20
$40
$60
$80
$100
$120
$140
$160
01Q1 02Q1 03Q1 04Q1 05Q1 06Q1 07Q1 08Q1 09Q1 10Q1
Bill
ions
6.0%
6.5%
7.0%
7.5%
8.0%
8.5%
9.0%
9.5%
Total Transaction Volume Cap Rate
Sources: Real Capital Analytics, Inc., Wells Fargo Securities, LLC.

11
• We expect property pricing for the major property types to continue to decline through 2010, with the greatest drop in pricing behind us at this point.
• We anticipate it will take about 18 months (early 2012) before property revenues begin rising.
• Strong investor interest in stabilized core assets will likely result in competitive pricing, and cap rates for these products are actually compressing.
Property Values Projected to Ultimately Decline 45%
8090
100110120130140150160170180190200
2000-4
2001-2
2001-4
2002-2
2002-4
2003-2
2003-4
2004-2
2004-4
2005-2
2005-4
2006-2
2006-4
2007-2
2007-4
2008-2
2008-4
2009-2
2010F
2012F
2014F
Moody's
CPPI
Apt Ind Off RetSource: M oody's CPPI, M IT Center for Real Estate, Real Capital Analytics, Wells Fargo Securities, LLC.
Index High Date Q4 2009 Decline 2010F 2011F 2012F Delta YTD
Apt 194.5 Q1 2007 125.9 -35.3% 114.4 110.4 107.0 -9.7%
Ind 192.5 Q4 2007 127.3 -33.9% 114.6 110.8 108.6 -9.7%
Off 177.6 Q2 2007 122.2 -31.2% 107.5 102.6 100.2 -12.4%
Ret 195.2 Q3 2007 139.6 -28.5% 126.4 121.5 107.4 -16.5%
Sources: Moody's CPPI, MIT Center for Real Estate, Real Capital Analytics, Wells Fargo Securities, LLC.
-43.6%
-43.6%
-45.0%
Peak to Trough Wells Fargo ForecastMoody's CPPI
Decline
-45.0%
12
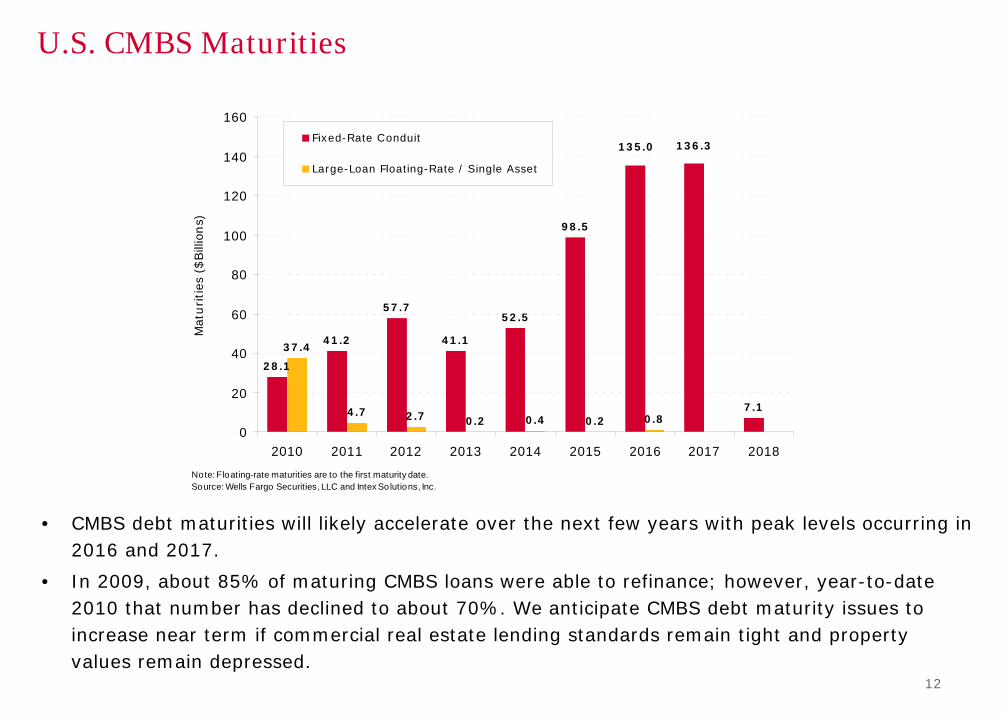
U.S. CMBS Maturities
• CMBS debt maturities will likely accelerate over the next few years with peak levels occurring in2016 and 2017.
• In 2009, about 85% of maturing CMBS loans were able to refinance; however, year-to-date 2010 that number has declined to about 70%. We anticipate CMBS debt maturity issues to increase near term if commercial real estate lending standards remain tight and property values remain depressed.
28.1
41.2
57.7
41.1
52.5
98.5
7.1
37.4
4.7 2.7 0.2 0.4 0.2 0.8
135.0 136.3
0
20
40
60
80
100
120
140
160
2010 2011 2012 2013 2014 2015 2016 2017 2018
Mat
urities
($Bill
ions)
Fixed-Rate Conduit
Large-Loan Floating-Rate / Single Asset
Note: Floating-rate maturities are to the first maturity date.Source: Wells Fargo Securities, LLC and Intex Solutions, Inc.

13
U.S. CMBS Issuance Trends
• Annual CMBS issuance peaked in 2007 at $230 billion. Since then, issuance volume remains below 1992 levels.
• We do not anticipate significant CMBS issuance in 2010 due to tight lending standards, flat to lower property values, additional deterioration in property cash flows, lead time needed to accumulate collateral for securitization, few effective hedging tools for conduits and questions regarding accounting/regulatory treatment of CMBS.
5 8 14 17 16 1627
37
74
5747
68
52
78
94
169
204
230
12 7 10
0
25
50
75
100
125
150
175
200
225
250
1990
1991
1992
1993
1994
1995
1996
1997
1998
1999
2000
2001
2002
2003
2004
2005
2006
2007
2008
2009
2010 F
Issu
ance
($Bill
ions)
Note: Excludes agency deals and resecuritizations. 2010 is a forecast.Source: Wells Fargo Securities, LLC and Commercial Mortgage Alert.

14
CMBS Spreads versus REIT Spreads
• REIT debt is trading about 200 bps tight of the 2007 vintage AAA CMBS and in parity with the 2005 vintage CMBS. If we assume 2007 vintage deals experience our projected lifetime loss of 8%–10% and a significant portion of problem loans are modified for 24 months, yield declines by about 75 bps, indicating some value to 2007 vintage CMBS and REIT debt.
-
200
400
600
800
1,000
1,200
1,400
1,600
1,800
1/0
6
4/0
6
7/0
6
10/0
6
1/0
7
4/0
7
7/0
7
10/0
7
1/0
8
4/0
8
7/0
8
10/0
8
1/0
9
4/0
9
7/0
9
10/0
9
1/1
0
4/1
0
Spre
ad t
o T
reasu
ry (
bps)
Weak 2007 Vintage Supersenior 10YR AAA
BBB REIT Index
2005 Vintage 10YR AAA
Source: B loomberg LP and Wells Fargo Securities, LLC.

15
Yields: Corporates versus CMBS
CMBS Yields versus Corporates
5/4/10 3/22/10 2/8/10 1/13/10 12/14/09
5-Yr. Corporates Composite AA 3.21% 3.25% 3.04% 3.31% 3.26%
A 3.66 3.73 3.56 3.83 3.73BBB 4.30 4.51 4.41 4.77 4.84
BB 5.91 6.22 6.20 6.56 6.80B 7.00 7.42 7.13 7.55 7.87
Finance BB 6.89 6.73 6.86 7.33 7.56
Industrials BB 5.47 5.97 5.92 6.17 6.38Retail BB 5.47 6.2 6.15 6.43 6.71
CMBS (loss adjusted) A2 3.58 3.8 3.6 4.3 4.5A4 6.07 7.1 7.9 7.8 9.3
AM 7.1–11.6 7.3–13 8.0–14 8.0–10.0 10.0–15.0
CMBS (With 2-Yr Extension) A2 4.27 4.3 3.7 4.8 4.4A4 6.07 7.1 7.9 7.5 8.6
AM 7.0–11.3 0–10 2–9.5 7.5–9.5 8.5–13.0Note: CMBS runs assume 3 CDR, 50% severity and a 12-mo. recovery lag. Source: Bloomberg Fair Market Value Curves, Bloomberg LP and Wells Fargo Securities, LLC.
16
DISCLOSURE APPENDIX
Additional information is available on request.
This report was prepared by Wells Fargo Securities, LLC.
About Wells Fargo Securities, LLC Wells Fargo Securities, LLC is a U.S. broker-dealer registered with the U.S. Securities and Exchange Commission and a member of the New York Stock Exchange, theFinancial Industry Regulatory Authority and the Securities Investor Protection Corp. Important Information for Non-U.S. Recipients EEA The securities and related financial instruments described herein may not be eligible for sale in all jurisdictions or to certain categories of investors. For recipients in theEEA, this report is distributed by Wells Fargo Securities International Limited (“WFSIL”). WFSIL is a U.K. incorporated investment firm authorized and regulated by theFinancial Services Authority. For the purposes of Section 21 of the UK Financial Services and Markets Act 2000 (“the Act”), the content of this report has been approvedby WFSIL a regulated person under the Act. WFSIL does not deal with retail clients as defined in the Markets in Financial Instruments Directive 2007. This report is notintended for, and should not be relied upon by, retail clients. Australia Wells Fargo Securities, LLC is exempt from the requirements to hold an Australian financial services license in respect of the financial services it provides to wholesaleclients in Australia. Wells Fargo Securities, LLC is regulated under U.S. laws which differ from Australian laws. Any offer or documentation provided to Australianrecipients by Wells Fargo Securities, LLC in the course of providing the financial services will be prepared in accordance with the laws of the United States and notAustralian laws. Hong Kong This report is issued and distributed in Hong Kong by Wells Fargo Securities Asia Limited (“WFSAL”), a Hong Kong incorporated investment firm licensed and regulatedby the Securities and Futures Commission to carry on types 1, 4, 6 and 9 regulated activities (as defined in the Securities and Futures Ordinance, “the SFO”). This reportis not intended for, and should not be relied on by, any person other than professional investors (as defined in the SFO). Any securities and related financial instrumentsdescribed herein are not intended for sale, nor will be sold, to any person other than professional investors (as defined in the SFO). Japan This report is distributed in Japan by Wells Fargo Securities (Japan) Co., Ltd, a Japanese financial instruments firm registered with the Kanto Local Finance Bureau, asubordinate regulatory body of the Ministry of Finance in Japan, to conduct broking and dealing of type 1 and type 2 financial instruments and agency or intermediaryservice for entry into investment advisory or discretionary investment contracts. This report is intended for distribution only to professional customers (TokuteiToushika) and is not intended for, and should not be relied upon by, ordinary customers (Ippan Toushika). Important Disclosures Relating to Conflicts of Interest and Potential Conflicts of Interest
Wells Fargo Securities, LLC may sell or buy the subject securities to/from customers on a principal basis or act as a liquidity provider in such securities. Wells Fargo Securities, LLC does not compensate its research analysts based on specific investment banking transactions. Wells Fargo Securities, LLC research analystsreceive compensation that is based on and affected by the overall profitability of their respective department and the firm, which includes, but is not limited to,investment banking revenue. Wells Fargo Securities, LLC Fixed Income Research analysts interact with the firm’s trading and sales personnel in the ordinary course of business. The firm trades ormay trade as a principal in the securities or related derivatives mentioned herein. The firm’s interests may conflict with the interests of investors in those instruments. For additional disclosure information please go to: www.wellsfargo.com/research.

17
Analyst’s Certification The research analyst(s) principally responsible for the report certifies to the following: all views expressed in this research report accurately reflect the analysts’ personal views about any and all of the subject securities or issuers discussed; and no part of the research analysts’ compensation was, is, or will be, directly or indirectly, related to the specific recommendations or views expressed by the research analyst(s) in this research report.
This report, IDs, and passwords are available at www.wellsfargo.com/research
This report is for your information only and is not an offer to sell, or a solicitation of an offer to buy, the securities or instruments named or described in this report. Interested parties are advised to contact the entity with which they deal, or the entity that provided this report to them, if they desire further information. The information in this report has been obtained or derived from sources believed by Wells Fargo Securities, LLC, to be reliable, but Wells Fargo Securities, LLC does not represent that this information is accurate or complete. Any opinions or estimates contained in this report represent the judgment of Wells Fargo Securities, LLC, at this time, and are subject to change without notice. Performance analysis is based on certain assumptions with respect to significant factors that may prove not to be as assumed. You should understand the assumptions and evaluate whether they are appropriate for your purposes. Performance results are often based on mathematical models that use inputs to calculate results. As with all models, results may vary significantly depending upon the value of the inputs given. Models used in any analysis may be proprietary making the results difficult for any third party to reproduce. The securities referenced herein are more fully described in offering documents prepared by the issuers, which you are strongly urged to request and review. Wells Fargo Securities, LLC, and its affiliates may from time to time provide advice with respect to, acquire, hold, or sell a position in, the securities or instruments named or described in this report. If you are subject to ERISA, this report is being furnished on the condition that it will not form a primary basis for any investment decision. For the purposes of the U.K. Financial Services Authority’s rules, this report constitutes impartial investment research. Each of Wells Fargo Securities, LLC, and Wells Fargo Securities International Limited is a separate legal entity and distinct from affiliated banks. Copyright © 2010 Wells Fargo Securities, LLC.
SECURITIES: NOT FDIC-INSURED * NOT BANK-GUARANTEED * MAY LOSE VALUE
Current State of CRE Lending for REITs
Thierry PerreinSenior AnalystREIT Fixed Income [email protected](704) 715-8455
May 13, 2010
Please see the disclosure appendix of this publication for certification and disclosure information
19
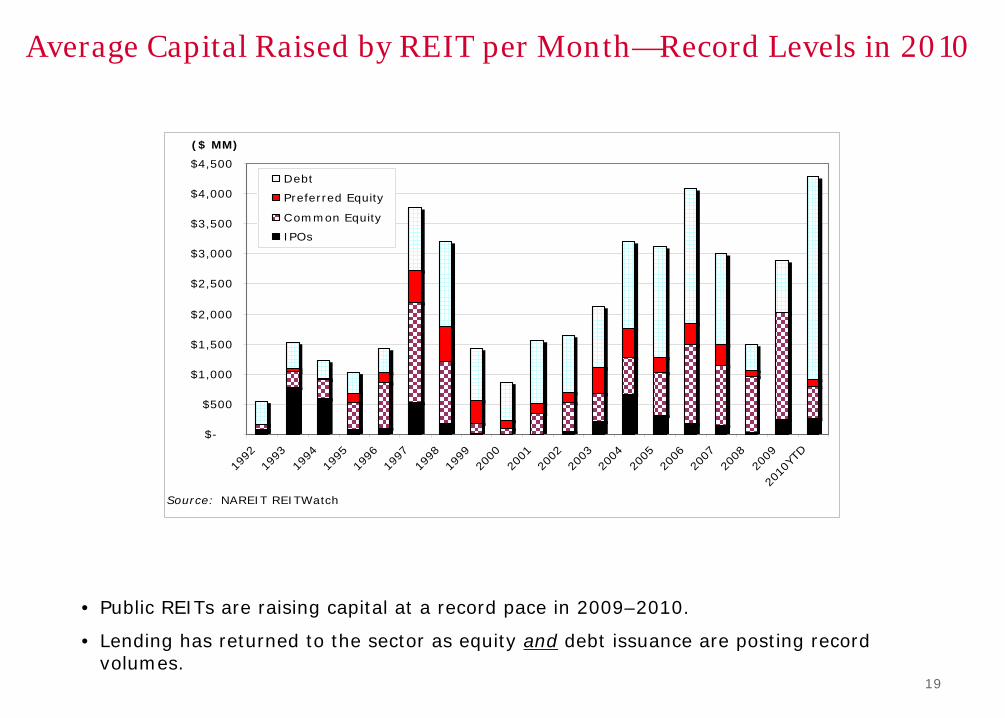
Average Capital Raised by REIT per Month—Record Levels in 2010
$-
$500
$1,000
$1,500
$2,000
$2,500
$3,000
$3,500
$4,000
$4,500
1992
1993
1994
1995
1996
1997
1998
1999
2000
2001
2002
2003
2004
2005
2006
2007
2008
2009
2010
YTD
Source: NAREIT REITWatch
($ MM)
Debt
Preferred Equity
Common Equity
IPOs
• Public REITs are raising capital at a record pace in 2009–2010.
• Lending has returned to the sector as equity and debt issuance are posting record volumes.
20
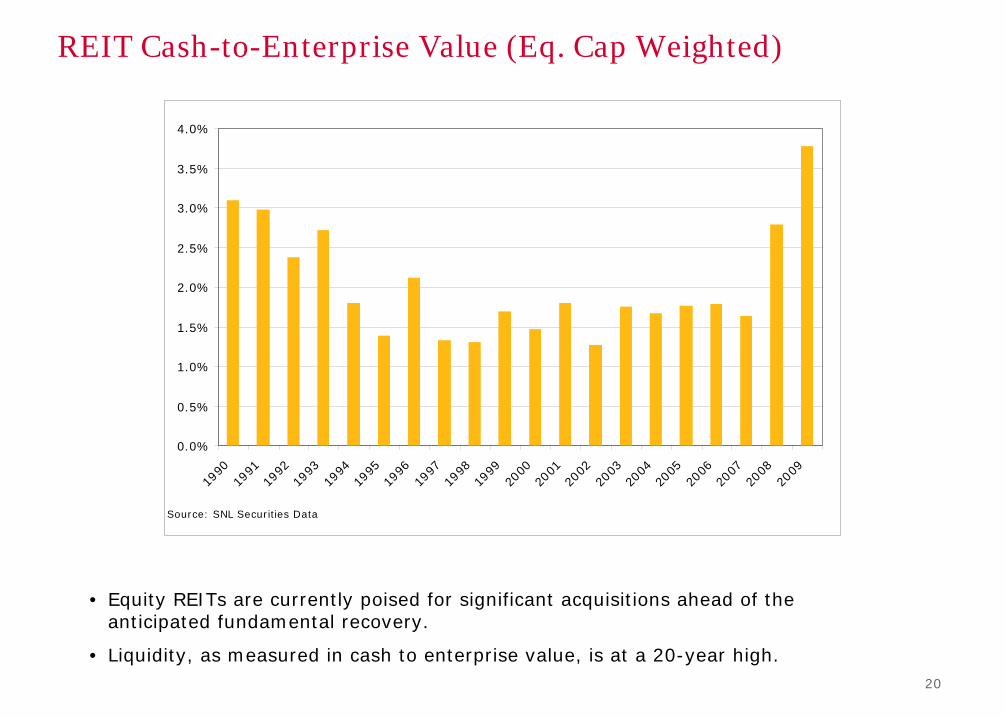
REIT Cash-to-Enterprise Value (Eq. Cap Weighted)
• Equity REITs are currently poised for significant acquisitions ahead of the anticipated fundamental recovery.
• Liquidity, as measured in cash to enterprise value, is at a 20-year high.
0.0%
0.5%
1.0%
1.5%
2.0%
2.5%
3.0%
3.5%
4.0%
1990
1991
1992
1993
1994
1995
1996
1997
1998
1999
2000
2001
2002
2003
2004
2005
2006
2007
2008
2009
Source: SNL Securities Data

21
Liquidity Positions ImprovedREIT Liquidity Summary 2010-2013; $000's sorted alphabetically(3 months ended 12/3109)
Company Name Ticker Total SourcesTotal Debt Maturing
2010-2013 Total Uses Surplus/(Shortfall)
Surplus/(Shortfall) Adjusted for Refinancing
Operating FFO Adjusted
Surplus/(Shortfall)
AMB Property Corp. AMB 1,309,539 2,402,254 3,544,024 (2,234,485) (1,219,361) (179,533)AvalonBay Communities, Inc AVB 1,105,691 1,259,953 2,710,718 (1,605,027) (1,153,730) (26,062)Boston Properties, Inc. BXP 2,448,637 3,297,902 5,176,342 (2,727,705) (1,656,424) 864,836Brandywine Realty Trust BDN 444,654 1,084,254 1,760,679 (1,316,025) (794,252) (12,289)BRE Properties BRE 467,656 897,075 1,334,031 (866,375) (734,218) (299,378)Camden Property Trust CPT 664,156 1,283,901 1,911,147 (1,246,991) (1,124,852) (411,653)Colonial Properties Trust CLP 404,044 590,997 877,592 (473,548) (473,548) (222,340)Developers Diversified Realty Corp. DDR 1,097,067 3,728,132 4,201,151 (3,104,084) (2,009,445) (783,872)Duke Realty Corp. DRE 997,322 1,442,130 2,904,450 (1,907,128) (1,881,855) (790,631)Equity One, Inc. EQY 434,690 283,272 636,392 (201,702) (34,527) 480,212Equity Residential EQR 1,563,288 3,241,514 5,123,027 (3,559,739) (2,269,857) (1,914)Federal Realty Investment Trust FRT 435,389 640,079 1,362,293 (926,904) (825,978) (7,460)First Industrial Realty Trust FR 67,699 848,072 1,411,857 (1,344,158) (1,281,840) (874,932)HCP Inc. HCP 1,612,259 2,487,511 5,001,141 (3,388,882) (2,400,057) (548,084)Healthcare Realty Trust HR 505,851 341,550 732,944 (227,093) (227,093) 125,283Healthcare REIT HCN 1,387,476 1,363,748 3,046,837 (1,659,361) (1,547,466) (255,203)Highwoods Properties, Inc. HIW 423,699 672,679 1,337,250 (913,551) (398,372) 277,906Hospitality Properties Trust HPT 880,399 706,053 1,831,211 (950,812) (950,812) 338,823HRPT Properties Trust HRP 876,204 979,810 2,067,233 (1,191,029) (881,098) 201,764Kimco Realty Corp. KIM 1,929,514 2,036,250 3,564,565 (1,635,051) (1,062,857) 615,927Liberty Property Trust LRY 697,446 1,018,346 2,169,964 (1,472,518) (1,262,181) (122,400)Mack-Cali Realty Corp. CLI 1,066,059 989,871 1,863,118 (797,059) (593,207) 396,195National Retail Properties, Inc. NNN 415,225 454,008 978,099 (562,874) (562,874) (98,428)Nationwide Health Properties NHP 1,082,278 989,126 2,191,542 (1,109,264) (877,351) 20,096Post Properties, Inc. PPS 643,347 409,344 644,439 (1,092) 65,360 261,265Prologis PLD 2,152,513 4,225,000 6,284,359 (4,131,846) (3,978,028) (2,293,991)PS Business Parks, Inc. PSB 308,229 38,107 474,715 (166,486) (166,486) 420,580Public Storage, Inc. PSA 1,063,789 451,058 3,214,371 (2,150,582) (1,991,190) 1,410,098Realty Income Corp. O 360,426 100,000 912,832 (552,406) (552,406) 133,192Regency Centers Corp. REG 695,877 660,994 1,500,817 (804,940) (747,800) 892Senior Housing Properties Trust SNH 500,494 380,453 1,354,148 (853,654) (795,826) (51,498)Simon Property Group, Inc. SPG 7,041,804 7,335,234 11,196,469 (4,154,665) (105,641) 6,188,167SL Green Realty Corp. SLG 901,024 2,587,475 2,956,388 (2,055,364) (1,240,298) (92,557)Tanger Factory Outlet Centers SKT 270,567 335,710 701,566 (430,999) (395,199) 39,915UDR, Inc. UDR 849,100 1,798,147 2,431,733 (1,582,633) (635,105) 47,614Ventas, Inc. VTR 965,931 1,118,970 2,579,569 (1,613,638) (816,942) 655,620Vornado Realty Trust VNO 2,663,913 6,561,749 9,201,474 (6,537,561) (2,023,527) 1,101,759Washington REIT WRE 220,203 669,572 1,143,020 (922,817) (780,083) (341,708)Weingarten Realty Investors WRI 728,584 1,248,196 2,055,105 (1,326,521) (749,585) 32,551
Source: Bloomberg L.P., SNL DataSource, Company Reports, and Wells Fargo Securities, LLC's Estimates.

22
Historical REIT Unsecured Debt Issuance
• REIT unsecured debt issuance peaked at $25.3 billion in 2006, bottomed at $4.4 billion in 2008 and has rebounded with 2010 year-to-date issuance of $7.1 billion.
Historical REIT Unsecured Debt Issuance
$709$1,680 $2,140
$3,459$4,426
$9,240
$13,786
$7,951$7,013
$9,895$10,638 $10,894
$17,306$16,330
$25,261
$18,155
$4,425
$11,535
$7,100
-
5,000
10,000
15,000
20,000
25,000
30,000
1992 1993 1994 1995 1996 1997 1998 1999 2000 2001 2002 2003 2004 2005 2006 2007 2008 2009 2010YTD
Year
($00
0)
Source: NAREIT
23
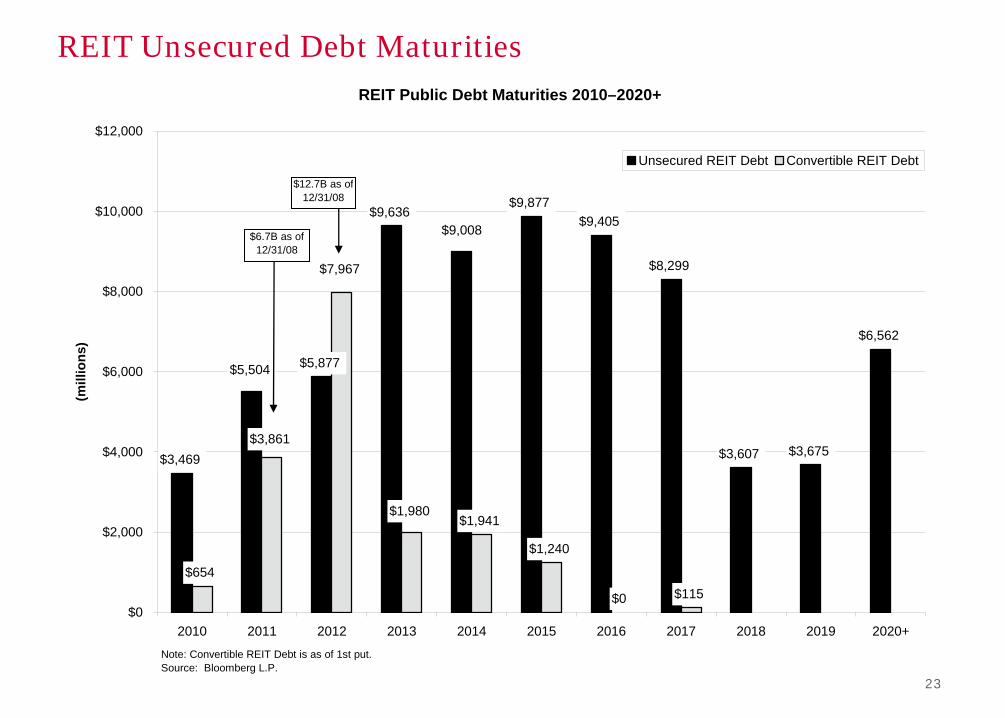
REIT Unsecured Debt MaturitiesREIT Public Debt Maturities 2010–2020+
$3,469
$9,877$9,405
$8,299
$3,607 $3,675
$6,562
$0 $115
$5,504
$9,636
$5,877
$9,008
$7,967
$1,980
$654
$1,240
$1,941
$3,861
$0
$2,000
$4,000
$6,000
$8,000
$10,000
$12,000
2010 2011 2012 2013 2014 2015 2016 2017 2018 2019 2020+
(mill
ions
)
Unsecured REIT Debt Convertible REIT Debt
Note: Convertible REIT Debt is as of 1st put. Source: Bloomberg L.P.
$6.7B as of 12/31/08
$12.7B as of 12/31/08

24
REIT Unsecured Debt Maturities
Public Debt Maturities 2010–2014 (Ranked Most to Least Debt due in 2010, $000's) FIXED INCOME RESEARCH
Company 2010 2011 2012 2013 2014
1 Simon Property Group, Inc. 800,000 382,660 390,880 966,620 1,800,000 2 iStar Financial Inc. 394,600 810,100 553,470 1,043,790 686,150 3 Developers Diversified Realty Corp. 298,950 124,750 223,470 - - 4 Kimco Realty Corp. 221,500 338,000 215,880 475,000 294,570 5 HCP Inc. 206,420 292,260 250,000 550,000 87,000 6 Brandywine Realty Trust 198,540 - 187,820 - 242,680 7 ProLogis Trust 190,280 101,300 59,190 61,470 350,000 8 Liberty Property Trust 169,740 246,500 230,100 - 200,000 9 Mack-Cali Realty Corp. 165,000 300,000 194,910 126,110 200,000 10 Vornado Realty Trust 148,340 117,390 - - - 11 Regency Centers Corp. 140,460 193,490 250,000 - 150,000 12 Post Properties 100,500 9,640 95,680 13,090 - 13 AvalonBay Communities, Inc. 89,580 189,900 381,000 100,000 150,000 14 Camden Property Trust 82,300 122,900 189,670 200,000 - 15 AMB Property Corp. 65,000 69,000 - 294,920 - 16 HRPT Properties Trust 50,000 168,220 150,680 190,980 244,660 17 Hospitality Properties Trust 50,000 - 100,800 287,000 300,000 18 BRE Properties, Inc. 30,580 48,550 - 40,020 50,000 19 Weingarten Realty Investors 25,930 127,630 195,600 175,000 315,000 20 Colonial Properties Trust 20,000 57,070 80,000 113,000 200,810 21 National Retail Properties Inc. 20,000 - 50,000 - 150,000 22 Ventas Inc. 1,380 - 82,430 - 71,650 23 Equity Residential - 93,100 475,990 400,000 500,000 24 General Growth Properties Inc. - - 400,000 1,250,000 - 25 Senior Housing Properties Trust - - 225,000 - - 26 Duke Realty Corp. - 327,220 200,000 475,000 250,000 27 Federal Realty Investment Trust - 75,000 175,000 135,000 150,000 28 New Plan Excel Realty Trust, Inc. [Centro Properties Group (AU)] - 150,000 125,000 50,000 - 29 UDR Inc. - - 100,000 122,500 312,500 30 First Industrial Realty Trust, Inc. - 70,800 77,830 - 91,940 31 Health Care REIT, Inc. - - 76,850 300,000 - 32 Nationwide Health Properties, Inc. - 339,000 72,950 269,850 - 33 Washington REIT - 150,000 50,000 60,000 100,000 34 Equity One, Inc. - - 10,000 - 250,000 35 Host Hotels & Resorts Inc. - - 6,630 725,000 500,000 36 Boston Properties, Inc. - - - 925,000 - 37 FelCor Lodging Trust Inc. - 86,600 - - 636,000 38 Healthcare Realty Trust Inc. - 286,300 - - 264,740 39 Highwoods Properties Inc. - - - - - 40 Omega Healthcare Investors, Inc. - - - - 310,000 41 Public Storage Inc./Shurgard Storage Centers Inc. - 103,320 - 186,460 - 42 Realty Income Corp. - - - 100,000 - 43 Reckson Associates Realty Corp. [SL Green Realty Corp.] - 123,610 - - 150,000 44 Tanger Factory Outlet Centers, Inc. - - - - -
Total: 3,469,100 5,504,310 5,876,830 9,635,810 9,007,700
Note: Does not include convertible debt maturities with put options.Source: Bloomberg L.P and Wells Fargo Securities, LLC.

25
REIT Bond Issuance
• Year-to-date 2010, $7.1 billion in 17 transactions have priced, compared to $1.2 billion in three transactions for the same period in 2009 (full-year 2009, $11.5 billion priced in 29 transactions).
REIT High-Grade Bond Issuance FIXED INCOME RESEARCH
Amount Treasury Estimated Ratings at Issue Date
Date Issuer ($million) Term Spread Z-Spread Coupon Moody’s S&P Fitch
Total/Weighted Average 2009: 11,535 8.6 444 395 7.27%
1/19/2010 Simon Property Group, Inc. 400 5.0 180 153 4.20% A3 A- A-
1/19/2010 Simon Property Group, Inc. 1,250 10.0 200 196 5.65% A3 A- A-
1/19/2010 Simon Property Group, Inc. 600 30.0 220 246 6.75% A3 A- A-
1/21/2010 Digital Realty Trust, Inc. 500 10.0 250 247 5.88% Baa2 BBB BBB
2/2/2010 UDR, Inc. (Reopen) 150 5.0 300 275 5.38% Baa2 BBB(N) NA
2/4/2010 Omega Healthcare Investors 200 10.0 414 413 7.50% Ba3(P) BB+(P) NR
2/24/2010 Federal Realty Investment Trust 150 10.0 225 224 5.90% Baa1 BBB+ BBB+
3/9/2010 ProLogis 800 10.0 320 330 6.88% Baa2(N) BBB-(N) BBB(N)
3/9/2010 ProLogis 300 7.0 320 318 6.25% Baa2(N) BBB-(N) BBB(N)
3/12/2010 SL Green Realty Corp. (Reckson Operating Partnership) 250 10.0 402 414 7.75% Ba2 BB+ BB+
3/16/2010 Developers Diversified Realty Corporation 300 7.0 437 438 7.50% Baa3(N) BB(N) BB(N)
3/23/2010 Vornado Realty Trust 500 5.0 188 179 4.25% Baa2 BBB BBB
3/25/2010 Duke Realty Corp. 250 10.0 288 306 6.75% Baa2(N) BBB- BBB(N)
3/30/2010 Healthcare REIT, Inc. 300 10.0 235 248 6.13% Baa2 BBB-(P) BBB
4/6/2010 Senior Housing Properties Turst 200 10.0 294 308 6.75% Ba1(P) BBB- NR
4/8/2010 Boston Properties, Inc. 700 10.5 175 176 5.63% Baa2 A- (N) BBB
4/22/2010 BioMed Realty Trust, Inc. 250 10.0 250 260 6.13% Baa3 BBB- NR
Total/Weighted Average 2010: 7,100 10.7 254 256 6.05%Source: Bloomberg L.P., company reports and Wells Fargo Securities, LLC's estimates.
26
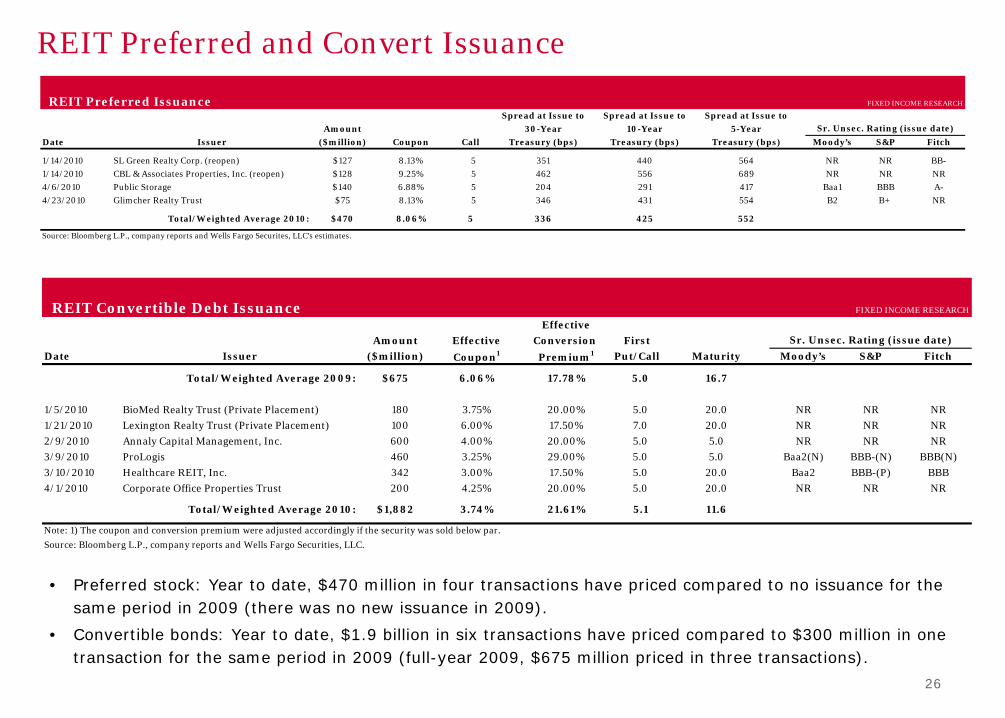
REIT Preferred and Convert Issuance
REIT Convertible Debt Issuance FIXED INCOME RESEARCH
Effective
Amount Effective Conversion First
Date Issuer ($million) Coupon1 Premium1 Put/Call Maturity Moody’s S&P Fitch
Total/Weighted Average 2009: $675 6.06% 17.78% 5.0 16.7
1/5/2010 BioMed Realty Trust (Private Placement) 180 3.75% 20.00% 5.0 20.0 NR NR NR
1/21/2010 Lexington Realty Trust (Private Placement) 100 6.00% 17.50% 7.0 20.0 NR NR NR
2/9/2010 Annaly Capital Management, Inc. 600 4.00% 20.00% 5.0 5.0 NR NR NR
3/9/2010 ProLogis 460 3.25% 29.00% 5.0 5.0 Baa2(N) BBB-(N) BBB(N)
3/10/2010 Healthcare REIT, Inc. 342 3.00% 17.50% 5.0 20.0 Baa2 BBB-(P) BBB
4/1/2010 Corporate Office Properties Trust 200 4.25% 20.00% 5.0 20.0 NR NR NR
Total/Weighted Average 2010: $1,882 3.74% 21.61% 5.1 11.6
Note: 1) The coupon and conversion premium were adjusted accordingly if the security was sold below par.
Source: Bloomberg L.P., company reports and Wells Fargo Securities, LLC.
Sr. Unsec. Rating (issue date)
• Preferred stock: Year to date, $470 million in four transactions have priced compared to no issuance for the same period in 2009 (there was no new issuance in 2009).
• Convertible bonds: Year to date, $1.9 billion in six transactions have priced compared to $300 million in one transaction for the same period in 2009 (full-year 2009, $675 million priced in three transactions).
REIT Preferred Issuance FIXED INCOME RESEARCH
Spread at Issue to Spread at Issue to Spread at Issue to
Amount 30-Year 10-Year 5-Year
Date Issuer ($million) Coupon Call Treasury (bps) Treasury (bps) Treasury (bps) Moody’s S&P Fitch
1/14/2010 SL Green Realty Corp. (reopen) $127 8.13% 5 351 440 564 NR NR BB-
1/14/2010 CBL & Associates Properties, Inc. (reopen) $128 9.25% 5 462 556 689 NR NR NR
4/6/2010 Public Storage $140 6.88% 5 204 291 417 Baa1 BBB A-
4/23/2010 Glimcher Realty Trust $75 8.13% 5 346 431 554 B2 B+ NR
Total/Weighted Average 2010: $470 8.06% 5 336 425 552
Source: Bloomberg L.P., company reports and Wells Fargo Securites, LLC's estimates.
Sr. Unsec. Rating (issue date)

27
REIT Equity Issuance
• Equity: Year to date, $4.5 billion in 21 transactions have priced, compared to $9.2 billion in 21 transactions for the same period in 2009 (full-year 2009, $16.8 billion priced in 65 transactions).
REIT Equity Issuance FIXED INCOME RESEARCH
Shares Overallotment Amount
Date Issuer Price (million) (million) ($million)
Total 2009: 1,211 102 $16,791
1/12/2010 Associated Estates Realty Corp. $11.10 4.50 $50
1/14/2010 Government Properties Income Trust $21.50 8.50 $183
1/15/2010 Hersha Hospitality Trust $3.00 45.00 6.75 $155
2/2/2010 Cedar Shopping Centers, Inc. $6.60 7.50 $50
2/2/2010 Developers Diversified Realty Corp. $8.16 37.30 $304
3/2/2010 LaSalle Hotel Properties $18.50 5.35 0.80 $114
3/10/2010 Equity One, Inc. $18.19 4.20 0.63 $88
3/16/2010 First Potomac Realty Trust $14.50 5.50 $80
3/17/2010 HRPT Properties Trust $7.25 30.00 $218
3/19/2010 Hersha Hospitality Trust $4.25 24.00 3.60 $117
3/25/2010 CapLease, Inc. $4.77 3.14 $15
3/26/2010 Lexington Realty Trust $6.60 9.50 1.43 $72
4/1/2010 BRE Properties $34.25 7.00 $240
4/7/2010 AMB Property Corp. $27.50 15.80 $435
4/13/2010 Agree Realty Corp. $22.00 1.30 $29
4/14/2010 BioMed Realty Trust, Inc. $17.25 11.50 1.75 $229
4/15/2010 Medical Properties Turst, Inc. $9.75 26.00 3.90 $292
4/15/2010 The Macerich Company $41.00 30.00 $1,230
4/15/2010 Kilroy Realty Corp. $34.00 8.00 $272
5/4/2010 Pennsylvania Real Estate Investment Trust $16.25 9.00 $146
5/6/2010 Entertainment Properties Trust $41.00 3.60 $148
Total 2010: 297 $4,464Source: Wells Fargo Securities, LLC.
28
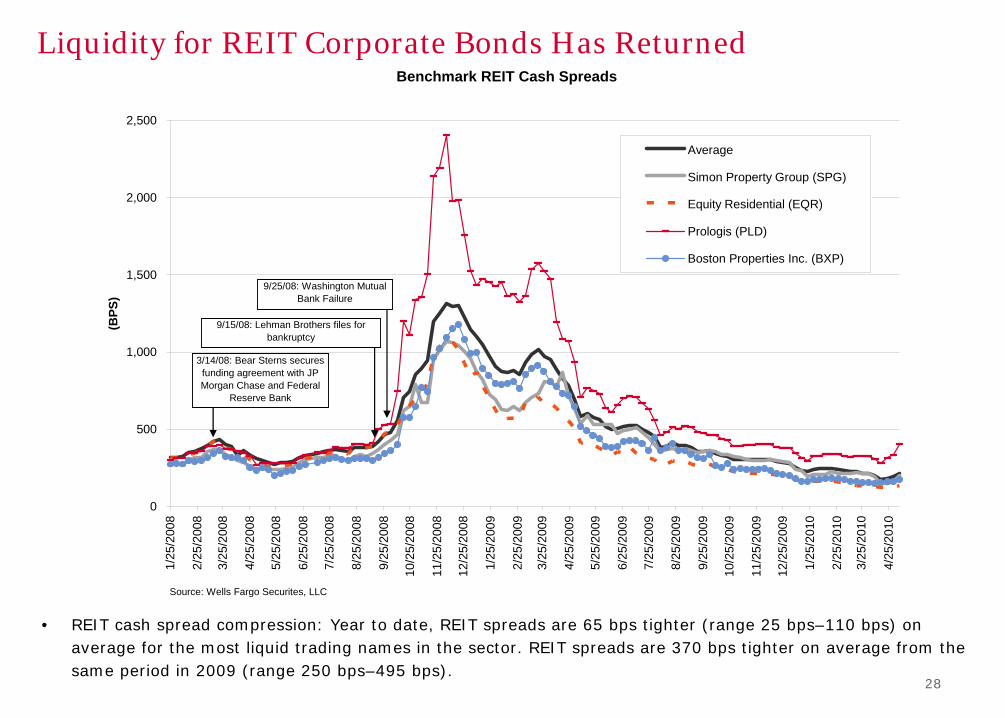
Liquidity for REIT Corporate Bonds Has Returned
• REIT cash spread compression: Year to date, REIT spreads are 65 bps tighter (range 25 bps–110 bps) on average for the most liquid trading names in the sector. REIT spreads are 370 bps tighter on average from the same period in 2009 (range 250 bps–495 bps).
Benchmark REIT Cash Spreads
0
500
1,000
1,500
2,000
2,500
1/25
/200
8
2/25
/200
8
3/25
/200
8
4/25
/200
8
5/25
/200
8
6/25
/200
8
7/25
/200
8
8/25
/200
8
9/25
/200
8
10/2
5/20
08
11/2
5/20
08
12/2
5/20
08
1/25
/200
9
2/25
/200
9
3/25
/200
9
4/25
/200
9
5/25
/200
9
6/25
/200
9
7/25
/200
9
8/25
/200
9
9/25
/200
9
10/2
5/20
09
11/2
5/20
09
12/2
5/20
09
1/25
/201
0
2/25
/201
0
3/25
/201
0
4/25
/201
0
(BPS
)
Average
Simon Property Group (SPG)
Equity Residential (EQR)
Prologis (PLD)
Boston Properties Inc. (BXP)
Source: Wells Fargo Securites, LLC
3/14/08: Bear Sterns secures funding agreement with JP Morgan Chase and Federal
Reserve Bank
9/15/08: Lehman Brothers files for bankruptcy
9/25/08: Washington Mutual Bank Failure

29
REIT Corporate Bond CDS Liquidity has Returned
• REIT credit default spreads (CDS) compression: For the basket of REITs that we track, year-to-date spreads are 20 bps wider on average (range 0 bps– 65 bps) for CDS. The same REIT CDS index is 215 bps tighter on average from the same period in 2009 (range 85 bps–490 bps).
Benchmark REIT CDS Spreads
0
500
1,000
1,500
2,000
2,500
3,000
3,500
4,0001/
25/2
008
2/25
/200
8
3/25
/200
8
4/25
/200
8
5/25
/200
8
6/25
/200
8
7/25
/200
8
8/25
/200
8
9/25
/200
8
10/2
5/20
08
11/2
5/20
08
12/2
5/20
08
1/25
/200
9
2/25
/200
9
3/25
/200
9
4/25
/200
9
5/25
/200
9
6/25
/200
9
7/25
/200
9
8/25
/200
9
9/25
/200
9
10/2
5/20
09
11/2
5/20
09
12/2
5/20
09
1/25
/201
0
2/25
/201
0
3/25
/201
0
4/25
/201
0
(BPS
)
Average
Simon Property Group (SPG)
Equity Residential (EQR)
Prologis (PLD)
Boston Properties Inc. (BXP)
Source: Wells Fargo Securites, LLC
3/14/08: Bear Sterns secures funding agreement with JP Morgan Chase and Federal
Reserve Bank
9/15/08: Lehman Brothers files for bankruptcy
9/25/08: Washington Mutual Bank Failure

30
REITs Trade Cheap to BBB Corporates
Source: Wells Fargo Securities, LLC
Wells Fargo Securities, LLC High Grade Cross Industy Relative Value Analysis as of 5/1/09
Ind. Brokers
IG FinCos
Regional Banks
Large BanksHealth Ins.
Railroads
Packaging
Diversified Manufacturing
Building Materials
Aerospace/Defense
Capital Goods
Paper
Metals & Mining
ChemicalsRefining/Services
E&P
Pipelines
Food & Beverage Grocery
RestaurantsRetail
Consumer Prod.
REITS
P&C Ins.
Life Ins.
Media
Telecom
Technology
Non-Reg. Utilities
Reg. Utilities
200
300
400
500
600
700
800
900
1,000
1,100
Composite Rating
Inte
rpol
ated
Sp
read
(b
ps)
A+ A A-
BBB+ BBB
BBB-

31
REITs Trade Cheap to BBB Corporates
Source: Wells Fargo Securities, LLC
Wells Fargo Securities, LLC High Grade Cross Industy Relative Value Analysis as of 04/30/10
Ind. Brokers
IG FinCos
Regional Banks
Large Banks
Health Ins.
Railroads
Packaging
Diversified Manufacturing
Building Materials
Aerospace/DefenseCapital Goods
Paper
Metals & Mining
Chemicals
Refining/Services
E&P
Pipelines
Food & Beverage
Grocery RestaurantsRetail
Consumer Prod.
REITS
P&C Ins.
Life Ins.
Media
Telecom
Technology
Non-Reg. Utilities
Reg. Utilities
50
75
100
125
150
175
200
225
250
275
300
Composite Rating
Inte
rpol
ated
Spr
ead
(b
ps)
A+ A A-
BBB+ BBB
BBB-
32
DISCLOSURE APPENDIX
Additional information is available on request.
Company Recommendation Definitions Buy: The security is trading cheap to its peer group and/or the market and has significant total return potential. Outperform: On a relative basis, the security is expected to outperform its peer group and/or the market. Market Perform: The security is expected to perform in line with its peer group and/or the market. Underperform: On a relative basis, the security is expected to underperform its peer group and/or the market. Sell: The security is trading rich to its peer group and/or the market and has the potential to significantly underperform based on fundamental reasons. Sector Recommendation Definitions Overweight We expect the sector to outperform the relevant broader market benchmark. Market Weight We expect the sector to perform in line with the relevant broader market benchmark. Underweight We expect the sector to underperform the relevant broader market benchmark. This report was prepared by Wells Fargo Securities, LLC. About Wells Fargo Securities, LLC Wells Fargo Securities, LLC is a U.S. broker-dealer registered with the U.S. Securities and Exchange Commission and a member of the New York Stock Exchange, theFinancial Industry Regulatory Authority and the Securities Investor Protection Corp. Important Information for Non-U.S. Recipients EEA The securities and related financial instruments described herein may not be eligible for sale in all jurisdictions or to certain categories of investors. For recipients in theEEA, this report is distributed by Wells Fargo Securities International Limited (“WFSIL”). WFSIL is a U.K. incorporated investment firm authorized and regulated by theFinancial Services Authority. For the purposes of Section 21 of the UK Financial Services and Markets Act 2000 (“the Act”), the content of this report has been approvedby WFSIL a regulated person under the Act. WFSIL does not deal with retail clients as defined in the Markets in Financial Instruments Directive 2007. This report is notintended for, and should not be relied upon by, retail clients. Australia Wells Fargo Securities, LLC is exempt from the requirements to hold an Australian financial services license in respect of the financial services it provides to wholesaleclients in Australia. Wells Fargo Securities, LLC is regulated under U.S. laws which differ from Australian laws. Any offer or documentation provided to Australianrecipients by Wells Fargo Securities, LLC in the course of providing the financial services will be prepared in accordance with the laws of the United States and notAustralian laws. Hong Kong This report is issued and distributed in Hong Kong by Wells Fargo Securities Asia Limited (“WFSAL”), a Hong Kong incorporated investment firm licensed and regulatedby the Securities and Futures Commission to carry on types 1, 4, 6 and 9 regulated activities (as defined in the Securities and Futures Ordinance, “the SFO”). This reportis not intended for, and should not be relied on by, any person other than professional investors (as defined in the SFO). Any securities and related financial instrumentsdescribed herein are not intended for sale, nor will be sold, to any person other than professional investors (as defined in the SFO). Japan This report is distributed in Japan by Wells Fargo Securities (Japan) Co., Ltd, a Japanese financial instruments firm registered with the Kanto Local Finance Bureau, asubordinate regulatory body of the Ministry of Finance in Japan, to conduct broking and dealing of type 1 and type 2 financial instruments and agency or intermediaryservice for entry into investment advisory or discretionary investment contracts. This report is intended for distribution only to professional customers (TokuteiToushika) and is not intended for, and should not be relied upon by, ordinary customers (Ippan Toushika).
33
Important Disclosures Relating to Conflicts of Interest and Potential Conflicts of Interest Wells Fargo Securities, LLC may sell or buy the subject securities to/from customers on a principal basis or act as a liquidity provider in such securities. Wells Fargo Securities, LLC does not compensate its research analysts based on specific investment banking transactions. Wells Fargo Securities, LLC research analysts receive compensation that is based on and affected by the overall profitability of their respective department and the firm, which includes, but is not limited to, investment banking revenue. Wells Fargo Securities, LLC Fixed Income Research analysts interact with the firm’s trading and sales personnel in the ordinary course of business. The firm trades or may trade as a principal in the securities or related derivatives mentioned herein. The firm’s interests may conflict with the interests of investors in those instruments. For additional disclosure information please go to: www.wellsfargo.com/research. Analyst’s Certification The research analyst(s) principally responsible for the report certifies to the following: all views expressed in this research report accurately reflect the analysts’ personal views about any and all of the subject securities or issuers discussed; and no part of the research analysts’ compensation was, is, or will be, directly or indirectly, related to the specific recommendations or views expressed by the research analyst(s) in this research report. Ratings History Chart
No rating information available. Distribution of Ratings
As of 5/14/10
1.2% of issuers and securities covered by Wells Fargo Securities, LLC Fixed Income Research are rated Buy.
Wells Fargo Securities, LLC has provided investment banking services for 57.1% of its Fixed Income Buy-rated issuers.
29% of issuers and securities covered by Wells Fargo Securities, LLC Fixed Income Research are rated Outperform.
Wells Fargo Securities, LLC has provided investment banking services for 40.6% of its Fixed Income Outperform-rated issuers.
52% of issuers and securities covered by Wells Fargo Securities, LLC Fixed Income Research are rated Market Perform.
Wells Fargo Securities, LLC has provided investment banking services for 38.2% of its Fixed Income Market Perform-rated issuers.
17.4% of issuers and securities covered by Wells Fargo Securities, LLC Fixed Income Research are rated Underperform.
Wells Fargo Securities, LLC has provided investment banking services for 19.2% of its Fixed Income Underperform-rated issuers.
0.4% of issuers and securities covered by Wells Fargo Securities, LLC Fixed Income Research are rated Sell.
Wells Fargo Securities, LLC has provided investment banking services for 50% of its Fixed Income Sell-rated issuers.

34
This report, IDs, and passwords are available at www.wellsfargo.com/research
This report is for your information only and is not an offer to sell, or a solicitation of an offer to buy, the securities or instruments named or described in this report. Interested parties are advised to contact the entity with which they deal, or the entity that provided this report to them, if they desire further information. The information in this report has been obtained or derived from sources believed by Wells Fargo Securities, LLC, to be reliable, but Wells Fargo Securities, LLC does not represent that this information is accurate or complete. Any opinions or estimates contained in this report represent the judgment of Wells Fargo Securities, LLC, at this time, and are subject to change without notice. For the purposes of the U.K. Financial Services Authority's rules, this report constitutes impartial investment research. Each of Wells Fargo Securities, LLC, and Wells Fargo Securities International Limited is a separate legal entity and distinct from affiliated banks. Copyright © 2010 Wells Fargo Securities, LLC.
SECURITIES: NOT FDIC-INSURED * NOT BANK-GUARANTEED * MAY LOSE VALUE