current wastewater technologies
TRANSCRIPT
Appendix A – Wastewater Technologies Report
Current Wastewater Technologies
An Overview for Homeowners
Prepared for the City of St. Augustine and the Florida Department of Environmental Protection, Office of Resilience and Coastal Protection, Florida Resilient Coastlines Program
As part of Grant Agreement Number R2130, Assess Vulnerability of OSTDS to SLR and Storm Surge to Develop Adaptation Plans, Ph I, Task 5 – Report of Wastewater Technologies
May 31, 2021 (Revised June 8, 2021)
Tricia Kyzar
Eban Z. Bean, PhD, PE, Principal Investigator

Appendix A – Wastewater Technologies Report
2 | Page
Table of Contents 1. Introduction ................................................................................................................... 7
1.1. The Basics of Domestic Wastewater Treatment .................................................................................. 7
2. Treatment Requirements ............................................................................................. 10
3. Decentralized Wastewater Technologies .................................................................... 17
3.1. Tank technologies .............................................................................................................................. 18
3.1.1. Anaerobic Systems (traditional/conventional) ................................................................... 19
3.1.2. Aerobic Treatment Units (ATUs) ...................................................................................... 20
3.2. Drainfield Technologies .................................................................................................................... 24
3.2.1. Traditional rock/gravel aggregate ...................................................................................... 24
3.2.2. Engineered Aggregate........................................................................................................ 25
3.2.3. Plastic Chambers ............................................................................................................... 26
3.2.4. bric Wrapped and Bundled Pipe ........................................................................................ 27
3.2.5. In-Ground Nitrogen Reducing Biofilter ............................................................................. 28
3.2.6. Drip Distribution ................................................................................................................ 28
3.2.7. Mound System ................................................................................................................... 29
4. Centralized Wastewater Technologies ........................................................................ 30
4.1. Suspended Growth Processes ............................................................................................................ 33
4.1.1. Complete Mixing ............................................................................................................... 33
4.2. Attached Growth Processes ............................................................................................................... 34
4.2.1. Trickling Filter ................................................................................................................... 34
4.2.2. Rotating Biological Contactor ........................................................................................... 35
4.3. Further/Additional Processing ........................................................................................................... 35
4.3.1. UV Disinfection ................................................................................................................. 35
4.3.2. Chemical Treatments ......................................................................................................... 36
5. Between Centralized and Decentralized ..................................................................... 36

Appendix A – Wastewater Technologies Report
3 | Page
5.1. STEP Systems ................................................................................................................................... 36
5.2. Cluster Systems ................................................................................................................................. 37
5.3. Package Plants ................................................................................................................................... 39
6. Costs ............................................................................................................................ 39
7. Funding Opportunities ................................................................................................ 44
7.1. Water Quality Grants ......................................................................................................................... 44
7.2. FDEP/Division of Water Restoration Assistance .............................................................................. 44
7.2.1. Federal 319 grant (EPA originated) Nonpoint Source Funds ............................................ 44
7.2.2. Clean Water State Revolving Funds Loan program (EPA originated) .............................. 45
7.2.3. Septic Upgrade Incentive Program .................................................................................... 46
7.3. Florida Resilient Coastlines Program ................................................................................................ 46
7.3.1. Resilience Planning Grant (RPG) ...................................................................................... 46
7.3.2. Resilience Implementation Grant (RIG) ............................................................................ 46
7.4. St. Johns River Water Management District ..................................................................................... 47
7.4.1. District Cost-Share Funding .............................................................................................. 47
7.4.2. Indian River Lagoon Water Quality Improvement Projects .............................................. 47
7.5. Florida Department of Economic Opportunity .................................................................................. 47
7.5.1. Florida Small Cities Community Dev elopement Block Grant .......................................... 47
7.5.2. Regional Rural Development Grant................................................................................... 48
7.5.3. Rural Infrastructure Fund................................................................................................... 48
7.5.4. Special District Accountability Program ........................................................................... 48
8. Conclusions ................................................................................................................. 49
9. References ................................................................................................................... 51
10. Terms .......................................................................................................................... 58
11. Abbreviations .............................................................................................................. 58

Appendix A – Wastewater Technologies Report
4 | Page
List of Figures Figure 1-1 The range of wastewater treatment facilities from single, onsite septic systems to large, municipal
sewer plants. ............................................................................................................................................. 7
Figure 2-1 Process flow of a typical domestic wastewater treatment process. ........................................................ 32
Figure 3-1 Example of a conventional septic tank. .................................................................................................. 19
Figure 3-2 Example of a suspended treatment tank. ................................................................................................ 21
Figure 3-3 Example of a fixed film or attached growth tank. .................................................................................. 22
Figure 3-4 Example of a recirculating, unsaturated media tank. .............................................................................. 23
Figure 3-5 Example of a conventional septic system. .............................................................................................. 25
Figure 3-6 Example of an engineered aggregate unit. ............................................................................................. 26
Figure 3-7 Example of a chamber system. ............................................................................................................... 27
Figure 3-8 Example of a fabric-wrapped pipe. ........................................................................................................ 28
Figure 3-9 Example of a drip distribution system. ................................................................................................... 29
Figure 3-10 Example of a mound system. ................................................................................................................. 30
Figure 4-1 Example of a cluster system. .................................................................................................................. 38
List of Tables Table 1-1 Summary of Domestic Wastewater Treatment Process and Examples for Centralized and Decentralized
Facilities ................................................................................................................................................... 9
Table 5-1 Comparison of common parameters for influent, effluent, PBTS, Florida Keys Treatment Standard and
Florida Drinking Water Standard. .......................................................................................................... 16
Table 6-1 Summary of cost estimates ..................................................................................................................... 43

Appendix A – Wastewater Technologies Report
5 | Page
EXECUTIVE SUMMARY This report is part of a project to assess the vulnerability of onsite wastewater treatment
disposal systems (OSTDS) to climate change related impacts such as sea level rise (SLR), storm
surge, high tide flooding and rising groundwater levels. Coastal areas are at higher risk of
experiencing these impacts which puts OSTDS in these areas at higher risk of inundation and
failure. This project focuses on the City of St. Augustine and the OSTDSs in their
water/wastewater infrastructure and service area. In the study area we have identified 2,938
OSTDS all of which are experiencing rising ground water levels and many of which are at risk of
SLR, storm surge and high tide flooding. The City of St. Augustine seeks to understand which
areas with OSTDS are at greatest risk and what options might be available for reducing or
eliminating these risks.
The purpose of this report is to provide homeowners with a comprehensive overview of
current wastewater technologies, both decentralized and centralized, to provide information on
contaminant and treatment levels for different circumstances and systems, and to share cost
examples and funding opportunities. The information in this report is intended to help
homeowners participate in community discussions and plans to reduce the risks faced by OSTDS
from climate change related impacts.
The authors would ask the readers to understand that science and technology are (thankfully)
constantly evolving and that new treatment technologies may be available in the near future that
are not covered in this report. This report includes information from the Environmental
Protection Agency, Florida Department of Environmental Protection and industry professionals
in both decentralized and centralized wastewater treatment. We are pleased to have had the input

Appendix A – Wastewater Technologies Report
6 | Page
from so many persons active in the area of wastewater treatment and appreciate the time they
spent with us.
The authors have made every attempt to recognize source material, and state that no
copyright infringement is intended and that we are sincerely grateful to all those who gave their
time to answer our many questions.

Appendix A – Wastewater Technologies Report
7 | Page
1. INTRODUCTION
This report is intended for use by homeowners and does not go into in deep details or
explanations of the biological, physical, or chemical processes of wastewater treatment or the
science of the technologies discussed. The intent of this report is to introduce the homeowner to
the broad range of treatment technologies available for treatment of residential (domestic)
wastewater so that they may have a simple reference when considering solutions for wastewater
treatment. Common treatment processes for decentralized and centralized systems will be
covered at the general level, as will cost examples and funding opportunities. The reader is
encouraged to seek other sources for more detailed information on any of the topics covered.
Again, it is emphasized this is a very generalized, high level review, not intended for scientific or
engineering audiences.
1.1.The Basics of Domestic Wastewater Treatment
Generally, wastewater treatment systems are managed in either ‘Centralized’ and
‘Decentralized’ facilities. Centralized facilities are usually thought of as the larger municipal
sewer systems but can include ‘STEP’ (Septic Tank Effluent Pumping) systems, local ‘package
Single,
onsite
Small
cluster for
Develop
ment level
Large
municipal sewer
plant that
Small
municipal
sewer plant
Figure 1-1 The range of wastewater treatment facilities from single, onsite septic systems to large,
municipal sewer plants.

Appendix A – Wastewater Technologies Report
8 | Page
plants,’ and even ‘cluster systems’ depending on your point of view. Decentralized facilities
include many different types of ‘onsite’ treatment systems including advanced treatment units
and performance-based units (Hallahan 2021). Think of the range of wastewater treatment
facilities as existing on a continuum from smallest to largest:
The goal of all of these systems is to break down the contents of your wastewater into
something that would not be harmful to the environment. These systems originally only
processed the waste from our showers, sinks and toilets. Now they also break down what comes
out of our clothes washers and dishwashers plus all the modern cleaning products we use,
medications we take, food we send down the garbage disposal and processed foods we eat and
unfortunately sometimes also the harsher chemicals we use such as paints or super-duty cleaners.
The processes available to treat these ‘influents’ fall within three different categories: physical,
biological and chemical (Tchobanoglous and Burton 1991). An example of a physical process is
straining to separate solids and liquids. A Biological process is using bacteria to break down
organic matter in solids and liquids, and a chemical process might include using chlorine to
disinfect effluents. Municipal systems, being bigger and more advanced, do a better job of
addressing some of the newer, chemical elements in our wastewater, but even these are not yet
advanced enough to treat everything. Onsite systems, which do not usually include a chemical
process, can be severely negatively affected by chemicals coming out of our homes and entering
our septic systems.
The most common process used to process wastewater are biological processes, and when
properly designed and maintained these are also the most efficient (Tchobanoglous and Burton
1991). Think of these as composting systems, some are just bigger than others. In the broadest
terms, domestic biological wastewater treatment falls into one of two categories: Suspended

Appendix A – Wastewater Technologies Report
9 | Page
Growth or Attached Growth. This refers to the growth of the bacteria that are doing the work of
breaking down the waste. In a suspended growth process the bacteria are suspended in the fluid
(aka ‘liquor’), in attached growth the bacteria grow on some type of media such as rocks or a
plastic shape. In centralized systems the process may include a preliminary step that specifically
screens out materials such as sand or objects that could harm the mechanical components of the
treatment system. In some biological processes, solids are allowed to settle to the bottom, or they
are mixed with the liquids. Solids that are allowed to settle are broken down by anaerobic
processes. Liquids with or without solids, move into either the suspended growth or the attached
growth process, both of which are aerobic processes. Depending on the design of the system this
may be the final step before disposing of outputs or there may be additional steps to further
clarify or polish the effluent before it moves out of the treatment process completely.
The table below summarizes what happens in the domestic wastewater treatment process and
gives examples for how these activities are accomplished in Centralized and Decentralized
treatment systems.
Table 1-1 Summary of Domestic Wastewater Treatment Process and Examples for Centralized
and Decentralized Facilities
Stage Activity Centralized Decentralized
Pre-Treatment Screen out grit or objects that could harm the physical components of the system
Influent Screen Grit Removal Unit
Preliminary Treatment
Solids settle to the bottom; liquids move to the next step
Sedimentation Tanks or Basins
Tank in Conventional System
Appendix A – Wastewater Technologies Report
10 | Page
1.2.Operation of Conventional Septic Systems
Conventional septic systems operate by allowing solids to settle to the bottom of the tank,
while letting liquids skim out to seep through a drainfield into below ground soils. The elements
in the wastewater that enter the tank include organics, nitrogen, phosphorous, pathogens and
chemicals/pharmaceuticals. The most common potential pollutants from onsite wastewater
treatment systems include nitrogen, phosphorous (Humphrey et al. 2014; Lapointe et al. 2015;
Lusk et al. 2017; Lusk 2018b; Paerl 2014), pathogens (Lapointe, Herren, and Bedford 2012;
Lapointe, Herren, and Paule 2017; Reay 2004; Schneeberger et al. 2015), pharmaceuticals and
personal care products (Del Rosario et al. 2014; Yang et al. 2016) although nitrogen pollution
may be the most well-recognized output of poorly functioning septic systems. It is important to
note that nitrogen and phosphorous (and to some extent FIB and some of the ingredients in
pharmaceuticals and personal care products) are naturally occurring elements in nature and only
become ‘pollutants’ when they reach harmful levels of concentration. Nitrogen is the export that
gets the most attention usually because it is often the limiting nutrient to eutrophication and
harmful algal blooms in surface waters (Humphrey, O’Driscoll, and Zarate 2010; Humphrey et
al. 2013; Humphrey Jr. et al. 2012; Lapointe, Herren, and Bedford 2012; Lusk et al. 2017;
O’Driscoll et al. 2019; Withers et al. 2014) although phosphorus can be a limiting nutrient as
Secondary Treatment
Liquids (with or without solids) are processed through a suspended growth, attached growth or combined process
Activated Sludge or Rotating Biological Contactor
ATU Tanks Suspended Fixed Film Unsaturated Media Drainfields
Tertiary Treatment
Possible additional processing for further contaminant reduction or elimination
Various Filters or Chemical Processes UV Treatment Wetland Filtration Lagoons
Performance-Based Treatment Systems Drainfields

Appendix A – Wastewater Technologies Report
11 | Page
well (Guildford and Hecky 2000). ‘Nitrogen’ is used in the general, there are actually several
species of nitrogen involved in the waste processing cycle of septic systems including nitrates
(NO3), nitrites (NO2), ammonia (NH3) and ammonium (NH4). FIB, also used as a general term,
includes fecal coliform bacteria (e coli) and entero viruses (enterococci) which will be discussed
below.
Valiela estimated that each person in a household releases 4.8kg of nitrogen per year (Valiela
et al. 1997) and Lusk et al estimate 8.7 g/person/day or 3.12 kg/person/year (Lusk et al. 2017).
The process of converting nitrogen outputs to nitrogen gas in septic systems takes many steps
(see Figure 1.1). Wastewater leaving the house contains nitrogen with approximately 74%
organic nitrogen and approximately 24% ammonium (NH4). While in the tank, organic nitrogen
will convert via ammonification to ammonium (NH4). Effluent leaving the tank to enter the
drainfield will then be approximately 70-90% ammonium (NH4) and 10-30% organic nitrogen
(Gurpal S. Toor 2019). Once the ammonium enters the drainfield it will most likely be
converted to nitrate (NO3) via denitrification in the unsaturated soils (aka vadose zone). It may
also be taken up by plants if the root zone is within the drainfield, or it may be converted to
ammonia gas (NH3) through volatilization (when the pH in the soil is greater than 8). If there are
any negatively charged particles in the soil, the ammonium maybe adsorbed to these.
Ammonium may also be used by microorganisms for food (Lusk et al. 2017; Valiela et al. 1997).
After passing through the soils, nitrates will enter the groundwater. In this anaerobic zone
denitrification will convert nitrates (NO3) to nitrogen gas (N2). Nitrates may also be taken up by
plants or microbes in groundwater. If ammonium and nitrates are not fully processed through
nitrification/denitrification they are likely to move into surface waters where even a small
amount (1 mg/L) can lead to harmful algae outbreaks.

Appendix A – Wastewater Technologies Report
12 | Page
Figure 1.2 The nitrogen cycle in a conventional septic system
When the full process does not happen, elevated levels of ammonium and/or nitrates enter
aquifers, drinking water wells and surface waters. For the full process to happen there must be an
adequate amount of organic matter in the unsaturated soils (aka the vadose zone) below the
drainfield and sufficient distance between the drainfield and the groundwater table (Valiela et al.
1997) (see Figure 1.1 again). There should be 24” between the drainfield and the high
groundwater table (determined by the wet season high level) and the soils should contain organic
matter capable of completing the nitrification process.

Appendix A – Wastewater Technologies Report
13 | Page
While this is not true for all coastal communities, many are at or near sea level and have a
predominance of inorganic sandy soils. For these communities, there is high likelihood for
incomplete nitrogen conversions. When these conditions are compounded by sea level rise,
increased flooding and precipitation, storm surge, and/or rising groundwater level, there is an
increasing opportunity for incomplete nitrification and/or denitrification, enabling ammonium
and/or nitrates to enter surface waters. When there is a lack of sufficient distance and/or organic
matter between drainfields and groundwater elevated levels of nitrogen (in the form of
ammonium and/or nitrates) could enter groundwater resources and transport to drinking water
wells, aquifers, or surface water bodies. When high levels of nitrogen (>10 mg/L) enter private
drinking water wells, the potential health risks to humans can include decreased oxygen in the
blood, blue baby syndrome or even cancer (Oosting and Joy 2011; Ye 2019). When high levels
of nitrates (>1 mg/L is an adequate food source for algae to grow) enter surface waters it can
contribute to harmful algae blooms, reduced oxygen in the water, eutrophication, reduced
biodiversity and ecosystem health (Cole et al. 2006; De 2015; Wang et al. 2013; Withers et al.
2014). When algae consume the nitrates and grow to such an extent that they block sunlight from
reaching submerged aquatic vegetation (SAV), causing the vegetation to die which can deprive
fish of a necessary food source. When the algae have consumed all the nitrogen they begin to
die and through decomposition reduce the supply of oxygen in the water which can lead to fish
kills. Some algae also produce toxins that can directly cause fish kills as well as skin rashes if
humans come in contact with it (SJRWMD 2021).
In addition to nitrogen, phosphorous, pharmaceuticals and pathogens may also transport out
of systems with the effluent (Lapointe, Herren, and Paule 2017). Kramer et al estimate
phosphorus exports per person per year at 1.2 kg/person/year (Kramer et al. 2006) and Lusk et al

Appendix A – Wastewater Technologies Report
14 | Page
estimate 1.6 g/person/day or 0.584 kg/person/year (Lusk et al. 2017) and while most of this is
exported in septic system effluent phosphorous readily binds to soils (Lusk et al. 2017) and so
does not usually pose a human health threat. This sounds good except that it only takes very
small amounts, 0.03mg/L, of P to lead to eutrophication in surface waters where P is the limiting
source (Charles P. Humphrey et al. 2014; Iverson et al. 2018; Lusk et al. 2017).
‘Pathogens,’ is the more appropriate term for pollutants that originate in fecal material
although not all are disease causing. These include fecal coliform bacteria and enteric viruses
such as enterococcus. Lusk et al estimates fecal coliform bacteria at 106-109 per gram of human
feces and enteroviruses at 103-107 (Lusk et al. 2017). The wide variety of fecal contaminants
would require specific tests for each one, making this level of testing impractical. Instead, FIB is
used to indicate the likely presence of pathogens. Pathogens in groundwater can contaminate
private drinking water wells and surface waters (Schneeberger et al. 2015; Weiskel, Howes, and
Heufelder 1996) where there is not sufficient distance in the unsaturated zone beneath drainfields
(Lusk et al. 2017). Lusk et al notes that counts for pathogenic bacteria in septic tank effluent can
be as high as 105-108/100ml for e coli and 103-104/100ml for enteroviruses. When this is
compared to the amount required for infection doses, just 10 organisms for some e coli species
and 106-107 for others, and only 1 organism for enterovirus, we can see how significant the
human health risk is from these contaminants (Lusk et al. 2017).
Recent research is also showing that pharmaceuticals and personal care products are another
export of septic systems (Del Rosario et al. 2014; Lusk et al. 2017) referred to as ‘TOrCs’ or
trace organic chemicals. A growing body of literature is revealing the danger these pose to the
environment and marine life in surface waters (Santos et al. 2013; Snyder et al. 2003). For

Appendix A – Wastewater Technologies Report
15 | Page
example, hormones in pharmaceuticals can lead to physical and behavioral changes in male fish
(feminization) that impact diversity and reproduction (Vajda et al. 2008).
1.3.Treatment Requirements
Historically, treatment was categorized as ‘primary,’ ‘secondary’ and ‘tertiary,’ but now
treatment is focused on maximum levels of contaminants in the effluent, such as a maximum of
10mg/L of Total Nitrogen in the Florida Keys. In this way, both centralized and decentralized
treatment systems are similar, in that they have to remove a certain amount of contaminants,
although the requirements are slightly different for the two. Since this resource is written for the
homeowner we will focus on treatment requirements for onsite or localized systems.
As mentioned, what’s going into the septic system is everything from our toilets, showers,
sinks, clothes washer, dishwasher and any other plumbing in your home. What we flush down
the drain is not only organic waste from ourselves, but all the chemicals we use for cleaning,
medications we ingest that don’t break down in the body, and often times hazardous household
waste that shouldn’t go down the drain at all. There are also some surprising items that enter
septic systems that shouldn’t: coffee grounds, fats/oils/grease (FOG), cleaning wipes, disposable
diapers, kitty litter and cigarette butts to name a few (Harriss and Blanco 2013). None of these
items can be broken down in septic systems and could even clog pipes and cause the tank
contents to back up into the house. It’s important to recognize that the biological processing done
by the septic system happens almost completely in the drainfield in a conventional system. ATUs
(advanced treatment units) and PBTS (performance based treatment systems) provide increased
reductions in the tank with their new technologies and this has greatly improved effluent quality
out of the drainfield.
Appendix A – Wastewater Technologies Report
16 | Page
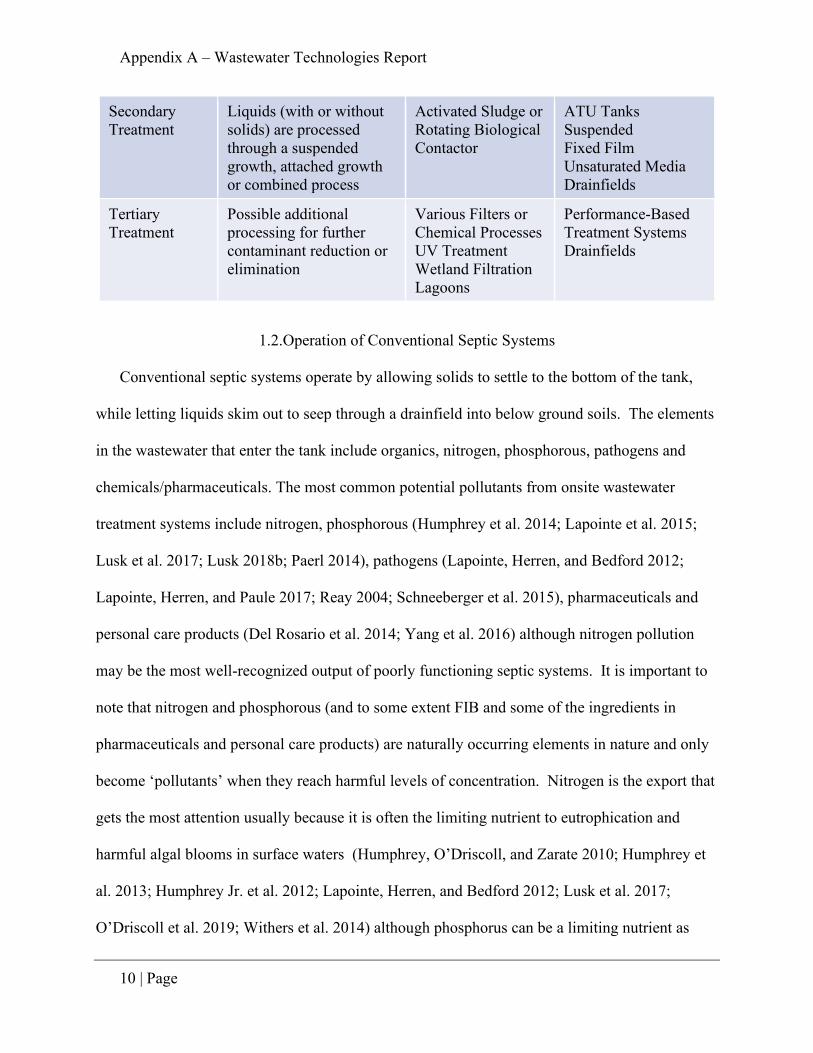
To understand what level of processing takes place in these systems, the table below
compares what is going into a conventional septic tank (the raw sewage – influent – from your
home), to what is coming out of the drainfield and going into the soils below the drainfield, and
also treatment standards for PBTSs, the Florida Keys and drinking water in Florida.
Table 1-2 Comparison of common parameters for influent, effluent, PBTS, Florida Keys
Treatment Standard and Florida Drinking Water Standard.
Element Going
into the
Septic Tank
(mg/l)1
Coming
out of the
Drainfield
(mg/l) 1
PBTS
meeting
NSF 245
Standard
(mg/l) 2
Florida
Keys
Treatment
Standard
(mg/l) 1
Drinking
Water
Standard
(Florida,
Class I)
(mg/l) 3
Total
Nitrogen
60 60 50%
reduction
10 10
Total
Phosphorous
10.4 9.8 1 0.01
CBOD5/BOD 420 216 25 10
TSS 232 61 30 10
1 (Harriss and Blanco 2013), 2(Groover 2020), 3(“62-302 : SURFACE WATER QUALITY STANDARDS -
Florida Administrative Rules, Law, Code, Register - FAC, FAR, ERulemaking” 2020, 530)
We can see that there is not much nitrogen treatment happening in a conventional system, an
area of concern in Florida right now. The NSF 245 standard defines the level of nitrogen
reduction required for residential wastewater systems (NSF International 2021) and has the

Appendix A – Wastewater Technologies Report
17 | Page
added benefit of CBOD and TSS reductions as well. In all cases, we can see that treatment is
necessary to cleaning the effluent to an appropriate level before releasing it back to the
environment.
2. DECENTRALIZED WASTEWATER TECHNOLOGIES
Decentralized Systems are systems that have historically been ‘onsite’ at the property it is
providing the waste treatment service for. While most commonly these are for single family
residential properties, they may also be for small commercial uses or a small number of homes
together. These most commonly consist of a tank and a drainfield. The tank is a watertight
concrete or heavy-duty plastic or fiberglass tank that is buried underground. Residential system
tank sizes depend on the size of the home and how many people live there. They generally start
at a 900 gallon size and can go as high as 3,000 gallons(“Product Listings and Approval
Requirements | Florida Department of Health” 2021). Everything leaving the house through the
plumbing (toilets, showers, sinks, dishwasher, clothes washer, etc.) enters the tank. Heavy solids
sink to the bottom; fats, oils, grease (FOG), and lighter solids rise to the top; and liquids
(effluent) flow out into the drainfield (US EPA 2018). The top of the drainfield should be 6”
below ground surface, and should have at least 24” from the bottom of the drainfield to the top of
the groundwater (FDOH 2018).
In these systems, a large area of concern is what types and quantities of pollutants are leaving
the tank and entering the drainfield. These ‘pollutants’ include high concentrations of nitrogen
from urine. While nitrogen is a naturally occurring element, in high concentrations it can be
harmful to plants and animals. In an ideal situation, there will be a high level of organic matter in
the soils beneath the drainfield and this organic matter will be able to convert enough of the
nitrogen to harmless nitrogen gas so that the concentrations are no longer harmful. After the

Appendix A – Wastewater Technologies Report
18 | Page
effluent leaves the drainfield and soaks through the soils beneath the drainfield, it enters
groundwater where it eventually makes its way out to surface waters. Especially in Florida we
have seen the effects of high levels of nitrogen entering surface waterbodies, such as lakes and
rivers, from septic systems as well as other sources, in the form of algal blooms, fish kills and
reduced aquatic vegetation (Diaz-Elsayed et al. 2017).
In Florida we face several challenges to the ‘ideal’ situation. First, our soils have a high sand
content and little organic material. This allows fluids to move quickly through the soil to
groundwater with very little processing of pollutants. An additional challenge, especially in
coastal areas, is our groundwater levels are rising – reducing the distance between the drainfield
and the groundwater and thus how much of the harmful nitrogen is converted to harmless
nitrogen gas. Both of these challenges allow high levels of harmful nitrogen to enter groundwater
and make their way out to surface waters. As we saw with the centralized systems, ‘treatment’
occurs in the biological processes of suspended growth or attached growth where bacteria break
down the contaminants. For onsite systems this process has traditionally been completed in the
drainfield, but new technologies have improved drainfield treatments and introduced these
processes to the tank as well.
2.1.Tank technologies
In recent decades, tank technologies have evolved from the traditional anaerobic (without air)
treatment type to several methods of more advanced treatment processes. These range from
providing better treatment to pollutants and wastes overall, to specifically treating nitrogen or
other elements. There have also been technological advances in drainfields. These have included
the design of the drainfield pipes as well as the media below the drainfield and above the soils.

Appendix A – Wastewater Technologies Report
19 | Page
2.1.1. Anaerobic Systems (traditional/conventional)
Anerobic septic systems are the most common and what most people think of when picturing
a septic system. They have also been around the longest. In these systems, solids settle to the
bottom and are ‘digested’ in an anerobic (without air) environment while lighter solids float to
the top and liquids flow into the drainfield and then into soils (US EPA 2018). The primary form of
‘treatment’ in these systems is whatever processing happens in the soils below the drainfield. As
noted above, in some situations this can be very little treatment.
Figure 2-1 Example of a conventional septic tank.

Appendix A – Wastewater Technologies Report
20 | Page
Image Source: EPA, Types of Septic Systems (https://www.epa.gov/septic/types-septic-
systems)
2.1.2. Aerobic Treatment Units (ATUs)
These systems introduce air into either the primary or a secondary tank where bacteria digest
more of the components of the wastes than they do in a traditional system. ATUs come in several
different forms such as ‘Suspended,’ ‘Fixed Film,’ and ‘Unsaturated’ (Groover 2020).
2.1.2.1. Suspended Growth
In a ‘Suspended’ aerobic treatment there is an aeration tank where air is forced to move in
the liquid and bacteria are ‘suspended’ in this mixture. The moving air keeps the mixture moving
and mixing while also keeping the bacteria suspended (Goguen 2018). These bacteria are more
effective at reducing pollutants so less harmful materials make it out to the drainfield.

Appendix A – Wastewater Technologies Report
21 | Page
Image source: AAMS Wastewater, www.aamswastewater.com
2.1.2.2. Fixed Film/Attached Growth
A ‘Fixed Film,’ or ‘Attached Growth’ system contain material that the bacteria attach
themselves to and then the effluent are sprayed over the material by a rotating arm. This process
mimics the suspended treatment system by alternatively exposing the bacteria to air and fluids
(Goguen 2018).
Figure 2-2 Example of a suspended treatment tank.

Appendix A – Wastewater Technologies Report
22 | Page
Image source: National Precast Concrete Association,
https://precast.org/2018/01/taking-septic-tanks-to-the-next-level-advanced-treatment/
2.1.2.3. Unsaturated Media Filters
Unsaturated media filters operate by filtering the effluent through a material (media) such as
sand before it goes to the drainfield. These are available in both ‘single-pass’ and ‘recirculating’
where the effluent may filter through the media only once before going to the drainfield or may
be recirculated through the media multiple times before going to the drainfield. There are several
different media types than can be used in these systems including sand, gravel, peat or foam
(Galbraith 2018).
Figure 2-3 Example of a fixed film or attached growth
tank.

Appendix A – Wastewater Technologies Report
23 | Page
Image source: Missouri Department of Natural Resources,
https://dnr.mo.gov/pubs/pub2738.htm
Performance Based Treatment Systems (PBTS) and Innovative Systems are systems
designed by a licensed engineer specializing in wastewater treatment and are often used where
site conditions require treatment beyond what a conventional or advanced system can achieve.
These systems must reach specified treatment levels for CBOD5 (five-day carbonaceous
biochemical oxygen demand), TSS (total suspended solids), TN (total nitrogen), TP (total
phosphorous) and FC (fecal coliform) (Harriss and Blanco 2013). As part of their design, they
may use components of ATUs and also additional treatment technologies such as chemical
treatments, UV lights or other technologies.
Figure 2-4 Example of a recirculating, unsaturated media tank.

Appendix A – Wastewater Technologies Report
24 | Page
2.2.Drainfield Technologies
While the drainfield design hasn’t changed much from the traditional pipe and trench
network, what the trench is filled with and how that ‘pipe’ is constructed has seen advancement.
Also, traditionally the drainfield has been gravity fed, meaning the effluents flow downhill into
the network. Today, when site conditions prevent a traditional gravity system from operating, a
pressurized system can be installed to make sure effluent moves through the drainfield network.
2.2.1. Traditional rock/gravel aggregate
The most common drainfield design is to put a perforated pipe network in a gravel bed. The
gravel is of large enough size to allow space between the rocks for the effluent to flow through.
Bacteria will build up on the rocks and provide treatment to the effluent as it flows through (US
EPA 2018). One downside of the rock aggregate is that the ‘fines,’ smallest pieces of rock, may
be so small as to clog filtration.

Appendix A – Wastewater Technologies Report
25 | Page
Image Source: EPA, Types of Septic Systems (https://www.epa.gov/septic/types-septic-
systems)
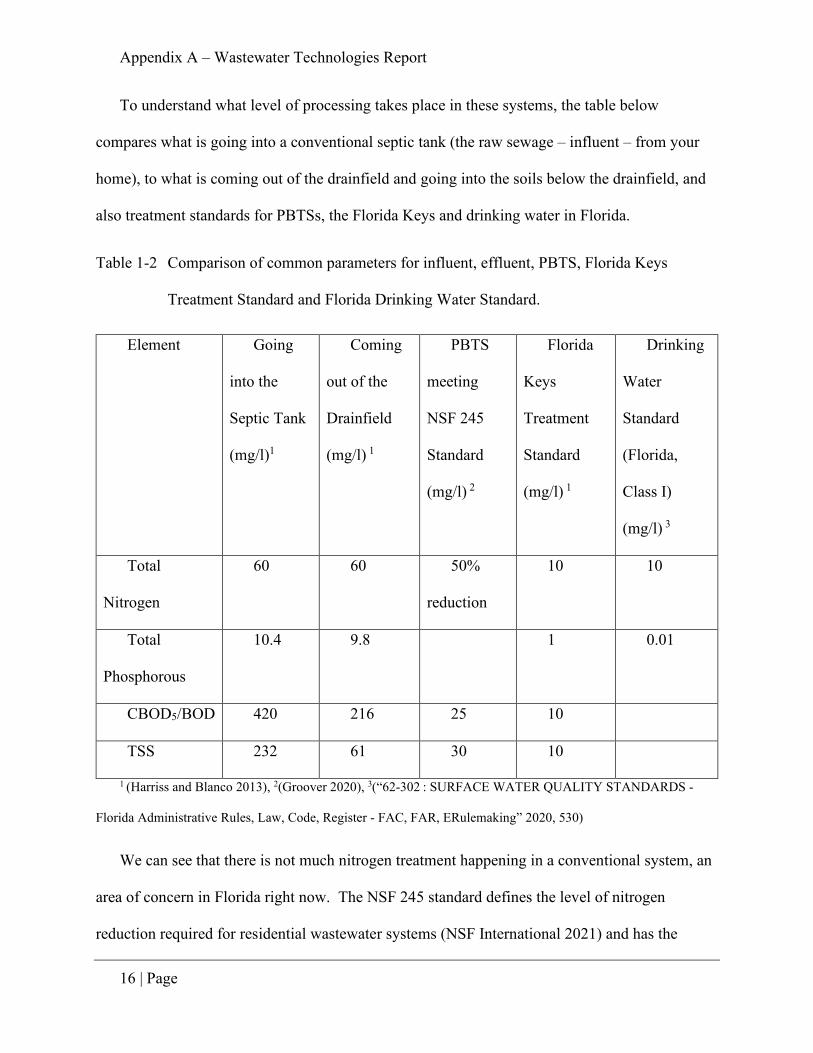
2.2.2. Engineered Aggregate
Engineered aggregate is a synthetic material that is formed into a shape with lots of surface
area for bacteria to attach to. These are often compiled into pre-built units to make installation
Figure 2-5 Example of a conventional septic system.
Appendix A – Wastewater Technologies Report
26 | Page
easier (Infiltrator Water Technologies 2015). These have the benefit of not having any ‘fines’ to
prevent effluent flow and increased surface area for more bacteria to attach.
Image Source: Infiltrator Water Technologies, www.infiltratorwater.com
2.2.3. Plastic Chambers
Plastic chambers are like the top half of a circle that is placed as the drainfield network.
These can be placed linearly or in the common network fashion like common perforated pipe.
Bacteria attach to the plastic chamber as well as the soil under it, building up a mat of biological
material to do the processing (Shoaf Precast Inc. 2021).
Figure 2-6 Example of an engineered
aggregate unit.

Appendix A – Wastewater Technologies Report
27 | Page
Image source: Shoaf Precast Inc., www.shoafprecast.com
2.2.4. Fabric Wrapped and Bundled Pipe
Fabric wrapped pipe is exactly what it sounds like. Perforated corrugated pipe is wrapped in
a polyester fabric. Bacteria attach to the fabric and the pipe and treat the effluent as it ‘wicks’
around the pipe (Springfield Plastics, Inc. 2021).
Figure 2-7 Example of a chamber system.

Appendix A – Wastewater Technologies Report
28 | Page
Image Source: Springfield Plastics Inc., www.spipipe.com
2.2.5. In-Ground Nitrogen Reducing Biofilter
This is required in Spring and Aquifer protection areas. It is a layer of filter material
(woodchips or other approved material) below the drainfield that will achieve significant
nitrogen reductions of up to 65% (FDOH 2020).
2.2.6. Drip Distribution
A pressurized system that regulates the flow of effluent to the drainfield so that it is sent to
the drainfield in regular, even doses. This regulates the application of effluent to the soils so
there is no over or under saturation that might interrupt the bacteria cycle and potentially kill off
the bacteria mat (Hallahan 2012).
Figure 2-8 Example of a fabric-wrapped pipe.

Appendix A – Wastewater Technologies Report
29 | Page
Image source: Ever Green Septic Design, www.egsd.com
2.2.7. Mound System
Mound systems are most commonly used when the distance between the drainfield and the
ground water, or a confining layer of soil such as clay, is not deep enough (24”) to allow for
sufficient effluent treatment (Parker et al. 2009). The drainfield is raised above ground to create
the depth necessary for treatment.
Figure 2-9 Example of a drip distribution system.

Appendix A – Wastewater Technologies Report
30 | Page
Image source: Iowa Department of Natural Resources, www.iowadnr.gov
3. CENTRALIZED WASTEWATER TECHNOLOGIES
This section will give a general description of some of the most common technologies used
to process domestic wastewater in Centralized systems. Virtually no two facilities have exactly
the same design as the final design is determined in part by the level of treatment required. The
treatment technologies described below are some of the most common for Centralized systems
and are usually used in some combination to achieve the necessary treatment.
Figure 2-1 below shows how domestic wastewater is generally handled by a centralized
facility. Some pre-treatment may happen at the water supply facility before water is consumed
by a household. This pre-treatment may remove fine particles or introduce disinfecting chemicals
not present in the water source. The public water supply is consumed by the household then
leaves the household as wastewater and is taken up by the collection system that moves it to the
wastewater treatment facility. Once the wastewater reaches the facility it may be put through a
screening process (Primary Treatment) to remove grit or objects that would harm the plants
physical components. If the facility uses an activated sludge process solids and liquids will move
Figure 2-10 Example of a mound system.

Appendix A – Wastewater Technologies Report
31 | Page
into the first treatment tank for mixing, or solids may be allowed to settle out and treated
separately from liquids (Secondary Treatment). If the facility produces bio solids that will be
disposed of separately these will be separated out and prepared for disposal (Biosolids
Treatment). Depending on the design of the facility and their treatment requirements, advanced
treatment may follow the secondary treatment. This may include special treatments for nutrients
such as nitrogen and phosphorus. Disinfection will be the last step if necessary to further remove
infectious organisms. Finally, the effluent is prepared for disposal. This may be discharging to a
local waterbody, reused for irrigation in places such as golf courses or certain agricultural
applications, or may be injected deep underground through an injection well.

Appendix A – Wastewater Technologies Report
32 | Page
Image source: Florida Department of Environmental Protection.
https://floridadep.gov/sites/default/files/dwwprocess_0.pdf
Figure 3-1 Process flow of a typical domestic wastewater treatment
process.

Appendix A – Wastewater Technologies Report
33 | Page
3.1.Suspended Growth Processes
The Activated Sludge process for wastewater treatment is the most common for suspended
growth processes. This process operates by both infusing air and preforming a mixing action of
the influent material (liquids and solids). This provides bacteria in a ‘suspended’ manner which
break down the ‘liquor’ (mixed material). The liquor moves through a series of these aeration
and mixing tanks for some period of time (hours to days), or as in the case of Sequencing Batch
Reactors, there may be only one tank for processing. Common variations of the Activated Sludge
method include ‘Complete Mixing,’ ‘Sequencing Batch Reactors,’ ‘Extended Aeration,’ and
‘Contact Stabilization’ (Tchobanoglous and Burton 1991).
3.1.1. Complete Mixing
The Complete Mix process involves a continuous flow of influents that are constantly being
mixed together. Additionally, as solids and liquids settle out at various points, a portion of each
are returned to the mixing tank(s). Some of the sludge is allowed to settle out as waste sludge. If
this process provides the necessary level of treatment, the effluent is discharged, otherwise it is
moved onto additional treatment processes.
3.1.1.1. Sequencing Batch Reactors (SBR)
Often referred to as a ‘fill and draw’ process, the SBR process happens in one tank and thus
the tank is ‘filled, the ‘batch’ is processed, and the tank is then emptied or ‘drawn’ down.
Bacteria treat both solids and liquids. After treatment, solids and liquids are separated and each
undergo additional processing dependent on how much treatment is still necessary and how the

Appendix A – Wastewater Technologies Report
34 | Page
final outputs will be disposed. SBR is well suited for smaller plants (<5MGD – million gallons
per day) but is more complex to keep processes balanced within the batch processing.
3.1.1.2. Extended Aeration
Extended aeration is a slower activated sludge process in that the liquor mixture spends much
more time in the suspended tank. This process is good for smaller facilities that have a much
lower influent rate (< 0.5 MGD). Also, it is most commonly used in ‘package plant’ setups.
Package plants are pre-manufactured facilities that can be setup for small communities or
neighborhoods.
3.1.1.3. Contact Stabilization
Contact Stabilization refers to using aeration to stabilize the organic matter in the sludge that
is being returned to the primary mixing tank. As with Complete Mixing, influents are mixed in
the same tank, after which some solids settle out in a second tank. These solids are then contact
stabilized before returning to the primary mixing tank.
3.2.Attached Growth Processes
Whereas Suspended Growth processes keep bacteria suspended in the tank, Attached Growth
provides a surface for the bacteria to attach to. These surfaces take many forms and are made
from several materials. In attached growth processes, the focus is on how the bacteria come in
contact with the influent. The most common methods are the ‘Trickling Filter’ and the ‘Rotating
Biological Contactor’ (Tchobanoglous and Burton 1991)
3.2.1. Trickling Filter
In this method, influent is introduced into a tank containing the media upon which bacteria is
growing. The influent is ‘trickled’ over top of this media and allowed to filter through the

Appendix A – Wastewater Technologies Report
35 | Page
bacteria on the media. Commonly these are round tanks, and the influent is introduced through a
set of arms extending from a rotating pivot point. These tanks tend to be several feet deep, often
6 feet deep. At the bottom is a collecting tank that collects solids as well as liquids. A portion of
the solids and liquids are cycled back through the tank. Treatment is achieved through repeated
cycling which places the influents in contact with the bacteria attached to the media.
3.2.2. Rotating Biological Contactor
While the trickling filter trickles the influents over the media, Rotating Biological Contactors
rotate the media through the influents. Bacteria are growing on the media which is slowly rotated
through influents in a tank. This exposes the bacteria to the influents for processing through both
an aerobic process and anaerobic process.
3.3.Further/Additional Processing
If further treatment is necessary, for disinfection or further treatment of infectious organisms,
UV disinfection or chemical treatments are available and the most common (Tchobanoglous and
Burton 1991).
3.3.1. UV Disinfection
Ultraviolet, or UV, light can be used to kill bacteria or virus by exposing the material to
either a natural or artificial UV light source. Ultraviolet light exists within a particular spectrum
on the light spectrum. It is the radiation emitted within this spectrum that can act as a bactericide
or virucide.

Appendix A – Wastewater Technologies Report
36 | Page
3.3.2. Chemical Treatments
For chemical disinfection, Chlorine is the most commonly used chemical in wastewater
treatment. In appropriately managed processes, it can react with various nitrogen compounds in
wastewater effluent achieving a desired level of disinfection.
The processes discussed above are only some, though the most common, ways in which
centralized wastewater treatment facilities may treat domestic wastewater. Additionally, facilities
may combine any of these processes to achieve a required level of treatment. In fact, it should be
noted that rarely will there be two facilities with the same treatment design. Facility design will
be determined by what is coming in and to what level it needs to be treated. Required treatment
level will also depend on how outputs will be disposed.
4. BETWEEN CENTRALIZED AND DECENTRALIZED
Depending on the needs of the community, components of centralized and decentralized
treatment systems can be combined to create a facility that serves a small area or community.
These can include ‘STEP’ systems, ‘cluster’ systems, and ‘package plants’ (Hallahan 2021). The
benefit of these is that they can be customized to the community’s needs and can help bridge the
wastewater treatment gap for small but growing communities who may not be ready or able to
connect to a larger treatment plant.
4.1.STEP Systems
STEP Systems (Septic Tank Effluent Pumping) leave the tank in place on the property but
draw the effluent into the collection network to be treated at the central wastewater treatment
facility. Solids in the tank continue to break down through their aerobic process and can be

Appendix A – Wastewater Technologies Report
37 | Page
pumped out periodically but the higher contaminant loads are treated with the (usually) more
advanced technology at the central facility.
4.2.Cluster Systems
Cluster systems, similar to STEP systems, leave the tank on the property to collect and
process solids, but transport the effluent to a common location for processing in a drainfield.
The drainfield can use the conventional pipe and gravel system of any of the other drainfield
technologies available. This can serve a small community of homes that may not be able to
connect to a central facility because of distance or physical barriers.

Appendix A – Wastewater Technologies Report
38 | Page
Image Source: EPA, Types of Septic Systems (https://www.epa.gov/septic/types-septic-
systems)
Figure 4-1 Example of a cluster system.

Appendix A – Wastewater Technologies Report
39 | Page
4.3.Package Plants
Package Plants, mentioned earlier under the centralized systems extended aeration
technology, are pre-built treatment facilities that can be setup and operating much quicker than a
centralized facility but are intended to serve local communities such as subdivisions or a few
thousand homes.
These local facilities can be operated by the municipality, a Special District (discussed under
funding options), or an agency created for their management.
5. COSTS
It’s difficult to pin down costs for any of these systems. What’s provided below is only for
reference and should not be relied upon as fact.
Centralized facilities usually don’t begin with a blank slate. Generally, there is an existing
facility that is looking to expand, and since each facility is a unique design costs will always
vary. if you want a 1mgd plant it might be $3/gallon, but changes with economies of scale, so
smaller package plant might be at least $5-6 per gallon for the plant. In addition to the physical
plant, there are costs for the collection system – the network of pipes around town. These costs
vary by length, number of connections, the need to install a pressurized system if there is not
enough elevation for a gravity feed system, land acquisitions or easements, road work, labor
costs, etc. The collection system may be as much or more than the plant itself (Jarrett 2021).
The City of St. Augustine has received information about several different upgrades they are
interested in. Being a low-lying coastal community, they are very vulnerable to the impacts of
climate change and their wastewater treatment facility is located in a particularly vulnerable area.
They have considered moving the facility to a different location on higher ground. This means

Appendix A – Wastewater Technologies Report
40 | Page
not only moving the physical treatment plant but also rerouting portions of the collection system
that brings wastewater to the plant for treatment. They estimate to build a brand-new plant would
be around $80 million not including design, land acquisition, easements or other costs not related
to the physical structure.
They have also looked at certain upgrade projects that would improve operations and
treatment. One such project would add a UV disinfection treatment which would replace an acid
treatment they currently use at the end of the treatment process. This would result in a higher
quality effluent though it would be around $800,000 to install and would pay off in
approximately 10 years.
Another upgrade project, rehabilitating the headworks, would improve the primary treatment
process where it accepts the influent. This particular project would have the benefit of enabling
them to raise some of the structures, which would make them more resilient to flooding. It is
estimated this project would cost around $4.5 million (Beach 2021).
For homeowners that may be connecting to the centralized facility, these costs generally
include connection from the road to their home. The municipality or authority usually provides
the pipe to the road in front of the property and the homeowner covers the connection from there
to the house. The cost for this varies based on how far from the road the house is. The longer the
distance the greater the cost. A conservative estimate for septic to sewer conversion may be
around $12,000. This includes removal of the existing tank and mound (if exists), restructuring
the existing plumbing and restoring landscaping (Beach 2021). In this situation there will also be
the monthly sewer bill following connection to the central facility. These fees vary too. There is
usually a flat fee plus a cost per gallon. Wastewater costs are often estimated based on water use
since there is no meter for the outgoing volume. The City of St. Augustine charges a monthly fee

Appendix A – Wastewater Technologies Report
41 | Page
of $15.11 for in-city wastewater plus $6.89 per 1,000 gallons of wastewater (St. Augustine
Utility Fees 2019).
For an onsite system, costs for the system are only a little less variable because the
mechanical components may have standard costs. But, similar to centralized systems, costs for
an onsite system may include: system design, shipping costs, site work and labor. System design
costs will be impacted in part by the site. If there are setback requirements that make placement
tricky, a higher performing unit may be necessary to achieve the treatment standards. Shipping
costs can be affected by the type of equipment: a concrete tank will cost more to ship than a
plastic or fiberglass tank.
For homeowners installing a new onsite system, a basic conventional system will start around
$8,000 if there are no soil or setback challenges. Soil challenges can include soils with a high
clay content that do not allow for fluids to filter through soils, or a limiting layer of clay within
the 24 inches below the drainfield. These soils will have to be replaced or amended with suitable
soils. Setback challenges may occur if the land area available for the septic system is too close to
a waterbody or private drinking well. This may result in additional treatment technologies being
added to the system. When basic systems face these challenges, it can drive the cost up over
$20,000 (Groover 2021).
Other examples of extra costs with basic systems include permit costs which can vary by
county, whether the soil evaluator is a private party of the Florida Department of Health, and fees
for inspections when extra soil work is needed.

Appendix A – Wastewater Technologies Report
42 | Page
Also possible is the requirement of a mound system because there is not enough depth
between the ground surface and the groundwater surface. Mound systems introduce addition
costs for the additional soils, inspections and mound stabilization fees.
For a more basic ATU which may only address CBOD and TSS, this can add an additional
$2,000-$4,000 for additional permits. These systems require an operating permit and a
maintenance entity permit. Plus, the system has to be inspected once a year and have recorded
maintenance twice a year. Homeowners may become certified to perform their own maintenance
and avoid the hired maintenance costs. For ATUs with more advanced treatment (CBOD, TSS,
TN, TP), these costs can go even higher.
Systems installed within the Springs Protected Areas require an In-ground Nitrogen
Reducing BioFilter. These are can also be installed in other locations and provide nitrogen
reduction benefits. Since these systems do not have any powered components, they do not incur
the operating and maintenance fees like the ATUs referenced above. These systems may be
completed for around $10,000.
Obviously, these costs add up. Beyond installation costs there are maintenance costs. An
ATU or PBTS will provide much higher treatment quality and can be used in locations with less
land available but have higher operating expenses. They have electrical components that require
electricity to operate, they require more frequent maintenance including annual inspections and
run most efficiently during regular loading. These systems can be negatively impacted when
under heavy loading (large holiday gatherings) or no loading (everyone is gone on vacation).
Again, these are only general ballpark estimates and homeowners should get a real quote
from a licensed engineer or installer. The table below summarizes the estimates presented here.

Appendix A – Wastewater Technologies Report
43 | Page
Table 5-1 Summary of cost estimates
Estimate example
Centralized
Large centralized facility $3/gallon
Small centralized facility $5-6/gallon
Build a new facility on higher ground $80 million
Upgrade disinfection to UV treatment $800,000
Rehabilitate headwords and raise some of the
structures
$4.5 million
Homeowner connecting to centralized facility $12,000
Decentralized
Install new conventional system beginning at $8,000,
may exceed $20,000
Install new, basic advanced treatment unit add $2,000-$4,000 to
conventional system
Install new conventional system with In-ground
Nitrogen Reducing BioFilter
$10,000
Appendix A – Wastewater Technologies Report
44 | Page
6. FUNDING OPPORTUNITIES
Thankfully there are many funding opportunities available to help communities who are
facing upgrades to their wastewater treatment systems. The state of Florida, both directly and
with EPA funds, offers several programs. The programs listed below all support septic upgrade
or septic to sewer conversion in some way. This may be planning, design, construction or
connection. See the program for specific details.
When looking at funding opportunities, look for programs that can work together. Projects
that cross multiple phases (design and construction) may benefit from multiple funding
opportunities such as one that only supports design plus one that supports construction. This can
be especially helpful when funds must be used within a short period of time such as one year
because these projects typically take several years from start to finish.
6.1.Water Quality Grants
Offered annually through FDEP to government entities, the program distributes a total of $25
million to selected applications. There is a minimum 50% local match required unless the entity
qualifies as a ‘rural area of opportunity’ or if there is a public/private partnership pay for
performance agreement.
https://protectingfloridatogether.gov/sites/default/files/documents/WaterQuality_PFT_GrantI
nfoSheet_0.pdf
6.2.FDEP/Division of Water Restoration Assistance
6.2.1. Federal 319 grant (EPA originated) Nonpoint Source Funds
“319 Grants” refers to the section of the Federal Clean Water Act that supports these
projects. Total available funds vary each year but is usually around $8-$9 million. Funds are

Appendix A – Wastewater Technologies Report
45 | Page
available to local governments (county and city), special districts, water management districts,
state agencies, public colleges and universities and national estuary programs in Florida.
https://floridadep.gov/wra/319-tmdl-
fund#:~:text=About%20Nonpoint%20Source%20Funds&text=The%20program%20administers
%20both%20the,pollution%20from%20land%20use%20activities.
6.2.2. Clean Water State Revolving Funds Loan program (EPA originated)
This is a low interest loan program and segregates loans by ‘planning loans,’ ‘design loans,’
and ‘construction loans.’ Additionally, if a community qualifies as a ‘small disadvantaged
community,’ they may qualify for grants (as opposed to loans). Loans are for 20 years and the
interest rate is determined by the community’s median household income, poverty index and
unemployment index.
https://floridadep.gov/wra/srf/content/cwsrf-program
If a community has received a Clean Water State Revolving Fund loan, they may also apply
for a Small Community Wastewater Construction Grant. These must be communities with
10,000 or fewer in population with a per capita income less than the state average.
https://floridadep.gov/wra/srf/content/cwsrf-program
For projects that include Davis-Bacon wage rate and American iron and steel in their
projects, they may be eligible for loan assistance in the form of financing rate reductions on
construction agreements.
https://floridadep.gov/wra/srf/content/cwsrf-program

Appendix A – Wastewater Technologies Report
46 | Page
6.2.3. Septic Upgrade Incentive Program
This program is currently not available because it has allocated all its funds. Funding for the
next state fiscal year is currently in deliberation so check back to see if there will be funding for
the next year.
https://floridadep.gov/springs/restoration-funding/content/septic-upgrade-incentive-program
6.3.Florida Resilient Coastlines Program
The Florida Resilient Coastlines Program offers two grant opportunities each year, the
Resilience Planning Grant and the Resilience Implementation Grant.
6.3.1. Resilience Planning Grant (RPG)
These grants are available annually to municipalities that are required to have a coastal
management element in their comprehensive plan. Funds are available for up to $75,000 and the
project must be completed within the fiscal year. Eligible projects include vulnerability
assessments (such as for infrastructure of anything that is not required for compliance with the
Peril of Flood statute), development of adaptation plans or resilience plans or for regional
collaboration efforts.
https://floridadep.gov/rcp/florida-resilient-coastlines-program/content/frcp-resilience-grants
6.3.2. Resilience Implementation Grant (RIG)
The ‘implementation’ grants are intended to be a ‘next step’ for communities who have
received a ‘planning’ grant. These grants are available to communities that have a coastal
management element in their comprehensive plan and are ready to implement the projects or
plans that have already been designed. Funds are available annually for up to $500,000 per
community and projects must be completed within the fiscal year.

Appendix A – Wastewater Technologies Report
47 | Page
https://floridadep.gov/rcp/florida-resilient-coastlines-program/content/frcp-resilience-grants
6.4.St. Johns River Water Management District
6.4.1. District Cost-Share Funding
The District supports a cost-share funding program for projects that support core missions
including water quality. Project terms are up to two years and funding is available for up to 25%
of construction costs for water quality projects.
https://www.sjrwmd.com/localgovernments/funding/districtwide/
6.4.2. Indian River Lagoon Water Quality Improvement Projects
Available to counties and municipalities, public universities, and colleges, regional planning
councils, non-profit groups and the Indian River Lagoon National Estuary Program who are
within the district boundaries. The program provides $25 million annual to programs designed to
improve water quality including sept to sewer conversions. No match is required but is a positive
consideration during review.
https://protectingfloridatogether.gov/sites/default/files/documents/IndianRiverLagoon_PFT_
GrantInfoSheet_2.pdf
6.5.Florida Department of Economic Opportunity
6.5.1. Florida Small Cities Community Dev elopement Block Grant
This is a HUD program that provides grant funds to Florida for use in Florida small
communities to support projects that benefit communities with a majority (51%) of low to
moderate income residents. Available funds range from $18 - $26 million on a competitive basis.
These funds can be used to support wastewater improvement projects including new sewer or

Appendix A – Wastewater Technologies Report
48 | Page
water lines and septic abandonment in cities with less than 50,000 residents or counties with less
than 200,000 residents. There are some additional criteria that may be confusing but can be
easily explained by a program coordinator.
www.FloridaJobs.org/SmallCitiesCDBG
6.5.2. Regional Rural Development Grant
This program encourages neighboring rural counties to join together to pursue economic
and/or tourism development for the improvement of their communities. This may lead to projects
that improve quality of life for residents. There are some financial planning and match
requirements from the communities. Be sure to work with a coordinator for the best experience.
https://floridajobs.org/community-planning-and-development/community-
partnerships/regional-rural-development-grant
6.5.3. Rural Infrastructure Fund
These funds are available to communities whose infrastructure project will result in increased
employment, and/or capital investment and diversification in small communities. These projects
can include improvements to infrastructure. Here too, the criteria can be confusing but there are
many resources to help communities navigate the program.
http://www.floridajobs.org/RIF
6.5.4. Special District Accountability Program
“Counties and municipalities may create special districts to develop and/or maintain various
wastewater and sewer systems.” Creating a special district would enable the authority to raise
money through bond debt for construction and maintenance of the facility, and to charge fees or
tax assessments for repayment of the debt. (Gaskins 2021)

Appendix A – Wastewater Technologies Report
49 | Page
www.FloridaJobs.org/SpecialDistricts
7. CONCLUSIONS
The purpose of this document is to provide homeowners information on wastewater
treatment technologies for centralized and decentralized systems. The technologies for each are
very similar, just operating at different scales. Also important for homeowners is information on
costs and funding opportunities. Costs are very difficult to pin down exactly because there are so
many variables for both centralized and decentralized facilities. But hopefully the ballpark range
estimates provided are useful for context at least.
In the course of developing this report, we learned about some onsite treatment opportunities
that are not currently being used in Florida but may be useful given our special soil conditions.
One of these includes using a UV or chlorine disinfectant in onsite systems. This is a step that
would happen in the tank and would allow for complete treatment in the tank thus eliminating
the need for a drainfield. Discharge could take place on the property without issue (Groover
2021). This is not a treatment process that is used onsite in Florida yet so more research should
be done to make sure it’s viable, but it shows promise.
Another possibility is to incorporate buoyancy options for tanks that may be at risk from
flooding or storm surge (Groover 2021). These can prevent the tank from lifting out of the
ground if soils become saturated, an event that could introduce raw sewage property and
neighborhood.
This report covered a long list of funding opportunities to assist with septic upgrade or septic
to sewer conversion projects. These projects have garnered much attention in recent years,
especially here in Florida. But we also saw that these are expensive projects. While there are

Appendix A – Wastewater Technologies Report
50 | Page
many programs to help cover these costs one that hasn’t been discussed is Property Assessed
Financing. The PACE model (Property Assessed Clean Energy) is one that has been around for
awhile and has been used by homeowners to install solar panels and finance the project through
their property tax bill. In this way the cost for the upgrade is attached to the property not the
individual and the repayment period can be 10 to 20 years. There is some practical sense to this.
First, a septic to sewer upgrade is an upgrade to the property. If the homeowner sells the house
and moves away during the repayment period, the repayment stays with the properties new
owner(s), after all the seller would not dig up the pipe and take it with them. Spreading the
project costs out over a period of time may help some homeowners complete a project that were
not able to secure funds through other sources. These costs could be attached to a utility bill for
smaller monthly payments, instead of the annual property tax bill that may already be a hardship
for some homeowners (Office of Energy Efficiency & Renewable Energy and Energy.gov 2021).
Onsite wastewater treatment systems in low lying coastal areas face multiple risks from
climate change related impacts. These include flooding, storm surge, sea level rise and rising
groundwater levels for example. These impacts could flood drainfields leading to system failure,
raw sewage backing up into homes or being released above ground. As communities plan for
climate change, considering the impacts to septic systems should be included in adaptation and
resiliency plans. This resource provides homeowners information on the technologies of
different wastewater treatment systems, some examples of cost and funding opportunities to help
communities not just plan but pursue projects to reduce the risks to septic systems.

Appendix A – Wastewater Technologies Report
51 | Page
8. REFERENCES
“62-302 : SURFACE WATER QUALITY STANDARDS - Florida Administrative Rules, Law,
Code, Register - FAC, FAR, ERulemaking.” 2020. Florida Administrative Code &
Florida Administrative Register. October 4, 2020.
https://www.flrules.org/gateway/ChapterHome.asp?Chapter=62-302.
Cole, Marci L., Kevin D. Kroeger, J. W. Mcclelland, and I. Valiela. 2006. “Effects of Watershed
Land Use on Nitrogen Concentrations and Δ15 Nitrogen in Groundwater.”
Biogeochemistry 77 (2): 199–215. https://doi.org/10.1007/s10533-005-1036-2.
De, Mriganka. 2015. “Fate and Transport of Effluent-Borne Nitrogen from Septic Drainfields to
Shallow Groundwater.” Ph.D., United States -- Florida: University of Florida.
https://search.proquest.com/pqdtglobal/docview/1992363501/abstract/49C645D1B39A42
FAPQ/1.
Del Rosario, Katie L., Siddhartha Mitra, Charles P. Humphrey, and Michael A. O’Driscoll. 2014.
“Detection of Pharmaceuticals and Other Personal Care Products in Groundwater beneath
and Adjacent to Onsite Wastewater Treatment Systems in a Coastal Plain Shallow
Aquifer.” Science of The Total Environment 487 (July): 216–23.
https://doi.org/10.1016/j.scitotenv.2014.03.135.
Diaz-Elsayed, Nancy, Xiaofan Xu, Maraida Balaguer-Barbosa, and Qiong Zhang. 2017. “An
Evaluation of the Sustainability of Onsite Wastewater Treatment Systems for Nutrient
Management.” Water Research 121 (September): 186–96.
https://doi.org/10.1016/j.watres.2017.05.005.
FDOH. 2018. “State of Florida Department of Health Chapter 64E-6, Florida Administrative
Code Standards for Onsite Sewage Treatment and Disposal Systems.”

Appendix A – Wastewater Technologies Report
52 | Page
http://www.floridahealth.gov/environmental-health/onsite-sewage/forms-
publications/_documents/64e-6.pdf.
———. 2020. “Nitrogen-Reducing Systems ForAreas Affected by the Florida Springs and
Aquifer Protection Act.” http://www.floridahealth.gov/environmental-health/onsite-
sewage/products/_documents/bmap-n-reducing-tech-18-10-29.pdf.
Galbraith, Ed. 2018. “Recirculating Media Filter Operation and Maintenance.” Missouri
Department of Natural Resources. October 2018. https://dnr.mo.gov/pubs/pub2738.htm.
Goguen, Claude. 2018. “Taking Septic Tanks to the Next Level: Advanced Treatment.” National
Precast Concrete Association. January 9, 2018. https://precast.org/2018/01/taking-septic-
tanks-to-the-next-level-advanced-treatment/.
Groover, Roxanne. 2020. “OSTDS Advanced Tretment Options for Nitrogen Reduction.”
January 16.
———. 2021. Personal Communication.
Guildford, Stephanie J., and Robert E. Hecky. 2000. “Total Nitrogen, Total Phosphorus, and
Nutrient Limitation in Lakes and Oceans: Is There a Common Relationship?” Limnology
and Oceanography 45 (6): 1213–23. https://doi.org/10.4319/lo.2000.45.6.1213.
Gurpal S. Toor, Mary Lusk. 2019. “Onsite Sewage Treatment and Disposal Systems: Nitrogen.”
April 5, 2019. https://edis.ifas.ufl.edu/ss550.
Hallahan, Dennis. 2012. “Drainfield Media 101.” Text/html. Onsite Installer. Onsite Installer.
Https://www.onsiteinstaller.com/. January 2012.
https://www.onsiteinstaller.com/editorial/2012/01/drainfield_media_101.
———. 2021. “Combining Decentralized And Centralized Wastewater Treatment Strategies To
Solve Community Challenges.” Water Online. 2021.

Appendix A – Wastewater Technologies Report
53 | Page
https://www.wateronline.com/doc/combining-decentralized-and-centralized-wastewater-
treatment-strategies-to-solve-community-challenges-0001.
Harriss, Bart, and Marcelo Blanco. 2013. “Onsite Wastewater Concepts, Materials, Regulations
& The Application Process Part I.”
Humphrey, C. P., M. A. O’Driscoll, and M. A. Zarate. 2010. “Controls on Groundwater Nitrogen
Contributions from On-Site Wastewater Systems in Coastal North Carolina.” Water
Science and Technology 62 (6): 1448–55. https://doi.org/10.2166/wst.2010.417.
Humphrey, Charles P., Eliot Anderson-Evans, Michael O’Driscoll, Alex Manda, and Guy
Iverson. 2014. “Comparison of Phosphorus Concentrations in Coastal Plain Watersheds
Served by Onsite Wastewater Treatment Systems and a Municipal Sewer Treatment
System.” Water, Air, & Soil Pollution 226 (1): 2259. https://doi.org/10.1007/s11270-014-
2259-4.
Humphrey, C.P., M.A. O’Driscoll, N.E. Deal, D.L. Lindbo, S.C. Thieme, and M.A. Zarate-
Bermudez. 2013. “Onsite Wastewater System Nitrogen Contributions to Groundwater in
Coastal North Carolina.” Journal of Environmental Health 76 (5): 16–22.
Humphrey Jr., C. P., N. E. Deal, M. A. O’Driscoll, and D. L. Lindbo. 2012. “Characterization of
On-Site Wastewater Nitrogen Plumes in Shallow Coastal Aquifers, North Carolina,”
April, 949–58. https://doi.org/10.1061/41114(371)105.
Infiltrator Water Technologies. 2015. “Geosynthetic Aggregate Technology.”
https://www.infiltratorwater.com/Customer-Content/www/CMS/files/cutsheets/EZ01.pdf.
Iverson, G., C. P. Humphrey, M. A. O’Driscoll, C. Sanderford, J. Jernigan, and B. Serozi. 2018.
“Nutrient Exports from Watersheds with Varying Septic System Densities in the North

Appendix A – Wastewater Technologies Report
54 | Page
Carolina Piedmont.” Journal of Environmental Management 211 (April): 206–17.
https://doi.org/10.1016/j.jenvman.2018.01.063.
Jarrett, Paul. 2021. Personal Communication.
Kramer, Daniel Boyd, Stephen Polasky, Anthony Starfield, Brian Palik, Lynne Westphal,
Stephanie Snyder, Pamela Jakes, Rachel Hudson, and Eric Gustafson. 2006. “A
Comparison of Alternative Strategies for Cost-Effective Water Quality Management in
Lakes.” Environmental Management 38 (3): 411–25. https://doi.org/10.1007/s00267-005-
0011-y.
Lapointe, Brian E., Laura W. Herren, and Bradley J. Bedford. 2012. “Effects of Hurricanes,
Land Use, and Water Management on Nutrient and Microbial Pollution: St. Lucie
Estuary, Southeast Florida.” Journal of Coastal Research, November, 1345–61.
https://doi.org/10.2112/JCOASTRES-D-12-00070.1.
Lapointe, Brian E., Laura W. Herren, David D. Debortoli, and Margaret A. Vogel. 2015.
“Evidence of Sewage-Driven Eutrophication and Harmful Algal Blooms in Florida’s
Indian River Lagoon.” Harmful Algae 43 (March): 82–102.
https://doi.org/10.1016/j.hal.2015.01.004.
Lapointe, Brian E., Laura W. Herren, and Armelle L. Paule. 2017. “Septic Systems Contribute to
Nutrient Pollution and Harmful Algal Blooms in the St. Lucie Estuary, Southeast Florida,
USA.” Harmful Algae 70 (December): 1–22. https://doi.org/10.1016/j.hal.2017.09.005.
Lusk, Mary G., Gurpal S. Toor, Yun-Ya Yang, Sara Mechtensimer, Mriganka De, and Thomas
A. Obreza. 2017. “A Review of the Fate and Transport of Nitrogen, Phosphorus,
Pathogens, and Trace Organic Chemicals in Septic Systems.” Critical Reviews in

Appendix A – Wastewater Technologies Report
55 | Page
Environmental Science and Technology 47 (7): 455–541.
https://doi.org/10.1080/10643389.2017.1327787.
Mary Lusk, Gurpal S. Toor. 2018. “Onsite Sewage Treatment and Disposal Systems:
Phosphorus.” July 2, 2018. https://edis.ifas.ufl.edu/ss551.
NSF International. 2021. “Water and Wastewater Standards.” NSF International. 2021.
https://www.nsf.org/standards-development/standards-portfolio/water-wastewater-
standards.
O’Driscoll, Michael, Eban Bean, Robert N. Mahoney, and Charles P. Humphrey. 2019. “Coastal
Tourism and Its Influence on Wastewater Nitrogen Loading: A Barrier Island Case
Study.” Environmental Management 64 (4): 436–55. https://doi.org/10.1007/s00267-019-
01201-7.
Office of Energy Efficiency & Renewable Energy, and Energy.gov. 2021. “Property Assessed
Clean Energy Programs.” Property Assessed Clean Energy Programs. March 30, 2021.
https://www.energy.gov/eere/slsc/property-assessed-clean-energy-programs.
Oosting, Andrew, and Doug Joy. 2011. “A GIS-Based Model to Assess the Risk of On-Site
Wastewater Systems Impacting Groundwater and Surface Water Resources.” Canadian
Water Resources Journal / Revue Canadienne Des Ressources Hydriques 36 (3): 229–46.
https://doi.org/10.4296/cwrj3603882.
Paerl, Hans W. 2014. “Mitigating Harmful Cyanobacterial Blooms in a Human- and
Climatically-Impacted World.” Life 4 (4): 988–1012.
https://doi.org/10.3390/life4040988.
Parker, Brent, Dan Olson, Jessie Rolph Brown, Kati Bainter, and Jim Carroll. 2009. “Residential
Onsite Wastewater Treatment: An Overview.” Iowa Department of Natural Resources.

Appendix A – Wastewater Technologies Report
56 | Page
“Product Listings and Approval Requirements | Florida Department of Health.” 2021. March 9,
2021. http://www.floridahealth.gov/environmental-health/onsite-
sewage/products/index.html.
Reay, William G. 2004. “Septic Tank Impacts on Ground Water Quality and Nearshore
Sediment Nutrient Flux.” Groundwater 42 (7): 1079–89. https://doi.org/10.1111/j.1745-
6584.2004.tb02645.x.
Santos, Lúcia H. M. L. M., Meritxell Gros, Sara Rodriguez-Mozaz, Cristina Delerue-Matos,
Angelina Pena, Damià Barceló, and M. Conceição B. S. M. Montenegro. 2013.
“Contribution of Hospital Effluents to the Load of Pharmaceuticals in Urban
Wastewaters: Identification of Ecologically Relevant Pharmaceuticals.” Science of The
Total Environment 461–462 (September): 302–16.
https://doi.org/10.1016/j.scitotenv.2013.04.077.
Schneeberger, Chandra L., Michael O’Driscoll, Charles Humphrey, Keaton Henry, Nancy Deal,
Kathy Seiber, Vincent R. Hill, and Max Zarate-Bermudez. 2015. “Fate and Transport of
Enteric Microbes from Septic Systems in a Coastal Watershed.” Journal of
Environmental Health; Denver 77 (9): 22–30.
Shoaf Precast Inc. 2021. “Drain Line Products.” 2021. https://www.shoafprecast.com/drain-line-
products/.
SJRWMD. 2021. “Understanding Algal Blooms.” St. Johns River Water Management District.
May 9, 2021. https://www.sjrwmd.com/education/algae/.
Snyder, Shane A., Paul Westerhoff, Yeomin Yoon, and David L. Sedlak. 2003.
“Pharmaceuticals, Personal Care Products, and Endocrine Disruptors in Water:

Appendix A – Wastewater Technologies Report
57 | Page
Implications for the Water Industry.” Environmental Engineering Science 20 (5): 449–69.
https://doi.org/10.1089/109287503768335931.
Springfield Plastics, Inc. 2021. “Gravel-Less Leachfield.” 2021.
https://www.spipipe.com/pipe_gravel-less_leachfield.php.
Tchobanoglous, George, and Franklin Burton. 1991. Wastewater Engineering: Treatment
Disposal Reuse. 3rd ed.
US EPA, OW. 2018. “Types of Septic Systems.” Overviews and Factsheets. US EPA. November
15, 2018. https://www.epa.gov/septic/types-septic-systems.
Vajda, Alan M., Larry B. Barber, James L. Gray, Elena M. Lopez, John D. Woodling, and David
O. Norris. 2008. “Reproductive Disruption in Fish Downstream from an Estrogenic
Wastewater Effluent.” Environmental Science & Technology 42 (9).
https://doi.org/10.1021/es0720661.
Valiela, I., G. Collins, J. Kremer, K. Lajtha, M. Geist, B. Seely, J. Brawley, and C. H. Sham.
1997. “Nitrogen Loading from Coastal Watersheds to Receiving Estuaries: New Method
and Application.” Ecological Applications 7 (2): 358–80. https://doi.org/10.1890/1051-
0761(1997)007[0358:NLFCWT]2.0.CO;2.
Wang, Liying, Ming Ye, Paul Z. Lee, and Richard W. Hicks. 2013. “Support of Sustainable
Management of Nitrogen Contamination Due to Septic Systems Using Numerical
Modeling Methods.” Environment Systems and Decisions 33 (2): 237–50.
https://doi.org/10.1007/s10669-013-9445-6.
Weiskel, Peter K., Brian L. Howes, and George R. Heufelder. 1996. “Coliform Contamination of
a Coastal Embayment: Sources and Transport Pathways.” Environmental Science &
Technology 30 (6): 1872–81. https://doi.org/10.1021/es950466v.

Appendix A – Wastewater Technologies Report
58 | Page
Withers, Paul JA, Philip Jordan, Linda May, Helen P. Jarvie, and Nancy E. Deal. 2014. “Do
Septic Tank Systems Pose a Hidden Threat to Water Quality?” Frontiers in Ecology and
the Environment 12 (2): 123–30. https://doi.org/10.1890/130131.
Yang, Yun-Ya, Gurpal S. Toor, P. Chris Wilson, and Clinton F. Williams. 2016. “Septic Systems
as Hot-Spots of Pollutants in the Environment: Fate and Mass Balance of Micropollutants
in Septic Drainfields.” Science of The Total Environment 566 (October): 1535–44.
https://doi.org/10.1016/j.scitotenv.2016.06.043.
Ye, Ming. 2019. “Online Training on ArcNLET Part 1: Background of Nitrogen Pollution and
Software Overview.” Presented at the Online Training on ArcNLET, June.
9. TERMS
Aerobic – an oxygenated environment
Anaerobic - an environment without oxygen
Centralized – managed by a central authority
Decentralized – managed at the onsite or local level
Effluent –liquid leaving a wastewater treatment system or component of the system
Influent – liquid entering a wastewater treatment system or a component of the system
10. ABBREVIATIONS
ATU – Advanced Treatment Unit, sometimes also used for Aerobic Treatment Unit

Appendix A – Wastewater Technologies Report
59 | Page
BOD/CBOD – Biological Oxygen Demand/Carbonaceous Biological Oxygen Demand
CDBG – Community Development Block Grant
EPA – Environmental Protection Agency
FDEO/DEO – Florida Department of Economic Opportunity
FDEP/DEP – Florida Department of Environmental Protection
FDOH/DOH – Florida Department of Health
HUD – Housing and Urban Development
OSTDS – Onsite Treatment and Disposal System
PBTS – Performance Based Treatment System
SBG – Sequencing Batch Reactor
SLR – Sea Level Rise
STEP – Septic Tank Effluent Pumping
TN – Total Nitrogen
TP – Total Phosphorous
TSS – Total Suspended Solids
WWTF – Wastewater Treatment Facility