curricular choice and technical non-technical … choice and technical – non-technical balance in...
TRANSCRIPT

Paper ID #14422
Curricular Choice and Technical – Non-Technical Balance in EnvironmentalEngineering Degree Programs
Dr. Angela R. Bielefeldt, University of Colorado - Boulder
Angela Bielefeldt is a professor at the University of Colorado Boulder in the Department of Civil, Envi-ronmental, and Architectural Engineering (CEAE). She serves as the ABET assessment coordinator forthe department. Professor Bielefeldt is the faculty director of the Sustainable By Design Residential Aca-demic Program, a living-learning community where interdisciplinary students learn about and practicesustainability. Bielefeldt is also a licensed P.E. Professor Bielefeldt’s research interests in engineeringeducation include service-learning, sustainable engineering, social responsibility, ethics, and diversity.
Dr. Marissa H. Forbes, University of Colorado - Boulder
Marissa H. Forbes is a research associate at the University of Colorado Boulder and lead editor of theTeachEngineering digital library. She previously taught middle school science and engineering and wroteK-12 STEM curricula while an NSF GK-12 graduate engineering fellow at CU. With a master’s degree incivil engineering she went on to teach physics for the Denver School of Science and Technology (DSST),where she also created and taught a year-long, design-based DSST engineering course for seniors. Forbesearned her PhD in civil engineering, with an engineering education research focus.
Dr. Jacquelyn F. Sullivan, University of Colorado - Boulder
Jacquelyn Sullivan is founding co-director of the General Engineering Plus degree program in the Uni-versity of Colorado Boulder’s College of Engineering and Applied Science. She spearheaded designand launch of the Engineering GoldShirt Program to provide a unique access pathway to engineering forhigh potential, next tier students not admitted through the standard admissions process and the CU teachEngineering Program - creating a pathway to secondary math and science teacher licensure through engi-neering. Sullivan was conferred as an ASEE Fellow in 2011 and was awarded NAE’s 2008 Gordon Prizefor Innovation in Engineering and Technology Education.
c©American Society for Engineering Education, 2016

Curricular Choice and Technical – Non-Technical Balance in
Environmental Engineering Degree Programs
Abstract
Self-determination theory indicates that choice is an important component of motivation and
satisfaction. Further, calls for holistically trained engineers demand that students gain knowledge
in humanities and social science topics. This research explored top-ranked environmental
engineering bachelor’s degree programs with regards to: (1) opportunities for students to make
choices in their courses (such as free electives and technical electives); and (2) the balance of
required technical and non-technical courses in the curriculum. These metrics were compared
with chemical and civil engineering degrees, as well as mathematics, chemistry, and physics
degrees. The curricular requirements were determined using the 2013-2014 online university
catalogs, including counting and characterizing degree program credit hours as either technical
coursework (engineering, math, and natural science), non-technical coursework, or free electives.
Among the 19 environmental engineering degree programs explored in this study, free electives
ranged from 0 to 22% of the curriculum, with a median of 0%. The total amount of the
curriculum that allowed any level of choice ranged from 14 to 80%, with a median of 44%. This
shows a high degree of variability among top-rated environmental engineering programs in the
amount of course choices that students can make. By comparison, the median for all engineering
programs at top-ranked institutions was 3% free electives and 40% any type of choice. The
percentage of technical courses in the environmental engineering curricula ranged from 56 to
86%, with a median of 78%. The median across all engineering programs was very similar at
76% technical. The percentage of non-technical courses in the environmental engineering
curricula ranged from 13 to 36%, with a median of 20%; similar to the median of 21% across all
engineering programs. Degrees in math, chemistry, and physics had higher percentages of free
electives (median 18-19%) and total choice (65-81%), and lower technical requirements (median
47-54%), as compared to engineering degrees. The results demonstrate that environmental
engineering students have comparatively less choice and curricular balance that peers in natural
science and math. However, there are accredited and highly ranked environmental engineering
programs that allow both choice and greater curricular balance. These programs serve as
examples to others who may want to design programs that allow students to exercise their innate
need for autonomy and also balance their educational experience.
Introduction
Self-determination theory indicates that human beings have an innate psychological need for
autonomy, satisfied through choice.1,2 Choice is an important component of motivation and
satisfaction, and a tool to be utilized in educational settings1,2,12,13,14,15,16,17 to nurture beneficial
educational outcomes such as creativity, cognitive flexibility, self-esteem, increased engagement,
higher quality learning, intrinsic motivation, self-regulation, and well-being.1,2 Previous studies
have found that engineering programs are typically highly restrictive and present students with
few opportunities to explore academically through course choice opportunities, presenting a
hypothesized dissonance with students’ psychological and developmental needs, and therefore an
obstacle to participation in engineering programs.3,4 Across over 300 ABET Engineering
Accreditation Commission (EAC)-accredited engineering programs, for example, engineering
students were afforded a median of 2% of their undergraduate program as free electives,
compared to a median of almost one-fourth of non-engineering students’ degree programs.4 This
same work also found that engineering programs nationwide were highly skewed towards
technical content, a median of 78% of total degree coursework across 100 programs,4 despite
ABET’s requirement of only 62.5% technical content.5 The high technical content and minimal
free elective opportunity curricular model combination also infers minimal opportunity for
students to pursue a broad and balanced liberal engineering education.
Over a number of years teaching an introductory environmental engineering course19 for first
year students, some students described their intent to leave engineering due to the restrictive
curriculum and/or a desire for more balance between technical and non-technical courses. These
thoughts were revealed in their reflective essays at the end of the semester. For example, one
student described a desire for balance between technical and non-technical coursework:
Currently, I am unsure of whether or not I want to continue with the environmental
engineering program and become an engineer. Prior to attending CU, I was convinced I
was going to become an engineer and save the world…[but] I do not like how technical my
course schedule is. As I learned when I did [the course plan] for [environmental
engineering], there are relatively few slots open for humanities and social studies courses. I
consider myself a very creative person, and enjoy thinking creatively, and it seems there is
very little room for such thinking in the engineering program (at least until upper level
courses).
Another student voiced similar concerns about the heavy technical focus, writing:
I have decidedly changed my major out of environmental engineering for the rest of my
time at the University of Colorado. This isn’t to say that many aspects of environmental
engineering don’t appeal to me. The overall ability an environmental engineer has to help
various peoples and nations, I’m sure is incredibly rewarding…much more rewarding than
any paycheck. But even so, based upon my current classes and the course plan in order to
graduate with a degree, [the] amount of technical and computer training required for this
degree is unappealing to me. …I also enjoy the mathematical and scientific aspect of the
degree, [but] I am the most interested in the aspect that “[environmental engineering]
graduates have adequate understanding of the social, economic, political, and ethical
context of environmental problems and solutions”. Thus, from this semester and taking
Intro to Environmental Engineering, I have learned that overall I am interested in the
environmental aspect of the degree but not the engineering facet, which is why I have
decided to change my major.
Two students described a strong interest in a non-engineering field and a desire for a dual major
(one in journalism and the other in psychology), but were uncertain that the environmental
engineering curriculum could accommodate their wider interests. One student wrote:
I wanted to travel, work with local peoples, and actually teach them about sustainable
living, and not just in terms of water treatment but also in other areas such as better
agriculture and waste management techniques…. Despite all of this however, I am still
unsure whether or not environmental engineering is the right major for me. One of the
biggest reasons for this is because I am not sure I would be happy doing the amount of
math required in the engineering field. Also, after completing [the environmental
engineering course plan] I realized that I got much more excited about the classes dealing

with culture and the environment (i.e.: “people and the environment” and “global
development”) and it made me wonder whether or not environmental studies would fit me
better. Additionally, I am currently enrolled in the journalism school and I was hoping that
if I were to transfer into the engineering school, I could keep journalism as a second major.
However, after studying my four-year course plan, I realized it would be nearly impossible
to do both and still graduate on time. Moreover, I was really hoping I could go abroad at
some point during my college career, but with the strict requirements of [environmental
engineering] I came to the conclusion that studying abroad for credit would be a difficult
thing to do. All in all, I enjoyed taking this class and I think environmental engineering for
developing communities is something I would really enjoy doing in the future, however I
am not convinced that I would be happy with the amount of math required for the degree or
having to give up journalism and study abroad.
The other student with similar concerns wrote:
I feel that given my particular skill set (strong with science, love the environment, and am
good working with/ mitigating with people) it is my duty to become an environmental
engineer. I have always been passionate to figure out how things work, and environmental
engineering is a way to use that passion to hopefully change the world someday. However,
there are also things that I dislike about environmental engineering…the environmental
engineering major [course requirements]…this is a problem for me because it would
require much more schooling and less diversification of my course selection (which is a
problem for me because I am also extremely fascinated with psychology and would hard
pressed to choose one over the other)…I have my doubts over whether environmental
engineering is the major I will stay with if my ambitions can better be satisfied elsewhere.
These four quotes were chosen from a larger number of examples from a fall 2009 course
reflection assignment of environmental engineering students citing dissatisfaction with the
minimal course choice and non-technical opportunities in the ABET EAC-accredited
environmental engineering program at the University of Colorado Boulder (CU). It is uncertain
the extent to which these concerns are limited to the particular environmental engineering
curriculum at CU. Do environmental engineering degree programs around the U.S. generally
allow students sufficient course choices and a sufficient balance of technical/non-technical
coursework, or are other environmental engineering curricula similarly limited?
ABET EAC accreditation for all engineering degree programs requires 1-year of math and basic
natural sciences, 1.5-years of engineering coursework, and a general education component (an
unspecified quantity; in contrast to pre-EC2000 requirements for 0.5-year of humanities and
social sciences).5 Accreditation also requires demonstration that students have met 11 outcomes.
These outcomes span technical and professional competencies. Outcome (h) seems to refer to
non-technical competencies and the general education component, requiring “the broad
education necessary to understand the impact of engineering solutions in a global, economic,
environmental, and societal context.” 5 (p. 3) The program-specific criteria for environmental
engineering have additional restrictions, among the most restrictive of all specialty programs.
This may be the result of the large number of societies which are responsible for the criteria, led
by the American Academy of Environmental Engineers and Scientists and with seven
cooperating societies. The program specific criteria outline 15 knowledge/skill areas, some with
a high level of detail. For example, the specific types of chemistry knowledge are noted

(stoichiometry, equilibrium, and kinetics). In total, the curriculum requirements description is
142 words. Contrast these requirements with chemical engineering where the requirements were
set by a single lead society, articulate only eight areas, and are explained in 61 words. The civil
engineering criteria are similarly restricted as the environmental, specifying 15 areas, but
explained more concisely in 106 words.
Per an ABET program search (November 11, 2015), there are 67 accredited environmental
engineering (EnvE) 4-year degree programs in the U.S.6 Based on the year first accredited, the
number of accredited programs has been steadily rising since about 1990. The majority of the
programs accredited today were likely first accredited under the outcomes-based format of
EC2000 rather than the previous more prescriptive requirements. The general characteristics of
the 67 accredited programs are summarized in Table 1; in addition, 47 of the programs (70%) are
at public institutions and 20 are at private institutions. It is also important to note that some
formerly accredited EnvE programs have ceased. For example, Stanford’s EnvE program ceased
ABET accreditation after June 2015.7 South Dakota School of Mines and Technology has an
accredited Environmental Engineering degree but no longer offers the EnvE B.S. degree; EnvE
is now just an emphasis within the civil engineering degree.8 Thus, it is important to keep in
mind that the precise program situation can change rapidly.
Figure 1. Growth in Number of ABET EAC-accredited EnvE programs in the U.S.
The Environmental Engineering Body of Knowledge (BOK) outlined aspirational content for
bachelor’s degree programs in environmental engineering. It acknowledged the historical roots
of the environmental engineering discipline, stating “in the1980’s and 1990’s, environmental
engineering evolved into a stand-alone engineering discipline…engineers came to view this
discipline as separate from, albeit related to, allied engineering disciplines such as civil and
chemical engineering.”9 (p. 7). The BOK also recognized that a balance of technical and non-
technical abilities is important; “the environmental engineer practicing at full professional
capacity should have the technical breadth to relate to engineers and specialists from other
disciplines as well as the non-technical breadth to positively influence society and
stakeholders.”9 (p. 20) Expanding on the importance of non-technical competencies, humanities
0
10
20
30
40
50
60
70
1965 1975 1985 1995 2005 2015
Cu
mu
lati
ve N
um
ber
En
vE P
rogr
ams
Year First Accredited

and social sciences was among the 16 knowledge domains explicitly articulated in the EnvE
BOK. This knowledge domain was mapped to 10 of the 18 BOK outcomes: 6 - problem
formulation and conceptual analysis, 7 - creative design, 10 societal impact, 11 - contemporary
and global issues, 13 - professional and ethical responsibilities, 14 - effective communication, 15
- lifelong learning, 16 - project management, 17 - business and public administration, and 18 -
leadership.
Given the background related to individuals’ needs for autonomy and the importance that
engineers possess both technical and non-technical skills, the following research questions
motivated this study:
(1) To what extent do top-ranked environmental engineering programs allow students to make
choices in their courses (such as free electives and technical electives)?
a. How do choice opportunities in EnvE compare to chemical and civil engineering
degrees?
b. How do choice opportunities in EnvE compare to non-engineering degrees in chemistry,
math, and physics?
(2) What is the balance of required technical and non-technical courses in top-ranked
environmental engineering curricula?
a. How does the curricular balance in EnvE compare to chemical and civil engineering
degrees?
b. How do the technical course requirements in EnvE compare to non-engineering degrees
in chemistry, math, and physics?
The answers to these questions will form a picture of the state of choice and curricular balance in
environmental engineering, and might help others to consider modifications to their programs to
embrace concepts from self-determination theory and considering the diverse career pathways of
environmental engineering graduates.
Methods
It was desired to benchmark the choice and curricular balance in top ranked environmental
engineering degree programs. The US News & World Report specialty rankings for
environmental/environmental health in 2015 were consulted;10 this included 17 programs at
doctoral institutions among the top 20 list. However, only 10 of these schools offered
environmental engineering degrees; many of those without environmental engineering degrees
offered “civil and environmental” engineering degrees but these were typically accredited under
the civil engineering criteria. The U.S. News & World Report ranks undergraduate engineering
programs and specialty engineering programs based solely on assessment surveys of engineering
deans and senior faculty members, noting “Schools offering any courses in a specialty are
eligible to be ranked in that specialty area. The specialty rankings are not based on whether an
engineering program has specific undergraduate-level ABET accreditation in that specialty
area.”11
In order to expand the pool of environmental engineering programs being explored,
environmental engineering degrees from institutions where the overall engineering program was
ranked in the top-20 lists for doctoral and non-doctoral institutions from US News & World
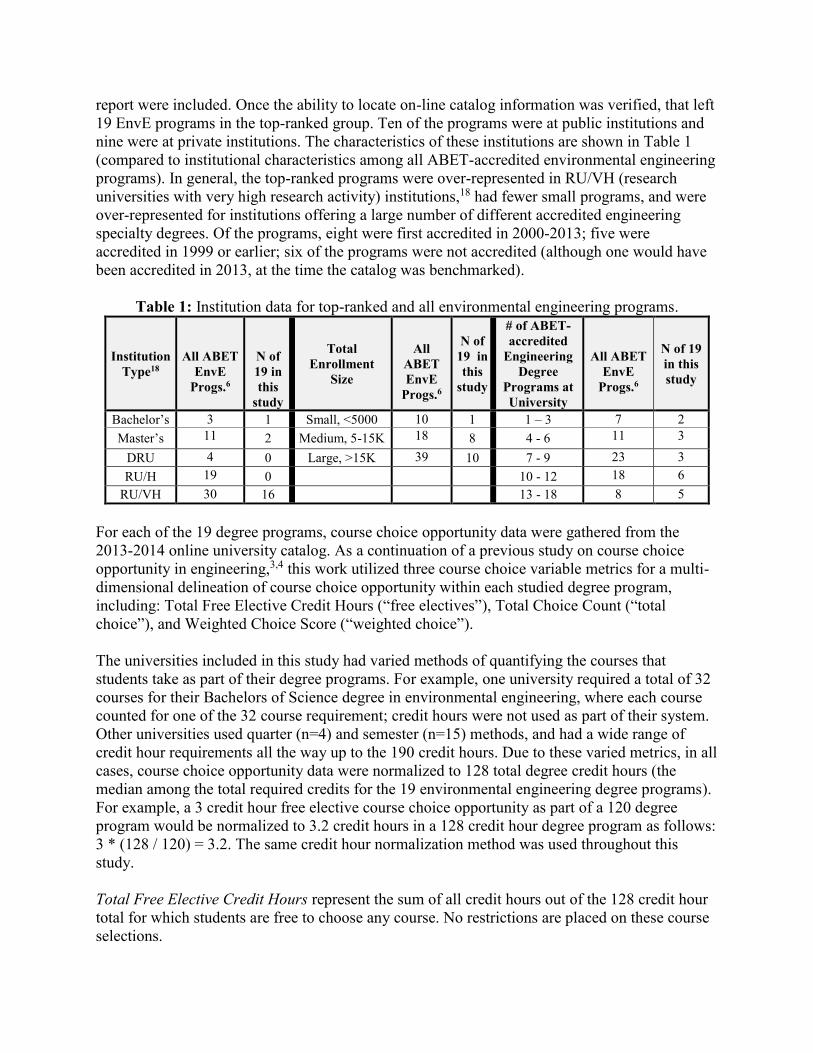
report were included. Once the ability to locate on-line catalog information was verified, that left
19 EnvE programs in the top-ranked group. Ten of the programs were at public institutions and
nine were at private institutions. The characteristics of these institutions are shown in Table 1
(compared to institutional characteristics among all ABET-accredited environmental engineering
programs). In general, the top-ranked programs were over-represented in RU/VH (research
universities with very high research activity) institutions,18 had fewer small programs, and were
over-represented for institutions offering a large number of different accredited engineering
specialty degrees. Of the programs, eight were first accredited in 2000-2013; five were
accredited in 1999 or earlier; six of the programs were not accredited (although one would have
been accredited in 2013, at the time the catalog was benchmarked).
Table 1: Institution data for top-ranked and all environmental engineering programs.
Institution
Type18
All ABET
EnvE
Progs.6
N of
19 in
this
study
Total
Enrollment
Size
All
ABET
EnvE
Progs.6
N of
19 in
this
study
# of ABET-
accredited
Engineering
Degree
Programs at
University
All ABET
EnvE
Progs.6
N of 19
in this
study
Bachelor’s 3 1 Small, <5000 10 1 1 – 3 7 2
Master’s 11 2 Medium, 5-15K 18 8 4 - 6 11 3
DRU 4 0 Large, >15K 39 10 7 - 9 23 3
RU/H 19 0 10 - 12 18 6
RU/VH 30 16 13 - 18 8 5
For each of the 19 degree programs, course choice opportunity data were gathered from the
2013-2014 online university catalog. As a continuation of a previous study on course choice
opportunity in engineering,3,4 this work utilized three course choice variable metrics for a multi-
dimensional delineation of course choice opportunity within each studied degree program,
including: Total Free Elective Credit Hours (“free electives”), Total Choice Count (“total
choice”), and Weighted Choice Score (“weighted choice”).
The universities included in this study had varied methods of quantifying the courses that
students take as part of their degree programs. For example, one university required a total of 32
courses for their Bachelors of Science degree in environmental engineering, where each course
counted for one of the 32 course requirement; credit hours were not used as part of their system.
Other universities used quarter (n=4) and semester (n=15) methods, and had a wide range of
credit hour requirements all the way up to the 190 credit hours. Due to these varied metrics, in all
cases, course choice opportunity data were normalized to 128 total degree credit hours (the
median among the total required credits for the 19 environmental engineering degree programs).
For example, a 3 credit hour free elective course choice opportunity as part of a 120 degree
program would be normalized to 3.2 credit hours in a 128 credit hour degree program as follows:
3 * (128 / 120) = 3.2. The same credit hour normalization method was used throughout this
study.
Total Free Elective Credit Hours represent the sum of all credit hours out of the 128 credit hour
total for which students are free to choose any course. No restrictions are placed on these course
selections.

Total Choice Count is the sum of all credit hours out of the 128 credit hour total for which
students get to make some kind of choice in the course they take. These choices could include
free electives, technical electives, humanities electives, etc., or simply getting to pick a writing
class out of two options.
Weighted Choice Score adds a dimension of magnitude to total choice. To calculate the weighted
choice for a given degree program, the course choice opportunity credit hours for the program
were categorized as either: 1. courses chosen from a list of options (such as multiple options for a
statistics or earth science lab course), 2. courses chosen from one department, 3. Courses chosen
from more than one department, or 4. free electives (Table 2).
Table 2. Weighted Choice Score course choice opportunity categories and weights.
Category Definition Examples Weight Weight
Fraction
1 Courses chosen from a list of
options.
“Choose 2 of the following 4 courses”
“Choose one course from the
following list of options” 3 0.0023
2 Courses chosen from one
department or engineering electives.
“Physics elective,” “History elective,”
“Mechanical Engineering elective” 22 0.0170
3
Course choices outside of
engineering, chosen from more than
one department (but not a free
elective).
“social sciences elective,” “humanities
elective”, “technical elective”
88 0.0681
4 Free electives. These course choice opportunities
have no restrictions. 1292 1
The weights for each matrix category were designed to capture the magnitude of choice for each
type of course choice opportunity. The weighted values originated from a five-university pilot
study3 wherein the actual numbers of courses students got to pick from for each course choice
opportunity were counted; the weights for each category in Table 2 were the median course
count values from the pilot study. These weights were then normalized to the weight of the free
elective category to produce a weighted fraction. From the counts and the category weights, the
Weighted Choice Score (WCS) for a program was calculated:
WCS = Ʃ (number of credits in category * weighted fraction for the category)
Comparators. The data for the choice metrics gains more relevance when it is contextualized
against other engineering degree programs and non-engineering degrees. Forbes4 previously
calculated the choice metrics for top-ranked chemical and civil engineering degree programs;
environmental engineering often shares roots in these disciplines and therefore these degree
programs will be used as comparators. Further, Forbes4 computed choice metrics for the median
of all engineering specialty degrees at the top-ranked doctoral and non-doctoral institutions;
these values also provide a basis for comparison. Finally, Forbes4 computed choice metrics for
five non-engineering degrees at institutions with the top-ranked engineering programs. For each
institution the median choice across math, chemistry, physics, economics, and psychology were
computed.

Microsoft Excel 2013 was used for data collection and calculations of university choice variable
data for this study. Statistical analyses were performed using SPSS and MVPstats. Because the
data were ordinal based on counts, non-parametric statistics were used. Mann-Whitney U tests
were used to detect statistically significant differences between two independent samples of
ordinal data and the Spearman Rank Correlation statistical test was used to test for coefficients of
association between ordinal variables. In all cases tests were two-tailed, with significance levels
of α=0.05.
Box-and-whisker plots will be used to visualize the data; these show the median (the center of
the box), the first quartile (Q1, lower, darker shaded extent of the box), third quartile (Q3, upper,
light gray extent of the box), and maximum (upper extent of whisker) and minimum (lower
extent of whisker); statistical outliers are also shown and may extend beyond the whiskers.
Results and Discussion
Choice in environmental engineering programs
First, it was found that the majority of the environmental engineering programs in this study
afforded very few free elective opportunities to students (Figure 2). Ten of the 19 programs
allowed no free elective credits, resulting in a median of zero free electives (thus no lower part of
the box-plot visible in Figure 2). There were three programs that allowed 2.0-3.8 credits of free
electives (1.6-3.0% of the curriculum), as well as 5 programs that allowed 11.3 to 16 credits of
free electives (8.8-12.5%; including 3 accredited programs) and 1 that allowed 28.4 credits of
free electives (this program is not accredited). The results indicate that a few programs allow
students flexibility to avail themselves of any course of their choosing. Free electives in a
curriculum could be particularly beneficial for allowing student in-migration from non-
engineering disciplines and allowing those students a chance at on-time graduation.
Within the total choice count, a wide range of choice is evident, ranging from 22 to 80% of the
curriculum (median of 44% or 56 credits, see Figure 2). In all cases, a significant portion of this
choice lies within technical coursework – ranging from 22-75%. The technical coursework
requirements with choice ranged from 7.5 to 76.6 credits (6-60% of the overall curriculum). In
some cases these choices are very minor, such as a choice between two different chemistry
courses. In other cases these are wider “technical electives” that encompass a very broad range of
options across any engineering and many natural science disciplines.
The weighted choice scores also show significant variability across the 19 environmental
engineering degree programs (Figure 2). Given the weighting of the various course choice
categories, in programs with free electives those courses determined the majority of the weighted
choice score. Thus, the six programs with the highest percentage of free electives also had the six
highest weighted choice scores. However, the contribution of additional choice types is also
evident. Three programs had very low weighted choice scores, which ranged from 0.20 to 0.80.

Figure 2. Free elective, total, and weighted course choice opportunity for 19 environmental
engineering programs, with overlay of box-and-whisker plot to reflect Q1, median, and Q3.
Choice comparisons between institution types
Some institution types had significant differences in the amount of choice in their environmental
engineering curricula (Table 3). The private institutions had more total choice credits and higher
Weighted Choice Scores than public institutions. Programs at medium and small institutions had
somewhat more weighted choice as compared to large institutions. There were not significant
choice differences between EAC and non-EAC accredited EnvE programs.
Table 3. Comparison of median choice metrics for environmental engineering programs at
different types of institutions
Institution Type
Median
Free Elective
Credits
Median
Total Choice
Credits
Median
Weighted
Choice
Not Accredited (n=6)
Accredited (n=13)
7.5
0 .281
73
53 .487
8.5
2.4 .210
Private (n=9)
Public (n=10)
3.8
0 .315 75
45 .010 5.2
1.4 .043
Large (n=10)
Medium+Small (n=9)
0
3.8 .315
46
68 .278
1.9
5.2 .095
Superscript = Independent-samples Mann Whitney U Test sig.

The impact of institution size was confirmed by correlation analysis (Table 4), which found
weighted choice weakly negatively correlated with the undergraduate population at the
institution; this indicates that EnvE programs at larger institutions tend to offer fewer overall
weighted choice opportunities to environmental engineering students. This represents a
combination of fewer choices and/or lower flexibility choices. No other correlations between
choice metrics and quantitative institution characteristics were found.
Table 4. Spearman’s rho correlation values for environmental engineering program choice
metrics and institutional characteristics
Choice Metric Undergraduate
Population
Undergraduate
Engineering
Population
# Eng Specialty
Degrees Accred
Free electives -0.293 .223 -0.260 .283 0.163 .504
Total choice -0.356 .135 -0.102 .679 -0.114 .643
Weighted choice -0.404 .087 -0.388 .101 0.002 .994
Superscripts are the sig. (2-tailed)
Choice comparisons between environmental engineering and other majors
Environmental engineering students had few choices, similar to other engineering majors and
lower than non-engineering comparators (previously calculated4). As shown in Table 5, the
median values for environmental engineering degrees for each of the three choice metrics was in
the range of the medians for top-ranked chemical and civil engineering degree programs, as well
as engineering majors at top ranked institutions in general (see Appendix A for corresponding
figures). The results indicate that students are unlikely to be impacted in their type of engineering
major based on choice disparity. In contrast, students may be unlikely to enter engineering from
non-engineering majors due to its restrictiveness on course choices, and may be lured into other
disciplines due to greater choice opportunities (Table 6). For example, chemistry programs at
institutions with top-ranked engineering programs offered a median of 22 free elective credits
(17% of the requirements). This greater choice in non-engineering disciplines is complemented
by fewer overall required credits to graduate – for example, a median of 124 credits for
chemistry (overall; 124 credits for chemistry B.S. and 120 credits for chemistry B.A., 124 credits
for math B.S. and 120 credits for math B.A., 126 credits for physics B.S. and 120 credits for a
physics B.A.). Thus, a college experience that offers both choice and on-time graduation is
perhaps more achievable via a switch out of environmental engineering into a related discipline.

Table 5. Comparison of median choice metrics for different degree programs.
Choice
Variable
EnvE
(n=19)
Chemical
(n=22)
Civil
(n=19)
All Eng
(n=38) Non-engineering*
Total Free
Elective
Credit
Hours
Env = 0.0 Chem = 0.0
Civil = 0.7 ENG = 3.6
Non-Eng = 30.9
physics = 20
chemistry = 22
math = 28
Total
Choice
Count Env = 56.0
Chem = 43.9 Civil = 64.0 ENG = 50.8
Non-Eng = 96.0
physics = 81
chemistry = 77
math = 97
Weighted
Choice
Score
Env = 2.6
Chem = 1.9
Civil = 2.4
ENG = 4.5
Non-Eng = 32.9
physics = 21
chemistry = 24
math = 32 *Non-engineering n = 244; Physics n = 56; Chemistry n = 49; Math n = 56
Table 6. Mann Whitney-U p-values (2-tailed significance) for 19 environmental engineering
program choice metrics versus choice metrics for different programs from Table 5.
Choice Metric EnvE v.
Chemical
EnvE v.
Civil
EnvE v.
All Eng
EnvE v.
Phys, Chem, Math
Free electives 0.375 0.906 0.747 0.000
Total choice 0.323 0.342 0.559 0.000
Weighted choice 0.507 0.949 0.839 0.000
High Choice Exceptions
Among the 19 environmental engineering programs, the four with the highest scores in each
choice category were identified as “high choice exceptions” (HCEs; shaded yellow in Table 7).
This resulted in the identification of seven HCE programs, since six of the programs were high
choice exceptions across multiple choice metrics. Three of the HCE programs were not ABET-
accredited, 71% were at private institutions, and 57% were small or medium sized institutions.
There were a couple of distinct patterns apparent. Schools that were consistently high in all three
choice metrics were A, B, and F. Schools C and G had fairly low total choice but relatively high
free electives; thus a large percentage of the choice given to students was in the form of free
electives (24-27%). Schools D and E gave students a lot of very small “menu-type” choices and
but no free electives, resulting in average weighted choice scores. The results indicate that there
are curricular designs that can achieve ABET accreditation and high rankings while also
allowing students to exercise their need for autonomy by choosing some of their courses. Of
note, in a previous study universities A, B, C, and E we also identified as providing exceptionally
high course choice opportunities to students across all engineering programs in the college.4 For
these universities, the exceptional course choice opportunities in environmental engineering are
perhaps reflections of overall institutional philosophies that lent themselves to more choice-
oriented engineering programs in all disciplines.

Table 7. Choice metrics from high choice exception (HCE) environmental engineering degree
programs
Institution Characteristics EnvE.
Rank
Free
Electives
Total
Choice
Weighted
Choice
A Private, medium NR 28.4 82 30.3
B Private, medium, ABET Top 10 16 80 18.0
C Private, medium, ABET NR 13.3 56 14.7
D Private, large, ABET Top 20 0 103 2.6
E Private, medium Top 10 0 88 2.3
F Public, large NR 12.8 85 13.0
G Public, large, ABET Top 10 12.0 45 13.1
Median of 7 HCE programs 12.8 82 13.1
Median of All 19 EnvE programs 0 56 2.6 NR = environmental engineering program not ranked in top 20; engineering undergraduate program as a
whole ranked in the top 20
Curricular Balance
Beyond the issue of choice for students, it was of interest to explore the balance between
technical (engineering, math, natural science) and non-technical coursework. In the
environmental engineering degree programs (Figure 3), there was a median of 42% required
engineering coursework, 78% required technical coursework, 18% non-technical coursework,
and 23% possible non-technical coursework (free + required non-technical). The minimum
requirement for technical coursework under ABET EAC accreditation is 2.5-years of a 4-year
curriculum or 62.5% of the coursework; for the median 128-credit environmental engineering
degree in this study, that represents 80 credit hours. One of the non-accredited programs was
below this level of technical content at 55.6% (71 credits); this program will be discussed further
below. For required non-technical coursework, this median represents about one 3-credit non-
technical course per semester and slightly over four 3-credit technical courses per semester.

Figure 3. Required engineering coursework, required technical coursework, required non-
technical coursework, and possible non-technical coursework (free electives + required non-
technical coursework) for 19 environmental engineering programs.
The technical – non-technical balance in environmental engineering programs is similar to other
engineering disciplines but far lower than non-engineering STEM peers at the institutions with
top-ranked engineering programs (Table 8). At worst, the ratio of required non-technical
coursework to technical coursework in environmental engineering was 0.16 (16.0 credits
required non-technical / 100.0 credits required technical), while at best it was 0.57 (45.5 credits
required non-technical / 80.4 credits required technical) (median 0.23). By comparison, for
chemistry degrees, the ratios ranged from 0.25 (24.9 credits required non-technical / 100.3
credits required technical) to 1.33 (41.3 credits required non-technical / 31.0 credits required
technical; this program was a B.A.), with a median of 0.44.

Table 8. Median credit hours of different types of coursework in the curriculum
Course
Type
Environmental
(n=19)
Chemical
(n=22)
Civil
(n=19)
All Eng
(n=38) STM Degrees*
Technical 100.0 101.0 .786 100.0 .568 98.2 .137
Chem 67.8 .000
Math 58.9 .000
Physics 70.4 .000
Non-
technical 23.5 24.5 .828 25.6 .392 26.4 .162
Chem 32.0 .000
Math 37.1 .000
Physics 34.6 .000
Possible
non-
technical
28.0 27.0 .684 28.0 .568 29.8 .145
Chem 58.9 .000
Math 69.12 .000
Physics 57.6 .000 *
Chemistry n = 49; Math n = 56; Physics n = 56
Superscripts are the Mann-Whitney U sig. (2-tailed) for comparison with the 19 EnvE programs.
Between institution types (small-medium vs. large, private vs. public, and accredited vs. non-
accredited) there were not significant differences in the percentage of the curriculum that was
required technical coursework, non-technical coursework, or possible non-technical (Mann-
Whitney U test, sig. all 0.133 or more); Table 9. However, the private institutions had somewhat
lower technical requirements and allowed higher possible non-technical coursework as compared
to public institutions.
Table 9. Institution types and median percentage of course types in the environmental
engineering curriculum.
Institution Type % required
technical
% required
non-technical
% possible
non-technical
Large (n = 10)
Medium+Small (n = 9)
79
76 .156
17
21 .278
17
24 .133
Private (n = 9)
Public (n = 10)
76
80 .065
21
16 .133
24
16 .095
Not Accredited (n = 6)
EAC Accredited (n = 13)
75
78 .244
17
20 .898
23
22 .152
Superscripts are the sig. (2-tailed)
Exceptional environmental engineering programs that offered students more balance were
identified (Table 10). These five “high non-technical exception” (HNTE) programs included the
three with the lowest required technical coursework, the three with the highest non-technical
coursework required, and the three with the highest possible non-technical coursework. Of the
five HNTE programs, four were at private, medium sized institutions. Institution A would fail to
meet ABET requirements, which specify 1-year of math and natural sciences and 1.5 years of
technical coursework, which is a total of 2.5 / 4 years or 63%. As shown by comparing
institution B, it is possible to accredit a program with the minimal amount of required technical
content.

Table 10. Environmental engineering programs with high non-technical balance.
Institution Characteristics
% required
technical
courses
% required
non-technical
courses
Maximum %
possible non-
technical
courses
A
E
B
C
H
Private, medium
Private, medium
Private, medium, ABET
Private, medium, ABET
Public, large, ABET
56
63
63
69
75
22
36
25
21
25
44
36
38
31
25
Median of 5 HNT programs 63 25 36
Median of All 19 EnvE programs 78 18 22
All five of the HNTE programs were also among the eight most flexible programs. This alludes
to the fact that perhaps most of the choice frequently resides in the non-technical coursework.
However, this was not found to be the case. The median percentage of the total choice that was
due to technical course choice was 48% (range 22% to 75%). Therefore, it rather appears that
these environmental engineering programs have a curriculum development philosophy that
embraces the importance of both non-technical coursework and choice. It is interesting that all
five of the universities with HNTE environmental engineering programs were also identified in a
previous study as providing exceptional course choice opportunities to students across all
engineering programs in the college,4 perhaps an indication that these universities value both
curricular choice and balance. Universities A, E, and B have also previously been found to have
other engineering programs (including mechanical, electrical, and civil) with comparatively high
non-technical requirements,4 again suggesting that the HNTE environmental engineering
programs were influenced by institutional philosophies that value curricular balance and the non-
technical components of an undergraduate engineering education.
Summary and Conclusions
This study presented an opportunity to take stock of current environmental engineering curricular
models to assess whether they can be improved to better align with students’ innate
psychological need for autonomy and the need for engineers to possess both technical and non-
technical skills. The results demonstrate that, like their engineering peers, environmental
engineering curricula tend to offer little choice to their students as compared to non-engineering
disciplines. Based on the studied population of programs, environmental engineering students are
unlikely to be impacted in their type of engineering major based on choice disparity, but students
may be unlikely to enter engineering from non-engineering majors due to its restrictiveness on
course choices, and may be lured into other disciplines due to greater choice opportunities. The
greater choice in non-engineering disciplines is complemented by fewer overall required credits
to graduate. Thus, a college experience that offers both choice and on-time graduation is perhaps
more achievable via a switch out of environmental engineering into a related discipline.
However, this minimal choice tendency in environmental engineering programs is not
universally true. There are highly ranked, ABET-accredited environmental engineering programs
that offer more choices to their students in terms of free electives, total course choice
opportunities, and the magnitude of those opportunities. Though the majority of the

environmental engineering programs in this study afforded very few free elective opportunities
to students, for example, several exceptional programs offer considerable free elective
opportunities. Free electives in a curriculum could be particularly beneficial for allowing student
in-migration from non-engineering disciplines and allowing those students a chance at on-time
graduation.
The results also demonstrate that the technical—non-technical balance in environmental
engineering programs is similar to other engineering disciplines but far lower than non-
engineering STEM peers at the institutions with top-ranked engineering programs. Again, this
tendency is not universally true, and exceptional environmental engineering programs were
identified that offered students a more balanced curriculum. Here again, free electives provide an
avenue for students to customize the technical—non-technical balance of their degree program
with the ability to devote their free elective credit hours to technical or non-technical pursuits,
per their own interests. Free elective opportunities additionally make it more navigable for
students to pursue minors, certificates, or study abroad opportunities.
Further research is needed to explore how environmental engineering students perceive the
opportunity for choice and the balance of technical/non-technical courses in their programs. For
example, some students prefer highly technical programs and disdain being forced to take what
they view as “useless” humanities and social science courses.20 Some students seem to flounder
when selecting their electives from broad ranges of options – such as fairly open technical
electives or free electives. Other students appear to desire choice, and particularly value the
opportunity to take advantage of the breadth of course opportunities available in college. Are
environmental engineering students more similar to peers in engineering, environmental science,
or environmental studies in their preferences for choice and non-technical coursework? Are there
differences in the preferences for choice and non-technical coursework between students from
different demographic groups (gender, race, socio-economic status, etc.)? Future qualitative
studies may shed light on these questions.
Further research should also be conducted to query faculty about the philosophy that guided the
design of the environmental engineering curricula. Were faculty designing the course
requirements to prepare students to become professionally licensed environmental engineers in
the future? If so, a constrained and technically-focused program may seem a necessity, in order
to meet the Body of knowledge.9 Alternatively, if faculty view the Master’s degree as a pre-
requisite for professional licensure, this may give them more flexibility in their Bachelor’s
degree programs.21 Another way to frame the discussion may be to consider the two cultures of
engineering – one professional and one industrial.21 A very different mindset often drives
curricular design in liberal arts, where they view college as an opportunity for exploration and
personal growth rather than vocational training. The different educational approaches will bring
different types of students into the workforce, but the extent to which students are aware that
different options exist to earn an environmental engineering bachelor’s degree is unknown.
The exceptional accredited and highly ranked environmental engineering programs that allow
both choice and greater curricular balance serve as examples to others who may want to design
their programs that allow students to exercise their innate need for autonomy and also balance
their educational experience. Faculty should carefully consider these issues among other factors

as they update and modify the curricular requirements in environmental programs at their
institutions.
References 1Ryan, R. M., & Deci, E. L. (2000). Self-Determination Theory and the Facilitation of Intrinsic Motivation, Social
Development, and Well-Being. American Psychologist, 55(1), 68-78. 2Deci, E. L., Vallerand, R. J., Pelletier, L. G., & Ryan, R. M. (1991). Motivation and Education: The Self-
Determination Perspective. Educational Psychologist, 26(3, 4), 325-346. 3Forbes, M.H., Bielefeldt, A.R., & Sullivan, J.F. (2015). The Choice Opportunity Disparity: Exploring Curricular
Choice Opportunities for Engineering vs. Non-Engineering Majors. Proceedings, ASEE Annual Conference
& Exposition, Seattle, WA, June. 4Forbes, M.H. (2015). Course choice opportunity and technical – non-technical balance in undergraduate
engineering education. Ph.D. Dissertation, University of Colorado Boulder. 5The Accreditation Board of Engineering and Technology. Retrieved September 4, 2015.
http://www.abet.org/accreditation/accreditation-criteria/criteria-for-accrediting-engineering-programs-2015-
2016/ 6The Accreditation Board of Engineering and Technology Program Search. Retrieved December, 2015.
http://main.abet.org/aps/accreditedprogramsearch.aspx 7Stanford University, Environmental Engineering Program. Retrieved November 13, 2015.
http://web.stanford.edu/group/ughb/cgi-bin/handbook/index.php/Environmental_Engineering_Program 8South Dakota School of Mines and Technology, Environmental Engineering Program. Retreived November 13,
2015. http://www.sdsmt.edu/Academics/Departments/Civil-and-Environmental-Engineering/Undergraduate-
Education/ 9American Academy of Environmental Engineers (AAEE). (2011). Environmental Engineering Body of
Knowledge. 10US News & World Report 2015-16. US News & World Report, 2015. 11US News. Best Undergraduate Engineering Programs Methodology. Posted Sept. 8, 2015.
http://www.usnews.com/education/best-colleges/articles/undergraduate-engineering-programs-
methodologyAccessed Nov. 13, 2015. 12Stefanou, C. R., Perencevich, K. C., DiCintio, M., & Turner, J. C. (2004). Supporting autonomy in the classroom:
Ways teachers encourage student decision making and ownership. Educational Psychologist, 39(2), 97-110. 13Assor, A., Kaplan, H., & Roth, G. (2002). Choice is good, but relevance is excellent: Autonomy‐enhancing and
suppressing teacher behaviours predicting students' engagement in schoolwork. British Journal of
Educational Psychology, 72(2), 261-278. 14Jones, B. D. (2009). Motivating Students to Engage in Learning: The MUSIC Model of Academic Motivation.
International Journal of Teaching and Learning in Higher Education, 21(2), 272-285. 15Jones, B. D., & Wilkins, J. L. (2013). Testing the MUSIC Model of Academic Motivation through confirmatory
factor analysis. Educational Psychology, 33(4), 482-503. 16Vanasupa, L., Stolk, J., & Harding, T. (2010). Application of self-determination and self-regulation theories to
course design: Planting the seeds for adaptive expertise. International Journal of Engineering Education,
26(4), 914. 17Vanasupa, L., Stolk, J., & Herter, R. J. (2009). The Four Domain Development Diagram: A Guide for Holistic
Design of Effective Learning Experiences for the Twenty‐first Century Engineer. Journal of Engineering
Education, 98(1), 67-81. 18The Carnegie Classification of Institutions of Higher Learning. Indiana University, Bloomington, IN. Retrieved
January 24, 2015. http://carnegieclassifications.iu.edu/ 19Bielefeldt, A.R. (2010). Evolution of a Sustainability Focused First-Year Environmental Engineering Course.
Proceedings, ASEE Annual Conference & Exposition, Louisville, KY, June. 20Bielefeldt, A.R. (2016). Infusing Macroethical Ideas into a Senior Engineering Course. Proceedings, ASEE Annual
Conference & Exposition, New Orleans, LA, June. 21Walker, H.W. (2012). Policy 465: Latest Struggle in the “Revolt of the Engineers”. Journal of Professional Issues
in Engineering Education and Practice, 138 (4), 283-288.

Appendix A: Comparison of median choice metrics for different degree programs.
Note: Each “Univ. Eng. Median” value represents the median free elective credit hours across all
engineering programs at a given university.
Figure A.1. Comparison of Total Free Elective Credit Hours for different degree programs.

Note: Each “Univ. Eng. Median” value represents the median credit hours with choice across all
engineering programs at a given university.
Figure A.2. Comparison of Total Choice Counts for different degree programs.

Note: Each “Univ. Eng. Median” value represents the median weighted choice score across all engineering
programs at a given university.
Figure A.3. Comparison of Weighted Choice Scores for different degree programs.