cuticular hydrocarbon composition reflects genetic - irbi
TRANSCRIPT

Cuticular Hydrocarbon Composition Reflects GeneticRelationship Among Colonies of the Introduced TermiteReticulitermes santonensis Feytaud
Stephanie Dronnet & Caroline Lohou & Jean-Philippe Christides &
Anne-Genevieve Bagneres
Received: 14 June 2005 / Revised: 8 September 2005 /Accepted: 24 January 2006 / Published online: 21 May 2006# Springer Science + Business Media, Inc. 2006
Abstract Nestmate recognition plays a key role in kin selection to maintain colonyintegrity in social insects. Previous studies have demonstrated that nestmaterecognition is dependent on detection of cuticular hydrocarbons. However, theabsence of intraspecific aggression between some colonies of Isoptera and socialHymenoptera questions whether kin recognition must occur in social insects. Thepurpose of this study was to determine if cuticular hydrocarbon similarity and highgenetic relatedness could explain the lack of intraspecific aggression among andwithin colonies of the introduced subterranean termite Reticulitermes santonensis.We performed both GC analysis of cuticular hydrocarbons and genotyping by using10 DNA microsatellite loci on the same 10 workers from each of 14 Parisiancolonies. Multivariate analyses demonstrated correspondence between cuticularhydrocarbon patterns and genetic variation. By using a redundancy analysiscombining chemical and genetic data, we found that a few hydrocarbons (mainlyshort vs. long chains; saturated vs. unsaturated alkanes) were associated with mostgenetic variation. We also found a strong positive correlation between chemical andgenetic distances between colonies, thus providing evidence of a genetic basis forcuticular hydrocarbon variation. However, genetic distance did not account for allchemical variation, thus suggesting that some hydrocarbon variation was environ-mentally derived. Investigation at the intracolony level indicated that cuticularhydrocarbons did not depend on colony social structure. Based on our findings, wespeculate that the absence of intraspecific aggression in R. santonensis may result
J Chem Ecol (2006) 32: 1027–1042DOI 10.1007/s10886-006-9043-x
S. Dronnet (*) . J.-P. Christides . A.-G. BagneresInstitut de Recherche sur la Biologie de l’Insecte, UMR CNRS 6035,Faculte des Sciences et Techniques,Parc Grandmont, Universite Francois Rabelais,37200 Tours, Francee-mail: [email protected]
C. LohouCirconscription des Etudes vegetales, Direction des Parcs,Jardins et Espaces Verts, 1 avenue Gordon Benett, Ville de Paris, France

from a loss of diversity in genetically derived recognition compounds in this speciesthat presumably descended from R. flavipes populations imported from NorthAmerica.
Keywords Cuticular hydrocarbons . Microsatellite DNA . Subterranean termite .
Reticulitermes santonensis . Multivariate analyses . Social structure
Introduction
In social insects, the ability to distinguish among individuals from different coloniesof the same or different species is essential to prevent competition, predation, andparasitism (Wilson, 1971). Nestmate recognition is also required for kin selectionthat is essential for maintenance of eusocial behavior (Hamilton, 1964). In mostcases, discrimination of unrelated individuals triggers aggressive behavior, but thismay not always be the case. Aggressive behavior is not observed between coloniesof arboreal nesting termite species (Leponce et al., 1996), dampwood Zootermopsisspecies (Haverty and Thorne, 1989), and subterranean species such as Coptotermesformosanus (Su and Haverty, 1991; Husseneder and Grace, 2001) and Reticulitermesflavipes (Grace, 1996; Bulmer and Traniello, 2002).
In France, colonies of the subterranean termite R. santonensis never displayintraspecific aggression regardless of the geographic distances among populations(Clement, 1986; Clement and Bagneres, 1998; Vieau, 2001). Many studies supportthat R. santonensis descended from one or more populations of R. flavipes importedfrom North America (see Dronnet et al., 2004, 2005a; Austin et al., 2005). Based onthis assumption, the nonaggressive behavior of R. santonensis is comparable to thatof other imported species such as the Argentine ant, Linepithema humile(Hymenoptera: Formicidae), which forms competitively dominant supercolonieswithout territorial boundaries (Tsutsui et al., 2000; Giraud et al., 2002) and thetramp ant, Wasmannia auropunctata (Le Breton et al., 2004). Therefore, theunderstanding of mechanisms that explain the lack of intraspecific aggression can betackled, at least partially, by investigating the compounds involved in recognitionsystems.
Cuticular hydrocarbons, i.e., epicuticle lipids that prevent desiccation, arereported to serve as chemical cues in the recognition process during interindividualinteractions (Howard and Blomquist, 2005; Ozaki et al., 2005). Recognitionprocesses based on genetically derived compounds are also essential for determiningthe degree of relatedness for kin selection (reviewed in Breed and Bennett, 1987).Hydrocarbon composition is often colony-specific (e.g., ants, Vander Meer andMorel, 1998; termites, Clement and Bagneres, 1998; bumblebees, Dronnet et al.,2005b). Although they can be influenced by the physical and social environment(e.g., Husseneder et al., 1997), cuticular hydrocarbons are thought to have a geneticbasis that played a major role in the evolution of social behavior (Carlin andHolldobler, 1986).
Study of chemical cues provides a powerful system for understanding the absenceof intraspecific aggression. Since the hydrocarbon composition of related coloniescan be expected to be similar, it should be possible to establish genetic relationships
1028 J Chem Ecol (2006) 32: 1027–1042

among colonies by evaluating the potential for recognition on the basis of putativeheritable compounds, as is the case in Schedorhinotermes lamanianus (Hussenederet al., 1998) and Macrotermes subhyalinus (Kaib et al., 2004). Within colonies, sincethe breeding system is fundamentally linked with colony genetic structure, it isessential to understand how it could influence cuticular hydrocarbon variation. InReticulitermes species, the number and type of reproductives may vary from onesingle outbred primary pair to multiple inbred secondary reproductives (offspring ofthe primary reproductives) or to multiple unrelated reproductives (Thorne et al.,1999). Colonies with a number of unrelated reproductives may present a greatervariety of derived compounds than highly inbred colonies. In this regard, it shouldbe underlined that R. santonensis colonies consist mainly of families headed byinbred secondary reproductives (neotenics) (Dronnet et al., 2005a).
The aim of this study was to determine if the cuticular hydrocarbon compositionof the nonaggressive introduced termite R. santonensis reflects the genetic relation-ships inferred from microsatellite molecular markers among and within colonies.We asked the following four questions. Can the apparent lack of conspecificrecognition be explained by similarities in cuticular hydrocarbon compositionbetween colonies? Is there sufficient genetic variation to distinguish colonies? Isthere a correlation between the cuticular hydrocarbon composition and geneticdistance among colonies? Are differences in cuticular hydrocarbon compositionamong nestmates within the same colony affected by colony social structure?
Methods and Materials
Termites
In 2003, 14 colonies of the subterranean termite R. santonensis were collected forgas chromatographic (GC) analysis of cuticular hydrocarbons and for genotypinganalysis using microsatellite DNA. The sampling sites were selected within andaround Paris, France (Fig. 1). Ten workers per colony (N = 140) were randomlytaken either from mud tubes on tree bark or from inside buildings. Each termite wasisolated into different conical glass vials (Wheaton, 0.3 ml) to avoid mixing ofcuticular hydrocarbons, immediately killed by freezing, and stored at j20-C untilthe time of analyses.
Gas Chromatographic Analysis of Cuticular Hydrocarbons
Cuticular hydrocarbons were extracted by rinsing individuals in 500 ml pentane for 2min. Following extraction, termites were retrieved with a fine wire (previouslywashed in pentane) and placed in 95% ethanol for later genetic analyses. Afterevaporation of pentane, the extracted hydrocarbons were redissolved in 50ml pentane containing 0.1 mg/ml n-eicosane as an internal standard. Samples wereanalyzed with a Perkin-Elmer Autosystem XL GC (Perkin-Elmer, Wellesley, MA,USA) equipped with a flame ionization detector (FID) and interfaced withTurbochrom workstation software. Analyses were carried out in splitless modeusing a 25 m � 0.32 mm � 0.5 mm BP1 nonpolar capillary column (SGE, Austin, TX,USA) programmed at 150-C for 2 min, followed by 5-C /min up to 300-C for 5 min.
J Chem Ecol (2006) 32: 1027–1042 1029

The carrier gas was helium at 1 ml/min. Extracts from different colonies wereinjected alternatively to avoid the possible biasing effect of injecting extracts fromthe same colonies one after another. Compound identification was based onprevious analyses of the cuticular hydrocarbons of R. santonensis by coupled GC-MS (Bagneres et al., 1990).
Chemical Analyses
To allow analysis of the 140 individual hydrocarbon profiles, areas of peaks werereadjusted by using an FID correction coefficient (Bagneres et al., 1990). Weselected cuticular hydrocarbons that represented >0.3% relative peak area and werepresent in all individuals. Cuticular hydrocarbons were coded following the notationused by Bagneres et al., 1990 (see also footnote Bb^ in Table 1): 9-C23:1 (e1),x-C23:1 (e2), n-C23 (a3), 11-MeC23 (m4), 4/2-MeC23 (m5), (Z)-9-C24:1 (e6),3-MeC23 (m7), n-C24 (a8), 11+12-MeC24 (m9), 4/2-MeC24 (m11), (Z)-9-C25:1(e12), n-C25 (a14), 11+13-MeC25 (m16), 7,9-C25:2 (n17), 4/2-MeC25 (m18),3-MeC25 (m19). The relative areas of some cuticular hydrocarbon pairs weresummed [9-C23:1 + x-C23:1 (i.e., e1 + e2); (Z)-9-C24:1 + 3-MeC23 (i.e., e6 + m7)],because they were most frequently combined (integrated together) by the GCsoftware. To visualize patterns of chemical similarity among individuals from thesame and different colonies, the relative areas of the 14 selected peaks weresubjected to principal component analysis (PCA) using the XLSTAT 7.1 software
Fig. 1 Map of the city of Paris (France) showing the locations of the 14 Reticulitermes santonensiscolonies. Ten colonies were collected within Paris: 8T2 [8th Arrondissement (=Ardt), Tronchetstreet], 8PA (8th Ardt, Pasquier street), 8PM (8th Ardt, Madeleine Place), 8FR (8th Ardt, Friedlandavenue), 9RO (9th Ardt, Rochechouart street), 12D (12th Ardt, Daumesnil avenue), 13D (13thArdt, Dunois street), 13W (13th Ardt, Louise Weiss street), 17CL (17th Ardt, Clichy avenue), 17LA(17th Ardt, Lantiez street). Four colonies came from cities around Paris: PU (Puteaux), BA(Bagnolet), IV (Ivry-sur-Seine), and CR (Creteil)
1030 J Chem Ecol (2006) 32: 1027–1042

Tab
le1
Mean
Perc
en
tagesa
of
Cu
ticu
lar
Hyd
roca
rbo
ns
of
14
Co
lon
ies
of
Ret
icu
lite
rmes
san
ton
ensi
s(P
ari
s,F
ran
ce)
Hyd
roca
rbo
ns
Peak
sb8T
28P
A8P
M8F
R9R
O12D
13D
13W
17C
L17L
AP
UB
AIV
CR
9-C
23:1
+x
-C23:1
e1+
e21.9
3 (0.3
9)
0.6
8 (0.4
6)
0.7
2 (0.3
4)
1.6
7 (0.5
8)
1.1
7 (0.3
3)
1.1
7 (0.3
0)
1.1
5 (0.5
2)
2.0
9 (0.1
2)
3.8
6 (1.3
1)
1.2
1 (0.3
9)
1.1
0 (0.2
9)
1.4
2 (0.6
3)
4.3
3 (1.7
9)
3.1
7 (0.6
1)
n-C
23
a3
13.0
7
(2.1
0)
7.5
0 (0.4
9)
6.6
4 (0.8
8)
9.0
7 (1.1
7)
9.6
3 (0.6
8)
6.5
8 (1.4
5)
9.4
5 (1.5
4)
6.2
2 (0.8
2)
8.9
1 (1.3
6)
7.4
8 (1.1
6)
13.6
1
(0.8
4)
11.0
9
(1.2
1)
15.6
2
(3.2
2)
8.0
5 (1.4
9)
11-M
eC
23
m4
0.8
1 (0.1
4)
0.7
0 (0.2
4)
1.0
8 (0.2
2)
0.9
3 (0.1
2)
1.9
5 (0.3
3)
1.1
1 (0.2
6)
1.9
5 (0.2
2)
2.3
7 (0.3
3)
1.3
2 (0.2
2)
0.9
9 (0.1
7)
0.7
6 (0.1
7)
1.7
3 (0.1
4)
1.5
7 (0.4
4)
3.1
6 (0.7
4)
4/2
-MeC
23
m5
2.7
0 (0.2
6)
1.8
1 (0.2
2)
1.6
2 (0.2
1)
1.7
1 (0.0
9)
2.1
4 (0.1
9)
1.9
4 (0.1
8)
1.7
8 (0.2
2)
1.5
7 (0.2
0)
1.8
6 (0.2
2)
1.6
3 (0.2
6)
1.8
4 (0.1
5)
1.3
2 (0.1
2)
0.7
4 (0.2
2)
1.9
0 (0.2
9)
(Z)-
9-C
24:1
+3-M
eC
23
e6+
m7
1.0
3 (0.0
9)
0.5
0 (0.0
5)
0.7
8 (0.1
0)
0.5
8 (0.0
6)
1.3
5 (0.1
9)
0.7
6 (0.0
3)
1.3
8 (0.1
0)
1.3
1 (0.0
9)
1.3
2 (0.1
8)
0.7
9 (0.0
8)
0.5
8 (0.1
2)
0.9
8 (0.0
9)
1.2
4 (0.1
4)
1.5
9 (0.1
3)
n-C
24
a8
3.1
8 (0.4
4)
4.4
7 (0.9
6)
3.0
5 (0.7
0)
2.5
5 (0.4
0)
4.3
9 (0.1
7)
2.3
2 (0.2
9)
4.2
5 (0.5
4)
2.2
2 (0.3
5)
3.3
5 (0.1
4)
3.0
5 (0.6
9)
4.3
5 (0.4
1)
2.6
8 (0.2
6)
3.8
8 (0.4
3)
2.6
3 (0.6
3)
11+
12-M
eC
24
m9
0.9
8 (0.2
3)
1.6
0 (0.1
5)
1.7
1 (0.1
6)
1.3
5 (0.2
5)
1.6
4 (0.1
5)
1.7
8 (0.5
1)
1.7
3 (0.2
2)
2.0
3 (0.1
2)
1.9
2 (0.1
3)
1.5
5 (0.2
4)
1.0
7 (0.2
3)
1.2
2 (0.1
2)
1.3
5 (0.1
7)
2.0
4 (0.2
1)
4/2
-MeC
24
m11
18.2
7
(1.1
8)
16.1
5
(0.8
2)
14.6
4
(1.2
1)
18.7
3
(0.8
9)
13.1
4
(0.7
0)
15.5
8
(2.2
7)
13.8
7
(1.2
2)
11.0
7
(0.7
4)
11.9
4
(1.2
8)
15.6
4
(1.9
4)
18
.69
(1.8
5)
13.0
2
(0.6
2)
6.5
5 (1.0
6)
11.2
0
(1.4
4)
(Z)-
9-C
25:1
e12
14.5
1
(1.8
9)
8.9
6 (2.1
6)
15.3
8
(3.2
2)
7.8
8 (1.3
7)
9.5
6 (1.9
2)
9.2
2 (1.9
5)
6.9
2 (1.7
2)
21.7
7
(1.2
0)
21.2
2
(2.1
0)
13.4
7
(3.2
6)
7.9
6 (2.1
6)
13.9
9
(2.1
5)
16.5
9
(1.9
6)
22.9
0
(2.1
2)
n-C
25
a14
11.7
4
(1.0
7)
18.7
9
(1.0
7)
12.9
415.3
4
(0.9
6)
18.1
1
(1.4
7)
11.0
1
(1.9
9)
20.3
9
(2.8
1)
8.8
8 (0.7
8)
13.7
0
(1.1
6)
14.4
8
(1.5
9)
18
.06
(0.9
8)
16.0
0
(1.1
9)
23.3
0
(2.6
8)
9.2
5 (2.1
6)
11+
13-M
eC
25
m16
17.4
5
(2.4
1)
25.4
9
(2.7
9)
27.4
7
(1.9
9)
22.0
1
(1.9
5)
21.9
2
(1.9
1)
31.2
7
(5.4
5)
20.6
5
(2.9
3)
28.9
9
(3.1
0)
20.5
9
(1.3
6)
25.7
2
(2.1
9)
16
.97
(2.3
3)
20.5
0
(1.6
8)
16.4
7
(1.2
6)
24.1
0
(1.6
1)
7,9
-C25:2
n17
4.7
9 (0.6
0)
3.3
8 (0.3
4)
4.0
4 (0.9
9)
6.7
5 (1.0
5)
4.3
5 (0.5
9)
5.3
6 (0.9
5)
5.2
0 (0.6
6)
4.1
4 (0.2
0)
3.6
8 (0.4
6)
3.6
4 (0.1
7)
5.9
5 (0.5
1)
7.1
2 (1.0
3)
3.3
8 (0.4
3)
3.7
6 (0.4
9)
4/2
-MeC
25
m18
2.9
3 (0.2
2)
3.3
9 (0.1
5)
3.0
9 (0.2
3)
3.9
3 (0.3
6)
2.9
6 (0.3
6)
3.8
3 (0.5
0)
3.0
8 (0.2
9)
2.3
3 (0.1
4)
2.3
3 (0.4
4)
3.4
2 (0.1
9)
3.3
7 (0.2
7)
2.7
5 (0.1
9)
1.6
6 (0.1
7)
2.0
5 (0.0
7)
3-M
eC
25
m19
6.6
0 (0.4
4)
6.5
8 (0.4
7)
6.8
4 (0.4
4)
7.5
1 (0.4
1)
7.6
9 (2.1
1)
8.0
8 (1.4
0)
8.1
9 (0.8
7)
5.0
1 (0.4
2)
3.9
9 (0.5
2)
6.9
2 (0.7
0)
5.6
9 (0.4
1)
6.1
8 (0.5
9)
3.3
4 (0.5
0)
4.2
1 (0.2
1)
aM
ean
s(S
D)
were
calc
ula
ted
acr
oss
the
10
ind
ivid
ual
pro
file
so
fw
ork
ers
an
aly
zed
per
colo
ny.
bC
od
es
for
cuti
cula
rh
yd
roca
rbo
np
eak
s:a
=n
-alk
an
e,
e=
mo
no
en
e,
n=
die
ne,
m=
mo
no
meth
yl-
alk
an
e.
J Chem Ecol (2006) 32: 1027–1042 1031

(Addinsoft, NY, USA). The 95% confidence ellipses around workers from the samecolony were obtained using STATGRAPHICS v.4.0 (StatPoint, Inc., Herndon, VA,USA) and UNIWIN PLUS v.3.0 (SIGMA PLUS, Levallois-Perret, France).
Microsatellite Genotyping
Microsatellite genotyping was performed on all 140 individuals that underwentchemical extraction. Genomic DNA extraction and PCR amplification wereperformed as described by Dronnet et al. (2004). The amplified products wereseparated by electrophoresis on 6% polyacrylamide gels with a Li-Cor 4000Lsequencer. Genotyping was performed at 10 loci. These included four loci originallyisolated from R. flavipes (Rf1-3, Rf6-1, Rf11-1, and Rf15-2; Vargo, 2000) and six locicharacterized from R. santonensis (RS10, RS15, RS68, RS76, RS78, and RS81;Dronnet et al., 2004). For the description of statistical analyses, these loci will benumbered 1 through 10 in the order listed in the previous sentence. Alleles werescored using the computer program GENE PROFILER 4.03 (Scanalytics, Inc.,Rockville, MD, USA).
Genetic Analyses
Patterns of genetic differentiation were initially ordinated by factorial correspon-dence analysis (FCA) to maximize the correspondence between allele andindividual scores. The GENETIX 4.05.2 software used for FCA also codes thealleles by the presence/absence of each feature including homozygous state (Belkhiret al., 1996–2001). As a secondary approach to assess an unrooted network of thegenetic distances between the 140 individuals, the proportion of shared alleledistance, defined as one minus half the mean number of shared alleles per locus, wascomputed with the SHAREDST program (J. Brzustowski; available at http://www2.biology.ualberta.ca/jbrzusto/sharedst.php). A Fitch & Margoliash tree (Fitchand Margoliash, 1967) was constructed from the two distance matrixes by using theFITCH program in the PHYLIP package v.3.06 (Felsenstein, 1993). Conventionalpopulation genetic analyses were used to support the previous analyses. Genotypicfrequencies between colonies were compared by means of a log-likelihood (G)-based test of differentiation using GENEPOP ON THE WEB (Raymond andRousset, 1995). The overall significance was determined by using Fisher’s combinedprobability test with Bonferroni’s method for multiple comparisons.
Correlation Between Genetic and Chemical Data among Colonies
Redundancy Analysis
The relationship between cuticular hydrocarbon and microsatellite DNA data wastested via direct canonical ordination by using a redundancy analysis (RDA; TerBraak, 1987) performed with Biplot and Singular Value Decomposition Macros forExcel (Lipkovich and Smith, 2002). The major difference between RDA and PCA isthat RDA minimizes error by basing linear regression directly on x variables(environmental variables), thus forcing ordination vectors to be maximally relatedto combinations of the x variables (see Legendre and Legendre, 1998). In this way,
1032 J Chem Ecol (2006) 32: 1027–1042

results can be expected to express only the part of variation that is significantlylinked to the y variables (response variables). RDA was originally used forecological applications, such as the analysis of community gradients to obtainconstrained ordinations of species abundance frequency data in the function ofenvironmental variables. In the present study, the table of y variables cor-responded to the allele frequency data in each colony, and x variablescorresponded to the mean relative area of each cuticular hydrocarbon peakcalculated from the relative areas of the 10 individuals per colony. In addition,PCA was performed again on chemical data at the colony level. Spearman’s rankcorrelation coefficients (rS) between the colony scores were calculated from RDAand PCA to explore the cuticular hydrocarbon variables affecting colony ordinationin multivariate analysis.
Matrix Correlations
Differences in hydrocarbon composition among colonies were quantified bymodifying the standard genetic distance of Nei (1987) using the following formula,D ¼ �ln
Pn xiyi
. ffiffiffiffiffiffiffiffiffiffiffiffiffiffiffiffiffiffiffiffiffiffiffiffiffiffiffiffiffiPn x2i
Pn y2i
� �q
, where n is the number of selected cuticular hydrocarbons,xi is the relative area of hydrocarbon i for colony x, and yi is the relative area ofhydrocarbon i for colony y. The dissimilarity matrix including all possible colonypairs was constructed from the previously calculated mean relative areas of cuticularhydrocarbons. Independent matrices coding genetic distances between colonieswere then calculated from allele frequency data. Nei’s standard genetic distance(DS; Nei, 1987) among colonies was calculated by using the GENDIST program inthe PHYLIP package v.3.06. To test the robustness of our results, we used theCavalli-Sforza and Edwards (1967) chord distance that makes no biologicalassumptions except that gene frequency changes can be attributed to genetic driftalone. For matrix correlations, we used XLSTAT 7.1 software to perform Manteltests with a permutation test strategy (10,000 permutations), because the pairwisedistance values among colonies were not independent of each other.
We investigated whether there was isolation by distance by plotting geographicdistances vs. chemical and genetic distances, respectively. For genetic distance, FST
among colonies was computed using FSTAT 2.9.3.2 (Goudet, 1995), and significanceof the correlation between FST/(1 j FST) and the logarithm of geographicaldistances were tested. Mantel tests were computed using XLSTAT 7.1.
Correlation between Chemical Distance and Genetic Relatedness within Colonies
The breeding system was studied with hierarchical F-statistics using FSTAT,following the notation of Thorne et al. (1999), as explained in detail in Dronnet etal. (2005a). The 95% confidence intervals were obtained by bootstrapping over loci15,000 times. It was assumed that the colony inbreeding coefficient, FIC, was stronglynegative in simple family colonies; approached zero as the number of neotenicreproductives increased; and became positive with assortative mating amongmultiple unrelated reproductives (Thorne et al., 1999).
Variation in chemical composition within colonies was investigated as a functionof intracolony genetic relatedness. Genetic relationship between nestmate workerswas assessed by measuring intracolony relatedness using RELATEDNESS v. 5.00
J Chem Ecol (2006) 32: 1027–1042 1033

(Queller and Goodnight, 1989). Colonies were weighted equally. Mean Neichemical distance within colonies was calculated from all possible pairs ofindividuals. Standard error of relatedness within single colonies was determinedby jackknifing over loci. Spearman’s rank correlation (rS) was applied to test therelationship between these chemical and genetic variables within colonies.
Results
Chemical Analyses
Quantitatively, the major cuticular hydrocarbons were 11+13-MeC25, n-C25, 4/2-MeC24, (Z)-9-C25:1, and n-C23 (Table 1). The mean percentages of these cuticularhydrocarbons and others were used for statistical analyses between colonies (RDA,PCA among colonies, Nei’s distance for matrix correlations). Principal componentanalysis of the quantitative variation in individual hydrocarbon data revealed thatthe first two principal components, PC-I and PC-II, accounted for 60.2% of totalchemical variation (Fig. 2A). Nestmates were regrouped in their respective colonies,but variation also occurred among colonies ranging from low individual variabilitywithin some colonies (e.g., 13W) to more dispersed patterns (e.g., 12D). In themultivariate space, the distinction between colonies was relatively pronounced forCR, IV, PU, 13W, 17CL, and 12D. There was some overlap among the eight othercolonies. Differences in colony profiles can be attributed to the effects of thecuticular hydrocarbons that contributed to the principal components. On the biplot(not shown), major contributions to PC-I (in brackets with the hydrocarbons)included two positive compounds, 4/2-MeC24 (m11, 14.2%) and 4/2-MeC25 (m18,13.6%), and three negative compounds, (Z)-9-C25:1 (e12, j14%), (Z)-9-C24:1 + 3-MeC23 (e6+m7, j11.8%) and 11-MeC23 (m4, j10.9%). Major contributions to PC-II included one positive compound, 11+13-MeC25 (m16, 27.6%), and one negative,n-C23 (a3, j25.2%). Colonies 8PA and 8T2 were more separate from the othercolonies when PCA was performed by using PC-III that accounted for 11.4% of thevariance (data not shown). Major contributions to PC-III included one positivecompound, n-C24 (a8, 27.6%), and one negative compound, n-C25 (a14, j15.6%).
Genetic Analyses
Factorial correspondence analysis revealed that most colonies were distinct andplotted into three areas of the multivariate space (Fig. 2B). The two first factorialcomponents (FC-I and FC-II) accounted for 25% of the total genetic variation.Three colonies (CR, IV, and 13W; group one) were completely separated from allthe other colonies on the negative part of FC-I, whereas two other groups weredistinct on FC-II. On FC-II, spatial distributions of the individual genotypes fromfour colonies (9RO, 12D, 17CL, 17LA) overlapped (group two), while individualsfrom the other colonies were mixed (group three) on the negative part of FC-II.Colony PU was clearly separated from all other colonies on FC-III (data notshown).
The unrooted tree based on allele-sharing distances among individuals providedsome support to the results of FCA (Fig. 3). Individuals from colony IV clusteredand formed a distinct subgroup from the mixed 13W and CR subgroups. Other
1034 J Chem Ecol (2006) 32: 1027–1042

distinct subgroups appeared including one formed by 8FR and PU, and another by17CL, 17LA, and 12D.
Significant differentiation was observed among most of the colonies (G test: P<0.01), except among colonies in the three groups defined by FCA.
CR
IV
BA
PU
17LA
17CL
13W
13D
12D
9RO
8FR
8PM
8PA
8T2
-1.1
-0.7
-0.3
0.1
0.5
0.9
-0.7 -0.3 0.1 0.5
A PC-II (22.7%)
PC-I (37.5%)
8T2
13W
8PA
17CL
8PM
17LA
8FR
PU
9RO
BA
12D
IV
13D
CR
8T2 8PA
8PM
8FR
9RO
12D
13D 13W
17CL
17LA
PU
BA
IV
-1
-0.8
-0.6
-0.4
-0.2
0
0.2
0.4
0.6
0.8
1
1.2
-1.8 -1.4 -1 -0.6 -0.2 0.2 0.6
CR
FC-I (16.8%)
FC-II (8.2%) B
Fig. 2 Multivariate analyses showing the chemical and genetic relationships among the same 140workers from Reticulitermes santonensis colonies. (A) Principal component analysis (PCA) of thecuticular hydrocarbon profiles. The 95% confidence ellipses are dotted. (B) Factorial correspon-dence analysis (FCA) of the microsatellite multilocus genotypes. The curves (dotted) were drawn byhand to delimit the distributions of the individuals belonging to the three distinct groups (see text).For both analyses, symbols of the same shape represent individuals from the same colony (seelegend and Fig. 1)
J Chem Ecol (2006) 32: 1027–1042 1035

Correlation between Chemical and Genetic Data among Colonies
Redundancy Analysis
Redundancy analysis performed on allele frequency data for all 14 hydrocarbonvariables revealed an ordination pattern of colonies (Fig. 4) that closely resembledthe ordination pattern produced by FCA plotting of the individual genotypes(Fig. 2B). The first two axes (RD-I and RD-II) accounted for 57.6% of the totalvariation. The scores of the 14 colonies on RD-I were positively correlated(Spearman’s rank test: rS = 0.54, P = 0.02) with the scores on the first axis of aPCA performed on cuticular hydrocarbons among colonies (plot not shown),suggesting that these variables adequately explained the variation in the allelefrequency data along this axis. Most of the variation on RD-I was explained by acombination of cuticular hydrocarbons strongly correlated with this axis (Fig. 4, longarrows). This correlation was positive mainly for long-chain methylbranchedhydrocarbons [3-MeC25 (m19), 4/2-MeC25 (m18), 4/2-MeC24 (m11)] and negativemainly for short-chain hydrocarbons [mainly monoenes (Z)-9-C25:1 (e12), 9-C23:1 +x-C23:1 (e1 + e2), (Z)-9-C24:1 (e6); shorter methylbranched hydrocarbons 11-MeC23 (m4), 3-MeC23 (m7)]. Again, CR, 13W, and IV appeared to be different
Fig. 3 Unrooted Fitch and Margoliash tree of genetic distances, based on the proportion of sharedallele distance among individual microsatellite multilocus genotypes from the 14 Reticulitermessantonensis colonies
1036 J Chem Ecol (2006) 32: 1027–1042

from the other colonies with regard to both allele frequency data and cuticularhydrocarbons. When colony 17CL, whose position was relatively inconsistent withthe results of the PCA, was removed from the datasets, the correlation coefficientslightly increased (rS = 0.63, P = 0.01).
The scores of the 14 colonies on RD-II were not significantly correlated (rS =0.25, P = 0.20) with the scores on the second axis of PCA performed on colonyhydrocarbons (without 17CL, rS = 0.27, P = 0.19). Therefore, cuticular hydrocarbonsdid not have an influence on the ordination among the colonies along the RD-IIaxis, as also revealed by the small size of the nearest arrows to this axis [11+13-MeC25 (m16), n-C23 (a3)]. These results suggested that ordination of the coloniesalong the RD-II axis was attributable mainly to genetic data, which would explainthe congruence between the RDA and FCA plots. The main alleles involved in thevariation in allele frequency data along the RD-II axis were from loci RS76 (alleles8a and 8d), RS15 (6d), Rf11-1 (3c), and Rf6-1 (2d and 2h) (Fig. 4).
Matrix Correlations
Hydrocarbon distances among the 14 colonies were strongly and positively correlatedwith microsatellite genetic distances; Nei distance (Mantel test, rS = 0.40, P = 0.005);and Cavalli-Sforza and Edward’s chord distance (Mantel test, rS = 0.42, P = 0.004).Colonies showing more similar hydrocarbon profiles were genetically closer.
There was a positive correlation between geographic distance and geneticdifferentiation between colonies (Mantel test: r = 0.49, P = 0.005), but not betweengeographic and chemical distances (Mantel test: r = 0.25, P = 0.072).
1a
1b
1d 2b
2c
2d
2f 2g
2h
3a
3b
3c
4a4b
5a5b
5c
5d
6a
6b
6c
6d
7b7d
7e
8a
8d
9a
9b
8T28PA
8PM
8FR
9RO
12D
13D
13W
17CL17LA
PU
BA
IV
CR
m19
m18
n17
m16
a14
e12
m11
m9
a8
e6+m7
m5
m4
a3
e1+e2
-0.8
-0.4
0
0.4
0.8
1.2
-1.8 -1.4 -1 -0.6 -0,2 0.2 0.6
RD-II (20.7%)
RD-I (36.9%)
Fig. 4 Redundancy analysis (RDA) ordination triplot of the 14 Reticulitermes santonensis colonies(capitalized letters) with the microsatellite alleles from 10 loci (roman) indicated by dashed linesand the cuticular hydrocarbons (italic) indicated by arrows (environmental variables). Note that forclarity, only microsatellite alleles related to colony ordination are indicated. [For abbreviations ofloci, see Methods and Materials; the letters represent the alleles at each locus (not detailed in text)]
J Chem Ecol (2006) 32: 1027–1042 1037
Correlation between Chemical Distances and Genetic Relatedness within Colonies
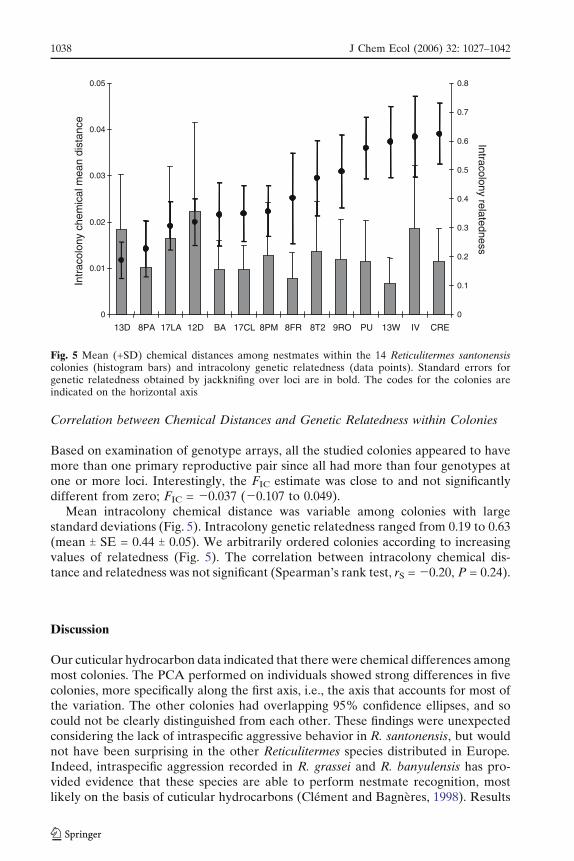
Based on examination of genotype arrays, all the studied colonies appeared to havemore than one primary reproductive pair since all had more than four genotypes atone or more loci. Interestingly, the FIC estimate was close to and not significantlydifferent from zero; FIC = j0.037 (j0.107 to 0.049).
Mean intracolony chemical distance was variable among colonies with largestandard deviations (Fig. 5). Intracolony genetic relatedness ranged from 0.19 to 0.63(mean T SE = 0.44 T 0.05). We arbitrarily ordered colonies according to increasingvalues of relatedness (Fig. 5). The correlation between intracolony chemical dis-tance and relatedness was not significant (Spearman’s rank test, rS = j0.20, P = 0.24).
Discussion
Our cuticular hydrocarbon data indicated that there were chemical differences amongmost colonies. The PCA performed on individuals showed strong differences in fivecolonies, more specifically along the first axis, i.e., the axis that accounts for most ofthe variation. The other colonies had overlapping 95% confidence ellipses, and socould not be clearly distinguished from each other. These findings were unexpectedconsidering the lack of intraspecific aggressive behavior in R. santonensis, but wouldnot have been surprising in the other Reticulitermes species distributed in Europe.Indeed, intraspecific aggression recorded in R. grassei and R. banyulensis has pro-vided evidence that these species are able to perform nestmate recognition, mostlikely on the basis of cuticular hydrocarbons (Clement and Bagneres, 1998). Results
Intr
acol
ony
chem
ical
mea
n di
stan
ce
Intracolony relatedness
0
0.01
0.02
0.03
0.04
0.05
13D 8PA 17LA 12D BA 17CL 8PM 8FR 8T2 9RO PU 13W IV CRE
0
0.1
0.2
0.3
0.4
0.5
0.6
0.7
0.8
Fig. 5 Mean (+SD) chemical distances among nestmates within the 14 Reticulitermes santonensiscolonies (histogram bars) and intracolony genetic relatedness (data points). Standard errors forgenetic relatedness obtained by jackknifing over loci are in bold. The codes for the colonies areindicated on the horizontal axis
1038 J Chem Ecol (2006) 32: 1027–1042

similar to ours have been reported on imported populations of C. formosanus fromFlorida and Hawaii insofar as their cuticular hydrocarbon patterns were not cor-related with agonistic responses (Su and Haverty, 1991). Aggressive behavior wasdemonstrated to be low or absent among Hawaiian colonies (Husseneder andGrace, 2001). However, it must be emphasized that absence of overt aggression doesnot necessarily mean that no nestmate recognition takes place. Signs of recognitioncan be observed by examining subtle differences in behavioral interactions and byvarious ethological tests (Cornelius and Osbrink, 2003; Bagneres and collaborators,unpublished data).
Our genetic data demonstrated almost the same ordination pattern as the cuticularhydrocarbon data. Three colonies were strongly separated along one FCA axis,whereas the other 11 colonies were distributed in two genetically distinct groups.Since the method of factorial analysis used maximized the correspondence betweenallele and individual scores, it can be assumed that individuals within each groupshared common alleles. The unrooted tree based on allele-sharing distance not onlyconfirmed this assumption, but also yielded better resolution among a few colonieswithin groups. There was sufficient variation to measure genetic distances amongmost colonies.
Our findings showing general variation in both cuticular hydrocarbon andmicrosatellite compositions suggest a genetic basis for cuticular hydrocarbons. Themultivariate approach that uses a redundancy analysis of chemical and genetic datasimultaneously allowed us to isolate the cuticular hydrocarbons that specificallyexplained the observed variation. The combination of six major cuticular hydro-carbons highly correlated with the first canonical axis appeared to account for geneticvariation among colonies. Interestingly, long- vs. short-chain hydrocarbons andsaturated vs. unsaturated alkanes were found to correlate positively and negatively,respectively, with the axis. Mantel tests provided a strong positive correlationbetween chemical and genetic distances among colonies. Other studies in ants andtermites have demonstrated a correlation between the level of intercolonialaggression during recognition processes and genetic distances between colonies(Beye et al., 1998; Husseneder et al., 1998). In the mound-building termite, M.subhyalinus, direct analyses showed that intercolonial differences in cuticularhydrocarbons were also negatively correlated with genetic similarity among colonies(Kaib et al., 2004).
However, several findings indicated that some chemical compounds may not begenetically derived. Some colonies, e.g., 17CL, were genetically similar and yetshowed different ordination based on hydrocarbon profiles. Observation of significantisolation by distance among colonies indicated that genetic differentiation increaseswith geographic distance but, as previously shown in M. subhyalinus (Kaib et al.,2004), hydrocarbon differences did not correspond to the geographic populationstructure (geographic distance). Cue origin could account for the differencesbetween chemical data in the genetic or geographical datasets. Cuticular hydro-carbons may also depend on environmental factors. Previous studies in other socialinsects such as the wood ant, Formica pratensis, have shown that environmentalcompounds not only are important for nestmate recognition, but they can alsooverride genetically based cues (Pirk et al., 2001).
The presumed imported origin of R. santonensis could explain the lack of intra-specific aggression in R. santonensis despite the chemical differences observed be-
J Chem Ecol (2006) 32: 1027–1042 1039

tween colonies. Although R. santonensis does not display the extraordinarysupercolony structure of the imported populations of the Argentine ant, L. humile,it may have undergone changes in its breeding system. Unlike R. flavipes colonies,which are mainly headed by primary reproductive pairs (Vargo, 2003), R.santonensis colonies tend to be large with high numbers of neotenic reproductives(Dronnet et al., 2005a). Introduction to Europe may have been accompanied by aloss of genetic diversity at neutral markers in R. santonensis resulting in fewer allelesand a lower level of heterozygosity in comparison with R. flavipes (Dronnet et al.,2004). One of the hypotheses used to explain the absence of intraspecific aggressionin L. humile may also explain how introduction events affected the mechanismsunderlying the recognition process in R. santonensis (Tsutsui et al., 2000; Giraud etal., 2002). A founder event accompanying initial introduction into Europe may havereduced genomic diversity, including both microsatellite loci and genes controllinghydrocarbon expression. The resulting fixation of most recognition alleles could havecaused a breakdown of intraspecific recognition ability. However, it should be em-phasized that colonies of R. santonensis have maintained the ability to discriminateamong allospecifics since they sometimes behave aggressively against other species.
Investigation at the intracolony level allowed us to study the influence of thesocial structure inferred from worker genotypes on hydrocarbon composition. Thiswas especially important insofar as many colonies were headed by many breeders(neotenic reproductives) in each colony, which was revealed by the low FIC valueclose to zero. These results were consistent with our previous data on other R.santonensis populations (Dronnet et al., 2005a) as mating among multiple neotenicsresulted in significant inbreeding in each colony. Although extensive variation inintracolony relatedness (from low to high) could have influenced the diversity incuticular hydrocarbons within colonies, no significant correlation was found betweenintracolony chemical distance and relatedness. This suggests that cuticularhydrocarbon composition did not depend on social structure. The supposed loss ofgenetic diversity during introduction may also have affected the recognition processwithin colonies. However, other factors such as intestinal flora (R. speratus;Matsuura, 2001) or diet-derived chemicals (C. formosanus, Florane et al., 2004)may influence recognition among individuals within colonies.
Based on our findings, we conclude that genetic relationships among colonies arewell reflected by cuticular hydrocarbon variation. This conclusion supports a geneticcomponent to these chemical compounds. Because this species does not showintraspecific aggression, i.e., a common trait for invasive species, it is possible thatthe supposed loss of genetic diversity also affected the ability to discriminate amongmore or less related individuals. Further studies focusing on other Reticulitermesspecies showing various degrees of intraspecific aggression will be needed toinvestigate the influence of cuticular hydrocarbons on recognition.
Acknowledgments We are grateful to the BSection de Lutte contre les termites^ (SMASH, Paris)and the pest control operators (HIE Piguy, Hygiene Office, Techmohygiene & APBM Bruant) forkindly providing some samples. We thank P. Legendre (Universite de Montreal) for advice on thepublished material on redundancy analysis, and K. A. Copren, C. Husseneder, M. Kaib, N. D. Tsutsui,and E. L. Vargo for comments on this manuscript, and we thank A. Corsini for help in improving theEnglish of the manuscript. This study was supported by a contract between the Centre de la RechercheScientifique (CNRS) and the City of Paris (Direction des Parcs, Jardins et Espaces verts).
1040 J Chem Ecol (2006) 32: 1027–1042

References
AUSTIN, J. W., SZALANSKI, A. L., SCHEFFRAHN, R. H., MESSENGER, M. T., DRONNET, S., andBAGNERES A.-G. 2005. Genetic evidence for the synonymy of two Reticulitermes species:Reticulitermes flavipes (Kollar) and Reticulitermes santonensis (Feytaud). Ann. Entomol. Soc.Am. 98:395– 401.
BAGNERES, A.-G., CLEMENT, J.-C., BLUM, M. S., SEVERSON, R. F., JOULIE, C., and LANGE, C.1990. Cuticular hydrocarbons and defensive compounds of Reticulitermes flavipes (Kollar) andR. santonensis (Feytaud): Polymorphism and chemotaxonomy. J. Chem. Ecol. 16:3213–3244.
BELKHIR, K., BORSA, P., CHIKHI, L., RAUFASTE, N., and BONHOMME, F. 1996–2001. genetix 4.04Logiciel sous windows TM pour la Genetique des Populations. Laboratoire Genome,Populations, Interactions, CNRS UMR 5000, Universite de Montpellier.
BEYE, M., NEUMANN, P., CHAPUISAT, M., PAMILO, P., and MORITZ, R. F. A. 1998. Nestmaterecognition and the genetic relatedness of nests in the ant Formica pratensis. Behav. Ecol.Sociobiol. 43:67–72.
BREED, M. D. and BENNETT, G. W. 1987. Kin recognition in highly eusocial insects, pp. 243–285, inD. J. C. Fletcher, and C. D. Michener (eds.). Kin Recognition in Animals. Wiley and Sons.
BULMER, M. S. and TRANIELLO, J. F. A. 2002. Lack of aggression and spatial association of colonymembers in Reticulitermes flavipes. J. Insect Behav. 15:121–126.
CARLIN, N. F. and HOLLDOBLER, B. 1986. The kin recognition system of carpenter ants(Camponotus spp.). I. Hierarchical cues in small colonies. Behav. Ecol. Sociobiol. 19:123–134.
CAVALLI-SFORZA, L. L. and EDWARDS, A. W. F. 1967. Phylogenetic analysis: Models andestimation procedures. Am. J. Hum. Genet. 19:233–257.
CLEMENT, J.-L. 1986. Open and closed societies in Reticulitermes termites (Isoptera, Rhinotermi-tidae): Geographic and seasonal variations. Sociobiology 11:311–323.
CLEMENT, J.-L. and BAGNERES, A.-G. 1998. Nestmate recognition in termites, pp. 126–155, in R. K.Vander Meer, M. D. Breed, K. E. Espelie, and M. L. Winston (eds.). Pheromone Com-munication in Social Insects. Ants, Wasps, Bees, and Termites. Westview Press, Boulder, CO.
CORNELIUS, M. L. and OSBRINK, W. L. 2003. Agonistic interactions between colonies of theFormosan subterranean termite (Isoptera: Rhinotermitidae) in New Orleans, Louisiana.Environ. Entomol. 32:1002–1009.
DRONNET, S., BAGNERES, A.-G., JUBA, T. R., and VARGO, E. L. 2004. Polymorphic microsatelliteloci in the European subterranean termite, Reticulitermes santonensis Feytaud. Mol. Ecol. Notes4: 127–129.
DRONNET, S., CHAPUISAT, M., VARGO, E. L., LOHOU, C., and BAGNERES, A.-G. 2005a. Geneticanalysis of the breeding system of an invasive subterranean termite, Reticulitermes santonensis,in urban and natural habitats. Mol. Ecol. 14:1311–1320.
DRONNET, S., SIMON, X., VERHAEGHE, J.-C., RASMONT, P., and ERRARD, C. 2005b. Bumblebeeinquilinism in Bombus (Fernaldaepsithyrus) sylvestris Lepeletier (Hymenoptera, Apidae):Behavioural and chemical analyses of host–parasite interactions. Apidologie 36:59–70.
FELSENSTEIN, J., 1993. Phylogeny Inference Package (PHYLIP), Version 3.5c University ofWashington, Seattle.
FITCH, W. M. and MARGOLIASH, E. 1967. Construction of phylogenetic trees. Science 155:279–284.FLORANE, C. B., BLAND, J. M., HUSSENEDER, C., and RAINA, A. K. 2004. Diet-mediated inter-
colonial aggression in the Formosan subterranean termite Coptotermes formosanus. J. Chem.Ecol. 30:2559–2574.
GIRAUD, T., PEDERSEN, J. S., and KELLER, L. 2002. Evolution of supercolonies: The Argentine antsof southern Europe. Proc. Natl. Acad. Sci. USA 99:6075– 6079.
GOUDET, J. 1995. FSTAT (version 1.2): A computer program to calculate F-statistics. J. Heredity86:485– 486.
GRACE, J. K. 1996. Absence of overt agonistic behavior in a northern population of Reticulitermesflavipes (Isoptera: Rhinotermitidae). Sociobiology 28:103–110.
HAMILTON, W. D. 1964. The genetic evolution of social behaviour. J. Theor. Biol. 71:1–52.HAVERTY, M. I. and THORNE, B. L. 1989. Agonistic behavior correlated with hydrocarbon
phenotypes in dampwood termites, Zootermopsis (Isoptera: Termopsidae). J. Insect Behav.2:523–543.
HOWARD, R. W. and BLOMQUIST, G. J. 2005. Ecological, behavioral, and biochemical aspects ofinsect hydrocarbons. Annu. Rev. Entomol. 50:371–393.
J Chem Ecol (2006) 32: 1027–1042 1041

HUSSENEDER, C. and GRACE, J. K. 2001. Evaluation of DNA fingerprinting, aggression tests, andmorphometry as tools for colony delineation of the Formosan subterranean termite. J. InsectBehav. 14:173–186.
HUSSENEDER, C., KAIB, M., EPPLEN, C., EPPLEN, J. T., and BRANDL, R. 1997. Small-scalepopulation structure of the termite Schedorhinotermes lamanianus: Aggression modulated bygenetic and environmental factors. Mitt. Dtsch. Ges. Allg. Angew. Entomol. 11:183–187.
HUSSENEDER, C., BRANDL, R., EPPLEN, C., EPPLEN, J. T., and KAIB, M. 1998. Variation between andwithin colonies in the termite: Morphology, genomic DNA, and behaviour. Mol. Ecol. 7:983–990.
KAIB, M., JMHASLY, P., WILFERT, L., DURKA, W., FRANKE, S., FRANCKE, W., LEUTHOLD, R. H.,and BRANDL, R. 2004. Cuticular hydrocarbons and aggression in the termite Macrotermessubhyalinus. J. Chem. Ecol. 30:365–385.
LE BRETON, J., DELABIE, J. H. C., CHAZEAU, J., DEJEAN, A., and JOURDAN, H. 2004.Experimental evidence of large-scale unicoloniality in the tramp ant Wasmannia auropunctata(Roger). J. Insect Behav. 17:263–271.
LEGENDRE, P. and LEGENDRE, L. 1998. Numerical Ecology. 2nd English ed. Elsevier, Amsterdam.LEPONCE, M., ROISIN, Y., and PASTEELS, J. 1996. Intraspecific interactions in a community of
arboreal nesting termites (Isoptera: Termitidae). J. Insect Behav. 9:799–817.LIPKOVICH, I. and SMITH, E. P. 2002. Biplot and Singular Value Decomposition Macros for Excel*.
J. Stat. Software 7:1–15.MATSUURA, K. 2001. Nestmate recognition mediated by intestinal bacteria in a termite,
Reticulitermes speratus. Oikos 92:20–26.NEI, M. 1987. Molecular Evolutionary Genetics. Columbia University Press, New York.OZAKI, M., WADA-KATSUMATA, A., FUJIKAWA, K., IWASAKI, M., YOKOHARI, F., SATOJI, Y.,
NISIMURA, T., and YAMAOKA, R. 2005. Ant nestmate and non-nestmate discrimination by achemosensory sensillum. Science 309:311–314.
PIRK, C. W. W., NEUMANN, P., MORITZ, R. F. A., and PAMILO, P. 2001. Intranest relatedness andnestmate recognition in the meadow ant Formica pratensis (R.). Behav. Ecol. Sociobiol. 49:366–374.
QUELLER, D. C. and GOODNIGHT, K. F. 1989. Estimating relatedness using genetic markers.Evolution 43:258– 275.
RAYMOND, M. and ROUSSET, F. 1995. GENEPOP (version 1.2): A population genetics software forexact tests and ecumenism. J. Heredity 86:248–249.
SU, N.-Y. and HAVERTY, M. I. 1991. Agonistic behavior among colonies of the Formosansubterranean termite, Coptotermes formosanus Shiraki (Isoptera: Rhinotermitidae), fromFlorida and Hawaii: Lack of correlation with cuticular hydrocarbon composition. J. InsectBehav. 4:115–128.
TER BRAAK, C. J. F. 1987. Ordination, pp. 29–77, in R. H. G. Jongman, C. J. F. Ter Braak, O. F. R.Van Tongeren (eds.). Data Analysis in Community and Landscape Ecology. Pudoc,Wageningen.
THORNE, B. L., TRANIELLO, J. F. A., ADAMS, E. S., and BULMER, M. 1999. Reproductive dynamicsand colony structure of subterranean termites of the genus Reticulitermes (Isoptera Rhinoter-mitidae): A review of the evidence from behavioral, ecological and genetic studies. Ethol. Ecol.Evol. 11:149–169.
TSUTSUI, N. D., SUAREZ, A. V., HOLWAY, D. A., and CASE, T. J. 2000. Reduced genetic variationin the success of an invasive species. Proc. Natl. Acad. Sci. USA 97:5948–5953.
VANDER MEER, R. K. and MOREL, L. 1998. Nestmate recognition in ants, pp. 79–103, in R. K.Vander Meer, M. D. Breed, K. E. Espelie, and M. L. Winston (eds.). PheromoneCommunication in Social Insects: Ants, Wasps, Bees and Termites. Westview Press, Boulder,CO.
VARGO, E. L. 2000. Polymorphism at trinucleotide microsatellite loci in the subterranean termiteReticulitermes flavipes. Mol. Ecol. 9:817–829.
VARGO, E. L. 2003. Hierarchical analysis of colony and population genetic structure of the easternsubterranean termite, Reticulitermes flavipes, using two classes of molecular markers. Evolution57:2805–2818.
VIEAU, F. 2001. Comparison of the spatial distribution and reproductive cycle of Reticulitermessantonensis Feytaud and Reticulitermes lucifugus grassei Clement (Isoptera, Rhinotermitidae)suggests that they represent introduced and native species, respectively. Insectes Soc. 48:57–62.
WILSON, E. O. 1971. The Insect Societies. Harvard University Press, Cambridge.
1042 J Chem Ecol (2006) 32: 1027–1042