cutting red tape in canada: a regulatory reform model … · cutting red tape in canada: a...
TRANSCRIPT
Cutting Red Tape in Canada: A Regulatory Reform Model for the United States?
Laura Jones
MERCATUS RESEARCH
Copyright © 2015 by Laura Jones and the Mercatus Center at George Mason University
Release: November 2015
The opinions expressed in Mercatus Research are the authors’ and do not rep-resent official positions of the Mercatus Center or George Mason University.
ABSTRACT
Canada recently passed a federal law requiring that one regulation be removed for every new regulation introduced. This change has deep roots in a broader set of reforms from the province of British Columbia, designed to control red tape while preserving justified regulation. British Columbia’s model of regula-tory reform is notable for its success and longevity. Canada’s experience with regulatory reform offers some very practical lessons for US governments. The essential ingredients of effective reform include political leadership from the top, public reporting of clear metrics, and constraints on regulators. It is also very helpful to have a credible group outside government pushing for less red tape. In Canada’s case, that group was and continues to be small business.
JEL code: L51
Keywords: red tape, regulation, regulatory reform, government of British Columbia, one-for-one rule, small business
Laura Jones. “Cutting Red Tape in Canada: A Regulatory Reform Model for the United States?” Mercatus Research, Mercatus Center at George Mason University, Arlington, VA, November 2015.
MERCATUS CENTER AT GEORGE MASON UNIVERSIT Y
3
Canada recently became the first country in the world to legislate a cap on regulation. The Red Tape Reduction Act, which became law on April 23, 2015, requires the federal government to eliminate at least one regulation for every new one introduced.1 Remarkably, the
legislation received near-unanimous support across the political spectrum: 245 votes in favor of the bill and 1 opposed. This policy development has not gone unnoticed outside Canada’s borders.2
Canada’s federal government has captured headlines, but its approach was borrowed from the province of British Columbia (BC) where controlling red tape has been a priority for more than a decade.3 BC’s regulatory reform dates back to 2001 when a newly elected government put in place policies to make good on its ambitious election promise to reduce the regulatory burden by one-third in three years. The results have been impressive. The government has reduced regulatory requirements by 43 percent relative to when the initia-tive started.4 During this time period, the province went from being one of the poorest-performing economies in the country to being among the best. While there were other factors at play in the BC’s economic turnaround, members of the business community widely credit red tape reduction with playing a critical role.
1. When the government introduces a regulation that imposes a new administrative burden on busi-ness, at least one regulation must be eliminated. The legislation also requires that the new regulation add no cost burden to business, which may mean that more than one regulation must be eliminated.2. For example, when the Canadian legislation came into force, it was a featured story on National Public Radio (NPR). Uri Berliner, “Canada Cuts Down on Red Tape: Could It Work in the U.S.?” NPR, May 26, 2015, http://www.npr.org/2015/05/26/409671996/canada-cuts-down-on-red-tape -could-it-work-in-the-u-s.3. Other Canadian provinces also have borrowed elements of the BC model, including Newfoundland, Nova Scotia, Quebec, Ontario, and Saskatchewan. However, BC’s reforms are the most enduring and transparent.4. Government of British Columbia, “Count Overview Report,” Regulatory Reform BC, http://www2 .gov.bc.ca/assets/gov/government/about-the-bc-government/regulatory-reform/pdfs/march_2015 _rr_overview_by_ministry_web.pdf.
MERCATUS CENTER AT GEORGE MASON UNIVERSIT Y
4
The British Columbia model, while certainly not perfect, is among the most promising examples of regulatory reform in North America. It offers valuable lessons for US governments interested in tackling the important challenge of keeping regulations reasonable. The basics of the BC model are not complicated: political leadership, measurement, and a hard cap on regu-latory activity.
This paper describes British Columbia’s reforms, evaluates their effec-tiveness, and offers practical “lessons learned” to governments interested in the elusive goal of regulatory reform capable of making a lasting difference. It also offers some important lessons for business groups and think tanks outside government that are pushing to reduce red tape. These groups can make all the difference in framing the issue in such a way that it can gain wide support from policymakers. A brief discussion of the challenges of accurately defin-ing and quantifying regulation and red tape add context to understanding the BC model, and more broadly, some of the challenges associated with effective exercises in cutting red tape.
DEFINING RED TAPE
Red tape refers to rules, policies, and poor government services that do little or nothing to serve the public interest while creating financial cost or frustration to producers and consumers alike. Red tape may include poorly designed laws, regulations, and policies; outdated rules that may have been justified at one time but are no longer; and rules intentionally designed to burden some busi-nesses while favoring others. Red tape, as the term is used in this paper, stands in contrast to government laws, regulations, rules, and policies that support an efficient and effective marketplace and provide citizens and businesses with the protections they need. For the sake of keeping a clear distinction between the two, the latter will be referred to as “justified regulation” in this paper.5 The “broad regulatory burden” is composed of both justified regulation and red tape.
Some rules fall into the justified regulation category because they deliver a lot of benefits relative to their costs. Others, such as an eliminated BC regu-lation prescribing what size televisions BC restaurateurs could have in their
5. As an added complexity to creating clear definitions, governments use the term “regulation” in a narrow sense to refer to rules created directly by statutes while individuals affected by government rules tend to use the term more broadly to refer to rules in legislation, statutes, and policies, as well as time wasted trying to understand the rules. The broader definition is used in this paper except where noted.
MERCATUS CENTER AT GEORGE MASON UNIVERSIT Y
5
establishments, have little or no value and entail significant compliance costs, so they fall into the category of red tape. However, the difference between jus-tified regulation and red tape is not always straightforward in the messy real world where costs and benefits are not always easily quantified and one per-son’s red tape is another person’s justified regulation.
Despite measurement challenges, available evidence suggests that the broad regulatory burden is growing in both Canada and the United States. Given that red tape delivers very little benefit relative to its costs, it is reason-able to want to keep this piece of the broad regulatory burden to a minimum. This is easy to say but hard to do for a number of reasons. Part of the chal-lenge can be attributed to the loose language that is often used about regula-tory reform, especially the imprecise use of the terms regulation and red tape. People sometimes confuse cutting red tape, which most support at least in theory, with eliminating justified regulation, which most do not support in theory or practice.
In Canada, the language about government reform has evolved to put a heavy emphasis on the distinction between red tape and necessary or justified regulation, as exemplified in the title of the recently passed Red Tape Reduction Act. The Canadian Federation of Independent Business (CFIB), a not-for-profit small business advocacy group with 109,000 small business members, strongly promotes this distinction in its work with governments.6 For example, in 2010 it created an annual Red Tape Awareness Week to highlight the costs of red tape and to tell the stories of business owners affected by it. Politicians at both the provincial and federal levels of government make announcements about cutting red tape (as opposed to announcements about regulatory reform) dur-ing the week. For example, during the 2011 Red Tape Awareness Week, former prime minister Stephen Harper announced the creation of a Red Tape Reduc-tion Commission (which ultimately led to a number of reforms, including the one-in, one-out legislation explained above). The BC government used the 2015 Red Tape Awareness Week to announce that it was extending its policy of elimi-nating one regulatory requirement for every new one introduced to 2019 (it had been set to expire in 2015).7
6. CFIB as an organization and the author of this paper as its executive vice-president spend a con-siderable amount of time advocating on the issue of red tape with governments at all levels in Canada. Red tape reduction is the second highest priority of CFIB’s small business membership, behind eas-ing the total tax burden.7. British Columbia News, “B.C. Top of the Class in Canada for Cutting Red Tape,” press release, BC Gov News, January 20, 2015, https://news.gov.bc.ca/stories/bc-top-of-the-class-for-cutting -red-tape.
MERCATUS CENTER AT GEORGE MASON UNIVERSIT Y
6
QUANTIFYING REGULATION AND RED TAPE
Governments have three main ways of influencing behav-ior: taxing, spending, and regulating. All have benefits and costs. With taxation and government spending, however, the costs and benefits are more obvious. It is clear how much money the government collects in revenues and there is a high degree of transparency with respect to how the money is spent, although it can be tougher to evalu-ate outcomes of spending and the externality costs and benefits to third parties. The costs of the broad regula-tory burden and its two components, justified regulation and red tape, are considerably less clear. Much of the costs fall on those who must comply with the rules, and these costs are never quantified by governments, making them essentially a hidden tax. Regulatory benefits too can be challenging to quantify.
The challenges of measuring regulatory costs and benefits are not trivial because they make it difficult to assess how much the broad regulatory burden is costing, whether the costs are increasing, and how much of the broad regulatory burden is red tape. In spite of ongoing concern from business communities in both the United States and Canada that regulatory costs are too high and growing, governments tend to be reluctant to take the first necessary step to assess the burden: that is, to measure it. Reducing regulatory excess without measurement is like trying to lose weight without ever stepping on a scale—possible but not probable.8 A distinguishing feature of the BC model, discussed in the next section, is the govern-ment’s willingness to create and track its own measure of the broad regulatory burden.
While governments have been generally reluctant to quantify the regulatory burden, others have stepped up to
8. In my own experience advocating for red tape reduction in Canada, government officials often argue that they should not try to measure the reductions because the measurements are too crude, and the officials do not believe that existing quantitative results can be connected to making a qualitative difference. Another argument is that it would be too expensive to calculate the costs of regulation.
“Reducing regulatory excess without measurement is like trying to lose weight without ever stepping on a scale—possible but not probable.”
MERCATUS CENTER AT GEORGE MASON UNIVERSIT Y
7
the challenge, including researchers working for the Canadian CFIB, as well as the Mercatus Center at George Mason University, the Competitive Enter-prise Institute, and the Small Business Administration’s Office of Advocacy in the United States. Existing measures, albeit limited and imperfect, bring some valuable transparency to our understanding of the broad regulatory burden. Clyde Wayne Crews, author of numerous studies on the broad burden of regu-lation, explains,
Precise regulatory costs can never be fully known because, unlike taxes, they are unbudgeted and often indirect. But scat-tered government and private data exist about scores of regu-lations and about the agencies that issue them, as well as data about estimates of regulatory costs and benefits. Compiling some of that information can make the regulatory state some-what more comprehensible.9
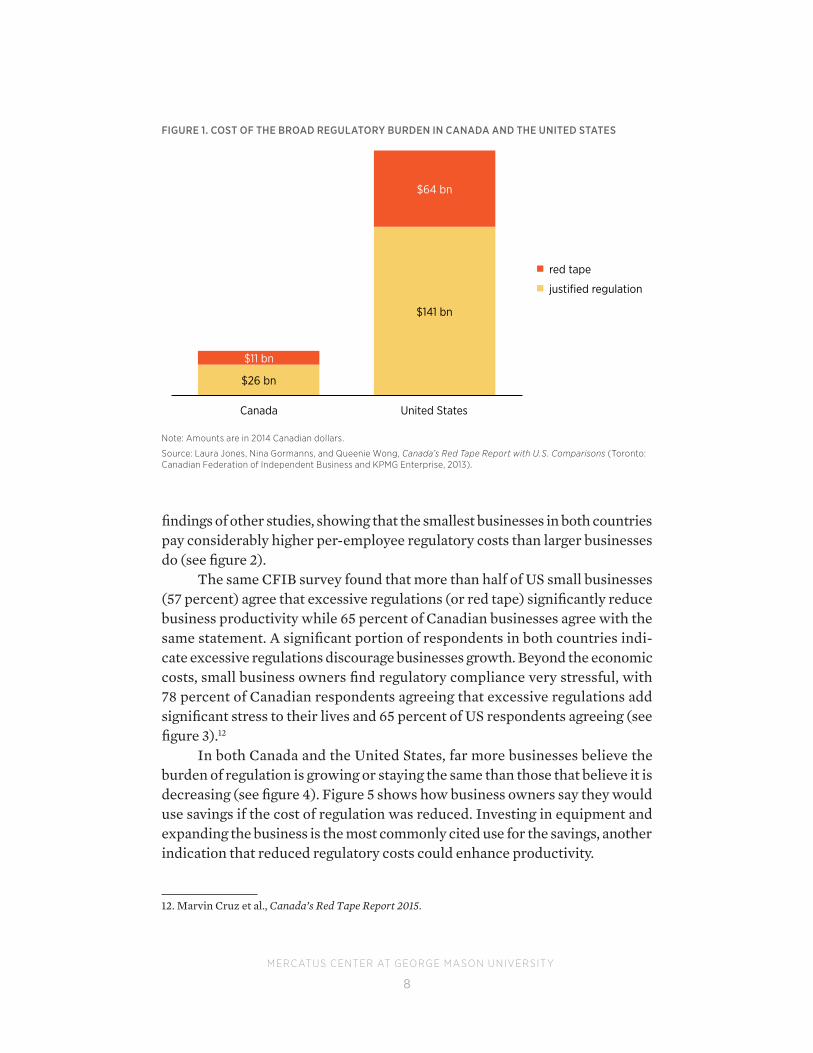
Using survey results from both Canada and the United States, CFIB esti-mates that broad regulatory costs for US businesses are around C$205 billion while Canadian businesses, far fewer in number, pay C$37 billion a year.10 What fraction of these broad costs might constitute red tape? When US small busi-nesses were asked how much of the burden of regulation could be reduced without sacrificing the public interest for these regulations, the average response was a 31 percent reduction (or C$64 billion a year) with Canadian respondents sharing a similar view on the fraction of the broad regulatory bur-den that is red tape (see figure 1).11 The survey results are consistent with the
9. Clyde Wayne Crews Jr., Ten Thousand Commandments: An Annual Snapshot of the Federal Regulatory State, 2014 ed. (Washington, DC: Competitive Enterprise Institute, 2014), 2.10. Marvin Cruz et al., Canada’s Red Tape Report 2015 (Toronto: Canadian Federation of Independent Business, 2015). C$205 billion is roughly equivalent to US$165 billion, and C$37 billion is equivalent to about US$30 billion. To estimate the cost of regulation in each country, CFIB conducted a survey of CFIB members in Canada and Ipsos Reid conducted a survey for CFIB in the United States. After eliminating outliers, the Canadian survey had 8,562 responses and the US survey had 1,535 responses. Respondents were asked questions about the time spent complying with existing rules and regula-tions and about money spent on accountants and lawyers for the sole purpose of complying with government rules. Respondents were also asked about fees spent on equipment. The responses were then divided into five categories according to size (fewer than 5 employees, 5–19 employees, 20–49 employees, 50–99 employees, and 100 or more employees). To determine the total cost for all firms, the national cost per employee for each firm size was multiplied by the total number of employed individuals corresponding to that firm size in each country. For a detailed discussion of the method-ology, see appendix B of the report.11. Laura Jones, Nina Gormanns, and Queenie Wong, Canada’s Red Tape Report with U.S. Comparisons (Toronto: Canadian Federation of Independent Business and KPMG Enterprise, 2013).
MERCATUS CENTER AT GEORGE MASON UNIVERSIT Y
8
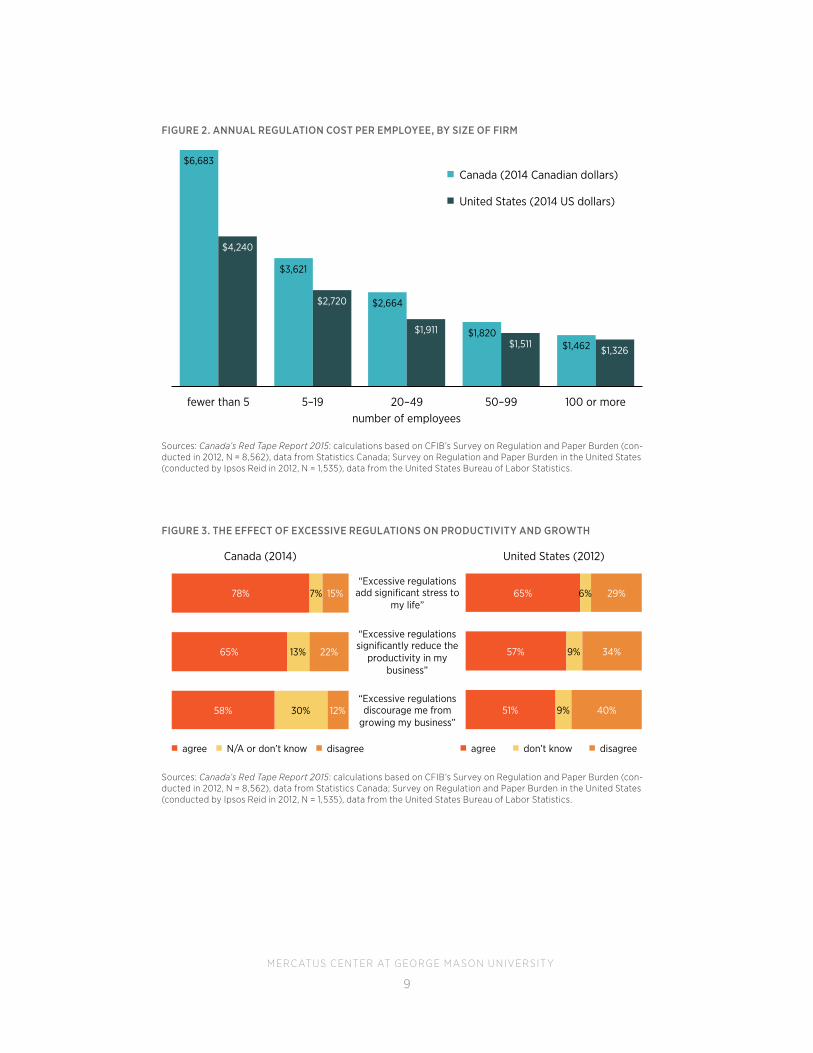
findings of other studies, showing that the smallest businesses in both countries pay considerably higher per-employee regulatory costs than larger businesses do (see figure 2).
The same CFIB survey found that more than half of US small businesses (57 percent) agree that excessive regulations (or red tape) significantly reduce business productivity while 65 percent of Canadian businesses agree with the same statement. A significant portion of respondents in both countries indi-cate excessive regulations discourage businesses growth. Beyond the economic costs, small business owners find regulatory compliance very stressful, with 78 percent of Canadian respondents agreeing that excessive regulations add significant stress to their lives and 65 percent of US respondents agreeing (see figure 3).12
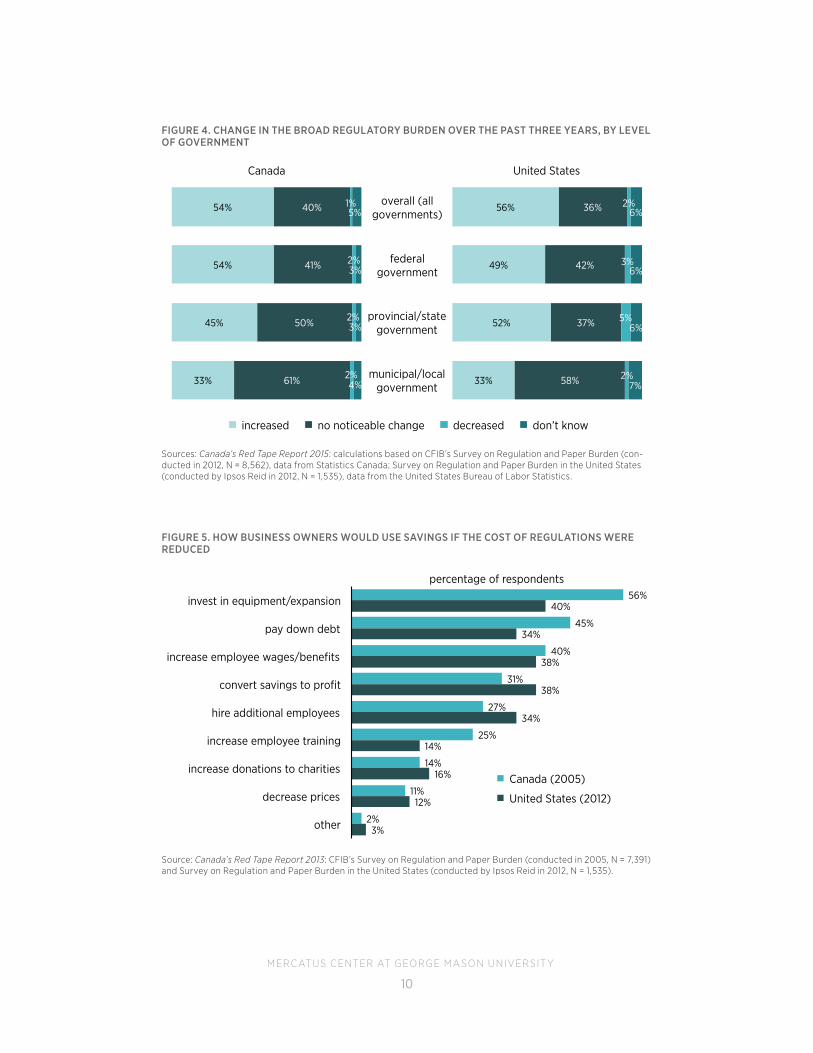
In both Canada and the United States, far more businesses believe the burden of regulation is growing or staying the same than those that believe it is decreasing (see figure 4). Figure 5 shows how business owners say they would use savings if the cost of regulation was reduced. Investing in equipment and expanding the business is the most commonly cited use for the savings, another indication that reduced regulatory costs could enhance productivity.
12. Marvin Cruz et al., Canada’s Red Tape Report 2015.
FIGURE 1. COST OF THE BROAD REGULATORY BURDEN IN CANADA AND THE UNITED STATES
Note: Amounts are in 2014 Canadian dollars.
Source: Laura Jones, Nina Gormanns, and Queenie Wong, Canada’s Red Tape Report with U.S. Comparisons (Toronto: Canadian Federation of Independent Business and KPMG Enterprise, 2013).
$26 bn
$141 bn
$11 bn
$64 bn
Canada United States
Cost of the Broad Regulatory Burden in Canada and the United States
red tape
justified regulation
MERCATUS CENTER AT GEORGE MASON UNIVERSIT Y
9
Sources: Canada’s Red Tape Report 2015: calculations based on CFIB’s Survey on Regulation and Paper Burden (con-ducted in 2012, N = 8,562), data from Statistics Canada; Survey on Regulation and Paper Burden in the United States (conducted by Ipsos Reid in 2012, N = 1,535), data from the United States Bureau of Labor Statistics.
FIGURE 2. ANNUAL REGULATION COST PER EMPLOYEE, BY SIZE OF FIRM
$6,683
$3,621
$2,664
$1,820 $1,462
$4,240
$2,720
$1,911 $1,511
$1,326
fewer than 5 5–19 20–49 50–99 100 or more number of employees
Annual Regulation Cost per Employee, by Size of Firm
Canada (2014 Canadian dollars)
United States (2014 US dollars)
Sources: Canada’s Red Tape Report 2015: calculations based on CFIB’s Survey on Regulation and Paper Burden (con-ducted in 2012, N = 8,562), data from Statistics Canada; Survey on Regulation and Paper Burden in the United States (conducted by Ipsos Reid in 2012, N = 1,535), data from the United States Bureau of Labor Statistics.
FIGURE 3. THE EFFECT OF EXCESSIVE REGULATIONS ON PRODUCTIVITY AND GROWTH
78%
65%
58%
7%
13%
30%
15%
22%
12%
The Effect of Excessive Regulations on Productivity and Growth
65%
57%
51%
6%
9%
9%
29%
34%
40%
United States (2012)
agree don’t know disagree
78%
65%
58%
7%
13%
30%
15%
22%
12%
Canada (2014)
agree N/A or don’t know disagree
“Excessive regulations significantly reduce the
productivity in my business”
“Excessive regulations add significant stress to
my life”
“Excessive regulations discourage me from
growing my business”
MERCATUS CENTER AT GEORGE MASON UNIVERSIT Y
10
Sources: Canada’s Red Tape Report 2015: calculations based on CFIB’s Survey on Regulation and Paper Burden (con-ducted in 2012, N = 8,562), data from Statistics Canada; Survey on Regulation and Paper Burden in the United States (conducted by Ipsos Reid in 2012, N = 1,535), data from the United States Bureau of Labor Statistics.
FIGURE 4. CHANGE IN THE BROAD REGULATORY BURDEN OVER THE PAST THREE YEARS, BY LEVEL OF GOVERNMENT
0% 10% 20% 30% 40% 50% 60% 70% 80% 90% 100%
overall (all governments)
federal government
provincial/state government
municipal/local government
Change in the Broad Regulatory Burden over the Past Three Years, by Level of Government
increased no noticeable change decreased don’t know
54%
54%
45%
33%
40%
41%
50%
61%
1%
2%
2%
2%
5%
3%
3%
4%
Canada
56%
49%
52%
33%
36%
42%
37%
58%
2%
3%
5%
2%
6%
6%
6%
7%
United States
overall (all governments)
federal government
provincial/state government
municipal/local government
Source: Canada’s Red Tape Report 2013: CFIB’s Survey on Regulation and Paper Burden (conducted in 2005, N = 7,391) and Survey on Regulation and Paper Burden in the United States (conducted by Ipsos Reid in 2012, N = 1,535).
FIGURE 5. HOW BUSINESS OWNERS WOULD USE SAVINGS IF THE COST OF REGULATIONS WERE REDUCED
56%
45%
40%
31%
27%
25%
14%
11%
2%
40%
34%
38%
38%
34%
14%
16%
12%
3%
invest in equipment/expansion
pay down debt
increase employee wages/benefits
convert savings to profit
hire additional employees
increase employee training
increase donations to charities
decrease prices
other
percentage of respondents
How Business Owners Would Use Savings If the Cost of Regulations Were Reduced
Canada (2005)
United States (2012)
MERCATUS CENTER AT GEORGE MASON UNIVERSIT Y
11
A very different way to quantify the broad regulatory burden is to track it by volume—by counting the number of regulations, the number of require-ments associated with regulations, or the number of pages of regulations. An example of the approach of counting the number of regulatory restrictions is the Mercatus Center’s database called RegData, which counts the number of regulatory restrictions in the Code of Federal Regulations (using a count of restrictive terms such as “shall not” and “must”).13 According to its data, as of 2012, there were 1,040,940 restrictions in the Code of Federal Regulations, an increase of 28 percent since 1997. RegData also quantifies how many additional restrictions are in place as a result of new laws such as the Dodd-Frank Wall Street Reform and Consumer Protection Act, which has added over 27,000 new federal restrictions since 2010, compared to all other laws passed by the Obama administration (roughly 25,500).14 RegData considers only federal regulations (as mentioned previously, government rules also can exist in legislation and other government policies), and it does not attempt to differentiate red tape from justified regulation. The Mercatus database has the advantage of being more objective than survey-based approaches, as it does not rely on perceptions and estimates of time and money spent on regulation.
Using yet another approach with a more complex methodology, Nicole Crain and Mark Crain wrote a report for the Small Business Administration’s Office of Advocacy, in which they estimate that the cost of federal regulations in the United States in 2008 was $1.75 trillion (14 percent of US GDP), up from $1.1 trillion in 2005 and $843 billion in 2001.15 The cost of US regulation in this study is significantly larger than the estimate from the survey-based approach of the CFIB, underscoring how challenging it is to estimate regulatory costs.
The US Congress requires the Office of Management and Budget to sub-mit a report each year estimating the annual benefits and costs of federal regu-lation to the extent feasible. The report for 2014 estimates the benefits of fed-eral regulation to be between $217 billion and $863 billion from October 1, 2003, to September 30, 2013, while the costs over the same period are estimated at somewhere between $57 billion and $84 billion (in 2001 dollars).16 However,
13. Omar Al-Ubaydli and Patrick A. McLaughlin, “RegData: A Numerical Database on Industry-Specific Regulations for All US Industries and Federal Regulations, 1997–2012” (Mercatus Working Paper, Mercatus Center at George Mason University, Arlington, VA, November 2014).14. Ibid.15. Nicole V. Crain and W. Mark Crain, The Impact of Regulatory Costs on Small Firms (Washington: US Small Business Administration, Office of Advocacy, September 2010).16. Office of Management and Budget, Office of Information and Regulatory Affairs, 2014 Report to Congress on the Benefits and Costs of Federal Regulations and Unfunded Mandates on State, Local, and Tribal Entities, 2015.
MERCATUS CENTER AT GEORGE MASON UNIVERSIT Y
12
the estimates only cover a small fraction of the total rules. Richard Williams and James Broughel find that for fiscal years 2003–2012, OMB reported both cost and benefit numbers for only 0.3 percent of the regulations.17 Both the wide range of the estimates and the limited scope of what they cover once again underscore the challenge of quantifying the costs and benefits of regulation.
The standard cost model, initially used in the Netherlands, is a way of measuring part of the overall regulatory burden.18 Popular with European gov-ernments, this model estimates the amount businesses spend administering regulations, but it makes no attempt to divide the regulations into those that are legitimate and those that would be considered red tape. Denmark, the Nether-lands, and Norway have used the model to track progress toward their respec-tive reduction targets of 25 percent. Although some European countries have embraced the model as a credible way to measure, it does have drawbacks. The methodology is complex (the user’s guide is 63 pages long) and it is much more difficult to implement than the BC measure discussed in the next section.
This brief discussion of some of the available measures of the regulatory burden leads to two important conclusions. First, measuring the broad regu-latory burden, and determining what portion of that burden may constitute red tape, is a challenging and imperfect undertaking. However, measurement is also an essential part of effective red tape reduction. One of the difficulties that governments interested in effective red tape reduction face is finding a clear, credible measure they can be comfortable using in spite of its inevitable imperfections. Second, available evidence suggests that the broad regulatory burden, including red tape, is large and growing, and that reducing red tape is a worthy policy objective. Both of these observations make the BC model of red tape reduction discussed below very relevant.
BRITISH COLUMBIA’S EXPERIENCE WITH RED TAPE REDUCTION
British Columbia is Canada’s westernmost province, with a population of 4.6 million people (roughly the same population as Louisiana) and a GDP of
17. Richard Williams and James Broughel, “Government Report on Benefits and Costs of Federal Regulations Fails to Capture Full Impact of Rules,” Mercatus Center at George Mason University, December 2, 2013, http://mercatus.org/publication/government-report-benefits-and-costs-federal -regulations-fails-capture-full-impact-rules.18. SCM Network, International Standard Cost Model Manual: Measuring and Reducing Administrative Burdens for Business, accessed November 9, 2015, www.oecd.org/gov/regulatory -policy/34227698.pdf.
MERCATUS CENTER AT GEORGE MASON UNIVERSIT Y
13
approximately C$220 billion.19 BC’s small open economy is reasonably well diversified, with important sectors includ-ing forestry, mining, oil and gas, agriculture, tourism, finan-cial services, real estate, technology, and film products.
The context for BC’s experience with regulatory reform was set in the 1990s, a time widely known as BC’s “dismal decade,”20 when economic growth and employ-ment lagged behind the rest of the country.21 The New Democratic Party government came to power in 1991 and raised taxes and increased regulation. The attitude of the government toward the economy in the 1990s is captured well by the comments of former premier Glen Clark, who was in power for most of that period. Shortly after leaving office, he told a reporter, “We were an old-fashioned activ-ist government, with no more money. So you’re naturally driven to look at ways you can be an activist without cost-ing anything. And that leads to regulation.”22
It is no surprise that, during this period, too much regulation or red tape was often cited as a significant con-tributor to BC’s economic underperformance, and the province had a reputation within Canada for regulatory excess. Forest companies were told what size nails to use when building bridges over streams. Restaurants were told what size televisions they could have. Golf clubs had to have a certain number of par-four holes, and the maximum patron capacity for ski hill lounges was based on the num-ber of vertical feet it took to get to the top of the mountain.23
The forest industry, one of the province’s main eco-nomic drivers, was burdened with a prescriptive Forest
19. Using the exchange rate of 0.7982 (Feb 10, 2015, Bank of Canada) C$220 billion is equivalent to US$176 billion.20. The “dismal decade” language captured the public imagination and is still used today. Media referred to it during the 2013 election.21. Satinder Chera and Fazil Mihlar, The Government of British Columbia, 1991–1998: An Assessment of Performance and a Blueprint for Economic Recovery (Vancouver: The Fraser Institute, 1998).22. David Beers, “Glen Clark Unplugged,” Vancouver Sun, August 3, 2001.23. Government of British Columbia, Ministry of Small Business and Economic Development, Ministry of Small Business and Economic Development Deregulation Report, October 2004.
“Golf clubs had to have a certain number of par-four holes, and the maximum patron capacity for ski hill lounges was based on the number of vertical feet it took to get to the top of the mountain.”
MERCATUS CENTER AT GEORGE MASON UNIVERSIT Y
14
Practices Code that was widely cited as a deterrent to investment. Accord-ing to one estimate, forestry regulations had added over $1 billion to the industry’s costs with no public benefit.24 The mining industry, another eco-nomic driver, was also suffering. In a 1998 survey of mining companies, Brit-ish Columbia’s overall investment policies scored last out of 31 jurisdictions on an investment attractiveness index, receiving a score of 5 points out of a possible 100. BC was the worst jurisdiction on several red tape indicators contributing to the index, such as “uncertainty concerning the administra-tion, interpretation and enforcement of existing regulations” (76 percent indicated this was a strong deterrent to investment), and “regulatory dupli-cation and inconsistencies” (62 percent indicated this was a strong deterrent to investment).25
Elections in British Columbia tend to be quite close, but in 2001 concern over the economy—including uncompetitive tax and regulatory policies, defi-cits, and costs of infrastructure projects—contributed to a landslide victory of the Liberal Party (a center-right coalition) over the incumbent New Demo-cratic Party (a left-of-center party) that had been in power since 1991; 77 of 79 seats in the election were won by Liberal candidates.
THE EARLY YEARS OF RED TAPE REDUCTION IN BRITISH COLUMBIA: 2001–2005
During the 2001 election campaign, the soon-to-be-elected Liberal government made the commitment to reduce the regulatory burden by one-third in three years. Once elected, Premier Gordon Campbell wasted no time in taking steps to accomplish his government’s goal. In his first cabinet, the premier appointed Kevin Falcon to the newly created position of minister of state for deregulation. Falcon’s only responsibility was regulatory reform, and he reported regularly at cabinet meetings.
The choice of the strong word “deregulation” reflected the context in which the reforms were undertaken—a province emerging from a “dismal decade” needed big policy changes. The minister of deregulation’s first chal-lenge was to develop a new regulatory policy and to figure out what measure the government would use to determine the success of its commitment to
24. Cornelis G. Van Kooten and Sen Wang, “Estimating Economic Costs of Nature Protection: British Columbia’s Forest Regulations,” Canadian Public Policy (May 1998).25. Fraser Institute, The Fraser Institute Annual Survey of Mining Companies Operating in North America, 1998/1999 (Vancouver: Fraser Institute, 1998). Recent editions of the survey show a greatly improved performance on all the indicators cited here, with an overall policy ranking of 75 out of 100.
MERCATUS CENTER AT GEORGE MASON UNIVERSIT Y
15
reduce the regulatory burden by one-third. Over time, the language changed from “deregulation” to “regulatory reform” and “red tape reduction.”
Falcon rejected several crude regulation measures used by think tanks and academics in the past.26 For example, he decided not to count pages of regu-lations or to simply count regulations, as each individual regulation can have literally thousands of requirements associated with it. To understand the differ-ence between counting “regulations” and counting “regulatory requirements,” consider that the Workers Compensation Act (legislation governing workplace safety) has nine regulations associated with it, but these nine regulations con-tain 35,308 regulatory requirements.
The minister chose to use regulatory requirements as his counting tool. The regulatory requirement measure was unique to BC at the time. It is similar to the measure that the Mercatus Center is now using for its RegData project. One important difference between the RegData measure and the BC measure is that BC’s measure included requirements found in policies and legislation as well as in regulations, so it is quite comprehensive. A “regulatory requirement” is defined in BC’s Regulatory Reform Policy (see attachment) as “an action or step that must be taken, or piece of information that must be provided in accordance with government legislation, regulation, policy or forms, in order to access services, carry out business or pursue legislated privileges.” For example, writing your name on a form or being required to have a safety committee meet-ing would each count as one regulatory requirement. To develop a baseline count of regulatory requirements, each ministry conducted its own count of all the regulatory requirements contained in the statutes, regulations, and poli-cies that ministry oversaw. A central regulatory requirement database, admin-istered by the newly created Deregulation Office, was established to track prog-ress against the baseline and issue regular reports. The first government-wide count revealed 382,139 regulatory requirements (the regulation count, which was not used, would have been a much less compelling 2,200).27
The regulatory requirement measure has several advantages, including its simplicity and granularity relative to the much cruder regulation measure.
26. Personal conversation with Kevin Falcon in June 2001. Falcon was looking for a way to bench-mark the commitment to reduce regulation by one-third and we discussed some of the challenges with respect to counting regulations or pages. He understood the limitations of these cruder mea-sures and developed his own “regulatory requirement” measure.27. The initial counts were done over the course of several months with the help of interns. This ini-tial count was subsequently revised to 360,295 to eliminate some double counting. The budget for the Regulatory Reform Office is not broken out separately but based on personal correspondence with the Regulatory Reform Office in 2009 is estimated to be around C$460,000 a year. The Regulatory Reform Office staffing and budget has experienced only minor fluctuations since 2001.
MERCATUS CENTER AT GEORGE MASON UNIVERSIT Y
16
However, like other measures, it has its flaws. For example, a regulatory require-ment could be something that only a few people have to do once a year or it could be something that many people have to do multiple times a year. The impact of these requirements is vastly different, yet each would count as one regulatory requirement.28 The measure could evolve to include frequency of reporting.
Setting a clear target for regulatory reduction and establishing a clear and compelling measure for evaluating success are two things that differenti-ate BC’s regulatory reform initiative from other initiatives. In contrast, many regulatory reform initiatives focus on identifying specific irritants. These ini-tiatives have a track record of failing to make much difference because, as the specific irritants are dealt with, others proliferate—the equivalent of pulling a few weeds in an overgrown garden.
One example of this is the prior BC government’s announcement in the 1998 budget that cutting red tape would be a priority. The government set up the Small Business Task Force, which focused on specific initiatives such as streamlining filing and registration requirements and simplifying approval pro-cesses. These are worthy objectives, but it is hard to see how they contribute to an overall reduction without the discipline of an aggregate measure in place.29
Another common approach to regulatory reform is to institute some form of regulatory impact analysis (RIA) that is essentially an internal checklist for regulators who must go through the exercise of evaluating the costs and ben-efits of new regulations. The United States and Canada, as well as many other developed countries, use a form of RIA process at the federal and state or pro-vincial level (not all US states have a RIA process). While RIAs may improve the regulatory process, they have not proved an effective approach for reducing red tape for at least three reasons: they are not subject to much public scrutiny, they do not cover a broad enough scope, and they set no overall limit on the total volume of regulatory activity.30
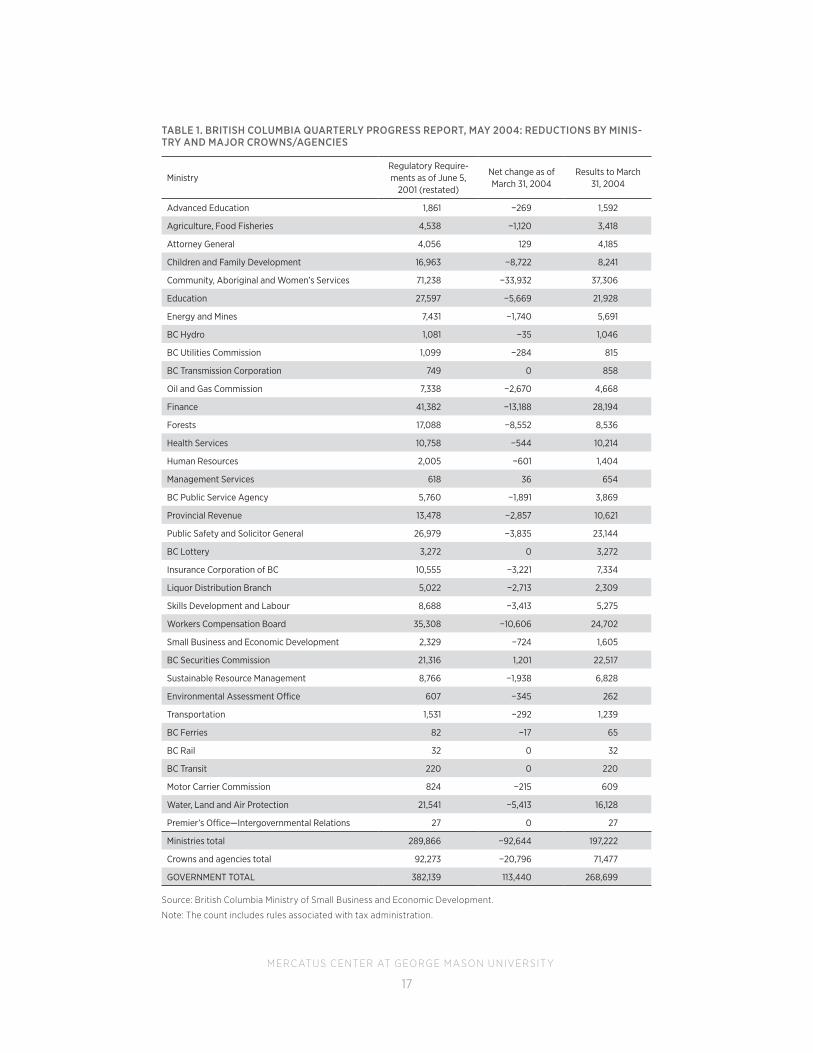
Of course having a measure is not enough, it also must be monitored. In BC’s case, the measure was monitored closely. During the initial years of the reform, the BC government publicly issued quarterly reports showing how many regulatory requirements each ministry had reduced. Table 1 is a quarterly report
28. The standard cost model discussed in the previous section would capture more of this but only for requirements found in regulations (not legislation or policies). The standard cost model is also much more complicated and would have taken far longer to implement.29. Ministry of Finance and Corporate Relations, “Budget ’98 Cuts Taxes and Red Tape to Stimulate B.C. Economy, Encourage Investment and Create Jobs,” press release, March 30, 1998.30. For a good discussion of the limitations of RIAs, see Jerry Ellig and Richard Williams, “Reforming Regulatory Analysis, Review, and Oversight: A Guide for the Perplexed” (Mercatus Working Paper, Mercatus Center at George Mason University, Arlington, VA, August 2014).
MERCATUS CENTER AT GEORGE MASON UNIVERSIT Y
17
TABLE 1. BRITISH COLUMBIA QUARTERLY PROGRESS REPORT, MAY 2004: REDUCTIONS BY MINIS-TRY AND MAJOR CROWNS/AGENCIES
MinistryRegulatory Require-ments as of June 5,
2001 (restated)
Net change as of March 31, 2004
Results to March 31, 2004
Advanced Education 1,861 −269 1,592
Agriculture, Food Fisheries 4,538 −1,120 3,418
Attorney General 4,056 129 4,185
Children and Family Development 16,963 −8,722 8,241
Community, Aboriginal and Women’s Services 71,238 −33,932 37,306
Education 27,597 −5,669 21,928
Energy and Mines 7,431 −1,740 5,691
BC Hydro 1,081 −35 1,046
BC Utilities Commission 1,099 −284 815
BC Transmission Corporation 749 0 858
Oil and Gas Commission 7,338 −2,670 4,668
Finance 41,382 −13,188 28,194
Forests 17,088 −8,552 8,536
Health Services 10,758 −544 10,214
Human Resources 2,005 −601 1,404
Management Services 618 36 654
BC Public Service Agency 5,760 −1,891 3,869
Provincial Revenue 13,478 −2,857 10,621
Public Safety and Solicitor General 26,979 −3,835 23,144
BC Lottery 3,272 0 3,272
Insurance Corporation of BC 10,555 −3,221 7,334
Liquor Distribution Branch 5,022 −2,713 2,309
Skills Development and Labour 8,688 −3,413 5,275
Workers Compensation Board 35,308 −10,606 24,702
Small Business and Economic Development 2,329 −724 1,605
BC Securities Commission 21,316 1,201 22,517
Sustainable Resource Management 8,766 −1,938 6,828
Environmental Assessment Office 607 −345 262
Transportation 1,531 −292 1,239
BC Ferries 82 −17 65
BC Rail 32 0 32
BC Transit 220 0 220
Motor Carrier Commission 824 −215 609
Water, Land and Air Protection 21,541 −5,413 16,128
Premier’s Office—Intergovernmental Relations 27 0 27
Ministries total 289,866 −92,644 197,222
Crowns and agencies total 92,273 −20,796 71,477
GOVERNMENT TOTAL 382,139 113,440 268,699
Source: British Columbia Ministry of Small Business and Economic Development.
Note: The count includes rules associated with tax administration.
MERCATUS CENTER AT GEORGE MASON UNIVERSIT Y
18
from May 2004. The reports were discussed regularly at cabinet meetings and created a strong culture of account-ability across government.
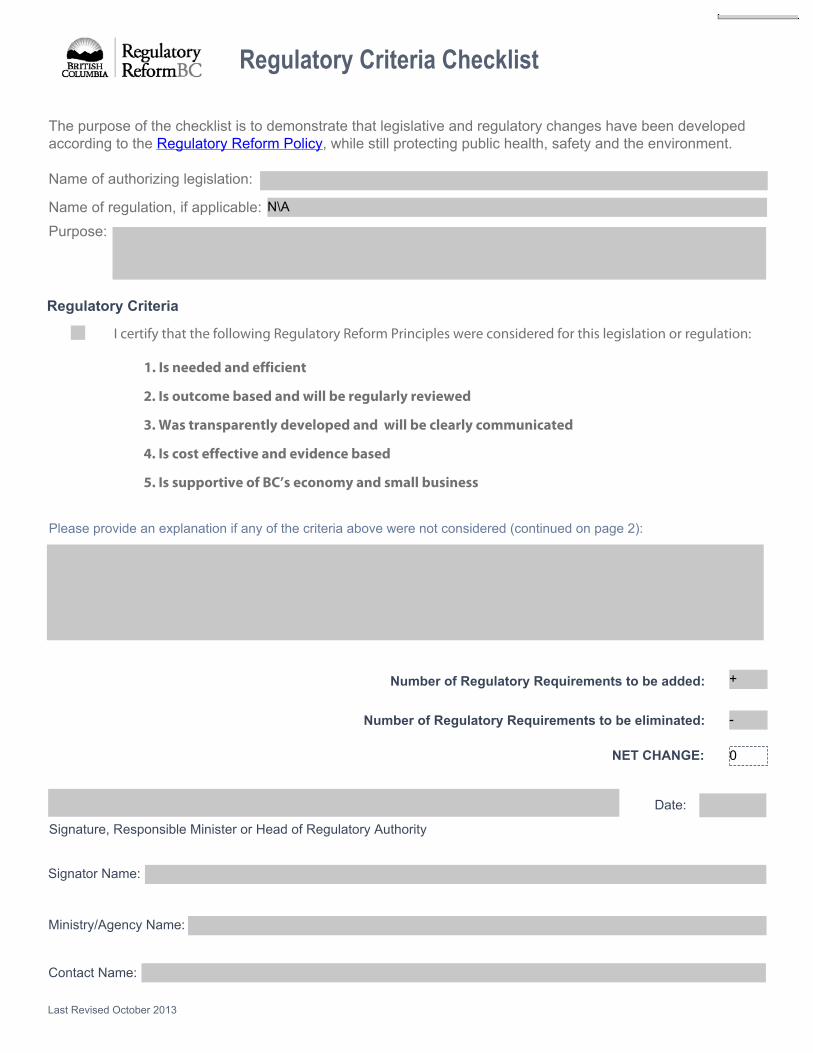
Measurement was critical to assessing whether the political commitment of reducing the regulatory burden by one-third had been met, and it was the cornerstone of the government’s overall Regulatory Reform Policy (attached), which was approved by Executive Council in August 2001, just three months after the election. The Reform Policy applies to all proposed legislation, regulations, and related policies. This broad application is another important fea-ture of BC’s reforms because much of what the private sector experiences as regulatory burden is in the form of policies and forms rather than in legislation or regulations. Another virtue of the Regulatory Reform Policy is that it is very simple. The entire policy, including definitions, a checklist, an exemption form, and an example is only seven pages long and written in very straightforward language (BC’s Regulatory Reform Policy and Regulatory Criteria Checklist are attached).
Complying with the Reform Policy involves two important steps. First, the Regulatory Criteria Check-list must be completed. The checklist has evolved a bit over time, but it essentially requires ministers to confirm that any new rules are needed and that they are outcome based, transparently developed, cost effective, evidence based, and support BC’s economy and small business.31 Where these criteria are not considered or met an expla-nation must be provided. At the end of the form, there is a box that asks how many regulatory requirements will be added and how many will be eliminated, as well as what
31. The original 10 criteria were reverse onus: need for regulation is justi-fied; regulatory design: regulation is results based; transparency: transpar-ent development of regulatory requirements; cost-benefit analysis: com-pleted for requirements; competitive analysis: completed for requirements; harmonized: requirements are harmonized with other jurisdictions, avoid-ing duplication; timeliness: response time is considered; plain language: plain language is used; sunset review and expiry provisions: evaluation of regulations has been considered; replacement principle: additional regula-tory requirements have been avoided.
“The decentralized approach to achieving progress likely helped create buy-in. . . . When ministry staff realized that they were in charge of determining changes within their own ministries, the reforms became easier to embrace.”
MERCATUS CENTER AT GEORGE MASON UNIVERSIT Y
19
the net change will be. The responsible minister or head of the regulatory authority must sign the form and submit it to the Regulatory Reform Office.32 In addition, he or she must make the Regulatory Criteria Checklist available to the public, at no charge, on request.
When the BC government first introduced the Reform Policy in 2001, two regulatory requirements had to be eliminated for every one introduced. At one point, the ratio was five to one, but today the policy calls for eliminating one requirement for every new one introduced. That policy expires in 2019.
In 2001, requiring regulators to consider the checklist and eliminate two regulatory requirements for every new one introduced represented a dramatic change in thinking about regulation in BC: It put the onus on the government to make the case that additional regulation was necessary, to ensure adequate consultation, to keep compliance flexible, and to reduce the total amount of regulation. One public official commented that it changed her role from regula-tion “maker” to regulation “manager.”
While the new Reform Policy did change the attitude of those in gov-ernment over time, there was a lot of initial internal resistance. However, the decentralized approach to achieving progress likely helped create buy-in. Not only were ministries tasked with conducting their own regulatory counts, but each minister was asked to identify how his or her three-year business plan would meet the one-third reduction target.33 When ministry staff realized that they were in charge of determining changes within their own ministries, the reforms became easier to embrace. The Deregulation Office was not going to tell them specifically what to do, but it was there to offer guidance, support, and feedback from industry about what regulations and policies were consid-ered especially problematic. In addition, the House Leader—the person in the legislature responsible for ensuring government bills become law—had guar-anteed that any legislation needed to reduce regulatory requirements would get on the agenda. This guarantee proved a powerful incentive for ministry staff who could sometimes toil away for years on projects that would never see the light of day.34
32. There are limited exemptions to using the checklist, such as changes that are nonregulatory in nature and changes that relate only to the procedures or practices of a court or tribunal. The Regulatory Reform Policy (attached) also includes a more open-ended exemption is provided if “the special circumstances of the case, as identified by the responsible minister or head of the regulatory authority, make it impracticable to comply with the regulatory criteria.”33. The three-year plans for regulatory reductions were not made public. However, ministries would often announce a review of a particular act or set of regulations and ask for submissions containing suggestions from interested stakeholders.34. Personal communication with the former director of regulatory reform.
MERCATUS CENTER AT GEORGE MASON UNIVERSIT Y
20
The three-year timeline proved to be a smart choice. It created enough urgency around eliminating regulatory requirements while being enough time to inculcate new habits and acceptance to the new way of doing things.35
Another feature of the first phase of the reform was an extensive set of consultations with the private sector. The Red Tape Task Force, largely made up of industry representatives, was established and tasked with reviewing and prioritizing 150 different submissions with 600 proposals for reform from the business community. Each minister was asked to prepare a three-year deregu-lation plan outlining how targets would be met. The minister of deregulation gave the priorities and recommendations of the Red Tape Reduction Task Force to other ministers to consider as they prepared these plans.36
Some of the major changes during this period included making significant amendments to the Workers’ Compensation and Employment Standards Acts in order to increase flexibility; reviewing more than 3,000 fees and licenses across government and eliminating, consolidating, or devolving 43 percent of them; streamlining the Forest Practices Code; and amending mining, oil, and gas regulations in order to increase flexibility and reduce administration.37
By 2004, BC’s premier and minister of deregulation had been successful at achieving their stated regulatory reduction objective. The number of regula-tory requirements eliminated at the end of three years was 37 percent, exceed-ing the one-third target. There is no question that political leadership and disciplined measurement and reporting were critical to achieving this success.
MAINTAINING RED TAPE REDUCTION: THE MIDDLE YEARS 2004–2013
Between 2004 and 2013, regulatory reform was a lower priority for the govern-ment. Around the time when the one-third reduction target was met, the min-ister of deregulation position was eliminated. The Regulatory Reform Office became part of the Ministry of Small Business and Economic Development. The minister responsible was enthusiastic about regulatory reform, but in con-trast to the minister of deregulation, he had a long list of other priorities.
35. In 2007, the Canadian federal government set a target to reduce federal regulatory requirements by 20 percent in one year. There was an enormous amount of resistance within the public service to this project, and one year proved too short to change the internal culture. The project died after the initial target was met in 2008.36. The minister of deregulation asked his colleagues to address the concerns raised by the Red Tape Task Force unless there was a good reason not to. He was not at all prescriptive about how the con-cerns were addressed.37. Ministry of Small Business and Economic Development Deregulation Report.
MERCATUS CENTER AT GEORGE MASON UNIVERSIT Y
21
As the deadline for meeting the one-third reduction target approached, it became clear that the government had no plans to continue tracking regula-tory requirements beyond 2004. Small businesses were concerned that regu-latory creep would set in unless the regulatory counting continued. Armed with survey results showing that small businesses wanted government to keep measuring, the Canadian Federation of Independent Business lobbied the minister and his colleagues to establish a new target to maintain the regu-latory reduction.
The lobbying effort was successful and the minister agreed to a target for no net increase in regulatory requirements through 2008 (a one-in, one-out rule). The policy of no net increase has subsequently been extended three times—to 2012, to 2015, and, earlier this year, to 2019.38 Pressure from small business to keep a target in place has been critical to preserving the reforms. The target provided a hard-cap constraint on regulators and meant that mea-surement had to continue. However, there was not much political appetite to build on the reforms and go beyond what had already been achieved.
This period was also characterized by high turnover of staff in the Regu-latory Reform Office, with none of the original staff remaining. This situation did not prove difficult in terms of understanding or overseeing regulatory reform, as the policy is concise and clearly written. However, there were many small indications that momentum was fading at the bureaucratic level. For example, the Regulatory Reform Office stopped holding annual conferences to share best practices, and it did not stay up to date in publishing its quarterly reports online.
In November of 2010, a new premier, Christy Clark, was sworn in. Con-trolling red tape did not seem to be high on her list of priorities. Regulatory reform went into maintenance mode with one important exception: Respon-sibility for the Regulatory Reform Office went back to the original architect of the reforms, Kevin Falcon. He helped make the reforms more permanent by promoting legislation (which passed in 2011) requiring the government to produce an annual report on regulation that included measurement. CFIB had been lobbying for this change for a number of years based on the concern that a future government might undo the reforms. Legislation requiring annual reporting would make this harder.
38. The Canadian federal government’s one-for-one rule applies to regulations, not regulatory requirements, as in BC. The federal legislation would be more comprehensive if it used regulatory requirements, as these are found in legislation, regulation, and policies.
MERCATUS CENTER AT GEORGE MASON UNIVERSIT Y
22
SURVIVING A CHANGE IN LEADERSHIP, 2013–PRESENT
Premier Clark’s Liberal Party won the 2013 election with a solid majority. Her campaign had focused on the importance of balancing the budget, paying off debt, and developing a liquefied natural gas industry in the province.
In her first mandate letters to her ministers, Premier Clark emphasized the importance of minimizing red tape. She also announced a core review of government services and made regulatory improvement an important part of the review. This energized the Regulatory Reform Office, and it has been seriously looking at ideas for building on, rather than just maintaining, the existing red tape reforms. As reported above, during the 2015 Red Tape Aware-ness Week, the small business minister announced the one-in, one-out policy would be extended through 2019. More recently, the government passed a law creating a Red Tape Reduction Day to be held every year on the first Wednes-day in March. The language in the release suggests the government itself has embraced the importance of an ongoing commitment to reform: “The new legislation institutionalizes the accountability and transparency in British Columbia.”39 The minister responsible also launched a consultation with Brit-ish Columbians to solicit new ideas for cutting red tape, including encourag-ing people to use the Twitter hashtag #helpcutredtape to communicate their suggestions.
It is worth noting that, while BC’s Regulatory Reform Policy is very broad, it does not cover a few arm’s-length-from-government groups in BC that have the ability to impose rules on businesses. In some cases, these groups are clearly creating red tape, and their exemption from BC’s policy is problematic.
DID REGULATORY REFORM MAKE A DIFFERENCE TO BRITISH COLUMBIA’S ECONOMIC PERFORMANCE?
There is no question that BC’s economic performance improved markedly after 2001 in contrast to the “dismal decade” of the 1990s. The province went from being one of the worst performing in the country to being among the best. How big a contribution did regulatory reform make to BC’s economic turnaround? It is hard to answer that question definitively because regulatory reform was part of a broader package of economic reforms happening at the same time. For example, when the Liberals came into office, one of the first things they did
39. British Columbia Ministry of Small Business and Red Tape Reduction, “B.C. Puts the Spotlight on Cutting Red Tape,” news release, September 30, 2015, https://news.gov.bc.ca/releases/2015 SBRT0010-001627.
MERCATUS CENTER AT GEORGE MASON UNIVERSIT Y
23
was reduce personal income tax rates across the board by 25 percent, eliminate the provincial sales tax on produc-tion machinery and equipment, and eliminate the corpo-rate capital tax on nonfinancial institutions.
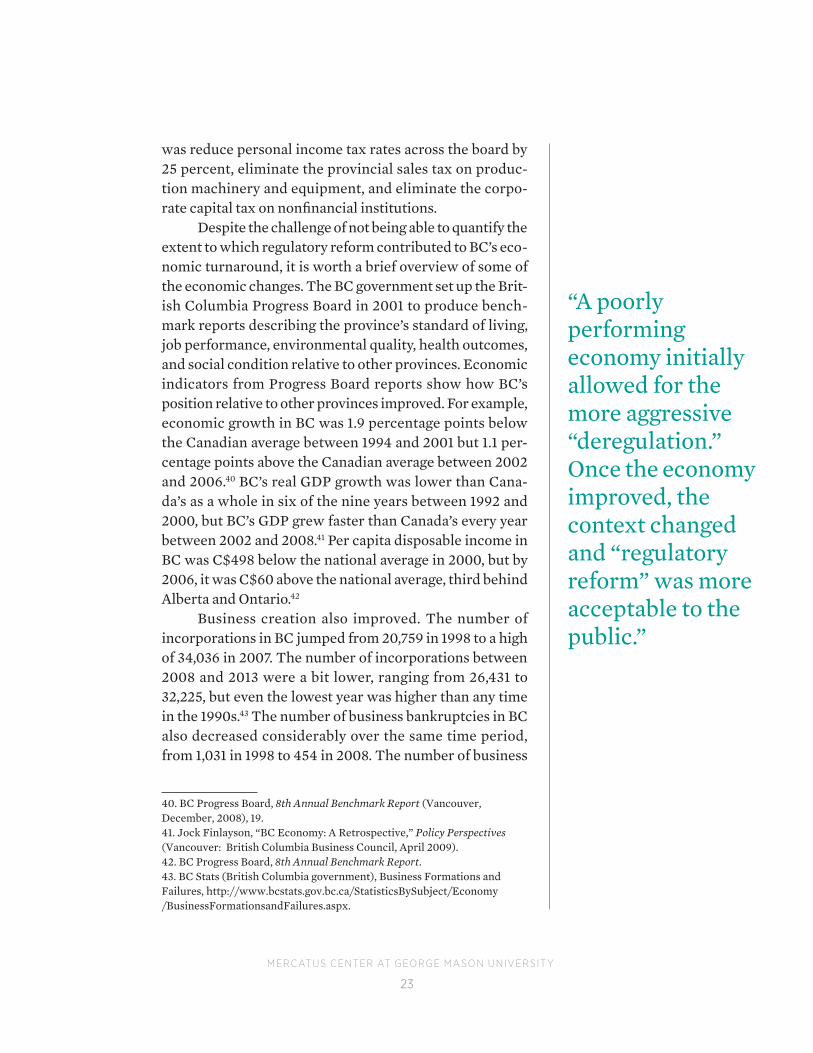
Despite the challenge of not being able to quantify the extent to which regulatory reform contributed to BC’s eco-nomic turnaround, it is worth a brief overview of some of the economic changes. The BC government set up the Brit-ish Columbia Progress Board in 2001 to produce bench-mark reports describing the province’s standard of living, job performance, environmental quality, health outcomes, and social condition relative to other provinces. Economic indicators from Progress Board reports show how BC’s position relative to other provinces improved. For example, economic growth in BC was 1.9 percentage points below the Canadian average between 1994 and 2001 but 1.1 per-centage points above the Canadian average between 2002 and 2006.40 BC’s real GDP growth was lower than Cana-da’s as a whole in six of the nine years between 1992 and 2000, but BC’s GDP grew faster than Canada’s every year between 2002 and 2008.41 Per capita disposable income in BC was C$498 below the national average in 2000, but by 2006, it was C$60 above the national average, third behind Alberta and Ontario.42
Business creation also improved. The number of incorporations in BC jumped from 20,759 in 1998 to a high of 34,036 in 2007. The number of incorporations between 2008 and 2013 were a bit lower, ranging from 26,431 to 32,225, but even the lowest year was higher than any time in the 1990s.43 The number of business bankruptcies in BC also decreased considerably over the same time period, from 1,031 in 1998 to 454 in 2008. The number of business
40. BC Progress Board, 8th Annual Benchmark Report (Vancouver, December, 2008), 19.41. Jock Finlayson, “BC Economy: A Retrospective,” Policy Perspectives (Vancouver: British Columbia Business Council, April 2009).42. BC Progress Board, 8th Annual Benchmark Report.43. BC Stats (British Columbia government), Business Formations and Failures, http://www.bcstats.gov.bc.ca/StatisticsBySubject/Economy /BusinessFormationsandFailures.aspx.
“A poorly performing economy initially allowed for the more aggressive “deregulation.” Once the economy improved, the context changed and “regulatory reform” was more acceptable to the public.”
MERCATUS CENTER AT GEORGE MASON UNIVERSIT Y
24
bankruptcies per year has been falling since 2003 and was only 189 a year by 2013.44
Anecdotal evidence suggests that red tape reduction was an important contributor to British Columbia’s recovery. For example, mining is a historically important industry in BC that was in decline in the 1990s, but it rebounded after 2000. According to a task force on mining established by the government in 2008, “The provincial government has taken many important steps—improv-ing its tax competitiveness, streamlining regulatory requirements and invest-ing in the province’s geosciences mineral data collection and analysis—to enhance BC’s reputation as an important mining jurisdiction and industry has responded with record exploration levels and the opening of new mines in the recent period of economic growth.”45 This statement is typical of the kinds of statements coming from industry at a time when tax and regulatory competi-tiveness are highlighted as key to the provincial economic turnaround.
LESSONS FROM THE BC MODEL FOR US GOVERNMENTS INTERESTED IN RED TAPE REDUCTION
The United States and Canada share more similarities than differences in over-all economic conditions and general cultural attitudes, which makes Canada’s experience with red tape reduction and control relevant to the United States. US governments at the state and federal level will find much to borrow from and some things to improve upon in the lessons from British Columbia.
Lesson #1: Language Matters
BC’s reforms were born in the context of “hitting the wall” with uncompeti-tive taxes and excessive regulation. This situation created a climate where the general public supported making cutting regulation a clear priority. A poorly performing economy initially allowed for the more aggressive “deregulation.” Once the economy improved, the context changed and “regulatory reform” was more acceptable to the public. More recently, a senior minister commented how helpful it was to make a distinction between red tape and necessary regu-lation.46 Indeed, it is much harder to argue against cutting red tape, a problem most can relate to in some way, than it is to argue against regulatory reform,
44. Ibid.45. BC Mining Economic Task Force, Mining Economic Task Force Report, January 2009.46. Personal conversation between author and Naomi Yamamoto (former BC minister of jobs and tourism and small business), 2015.
MERCATUS CENTER AT GEORGE MASON UNIVERSIT Y
25
which can be confused with cutting justified regulations. The language used in BC today is better at maintaining public support for cutting red tape, and it would likely have been as effective, if not more effective, than the “deregula-tion” language used at the beginning of the reforms. Indeed much of the “regu-lation” that was cut (such as restaurants being told what size televisions they could have in their establishments) was clearly red tape.
Lesson #2: Political Leadership Matters
Regulatory reform in BC has been successful because it has had strong political champions. Leadership from the top was critical to the success of the reforms. However, it was also important in the early years to have other strong political leaders who could lead the execution of the reforms. In BC’s case this initially came from the minister of deregulation, whose sole responsibility was to focus on effectively implementing the reforms.
For regulatory reform to be successful, it must have broad buy-in from politicians and from civil servants. The buy-in in BC was the result of strong political leadership from the top, a decentralized approach to reform where ministries could chose the regulatory requirements to cut, and a three-year timeline, which created urgency while still allowing time to adapt to the change.
Lesson #3: A Clear, Credible, Simple Measure Matters
One thing that distinguishes BC’s regulation reforms is the clear metric that was used to establish whether the reforms were successful. BC’s measure has several virtues: it is clear, fairly comprehensive, and easy to update. There is no perfect way to measure the broad burden of regulation, and there are certainly alternative approaches to the regulatory requirement metric used in BC that would be just as good, if not better. However, too often, regulatory measures become so complex that they are too expensive for governments to consider adapting, and it is not at all clear that the additional complexity delivers more accuracy or better results. A simple measure has the added advantage of being easy to communicate to the public.
Lesson #4: A Hard-Cap Constraint on Regulators Matters
At the federal and state levels in both Canada and the United States, regula-tory impact analysis has been used as a “check” on regulators. RIAs may slow down the growth of regulatory activity, but available evidence suggests that
MERCATUS CENTER AT GEORGE MASON UNIVERSIT Y
26
they do not stop it. BC’s target of reducing regulation requirements by one-third in three years and then maintaining the reduction has set a hard cap on the total amount of regulatory requirements. This has forced a discipline that did not previously exist, a discipline that has helped change the culture within government to one where regulators see their job as focusing on the most important rules.
One of the challenges for governments interested in reducing, rather than just controlling, red tape is picking a reduction target. BC’s choice of a one-third reduction target was not scientific. However, the political “gut feeling” was that a one-third target would be achievable without compromising justified regula-tion. The choice seems to have been reasonable, as there is little evidence that the regulatory reduction in the province compromised health, safety, or envi-ronmental outcomes. Interestingly, on the CFIB survey, small business own-ers in both Canada and the United States also suggest that about a one-third reduction in rules is possible without compromising the legitimate objectives of regulation (see figure 1).
As was mentioned at the beginning of this paper, the Canadian govern-ment recently adapted BC’s one-in, one-out policy, becoming the first country in the world to legislate a hard cap on regulations.47 The legislation is new, but it has been the policy of the government for the past several years. As of December 2013, the rule had achieved a net reduction of 19 regulations, saving business 98,000 hours and $20 million.48 While this reduction is small in the grand scheme of the costs of the overall regulatory burden, it is nonetheless a quantifiable reduction and another indication that hard caps matter.
Lesson #5: Institutionalizing Red Tape Control Matters
Perhaps one of the most remarkable things about the BC model is its longevity. An important transition happened once the initial one-third reduction target was met: a new target for zero net increase in regulatory requirements was set. The government has extended this commitment several times and ensured that measuring red tape requirements has continued. While it is impossible to say with certainty that there would have been more red tape without the con-trols, it is clear that there would have been less transparency and less ability
47. As noted earlier, the Canadian federal government’s one-in, one-out rule is narrower than BC’s because it only applies to regulations, not to rules found in legislation and policies. However, unlike BC’s rule, the federal one-in, one-out is legislated rather than just a policy commitment.48. “Reducing Red Tape,” Canada’s Economic Action Plan, accessed November 2, 2015, actionplan .gc.ca/en/initiative/reducing-red-tape.
MERCATUS CENTER AT GEORGE MASON UNIVERSIT Y
27
to evaluate the broad regulatory burden without the ongoing measure, which provides a benchmark.
In contrast, Nova Scotia’s government implemented its own red tape ini-tiative, which had some initial success, but it was not followed by institutional commitment. Several years after BC launched its reforms, the Nova Scotia gov-ernment was convinced of the merits of setting and measuring targets. In 2005, Nova Scotia set a target for a 20 percent reduction by 2010 in the time business owners spend on regulation. The starting benchmark was 613,000 hours, and the government successfully achieved its goal. It then stopped measuring and there is currently no way to know whether the time spent by businesses com-plying with rules has increased, decreased, or stayed the same. A recent report commissioned by the Nova Scotia government strongly recommends that the government find effective ways to eliminate red tape, including reestablishing measurement and “creating mechanisms, including legislation, to sustain the regulatory modernization agenda over the long term.”49
Final Lesson: Outside Advocacy Can Make All the Difference
Regulation is largely a hidden tax that most directly affects business owners, in particular small business owners. Having the support of organizations that represent small businesses has been very important in keeping the BC gov-ernment committed to its reforms and in encouraging other governments in Canada, including the federal government, to follow the example set by BC. In fact, without the advocacy coming from small business, it is doubtful that BC’s reforms would still be in place today.50 Several effective steps that the CFIB51 took in pushing to continue reforms include the following:
• Regularly meeting with politicians from the governing party and opposi-tion parties to present survey results from small businesses that showed why it was important to continue the reforms. These meetings helped make red tape reduction a nonpartisan issue that all parties could support. This strategy worked at the federal level too.
49. Laurel C. Broten, Charting a Path for Growth: Nova Scotia Tax and Regulatory Review, report pre-pared for province of Nova Scotia, November 2014.50. In personal meetings with many BC ministers in 2003, some were of the view that once the one-third reduction target was met, there would be no further need to report regulatory targets. This view changed once it was pointed out that it would be difficult to maintain the reductions without ongoing targets and tracking.51. Following the initial progress, other business groups seemed to lose interest in BC’s broad regula-tory reform program, but one committed organization was enough to keep the reforms alive.
MERCATUS CENTER AT GEORGE MASON UNIVERSIT Y
28
• Issuing an annual report card on governments across Canada. BC was the only jurisdiction to get an A and wanted to keep it.
• Holding an annual “Red Tape Awareness Week,” which keeps a spot-light on the issue and gives politicians credit and publicity for making announcements about cutting red tape.
• Publishing research reports estimating the costs of the broad regulatory burden and red tape.
• Connecting business owners with media during Red Tape Awareness Week so that the public could get a better understanding of the costs and frustration of red tape.
• Issuing an annual “Golden Scissors” award for cutting red tape. Kevin Fal-con, the BC minister responsible for the initial reforms, was the first to receive the award.
CONCLUSION
As average incomes in countries like Canada and the United States have increased, the demands for better health, safety, and environmental provisions have also increased.52 Available evidence, while limited, suggests that at least some of these demands have been expressed in an increase in the number of mandatory rules our governments issue. It seems reasonable to assume that some of the increase in the broad regulatory burden is justified regulation and some is red tape.
The challenge for modern governments is to control the growth of red tape in the messy real world, where measures are imperfect and the line between justified regulation and red tape can be difficult to establish. The BC model of red tape reduction stands out for its simplicity, effectiveness, and lon-gevity. Not only did the BC government accomplish its goal of reducing the number of regulatory requirements by more than one-third in three years, it has maintained the reduction for over a decade. Its approach, which is very dif-ferent from what other governments have tried, uses essential ingredients that are really just common sense: measurement, a cap on the total burden of regula-tion, and political leadership. A blueprint for common sense regulatory reform is long overdue, and I hope it proves useful to US governments interested in improving the welfare of their citizens. Reducing red tape has the power to unleash entrepreneurship and make us all better off.
52. Economists generally consider environmental, health, and safety protections to be “normal goods” in the sense that as incomes increase so too does the demand for a normal good.

ABOUT THE AUTHOR
Laura Jones is the executive vice-president of the Canadian Federation of Independent Business (CFIB), a nonprofit association that advocates for 109,000 independent businesses in Canada on all topics of importance to them, including taxes and regulation. Jones has been providing advice to Canadian governments on effective regulatory reform for more than a decade. She is author of a number of studies estimating the cost and impact of regulation, including a study for the Organisation for Economic Co-operation and Devel-opment and studies for CFIB estimating the cost and impact of regulation in Canada and the United States. She also created Canada’s annual Red Tape Awareness Week, a successful initiative to focus government attention on the red tape problem. She is currently a member of the Red Tape Advisory Com-mittee for the government of Canada and on the board of the Macdonald-Laurier Institute. Before her work with CFIB, Jones taught economics at the British Columbia Institute of Technology and worked at a well-known Cana-dian think tank, the Fraser Institute.
ABOUT THE MERCATUS CENTER AT GEORGE MASON UNIVERSITY
The Mercatus Center at George Mason University is the world’s premier university source for market-oriented ideas—bridging the gap between aca-demic ideas and real-world problems.
A university-based research center, Mercatus advances knowledge about how markets work to improve people’s lives by training graduate students, con-ducting research, and applying economics to offer solutions to society’s most pressing problems.
Our mission is to generate knowledge and understanding of the institu-tions that affect the freedom to prosper and to find sustainable solutions that overcome the barriers preventing individuals from living free, prosperous, and peaceful lives.
Founded in 1980, the Mercatus Center is located on George Mason Uni-versity’s Arlington campus.
Revised October 1, 2013 Page 1
Regulatory Reform BC Regulatory Reform Policy
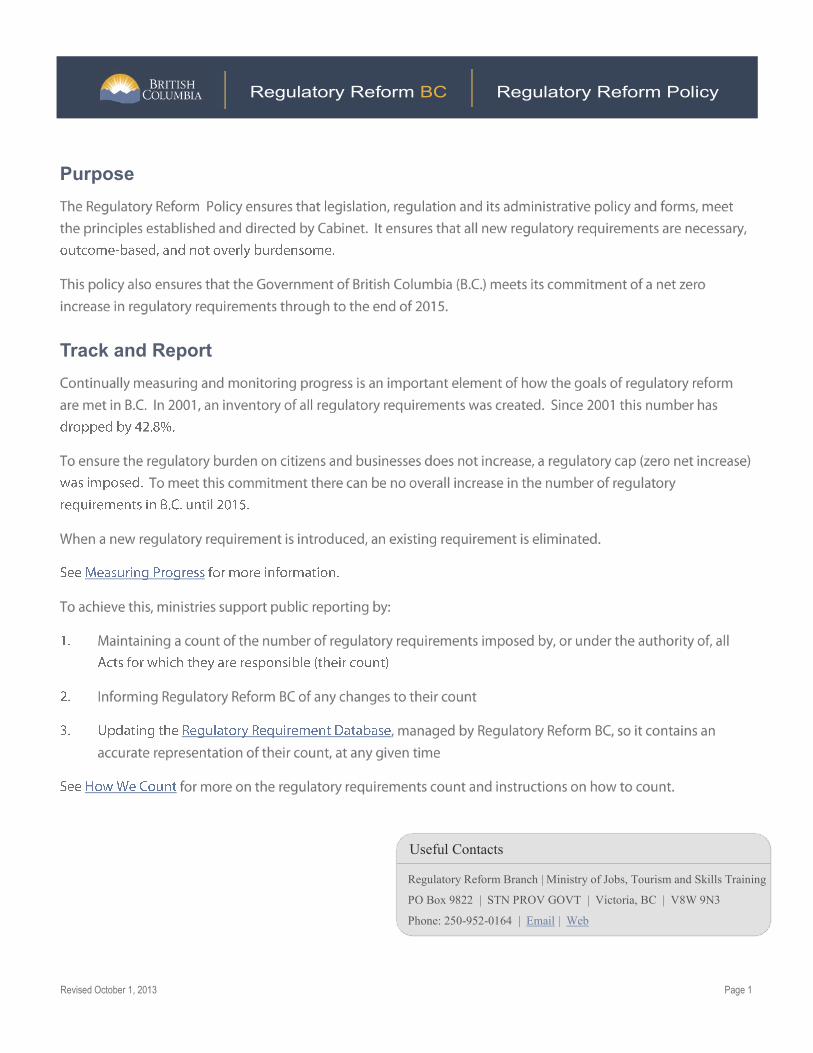
Purpose
Track and Report
Useful Contacts
Regulatory Reform Branch | Ministry of Jobs, Tourism and Skills Training
PO Box 9822 | STN PROV GOVT | Victoria, BC | V8W 9N3
Phone: 250-952-0164 | Email | Web
Revised October 1, 2013 Page 2
Regulatory Reform BC Regulatory Reform Policy
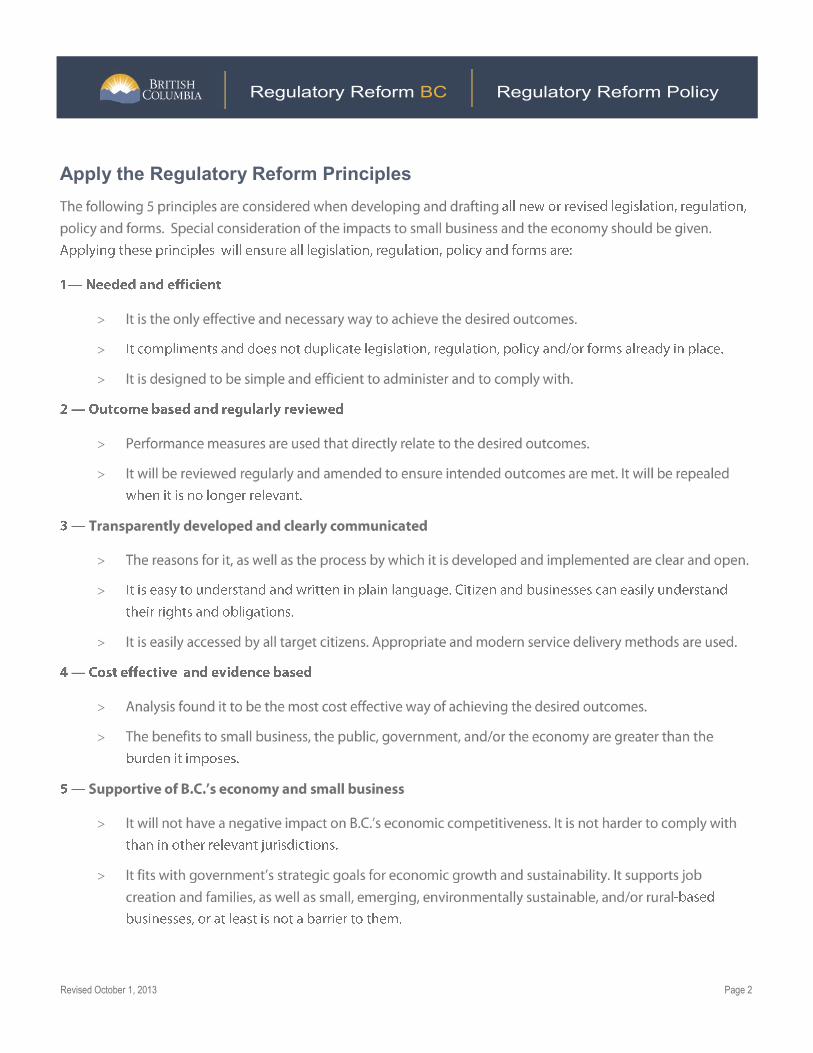
Apply the Regulatory Reform Principles
Revised October 1, 2013 Page 3
Regulatory Reform BC Regulatory Reform Policy
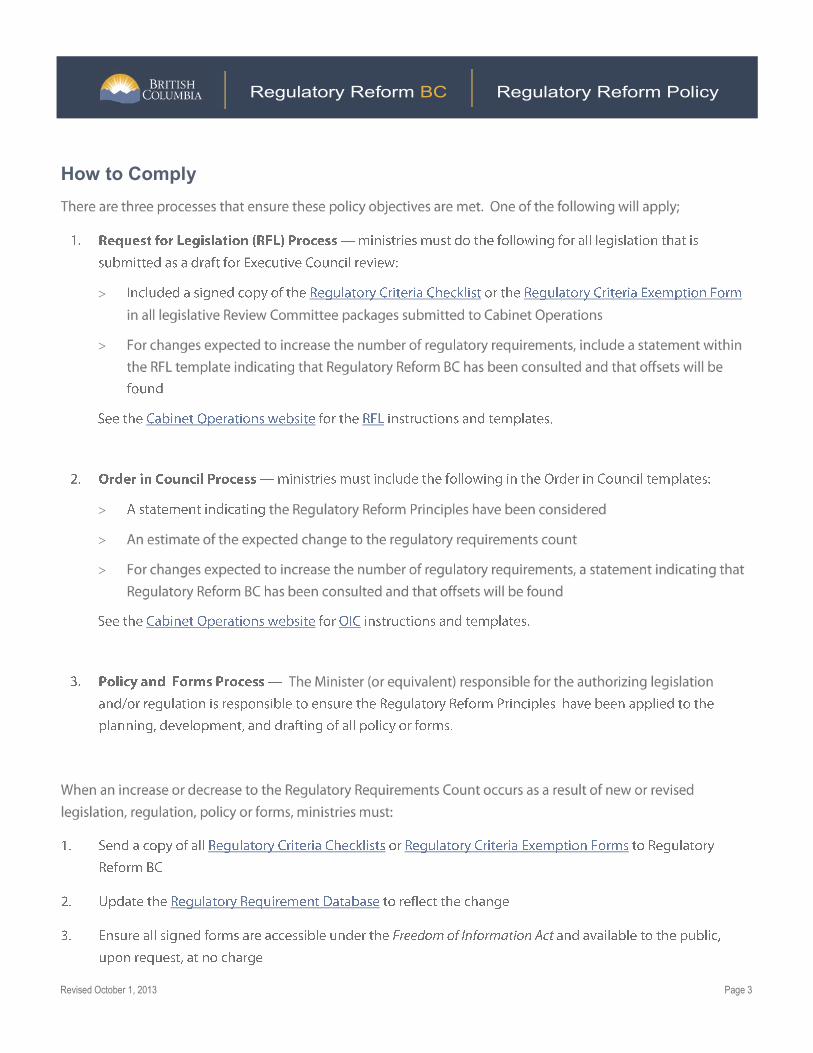
How to Comply
Revised October 1, 2013 Page 4
Regulatory Reform BC Regulatory Reform Policy
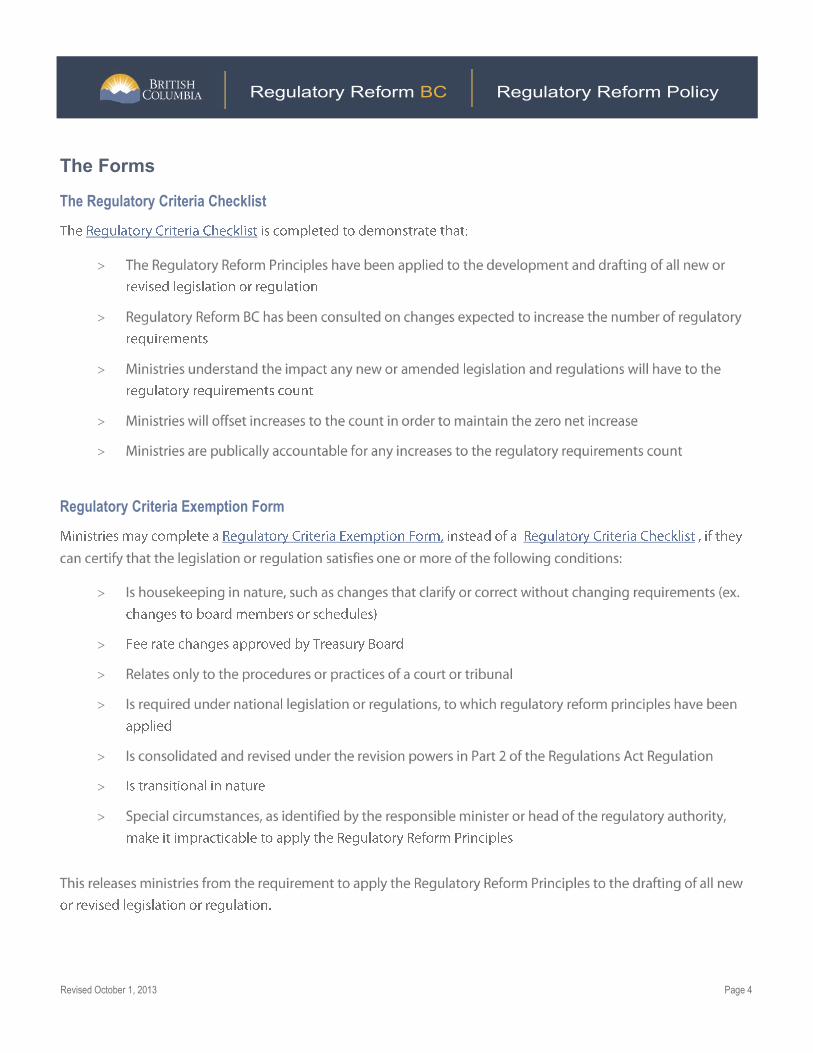
The Forms
The Regulatory Criteria Checklist
Regulatory Criteria Exemption Form
Revised October 1, 2013 Page 5
Regulatory Reform BC Regulatory Reform Policy
Definitions
Last Revised October 2013
I certify that the following Regulatory Reform Principles were considered for this legislation or regulation:
Regulatory Criteria
5. Is supportive of BC’s economy and small business
4. Is cost effective and evidence based
3. Was transparently developed and will be clearly communicated
2. Is outcome based and will be regularly reviewed
1. Is needed and efficient
Please provide an explanation if any of the criteria above were not considered (continued on page 2):
The purpose of the checklist is to demonstrate that legislative and regulatory changes have been developed according to the Regulatory Reform Policy, while still protecting public health, safety and the environment.
Purpose:
Name of regulation, if applicable:
Name of authorizing legislation:
Regulatory Criteria Checklist
Number of Regulatory Requirements to be added:
-Number of Regulatory Requirements to be eliminated:
NET CHANGE:
+
Signature, Responsible Minister or Head of Regulatory Authority
Date:
Ministry/Agency Name:
Contact Name:
Signator Name:
N\A
Print FormPrint Form
0

Last Revised October 2013
Explanation Continued