cvp analysis gnb 06 12e.ppt - csus.edu · net operating income $ 10,000 th t ib ti i f t h ithe...
TRANSCRIPT
CVP Analysis
1
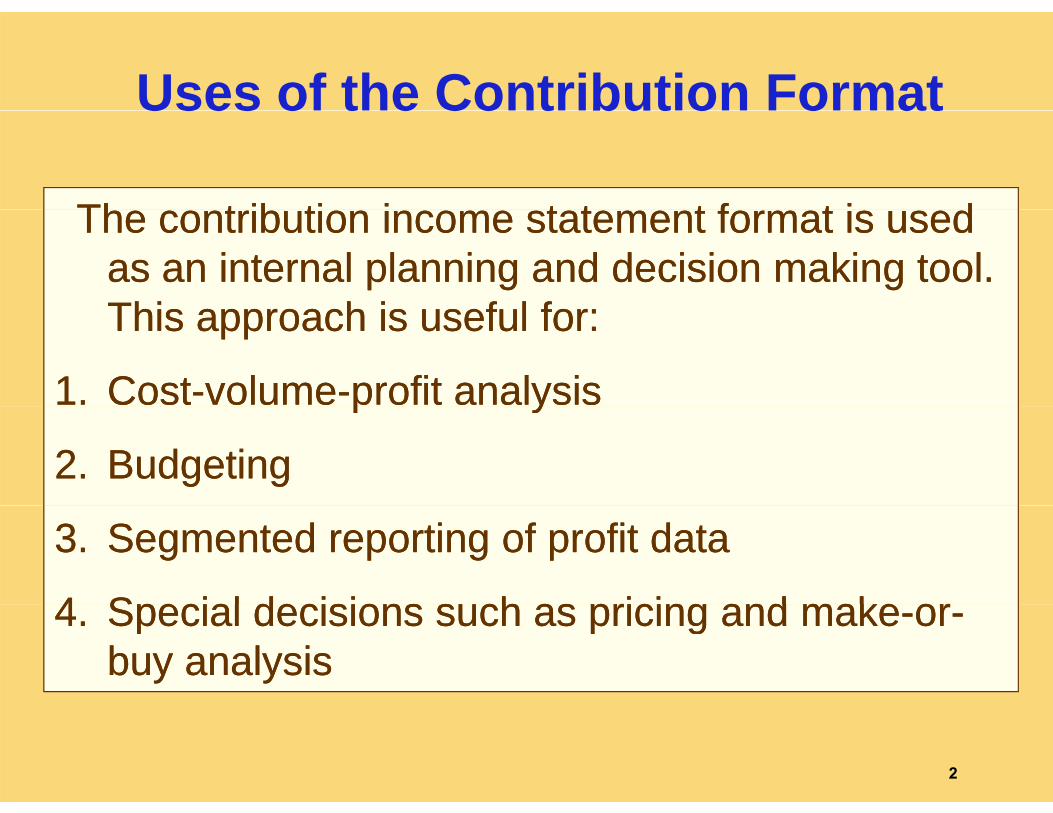
Uses of the Contribution FormatUses o t e Co t but o o at
Th t ib ti i t t t f t i dTh t ib ti i t t t f t i dThe contribution income statement format is used The contribution income statement format is used as an internal planning and decision making tool. as an internal planning and decision making tool. Thi h i f l fThi h i f l fThis approach is useful for:This approach is useful for:
1.1. CostCost--volumevolume--profit analysis profit analysis p yp y
2.2. BudgetingBudgeting
3.3. Segmented reporting of profit Segmented reporting of profit datadata
44 Special decisions s ch as pricing and makeSpecial decisions s ch as pricing and make oror4.4. Special decisions such as pricing and makeSpecial decisions such as pricing and make--oror--buy buy analysisanalysis
2

The Contribution Format
Used primarily forUsed primarily forexternal reportingexternal reporting
Used primarily byUsed primarily bymanagementmanagementexternal reporting.external reporting. management.management.
3
The Contribution Format
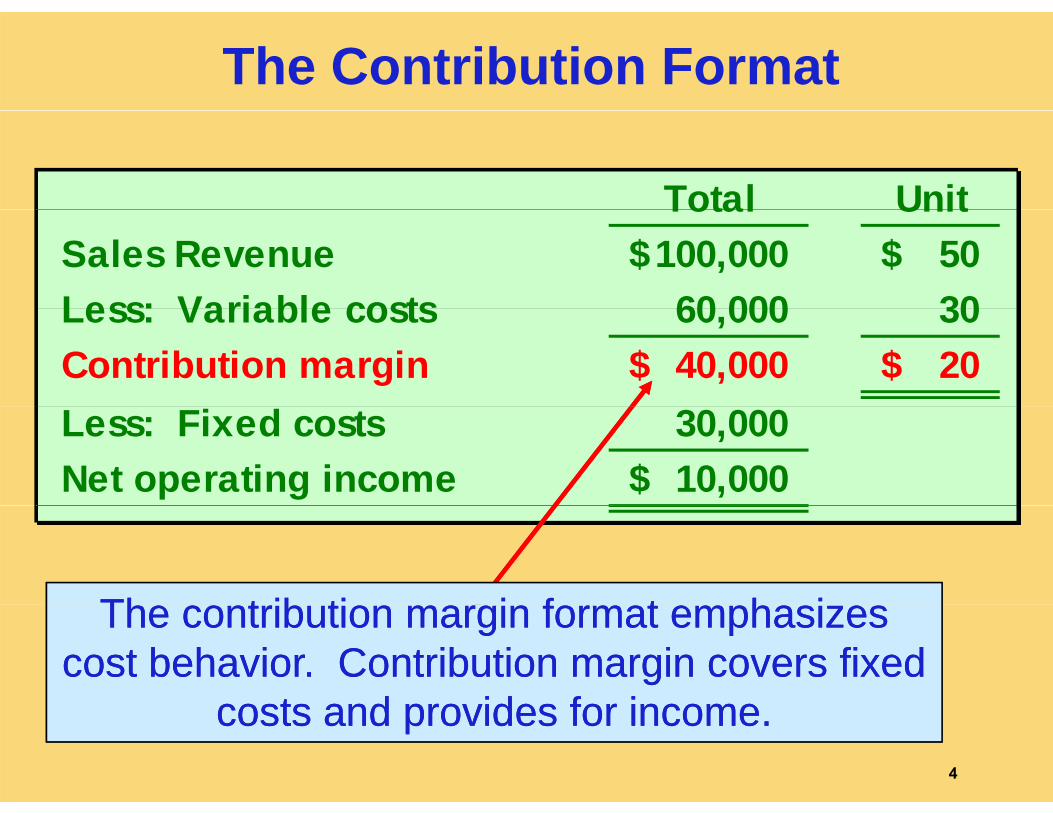
Total UnitTotal UnitSales Revenue 100,000$ 50$ Less: Variable costs 60 000 30Less: Variable costs 60,000 30 Contribution margin 40,000$ 20$ Less: Fixed costs 30,000 Net operating income 10,000$
Th t ib ti i f t h iTh t ib ti i f t h iThe contribution margin format emphasizes The contribution margin format emphasizes cost behavior. Contribution margin covers fixed cost behavior. Contribution margin covers fixed
t d id f it d id f icosts and provides for income.costs and provides for income.4
3-25
CVP Relationships in Graphic Form
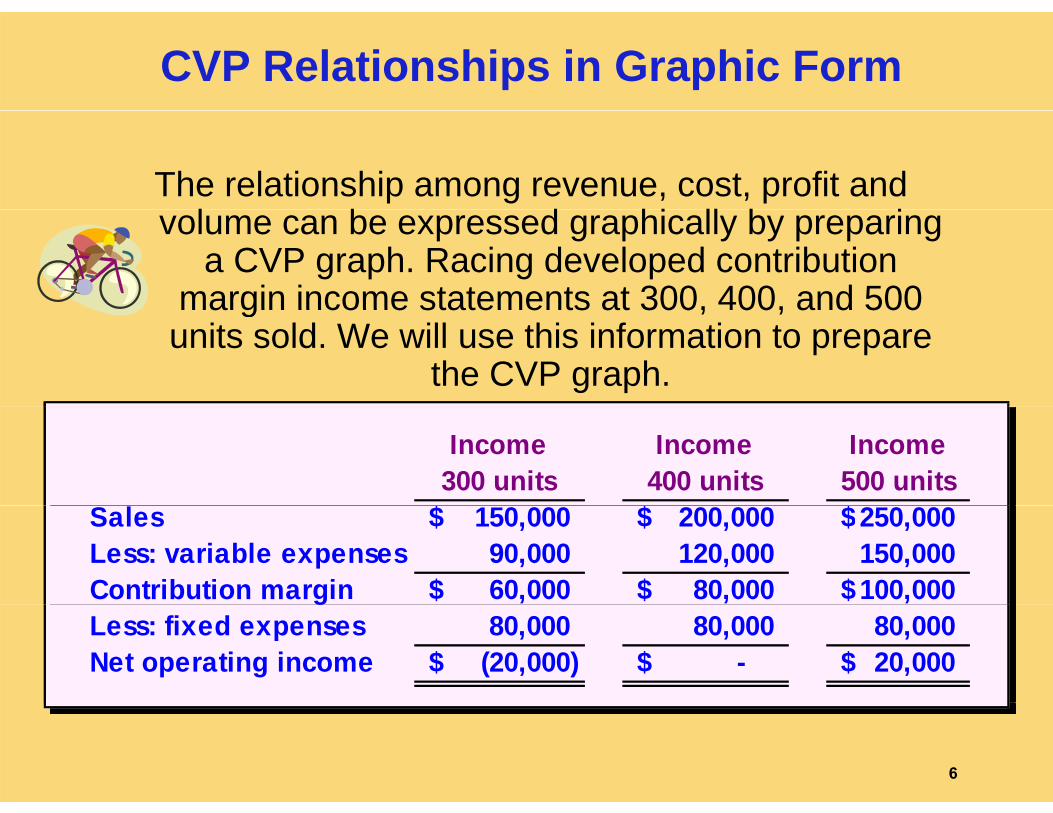
The relationship among revenue, cost, profit and l b d hi ll b ivolume can be expressed graphically by preparing a CVP graph. Racing developed contribution
margin income statements at 300, 400, and 500margin income statements at 300, 400, and 500 units sold. We will use this information to prepare
the CVP graph.
Income 300 units
Income 400 units
Income 500 units
$ $ $Sales 150,000$ 200,000$ 250,000$Less: variable expenses 90,000 120,000 150,000 Contribution margin 60,000$ 80,000$ 100,000$gLess: fixed expenses 80,000 80,000 80,000 Net operating income (20,000)$ -$ 20,000$
6
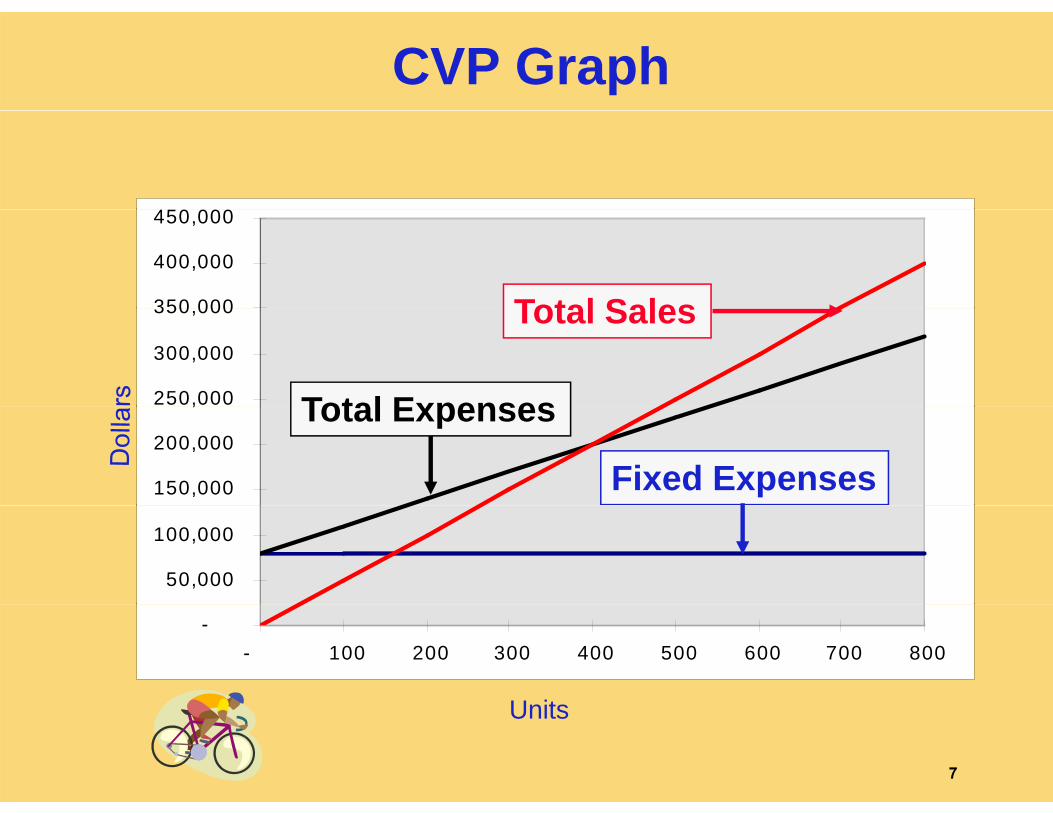
CVP Graph
4 0 000
350 000
400,000
450,000
Total Sales
250,000
300,000
350,000
Total Expenses
Total Sales
150,000
200,000
,
Fixed Expenses
Total Expenses
50,000
100,000
-- 100 200 300 400 500 600 700 800
U itUnits
7
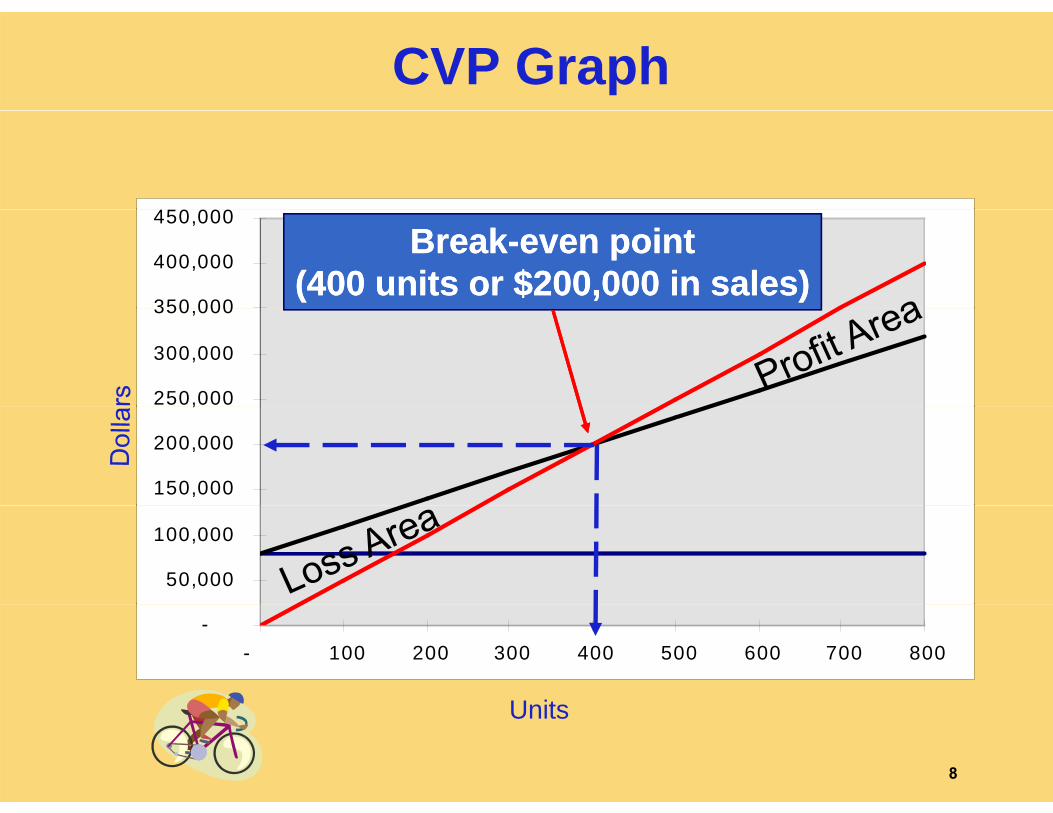
CVP Graph
4 0 000
350 000
400,000
450,000BreakBreak--even pointeven point
(400 units or $200,000 in sales)(400 units or $200,000 in sales)
250,000
300,000
350,000
150,000
200,000
,
50,000
100,000
-- 100 200 300 400 500 600 700 800
U itUnits
8
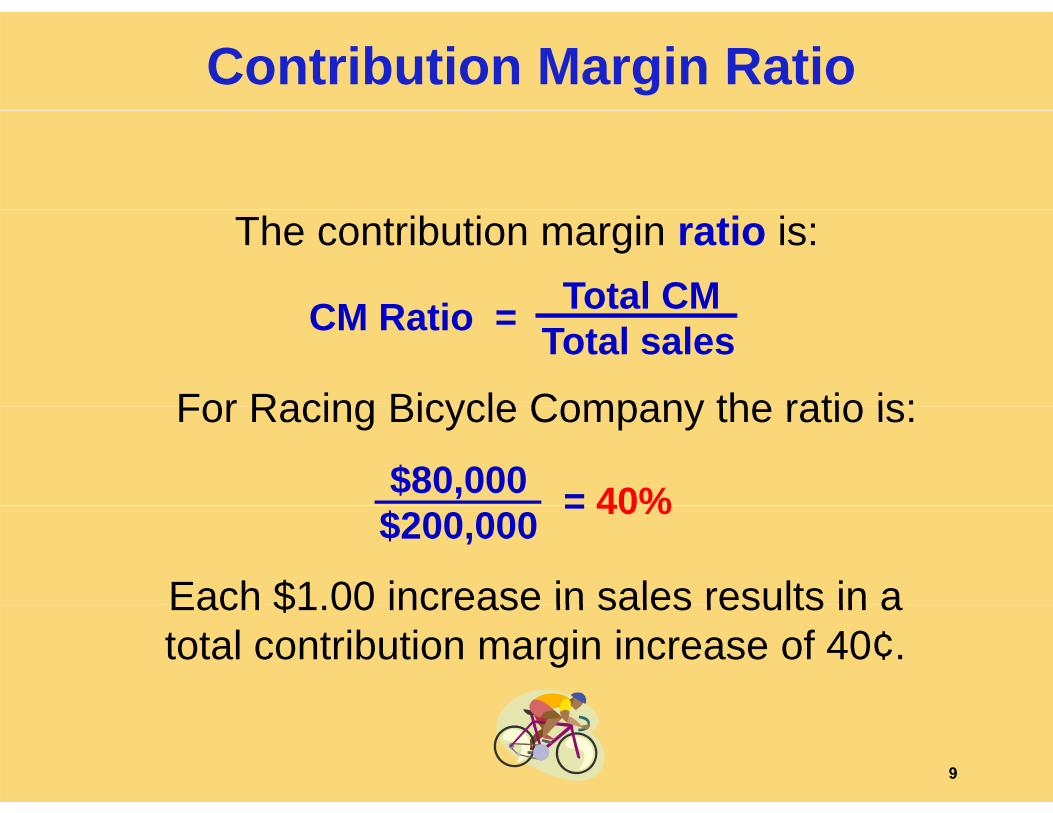
Contribution Margin Ratio
The contribution margin ratio is:Total CMCM R ti
For Racing Bicycle Company the ratio is:
Total CMTotal salesCM Ratio =
For Racing Bicycle Company the ratio is:
= 40%$80,000
Each $1 00 increase in sales results in a
= 40%$200,000
Each $1.00 increase in sales results in a total contribution margin increase of 40¢.
9
Contribution Margin Ratio
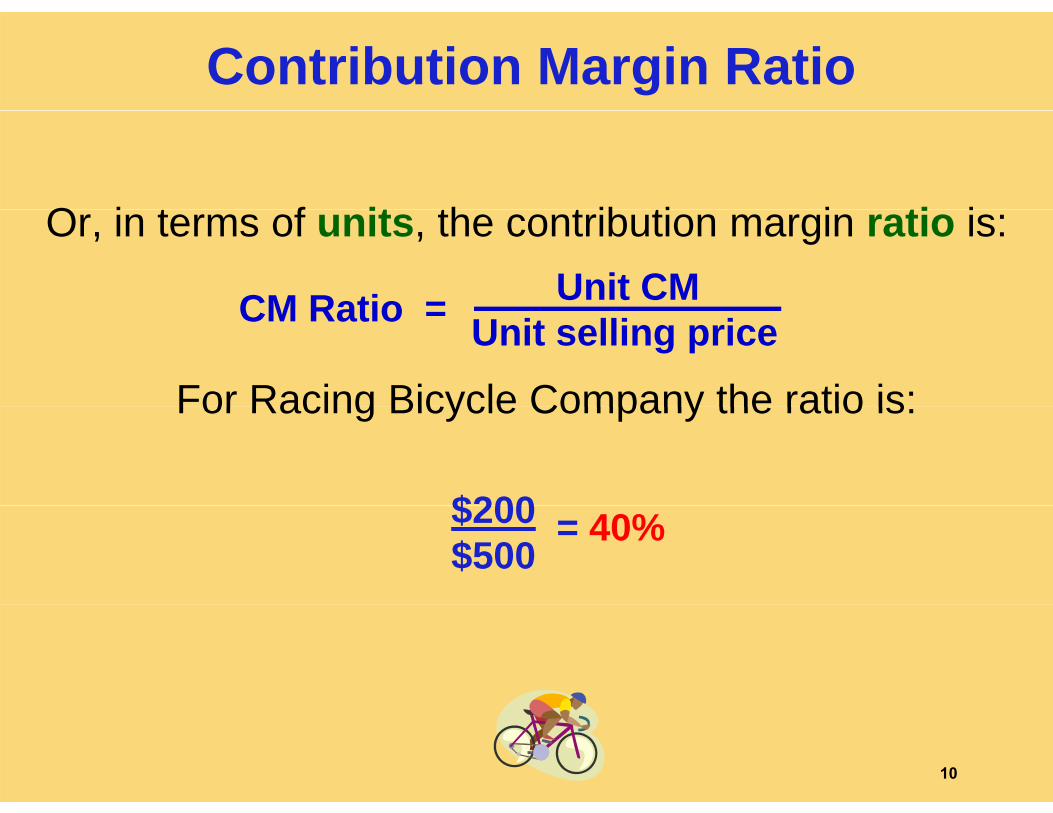
O i t f it th t ib ti i ti iOr, in terms of units, the contribution margin ratio is:Unit CMCM Ratio =
For Racing Bicycle Company the ratio is:Unit selling priceCM Ratio =
For Racing Bicycle Company the ratio is:
$200$200$500
= 40%
10

Contribution Margin Ratio
400 Bikes 500 BikesSales 200,000$ 250,000$ Less: variable expenses 120,000 150,000 Contribution margin 80,000 100,000 L fi d 80 000 80 000Less: fixed expenses 80,000 80,000 Net operating income -$ 20,000$
A $50,000 increase in sales revenue A $50,000 increase in sales revenue results in a $20 000 increase in CMresults in a $20 000 increase in CMresults in a $20,000 increase in CM.results in a $20,000 increase in CM.
($50,000 ($50,000 ×× 40% = $20,000)40% = $20,000)
11
Break-Even Analysis
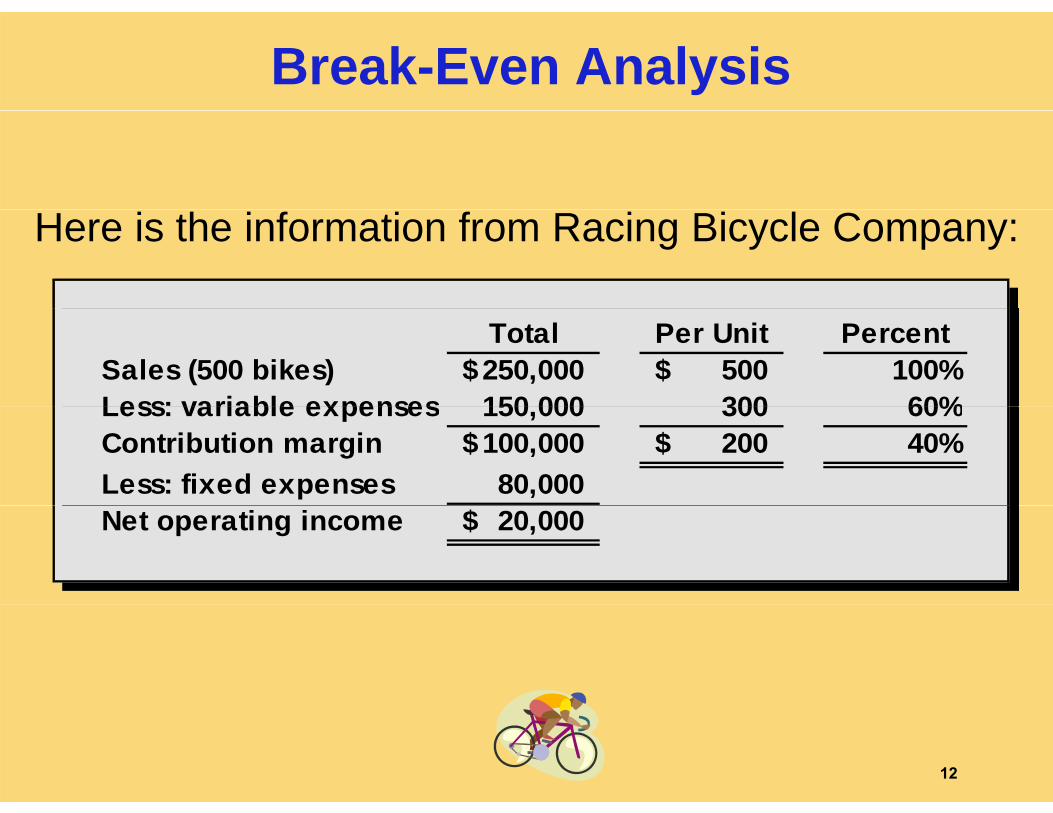
Here is the information from Racing Bicycle Company:
Total Per Unit PercentSales (500 bikes) 250,000$ 500$ 100%Less: variable expenses 150 000 300 60%Less: variable expenses 150,000 300 60%Contribution margin 100,000$ 200$ 40%Less: fixed expenses 80,000 Net operating income 20,000$
12
Contribution Margin Method
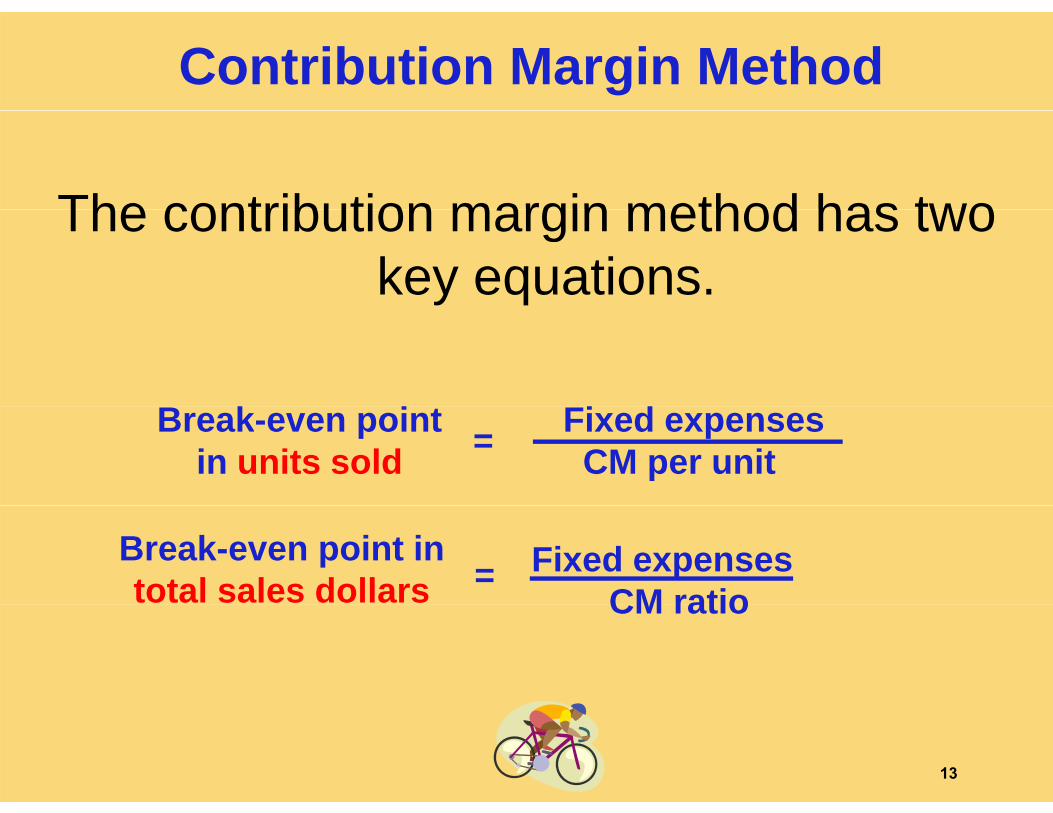
The contribution margin method has twoThe contribution margin method has two key equations.
Fi dB k i Fixed expensesCM per unit =Break-even point
in units sold
Fixed expensesCM ratio
=Break-even point intotal sales dollars CM ratio
13
Contribution Margin Method
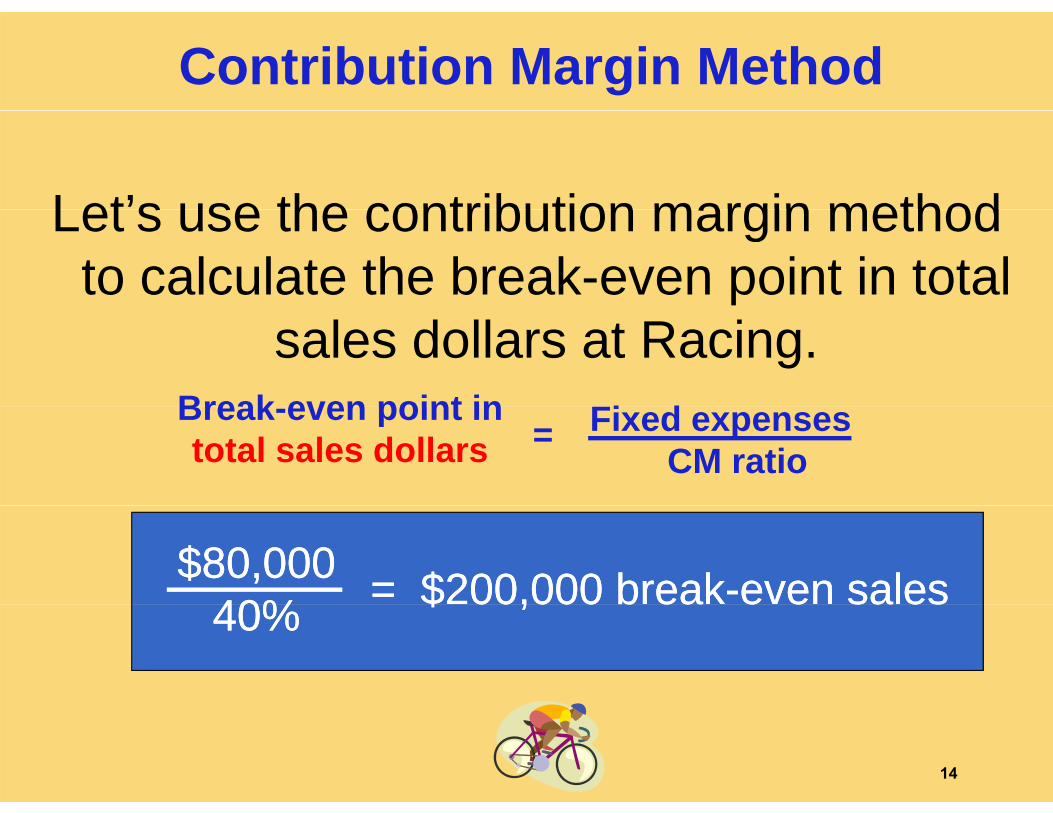
Let’s use the contribution margin methodLet s use the contribution margin method to calculate the break-even point in total
sales dollars at Racing.Fi dBreak even point in Fixed expenses
CM ratio=
Break-even point intotal sales dollars
$80,000$80,00040%40% = $200,000 break= $200,000 break--even saleseven sales40%40% $ 00,000 b ea$ 00,000 b ea e e sa ese e sa es
14
Target Profit Analysis
Suppose Racing Bicycle Company wantsSuppose Racing Bicycle Company wants to know how many bikes must be sold y
to earn a profit of $100,000.
15
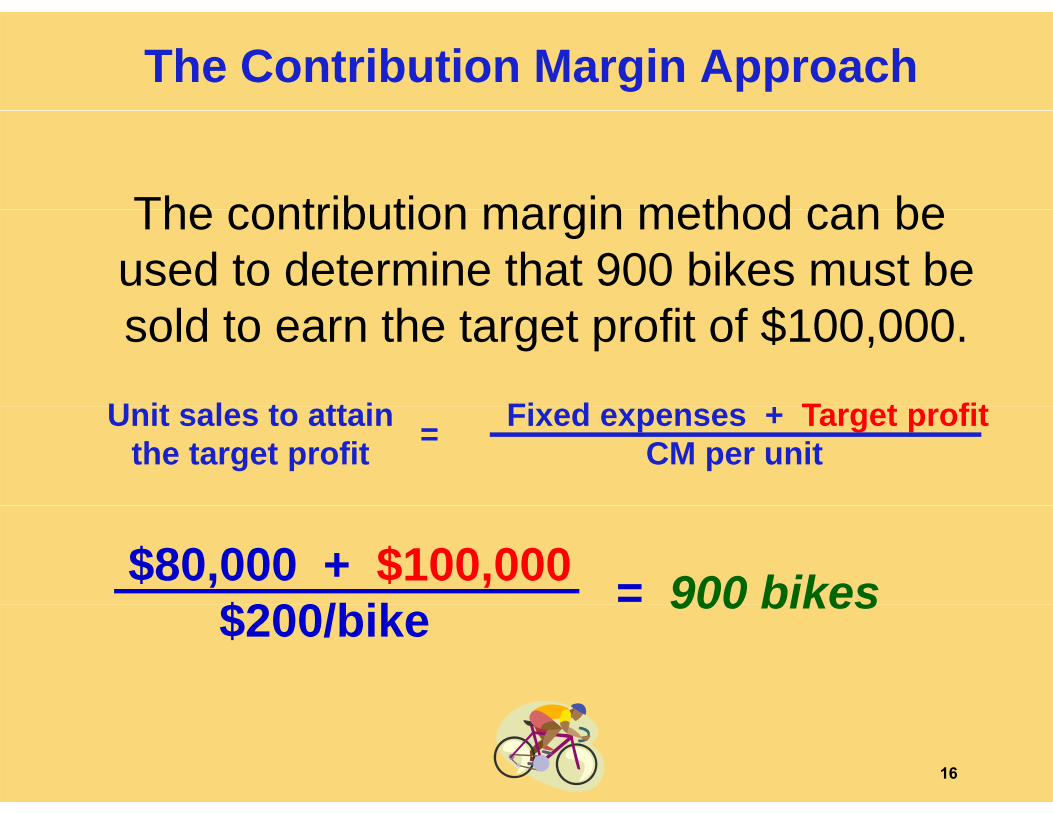
The Contribution Margin Approach
The contribution margin method can beThe contribution margin method can be used to determine that 900 bikes must be
f f $100 000sold to earn the target profit of $100,000.
Fi d + T t fitU it l t tt i Fixed expenses + Target profitCM per unit=Unit sales to attain
the target profit
$80,000 + $100,000$200/bik = 900 bikes$200/bike 900 bikes
16
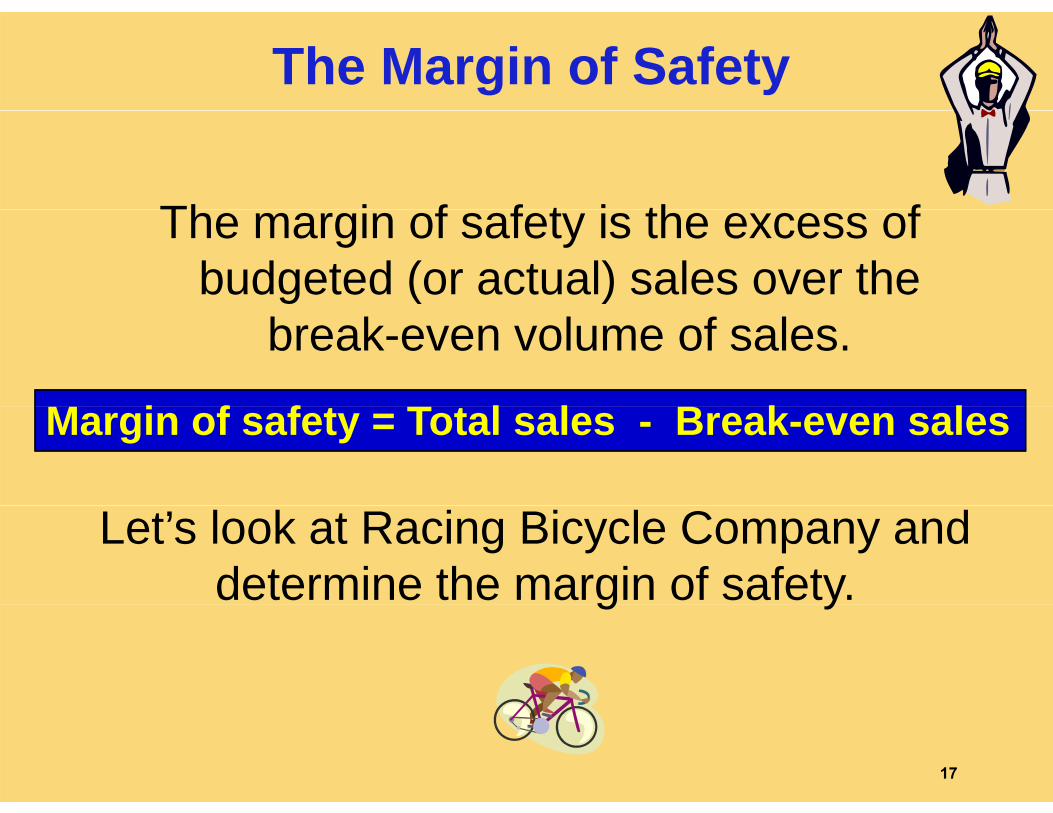
The Margin of Safety
Th i f f t i th fThe margin of safety is the excess of budgeted (or actual) sales over the
break-even volume of sales.
M i f f t T t l l B k lMargin of safety = Total sales - Break-even sales
Let’s look at Racing Bicycle Company and determine the margin of safety.g y
17
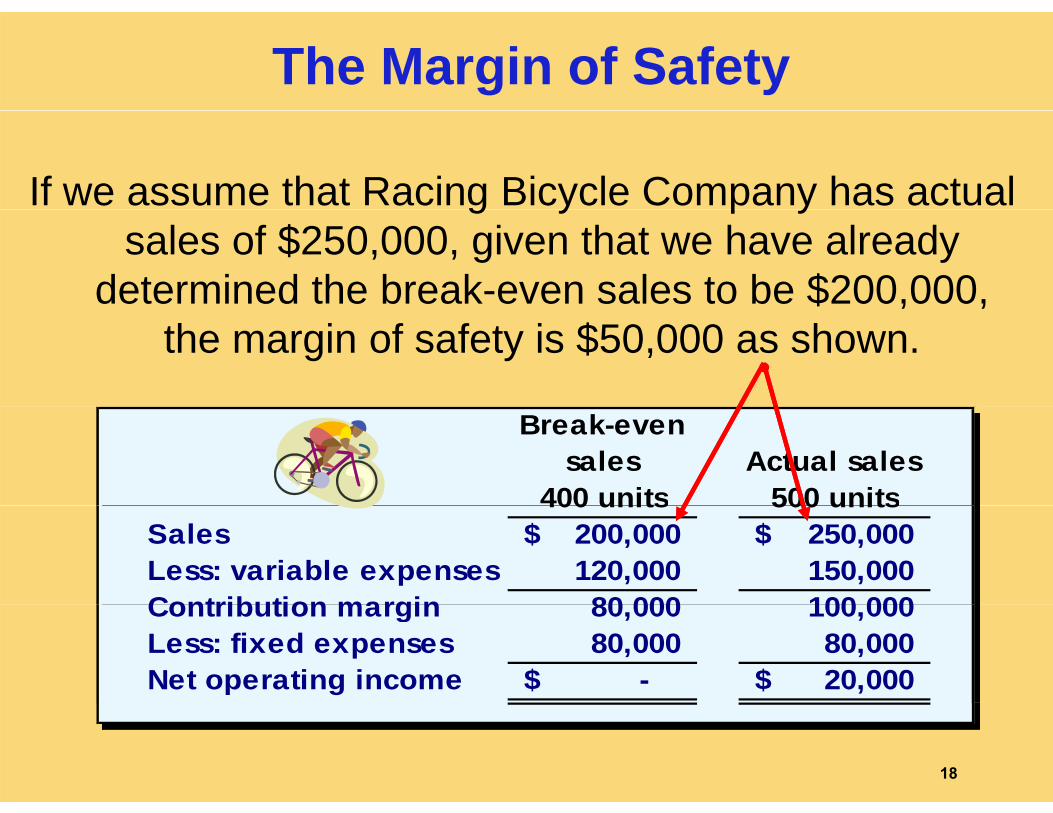
The Margin of Safety
If we assume that Racing Bicycle Company has actual g y p ysales of $250,000, given that we have already
determined the break-even sales to be $200,000, , ,the margin of safety is $50,000 as shown.
Break-even sales
400 unitsActual sales
500 units400 units 500 unitsSales 200,000$ 250,000$ Less: variable expenses 120,000 150,000 Contribution margin 80 000 100 000Contribution margin 80,000 100,000 Less: fixed expenses 80,000 80,000 Net operating income -$ 20,000$
18
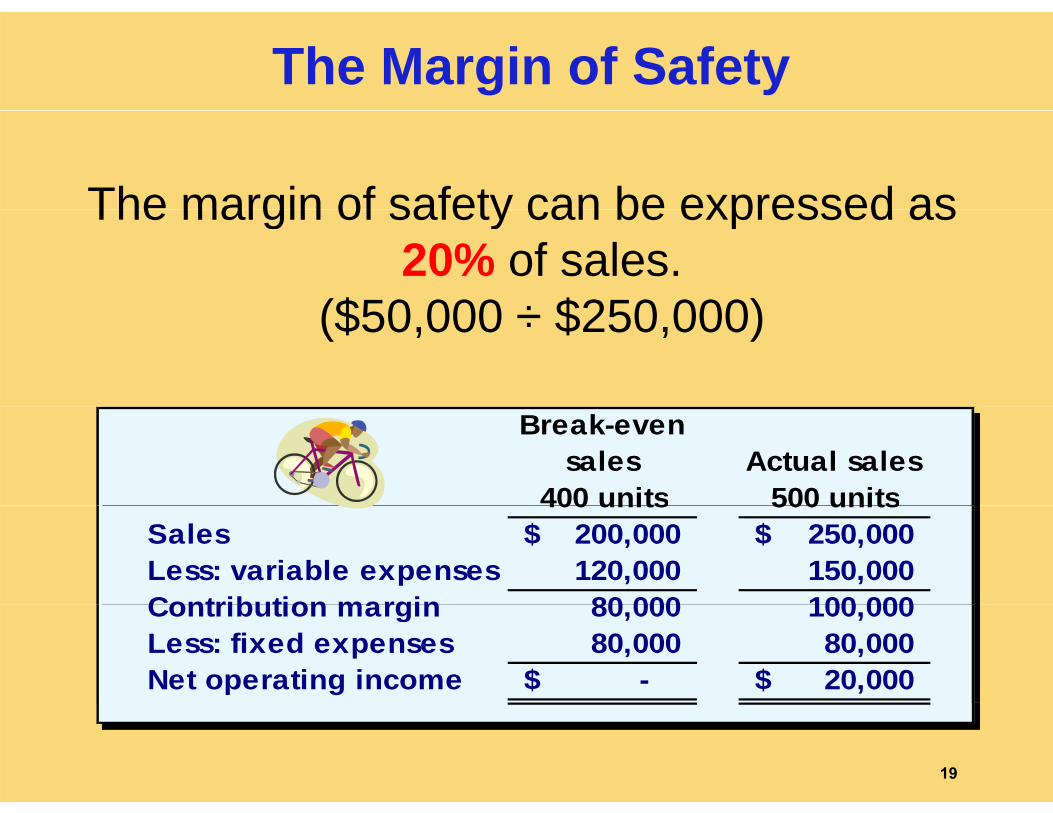
The Margin of Safety
The margin of safety can be expressed asThe margin of safety can be expressed as 20% of sales.
($50 000 ÷ $250 000)($50,000 ÷ $250,000)
Break-even sales
400 unitsActual sales
500 units400 units 500 unitsSales 200,000$ 250,000$ Less: variable expenses 120,000 150,000 Contribution margin 80 000 100 000Contribution margin 80,000 100,000 Less: fixed expenses 80,000 80,000 Net operating income -$ 20,000$
19
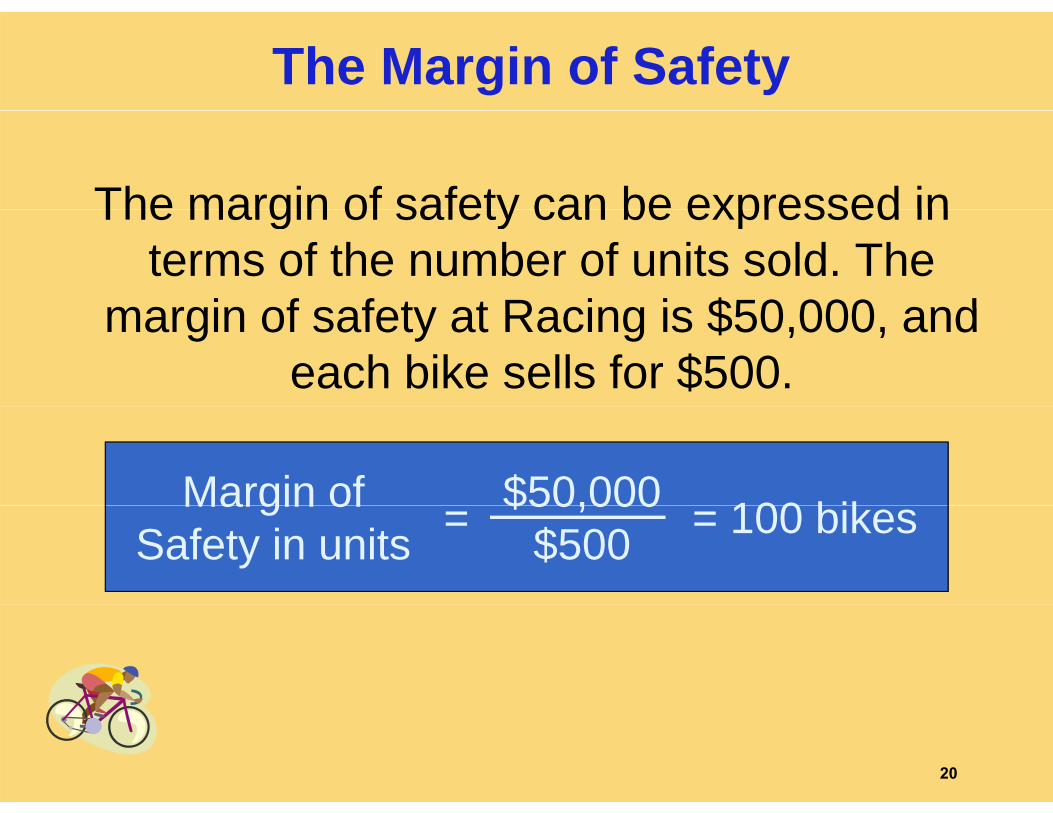
The Margin of Safety
The margin of safety can be expressed inThe margin of safety can be expressed in terms of the number of units sold. The
margin of safety at Racing is $50 000 andmargin of safety at Racing is $50,000, and each bike sells for $500.
Margin of 100 bik$50,000Margin ofSafety in units = = 100 bikes$50,000
$500
20

Operating Leverage
A measure of how sensitive net operatingA measure of how sensitive net operating income is to percentage changes in sales.
Contribution marginDegree of Contribution marginNet operating income
Degree ofoperating leverage =
21
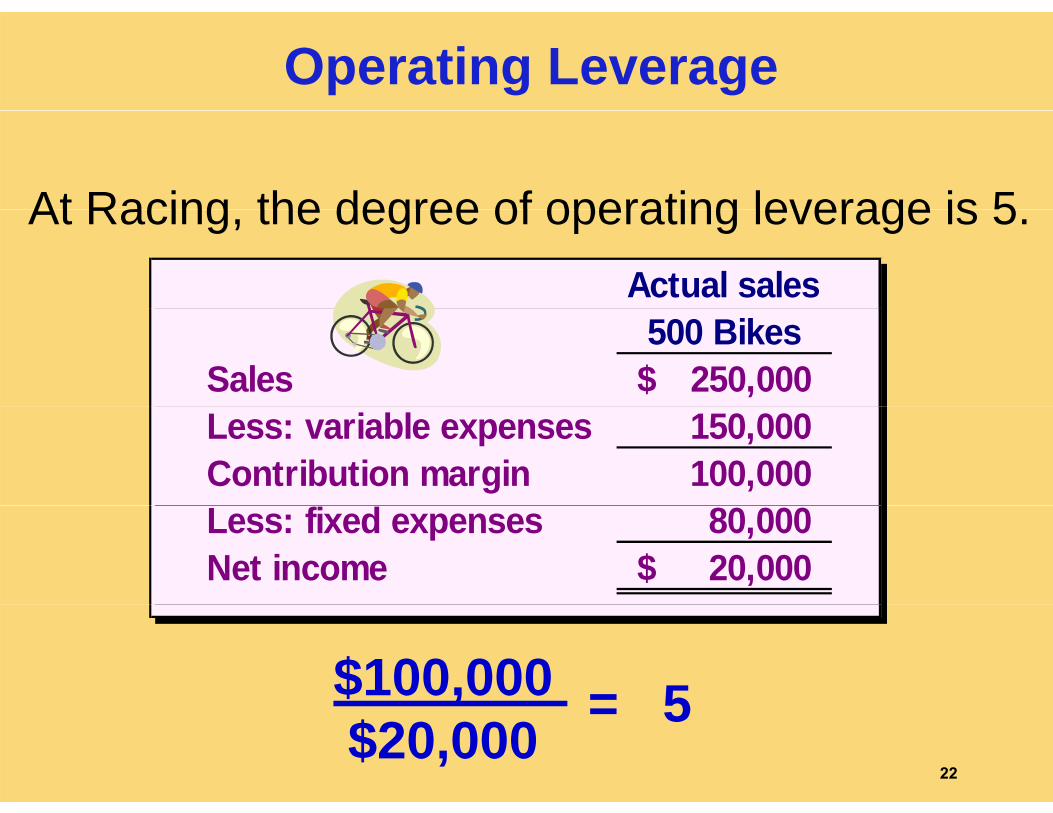
Operating Leverage
At Racing the degree of operating leverage is 5Actual sales
At Racing, the degree of operating leverage is 5.
500 BikesSales 250,000$ Less: variable expenses 150,000 Contribution margin 100,000 Less: fixed expenses 80,000 Net income 20,000$
$100,000 = 5,$20,000
= 522
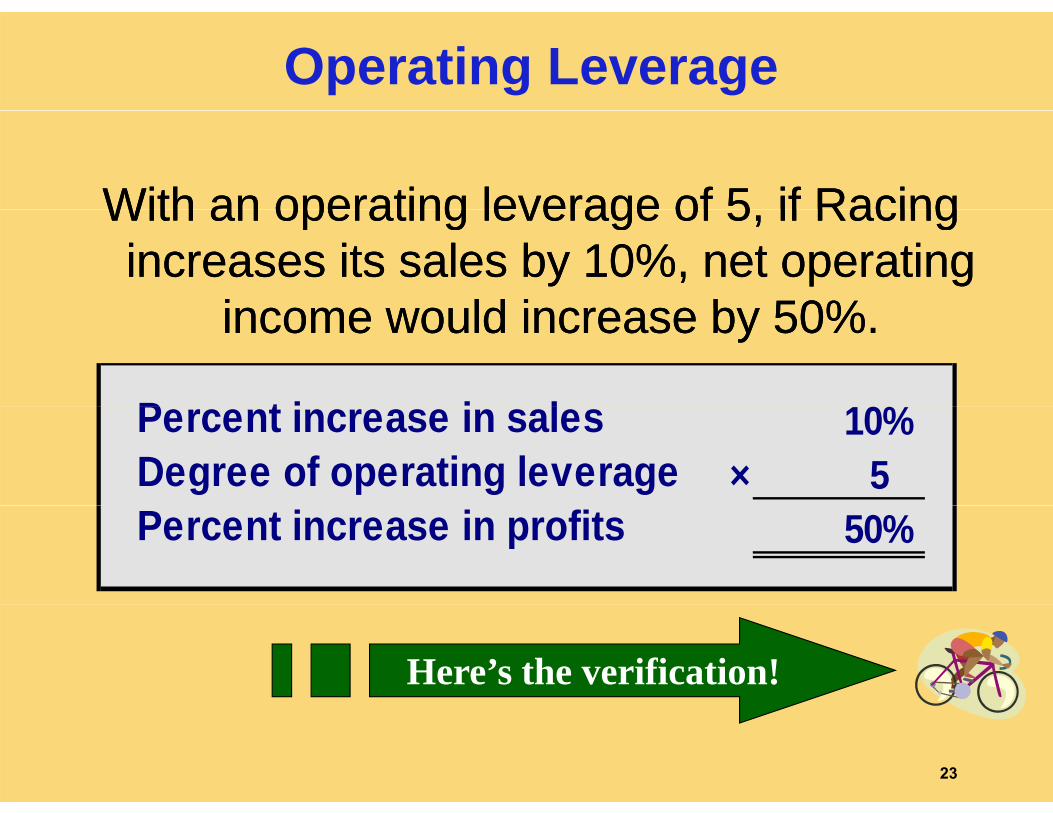
Operating Leverage
With an operating leverage of 5 if RacingWith an operating leverage of 5 if RacingWith an operating leverage of 5, if Racing With an operating leverage of 5, if Racing increases its sales by 10%, net operating increases its sales by 10%, net operating
income o ld increase b 50%income o ld increase b 50%income would increase by 50%.income would increase by 50%.
P t i i l 10%Percent increase in sales 10%Degree of operating leverage × 5Percent increase in profits 50%
Here’s the verification!
23
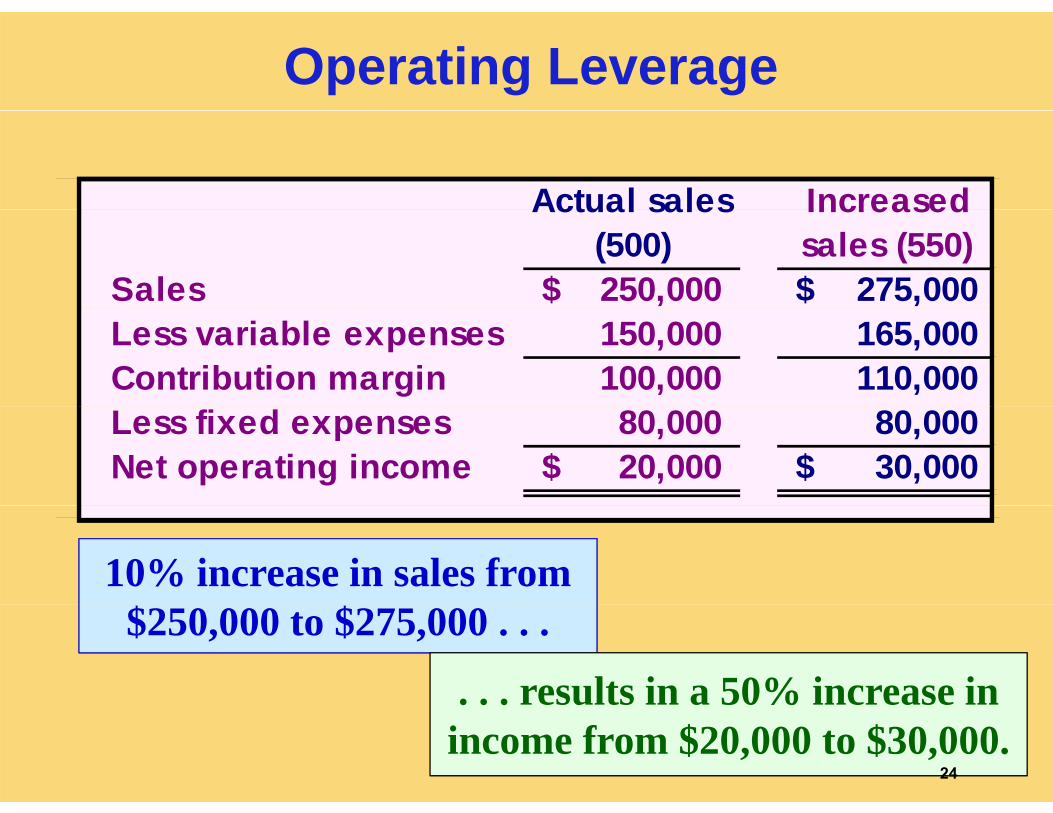
Operating Leverage
Actual sales IncreasedActual sales (500)
Increased sales (550)
Sales 250,000$ 275,000$ Less variable expenses 150,000 165,000 Contribution margin 100,000 110,000 Less fixed expenses 80,000 80,000 Net operating income 20,000$ 30,000$
10% increase in sales from$250,000 to $275,000 . . .
. . . results in a 50% increase in. . . results in a 50% increase inincome from $20,000 to $30,000.
24
The Concept of Sales Mix
S l i i th l ti ti i hi h• Sales mix is the relative proportion in which a company’s products are sold.
• Different products have different selling prices, cost structures, and contribution margins.
Let’s assume Racing Bicycle Company sells g y p ybikes and carts and that the sales mix between
the two products remains the same.p
25
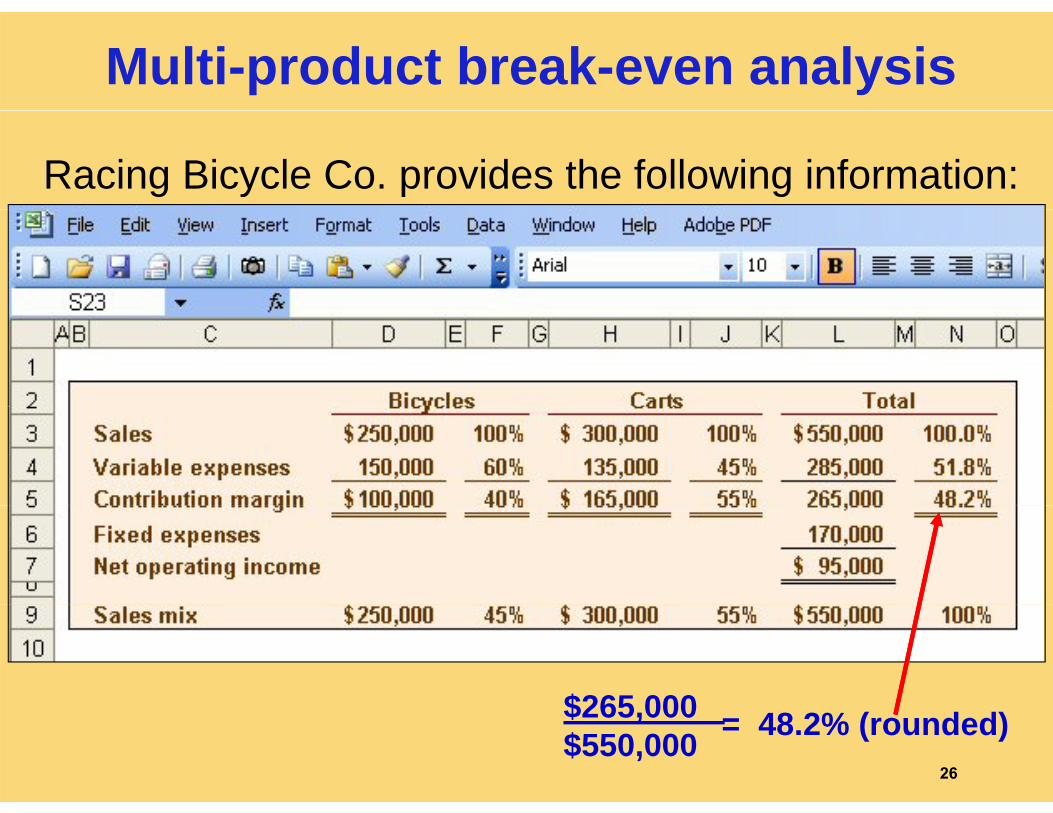
Multi-product break-even analysis
Racing Bicycle Co. provides the following information:
$265 000$265,000 $550,000 = 48.2% (rounded)
26
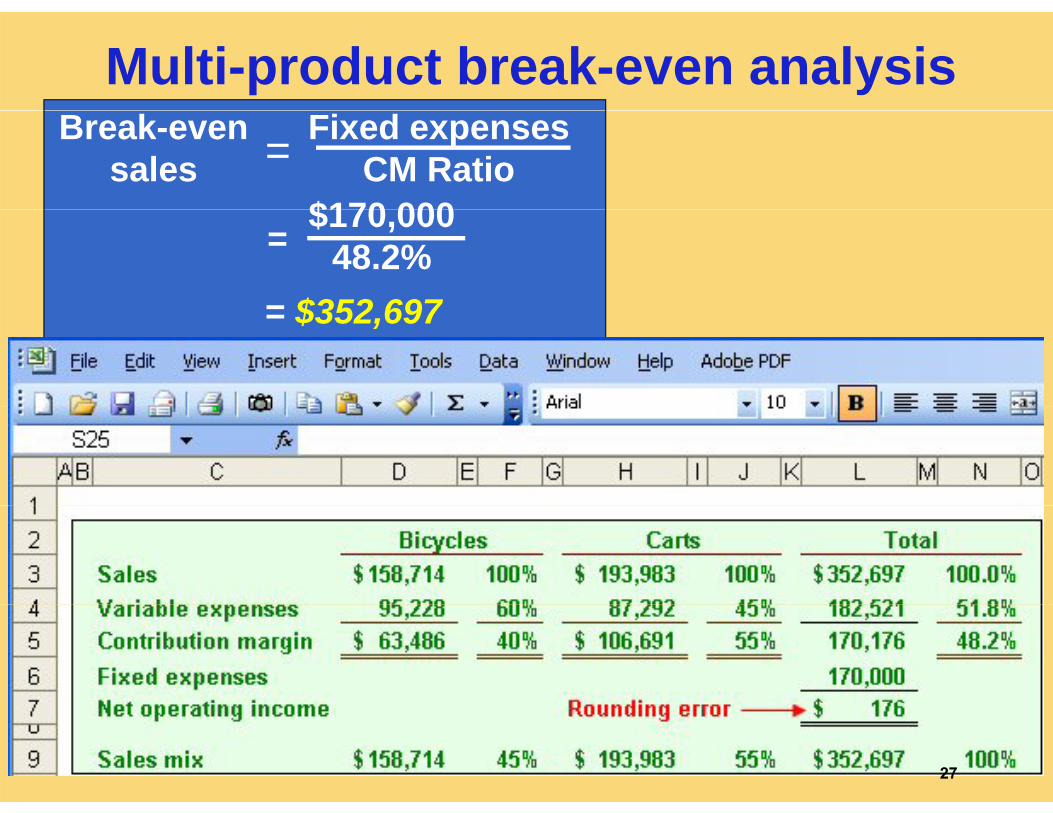
Multi-product break-even analysisFixed expenses
CM RatioBreak-even
sales$170 000
=$170,000
48.2%= $352 697
=
= $352,697
27
Key Assumptions of CVP Analysis
Selling price is constant.Selling price is constant.Costs are linear.In multiproduct companies, the sales mix is constant.constant.In manufacturing companies, inventories do
t h ( it d d it ld)not change (units produced = units sold).
28