cwt international limitedcompletion of the formation of the largest logistics hub in singapore and...
TRANSCRIPT

-1-
CWT International Limited(formerly known as HNA Holding Group Co. Limited)
Stock Code: 521
2017ANNUAL RESULTS
CORPORATE PRESENTATIONApril 2018

-2-
This presentation has been prepared for the sole purpose of providing an overview of CWT Pte. Limited (previously known as “CWT Limited”) (“CWT SG”) and CWT International Limited (the
“Company”) to facilitate a general discussion of aforementioned (“Purpose”). It is provided on a confidential basis, and may not be reproduced in whole or in part, nor may any of its contents be
disclosed to any other person, without the prior written consent of the Company. This presentation is provided by the Company for general information purposes only, without taking into account
any potential investors’ personal objectives, financial situation or needs. It should not be relied upon by the recipient in considering the merits of any particular investment in the securities of the
Company or other investments. It is not an offer to buy or sell, or a solicitation to invest in or refrain from investing in, any securities or other investment product. Nothing in this presentation
constitutes investment, legal, tax, accounting or other advice. The recipient should consider its own financial situation, objectives and needs, and conduct its own independent investigation and
assessment of the contents of this presentation, including obtaining investment, legal, tax, accounting and such other advice as it considers necessary or appropriate. In this presentation, the
Company may refer to information and statistics regarding the industry in which it operates that have been obtained from independent industry publications or other publicly available information.
The Company has relied upon and assumed, without independent verification, the accuracy and completeness of all such information. It contains selected information and does not purport to be
all-inclusive or to contain all of the information that may be relevant to the Purpose. The recipient acknowledges that circumstances may change and that this presentation may become outdated
as a result. The Company is under no obligation to update or correct this presentation.
The Company, its related bodies corporate and other affiliates, and their respective directors, employees, consultants and agents (“the Group”) make no representation or warranty as to the
accuracy, completeness, timeliness or reliability of the contents of this presentation. To the maximum extent permitted by law, no member of the Group accepts any liability (including, without
limitation, any liability arising from fault or negligence on the part of any of them) for any loss whatsoever arising from the use of this presentation or its contents or otherwise arising in connection
with it.
This presentation may contain forward-looking statements, forecasts, estimates and projections (“Forward Statements”). No independent third party has reviewed the reasonableness of any such
statements or assumptions. No member of the Group represents or warrants that such Forward Statements will be achieved or will prove to be correct. Actual future results and operations could
vary materially from the Forward Statements. Similarly, no representation or warranty is made that the assumptions on which the Forward Statements are based may be reasonable. No audit,
review or verification has been undertaken by the Group or an independent third party of the assumptions, data, results, calculations and forecasts presented or referred to in this presentation.
The recipient acknowledges that the Group does not intend to act or be responsible as a fiduciary to the recipient, its management, stockholders, creditors or any other person. Each of the
recipient and the Group, by accepting this presentation respectively, expressly disclaims any fiduciary relationship and agrees that the recipient is responsible for making its own independent
judgments with respect to any Investment and any other matters regarding this presentation.
Important Notice and Disclaimer
1

-3-
CWT Int’l At a Glance
Shareholding Structure
About Us Development Milestones of CWT Int’l
1993
2009
2011
2013
2016
2017
1970
Established by Singapore Port
Authority to provide warehousing
and container shipping terminal
services.
Listed on the Singapore Stock
Exchange
Completion of the formation of the
largest logistics hub in Singapore
and Southeast Asia
Acquired MRI, a global
commodities trading company
Shougang Concord Technology
Holdings Limited, jointly invested
by Shougang Group and Cheung
Kong(Holdings) Limited was
founded
HNA Group* became the largest
shareholders of the listed company
• HNA Group and its subsidiaries
Completion of non-core business
spin-off: sale of digital TV business
and LED Business and lay solid
foundation for strategic
transformation
Achieved success in terms of
business restructuring and profit
turnaround in FY17
CWT SG 521.HK
Enlarged CWT Int’l
A Brand-new Name and Image in HK Capital Market
Commodities
Marketing
MRI Group Straits Financial Group Indeco Engineers
CWT International Limited (521.HK)
CWT SG
100%
* 66.84%
Financial
ServicesLogistics
Engineering
Services
Public Float
* 33.16%
CWT Logistics Group 1983
2017Delisted from SGX
CWT International Limited (“CWT Int’l” or the “Group”) is a HKEX Main Board listed
company (Stock code:521.HK) headquartered in Hong Kong. In 2017, it acquired CWT
Pte. Limited (formerly known as “CWT Limited”) (currently “CWT SG”), a leading
integrated logistics solutions provider in Singapore, by way of voluntary general offer.
CWT Int’l aims to further optimize its business structure with focus on integrated logistics
services, commodity marketing and financial services.
* As at 31 December, 2017 2
100% 100% 100%98%
A leading integrated logistics
services provider with over 40 years
warehousing operational experience.

-4-
2017 Annual Results Highlights
3
Revenue
23,955,8632016: 182,546
Gross profit
811,1622016: 59,517
Profit before taxation
179,6862016: 20,948
Profit attributable to
owners of the Company
204,4782016: (21,902)
New revenue drivers with positive growth prospect
Synergistic effects with CWT Int’l business and network
Remarkable results after CWT Limited acquisitionHK$'000
13,023% 1,263% 758%Significant
Profit
turnaround

-5-
Connect ing World Trade
B U S I N E S S
O V E RV I E W

-6-
Logistics
ServicesEngineering
Services
Financial
Services
Commodity
Marketing
Industrial Sectors:
• Chemical
• Industrial
• Food and Beverage and
Lifestyle
• Shipping and Marine
Key revenue sources
• Warehousing logistics
• Regional and local distribution
logistics
• Project Logistics
• Vehicles and equipment management/maintenance
• Facilities management/maintenance
• Design and building services
• Warehouses management
• Property management
Non-regulated
• Broking
• FX trading
Regulated
• Futures and options
• OTC-cleared products
• Managed futures
• Trade financing
• Facilitation of physical delivery
• Structured trade transaction
Business Structure
Property management
Design and Build
Engineering Maintenance
Brokerage Services
Trade Services
Warehousing and Integrated Logistics (WIL)
• Consolidation of LCL cargo
• Freight forwarding services
Freight Logistics
Commodity Logistics
• Warehousing services
• Inventory management/Stock monitoring
• Freight forwarding
Commodity Marketing
• Physical trading of non-ferrous base metal Concentrates
and energy products
4

-7-
Logistics & Engineering Services
Leading logistics solutions provider for worldwide customers in
commodities, chemical, petrochemical, marine, oil & gas and
industrial sectors
Large scale warehousing capacityOne of the largest in Singapore with 6.3mn
sqft & 3.0mn sqft of owned and leased
warehouse space respectively
Leading player in niche segments From cold chain logistics, petrochemical/
chemical logistics to bonded and dutiable
logistics
Global freight & commodity
logistics networkConnectivity to around 200 direct ports &
1,600 inland destinations
Strategically located distribution hubsRegional distribution hubs in Asia and Europe
with full-service logistics facilities in storage,
movement and distribution of goods
Aviation and public facilities management
and maintenance
Vehicle and equipment maintenance
Agent for renowned specialized engineering
products
Design and build solutions for logistics
properties
property management of Cache Logistics
Trust, a real estate investment trust that
manages over 9.1mn sqft GFA of high quality
warehouse logistics facilities in Singapore,
China and Australia.
Logistics Engineering
Trusted engineering services provider in logistics
facilities and properties
5
Logistics
Services
Engineering
Services
Financial
Services
Commodity
Marketing

-8-
Commodity Marketing
Global contracting centers
Commodity Marketing
Non-ferrous ores
& concentrates
Major
products
Refined &
precious
metals
Petroleum
products
Related
byproducts
for global smelting
& processing
customer base
One-stop solutions
Structured
commodity
Hedge & risk
management
solutions
Local and representative offices located in 17 other countries
Main contracting centers located in
Zug, Switzerland and Singapore
6
Logistics
Services
Engineering
Services
Financial
Services
Commodity
Marketing
Pre-export
A commodity marketing division of CWT Int’l engaging in energy products, metals and minerals trading.
South
Korea
Singapore
Switzerland
TurkeyJapan
ThailandMalaysia
AustraliaSouth
Africa
Canada
Nigeria Mexico
Peru
Chile
Taiwan
China
Countries with MRI office(s)
Countries with MRI agent(s)
Bolivia
MRI Main Offices

-9-
Futures Exchange
Exchange Access
# represents number
in a region
Financial Services
• Futures and Options
• Cleared OTC Products
• Contract-for-differences (CDFs)
• Managed Funds
Financial and Commodities Derivatives1
• Collateralised Financing
• Trading of Physical Commodities
• Facilitation of Physical Delivery
Structured Trade Services2 Global Presence in Key Financial Markets
• Our main offices are located in Chicago, Singapore, Shanghai, Hong
Kong, Jakarta, Dubai
• Regulated under the CFTC in the US, MAS in Singapore, and SFC in
Hong Kong
4
Clearing Memberships3• Full Clearing Members of the Chicago Group Exchanges (total 7
exchanges
• With access to all major exchanges globally for a comprehensive
suit of products and services
• Our services include: Voice Brokerage, Trade Execution, Clearing,
Direct market access through trading platforms
Financial Services
• Commenced the first trade on INE Crude Oil Futures on 26
Mar, 2018
• Trading activity on INE surpassed expectations, with an
average of 50,000 lots in the first 3 days
Among the first approved
overseas intermediary brokers for
Shanghai International Energy
Exchange (“INE”)
7
Logistics
Services
Engineering
Services
Financial
Services
Commodity
Marketing
-10-
Connect ing World Trade
I N V E S T M E N T
H I G H L I G H T S

-11-
Investment Highlights
Reputable
Warehouse Operator
in Singapore
Leading NVOCC
Operator in Asia
Strategically Entrenched in
Customers’ Supply Chains
Significant Global
Presence
Experienced
Management Team Well Positioned for
Future Growth
8
-12-
Reputable Warehouse Operator in Singapore
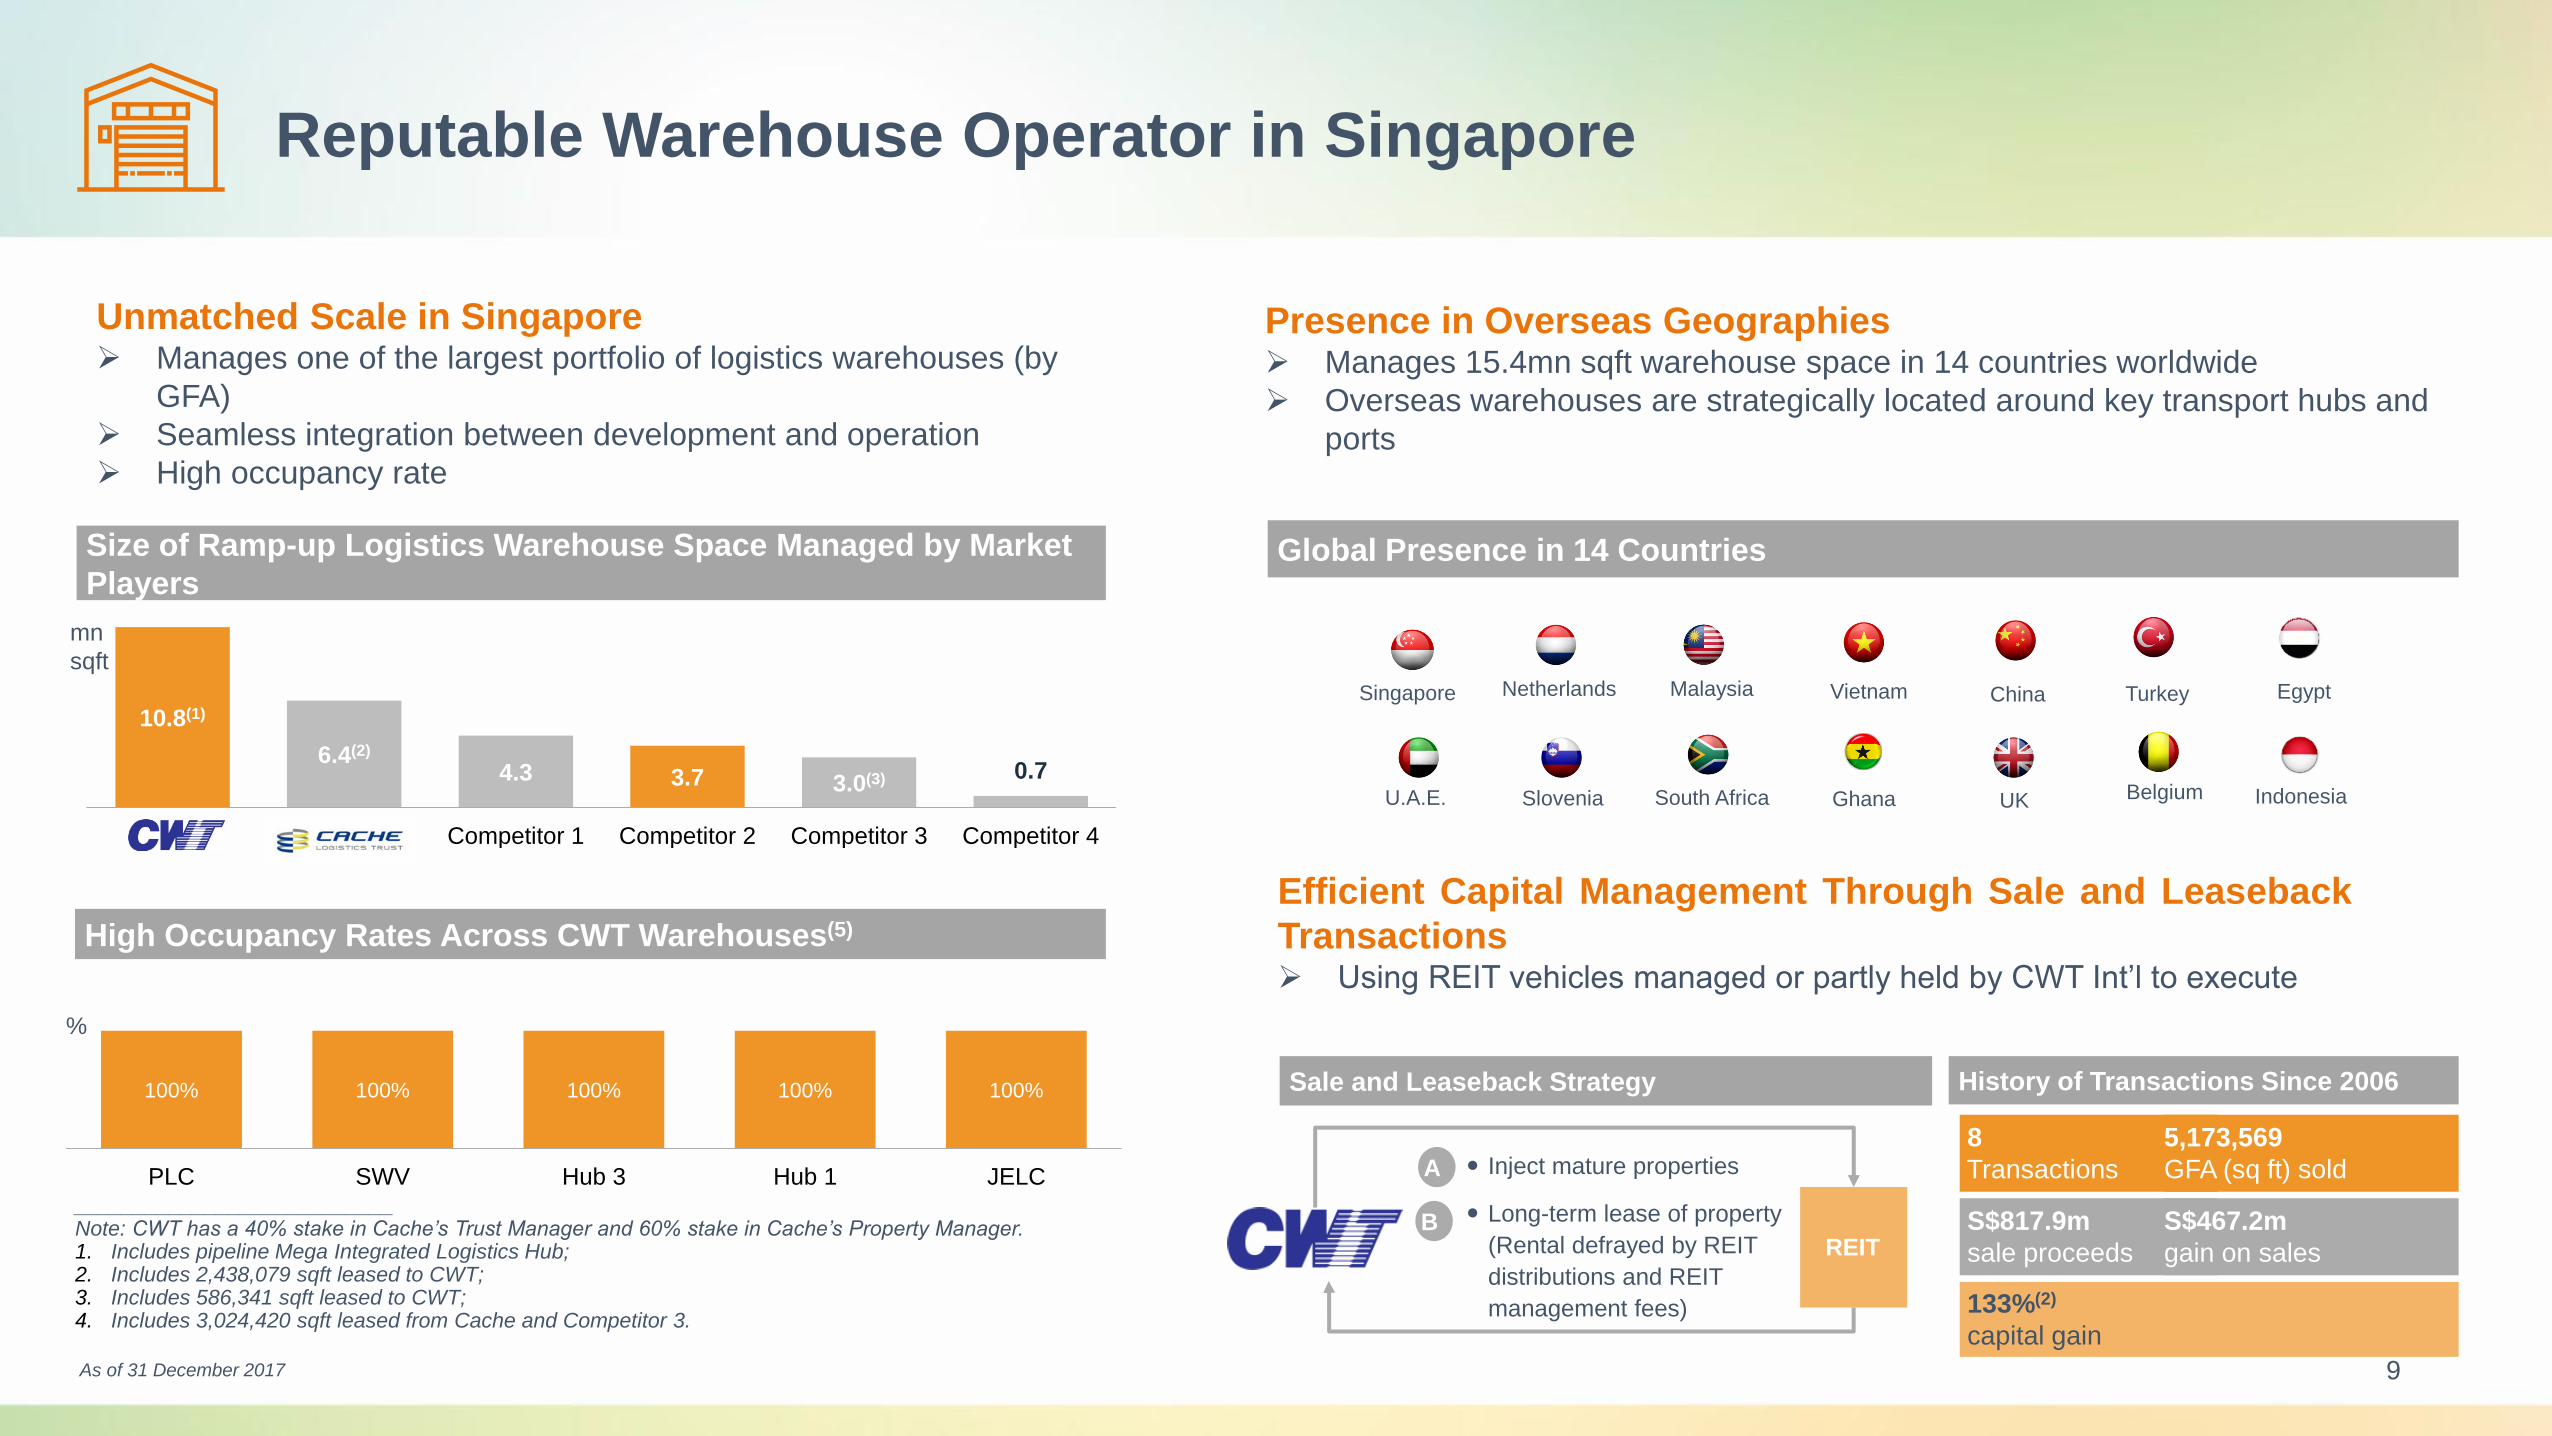
Unmatched Scale in Singapore Manages one of the largest portfolio of logistics warehouses (by
GFA)
Seamless integration between development and operation
High occupancy rate
Presence in Overseas Geographies Manages 15.4mn sqft warehouse space in 14 countries worldwide
Overseas warehouses are strategically located around key transport hubs and
ports
Size of Ramp-up Logistics Warehouse Space Managed by Market
Players
10.8(1)
6.4(2)
4.3 3.7 3.0(3) 0.7
CWT Cache Competitor 1 Competitor 2 Competitor 3 Competitor 4
mn
sqft
100% 100% 100% 100% 100%
PLC SWV Hub 3 Hub 1 JELC
High Occupancy Rates Across CWT Warehouses(5)
%
___________________________Note: CWT has a 40% stake in Cache’s Trust Manager and 60% stake in Cache’s Property Manager.1. Includes pipeline Mega Integrated Logistics Hub; 2. Includes 2,438,079 sqft leased to CWT; 3. Includes 586,341 sqft leased to CWT; 4. Includes 3,024,420 sqft leased from Cache and Competitor 3.
Global Presence in 14 Countries
Singapore Malaysia Vietnam China TurkeyNetherlands
South Africa UK BelgiumU.A.E. Slovenia
Efficient Capital Management Through Sale and Leaseback
Transactions Using REIT vehicles managed or partly held by CWT Int’l to execute
Inject mature properties
Long-term lease of property
(Rental defrayed by REIT
distributions and REIT
management fees)
A
BREIT
8
Transactions
5,173,569
GFA (sq ft) sold
S$817.9m
sale proceeds
S$467.2m
gain on sales
133%(2)
capital gain
Sale and Leaseback Strategy History of Transactions Since 2006
9
Ghana
Egypt
Indonesia
As of 31 December 2017

-13-
CENTRAL & SOUTH
AMERICA
Leading NVOCC* Operator in Asia
48
135
4367
3263
43
117
103
208
73
178
475350
1,102
690
AFRICA
MIDDLE
EAST
OCEANIA
SOUTH
PACIFIC
ASIA
EUROPE
NORTH, CENTRAL
AMERICA &
CARRIBEAN
Export Import
Global Freight Services(1)
___________________________*Note: NVOCC = Non-vessel Operating Common Carrier,
LCL = Less than Container Load.
1. Charts represent number of services. For illustrative purposes, an export service in Asia represents a direct calling at rest-of-world ports, originating from Asia, whereas an import service represents a direct calling at an Asian port, from rest of world locations.
Global freight
forwarding network
200 direct ports
1,600 inland
destinations
Extensive network
+100
offices globally
Global status
Global players for
LCL* cargo
Top
Market leader in Asia
Handles
+200,000 TEUs
5mn cbmof LCL cargo annually
10

-14-
Strategically Entrenched in Customers’ Supply Chains
Petrochemicals
& Chemicals
Regional Distribution Hub (RDH) services:
• In-plant logistics and hub management for leading chemical and
petrochemical companies
Supply chain solutions:
• Hazardous material handling and storage, chemical drumming, packing
and packaging, freight management
F&B,
Bonded Cargo
Dutiable cargo services:
• Coordinate documentation and inspection for dutiable cargos, dutiable
cargo accountability & reporting
Cold chain solutions:
• CWT Cold Hub 2 (Singapore Wine Vault), a 747,000 sq. ft. multi-
temperature controlled facility and the largest wine
• storage facility in South East Asia
A Value Proposition Across Various Industries
CommoditiesApproved and licensed warehouses:
• London Metal Exchange and ICE Futures Europe
Full suite of commodity logistics:
• Storage, handling, consolidation and inventory management of both hard
and soft commodities
MarineContainer logistics:
• Container trucking and storage, maintenance and repair, reefer structural
and machine repair, ISO tank maintenance
Loyal Customers Base
>15 years >20 years >12 years
>3 years >5 years
>30 years >30 years >20 years
>10 years >10 years >10 years
11

-15-
MRI Offices
1.Singapore
2.Zug, Switzerland
3.China
4.Johannesburg, South Africa
5.Lima, Peru
6.Seoul, Korea
7.Vancouver, Canada
8.Melbourne, Australia
9.Mexico City, Mexico
10.Santiago, Chile
11.Nigeria
Significant Global Presence
Maintains consistent profitability
amidst global fluctuations in the
commodities sector
Global Presence in 17 Countries
MRI Agents
12.Bolivia
13.Bangkok
14.Istanbul
15.Taiwan
16.Tokyo
17.Turkey
One of the world’s largest
independent traders of non-
ferrous concentrates trading
business
12Main Offices
South
Korea
Singapore
Switzerland
TurkeyJapan
ThailandMalaysia
AustraliaSouth
Africa
Canada
Nigeria Mexico
Peru
Chile
Taiwan
China
Countries with MRI office(s)
Countries with MRI agent(s)
Bolivia
MRI Main Offices

-16-
Loi Pok Yen
CEO, CWT SG
Mr. Loi was responsible for leading the executive team of
CWT SG to enhance the business strength and market
competitiveness for achieving the long-term success of the
CWT SG . Prior to joining CWT SG, he was responsible for
the construction and logistics operations of the storage facility
of C&P Holdings. He was the Winner of Ernst & Young's
Annual Entrepreneurship - Logistics Industry Sector
Lynda Goh
Deputy CEO & Chief Financial Officer,
CWT SG
Ms. Goh has held various senior leadership positions at CWT SG
since 1991. In 2005, she was appointed as Group Chief Financial
Officer and since then served as Deputy CEO of the Group. She
was responsible for assisting the Group CEO in the
implementation of company development and strategies, as well
as the management of the financial and day-to-day management
of CWT companies She was also responsible for managing CWT‘s
engineering business, investment, capital, finance, human
resources and corporate affairs. Ms. Goh was awarded Best CFO
for mid-cap listed company in the 2013 Singapore Business
Awards.
Guo Ke
Executive Director &
Co-Chairman of the Board
Mr. Guo is currently the Executive Director & Co-
Chairman of the Board. He has around 10 years
management experience in the fields of financial
management, capital operation and financial
investment.
Xu Haohao
Executive Director,
Co-Chairman of the Board
Mr. Xu is currently the Executive Director, Co-
Chairman of the Board. He works alongside
with Mr. Guo in providing leadership to the
Company. Mr. Xu has extensive management
knowledge and experience in financial and
corporate management.
Ding Lei
Chief Executive Officer
Mr. Ding joined in 2017 and is currently Chief
Executive Officer. He was engaged in HKEx,
CMS, BOCI, Newedge etc. and has extensive
experience in commodities, sales and trading.
Experienced Management Team
13

-17-
Well Positioned for Future Growth
4-folded Expansion Strategies
Sharper Market
Penetration
Wider Market
Coverage
Further
Geographical
Expansion
Stronger Physical
Presence
Logistics & Engineering
Services
Commodity
Marketing
Financial
ServicesM&A
Integrated logistics - Build Mega Hub of 2.4M
sq. ft. fully integrated facility capable of handling
12,000 TEUs
Freight logistics - Increase market share,
enhance and expand product suite
Integrated logistics - Develop niche logistics
operations such as hazardous goods and cold
chain and ride on e-commerce wave
Engineering services - Expand into healthcare
sector and regional airport maintenance
Commodity logistics - Expand international
operations in China, Middle East and Africa
Continuous strengthening
of supply chain
management and logistics
offerings
Continue to build upon OTC
brokerage services & existing
product suite (Energy, Bulk
Liquids, FX, CFDs)
Financial Services - Expand
services into key financial
markets (London, Hong Kong,
Middle East, South America)
Grow freight network
through JVs and local
partnerships
Strive to develop global
network through M&A
14

-18-
Connect ing World Trade
F I N A N C I A L
H I G H L I G H T S

-19-
Business
Segments
(HK$ mn)Revenue
Gross
Profit
Gross Profit
MarginNet Profit
Net Profit
Margin
Logistics 1,694 240 14.2% 162 9.6%
Commodity Marketing 19,819 254 1.3% 24 0.1%
Financial Services 1,920 116 6.0% 25 1.3%
Engineering 200 33 16.5% 25 12.6%
Overall 23,955 811 3.4% 315 1.3%
8%
89%
2% 1%
REVENUE BY SEGMENT
Logistics
Commodity Marketing
Engineering
Financial Services
40%
39%
10%
11%
GROSS PROFIT BY SEGMENT
Logistics
Commodities Marketing
Engineering
Financial Services
65%
12%
3%
2%9%
5%
3% 1% 0%
REVENUE BY GEOGRAPHICAL DISTRIBUTION
Mainland ChinaSingaporeMalaysiaTaiwanOther parts of the Asia Pacific RegionEuropeNorth AmericaAfrica
2017 Annual Results Highlights - 2
15

-20-
Connect ing World Trade
D E V E L O P M E N T
S T R AT E G I E S

-21-
Commodity
Marketing
CWT
Int’l
End
User
Logistic Service
Commodity
Inventory Management
Warehousing Service
Hedging Products Industrial Chain Financing
O v e r s e a s M a r k e t P R C M a r k e t
Financial
Service
Integrated
Platform
Development Strategies in China
Commodity
B e l t a n d R o a dB e l t a n d R o a d I n i t i a t i v e
16

-22-
Connect ing World Trade
A P P E N D I X

-23-
Appendix
17
Consolidated statement of profit or loss and other comprehensive income
For the year ended 31 December 2017
2017 2016
HK$'000 HK$'000
Continuing operations
Revenue 23,955,863 182,546
Cost of sales (23,144,701) (123,029)
Gross profit 811,162 59,517
Other income 77,513 21,422
Other gains, net 383,827 142,151
Selling and distribution costs (177,186) (6,152)
Administrative expenses (548,997) (124,815)
Finance costs (383,659) (113,071)
Share of profits less losses of associates, net of tax 13,006 -
Share of profits less losses of joint ventures, net of tax 4,020 -
Profit/(loss) before taxation 179,686 (20,948)
Income tax (expense)/credit (41,896) 2,003
Profit/(loss) for the year from continuing operations 137,790 (18,945)
Discontinued operations
Profit/(loss) for the year from discontinued operations 88,421 (40,895)
Profit/(loss) for the year 226,211 (59,840)

-24-
Appendix - 2
18
Other comprehensive income
Items that will not be reclassified to profit or loss:
Exchange differences arising from translation of financial statements
from functional currency to presentation currency 57,063 (157,711)
Defined benefit plan remeasurements 1,063 0
Tax on other comprehensive income (144) 0
57,982 (157,711)
Items that may be reclassified subsequently to profit or loss net of tax:
Exchange differences arising from translation of financial statements of
overseas subsidiaries 44,173 -
Exchange differences reclassified to profit or loss on disposal of
subsidiaries 23 -
Net change in fair value of available-for-sale financial assets (4,242) -
Share of other comprehensive income of associates and joint ventures (8,796) -
31,158 -
Other comprehensive income for the year 89,140 (157,711)
Total comprehensive income for the year 315,351 (217,551)
Consolidated statement of profit or loss and other comprehensive income
For the year ended 31 December 2017
2017 2016
HK$'000 HK$'000

-25-
Appendix - 3
19
Profit/(loss) for the year attributable to owners of the Company
- from continuing operations 115,621 (8,322)
- from discontinued operations 88,857 (13,580)
204,478 (21,902)
Profit/(loss) for the year attributable to non-controlling interests
- from continuing operations 22,169 (10,623)
- from discontinued operations (436) (27,315)
21,733 (37,938)
Profit/(loss) for the year 226,211 (59,840)
Total comprehensive income attributable to:
Owners of the Company 263,284 (152,169)
Non-controlling interests 52,067 (65,382)
315,351 (217,551)
Earnings/(loss) per share
Basic (HK cents) 1.79 -0.19
Diluted (HK cents) 1.79 -0.40
From continuing operations
Basic (HK cents) 1.01 -0.07
Diluted (HK cents) 1.01 -0.28
Consolidated statement of profit or loss and other comprehensive income
For the year ended 31 December 2017
2017 2016
HK$'000 HK$'000

-26-
Appendix - 4
Consolidated Statement of Financial Position
As at 31 December 2017
2017 2016
HK$'000 HK$'000
Non-current assets
Property, plant and equipment 8,589,127 260,655
Land use rights 1,095,395 1,059,477
Investment properties 2,486,202 2,447,621
Intangible assets 420,969 -
Interest in associates 202,135 -
Interest in joint ventures 311,334 -
Prepayments, deposits and other receivables 77,745 2,500
Other financial assets 373,409 155,000
Other non-current assets 23,038 700
Deferred tax assets 19,614 -
13,598,968 3,925,953
Current assets
Land use rights 44,710 41,548
Inventories 4,349,064 6,916
Trade receivables 4,604,925 27,040
Prepayments, deposits and other receivables 5,303,592 919,253
Warrantable LME commodities 136,387 -
Other financial assets 561,168 -
Derivative financial instruments 379,805 -
Tax recoverable 13,594 -
Pledged bank deposits 36,015 27,890
Cash and cash equivalents 2,137,858 1,085,447
17,567,118 2,108,094
Assets associated with disposal groups classified as held-for-sale - 387,075
Other non-current assets held-for-sale 15,617 -
17,582,735 2,495,169 20

-27-
Appendix - 5
21
Current liabilities
Trade and other payables 7,845,311 122,448
Loans and borrowings 10,268,069 55,163
Convertible bonds 380,656 -
Derivative financial instruments 1,074,659 -
Current tax payable 128,906 13,704
Deferred gains 59,360 49,489
Provisions 19,649 -
19,776,610 240,804
Liabilities associated with disposal groups classified as held-for sale - 396,961
19,776,610 637,765
Net current (liabilities)/assets (2,193,875) 1,857,404
Total assets less current liabilities 11,405,093 5,783,357
Consolidated Statement of Financial Position
As at 31 December 2017
2017 2016
HK$'000 HK$'000

-28-
Appendix - 6
Consolidated Statement of Financial Position
As at 31 December 2017
2017 2016
HK$'000 HK$'000
Non-current liabilities
Loans and borrowings 4,079,350 1,232,692
Derivative financial instruments 567 56,167
Convertible bonds - 324,421
Employee benefits 71,163 -
Deferred gains 195,386 193,909
Deferred tax liabilities 1,073,624 237,406
Other non-current liabilities 13,670 -
5,433,760 2,044,595
Net assets 5,971,333 3,738,762
Capital and reserves
Share capital 4,731,480 4,731,480
Reserves 712,653 (1,329,029)
Amounts recognised in other comprehensive income and accumulated in equity
relating to disposal groups classified as held-for-sale - (42,240)
Equity attributable to owners of the Company 5,444,133 3,360,211
Non-controlling interests 527,200 378,551
Total equity 5,971,333 3,738,762 22

-29-
Connect ing World Trade
THANK YOU!
CWT International Limited (0521.HK)
Suites 5811-5814, 58/F, Two International Finance
Centre, 8 Finance Street, HK
Tel: (852) 3151 5200
Fax: (852) 2505 9673
Email: [email protected]