cyclic cohesive model for fatigue crack growth in concrete · cyclic cohesive model for fatigue...
TRANSCRIPT
General rights Copyright and moral rights for the publications made accessible in the public portal are retained by the authors and/or other copyright owners and it is a condition of accessing publications that users recognise and abide by the legal requirements associated with these rights.
Users may download and print one copy of any publication from the public portal for the purpose of private study or research.
You may not further distribute the material or use it for any profit-making activity or commercial gain
You may freely distribute the URL identifying the publication in the public portal If you believe that this document breaches copyright please contact us providing details, and we will remove access to the work immediately and investigate your claim.
Downloaded from orbit.dtu.dk on: Feb 01, 2020
Cyclic cohesive model for fatigue crack growth in concrete
Skar, Asmus; Poulsen, Peter Noe; Olesen, John Forbes
Publication date:2017
Document VersionPeer reviewed version
Link back to DTU Orbit
Citation (APA):Skar, A., Poulsen, P. N., & Olesen, J. F. (2017). Cyclic cohesive model for fatigue crack growth in concrete.Paper presented at 2nd International Symposium on Multiscale Experimental Mechanics: Multiscale Fatigue ,Lyngby, Denmark.

Cyclic cohesive model for fatigue crack growth in
concrete
Asmus Skar1, Peter Noe Poulsen2, John Forbes Olesen2 1Section for Geotechnics and Geology, Department of Civil Engineering, Nordvej, Building
119, Technical University of Denmark, 2800 Kgs. Lyngby, Denmark 2Section for Structural Engineering, Department of Civil Engineering, Brovej, Building 118,
Technical University of Denmark, 2800 Kgs. Lyngby, Denmark
e-mail: asska@ byg.dtu.dk, [email protected], [email protected]
1. Introduction Concrete structures, e.g. concrete bridges, rigid and semi-rigid pavements, are subjected to
cyclic loading from moving vehicles. This type of loading results in initiation of bending cracks
in the quasi-brittle cemented material. Subsequently, these cracks propagate, which might
lead to failure of the structure. The cyclic behaviour of concrete materials has mainly been
studied subjected to fatigue loading in direct tensile, flexural or indirect tensile loading, see
e.g. Cornelissen [1]. These types of experiments have typically been used to establish Wöhler
type of fatigue relationships, or so-called 𝑆-𝑁 curves, and provide some information about the
number of cycles to failure and the damage development. However, these tests do not
distinguish between crack initiation and crack propagation or elastic and inelastic work.
John Forbes Olesen, MSc,
PhD, Associate Professor,
DTU. Areas of interest:
Computational structural
modelling, FEM, FELA, non-
linear fracture mechanics of
concrete and reinforced
concrete structures.
Peter Noe Poulsen, MSc,
PhD, Associate Professor,
DTU. Areas of interest: non-
linear FEM, FELA, fracture
mechanics of concrete and
reinforced concrete
structures, constitutive
modelling.
Asmus Skar, MSc, PhD,
Postdoc, DTU. Areas of
interest: Pavement
mechanics, computational
modelling, FEM, constitutive
modelling, fracture
mechanics, forward and
inverse pavement analysis.

2
In order to create a simple and robust modelling framework for engineering application and
inverse analysis of experimental results, this paper presents a multi-scale cyclic cohesive
model. The model consists of three levels, i.e. (i) fiber, (ii) hinge and (iii) beam level,
respectively.
At the lowest level a fiber of concrete material including a crack is considered and a stress-
mean strain relationship is established. The cyclic behaviour of the crack is incorporated into
the fiber response considering the loading process below the monotonic softening curve, i.e.
fatigue crack growth after crack initiation. Reduction of the crack bridging stress during cyclic
loading is determined applying an energy based approach, relating damage of the cohesive
potential to the accumulated work during the fatigue loading process.
The fiber stress-mean strain relationship is incorporated in a hinge as proposed by Skar et al.
[2]. Hinge models have been effectively applied for studying crack growth phenomena in both
plain concrete beams [3]-[4], as well as reinforced and fiber-reinforced concrete beams [5]-
[7]. For the hinge, which is a finite part of the beam, a relationship between the generalized
sectional forces and strains is established.
For structural analysis, the hinge model is then applied as a constitutive model in a non-linear
beam element as first proposed by Olesen and Poulsen [8]. Although the underlying
description of the hinge is based on the formation of discrete cracks the constitutive behaviour
of the hinge is smeared (smooth). This particular feature is practical and effective as it requires
no a-priori knowledge of the crack pattern. Skar et al. [9] showed that this model is able to
predict the stress distribution and stiffness during crack development, resulting in a precise
prediction of the crack-opening.
The presented model accounts for the material behaviour in all the cracked phases, linking
the development of the fracture process zone and damage of the existing fracture process
zone to the monotonic material characteristics in a rational manner. The model represent an
extension and generalization compared to previous models developed by the Authors, see
[10], including pre-peak initiation of cracks and more complex stress-crack opening behaviour.
2. Fiber level The uni-axial tensile behaviour of the concrete material is modelled according to the fictitious
crack model by Hillerborg et al. [11]. The linear elastic pre-crack state is described by the
elastic modulus, 𝐸𝑐. The uni-axial tensile strength is denoted by 𝑓𝑡 and the corresponding
strain by 𝜀𝑐𝑡. However, as micro cracks form at a lower level than the tensile strength, the
proposed model is generalized to account for the damage process during pre-peak crack
initiation. This behaviour can be described by exponential or multilinear stress-crack opening
relationships, e.g.

3
𝜎(𝑤) = 𝑏𝑖 + 𝑎𝑖𝑤 0 ≤ 𝑤 ≤ 𝑤𝑐 (1) where 𝑤 is the crack opening, 𝑤𝑐 is the final
zero-stress displacement, 𝑎𝑖 is the slope
and 𝑏𝑖 the intersection of the tangent line
segment and the ordinate for a given point
on softening curve as shown in Figure 1.
The present study aims at creating a simple
modelling framework for engineering
design purposes, and not models that
exactly describes the concrete unloading-
reloading hysteresis loops found from
experiments, see e.g. Hordijk [12]. For
simplicity unloading towards the origin is
assumed as a starting point for the model
development, as shown in Figure 2.
Figure 1 . Definition of parameters for softening law
selected: multi-linear idealisation (black dashed) of
exponential softening curve (grey solid) using four
linear line segments.
Figure 2. Energy considerations used for description of cyclic behaviour of concrete material in uni-axial tension at the
start of fatigue analysis: (a) Residual fracture energy and (b) Dissipated, reversible and residual energy.
The cohesive potential, i.e. the residual fracture energy, 𝐺𝐹𝑟𝑒𝑠, at the point where a fiber of
concrete material enters the fatigue phase is given as, see Figure 2 (a),
𝐺𝐹𝑟𝑒𝑠 = 𝐺𝐹 − 𝐸𝑚𝑜𝑛
𝑑𝑖𝑠 = 𝐸𝑟𝑒𝑣 + 𝐸𝑟𝑒𝑠 (2)
where 𝐸𝑚𝑜𝑛𝑑𝑖𝑠 is the dissipated energy from monotonic crack-opening process, 𝐸𝑟𝑒𝑣 is the
reversible elastic fracture energy upon the first load cycle and 𝐸𝑟𝑒𝑠 is the residual fracture
energy upon the first load cycle.

4
In incremental unloading-reloading schemes, shown as the grey curve in Figure 3 (a), the
gradient at the onset of unloading would decline with decreasing stress level due to the
incremental deterioration of the fracture energy. Similarly, the gradient at the onset of
reloading, would be equal to the final unloading stiffness, and then decline with increasing
stress level. In the model presented here, a more simplified format is selected, assuming a
constant unloading and reloading stiffness, i.e. unloading towards origin and reloading
towards a fixed point on the monotonic curve, respectively. The fixed point on the monotonic
curve is controlled by the residual fracture energy, 𝐺𝐹𝑟𝑒𝑠, after a cyclic loading process. The
residual fracture energy is updated at the onset of reloading. This is exemplified for the
reloading process 𝐴-𝐵 in Figure 3 (a), comparing the simple constant stiffness scheme
proposed (black line) and incremental stiffness scheme (gray line) where the deterioration is
exaggerated.
Figure 3. a) Proposed simplified constant stiffness scheme (black line) compared to a more realistic incremental stiffness
scheme (gray line) showing the work of the cyclic reloading process 𝑨-𝑩 (shaded gray). (b) Sketch of arbitrary load case
𝑴-𝑨-𝑩-𝑪: Unloading with constant damage (towards origin) and reloading with damage of loading process below the
monotonic curve (towards (𝒘𝒇, 𝝈𝒇)).
In order to determine the cyclic damage an arbitrary load case is considered, see Figure 3 (b).
After unloading from point 𝑀 on the monotonic curve, the fiber enters cyclic loading. The
residual fracture energy for a point 𝑗 is given by the residual fracture energy at the onset of
cyclic loading, here denoted point 𝑖, and the accumulated work. A simple linear relationship is
proposed
𝐺𝐹,𝑗𝑟𝑒𝑠 = 𝐺𝐹,𝑖
𝑟𝑒𝑠 − 𝑘𝑓𝑎𝑡 ∑ 𝑊 (3)
where 𝑘𝑓𝑎𝑡 is the fatigue damage parameter. The fatigue damage parameter is a key
calibration parameter of the model and is used to scale the fracture energy dissipated during
fatigue loading as a fraction of accumulated work. ∑ 𝑊 is the accumulated work, i.e. for the
loading process 𝑀-𝐴-𝐵, shown in Figure 3 (a),

5
∑ 𝑊 = 𝑊𝑀−𝐴 + 𝑊𝐴−𝐵 (4)
The work for a load increment, e.g. 𝑊𝐴−𝐵 is found from trapezoidal calculation.
Considering a fiber in point 𝐶, the work from the loading process 𝑀-𝐴-𝐵-𝐶 is added to the
accumulated work upon reloading from 𝐶. Reloading from point 𝐶 takes place towards the
fixed point on the monotonic failure envelope (𝑤𝑓 , 𝜎𝑓) found from a simple bisection
interpolation scheme, i.e. solving the equation
𝑓(𝑤𝑓) = 𝐺𝐹,𝑗𝑟𝑒𝑠 − (𝐸𝑗
𝑟𝑒𝑣(𝑤𝑓) + 𝐸𝑗𝑟𝑒𝑠(𝑤𝑓)) = 0 (5)
The stiffness during cyclic loading depends on whether the cohesive surface opens or closes, i.e.
�̇� = {𝐾𝑠
−�̇�
𝐾𝑠+�̇�
�̇� < 0 �̇� > 0
, where 𝐾𝑠
− =𝜎𝑢−𝜎𝑢
𝑘
𝑤𝑢
𝐾𝑠+ =
𝜎𝑓−𝜎𝑟
𝑤𝑓−𝑤𝑟
(6)
where 𝐾𝑠− and 𝐾𝑠
+are the unloading and reloading stiffnesses, respectively. 𝜎𝑢 and 𝜎𝑟 are
the stresses at the onset of unloading and reloading, respectively, and 𝑤𝑢 and 𝑤𝑟 are the
crack-openings at the onset of unloading and reloading, respectively. 𝜎𝑢𝑘 is a fixed negative
intersecting point on the ordinate for more precise prediction of the concrete cyclic
response. For secant unloading 𝜎𝑢𝑘 is zero. The stress during unloading and reloading is then
given as
𝜎 = {𝐾𝑠
−𝑤
𝐾𝑠+(𝑤 − 𝑤𝑟)
�̇� < 0 �̇� > 0
(7)
The fatigue crack growth process in concrete may be divided into a crack initiation phase and
a crack development phase. In order to test the proposed methodology, the latter phase is
considered, avoiding influence of pre-peak fatigue damage on the results. This means that
the maximum stress 𝜎𝑚𝑎𝑥 at some point has reached the tensile strength 𝑓𝑡, where a crack
in the concrete material has initiated.
The proposed methodology is tested and compared to fatigue tests of cracked plain concrete
cylinders in uni-axial tension reported in Plizzari et al. [13]. Cylinders with a length of 210
mm, diameter of 80 mm and a notch depth of 4 mm were considered. The crack mouth
opening displacement was measured over a length of 35 mm. In these tests only the cracked
phase was considered, see example in Figure 4.
6
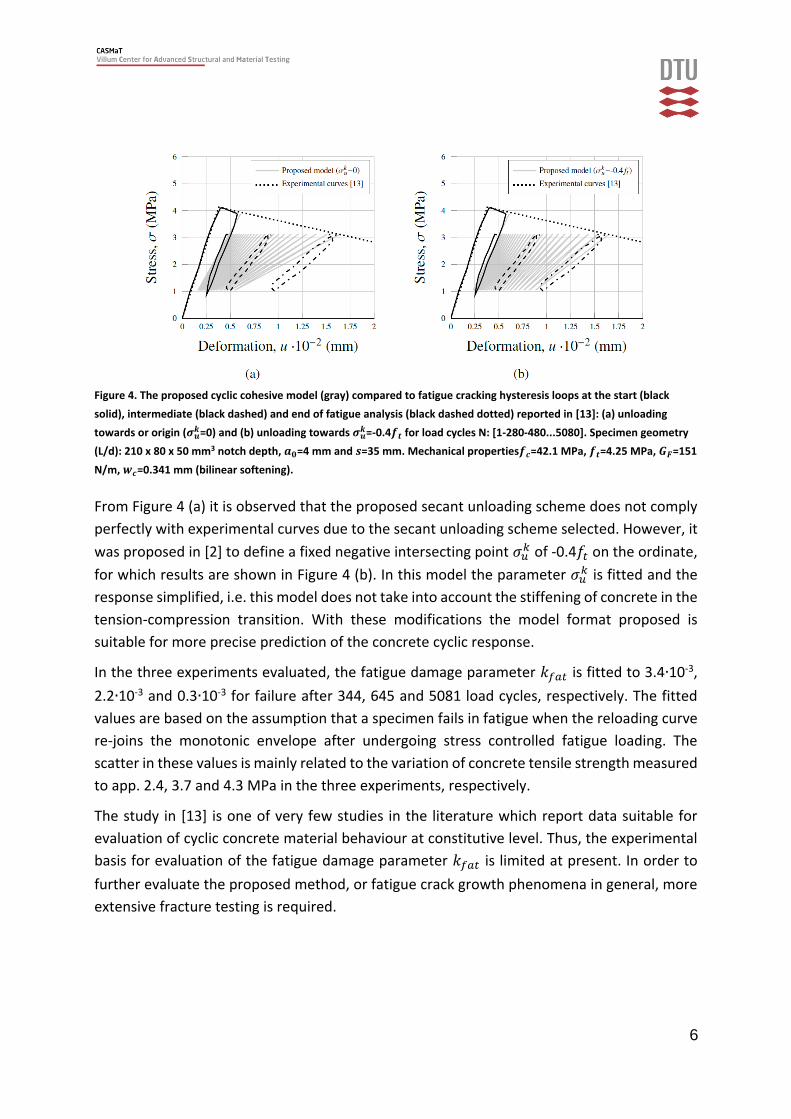
Figure 4. The proposed cyclic cohesive model (gray) compared to fatigue cracking hysteresis loops at the start (black
solid), intermediate (black dashed) and end of fatigue analysis (black dashed dotted) reported in [13]: (a) unloading
towards or origin (𝝈𝒖𝒌=0) and (b) unloading towards 𝝈𝒖
𝒌=-0.4𝒇𝒕 for load cycles N: [1-280-480...5080]. Specimen geometry
(L/d): 210 x 80 x 50 mm3 notch depth, 𝒂𝟎=4 mm and 𝒔=35 mm. Mechanical properties𝒇𝒄=42.1 MPa, 𝒇𝒕=4.25 MPa, 𝑮𝑭=151
N/m, 𝒘𝒄=0.341 mm (bilinear softening).
From Figure 4 (a) it is observed that the proposed secant unloading scheme does not comply
perfectly with experimental curves due to the secant unloading scheme selected. However, it
was proposed in [2] to define a fixed negative intersecting point 𝜎𝑢𝑘 of -0.4𝑓𝑡 on the ordinate,
for which results are shown in Figure 4 (b). In this model the parameter 𝜎𝑢𝑘 is fitted and the
response simplified, i.e. this model does not take into account the stiffening of concrete in the
tension-compression transition. With these modifications the model format proposed is
suitable for more precise prediction of the concrete cyclic response.
In the three experiments evaluated, the fatigue damage parameter 𝑘𝑓𝑎𝑡 is fitted to 3.4∙10-3,
2.2∙10-3 and 0.3∙10-3 for failure after 344, 645 and 5081 load cycles, respectively. The fitted
values are based on the assumption that a specimen fails in fatigue when the reloading curve
re-joins the monotonic envelope after undergoing stress controlled fatigue loading. The
scatter in these values is mainly related to the variation of concrete tensile strength measured
to app. 2.4, 3.7 and 4.3 MPa in the three experiments, respectively.
The study in [13] is one of very few studies in the literature which report data suitable for
evaluation of cyclic concrete material behaviour at constitutive level. Thus, the experimental
basis for evaluation of the fatigue damage parameter 𝑘𝑓𝑎𝑡 is limited at present. In order to
further evaluate the proposed method, or fatigue crack growth phenomena in general, more
extensive fracture testing is required.
7
3. Hinge level For analysis of bending in beam structures, the proposed uni-axial cyclic cohesive model in
Section 2 is incorporated into a hinge model. The basic assumption of the hinge model is the
fact that the presence of a crack influences the overall stress and strain field of a structure
only locally. The discontinuity created by the crack is expected to vanish outside a certain
width. The width 𝑠 between two such sections embracing one crack defines a hinge.
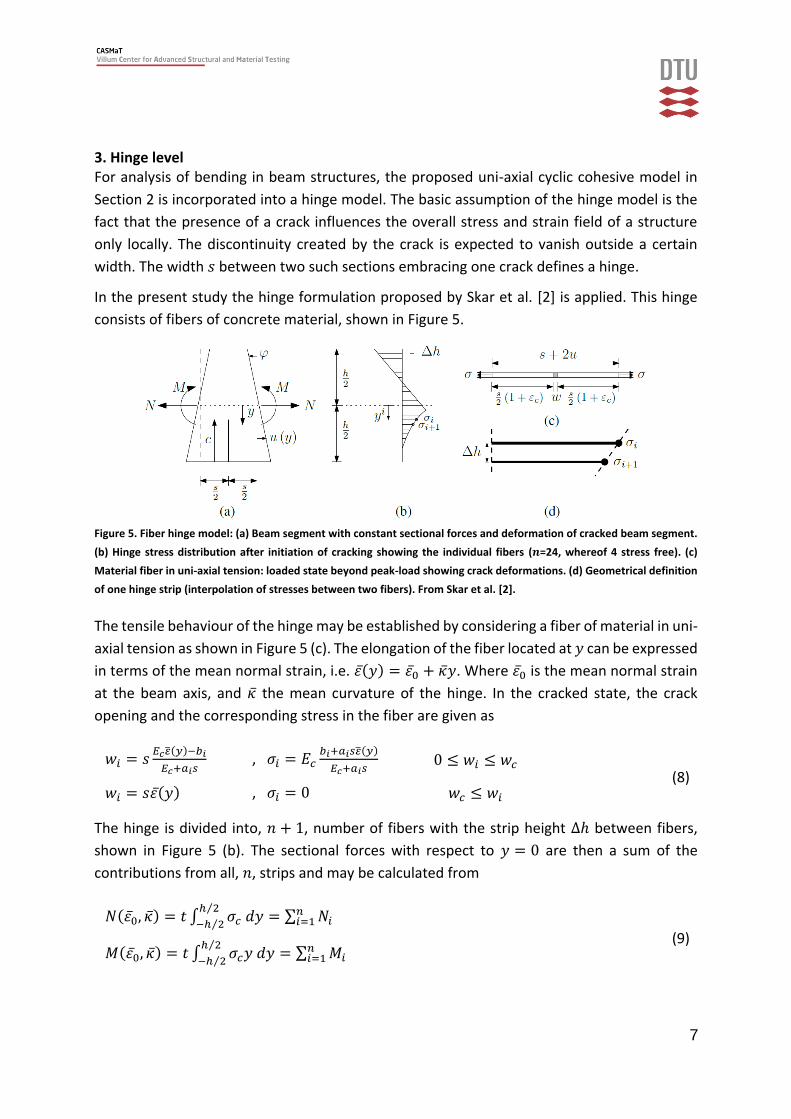
In the present study the hinge formulation proposed by Skar et al. [2] is applied. This hinge
consists of fibers of concrete material, shown in Figure 5.
Figure 5. Fiber hinge model: (a) Beam segment with constant sectional forces and deformation of cracked beam segment.
(b) Hinge stress distribution after initiation of cracking showing the individual fibers (𝒏=24, whereof 4 stress free). (c)
Material fiber in uni-axial tension: loaded state beyond peak-load showing crack deformations. (d) Geometrical definition
of one hinge strip (interpolation of stresses between two fibers). From Skar et al. [2].
The tensile behaviour of the hinge may be established by considering a fiber of material in uni-
axial tension as shown in Figure 5 (c). The elongation of the fiber located at 𝑦 can be expressed
in terms of the mean normal strain, i.e. 𝜀(̅𝑦) = 𝜀0̅ + �̅�𝑦. Where 𝜀0̅ is the mean normal strain
at the beam axis, and �̅� the mean curvature of the hinge. In the cracked state, the crack
opening and the corresponding stress in the fiber are given as
𝑤𝑖 = 𝑠𝐸𝑐�̅�(𝑦)−𝑏𝑖
𝐸𝑐+𝑎𝑖𝑠 , 𝜎𝑖 = 𝐸𝑐
𝑏𝑖+𝑎𝑖𝑠�̅�(𝑦)
𝐸𝑐+𝑎𝑖𝑠 0 ≤ 𝑤𝑖 ≤ 𝑤𝑐
(8) 𝑤𝑖 = 𝑠𝜀(̅𝑦) , 𝜎𝑖 = 0 𝑤𝑐 ≤ 𝑤𝑖
The hinge is divided into, 𝑛 + 1, number of fibers with the strip height ∆ℎ between fibers,
shown in Figure 5 (b). The sectional forces with respect to 𝑦 = 0 are then a sum of the
contributions from all, 𝑛, strips and may be calculated from
𝑁(𝜀0̅, �̅�) = 𝑡 ∫ 𝜎𝑐 𝑑𝑦ℎ 2⁄
−ℎ 2⁄= ∑ 𝑁𝑖
𝑛𝑖=1
(9) 𝑀(𝜀0̅, �̅�) = 𝑡 ∫ 𝜎𝑐𝑦 𝑑𝑦
ℎ 2⁄
−ℎ 2⁄= ∑ 𝑀𝑖
𝑛𝑖=1

8
where 𝑁𝑖 and 𝑀𝑖 are the normal force contribution and moment contribution from each strip,
respectively. It was found in [2] that sufficient accuracy of the hinge response can be obtained
with app. 10-30 fibers.
The functionality of the proposed cyclic hinge model is tested on a single hinge subjected to
25 cycles (𝑁=25) with hinge mean curvature between 1 and 4 mm-1 as shown in Figure 6.
Figure 6. Cyclic behaviour of hinge under constant curvature control: Fatigue damage parameter 𝒌𝒇𝒂𝒕=0.25. Hinge
dimensions (h/t): 0.20 x 0.10 m2. Hinge parameters: 𝒏=50 and 𝒔=𝑯/2. Material properties: 𝑬𝒄=30 GPa, 𝒇𝒕=3.5 MPa,
𝑮𝑭=150 N/m and 𝒘𝒄=0.1 mm (linear softening).
The evolving stress-mean strain response for the upper quarter hinge fiber, at the position
𝑦 = − ℎ 4⁄ , and the bottom hinge fiber, at the position 𝑦 = ℎ 2⁄ , during the cyclic loading
process is shown in Figure 7 (a) and (b).
Figure 7. Behaviour of hinge fibers during cyclic loading: (a) Bottom fiber (black) and upper quarter fiber (grey). (b) Close-
up of the upper hinge fiber at position 𝒚=-𝒉/4 going through different phases during cyclic loading of hinge. From Figure 7 (a) it is observed that the bottom fiber enters the fatigue phase after the first
monotonic load step. As fibers on the lower part of the hinge deteriorate, new fibers in the
upper part of the hinge are activated, see Figure 7 (b). The upper hinge fiber is first in

9
compression, then in linear elastic tension, before entering a short stage of low-cyclic
monotonic damage, i.e. development of the fracture process zone. Finally, the fiber enters the
fatigue phase. This behaviour highlights the importance of a consistent format for numerical
simulations of concrete material subjected to cyclic loading, accounting for all the different
cracked phases in a unified manner.
4. Beam level Under constant moment, e.g. between the loaded points in Figure 8 (a), the beam sections at
the midpoint between cracks will, due to the periodicity of the cracks, remain plane during
deformation of the beam. This justifies the application of the hinge model. For the beam parts
outside the loaded points, the moment distribution is no longer constant. Such phenomena
can be handled with appropriate numerical tools, i.e., the finite element (FE) method, as
exemplified for a single beam element in Figure 8 (b).
Figure 8. Sketch of hinge model implemented in simply supported beam under four point loading: (a) overview of beam
structure, (b) underlying discrete formulation of cracks at constitutive points, 𝒄𝒑, and smeared constitutive behaviour
obtained from interpolation between constitutive points, 𝒊𝒑.
The proposed hinge model is implemented in a user-built finite element code, hereafter
referred to as the FEM hinge. Detailed description of the implementation of the model can be
found in Skar et al. [10] and Skar [14].
The functionality of the proposed numerical hinge model for simulation of the cyclic fracture
behaviour of a three point beam in the fatigue phase is demonstrated by comparing crack
length versus number of load cycles with the experimental results reported in Toumi and
Bascoul [15], as shown in Figure 9.

10
Figure 9. FEM hinge versus experimental and model curves reported in [15]: Crack length versus number of load cycles.
Where the crack length c is taken as the progressive depth to the crack tip.
It is observed from Figure 9 that the FEM hinge model is able to capture the fatigue crack
growth development during cyclic loading after an initial phase of app. 50 load cycles.
Moreover, some characteristic features of the model are shown: (i) the initial crack length
increases with increasing load (𝑃𝑢), (ii) the crack growth rate increases with increasing load
(𝑃𝑢) and the fatigue life increases for decreasing load (𝑃𝑢). It is also observed that the
numerical crack growth curves resemble the experimental curves, and that the combination
of all three models is able to give a close prediction of the number of load repetitions to failure.
5. Conclusions A simple energy based approach for damage evolution during cyclic loading was proposed,
requiring only a single model parameter additional to the monotonic parameters. The selected
format is general and consistent, and ensures that damage during cyclic loading in fatigue is
restricted to the monotonic failure envelope, i.e. the damage state after arbitrary loading is
associated with a monotonic loading process that leads to the same damage state. The
proposed model shows satisfactory results when compared to experiments with cracked plain
concrete cylinders in uni-axial tension. The finite element hinge adequately describes the
fatigue crack growth of plain concrete beams under three point loading. Main characteristic
features, such as initial crack length and fatigue crack growth rate, can be simulated with the
finite element hinge model. The results obtained are encouraging and show that the
methodology is well suited for practical use, e.g. inverse analysis of experiments and forward
analysis of fatigue crack growth in concrete beam structures.

11
6. References [1] H. Cornelissen, Fatigue failure of concrete in tension, HERON, 29 (4), 1984.
[2] A. Skar, P. N. Poulsen, J. F. Olesen, General cracked-hinge model for simulation of low-
cycle damage in cemented beams on soil, Engineering Fracture Mechanics 175 (2017)
324–338. doi:10.1016/j.engfracmech.2017.01.016.
[3] J. P. Ulfkjær, S. Krenk, R. Brincker, Analytical model for fictitious crack propagation in
concrete beams, Journal of Engineering Mechanics 121 (1) (1995) 7–15.
[4] J. F. Olesen, Fictitious crack propagation in fiber-reinforced concrete beams, Journal of
Engineering Mechanics 127 (3) (2001) 272–280. doi:10.1061/ (ASCE)0733-
9399(2001)127:3(272).
[5] A. Carpinteri, Energy dissipation in rc beams under cyclic loadings, Engineering
Fracture Mechanics 39 (2) (1991) 177–184.
[6] J. Zhang, H. Stang, V. C. Li, Fatigue life prediction of fiber reinforced concrete under
flexural load, International Journal of Fatigue 21 (10) (1999) 1033–1049.
[7] J. F. Olesen, Cracks in reinforced frc beams subject to bending and axial load, Fracture
mechanics of concrete structures, vols 1 and 2 (2001) 1027–1033.
[8] J. F. Olesen, P. N. Poulsen, Modeling rc beam structures based on cracked hinge model
and finite elements, Tech. Rep. SR12-11, Technical University of Denmark, DTU Civil
Engineering (2012).
[9] A. Skar, P. N. Poulsen, J. F. Olesen, Cohesive cracked-hinge model for simulation of
fracture in one-way slabs on grade, International Journal of Pavement Engineering 0
(0) (0) 1–15. doi:10.1080/10298436.2017.1293263.
[10] A. Skar, P. N. Poulsen, J. F. Olesen, A simple model for fatigue crack growth in concrete
applied to a hinge beam model, Engineering Fracture Mechanics 181 (2017) 38–51.
doi:10.1016/j.engfracmech.2017.06.018.
[11] A. Hillerborg, M. Modéer, P.-E. Petersson, Analysis of crack formation and crack growth
in concrete by means of fracture mechanics and finite elements, Cement and concrete
research 6 (6) (1976) 773–781.
[12] D. Hordijk, Tensile and tensile fatigue behaviour of concrete; experiments, modelling
and analyses, Heron 37 (1) (1992) 1–79.
[13] G. Plizzari, S. Cangiano, S. Alleruzzo, The fatigue behaviour of cracked concrete,
Fatigue & Fracture of Engineering Materials & Structures 20 (8) (1997) 1195–1206.
[14] A. Skar, Deterioration models for cement bound materials in structural design and
evaluation of heavy duty pavements, Ph.D. thesis, Technical University of Denmark,
DTU Civil Engineering (April 2017).
[15] A. Toumi, A. Bascoul, Mode i crack propagation in concrete under fatigue: microscopic
observations and modelling, International journal for numerical and analytical
methods in geomechanics 26 (13) (2002) 1299–1312.