cyclic in-plane shear testing of unreinforced masonry ... · pdf filec. allen, m.j. masia...
TRANSCRIPT
Proceedings of the Tenth Pacific Conference on Earthquake Engineering Building an Earthquake-Resilient Pacific
6-8 November 2015, Sydney, Australia
Cyclic in-plane shear testing of unreinforced masonry walls with openings
C. Allen, M.J. Masia & A.W. Page
The University of Newcastle, Australia.
M.C. Griffith & H. Derakhshan
The University of Adelaide, Australia.
ABSTRACT: This paper presents the results to date of an experimental testing programme of unreinforced masonry (URM) walls subject to cyclic in-plane shear loading. The primary aim of this experimental program is to obtain force-displacement relationships for URM walls with openings and to understand the influence of wall geometry and vertical pre-compression on in-plane wall failure modes.
The experimental programme consists of testing 12 full-scale wall specimens. These 12 walls consist of three geometrical configurations, two levels of pre-compression, and two repeats for each wall. To date, 10 of these 12 combinations have been successfully tested with the two remaining tests being repeats of walls previously tested.
1 INTRODUCTION
Unreinforced masonry (URM) has consistently been observed to perform poorly in even moderate earthquakes. This seismic vulnerability is due to URM’s high mass and stiffness, low tensile and shear strength, low ductility, and high variability of material properties.
When a building is subject to earthquake loading, inertial forces are transferred from floors and out-of-plane walls to in-plane walls. Acceptable structural performance of URM buildings is only achieved by preventing local failure mechanisms such as out-of-plane wall failures.
Observations from previous earthquakes such as Canterbury 2010-2011 (Ingham & Griffith, 2011) have shown that, although damage to walls due to in-plane seismic actions is common, structural collapse due to in-plane actions is usually only observed for walls with openings (perforated walls). Damage to perforated walls is especially prevalent at lower levels of buildings where seismic shears are highest.
The analysis of perforated URM walls subject to in-plane loads is usually carried out by discretising walls into pier (vertical) and spandrel (horizontal) elements. Guidance for assessing the strength and stiffness of pier elements is abundant in worldwide design guidelines (e.g. ( NZSEE, 2006) ) but guidance for assessment of spandrels is much less prevalent.
Previous research into the in-plane behaviour of perforated URM walls subject to seismic loading has focused mainly on the behaviour of piers e.g. (Magenes & Calvi, 1997) as these have been the elements of perforated walls most commonly observed to fail in-plane during previous earthquakes. In-plane spandrel failures in URM walls were however a common failure mode observed in the Canterbury 2010-2011 earthquakes (Ingham & Griffith, 2011). Recent experimental studies such as (Beyer, 2012) and (Knox, 2012) have begun to shift the focus to the seismic behaviour of URM spandrels, and URM pier and spandrel assemblages respectively.
Previous experimental studies at The University of Newcastle ( (Konthesingha, 2012), (Petersen, 2009)) have investigated the performance of URM piers representative of Australian construction sub-ject to seismic loads. Research by the University of Auckland (Knox, 2012) has conducted in-plane testing of perforated URM walls representative of NZ construction, but to the authors’ knowledge, no experimental testing has been undertaken on perforated URM walls which reflect typical building prac-tices in Australia including:
Single leaf kiln-fired clay brick masonry construction
Paper Number 68
2
Cement mortar Rectangular window and door openings with steel angle lintels Flexible floor diaphragms without confining reinforced concrete elements
The aim of the experimental testing programme presented in this paper is to understand the in-plane force-displacement behaviour and failure modes of perforated URM walls representative of Australian construction and to develop models to predict the in-plane behaviour of these walls. The work presented in this paper is part of a joint project between the University of Newcastle and the Universities of Ade-laide, Auckland, and Pavia aiming to improve the seismic assessment techniques for URM buildings with flexible diaphragms.
2 WALL GEOMETRICAL AND MATERIAL PROPERTIES
The geometrical properties of the walls included in this study have been determined based on observed examples typical of Australian URM construction. The wall geometrical properties and vertical pre-compression levels for the experimental testing programme were selected so that both pier and spandrel failure modes would occur in the walls.
The wall geometries selected for the Newcastle experimental testing programme are similar in elevation to the perforated URM walls previously tested in Auckland (Knox, 2012) but have several significant differences due to the varying construction practices and construction dates.
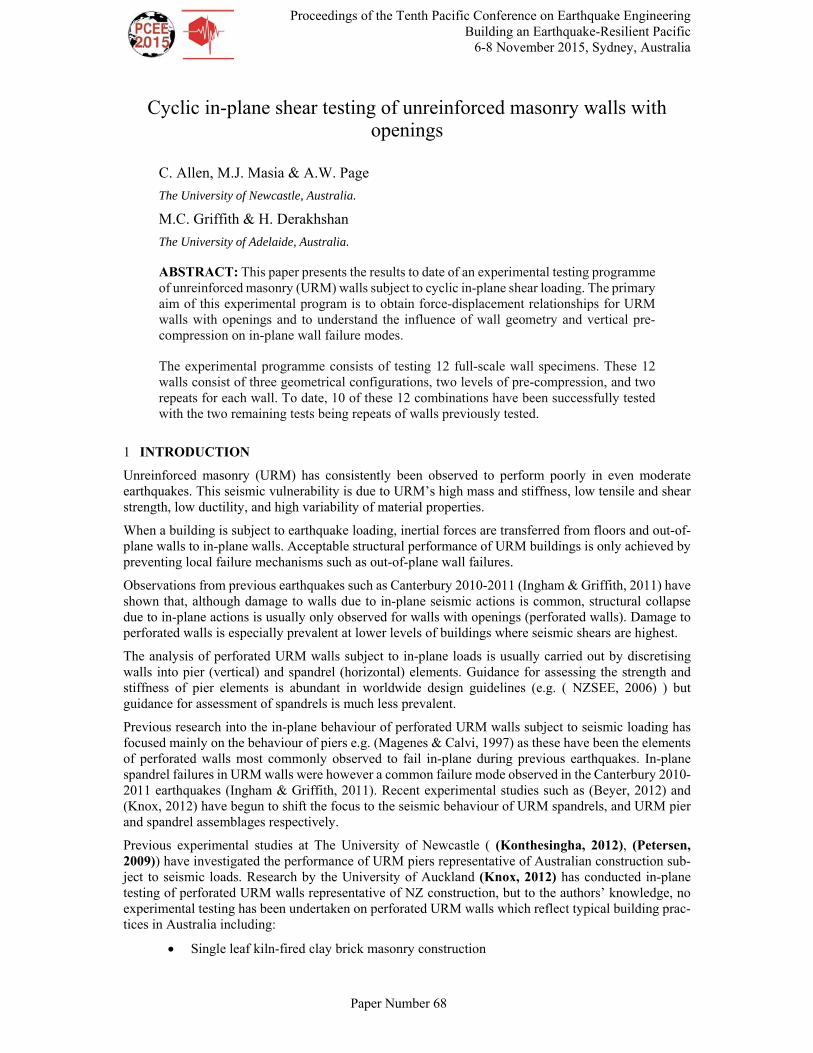
The walls presented in this paper consist of a single skin of clay masonry 110mm thick. Steel equal angle sections are provided as lintels for each of the walls to be tested.
A summary of the tested wall geometries is presented in Figure 1.
(a) Wall type 1 – Shallow spandrel
(b) Wall type 2 – Deep spandrel
(c) Wall type 3 – Smaller wall with medium spandrel above and below
Figure 1 – Wall geometries for experimental testing programme. Note that all walls are 110mm thick.

3
The target masonry material properties selected for the URM experimental programme outlined in this paper are based on typical properties observed in Australian URM construction in the past 80 years. The walls were constructed using extruded clay bricks (230mm long × 110mm wide × 76mm high) with 10mm thick mortar joints.
Mortar with a low tensile and shear bond strength was selected for the experimental testing program, as it is representative of existing URM construction, and also allows all potential in-plane failure modes of unreinforced masonry to develop (rocking, sliding, toe-crushing, and diagonal tension cracking). The weak mortar was achieved by creating low flexural bond strength by overdosing the mortar with an air entrainment agent. A summary of key masonry properties is presented in Table 1.
3 EXPERIMENTAL TEST SETUP
An elevation of the experimental testing setup and instrumentation is presented in Figure 2 a). The vertical precompression loads of either 0.2MPa or 1.0MPa per pier were applied at the centreline of each pier via jack 1 which reacts against steel beams spanning between laboratory strong walls. The jack imparts a vertical load to a spreader beam (250UC73), which in turn distributes half of this vertical load to each pier. Due to the shallow depth of the loading beam (200UC46) an extra section of beam (200UC46) was bolted to the top of the loading beam over the piers. This extra section of beam allows the vertical load applied by the spreader beam and roller above to be essentially uniformly distributed along the plan length of the pier, thereby reducing the chance of localised failure due to vertical loads.
a) Elevation of testing setup. Note that displacements to the left are taken as
positive.
b) Photograph of wall in situ showing speckle pattern used for digital image
correlation (DIC)
Figure 2 – Experimental testing setup
A key feature of the adopted loading beam arrangement is the connection between the loading beam and URM piers which is achieved by a 100mm × 100mm square hollow section which is bolted to the loading beam and epoxied to the piers, allowing a gap over the spandrel which allows the spandrel to deform vertically as the wall is subject to lateral displacements. Dimensions of the loading beam steelwork were determined from linear finite element analyses which were used to simulate realistic wall boundary conditions found in multi-storey walls (Allen, Masia, & Page, 2014)
Cyclic lateral displacements were applied at the centreline of the 200UC46 loading beam. The cyclic lateral displacements consisted of a push cycle (negative) and a pull cycle (positive) which were increased in magnitude until the post-peak lateral load of the wall dropped by 20%, or excessive damage or instability of the wall specimen was observed. The adopted lateral displacement regime is presented in Figure 3.

4
Cyclic loading increments and load rate
0 mm ± 6 mm (0.10mm/s)
± 0.5 mm (0.01mm/s) ± 7 mm (0.11mm/s)
± 1.0 mm (0.02mm/s) ± 8 mm (0.13mm/s)
± 1.5 mm (0.02mm/s) ± 10 mm (0.16mm/s)
± 2 mm (0.03mm/s) ± 12 mm (0.19mm/s)
± 3 mm (0.05mm/s) ± 16 mm (0.26mm/s)
± 4 mm (0.06mm/s) ± 22 mm (0.35mm/s)
± 5 mm (0.08mm/s) ± 28 mm (0.45mm/s)
Figure 3 – Adopted quasi-static cyclic loading regime for wall tests
The wall specimen labelling convention adopted for the experimental testing programme is as follows:
<Wall geometry type>_<precompression level>_<test repeat>. For example, W01_02a refers to the first repeat of the test for wall geometry type 1 (see Figure 1) with 0.2MPa precompression per pier. A listing of the 10 wall tests performed to date can be found in Table 2.
4 EXPERIEMNTAL TEST RESULTS
4.1 Key material properties
Table 1 - Summary of key masonry material parameters for walls tested
Parameter Average value Test method
Masonry compressive strength
f'm 9.6 MPa Prism compression test
Masonry elastic modulus Em 9573 MPa Prism compression test
Mortar flexural bond strength
fbt 0.16 MPa Bond-wrench test
Tensile strength of brick fut = fct.f / 1.5 1.85 MPa Lateral modulus of rupture test
Cohesion of mortar joint c To be confirmed Triplet test
Friction coefficient of mortar joint
µf = tan[φ] To be confirmed Triplet test
4.2 Observations from in-plane wall tests
The failure modes observed during the tests on wall geometry type 1 specimens involved rocking of piers with varying degrees of spandrel cracking depending on the applied axial load.
For the case of 0.2MPa axial load (W01_02a, W01_02b), cracking initiated at the top corners of the opening and propagated upwards and outwards towards the edge of the piers. As the displacement cycles increased in magnitude these cracks eventually reached the edge of the piers.
For wall geometry type 2, full height rocking of piers was observed combined with spandrel flexural or shear failure when the axial loads were high (W02_10a, W02_10b). When axial loads were low
5
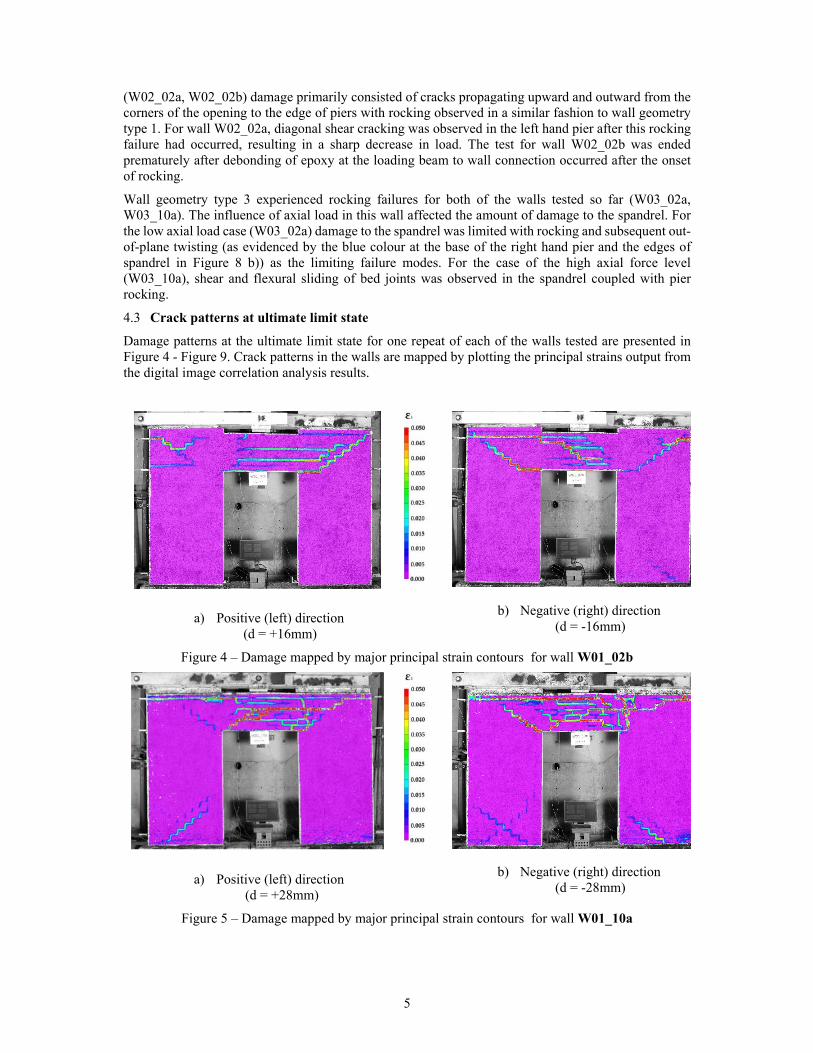
(W02_02a, W02_02b) damage primarily consisted of cracks propagating upward and outward from the corners of the opening to the edge of piers with rocking observed in a similar fashion to wall geometry type 1. For wall W02_02a, diagonal shear cracking was observed in the left hand pier after this rocking failure had occurred, resulting in a sharp decrease in load. The test for wall W02_02b was ended prematurely after debonding of epoxy at the loading beam to wall connection occurred after the onset of rocking.
Wall geometry type 3 experienced rocking failures for both of the walls tested so far (W03_02a, W03_10a). The influence of axial load in this wall affected the amount of damage to the spandrel. For the low axial load case (W03_02a) damage to the spandrel was limited with rocking and subsequent out-of-plane twisting (as evidenced by the blue colour at the base of the right hand pier and the edges of spandrel in Figure 8 b)) as the limiting failure modes. For the case of the high axial force level (W03_10a), shear and flexural sliding of bed joints was observed in the spandrel coupled with pier rocking.
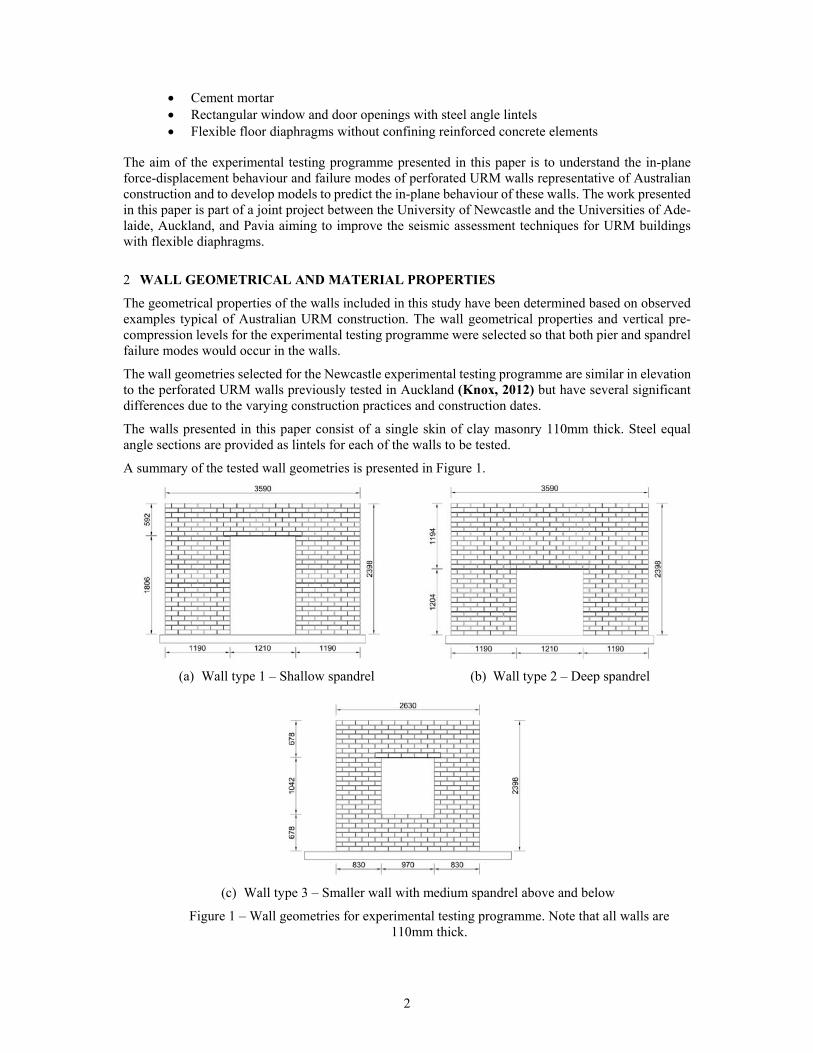
4.3 Crack patterns at ultimate limit state
Damage patterns at the ultimate limit state for one repeat of each of the walls tested are presented in Figure 4 - Figure 9. Crack patterns in the walls are mapped by plotting the principal strains output from the digital image correlation analysis results.
a) Positive (left) direction (d = +16mm)
b) Negative (right) direction (d = -16mm)
Figure 4 – Damage mapped by major principal strain contours for wall W01_02b
a) Positive (left) direction (d = +28mm)
b) Negative (right) direction (d = -28mm)
Figure 5 – Damage mapped by major principal strain contours for wall W01_10a
6
a) Positive (left) direction (d = +10mm)
b) Negative (right) direction (d = -10mm)
Figure 6 – Damage mapped by major principal strain contours for wall W02_02a
a) Positive (left) direction (d = +16mm)
b) Negative (right) direction (d = -16mm)
Figure 7 – Damage mapped by major principal strain contours for wall W02_10b
a) Positive (left) direction (d = +22mm)
b) Negative (right) direction (d = -22mm)
Figure 8 – Damage mapped by major principal strain contours for wall W03_02a
7
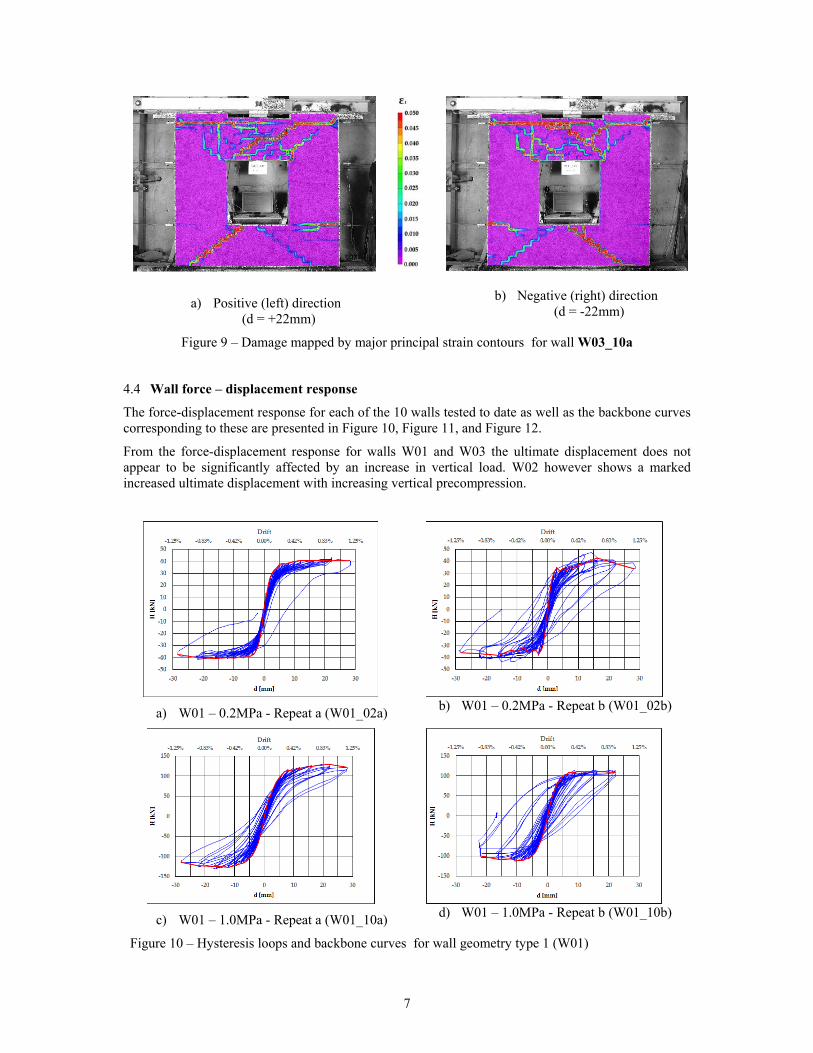
a) Positive (left) direction (d = +22mm)
b) Negative (right) direction (d = -22mm)
Figure 9 – Damage mapped by major principal strain contours for wall W03_10a
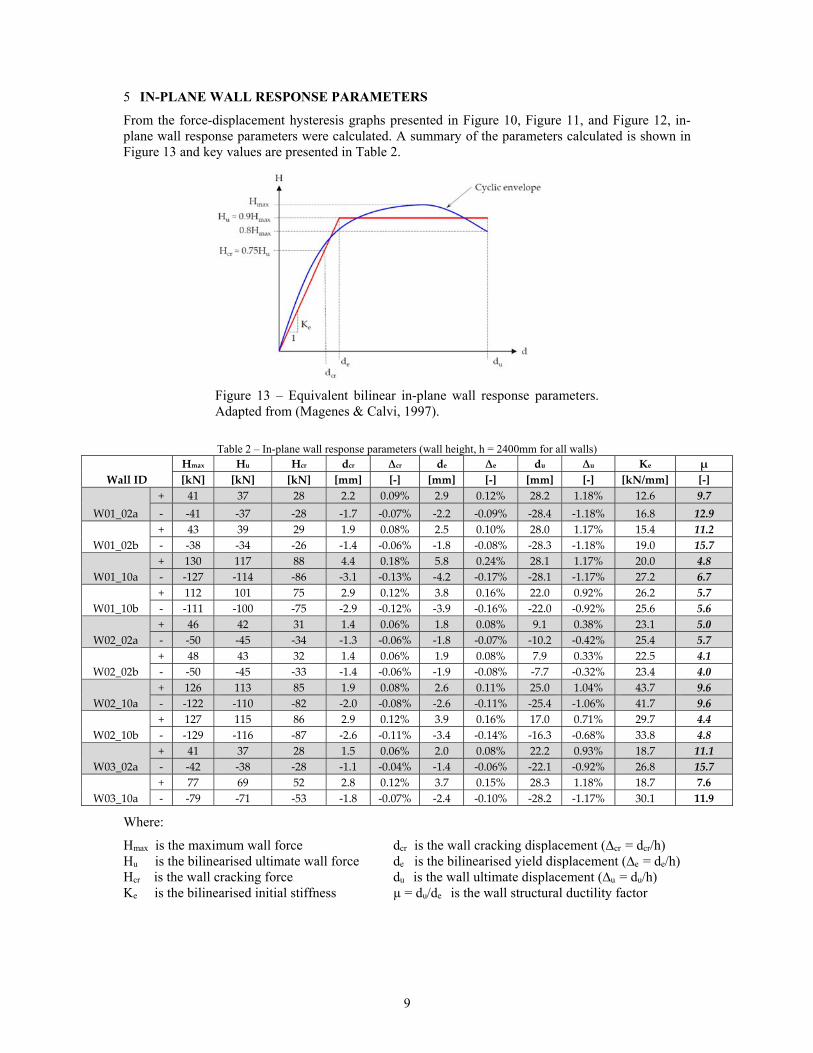
4.4 Wall force – displacement response
The force-displacement response for each of the 10 walls tested to date as well as the backbone curves corresponding to these are presented in Figure 10, Figure 11, and Figure 12.
From the force-displacement response for walls W01 and W03 the ultimate displacement does not appear to be significantly affected by an increase in vertical load. W02 however shows a marked increased ultimate displacement with increasing vertical precompression.
a) W01 – 0.2MPa - Repeat a (W01_02a) b) W01 – 0.2MPa - Repeat b (W01_02b)
c) W01 – 1.0MPa - Repeat a (W01_10a) d) W01 – 1.0MPa - Repeat b (W01_10b)
Figure 10 – Hysteresis loops and backbone curves for wall geometry type 1 (W01)

8
a) W02 – 0.2MPa - Repeat a (W02_02a) b) W02 – 0.2MPa - Repeat b (W02_02b)
c) W02 – 1.0MPa - Repeat a (W02_10a) d) W02 – 1.0MPa - Repeat b (W02_10b)
Figure 11 – Hysteresis loops and backbone curves for wall geometry type 2 (W02)
a) W03 – 0.2MPa - Repeat a (W03_02a) b) W03 – 1.0MPa - Repeat a (W03_10a)
Figure 12 – Hysteresis loops and backbone curves for wall geometry type 3 (W03)
9
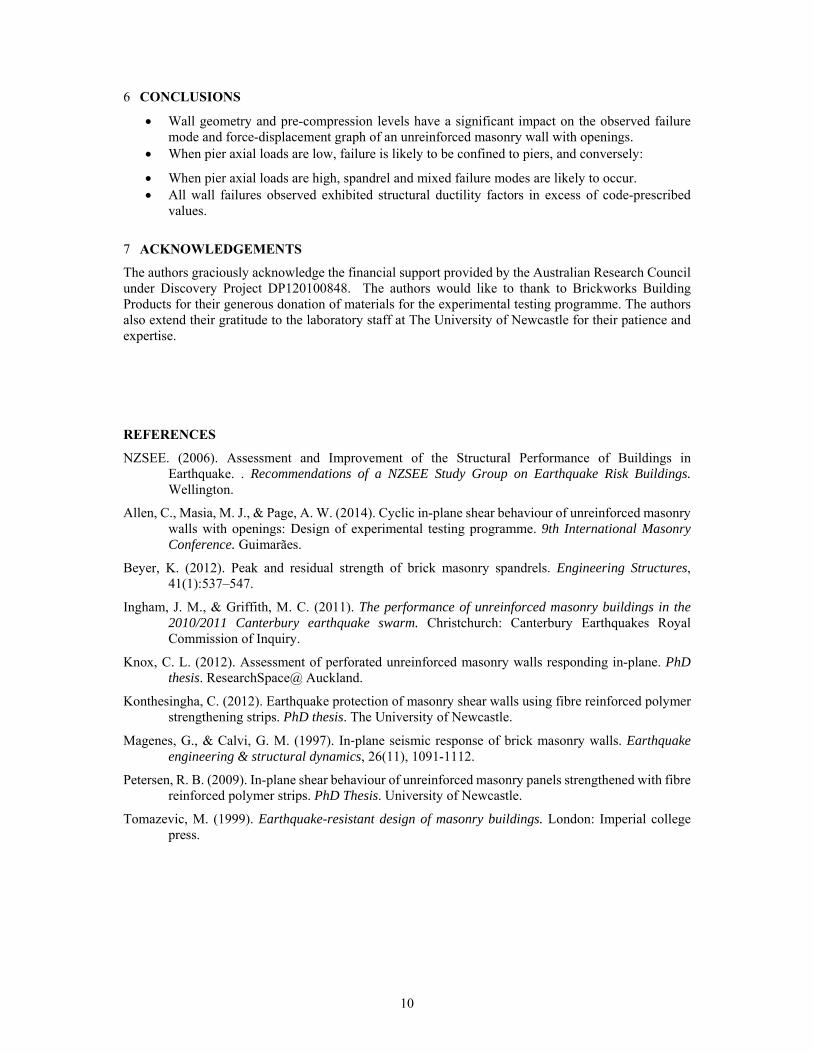
5 IN-PLANE WALL RESPONSE PARAMETERS
From the force-displacement hysteresis graphs presented in Figure 10, Figure 11, and Figure 12, in-plane wall response parameters were calculated. A summary of the parameters calculated is shown in Figure 13 and key values are presented in Table 2.
Figure 13 – Equivalent bilinear in-plane wall response parameters. Adapted from (Magenes & Calvi, 1997).
Table 2 – In-plane wall response parameters (wall height, h = 2400mm for all walls)
Wall ID
Hmax Hu Hcr dcr ∆cr de ∆e du ∆u Ke μ
[kN] [kN] [kN] [mm] [‐] [mm] [‐] [mm] [‐] [kN/mm] [‐]
W01_02a
+ 41 37 28 2.2 0.09% 2.9 0.12% 28.2 1.18% 12.6 9.7
‐ ‐41 ‐37 ‐28 ‐1.7 ‐0.07% ‐2.2 ‐0.09% ‐28.4 ‐1.18% 16.8 12.9
W01_02b
+ 43 39 29 1.9 0.08% 2.5 0.10% 28.0 1.17% 15.4 11.2
‐ ‐38 ‐34 ‐26 ‐1.4 ‐0.06% ‐1.8 ‐0.08% ‐28.3 ‐1.18% 19.0 15.7
W01_10a
+ 130 117 88 4.4 0.18% 5.8 0.24% 28.1 1.17% 20.0 4.8
‐ ‐127 ‐114 ‐86 ‐3.1 ‐0.13% ‐4.2 ‐0.17% ‐28.1 ‐1.17% 27.2 6.7
W01_10b
+ 112 101 75 2.9 0.12% 3.8 0.16% 22.0 0.92% 26.2 5.7
‐ ‐111 ‐100 ‐75 ‐2.9 ‐0.12% ‐3.9 ‐0.16% ‐22.0 ‐0.92% 25.6 5.6
W02_02a
+ 46 42 31 1.4 0.06% 1.8 0.08% 9.1 0.38% 23.1 5.0
‐ ‐50 ‐45 ‐34 ‐1.3 ‐0.06% ‐1.8 ‐0.07% ‐10.2 ‐0.42% 25.4 5.7
W02_02b
+ 48 43 32 1.4 0.06% 1.9 0.08% 7.9 0.33% 22.5 4.1
‐ ‐50 ‐45 ‐33 ‐1.4 ‐0.06% ‐1.9 ‐0.08% ‐7.7 ‐0.32% 23.4 4.0
W02_10a
+ 126 113 85 1.9 0.08% 2.6 0.11% 25.0 1.04% 43.7 9.6
‐ ‐122 ‐110 ‐82 ‐2.0 ‐0.08% ‐2.6 ‐0.11% ‐25.4 ‐1.06% 41.7 9.6
W02_10b
+ 127 115 86 2.9 0.12% 3.9 0.16% 17.0 0.71% 29.7 4.4
‐ ‐129 ‐116 ‐87 ‐2.6 ‐0.11% ‐3.4 ‐0.14% ‐16.3 ‐0.68% 33.8 4.8
W03_02a
+ 41 37 28 1.5 0.06% 2.0 0.08% 22.2 0.93% 18.7 11.1
‐ ‐42 ‐38 ‐28 ‐1.1 ‐0.04% ‐1.4 ‐0.06% ‐22.1 ‐0.92% 26.8 15.7
W03_10a
+ 77 69 52 2.8 0.12% 3.7 0.15% 28.3 1.18% 18.7 7.6
‐ ‐79 ‐71 ‐53 ‐1.8 ‐0.07% ‐2.4 ‐0.10% ‐28.2 ‐1.17% 30.1 11.9
Where:
Hmax is the maximum wall force dcr is the wall cracking displacement (∆cr = dcr/h) Hu is the bilinearised ultimate wall force de is the bilinearised yield displacement (∆e = de/h) Hcr is the wall cracking force du is the wall ultimate displacement (∆u = du/h) Ke is the bilinearised initial stiffness µ = du/de is the wall structural ductility factor
10
6 CONCLUSIONS
Wall geometry and pre-compression levels have a significant impact on the observed failure mode and force-displacement graph of an unreinforced masonry wall with openings.
When pier axial loads are low, failure is likely to be confined to piers, and conversely:
When pier axial loads are high, spandrel and mixed failure modes are likely to occur. All wall failures observed exhibited structural ductility factors in excess of code-prescribed
values.
7 ACKNOWLEDGEMENTS
The authors graciously acknowledge the financial support provided by the Australian Research Council under Discovery Project DP120100848. The authors would like to thank to Brickworks Building Products for their generous donation of materials for the experimental testing programme. The authors also extend their gratitude to the laboratory staff at The University of Newcastle for their patience and expertise.
REFERENCES
NZSEE. (2006). Assessment and Improvement of the Structural Performance of Buildings in Earthquake. . Recommendations of a NZSEE Study Group on Earthquake Risk Buildings. Wellington.
Allen, C., Masia, M. J., & Page, A. W. (2014). Cyclic in-plane shear behaviour of unreinforced masonry walls with openings: Design of experimental testing programme. 9th International Masonry Conference. Guimarães.
Beyer, K. (2012). Peak and residual strength of brick masonry spandrels. Engineering Structures, 41(1):537–547.
Ingham, J. M., & Griffith, M. C. (2011). The performance of unreinforced masonry buildings in the 2010/2011 Canterbury earthquake swarm. Christchurch: Canterbury Earthquakes Royal Commission of Inquiry.
Knox, C. L. (2012). Assessment of perforated unreinforced masonry walls responding in-plane. PhD thesis. ResearchSpace@ Auckland.
Konthesingha, C. (2012). Earthquake protection of masonry shear walls using fibre reinforced polymer strengthening strips. PhD thesis. The University of Newcastle.
Magenes, G., & Calvi, G. M. (1997). In‐plane seismic response of brick masonry walls. Earthquake engineering & structural dynamics, 26(11), 1091-1112.
Petersen, R. B. (2009). In-plane shear behaviour of unreinforced masonry panels strengthened with fibre reinforced polymer strips. PhD Thesis. University of Newcastle.
Tomazevic, M. (1999). Earthquake-resistant design of masonry buildings. London: Imperial college press.