cytotoxic t lymphocytes block tumor growth both by lytic...
TRANSCRIPT
1
Cytotoxic T lymphocytes block tumor growth both by lytic activity and IFNγ-dependent cell cycle arrest Hirokazu Matsushita1, Akihiro Hosoi1,4, Satoshi Ueha2, Jun Abe2, Nao Fujieda1,4,
Michio Tomura3, Ryuji Maekawa4, Kouji Matsushima2, Osamu Ohara5, Kazuhiro
Kakimi1
1Department of Immunotherapeutics, The University of Tokyo Hospital, Tokyo, Japan 2Department of Molecular Preventive Medicine, Graduate School of Medicine, The
University of Tokyo, Tokyo, Japan 3Center for Innovation in Immunoregulative Technology and Therapeutics, Kyoto
University Graduate School of Medicine, Kyoto, Japan. 4Medinet Co Ltd., Yokohama, Japan 5Department of Human Genome Research, Kazusa DNA Research Institute, Chiba,
Japan
Running title: IFNγ-dependent cell cycle regulation by CTL therapy
Keywords: CTL, IFNγ, tumor inhibition, fucci system, cell cycle arrest
Financial support: This study was supported in part by a Grant-in-Aid for Scientific
Research of the Ministry of Education, Culture, Sports, Science and
Technology of Japan (Kazuhiro Kakimi).
Correspondence to Kazuhiro Kakimi, M.D., Ph.D.
Department of Immunotherapeutics,
The University of Tokyo Hospital,
7-3-1 Hongo, Bunkyo-Ku, Tokyo 113-8655, Japan.
Phone: +81-3-5805-3161;
Fax: +81-3-5805-3164;
E-mail: [email protected].
There is no conflict of interest to disclose.
• 4,678 words
• Seven figures with one supplementary table and four supplementary figures
on June 6, 2019. © 2014 American Association for Cancer Research. cancerimmunolres.aacrjournals.org Downloaded from
Author manuscripts have been peer reviewed and accepted for publication but have not yet been edited. Author Manuscript Published OnlineFirst on August 15, 2014; DOI: 10.1158/2326-6066.CIR-14-0098
2
Abstract
To understand global effector mechanisms of CTL therapy, we performed microarray
gene expression analysis in a murine model using pmel-1 TCR transgenic T cells as
effectors and B16 melanoma cells as targets. In addition to up-regulation of genes
related to antigen presentation and the MHC class I pathway, and cytotoxic effector
molecules, cell cycle-promoting genes were down-regulated in the tumor on days 3 and
5 after CTL transfer. To investigate the impact of CTL therapy on the cell cycle of
tumor cells in situ, we generated B16 cells expressing fluorescent ubiquitination-based
cell-cycle indicator (B16-fucci), and performed CTL therapy in mice bearing B16-fucci
tumors. Three days after CTL transfer, we observed diffuse infiltration of CTLs into the
tumor with a large number of tumor cells arrested at G1 phase of the cell cycle, and the
presence of spotty apoptotic or necrotic areas. Thus, tumor growth suppression was
largely dependent on G1 cell-cycle arrest rather than killing by CTLs. Neutralizing
antibody to IFNγ prevented both tumor growth inhibition and G1 arrest. The mechanism
of G1 arrest involved the down-regulation of S-phase kinase-associated protein 2 (Skp2)
and the accumulation of its target cyclin-dependent kinase inhibitor p27 in the
B16-fucci tumor cells. Because tumor-infiltrating CTLs are far fewer in number than
the tumor cells, we propose that CTLs predominantly regulate tumor growth via
IFNγ-mediated profound cytostatic effects rather than cytotoxicity. This dominance of
G1 arrest over other mechanisms may be widespread but not universal because IFNγ
sensitivity varied among tumors.
on June 6, 2019. © 2014 American Association for Cancer Research. cancerimmunolres.aacrjournals.org Downloaded from
Author manuscripts have been peer reviewed and accepted for publication but have not yet been edited. Author Manuscript Published OnlineFirst on August 15, 2014; DOI: 10.1158/2326-6066.CIR-14-0098
3
Introduction
Adoptive T-cell immunotherapy (ACT) using autologous tumor-infiltrating
lymphocytes (TIL) can be highly effective for treating melanoma (1). The recent
development of genetically engineered T cells stably expressing exogenous T-cell
receptors (TCR) or chimeric antigen receptors (CAR) specific for tumor-associated
antigens offers the possibility of testing the efficacy of ACT against a wide range of
cancer types in addition to melanoma (2, 3). Many clinical trials have now been
conducted using genetically engineered T cells specific for tumor antigens as well as
TILs, and some objective responses have been achieved (4, 5). It is clear from mouse
models that adoptively transferred antigen-specific T cells are capable of eradicating
established cancer (6-8) and the ability of CTLs to directly kill tumor and/or stromal
cells is thought to be important for tumor elimination (9-11). Nonetheless, cytokines
such as IFNγ and TNFα produced by T cells are also likely to contribute to the
prevention of tumor growth by ACT via mechanisms other than cell lysis (12-14).
IFNγ is a critical cytokine for antitumor immunity under natural and therapeutic
conditions (15, 16). It enhances tumor immunogenicity by upregulating components of
the MHC antigen processing and presentation pathway. It also induces the expression of
chemokines including the angiostatic chemokines CXCL9 (MIG), CXCL10 (IP-10), and
CXCL11 (I-TAC) that block neovascularization in the tumor and recruit effector
immune cells (17-19). Furthermore, IFNγ has been reported to exert antiproliferative
effects on the developing tumor (20, 21), and it triggers apoptosis of tumor cells by
inducing pro-apoptotic molecules (22, 23).
To understand the global antitumor effect mediated by ACT, we used the B16
melanoma-pmel-1 TCR-transgenic T-cell model to perform a gene expression analysis
on June 6, 2019. © 2014 American Association for Cancer Research. cancerimmunolres.aacrjournals.org Downloaded from
Author manuscripts have been peer reviewed and accepted for publication but have not yet been edited. Author Manuscript Published OnlineFirst on August 15, 2014; DOI: 10.1158/2326-6066.CIR-14-0098
4
of ACT-treated tumors. Based on these results, we focused on genes controlling the cell
cycle and arresting growth of B16 tumor cells in this model. We examined the effects
on tumor cells of the IFNγ produced by the CTLs in situ using cell cycle status
indicators, and investigated the mechanism of cell cycle arrest. Furthermore, we
demonstrate the importance of cell cycle arrest induced by CTL-derived IFNγ in the
regulation of tumor growth.
on June 6, 2019. © 2014 American Association for Cancer Research. cancerimmunolres.aacrjournals.org Downloaded from
Author manuscripts have been peer reviewed and accepted for publication but have not yet been edited. Author Manuscript Published OnlineFirst on August 15, 2014; DOI: 10.1158/2326-6066.CIR-14-0098

5
Materials and Methods
Mice, tumor cells and peptides
6-week-old male C57BL/6 mice were purchased from Japan SLC (Shizuoka, Japan).
Mice transgenic for the Pmel-1-TCR which recognizes the H-2Db-restricted epitope
EGSRNQDWL from gp100 (gp100 25-33) were obtained from The Jackson Laboratory
(Bar Harbor, ME). All mice were housed in a pathogen-free environment and all animal
procedures were conducted in accordance with institutional guidelines. All animal
experiments were approved by the University of Tokyo Ethics Committee for Animal
Experiments (10-P-127). The H-2Db-restricted peptide human gp100 (hgp100 25–33,
KVPRNQDWL) was purchased from GenScript Japan (Tokyo, Japan) at a purity of
>90%, with free amino and carboxyl terminals. B16F10, FBL3, and 3LL cell lines were
maintained in culture medium consisting of DMEM with 10% FCS, 100 U/ml penicillin,
and 100 μg/ml streptomycin. EL4, P815, and CT26 were cultured in RPMI 1640
medium supplemented with 10% FCS, 100 U/ml penicillin, and 100 μg/ml streptomycin.
All cell lines were tested for mycoplasma by MycoAlert Mycoplasma Detection kit
(Lonza, Basel, Switzerland). Cellular morphology and growth curve in vitro were
checked in all cell lines. B16F10 and B16-fucci cells were authenticated by
transplantation for assessing growth ability in vivo.
DC preparation and CTL stimulation
DCs were obtained by 8-day culture of C57BL/6-derived bone marrow cells with
granulocyte-macrophage colony-stimulating factor (GM-CSF) as described previously
(24). Briefly, bone marrow cells obtained from tibias and femurs of C57BL/6 mice were
cultured in RPMI 1640 medium supplemented with 10% FCS, 12.5 mM HEPES, 5×10⁻⁵
on June 6, 2019. © 2014 American Association for Cancer Research. cancerimmunolres.aacrjournals.org Downloaded from
Author manuscripts have been peer reviewed and accepted for publication but have not yet been edited. Author Manuscript Published OnlineFirst on August 15, 2014; DOI: 10.1158/2326-6066.CIR-14-0098
6
M 2-mercaptoethanol, 1×10⁻⁵ M sodium pyruvate, 1% nonessential amino acids, 100
U/ml penicillin, 100 μg/ml streptomycin and 20 ng/ml GM-CSF (PeproTech, Rocky
Hill, NJ) for 8 days. On days 3 and 6, half the medium was replaced with fresh medium
containing GM-CSF. DCs were further incubated with 1 μg/ml lipopolysaccharide for
16 h and then pulsed with 1 μg/ml hgp100 peptide for 3 h to obtain mature DCs. To
prepare CTLs, 1×10⁷ spleen cells from pmel-1-TCR-transgenic mice were co-cultured
with 2×10⁵ DCs in medium containing 50 U/ml IL2 (Chiron Corporation, Emeryville,
CA). After 3 days in vitro stimulation, approximately 90% of the harvested cells were
CD3+CD8+ CTLs.
ACT and anti-IFNγ mAb treatment
C57BL/6 mice were inoculated subcutaneously with 1x10⁶ B16 tumor cells followed
by adoptive CTL transfer (1×10⁷ or 4×10⁷) 9 days later. Tumor growth was monitored
every 2 to 3 days with calipers in an anonymous fashion. On the day of, and 2 days after,
CTL transfer, mice received intraperitoneal injections of 500 μg anti-IFNγ mAb (clone
XMG1.2, BioXCell, West Lebanon, NH, USA) or rat IgG1 isotype control (BioXCell).
Tumor volume was calculated as described previously (24).
Cell preparation and flow cytometry
Tumors were harvested from mice at scheduled time points, cut into pieces, and
re-suspended in HBSS supplemented with 0.1% collagenase D (Roche Diagnostics,
Indianapolis, IN) and DNase I (Roche Diagnostics) for 60 min at 37°C. The entire mass
of material was pressed through a 70 μm cell strainer (BD Falcon, BD Bioscience)
using a plunger to obtain single-cell suspensions of tumor-infiltrating cells. For flow
on June 6, 2019. © 2014 American Association for Cancer Research. cancerimmunolres.aacrjournals.org Downloaded from
Author manuscripts have been peer reviewed and accepted for publication but have not yet been edited. Author Manuscript Published OnlineFirst on August 15, 2014; DOI: 10.1158/2326-6066.CIR-14-0098

7
cytometry, the cells were first stained with Fixable Viability Dye eFluor450
(eBioscience, San Diego, CA) to label dead cells, and pretreated with Fc Block
(anti-CD16/32 clone 2.4G2; BD Pharmingen). The cells were then stained with
antibodies and analyzed on a GalliosTM flow cytometer (Beckman Coulter, San Diego,
CA). The following mAbs were obtained from BioLegend (San Diego, CA):
PerCP/Cy5.5-conjugated anti-CD45, Alexa Fluor 647-conjugated anti-CD90.1, and
APC-Cy7-conjugated anti-CD8. Data were analyzed with Kaluza software (Beckman
Coulter).
Comprehensive Gene Expression Analysis
Gene expression profiling data of B16 tumor tissues on different days were obtained
by Agilent whole mouse genome microarray. Total RNA was extracted with TRIzol
(Invitrogen) from B16 tumor tissues and fluorescently labeled using a One-Color
Agilent Quick Amp Labeling kit. The microarray slides were hybridized, washed, and
read on an Agilent Microarray scanner following the manufactures instructions, and raw
fluorescence signal intensities were generated by Agilent Feature Extraction Software
v9.5. The signals were normalized to align at 75th percentile, and then turned into log2
ratio against day1 in untreated and CTL-treated groups. We began with 45,018 probes,
and removed probes if their gIsWellAboveBG flag values were 0 at all samples, and
then filtered out log2 ratio values that were unvarying (between -1 and 1) at all time
points. We obtained 10,855 probes and ran hierarchical clustering (standard correlation,
UPGMA) on them. All data were analyzed with the Subio Platform and Basic Plug-in
v1.16 (Subio Inc., Amami, Japan). The microarray data are available from Gene
Expression Omnibus (GEO) database (series accession number GSE57304; sample
on June 6, 2019. © 2014 American Association for Cancer Research. cancerimmunolres.aacrjournals.org Downloaded from
Author manuscripts have been peer reviewed and accepted for publication but have not yet been edited. Author Manuscript Published OnlineFirst on August 15, 2014; DOI: 10.1158/2326-6066.CIR-14-0098
8
accession numbers GSM1379331-GSM1379344).
For quantitative gene panel-based PCR, Cell Cycle RT² Profiler™ PCR arrays
(SABioscience, Frederick, MD: http://www.sabiosciences.com/rt_pcr_product/HTML/
PAMM-020Z.html) were used to simultaneously examine the mRNA levels of 84 genes
in 96-well PCR array plates. Total RNA was prepared using TRIzol according to the
manufacturer's instructions (Invitrogen), and reverse-transcribed using RT2 First Strand
kits (SABioscience). Real-time PCR was performed as instructed by the supplier on an
ABI PRISM 7900HT Sequence Detection System (Life Technologies). Data were
analyzed by a ΔΔ cycle threshold method to determine the fold-changes of the mRNA
levels (http://www.SABiosciences.com/pcrarraydataanalysis.php).
Expression vectors
CSII-EF-MCS/mAG-hGeminin and CSII-EF-MCS/mKO-cdt1 vectors were kindly
provided by Dr. Atsushi Miyawaki (RIKEN, Wako) (25). cDNA encoding mouse
IFNGR1 lacking the intracellular component of the receptor (26) was generated by PCR
using the primer pair 5′- ATCTCACTCGAGATGGGCCCGCAGGCGGCAGCT-3′ and
5′-ATCTCAGAATTCATTCTTCTTAGTATACCAATA-3′ and subcloned into the Xho-1
and Eco-RI sites of the RV-GFP vector (27) (designated RV-IFNGR1ΔIC).
Production of B16-fucci and B16-fucciΔIC tumor cells
mAG-hGeminin and mKO-cdt1 were expressed in B16 tumor cells using lentiviral
vectors (designated B16-fucci). IFNGR1 lacking the sequence encoding the intracellular
component of the receptor was expressed in B16-fucci tumor cells in the same way
(designated B16-fucciΔIC).
on June 6, 2019. © 2014 American Association for Cancer Research. cancerimmunolres.aacrjournals.org Downloaded from
Author manuscripts have been peer reviewed and accepted for publication but have not yet been edited. Author Manuscript Published OnlineFirst on August 15, 2014; DOI: 10.1158/2326-6066.CIR-14-0098

9
Quantitative Real-Time Polymerase Chain Reaction
Total RNA was extracted using TRIzol and converted into cDNA using the
SuperScript III First-Strand Synthesis System according to the manufacturer's
instructions (Invitrogen, Carlsbad, CA). qRT-PCR reactions were carried out using
EXPRESS SYBR GreenER qPCR SuperMix Universal (Invitrogen). Primer sequences
are listed in Supplementary Table S1. PCR reactions were run in a Thermal Cycler Dice
Real-Time System TP800 (Takara, Shiga, Japan) using the following program: 1 cycle
of 95°C for 2 minutes, 40 cycles 95°C for 15 seconds, 60°C for 30 seconds. Results are
expressed as ratios. The quantity of target mRNA was normalized to the level of
GAPDH in each sample. PCR was performed in duplicate for each experiment and PCR
products were monitored by electrophoresis in 1.8% agarose gels and visualized with
ethidium bromide.
Histological analysis
Cryosections were fixed in 4% paraformaldehyde (PFA) at 4°C overnight and then
transferred into 30% sucrose/PBS. After incubation for more than 24 hours, they were
embedded in OCT compound (Sakura Finetek Japan, Tokyo, Japan) in liquid nitrogen.
8-10 μm sections were incubated with primary antibodies, followed by secondary
antibodies and streptavidin. Polyclonal anti-Azami-Green antibody (PM011) was
purchased from MBL. Polyclonal anti-single strand DNA was purchased from IBL.
APC-conjugated anti-Thy1.1 antibody was purchased from BD Biosciences (San Diego,
CA, USA). Alexa-conjugated polyclonal secondary antibodies and streptavidin were
from Life Technologies (Carlsbad, CA, USA). Anti-APC-biotin was from Biolegend
on June 6, 2019. © 2014 American Association for Cancer Research. cancerimmunolres.aacrjournals.org Downloaded from
Author manuscripts have been peer reviewed and accepted for publication but have not yet been edited. Author Manuscript Published OnlineFirst on August 15, 2014; DOI: 10.1158/2326-6066.CIR-14-0098
10
(San Diego, CA, USA). The samples were analyzed using a BZ-9000 fluorescence
microscope with BZ-II image processing software (KEYENCE, Osaka, Japan). The
number of cells in the necrotic/apoptotic area was estimated by calculating surface area
of the region using BZ-H1M software (Keyence).
Cytology
Cultured B16-fucci tumor cells treated with IFNγ were examined using bright field or
fluorescence microscopy (OLYMPUS IX71, OLYMPUS, Tokyo, Japan, magnification
×200).
SA-β-gal activity assay
Senescence-associated β-galactosidase (SA-β-gal) activity in cancer cells was
assessed using the Senescence Detection Kit (BioVision, Mountain View, CA, USA).
SA-β-gal-positive cells were identified using bright field microscopy (OLYMPUS IX71,
OLYMPUS, Tokyo, Japan, magnification ×400).
Protein extraction and Western blotting
B16-fucci tumors were harvested from untreated or ACT mice receiving either rat
IgG (control for treatment) or anti-IFNγ mAb on day 3 after CTL transfer. Protein
extracts were prepared from each tissue using RIPA buffer (Thermo Scientific,
Rockford, IL, USA) with protease inhibitor cocktail, Complete Mini (Roche, Mannheim,
Germany). 50 μg of protein extracts were used for immunoblotting. Protein extracts
(30-50 μg) from B16-fucci, B16-fucciΔIC cells, FBL3-, or EL4-treated with IFNγ (10
U/ml) for the indicated time were used for immunoblotting. The following antibodies
on June 6, 2019. © 2014 American Association for Cancer Research. cancerimmunolres.aacrjournals.org Downloaded from
Author manuscripts have been peer reviewed and accepted for publication but have not yet been edited. Author Manuscript Published OnlineFirst on August 15, 2014; DOI: 10.1158/2326-6066.CIR-14-0098
11
were used: rabbit anti-pSTAT1 (sc-7988-R), rabbit anti-Skp2 (sc-7164), mouse
anti-ATM (sc-23921), rabbit anti-p53ser15 (sc-101762), rabbit anti-p21 (sc-397), all
from Santa Cruz Biotechnology (Santa Cruz, CA, USA). Mouse anti-p27 [kip1]
antibody was purchased from BD Biosciences. All antibodies were used at a final
concentration of 0.2-1.0 μg/ml. After incubation with anti-rabbit IgG or anti-mouse IgG
antibodies conjugated with horseradish peroxidase, proteins were visualized using the
ECL Plus Western Blotting Detection system (GE Healthcare Life Sciences,
Buckinghamshire, UK).
Statistical Analysis
Comparison of results was performed by unpaired, two-tailed Student’s t testing with
GraphPad Prism 5 (GraphPad Software, Inc., San Diego, CA, USA).
on June 6, 2019. © 2014 American Association for Cancer Research. cancerimmunolres.aacrjournals.org Downloaded from
Author manuscripts have been peer reviewed and accepted for publication but have not yet been edited. Author Manuscript Published OnlineFirst on August 15, 2014; DOI: 10.1158/2326-6066.CIR-14-0098
12
Results
Gene expression analysis in CTL transfer therapy
To understand the effector mechanism whereby ACT inhibits tumor growth, we
assessed tumor-cell gene expression in a B16 melanoma model of pmel-1
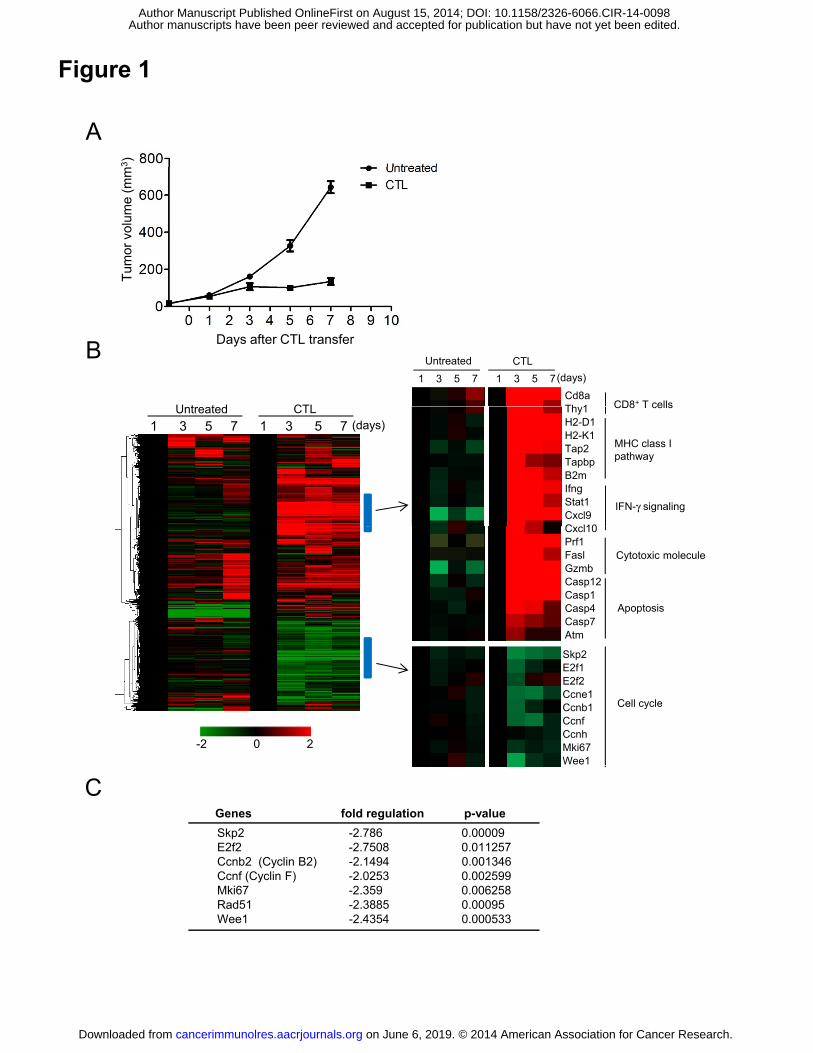
TCR-transgenic CTL transfer. Tumors grew progressively in untreated B16-bearing
mice, which was prevented between days 3 and 7 after the animals had received ten
million CTLs (Fig. 1A and Supplementary Fig. S1A). Tumor tissues were harvested
from untreated mice and ACT mice on days 1, 3, 5 and 7 after CTL transfer, and gene
expression analyzed. Up-regulation of genes related to CD8+ T cells, the MHC class I
pathway, IFNγ signaling, cytotoxic effector molecules, and others was observed in
tumors from treated but not untreated mice (Fig. 1B). These data are consistent with our
previous findings (24, 28) that adoptively-transferred CTLs infiltrated into the tumor
and that mRNA encoding IFNγ, Perforin, Granzyme B, and FasL was expressed on
days 3-7 with kinetics reflecting the infiltration of the CTLs (Supplementary Fig. S1B
and C).
Interestingly, some genes positively regulating the cell cycle, such as Skp2, E2f2,
Ccnf, Mki67 and Wee1 were down-regulated in tumors from ACT mice on day 3 and 5
(Fig. 1B). This was not the case in the untreated controls. We confirmed these data by a
Cell Cycle PCR array (Fig. 1C). Thus, gene expression analysis revealed profiles related
to cell-cycle regulation, as well as cytotoxicity, in tumors from mice with ACT
treatment.
CTL therapy induces G1 cell cycle arrest
Using the fucci (fluorescent ubiquitination-based cell cycle indicator) system (25), we
on June 6, 2019. © 2014 American Association for Cancer Research. cancerimmunolres.aacrjournals.org Downloaded from
Author manuscripts have been peer reviewed and accepted for publication but have not yet been edited. Author Manuscript Published OnlineFirst on August 15, 2014; DOI: 10.1158/2326-6066.CIR-14-0098
13
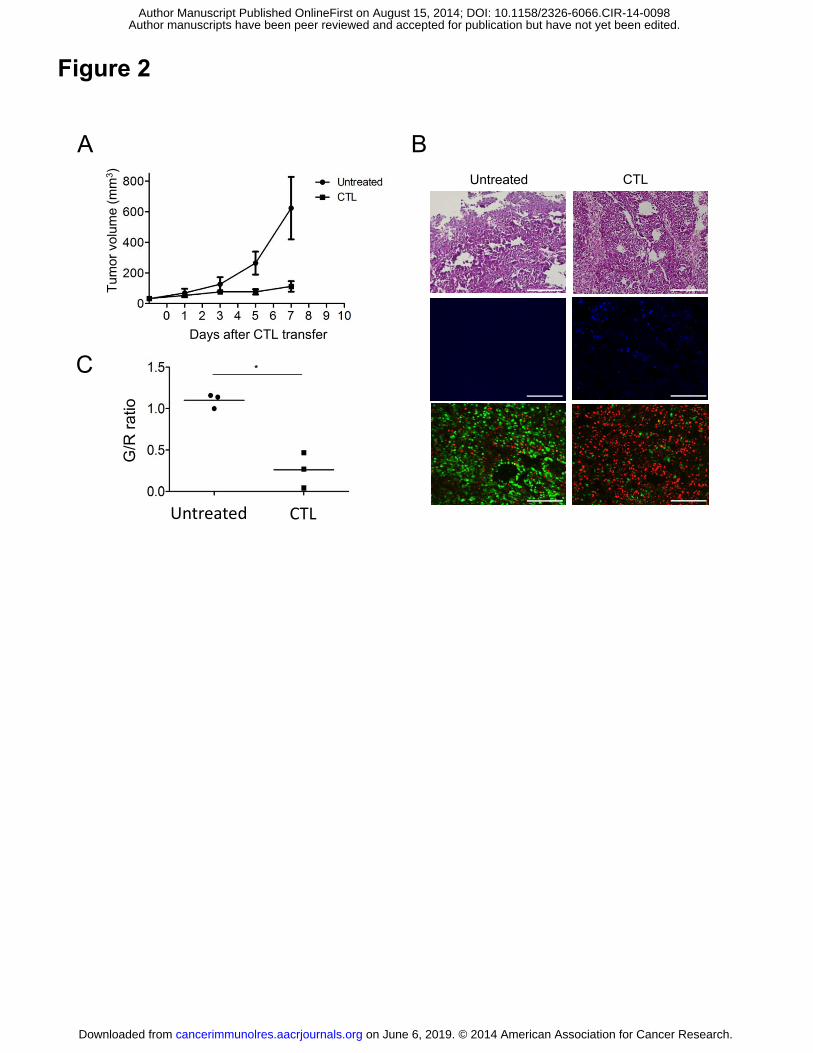
investigated the impact of ACT on the cell cycle of B16 tumor cells. To this end, we
generated B16 tumor cells expressing fucci (designated B16-fucci), which emit red
fluorescence in the G1-phase but otherwise fluoresce green. We then treated B16-fucci
tumor-bearing mice with ACT. Tumor growth was not affected by the transduction of
fucci into B16 tumor cells, but ACT inhibited their growth (Fig. 2A). On day 3 after
CTL transfer, tumors were harvested from untreated or ACT mice for histological
analysis. As shown in Fig. 2B, CTLs had infiltrated into the tumors and were visible as
blue spots. While green cells were dominant in the growing tumor cells, the majority of
tumor cells from ACT mice were red, suggesting that CTL therapy induced tumor
cell-cycle arrest in the G1-phase. Expressing the cell cycle state as a green/red (G/R)
ratio (Fig. 2C) showed that this was lower in ACT mice (0.26±0.12, n=3) than in
untreated controls mice on day 3 (1.1±0.05, n=3) (P=0.0032). This difference remained
up to day 5 after CTL transfer, but on day 7 the G/R ratio increased again together with
the disappearance of CTLs, and green cells became dominant once more after day 10
(Supplementary Fig. S1B).
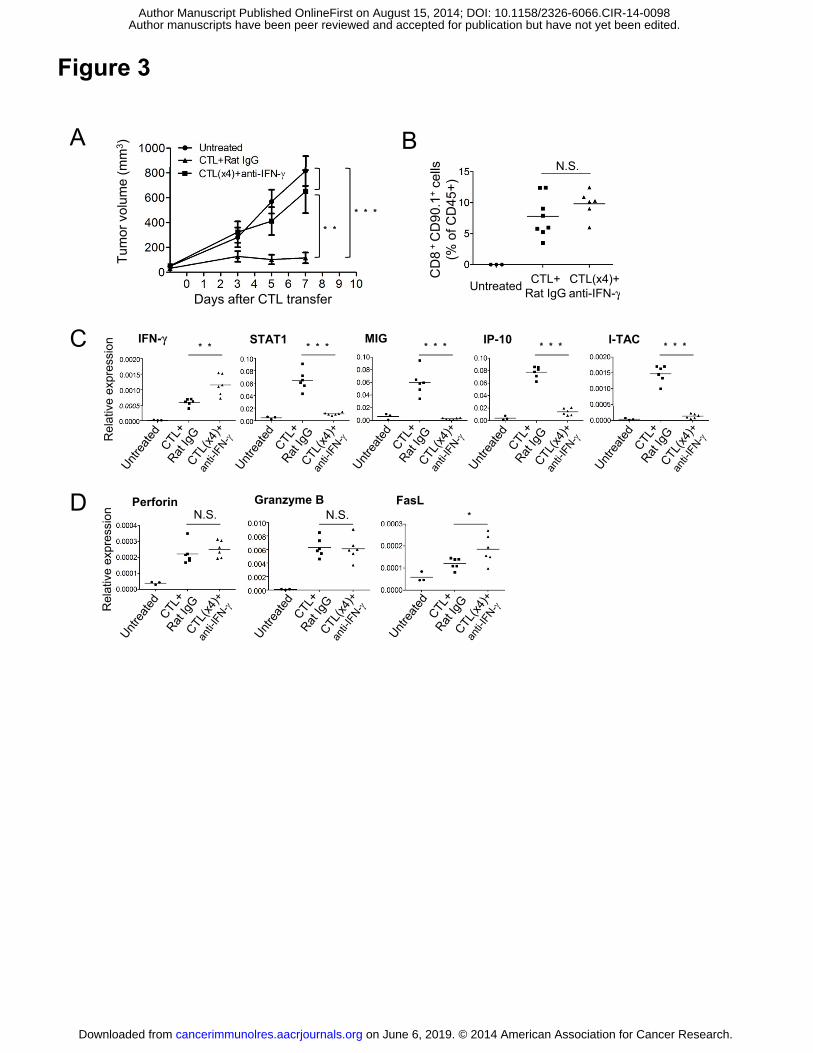
IFNγ is critical for tumor growth inhibition and cell cycle arrest
IFNγ is important for antitumor immunity. We have shown that it is critical for tumor
growth inhibition in this model using IFNγ neutralizing antibody (anti-IFNγ mAb) (28).
Because IFNγ is involved in MHC class I upregulation, antigen processing, trafficking
of T cells into the tumor site by promoting chemokine production, and the number of T
cells infiltrating into the tumor was decreased by neutralizing IFNγ (data not shown). It
was necessary to inject four-fold more T cells to achieve the same level of CTL
infiltration in anti-IFNγ Ab-treated animals (Fig. 3B). Nevertheless, anti-IFNγ treatment
on June 6, 2019. © 2014 American Association for Cancer Research. cancerimmunolres.aacrjournals.org Downloaded from
Author manuscripts have been peer reviewed and accepted for publication but have not yet been edited. Author Manuscript Published OnlineFirst on August 15, 2014; DOI: 10.1158/2326-6066.CIR-14-0098
14
still prevented tumor growth blockade, despite the presence of equivalent levels of CTL
in the tumor (Fig. 3A). Strikingly, this was the case even though the expression of RNA
encoding the effector molecules IFNγ, Perforin, Granzyme B, and FasL in ACT mice
treated with anti-IFNγ mAb was the same or even higher than that in control ACT mice
treated with rat IgG (Fig. 3C and D). A major difference in the anti-IFNγ mAb-treated
mice was that the expression of mRNA encoding STAT1 and IFNγ inducible genes such
as MIG, IP10, or I-TAC was suppressed. This suggests that IFNγ signaling was blocked
by the treatment with anti-IFNγ mAb.
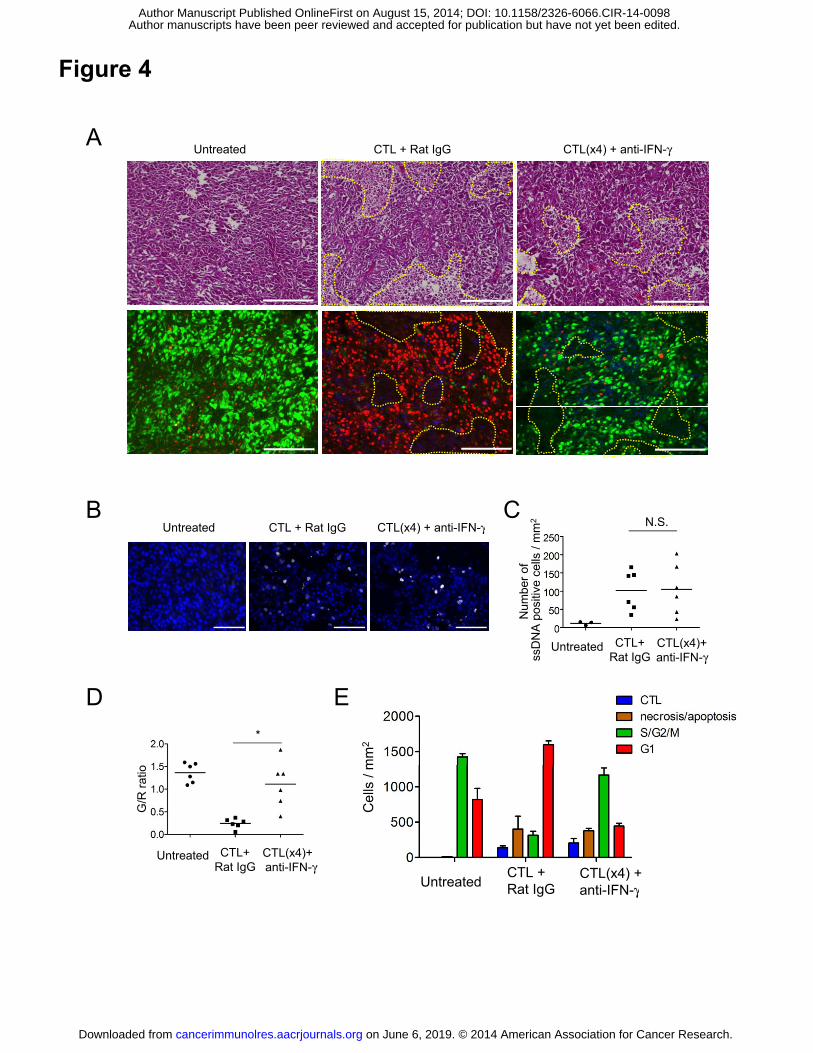
As shown in Fig. 4A, all tumor cells fluoresced either green or red. In growing
tumors, the majority of B16 tumor cells were in the S/G2/M phase (Fig.4A, left). After
CTL transfer, most became red (Fig. 4A, middle), but in the anti-IFNγ mAb-treated
ACT mice, the tumor cells remained green (Fig. 4A, right). Diffused infiltration of
CTLs into the tumor accompanied by massively infiltrated mononuclear cells and
destruction of tumor cells, corresponding to spotty necrotic/apoptotic areas, was seen in
ACT mice whether or not they received anti-IFNγ mAb treatment. Furthermore,
apoptotic cells positive for single-stranded DNA (ssDNA), detected as white spots, were
rare, but present equally in ACT mice with or without anti-IFNγ mAb treatment (Fig.
4B and C). This therefore suggests that the transferred CTLs actually mediated
relatively little tumor cell killing, which was unaffected by anti-IFNγ mAb
administration.
The numbers of CTLs, tumor cells in necrotic/apoptotic areas, and tumor cells in the
G1 or S/G2/M phase were compared systematically in these mice. More green than red
cells were observed in untreated tumors (Fig. 4D). In CTL-treated tumors, as described
above, the G/R ratio was inverted, but the ratio was restored by the abrogation of IFNγ
on June 6, 2019. © 2014 American Association for Cancer Research. cancerimmunolres.aacrjournals.org Downloaded from
Author manuscripts have been peer reviewed and accepted for publication but have not yet been edited. Author Manuscript Published OnlineFirst on August 15, 2014; DOI: 10.1158/2326-6066.CIR-14-0098

15
signaling. The surface area of the part of the tumor with necrotic/apoptotic cells was
similar in the two CTL-treated groups (with or without anti-IFNγ mAb treatment) and
the estimated number of dead cells was always smaller than that of the live cells
(whether green or red) (Fig. 4E). These results indicate that G1 cell-cycle arrest, and not
cytolytic killing, was primarily responsible for the CTL-induced suppression of tumor
growth.
IFNγ directly suppress B16-fucci tumor cell growth through cell cycle arrest
We constructed B16-fucci tumor cells expressing an IFNγ receptor lacking the
intracellular component (B16-fucciΔIC). ACT did not suppress the growth of these cells
even when four-fold more CTLs (4x10⁷) were transferred (Supplementary Fig. S2A).
Although a similar number of CTLs infiltrated into B16-fucciΔIC tumor sites as in mice
with B16-fucci tumors receiving 4-fold less CTLs, no IFNγ production was observed
(Supplementary Fig. S2B and C) and therefore the effect of IFNγ could not be evaluated
in this system. This might be due to limited recognition of B16-fucciΔIC tumor cells by
the CTL, because of their low level of MHC class I expression (Supplementary Fig.
S2D). As expected, B16-fucciΔIC did not up-regulate MHC class I molecules after
exposure to IFNγ.
Because we could not evaluate the effect of IFNγ on tumor cells in vivo in this
manner, we tested its effects directly on B16 tumor cells in vitro. As shown in Fig. 5,
proliferation of B16-fucci cells, but not B16-fucciΔIC cells, was inhibited completely
when they were treated with IFNγ (Fig. 5A). These cells were arrested in G1 (Fig. 5B),
showing that IFNγ directly inhibits the growth of B16-fucci tumor cells through G1 cell
cycle arrest.
on June 6, 2019. © 2014 American Association for Cancer Research. cancerimmunolres.aacrjournals.org Downloaded from
Author manuscripts have been peer reviewed and accepted for publication but have not yet been edited. Author Manuscript Published OnlineFirst on August 15, 2014; DOI: 10.1158/2326-6066.CIR-14-0098
16
Recently, it was reported that a combination of IFNγ and TNFα produced by CD4+ T
cells can drive tumor cells into senescence by inducing G0/G1 cell cycle arrest through
the activation of p16INK4a (14). Therefore, we tested the effect of IFNγ and/or TNFα
on B16 tumor cells. While IFNγ alone inhibited cell proliferation by G1 arrest, TNFα
alone had a limited inhibitory effect on B16 proliferation even at a high concentration
(10 ng/ml) (Supplementary Fig. S3). When B16 tumor cells were cultured in the
presence of both IFNγ and TNFα at a high concentration, a synergistic effect on cell
growth inhibition and cell senescence was observed (Supplementary Fig. S3).
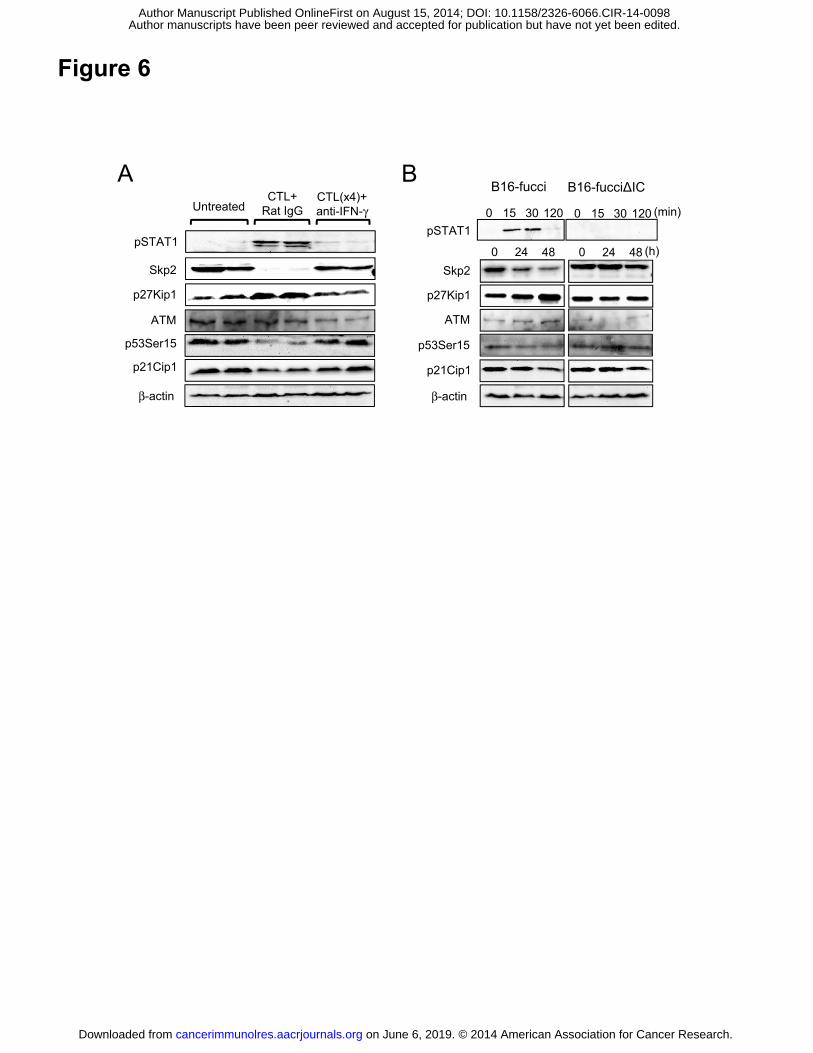
IFNγ production by transferred CTLs induces G1 cell cycle arrest by a mechanism
involving Skp2/p27-related cell cycle regulation
We next investigated the mechanism of G1 cell cycle arrest by IFNγ. B16-fucci tumor
tissues were harvested from untreated mice, ACT mice treated with rat IgG, or ACT
mice treated with anti-IFNγ mAb on day 3 after CTL transfer. Proteins were extracted
from each tissue for Western blotting. As shown in Fig. 6A, downstream of IFNγ
signaling, STAT1 was phosphorylated in tumors from ACT mice treated with rat IgG,
but not in tumors from anti-IFNγ mAb-treated ACT mice. To confirm the gene
expression data that Skp2 was significantly downregulated in tumors from ACT mice
(Fig.1B and C), we examined the protein expression of Skp2. As shown in Fig. 6A,
Skp2 expression was suppressed in tumors from control ACT mice, but not in those
from mice treated with anti-IFNγ mAb. Conversely, the cyclin-dependent kinase
inhibitor (CKI) p27 accumulated in the former but not in the latter. We also investigated
the ataxia telangiectasia mutated (ATM)/p53/p21 pathway involved in G1 cell cycle
arrest following DNA damage. We found that ATM was not up-regulated as a result of
on June 6, 2019. © 2014 American Association for Cancer Research. cancerimmunolres.aacrjournals.org Downloaded from
Author manuscripts have been peer reviewed and accepted for publication but have not yet been edited. Author Manuscript Published OnlineFirst on August 15, 2014; DOI: 10.1158/2326-6066.CIR-14-0098

17
CTL therapy, p53 was not activated, and no subsequent accumulation of p21 was
observed. This shows that the ATM/p53/p21 pathway is not involved in this model (Fig.
6A). We also investigated the expression of these molecules in vitro (Fig. 6B).
B16-fucci and B16-fucciΔIC tumor cells were treated with 10 U/ml IFNγ and harvested
at the indicated times. STAT1 phosphorylation was observed at early time points (15
and 30 min after IFNγ treatment) in B16-fucci, but not in B16-fucciΔIC. Skp2
expression was downregulated gradually, and p27 accumulated by 48 hours after IFNγ
treatment in B16-fucci but not in B16-fucciΔIC cells (Fig. 6B). We confirmed that the
ATM/p53/p21 pathway was also not involved in G1 cell cycle arrest in vitro. These
results suggest that G1 cell cycle arrest by CTL therapy is likely due to Skp2/p27-related
cell cycle regulation by IFNγ.
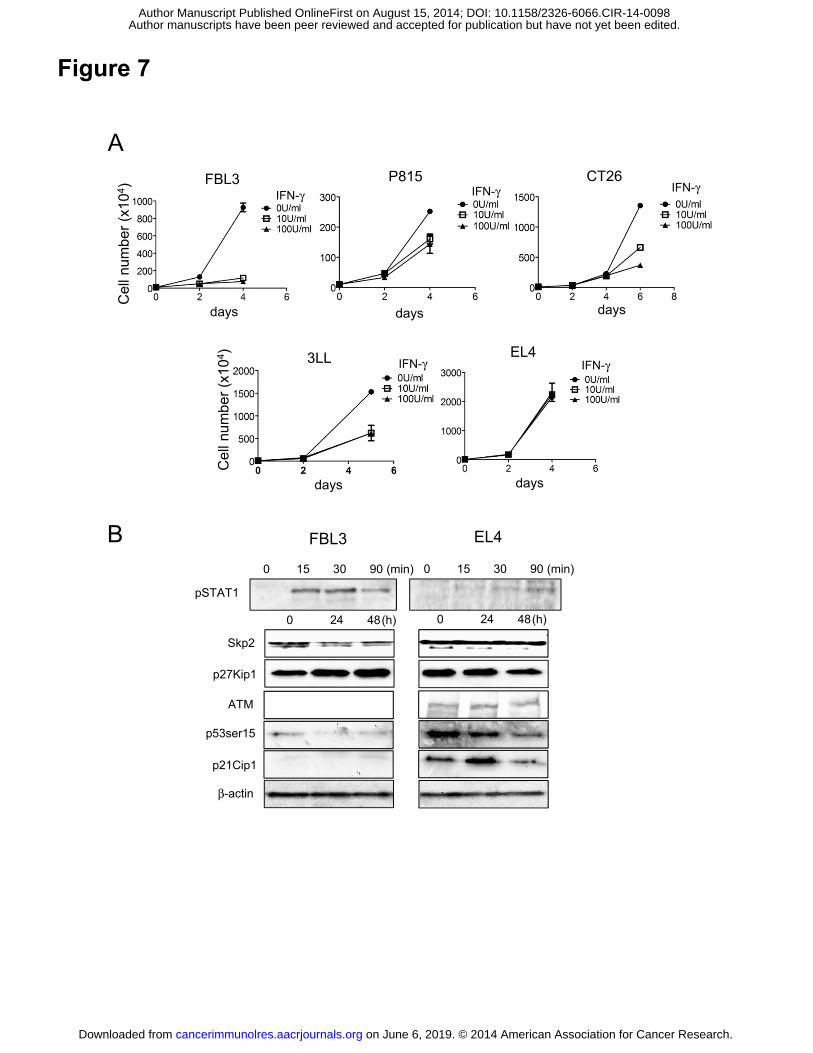
Inhibition of FBL3 cell proliferation by IFNγ
We next investigated whether proliferation of other murine cell lines is inhibited by
IFNγ. FBL3, p815, CT26, 3LL, and EL4 tumor cells were treated with IFNγ (10 U or
100 U/ml) for 4-6 days (Fig. 7A). The proliferation of FBL3 tumor cells was inhibited
by IFNγ treatment in a manner similar to that of B16 tumor cells. The proliferation of
p815, CT26, and 3LL tumor cells was moderately inhibited. No inhibition was observed
in IFNγ-treated EL4 tumor cells. In Western blot analyses using tumor lysates from
FBL3 and EL4 tumors at the indicated time point, Stat1 phosphorylation was observed
in FBL3 lysates but the phosphorylation was very weak in EL4 tumor lysates. Skp2
expression was downregulated 24-48 hours after IFNγ treatment in FBL3 but not in EL4
tumors, and p27 accumulated (Fig. 7B). Again, the ATM/p53/p21 pathway was not
involved. These results suggest that inhibition of FBL3 tumor cell proliferation by IFNγ
on June 6, 2019. © 2014 American Association for Cancer Research. cancerimmunolres.aacrjournals.org Downloaded from
Author manuscripts have been peer reviewed and accepted for publication but have not yet been edited. Author Manuscript Published OnlineFirst on August 15, 2014; DOI: 10.1158/2326-6066.CIR-14-0098
18
might involve Skp2/p27-related cell cycle regulation, as in B16.
on June 6, 2019. © 2014 American Association for Cancer Research. cancerimmunolres.aacrjournals.org Downloaded from
Author manuscripts have been peer reviewed and accepted for publication but have not yet been edited. Author Manuscript Published OnlineFirst on August 15, 2014; DOI: 10.1158/2326-6066.CIR-14-0098
19
Discussion
In this study, we demonstrated that the mechanism of tumor growth inhibition by
adoptive CTL therapy was largely dependent on IFNγ-induced G1 cell cycle arrest rather
than tumor cell lysis. In microarray analysis, up-regulation of genes related to CD8+ T
cells, the MHC class I pathway, IFNγ signaling, cytotoxic effector molecules, and
others were observed in tumors from ACT mice. At the same time, there was a decrease
in the expression of some genes positively regulating the cell cycle in these tumors.
Therefore, we focused on cell cycle control in the B16 adoptive immunotherapy model
and utilized the fucci system, which allows the visualization of cell cycle stage of tumor
cells in situ in mice receiving CTL.
Histological analysis following ACT showed that the number of CTLs in the tumor
was far lower than the number of tumor cells. On average, there were only 140 CTLs
per mm2 tumor tissue on day 3 after transfer. In contrast, this area contained 1,911
tumor cells (both green and red cells). Thus, it seems a priori unlikely that this small
number of CTLs infiltrating the tumor would be sufficient to prevent tumor growth by
direct cytotoxicity 3 to 7 days after CTL injection. Consistent with this observation, we
also found that the area of the tumor undergoing necrosis/apoptosis was relatively small.
Instead, there is a larger area consisted of tumor cells that had undergone cell cycle
arrest at G1. Therefore, transient tumor suppression from day 3 to 7 seems to be largely
due to cell cycle arrest rather than by CTL killing. Using mAbs that neutralize IFNγ and
completely block IFNγ signaling, we demonstrated that IFNγ is required for tumor
growth inhibition and G1 cell cycle arrest but not for CTL killing. Thus, IFNγ-dependent
G1 cell cycle arrest makes a major contribution to tumor growth suppression in this
model. This would explain why tumor growth was suppressed in spite of the low ratio
on June 6, 2019. © 2014 American Association for Cancer Research. cancerimmunolres.aacrjournals.org Downloaded from
Author manuscripts have been peer reviewed and accepted for publication but have not yet been edited. Author Manuscript Published OnlineFirst on August 15, 2014; DOI: 10.1158/2326-6066.CIR-14-0098
20
of CTLs to tumor cells in this system and how T cells can suppress the growth of
bystander tumor cells that may not express the target antigen. This could also explain
some examples to tumor suppression by CD4+ T cells that can also make IFNγ even if
they are not lytic and even if the tumor is MHC class II negative, as long as APCs are
infiltrating and can present antigen, since the soluble IFNγ can target neighboring cells.
IFNγ inhibits cell proliferation via cell type-specific pathways that involve cyclin
kinase inhibitors (CKIs) such as p21Cip1 (29, 30) or p27Kip1 (31, 32). It has been
shown that STAT1 interacts directly with cyclin D1/Cdk4 and mediates cell cycle arrest
of human U3A cells (33). Here, we investigated the involvement of CKIs in G1 cell
cycle arrest, and found that p27Kip1, but not p21Cip1, accumulated in B16 tumor cells
following CTL therapy in vivo or IFNγ treatment in vitro. Another CKI, p16, is involved
in senescence-like G1 cell cycle arrest (14), but this factor is not expressed in B16 tumor
cells due to a p16Ink4a exon1α deletion (34). Thus, p27Kip1 appeared to be the major
CKI involved in G1 arrest in this model. Skp2 is an oncogene; Skp2 inactivation induces
cell senescence independent of the p53 pathway (35). STAT1 has been shown to repress
Skp2 gene transcription by binding to its promotor region and stabilizing p27Kip1 in
Ras-transformed cells (36). In this report, we showed that Skp2 expression was
down-regulated after either CTL therapy or IFNγ treatment; thus, STAT1 may repress
Skp2 expression and promote p27Kip1 stabilization.
G1 cell cycle arrest is also known to be induced by ATM-dependent activation of p53
and induction of p21Cip1 (37). Because ATM is a key molecule in the cellular response
to DNA damage (38), we investigated its expression by Western blotting. We found that
the ATM protein was not highly expressed in the tumor following CTL therapy. We also
confirmed this finding in vitro in B16 cells cultured with IFNγ. Furthermore, p53 was
on June 6, 2019. © 2014 American Association for Cancer Research. cancerimmunolres.aacrjournals.org Downloaded from
Author manuscripts have been peer reviewed and accepted for publication but have not yet been edited. Author Manuscript Published OnlineFirst on August 15, 2014; DOI: 10.1158/2326-6066.CIR-14-0098

21
not phosphorylated at Ser15, and the CKI p21Cip1, which is downstream of
phospho-p53 (Ser15), was not up-regulated. Therefore, we conclude that ATM
expression triggered by DNA damage and the subsequent activation of the
phospho-p53/p21 pathway was not involved in this model.
We tested the effect of IFNγ on other murine tumor cell lines, and found that the
proliferation of FBL-3 cells was strongly inhibited by IFNγ, similar to that of the B16
tumor cells. On the other hand, EL-4 cells were insensitive to IFNγ, whereas p815,
CT26, and 3LL cells were moderately sensitive. IFNγ sensitivity and the mechanisms
involved in the inhibition of cell proliferation may differ in different tumor cell lines. It
is important to know whether IFNγ insensitivity is due to the downregulation of IFNγ
receptors on these tumors, or defects in their IFNγ signal transduction.
Braumuller and colleagues reported that IFNγ together with TNFα reduced the
proliferation of different cancer cell lines in both mouse and human (14). Here we
showed that the combination of IFNγ and TNFα strongly inhibited B16 tumor cell
proliferation and senescence (Supplementary Fig. S3). Because Pmel-1 CTLs produce
large amounts of IFNγ but not TNFα when they are cultured with B16 tumor cells in
vitro (Supplementary Fig. S4), and IFNγ alone is enough to suppress tumor cell
proliferation (Supplementary Fig. S3), the transient suppression of tumor growth from
day 3 to day 7 in vivo in this model may be entirely due to IFNγ, as there is only a small
amount of TNFα at the tumor site. Th1 CD4+ T cells or toll-like receptor
(TLR)-stimulated macrophages might be able to produce enough TNFα, but these cells
are not present in our system. Alternatively, a strategy to induce polyfunctional CD8+ T
cells producing IFNγ, TNFα, and IL2 might be important to enhance further the
antitumor effects in this model (39, 40).
on June 6, 2019. © 2014 American Association for Cancer Research. cancerimmunolres.aacrjournals.org Downloaded from
Author manuscripts have been peer reviewed and accepted for publication but have not yet been edited. Author Manuscript Published OnlineFirst on August 15, 2014; DOI: 10.1158/2326-6066.CIR-14-0098
22
IFNγ is a critical molecule in cancer immunosurveillance or immunoediting in
primary mouse tumor models (41-44). In our study, as long as high concentrations of
IFNγ were present in the tumor, its growth was controlled through G1 arrest
(Supplementary Fig. S1). Thus, our study suggests that deregulation of the cell cycle
due to insufficient availability of IFNγ or IFNγ insensitivity developed by tumor cells
may be one mechanism by which tumor cells escape from CTL therapy (Supplementary
Figs. S1 and S2).
Our study indicates that a small number of infiltrated CTLs can cause a large number
of tumor cells to arrest in G1 rather than dying. Based on this finding, we propose that
the development of an appropriate strategy to maintain tumor cells in a quiescent,
dormant state for extended periods (immunotherapy-induced equilibrium/dormancy), or
to induce apoptosis/senescence would be highly desirable.
Aknowledgement
We thank Dr. N. Restifo (National Cancer Institute) for providing the B16F10 tumor
cell line; Dr. A. Miyawaki (RIKEN, Wako) for Fucci system and Mr. K. Sato (Kazusa
DNA Research Institute) for excellent technical assistance in gene expression analysis.
on June 6, 2019. © 2014 American Association for Cancer Research. cancerimmunolres.aacrjournals.org Downloaded from
Author manuscripts have been peer reviewed and accepted for publication but have not yet been edited. Author Manuscript Published OnlineFirst on August 15, 2014; DOI: 10.1158/2326-6066.CIR-14-0098
23
References
1. Rosenberg SA, Restifo NP, Yang JC, Morgan RA, Dudley ME. Adoptive cell transfer: a
clinical path to effective cancer immunotherapy. Nat Rev Cancer. 2008;8:299-308.
2. Morgan RA, Dudley ME, Wunderlich JR, Hughes MS, Yang JC, Sherry RM, et al.
Cancer regression in patients after transfer of genetically engineered lymphocytes.
Science. 2006;314:126-9.
3. Brenner MK, Heslop HE. Adoptive T cell therapy of cancer. Curr Opin Immunol.
2010;22:251-7.
4. Kalos M, Levine BL, Porter DL, Katz S, Grupp SA, Bagg A, et al. T cells with chimeric
antigen receptors have potent antitumor effects and can establish memory in patients
with advanced leukemia. Sci Transl Med. 2011;3:95ra73.
5. Robbins PF, Morgan RA, Feldman SA, Yang JC, Sherry RM, Dudley ME, et al. Tumor
regression in patients with metastatic synovial cell sarcoma and melanoma using
genetically engineered lymphocytes reactive with NY-ESO-1. J Clin Oncol.
2011;29:917-24.
6. Vierboom MP, Nijman HW, Offringa R, van der Voort EI, van Hall T, van den Broek L,
et al. Tumor eradication by wild-type p53-specific cytotoxic T lymphocytes. J Exp Med.
1997;186:695-704.
7. Hanson HL, Donermeyer DL, Ikeda H, White JM, Shankaran V, Old LJ, et al.
Eradication of established tumors by CD8+ T cell adoptive immunotherapy. Immunity.
2000;13:265-76.
8. Mukherjee P, Ginardi AR, Tinder TL, Sterner CJ, Gendler SJ. MUC1-specific cytotoxic T
lymphocytes eradicate tumors when adoptively transferred in vivo. Clin Cancer Res.
2001;7:848s-55s.
9. Kagi D, Vignaux F, Ledermann B, Burki K, Depraetere V, Nagata S, et al. Fas and
perforin pathways as major mechanisms of T cell-mediated cytotoxicity. Science.
1994;265:528-30.
10. Spiotto MT, Rowley DA, Schreiber H. Bystander elimination of antigen loss variants in
established tumors. Nat Med. 2004;10:294-8.
11. Breart B, Lemaitre F, Celli S, Bousso P. Two-photon imaging of intratumoral CD8+ T
cell cytotoxic activity during adoptive T cell therapy in mice. J Clin Invest.
2008;118:1390-7.
12. Zhang B, Karrison T, Rowley DA, Schreiber H. IFN-gamma- and TNF-dependent
bystander eradication of antigen-loss variants in established mouse cancers. J Clin
Invest. 2008;118:1398-404.
13. Muller-Hermelink N, Braumuller H, Pichler B, Wieder T, Mailhammer R, Schaak K, et
on June 6, 2019. © 2014 American Association for Cancer Research. cancerimmunolres.aacrjournals.org Downloaded from
Author manuscripts have been peer reviewed and accepted for publication but have not yet been edited. Author Manuscript Published OnlineFirst on August 15, 2014; DOI: 10.1158/2326-6066.CIR-14-0098

24
al. TNFR1 signaling and IFN-gamma signaling determine whether T cells induce tumor
dormancy or promote multistage carcinogenesis. Cancer Cell. 2008;13:507-18.
14. Braumuller H, Wieder T, Brenner E, Assmann S, Hahn M, Alkhaled M, et al.
T-helper-1-cell cytokines drive cancer into senescence. Nature. 2013;494:361-5.
15. Dunn GP, Koebel CM, Schreiber RD. Interferons, immunity and cancer immunoediting.
Nat Rev Immunol. 2006;6:836-48.
16. Winter H, Hu HM, McClain K, Urba WJ, Fox BA. Immunotherapy of melanoma: a
dichotomy in the requirement for IFN-gamma in vaccine-induced antitumor immunity
versus adoptive immunotherapy. J Immunol. 2001;166:7370-80.
17. Liao F, Rabin RL, Yannelli JR, Koniaris LG, Vanguri P, Farber JM. Human Mig
chemokine: biochemical and functional characterization. J Exp Med. 1995;182:1301-14.
18. Luster AD, Leder P. IP-10, a -C-X-C- chemokine, elicits a potent thymus-dependent
antitumor response in vivo. J Exp Med. 1993;178:1057-65.
19. Cole KE, Strick CA, Paradis TJ, Ogborne KT, Loetscher M, Gladue RP, et al.
Interferon-inducible T cell alpha chemoattractant (I-TAC): a novel non-ELR CXC
chemokine with potent activity on activated T cells through selective high affinity
binding to CXCR3. J Exp Med. 1998;187:2009-21.
20. Bromberg JF, Horvath CM, Wen Z, Schreiber RD, Darnell JE, Jr. Transcriptionally
active Stat1 is required for the antiproliferative effects of both interferon alpha and
interferon gamma. Proc Natl Acad Sci U S A. 1996;93:7673-8.
21. Chin YE, Kitagawa M, Su WC, You ZH, Iwamoto Y, Fu XY. Cell growth arrest and
induction of cyclin-dependent kinase inhibitor p21 WAF1/CIP1 mediated by STAT1.
Science. 1996;272:719-22.
22. Meurs E, Chong K, Galabru J, Thomas NS, Kerr IM, Williams BR, et al. Molecular
cloning and characterization of the human double-stranded RNA-activated protein
kinase induced by interferon. Cell. 1990;62:379-90.
23. Deiss LP, Feinstein E, Berissi H, Cohen O, Kimchi A. Identification of a novel
serine/threonine kinase and a novel 15-kD protein as potential mediators of the gamma
interferon-induced cell death. Genes Dev. 1995;9:15-30.
24. Noji S, Hosoi A, Takeda K, Matsushita H, Morishita Y, Seto Y, et al. Targeting
spatiotemporal expression of CD137 on tumor-infiltrating cytotoxic T lymphocytes as a
novel strategy for agonistic antibody therapy. J Immunother. 2012;35:460-72.
25. Sakaue-Sawano A, Kurokawa H, Morimura T, Hanyu A, Hama H, Osawa H, et al.
Visualizing spatiotemporal dynamics of multicellular cell-cycle progression. Cell.
2008;132:487-98.
26. Dighe AS, Richards E, Old LJ, Schreiber RD. Enhanced in vivo growth and resistance to
on June 6, 2019. © 2014 American Association for Cancer Research. cancerimmunolres.aacrjournals.org Downloaded from
Author manuscripts have been peer reviewed and accepted for publication but have not yet been edited. Author Manuscript Published OnlineFirst on August 15, 2014; DOI: 10.1158/2326-6066.CIR-14-0098
25
rejection of tumor cells expressing dominant negative IFN gamma receptors. Immunity.
1994;1:447-56.
27. Ranganath S, Ouyang W, Bhattarcharya D, Sha WC, Grupe A, Peltz G, et al.
GATA-3-dependent enhancer activity in IL-4 gene regulation. J Immunol.
1998;161:3822-6.
28. Hosoi A, Matsushita H, Shimizu K, Fujii SI, Ueha S, Abe J, et al. Adoptive cytotoxic T
lymphocyte therapy triggers a counter-regulatory immunosuppressive mechanism via
recruitment of myeloid-derived suppressor cells. Int J Cancer. 2014;134:1810-22.
29. Hobeika AC, Etienne W, Torres BA, Johnson HM, Subramaniam PS. IFN-gamma
induction of p21(WAF1) is required for cell cycle inhibition and suppression of apoptosis.
J Interferon Cytokine Res. 1999;19:1351-61.
30. Gooch JL, Herrera RE, Yee D. The role of p21 in interferon gamma-mediated growth
inhibition of human breast cancer cells. Cell Growth Differ. 2000;11:335-42.
31. Harvat BL, Seth P, Jetten AM. The role of p27Kip1 in gamma interferon-mediated
growth arrest of mammary epithelial cells and related defects in mammary carcinoma
cells. Oncogene. 1997;14:2111-22.
32. Lee SH, Kim JW, Oh SH, Kim YJ, Rho SB, Park K, et al. IFN-gamma/IRF-1-induced
p27kip1 down-regulates telomerase activity and human telomerase reverse
transcriptase expression in human cervical cancer. FEBS Lett. 2005;579:1027-33.
33. Dimco G, Knight RA, Latchman DS, Stephanou A. STAT1 interacts directly with cyclin
D1/Cdk4 and mediates cell cycle arrest. Cell Cycle. 2010;9:4638-49.
34. Melnikova VO, Bolshakov SV, Walker C, Ananthaswamy HN. Genomic alterations in
spontaneous and carcinogen-induced murine melanoma cell lines. Oncogene.
2004;23:2347-56.
35. Lin HK, Chen Z, Wang G, Nardella C, Lee SW, Chan CH, et al. Skp2 targeting
suppresses tumorigenesis by Arf-p53-independent cellular senescence. Nature.
2010;464:374-9.
36. Wang S, Raven JF, Koromilas AE. STAT1 represses Skp2 gene transcription to promote
p27Kip1 stabilization in Ras-transformed cells. Mol Cancer Res. 2010;8:798-805.
37. Delia D, Fontanella E, Ferrario C, Chessa L, Mizutani S. DNA damage-induced
cell-cycle phase regulation of p53 and p21waf1 in normal and ATM-defective cells.
Oncogene. 2003;22:7866-9.
38. Kitagawa R, Kastan MB. The ATM-dependent DNA damage signaling pathway. Cold
Spring Harb Symp Quant Biol. 2005;70:99-109.
39. Perret R, Ronchese F. Effector CD8+ T cells activated in vitro confer immediate and
long-term tumor protection in vivo. Eur J Immunol. 2008;38:2886-95.
on June 6, 2019. © 2014 American Association for Cancer Research. cancerimmunolres.aacrjournals.org Downloaded from
Author manuscripts have been peer reviewed and accepted for publication but have not yet been edited. Author Manuscript Published OnlineFirst on August 15, 2014; DOI: 10.1158/2326-6066.CIR-14-0098
26
40. Imai N, Ikeda H, Tawara I, Shiku H. Tumor progression inhibits the induction of
multifunctionality in adoptively transferred tumor-specific CD8+ T cells. Eur J Immunol.
2009;39:241-53.
41. Kaplan DH, Shankaran V, Dighe AS, Stockert E, Aguet M, Old LJ, et al. Demonstration
of an interferon gamma-dependent tumor surveillance system in immunocompetent
mice. Proc Natl Acad Sci U S A. 1998;95:7556-61.
42. Shankaran V, Ikeda H, Bruce AT, White JM, Swanson PE, Old LJ, et al. IFNgamma and
lymphocytes prevent primary tumour development and shape tumour immunogenicity.
Nature. 2001;410:1107-11.
43. Koebel CM, Vermi W, Swann JB, Zerafa N, Rodig SJ, Old LJ, et al. Adaptive immunity
maintains occult cancer in an equilibrium state. Nature. 2007;450:903-7.
44. Schreiber RD, Old LJ, Smyth MJ. Cancer immunoediting: integrating immunity's roles
in cancer suppression and promotion. Science. 2011;331:1565-70.
on June 6, 2019. © 2014 American Association for Cancer Research. cancerimmunolres.aacrjournals.org Downloaded from
Author manuscripts have been peer reviewed and accepted for publication but have not yet been edited. Author Manuscript Published OnlineFirst on August 15, 2014; DOI: 10.1158/2326-6066.CIR-14-0098
27
Figure legends
Figure 1. Gene expression analysis of the tumor in adoptive T-cell immunotherapy
(ACT). (A) C57BL/6 mice were injected with 1x10⁶ B16 tumor cells, and 9 days later
(designated as day 0), tumor-bearing mice received 1x10⁷ in vitro activated B16-specific
(gp100-specific) CD90.1+ CTLs (designated ACT mice). Tumor volumes were
measured on days 1, 3, 5 and 7 after CTL transfer (n = 5). (B) Tumor tissues from
untreated or ACT mice were harvested on days 1, 3, 5 and 7. Total RNA extracted from
3-4 tumor tissues in each group was pooled and used for gene expression analysis. Heat
maps of hierarchical clustering analysis based on fold-changes of gene expression on
day 3, 5, and 7 relative to day 1 are shown (left columns). Some groups of genes that
were up-regulated (upper) or down-regulated (lower) after CTL transfer were extracted
into the columns on the right. (C) Cell cycle PCR array performed using tumor tissues
from untreated or ACT mice (n=4) on day 3. Seven cell cycle genes that were
significantly down-regulated in the tumors from ACT mice are shown. The
fold-regulation is the negative inverse of the fold-change.
Figure 2. CTL transfer therapy induced G1 cell cycle arrest of the tumor. (A) C57BL/6
mice were injected with 1x10⁶ B16-fucci tumor cells, and 9 days later tumor-bearing
mice (n=5) were treated as described in Fig. 1. (B) Representative H&E (top) and
fluorescence microscopy images (middle and bottom) of cryosections of B16-fucci on
day 3 (n=3 per group). Alexa Fluor 647-labeled anti-mouse CD90.1 antibody was used
to detect infiltrating CD90.1+ T cells (blue cells) (middle). Scale bars: 200 μm. (C)
Analysis of cell cycle stage was performed by calculating the green/red (G/R) ratio in
fluorescence images (n=3 per group). Samples were compared using an unpaired,
on June 6, 2019. © 2014 American Association for Cancer Research. cancerimmunolres.aacrjournals.org Downloaded from
Author manuscripts have been peer reviewed and accepted for publication but have not yet been edited. Author Manuscript Published OnlineFirst on August 15, 2014; DOI: 10.1158/2326-6066.CIR-14-0098
28
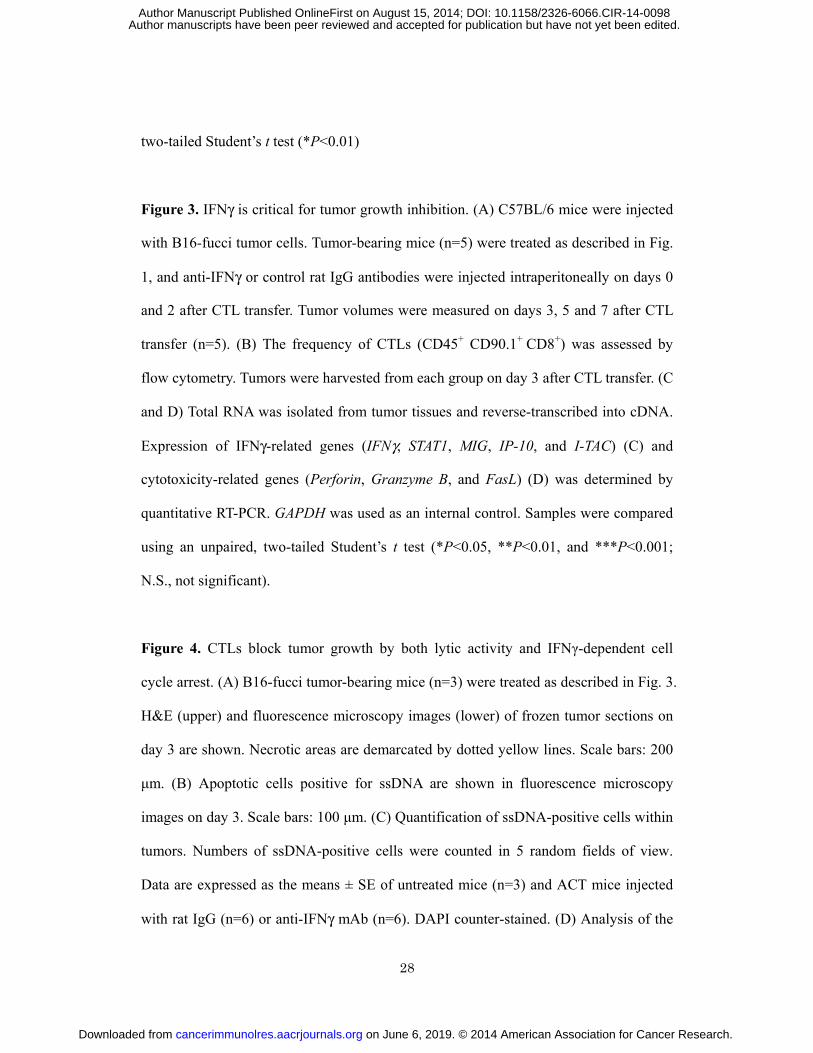
two-tailed Student’s t test (*P<0.01)
Figure 3. IFNγ is critical for tumor growth inhibition. (A) C57BL/6 mice were injected
with B16-fucci tumor cells. Tumor-bearing mice (n=5) were treated as described in Fig.
1, and anti-IFNγ or control rat IgG antibodies were injected intraperitoneally on days 0
and 2 after CTL transfer. Tumor volumes were measured on days 3, 5 and 7 after CTL
transfer (n=5). (B) The frequency of CTLs (CD45+ CD90.1+ CD8+) was assessed by
flow cytometry. Tumors were harvested from each group on day 3 after CTL transfer. (C
and D) Total RNA was isolated from tumor tissues and reverse-transcribed into cDNA.
Expression of IFNγ-related genes (IFNγ, STAT1, MIG, IP-10, and I-TAC) (C) and
cytotoxicity-related genes (Perforin, Granzyme B, and FasL) (D) was determined by
quantitative RT-PCR. GAPDH was used as an internal control. Samples were compared
using an unpaired, two-tailed Student’s t test (*P<0.05, **P<0.01, and ***P<0.001;
N.S., not significant).
Figure 4. CTLs block tumor growth by both lytic activity and IFNγ-dependent cell
cycle arrest. (A) B16-fucci tumor-bearing mice (n=3) were treated as described in Fig. 3.
H&E (upper) and fluorescence microscopy images (lower) of frozen tumor sections on
day 3 are shown. Necrotic areas are demarcated by dotted yellow lines. Scale bars: 200
μm. (B) Apoptotic cells positive for ssDNA are shown in fluorescence microscopy
images on day 3. Scale bars: 100 μm. (C) Quantification of ssDNA-positive cells within
tumors. Numbers of ssDNA-positive cells were counted in 5 random fields of view.
Data are expressed as the means ± SE of untreated mice (n=3) and ACT mice injected
with rat IgG (n=6) or anti-IFNγ mAb (n=6). DAPI counter-stained. (D) Analysis of the
on June 6, 2019. © 2014 American Association for Cancer Research. cancerimmunolres.aacrjournals.org Downloaded from
Author manuscripts have been peer reviewed and accepted for publication but have not yet been edited. Author Manuscript Published OnlineFirst on August 15, 2014; DOI: 10.1158/2326-6066.CIR-14-0098

29
cell cycle was performed by calculating the green/red (G/R) ratio in fluorescence
images (n=6 per group). (E) The numbers of CTLs, tumor cells in necrotic areas, and
tumor cells in G1 or S/G2/M. The number of cells in necrotic areas was estimated by
calculating surface area of the region using BZ-H1M software (Keyence). Total
numbers of cells in at least three random fields of view (/mm2) are shown.
Representative data of 3 mice for each group are given. Samples were compared using
an unpaired, two-tailed Student’s t test (*P<0.01; N.S., not significant).
Figure 5. IFNγ dirrectly inhibit tumor cell growth through G1 cell cycle arrest. (A)
Proliferation of B16-fucci cells or B16-fucci expressing an IFNγ receptor lacking the
intracellular component (B16-fucciΔIC) was assessed after exposure to IFNγ (10 U/ml)
for 6 days. (B) B16-fucci or B16-fucciΔIC cells were incubated with IFNγ (10 U/ml).
Two days later, the cell-cycle state was determined by fluorescence microscopy (left).
Original magnification, ×200. Green/red (G/R) ratio in fluorescence images is shown
(n=2 per group) (right-hand side).
Figure 6. G1 cell cycle arrest by ACT was mediated by IFNγ-dependent
Skp2/p27-related cell cycle regulation. (A) B16-fucci tumors were harvested from
untreated or ACT mice given control rat IgG or anti-IFNγ mAb on day 3 after CTL
transfer. Protein extracts (50 mg) from tumor tissues in each group were used for
immunoblotting of the indicated proteins. (B) Protein extracts from B16-fucci or
B16-fucciΔIC cells treated with IFNγ (10 U/ml) for the indicated time were used for
immunoblotting of the indicated proteins.
on June 6, 2019. © 2014 American Association for Cancer Research. cancerimmunolres.aacrjournals.org Downloaded from
Author manuscripts have been peer reviewed and accepted for publication but have not yet been edited. Author Manuscript Published OnlineFirst on August 15, 2014; DOI: 10.1158/2326-6066.CIR-14-0098
30
Figure 7. Inhibition of cell proliferation by IFNγ in other murine cell lines. (A)
Proliferation of FBL3, p815, CT26, 3LL, and EL4 cells after treatment with IFNγ (10 or
100 U/ml) for 4-6 days. (B) Protein extracts from FBL3 and EL4 cells treated with IFNγ
(10 U/ml) for the indicated time were used for immunoblotting of the indicated proteins.
on June 6, 2019. © 2014 American Association for Cancer Research. cancerimmunolres.aacrjournals.org Downloaded from
Author manuscripts have been peer reviewed and accepted for publication but have not yet been edited. Author Manuscript Published OnlineFirst on August 15, 2014; DOI: 10.1158/2326-6066.CIR-14-0098
A3)
Figure 1
Tum
or v
olum
e (m
m
B
U t t d CTLCd8aTh 1
1 3 5 7 1 3 5 7
Untreated CTL
(days)
CD8+ T cells
Days after CTL transfer
1 3 5 7 1 3 5 7Untreated CTL
(days)
Thy1H2-D1H2-K1Tap2TapbpB2mIfngStat1Cxcl9C l10
MHC class I pathway
IFN-γ signaling
CD8 T cells
Cxcl10Prf1FaslGzmbCasp12Casp1Casp4Casp7Atm
Cytotoxic molecule
Apoptosis
Skp2E2f1E2f2Ccne1Ccnb1CcnfCcnhMki67Wee1
Cell cycle
-2 0 2
C
Skp2 -2.786 0.00009E2f2 -2.7508 0.011257Ccnb2 (Cyclin B2) -2.1494 0.001346Ccnf (Cyclin F) -2.0253 0.002599
Genes fold regulation p-value
Mki67 -2.359 0.006258Rad51 -2.3885 0.00095Wee1 -2.4354 0.000533
on June 6, 2019. © 2014 American Association for Cancer Research. cancerimmunolres.aacrjournals.org Downloaded from
Author manuscripts have been peer reviewed and accepted for publication but have not yet been edited. Author Manuscript Published OnlineFirst on August 15, 2014; DOI: 10.1158/2326-6066.CIR-14-0098
BA
Figure 2T
umor
vol
ume
(mm
3)
Untreated CTL
C
o
Days after CTL transfer
T
*
Untreated CTL
G/R
rat
io
on June 6, 2019. © 2014 American Association for Cancer Research. cancerimmunolres.aacrjournals.org Downloaded from
Author manuscripts have been peer reviewed and accepted for publication but have not yet been edited. Author Manuscript Published OnlineFirst on August 15, 2014; DOI: 10.1158/2326-6066.CIR-14-0098
A B
s N Smm
3)
Figure 3
UntreatedCTL+ CTL(x4)+C
D8
+ C
D90
.1+
cells
(% o
f CD
45+
)
N.S.N.S.
Tum
or v
olum
e (m
**
***
C
UntreatedRat IgG anti-IFN-γDays after CTL transfer
IFN-γ STAT1 MIG IP-10 I-TAC
ve e
xpre
ssio
n ** *** *** *** ***
D
Rel
ativ
Perforin Granzyme B FasL
sion N.S.N.S. *
Rel
ativ
e ex
pres
s
on June 6, 2019. © 2014 American Association for Cancer Research. cancerimmunolres.aacrjournals.org Downloaded from
Author manuscripts have been peer reviewed and accepted for publication but have not yet been edited. Author Manuscript Published OnlineFirst on August 15, 2014; DOI: 10.1158/2326-6066.CIR-14-0098
AUntreated CTL + Rat IgG CTL(x4) + anti-IFN-γ
Figure 4
B Cm
2 N.S.Untreated CTL + Rat IgG CTL(x4) + anti IFN γ
Untreated CTL+ CTL(x4)+
Num
ber
of
DN
Apo
sitiv
e ce
lls /
mmUntreated CTL + Rat IgG CTL(x4) + anti-IFN-γ
o
*
D E
mm
2
Untreated CTLRat IgG
CTL(x4)anti-IFN-γss
D
G/R
rat
io
Untreated CTL+Rat IgG
CTL(x4)+anti-IFN-γ
UntreatedCTL + R t I G
CTL(x4) + ti IFN
Cel
ls /
m
Untreated Rat IgG anti-IFN-γ
on June 6, 2019. © 2014 American Association for Cancer Research. cancerimmunolres.aacrjournals.org Downloaded from
Author manuscripts have been peer reviewed and accepted for publication but have not yet been edited. Author Manuscript Published OnlineFirst on August 15, 2014; DOI: 10.1158/2326-6066.CIR-14-0098
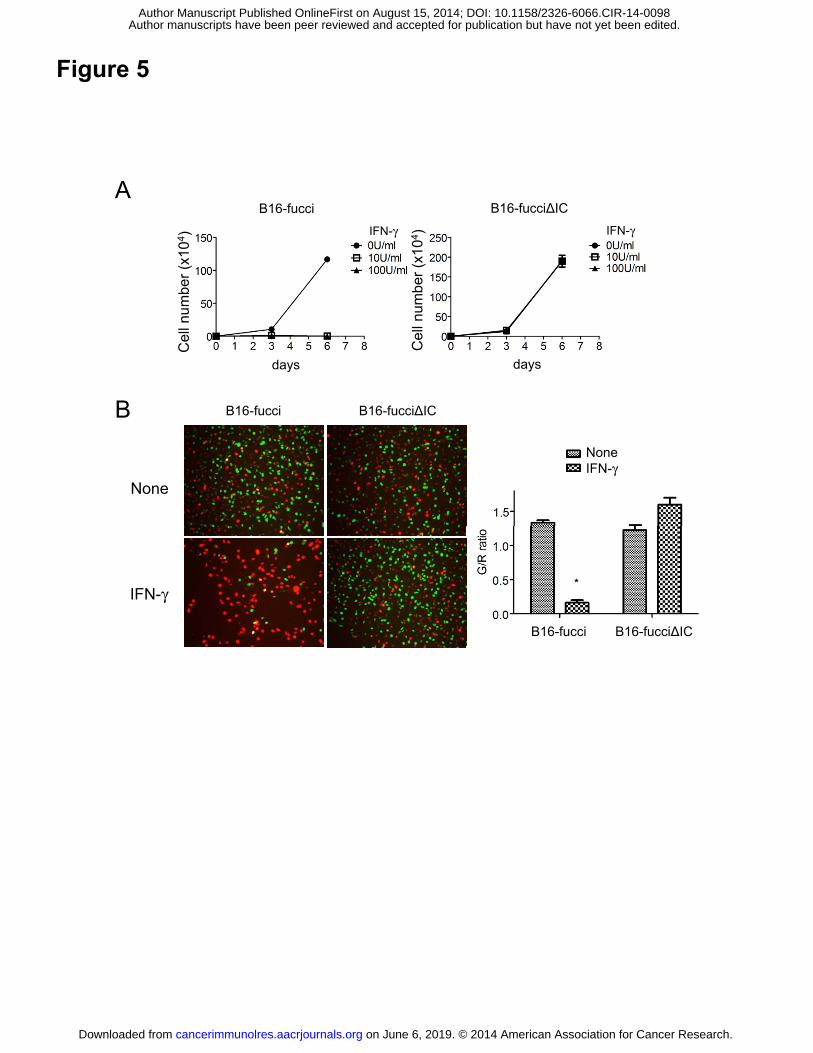
Figure 5
B16-fucci B16-fucciΔICIFN-γIFN-γ
Aer
(x10
4 )
ber (
x104
)B B16 f iΔICB16 f i
Cel
l num
b
days
Cel
l num
b
days
B B16-fucciΔICB16-fucci
NoneIFN-γ
None
IFN-γ
B16-fucciΔICB16-fucci
*
on June 6, 2019. © 2014 American Association for Cancer Research. cancerimmunolres.aacrjournals.org Downloaded from
Author manuscripts have been peer reviewed and accepted for publication but have not yet been edited. Author Manuscript Published OnlineFirst on August 15, 2014; DOI: 10.1158/2326-6066.CIR-14-0098
A B
Figure 6
A B
Skp2
B16-fucci B16-fucciΔIC
pSTAT1
0 24 48 0 24 48
0 15 30 120 0 15 30 120 (min)
(h)
UntreatedCTL+
Rat IgGCTL(x4)+anti-IFN-γ
Skp2
pSTAT1
p27Kip1
β-actin
p21Cip1
ATM
p53Ser15
p27Kip1
β-actin
p21Cip1
ATM
p53Ser15
on June 6, 2019. © 2014 American Association for Cancer Research. cancerimmunolres.aacrjournals.org Downloaded from
Author manuscripts have been peer reviewed and accepted for publication but have not yet been edited. Author Manuscript Published OnlineFirst on August 15, 2014; DOI: 10.1158/2326-6066.CIR-14-0098
A
Figure 7
ell n
umbe
r (x
104 )
FBL3IFN-γ
CT26IFN-γ
P815IFN-γ
EL4IFN-γ
Ce
days daysdays
3LL
ber
(x10
4 )
IFN-γ
B
days
Cel
l num
b
days
B
Skp2
0 24 48(h) 0 24 48(h)
FBL3 EL4
0 15 30 90 (min)
pSTAT1
0 15 30 90 (min)
p27Kip1
Skp2
p21Cip1
ATM
p53ser15
β-actin
p21Cip1
on June 6, 2019. © 2014 American Association for Cancer Research. cancerimmunolres.aacrjournals.org Downloaded from
Author manuscripts have been peer reviewed and accepted for publication but have not yet been edited. Author Manuscript Published OnlineFirst on August 15, 2014; DOI: 10.1158/2326-6066.CIR-14-0098
Published OnlineFirst August 15, 2014.Cancer Immunol Res Hirokazu Matsushita, Akihiro Hosoi, Satoshi Ueha, et al.
-dependent cell cycle arrestγactivity and IFN-Cytotoxic T lymphocytes block tumor growth both by lytic
Updated version
10.1158/2326-6066.CIR-14-0098doi:
Access the most recent version of this article at:
Material
Supplementary
http://cancerimmunolres.aacrjournals.org/content/suppl/2014/08/16/2326-6066.CIR-14-0098.DC1
Access the most recent supplemental material at:
Manuscript
Authoredited. Author manuscripts have been peer reviewed and accepted for publication but have not yet been
E-mail alerts related to this article or journal.Sign up to receive free email-alerts
Subscriptions
Reprints and
To order reprints of this article or to subscribe to the journal, contact the AACR Publications
Permissions
Rightslink site. Click on "Request Permissions" which will take you to the Copyright Clearance Center's (CCC)
.http://cancerimmunolres.aacrjournals.org/content/early/2014/08/15/2326-6066.CIR-14-0098To request permission to re-use all or part of this article, use this link
on June 6, 2019. © 2014 American Association for Cancer Research. cancerimmunolres.aacrjournals.org Downloaded from
Author manuscripts have been peer reviewed and accepted for publication but have not yet been edited. Author Manuscript Published OnlineFirst on August 15, 2014; DOI: 10.1158/2326-6066.CIR-14-0098