d-a112 921 fphy fl s odnip 1. goetze ti-- . 'iti air force office of scientific research office...
TRANSCRIPT

D-A112 921 FPHY Fl s " ODNip aUHOCNOiI 1

H 10 1112-0
1.1 120

Olt Mechanics and Materials CenterTEXAS A&M UNIVERSITY
College Station, Texasixi
" * Y AFOSR.Ih. 8 8- 0 020
Approve d for pr icb release;~~~~~~~distri,1' ' '- *,: 1i,~' '
N FRACTURE PHYSICS OF DELAMINATION
OF COMPOSITE MATERIALS ..
m L- , .. .
+ TECHNICAL REPORT
W.L. BRADLEY
C.R. CORLETO
D.P. GOETZE TI-- .
'ITI
AIR FORCE OFFICE OF SCIENTIFIC RESEARCH
OFFICE OF AEROSPACE RESEARCH
UNITED STATES AIR FORCE
GRANT No. AFOSR-84-0064
MM 5021-87-12 OCTOBER 1987
88 2 2,4 50
UNCLASSIFIED Itl 0:SECURITY CLASSIFICATION OF TI1S PAGE
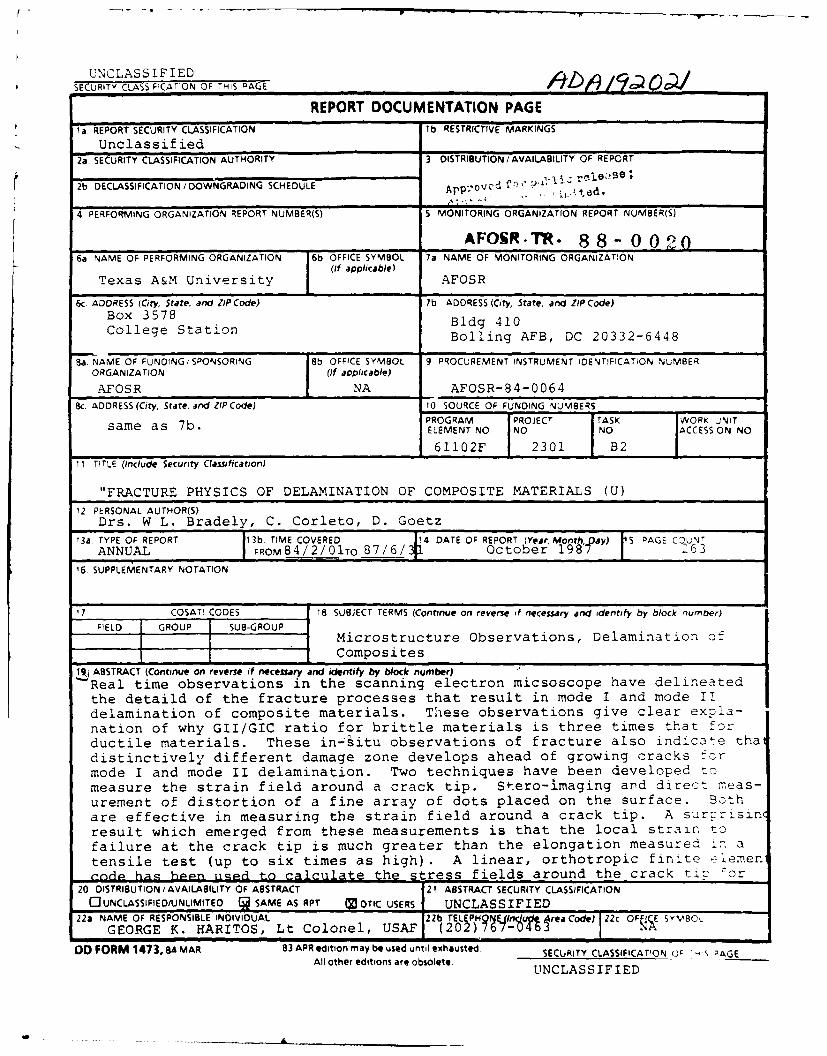
REPORT DOCUMENTATION PAGEla. REPORT SECURITY CLASSIFICATION lb RESTRICTIVE MARKINGS
Unclassified2a. SECURITY CLASSIFICATION AUTHORITY 3 DISTRIBUTION/ AVAILABILITY OF REPORT
2b. DECLASSIFICATION / DOWNGRADING SCHEDULE ApP r i7~eS
4 PERFORMING ORGANIZATION REPORT NUMBER(S) 5 MONITORING ORGANIZATION REPORT NUMBER(S)
AFONR.7R . 8 8- 0 0 06a NAME OF PERFORMING ORGANIZATION 6b OFFICE SYMBOL 7a NAME OF MONITORING ORGANIZATION
(if applicable)
Texas A&M University AFOSR
6c, ADDRESS (City, State. and ZIPCode) 7b ADDRESS (City, State, and ZIP Code)Box 3578 Bldg 410College Station Bd 1Bolling AFB, DC 20332-6448
Ba. NAME OF FUNDING SPONSORING 8b OFFICE SYMBOL 9 PROCUREMENT INSTRUMENT IDENTIFICATION NUMBERORGANIZATION (If applicable)
AFOS R NA AFOSR-84-00648c. ADDRESS (City, State, and ZIP Code) 10 SOURCE OF FUNDING NUMBERS
PROGRAM PROJECT TASK WORK UNITsame as 7b. ELEMENT NO. NO NO ACCESSION NO
61102F 2301 211 TITLE (Include Security Classification)
"FRACTURE PHYSICS OF DELAMINATION OF COMPOSITE MATERIALS (U)
12 PERSONAL AUTHOR(S)
Drs. W L. Bradely, C. Corleto, D. Goetz
3a, TYPE OF REPORT 13b TIME COVERED 14 DATE OF REPORT (Year Month,Day) S AGE COU1TANNUAL FROM 8 4 / 2 /01TO 87/6/ October' 1987
16 SUPPLEMENTARY NOTATION
17 COSATI CODES 18 SUBJECT TERMS (Continue on reverse if necessary and identify by block number)
FIELD GROUP SUB-GROUPMicrostructure Observations, Delamination ofComposites
11 ABSTRACT (Continue on reverse if necessary and identify by block number) 1Real time observations in the scanning electron micsoscope have delineatedthe detaild of the fracture processes that result in mode I and mode IIdelamination of composite materials. These observations give clear expla-nation of why GII/GIC ratio for brittle materials is three times that forductile materials. These in-situ observations of fracture also indica-e thadistinctively different damage zone develops ahead of growing cracks formode I and mode II delamination. Two techniques have been developed tomeasure the strain field around a crack tip. Stero-Imaging and direct meas-urement of distortion of a fine array of dots placed on the surface. Bothare effective in measuring the strain field around a crack tip. A surpr.sinresult which emerged from these measurements is that the local strain tofailure at the crack tip is much greater than the elongation measured In atensile test (up to six times as high). A linear, orthotropic finite :Iemenonrin ha- hen uqed to calculate the stress fields around the crack tip ;or
20. DISTRIBUTION/ AVAILABILITY OF ABSTRACT 21 ABSTRACT SECURITY CLASSIFICATION
OUNCLASSIFIEDUNLIMITEO Q SAME AS RPT MOTC USERS UNCLASSIFIED22a NAME OF RESPONSIBLE INDIVIDUAL Z2b. TELEPHONE In/uo. area Code) 22c OF SyV80L
GEORGE K. HARITOS, Lt Colonel, USAF (202) 767-046 NA
OD FORM 1473.84 MAR 83 APR edition may be used until exhausted. SECURITY CLASSIFICATION O1 '"- PAGEAll other editions are obsolete. UNCLASSIFIED
UNCLASSIFIED
(Block No. 19) Continued
mode I and mode II loading. A J-integral approach for mode I has been usedto investigate the delamination of multi-directional composites. Initialresults using this approach look very promising for chacterizing systemswhich can not be characterized with conventional analysis.,

TABLE OF CONTENTS
page
1.0 SUMMARY OF SIGNIFICANT ACCOMPLISHMENTS 12.0 OBJECTIVES 23.0 SUMMARY WORK STATEMENT 34.0 SUMMARY OF ACCOMPLISHMENTS BY AREAS STATED IN 4
WORK STATEMENT4.1 IN-SITU FRACTURE OBSERVATIONS 44.1.1 IN-SITU OBSERVATIONS IN SEM OF FRACTURE OF NEAT 4
RESINS4.1.2 IN-SITU OBSERVATIONS IN SEM OF DELAMINATION 13
FRACTURE OF COMPOSITE MATERIALS4.2 STRAIN FIELD MAPPING 264.2.1 STRAIN- FIELD MAPPING BY STEREO-IMAGING 264.2.2 -STtREO-IMAGING 304.3 ANALYSIS AND MODELING 514.3.1 LINEAR, ORTHOTROPIC FINITE ELEMENT ANALYSIS 52
OF MODE I AND MODE II DELAMINATION4.3.2 MODELING THE EFFECT OF FIBERS ON MODE I 60
DELAMINATION TOUGHNESS4.4 FRACTURE MECHANICS CHARACTERIZATION OF MATERIALS 674.4.1 MODE I DELAMINATION 684.4.2 MIXED MODE AND MODE II DELAMINATION OF COMPOSITE 1074.4.2.1 COMPARISON OF THE END NOTCH FLEXURE TEST AND THE 107
END-LOADED SPLIT LAMINATE TEST FOR DELAMINATIONOF COMPOSITE MATERIALS
4.4.2.2 J-INTEGRAL APPROACH FOR MODE II DELAMINATION 126FRACTURE TOUGHNESS EVALUATION
4.5 FRACTOGRAPHY AND FAILURE ANALYSIS5.0 PUBLICATION RESULTING IN WHOLE OR IN PART FROM 155
WORK SUPPORTED BY AFOSR6.0 PRESENTATIONS MADE THAT WERE BASED ON WHOLE OR 158
IN PART ON WORK PERFORMED UNDER SPONSORSHIP OFTHIS AFOSR GRANT
7.0 PROFESSIONAL PERSONNEL ASSOCIATED WITH RESEARCH 161EFFORT
Appendix I 163Appendix II 167
P _4
or
iti

1.0 SUMMARY OF SIGNIFICANT ACCOMPLISHMENTS
The significant accomplishments from this research
project fall into five areas.
1.1 Real time observations in the scanning electron
microscope have delineated the details of the fracture
processes that result in mode I and mode II delamination of
composite materials. These observation give clear
explanation of why Giic/Gic ratio for brittle materials is
3.0 or larger while for ductile materials it is closer to 1.1
These in-situ observations of fracture also indicate that
distinctively different damage zones develop ahead of growing
cracks for mode I and mode II delamination.
1.2 Two techniques have been developed to measure the
strain field around a crack tip. Stereo-imaging and direct
measurement of distortion of a fine array of dots placed on
the surface have both been found to be effective in measuring
the strain field around a crack tip. One of the surprising
results from these measurements is that the local strain to
failure at the crack tip is much greater than the elongation
measured in a tensile test (48% versus 8% for Hexcel F185).
1.3 A linear, orthotropic finite element code has been
used to calculate the stress fields around the crack tip for
mode I and mode II loading. The relative size and shape of
the stress fields for these two different loading conditions
explains the different sizes and shapes of the
damage/deformation zones see in-situ (as noted in 1.1). A
phenomenological model has been developed to try to explain
1
I
why GIc and G IIc for delamination of a composite material
made from a tough resin are so much lower than the neat resin
Gic.
1.4 A J-integral approach for mode I has been used to
investigate the delamination of multi-directional composites.
A comparison of the end notch flexure test and the loaded
flexure test for measuring G IIc has found that they give
consistent results. A J-integral approach for the
measurement of J IIc for composites made from more ductile
resin has been developed. Initial results using this
approach look very promising for characterizing systems which
previously could not be characterized with conventional
analyses.
1.5 A combination of in-situ fracture observations with
postmortem fractography has clarified some long standing
questions with regard to fractographic interpretation in
failure analysis.
2.0 OBJECTIVES
The objectives of the research program whose results
are summarized in this report have been:
2.1 to better define the deformation and fracture physics
of delamination fracture in graphite/epoxy composite
materials so that realistic micromechanics models of matrix
dominated fracture can be developed; and
2.2 to develop reliable experimental and analytical
techniques to measure mode I, mode II, and mixed mode
2
delamination fracture toughness of both unidirectional and
multidirectional composite laminates to provide meaningful
design parameters and benchmarks against which predictions of
the various micromechanics models may be tested.
3.0 SUMMARY WORK STATEMENT
The following areas of work have been performed to
achieve the stated objectives.
3.1 In-situ fracture studies in a scanning electron
microscope (SEM) have been undertaken to better define the
deformation and fracture processes which accompany mode I and
mode II delamination fracture.
3.2 Two techniques to measure the displacement fields
around crack tips in neat resins and composites from direct
observations made in the scanning electron microscope f ave
been developed and utilized.
3.3 A simple phenomenological model consistent with
observations made in 3.1 and 3.2 which is capable of
predicting the results obtained in 3.4 is being developed.
3.4 Testing and analytical techniques have been developed
for characterizing mode I, mode II, and mixed mode
delamination of split laminates which give very nonlinear
load-displacement curves; e.g. ones made from more ductile
resins and/or split laminates with multi-directional layups.
3.5 The results from the in-situ obseriations of fracture
in the SEM have been utilized in conjunction with post-mortem
fractography to develop a failure analysis methodology.
3

4.0 SUMMARY OF ACCOMPLISHMENTS BY AREAS STATED IN WORK
STATEMENT
4.1 In-Situ Fracture Observations
A summary of significant results will be given in this
section with more complete results and discussion available
in the twelve papers that have been published based on this
work. These papers are listed in section 5.0 with copies of
each in Appendix II.
In this research program, in-situ fracture
observations have been made for both neat resin loaded in
mode I and graphite/epoxy composite materials loaded to give
mode I and mode II delamination. The primary objective of
these observations have been to determine the crack tip
processes that lead to fracture and to relate the size and
shape of the damage zone observed around the tip of a growing
crack to the macroscopically measured fracture toughness.
4.1.1 In-Situ Observations in SEM of Fracture of Neat Resins
In-situ observations of neat resin fracture have been
made on standard 0.5T compact tension specimens (see
ASTM-E3991), except that the thicknesses were typically about
3-4 mm rather than the specified 12.5 mm.
Typical in-situ fracture observations are presented in
Fig. 1 for the relatively brittle resin Hercules 3502 (highly
crosslinked epoxy) and for the much more ductile Hexcel F185
(moderately crosslinked epoxy with 14% rubber added to
4

enhance toughness). The very fine microcracking observed in
these figures is due either to deformation and fracture of
the 150A thick gold/palladium film that is sputter coated
onto the polished surface of the neat resin compact tension
specimens to avoid charging or real microcracking in the
specimen. It has been determined that the film microcracking
begins at about 3-5% tensile strain. (This was done by
coating a rubber band and stretching it in the SEM.) Thus,
the microcracked zone gives some indication of the volume of
material surrounding the crack tip which experiences either
significant deformation (at least 3%) or real resin
microcracking.
F185 Resin--The "butterfly wings" pattern of the
microcrack distribution as well as the very fine scale of
cracking in the in-situ observations of fracture of F185 neat
resin (Fig. 1) indicate this to be only film cracking
resulting from the considerable plastic deformation occurring
in this very ductile resin prior to crack advance. A
comparison of the fracture surface of the F185 observed post
mortem to the fracture surface of the 3502 which fails
brittlely clearly indicates that the F185 experiences a
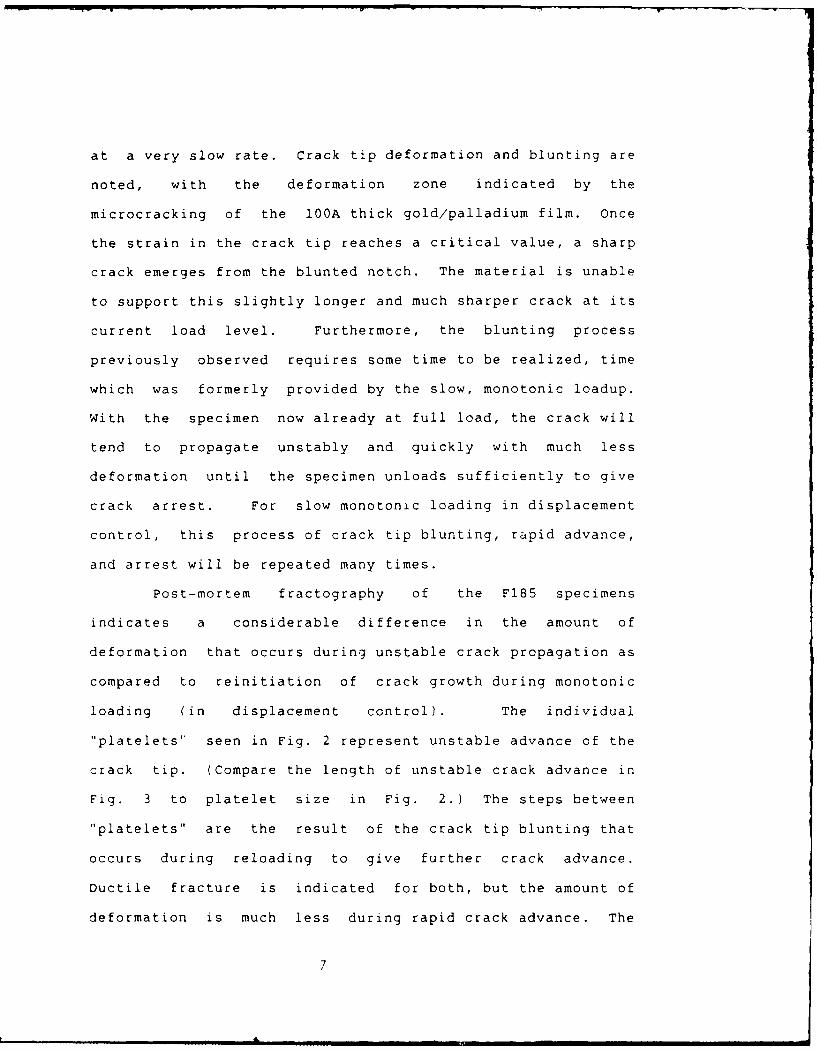
ductile fracture (see Fig. 2). This further substantiates
our contention that the microcracking observed in-situ in the
F185 is coating microcracking due to resin deformation.
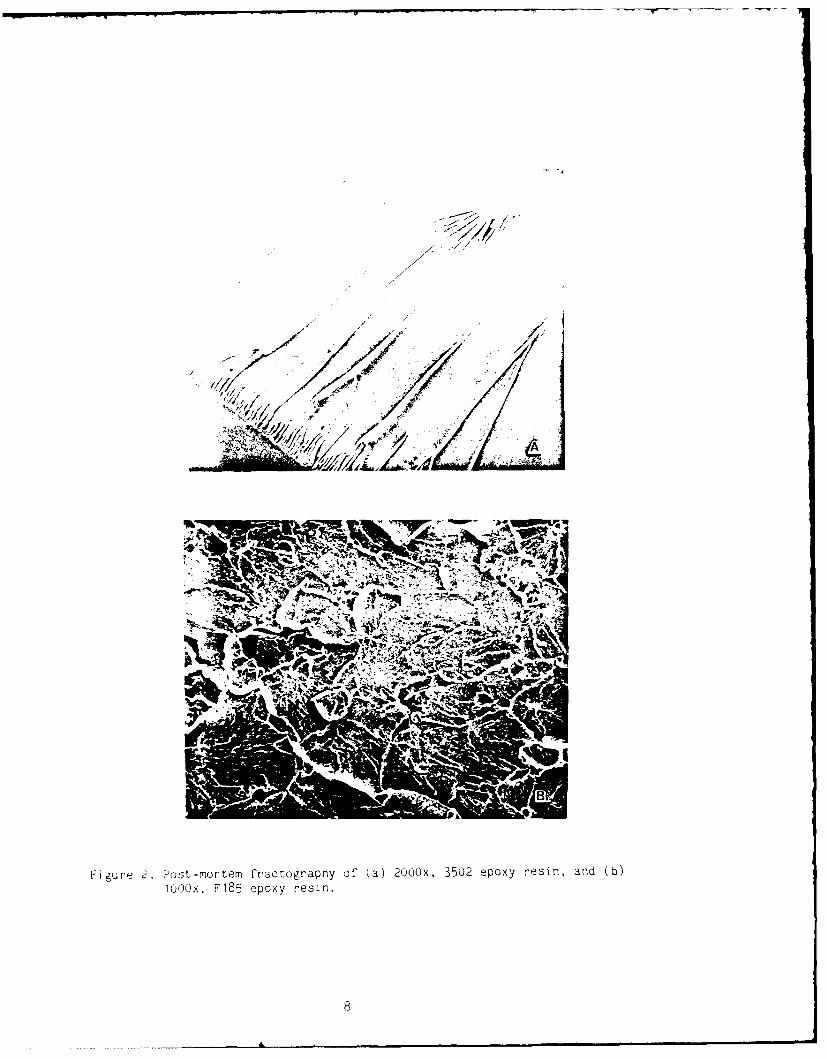
The viscoelastic nature of the Hexcel 185 resin gives
a very discontinuous crack growth behavior, as seen in Fig.3.
The initial loading is occurring under displacement control
5

77
Figure 1. In-situ fracture of (a) 3502 (4300X) and (b)F185(1000X). The white region along the crackis due to charging of uncoated resin, exposedby the fracture process. The point linesespecially evident in the 3502 arc polishingscratches introduced during specimenpreparation.
6
at a very slow rate. Crack tip deformation and blunting are
noted, with the deformation zone indicated by the
microcracking of the 100A thick gold/palladium film. Once
the strain in the crack tip reaches a critical value, a sharp
crack emerges from the blunted notch. The material is unable
to support this slightly longer and much sharper crack at its
current load level. Furthermore, the blunting process
previously observed requires some time to be realized, time
which was formerly provided by the slow, monotonic loadup.
With the specimen now already at full load, the crack will
tend to propagate unstably and quickly with much less
deformation until the specimen unloads sufficiently to give
crack arrest. For slow monotonic loading in displacement
control, this process of crack tip blunting, rapid advance,
and arrest will be repeated many times.
Post-mortem fractography of the F185 specimens
indicates a considerable difference in the amount of
deformation that occurs during unstable crack propagation as
compared to reinitiation of crack growth during monotonic
loading (in displacement control). The individual
"platelets' seen in Fig. 2 represent unstable advance of the
crack tip. (Compare the length of unstable crack advance in
Fig. 3 to platelet size in Fig. 2.) The steps between
"platelets" are the result of the crack tip blunting that
occurs during reloading to give further crack advance.
Ductile fracture is indicated for both, but the amount of
deformation is much less during rapid crack advance. The
7
$77'.7/
7- r -
IK$/r
'sfA6tZi4 A
1I&L WV
~
r x N; )w-*4
'~ r 4Figure 9. Post-mortem fractography of (a) 2000x, 3502 epoxy resin, and (b)
lOQOx, F185 epoxy resin.
S
r
-ok
N. ,
Figure 3. Microcracking anead of crack tip of F185 resin showing crack growthsequence under constant applied displacement. (a) 3000x. Detail ofcrack tip, blunt crack. (b) 9000x. Crack propagation throughmicrocrack coalescence to form a very sharp narrow crack. (c) 5000x.Crack extension occurred. New crack tip is very sharp.
9

fine holes are due to cavitation of the rubber particles
added to the F185 resin to enhance toughness.
3502 Resin--The microcracking in the brittle 3502 is
much more localized around the crack tip, and the observation
of these microcracks in real time indicates that they
coalesce to give macrocrack advance, as seen in Fig. 2. With
a monotonic increase in mouth opening displacement,
microcracking around the crack tip develops which partially
shields the crack tip, reducing locally the crack tip
stresses. However, once these microcracks coalesce giving
local crack tip advance, unstable crack growth follows due to
the presence of the new sharp crack tip without the benefit
of microcrack shielding. Advance proceeds under displacement
control until sufficient unloading occurs that the running
crack arrests. Subsequent quasi-static, monotonic increase
in the mouth opening displacement again causes the formation
of new microcracks surrounding the crack tip, with the
density increasing with mouth opening displacement until
coalescence occurs, again giving additional, unstable crack
extension.
The river pattern seen in Fig. 2 is due to coalescence
with growth of the many microcracks that develop in the
vicinity of the crack tip during quasi-static, monotonic
loading. Once coalescence has occurred, the crack advances
rapidly to the new arrest location, with little opportunity
for new microcrack formation. The river patterns that form
at the arrest lines as well as the almost smooth fracture
10

surface in between arrest lines strongly supports the
scenario just presented for crack growth in brittle resin
systems.
Comparison of 3502 and F185 Resins--The relative
deformation/damage zone sizes seen in Fig. 1 for F185 and
3502 resins may be better understood by comparing the
constitutive behavior of the two materials as determined in
tensile tests, the results of which are presented in Fig. 4.
It is clear that the lower yield strength of the F185 as well
as the much more nonlinear constitutive behavior combine to
give a much larger deformation zone and much greater load
redistribution away from the crack tip, postponing the
fracture event. The result is a much greater resistance to
crack propagation, and thus, a much greater macroscopically
measured fracture toughness.
It should be emphasized that the strain to failure
measured in tensile tests greatly underestimates the local
strain to failure in the crack tip region. For example, the
F185 resin gave 8-9% elongation in a 2.5 cm gage length. By
contrast, the local strain to failure as measured in a 10
micron gage length at the tip of the crack indicated 48%
strain (as will be explained in more detail in section 4.2 of
this report). In similar fashion the tensile elongation in a
2.5 cm gage length of 3502 resin was only 1.5% whereas the
elongation measured in a 10 micron gage length at the tip of
a mode I delamination crack was 15%. However, to the degree
that crack tip strain to failure is some constant times the
1i
i 4 ml ~

ci0
00
00
C0 tLo
00
L()~ i D
1~ 12

tensile elongation, or more likely times the nonlinear
component of the tensile elongation, tensile data may still
be useful to rank resins, though the tensile elongation would
obviously not be a useful fracture parameter in a
micromechanics model.
4.1.2 IN-SITU OBSERVATIONS IN SEM OF DELAMINATION FRACTURE
OF COMPOSITE MATERIALS
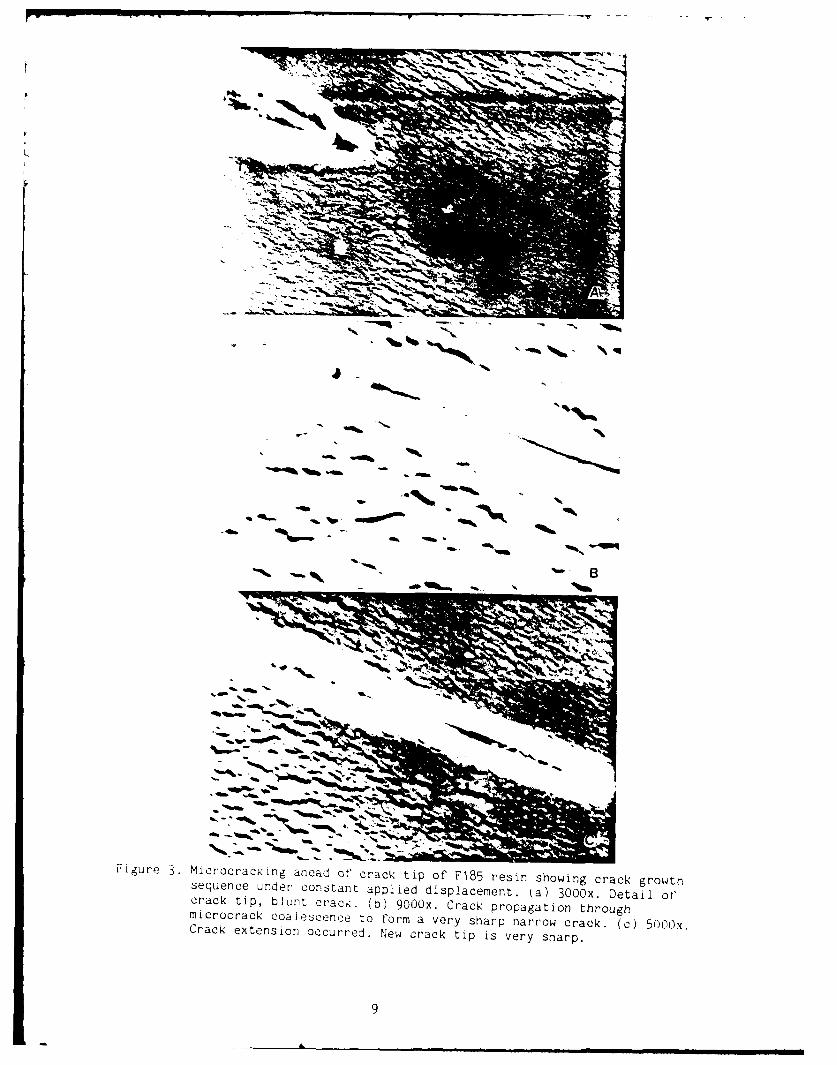
Direct observation of the delamination fracture
process in composite materials allows one to determine the
micromechanical processes responsible. For example,
delamination crack growth may occur by interfacial debonding
or by resin cracking, as seen in Fig. 5. Furthermore, the
size and shape of the deformation/damage zone is seen to be
quite variable, depending on both the resin toughness and the
state of stress (i.e., mode I, mode II, or mixed mode).
Figure 6 presents in-situ fracture observations of the
deformation/damage zone sizes for mode I and mode II
delamination fracture of brittle AS4/3501-6. The extent of
the damage zone ahead of the crack tip is much greater for
the mode II loading than for the mode I loading. A much
slower decay in the stress field ahead of the crack tip (to
be reported in section 4.3 of this document) for mode II
loading than for mode I loading is responsible for the
difference in the respective damage zone sizes.
The deformation/damage zone for mode I and mode II
delamination fracture of the much more ductile T6TI45/FI85 is
13
IL-MI~
WWii&
Figure 5 Crack extension by resin fracture andinterfacial debond are seen in threecomposites made with ductile resins. (a)AS4lQ6, Dow Chemical (llOOX)l; (b)T6T145/Fl85, Hexcel (lOQOX), and (c)T6145/F155, Hexcel (1200X).
14

seen in Fig. 7. It is obvious that the deformation/damage
zone for both mode I and mode II delamination of the
T6TI45/FI85 is much greater than that observed in the more
brittle AS4/3501-6. A schematic representation of the
relative damage zone sizes for these two composite systems,
loaded in mode I and mode II, is seen in Fig. 8.
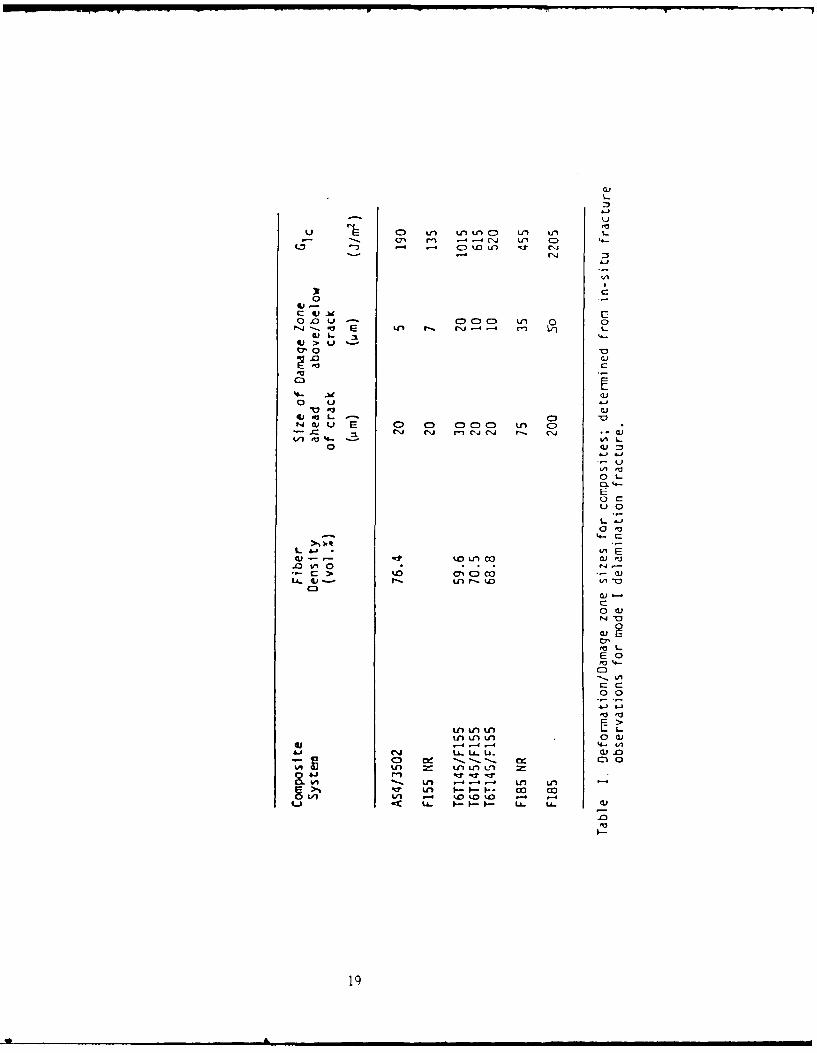
The deformation/damage zone size has been measured for
several systems and an effort has been made to see how the
size of the deformation/damage zone correlates with the
delamination fracture toughness. The results are presented
in Table 1. In general, larger deformation/damage zone sizes
correlate with higher delamination fracture toughness;
however, the correlation is not monotonic.
Micromechanisms of Mode I Delamination--The details of
the fracture process have also been noted during in-situ
observations of fracture. In most systems studied, mode I
crack advance occurs after the development of a
deformation/damage zone ahead of the crack tip. In brittle
systems, this zone consists of microcracks which coalesce
with each other and the macrocrack to give crack advance.
Sometimes, crack advance occurs by debonding before
microcrack coalescence occurs. When this takes place, fiber
bridging and fiber breakage will be observed. In ductile
systems, local deformation around the crack tip preceeds
crack advance, but with no true specimen microcracking, only
the superficial coating cracks which are indicative of large
deformation. Crack advance generally occurs by ductile
15

17A
M"1
Figure 6. Damage zones ahead of the crack tip of AS4/3501-6 under (a)mode I loading, and (b) mode 11 loading.
16

-PAN- .
Figure 7. Damage zone ariead of crack tip or T6TI45/'FI85 under (a) 750x, modeI loading. (b) loGox, mode 11 iodding. (c) TOON, mode 11 loading.
17

15 wn
__________ 270 sf
CrackTip
F185 2 6 45F8mode (840 J/mmode 1 (2200 J/w2 j
1od1I (2400 J/M.
100 IJm
CrackTip
Figure 8. Schematic of relative damage zone sizes for mode I and mode II. (a)3502 neat resin and AS14/3502 composite. (b) F185 neat resin andT6T14c5;.Fl85 composite.
18
u C) tLn n Ut(D U-) 1)-
-, u - C:) C) C) n
0jo -
cur CC
4J-L -I atm 2 LM C Lco u
o 0
C3C
00a
4C
E
C)
0
tn U") Ln L
tA- U- U. cu .
C3 ~ ~ ~ ~ . 4.J-1 - C
I- .n-4 .- 4 4- V(
-t 11( CC) Lfo
191
0.

tearing, but crack advance by interfacial debonding was also
commonly observed in composites made with more ductile
resins.
Micromechanisms of Mode II Delamination--Mode II
delamination of brittle systems occurs in a very distinctive
way. Microcracks form for a considerable distance ahead of
the crack tip at a 450 angle to the plane of the ply, which
is the plane perpendicular to the principal normal stress.
These cracks grow until they reach the fibers which bound the
resin rich region between plies. It sometimes appears that
they stop in the resin short of the nearest visible fiber
(see Fig. 6, for example). However, there are certainly
fibers just beneath the surface which are responsible for
arresting these growing microcracks. Coalescence of these
microcracks is required for macrocrack advance. This
coalescence generally occurs at the fiber/matrix interface,
giving a corrugated roof appearance along with the formation
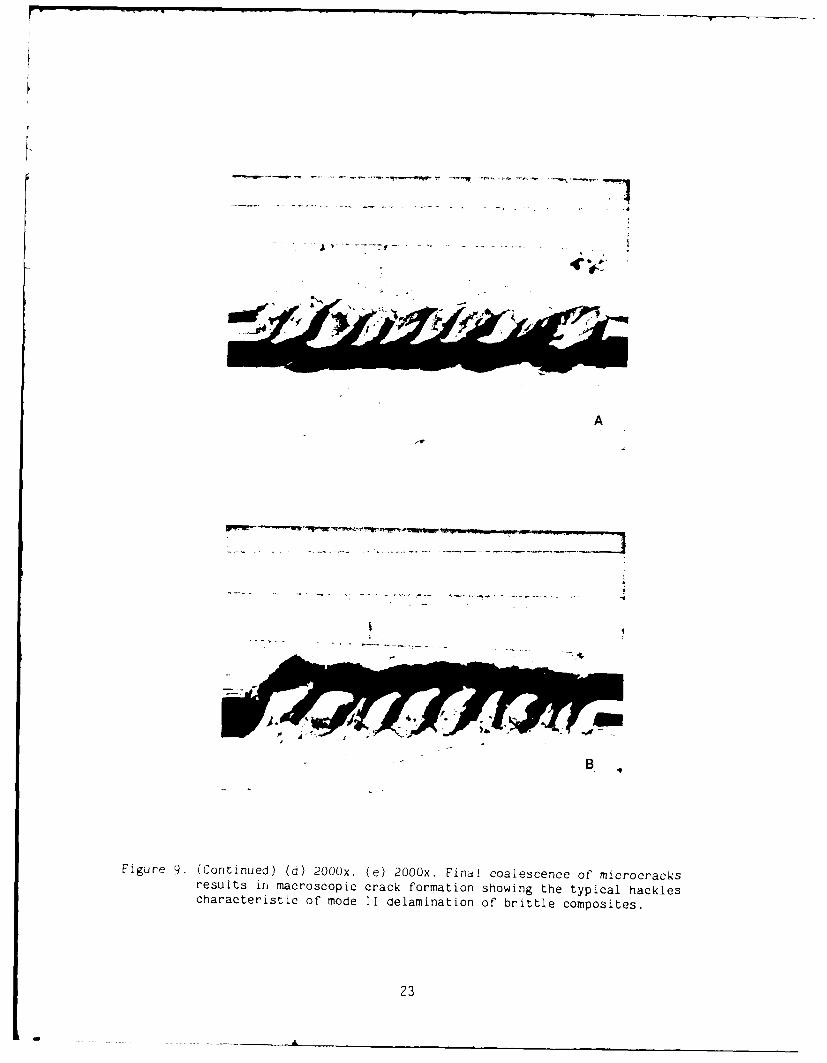
of "hackles" in the resin between fibers, as seen in Fig. 9.
It is apparent that the final orientation of the microcracks
and the resulting hackles is greater than 450. This is a
result of the fact that hackles aLe often rotated into a more
nearly upright position by the mode II loading prior to final
microcrack coalescence, as shown schematically in Fig. 10.
It has been noted by several investigators (e.g., Bradley and
Cohen 2 ) that the G iIc/G ic ratio for delamination of
composites made with brittle resins is typically 3 or
greater. This is understandable when one considers the
20

following factors: (1) a much more extensive damage zone
ahead of the crack tip; (2) the greater difficulty in getting
microcrack coalescence; (3) the more torturous path taken by
the crack; and (4) the much greater evidence of crack
interaction with the fibers via the microcracks which form
and arrest temporarily at the fibers.
Mode II delamination of the more ductile T6T145/F185
gave no evidence of resin microcracking. Rather, only a very
fine coating cracking was noted (see Fig. 7), indicating
resin deformation. Thus, the fracture process for mode II
delamination (like that for mode I delamination) appears to
be ductile rupture, with occasional fiber debonding. Thus,
it is not surprising that the Giic/'Gic ratio for delamination
cf composites made with ductile resins is approximately 1.
Mixed-Mode Delamination--A series of mixed mode
lelamination experiments were run in which the percentage of
mode 1I energy release rate, Giic, was systematically varied
from 0% to 100%. These tests were performed on several resin
systems. Where the brittle AS4/3502 was used, the density of
the hackles as well as their orientation relative to the
delamination planes were found to increase with increasing
percentage of mode II loading, as seen in Fig. 11. The total
critical energy release rate was also found to monotonically
increase with increasing percentage of mode II energy release
rate, as seen in Fig. 12 for composites made with brittle
resins. No such systematic variation in either fracture
surface appearance or critical energy release rate was noted
21

A n 6itj and post mortem fractography of AS4L 3502 under mode 11lelamination. (a) 3000x. Microcrack formation at 45 degrees followedby opening of microcracks. (Ib) 3000x . Microcrack coalescence.(c, 3i7Q.Microcrick coalescence with rotation at root of hackles.
22
,-71
Figure 9. (Continued) (d) 2000x. (e) 2000x. Find I coalescence of microcracksresults in macroscopic crack formation showing the typical hacklescharacteristic of mode 11 delamination of brittle composites.
23

AA
Figure 9. (Continued). Post-mortem fractography showing the highly hackledfracture surface. M 1000x. (g) 1000x. (h) 2000x.
24

Principal normalstress plane 1 /
Resin richFiber I ///// / 1(1/ -reqion between
'''//J /11/ plies
(a) Mcrocrackinq ahead of macroscopic crack
Resin richFiber reqion between
plies
(b) Microcrack coalescence (microcracks beqinto open up first)
Resin richFiber reqion between
plies
(c) Final microcrack coalescence is accompaniedwith hackle rotation at the root of the hackles.
Fiqure 10. Schematic of mode II delamination crack formation(hackle formation process).
25

for the ductile T6TI45/F185 as the percentage of mode II
loading was increased.
While most of the laminates studied in this work were
unidirectional layups, a few multi-directional layups were
also investigated. Typical results for mode I delamination
of a specimen containing ±451 plies across the delamination
plane are seen in Fig. 13.
4.2 Strain Field Mapping
In the previous section, the physical details of the
mode I and mode II delamination fracture process as
determined by direct, real-time observations in the SEM were
summarized. It was decided early in this program that
quantifying the strain field around the crack tip would be
essential to assist in the development and verification of
micromechanics models. Two different approaches were taken
to try to achieve this objective: (1) the stereo-imaging
approach developed for metals by Davidson and Lankford at
Southwest Research Institute and (2) the direct measurement
of the distortion of a dot pattern placed on the surface with
the electron beam of the SEM. These two approaches will be
explained and results from each presented next.
4.2.1 Strain Field Mapping by Stereo-Imaging3-5
Recent works by Davidson and Lankford have
described a method of accurately determining the in-plane
displacements and strain fields developed during the
26

Figure 11. Hackles increasing in orientation with increasing mode II loadingof AS4i/3501-6. (a) 1500x. 0% mode II (mode 1). (b) 10000x. 20% mode11. (c) 2000x. 43% mode 11. (d) 3000x. 100% mode II.
27

0
0
-E
()
Ln coIC0 Co )
LOL
LL I) ZIC) 3 -
(0
00
Cl Lr)
0- NC14~ W-
(.zw/o

Flgure '.Mu~tiaxia. idyup ieiainination at' F155 composite system. (a) l0Ox.
deformation of a specimen. The technique involves
photographing the crack tip region of the specimen both
before loading and while loaded, and then using
stereo-imaging to determine the displacement field. The
in-plane strains are then calculated by differentiating this
displacment field. The advantage of this technique is that
high-resolution strain field maps can be obtained for any
level of loading, including loading that produces nonlinear
deformation around the crack tip.
Previously this experimental approach has only been
utilized to determine the strain field around the crack tip
3-Sof metals subjected to fatigue stressing In this study,
similar stereo-imaging techniques have been developed to
examine the strain fields associated with delamination in
graphite/epoxy composites. Stereo-photograph pairs (one of
the loaded specimen, a second of the unloaded specimen) of a
delamination crack tip for both mode I and mode Ii loading
conditions are made in a scanning electron microscope (SEM).
From the displacement and strain field maps generated, the
effects of macroscopic loading as well as the cole of fiber
constraint on the deformation and resin yielding in the
region of the crack tip were examined. All data reduction
routines used in the strain field analysis were performed on
an Apple Computer.
4.2.1.1 Stereo-Imaging
We perceive three dimensions, or depth of field,
30
because our eyes view our surroundings from slightly
different angles. The apparent position of foreground
objectives relative to the distant background seen from one
eye is slightly displaced from that seen through the other
eye. As the brain melds these two images into one, it takes
note of the relative displacements of the foreground objects
and interprets it as depth.
In determining the in-plane delamination
displacements, an area well ahead of the crack tip in an
unloaded specimen is photographed, ensuring an unloaded
reference condition. The specimen is then loaded and the
crack allowed to grow into the field of view, which is
subsequently rephotographed. In the second case, due to the
loading, localized deformation in the crack tip region will
appear as displacements relative to the surrounding
unstrained regions, as captured in the photograph of the
specimen prior to loading. When the two photographs are
observed in a stereoscope, these relative surface
displacements are perceived are as relief in the out of plane
or Z-direction. It is noted that a state of triaxial
displacement may exist at the loaded crack tip, but only the
in-plane displacement can be observed using this technique.
4.2.1.2 Experimental and Analytical Procedures
The graphite-epoxy systems examined in this study were
Hercules AS4/3501-6 and AS4/DOW P-7. These resin systems
were selected because of theiL differences in ductility and
31
interfacial adhesion strengths. The Hercules AS4/3501-6
system consisted of a brittle resin (GIc = 70 Jim 2 ) along
with unsized fibers, resulting in a composite delamination
2 2toughness of G Ic - 140 J/m and G IIc = 634 J/m The AS4/Dow
P7 system used sized fibers with a tougher Novolac resin,
modified to increase both toughness and resin/fiber adhesion,
resulting in a composite delamination toughnesses of G =
2 2340 J/m and Gi c - 862 J/m
Small (25 mm x 11 cm), undirectional double cantilever
beam specimens, 14 plies in thickness, were cut from cured
laminate panels of the two systems. A thin 0.03 mm teflon
sheet inserted at one edge during the layup of the laminate
panels before curing provided a starter crack between the
mid-plies. Delamination loading of the specimens within the
SEM was accomplished by using a tensile stage. Mode I
loading was achieved by driving the precracked portion of the
specimen onto a fixed wedge (see Fig. 14). The wedge was
sufficiently blunt to ensure that it remained well behind the
crack tip. A three point bend fixture was used to provide
pure shear or mode II loading at the crack tip (see Fig. 14).
For neat resin testing, compact tension specimens of
1size 1T were used as per ASTM E399 , except that the
thickness was 3-4 mm instead of the 12.5 mm prescribed by the
standard. The same loading fixtures were originally used for
the in-situ fracture observations reported in section 4.1 of
this report.
As described before, an area well ahead of the crack
32

tip was photographed, and then rephotographed after the crack
was allowed to grow into the field of view, representing the
unloaded and loaded conditions respectively. These
photographs were than viewed with a TOPCON stereoscope. A
1/4-inch reference grid is marked on one photograph to enable
the location on the specimen to be identified. A parallax
bar is then used to measure the apparent height (Zx) of the
surface at each of the points of the reference grid. A
reference point far ahead of the crack tip outside of the
deformation zone is selected to provide a reference point
(RP) of zero displacement (see Fig. 2). Displacement (Dx) is
calculated at each point on the reference grid using a
standard stereo imaging analysis by the following5
relationship
Dx = (1/M) (dP)/(P+dP) (1)
where M is the photographic magnification, dP is the
difference in the parallax bar measurement at a given point
on the reference grid minus the parallax bar measurement at
the reference point (Zx-RP), and P is the average separation
between the conjugate center and conjugate principal points
for the two pictures used in the stereo pair. A more
complete discussion by Avery 6 of this technique is available.
Since only displacements along the eye axis can be
observed in the stereoscope, the photographs must be rotated
90 degrees and the procedure repeated to obtained the
Y-direction displacements (Dy). Additional details may be
found in a soon to be published dissertation by Hibbs.
33

L
6'GE ESPECIMTEN
P
SPFCTMEN
LP
Figure (a) Schematic of mode i aelamination of scanning electron of
microscopy specimens. (b) Schematic of mode II delamination
of scanning electron microscopy specimens. (c) Schematic of mode
I fracture of scanning electron microscopy CT specimens.
34

AA
STEREOSCOPE
UNLOADED LOADED
APPEARSHIGHER
Xo - X CRACK
CRACK X0+X
APPEARSLOWER
Xo
REMOTE POINT
I:,r e 4 d. heliative displacement of points near the crack tipresulting from the loading of the specimen. When view with astereoscope these relative displacements are seen asvertical relief. The point x. is selected far ahead of thedeformatior zone and is used as a reference point of zerod'spacement.
35

4.2.1.3 Experimental Results
Results for mode I loading of the AS4/Dow P7 system
and mode II loading of the AS4/3501-6 system will be
presented in this report with more extensive results to be
presented in Michael Hibbs' dissertation.
Mode I Displacement and Strain Fields--The
unloaded/loaded stereo pair for the AS4/Dow P7 composite
system loaded in mode I conditions is given in Fig. 15. To
show the displacement field more clearly, the displacement
vectors as determined from the photographs in Fig. 15 using
the TOPCON stereoscope are represented graphically in
Fig. 16. The displacement field is not symmetric about the
crack tip. This probably results from asymmetric constraints
due to the asymmetric distribution of fibers on either side
of the plane of the crack. The maximum displacements are
seen to be approximately 0.25 microns. At the crack tip the
loading is shown to be essentially pure mode I.
The resulting strain field seen in Fig. 17 shows that
the maximum shear strain is for the most part confined to the
resin rich area between the fibers, with a maximum of about
20% strain at the crack tip. A more ductile resin would be
expected to have deformation outside the resin rich region
between plies. with increasing distance ahead of the crack
tip, the magnitude of the strain decreases, reaching a value
of 7% strain at a distance of 33 microns. It is interesting
to note that the tensile elongation measured for this
36

unloade6 loaded
Figure 15. The unloaded loaned stereo photographs of' the compositeAS24 Dow P7 loaded in mode I conditions. (1000X)
37

-0 0
-
-rE
4- C.)
38
relatively brittle resin is less than 2%. We should hasten
to add that the indicated crack tip shear strain of 20% is
not true resin strain because of the fine microcracking that
develops in the crack tip region. The true resin strain
would be less. Nevertheless, displacements due to resin
deformation and microcracking combine to give deformation
shear equivalent to 20% strain.
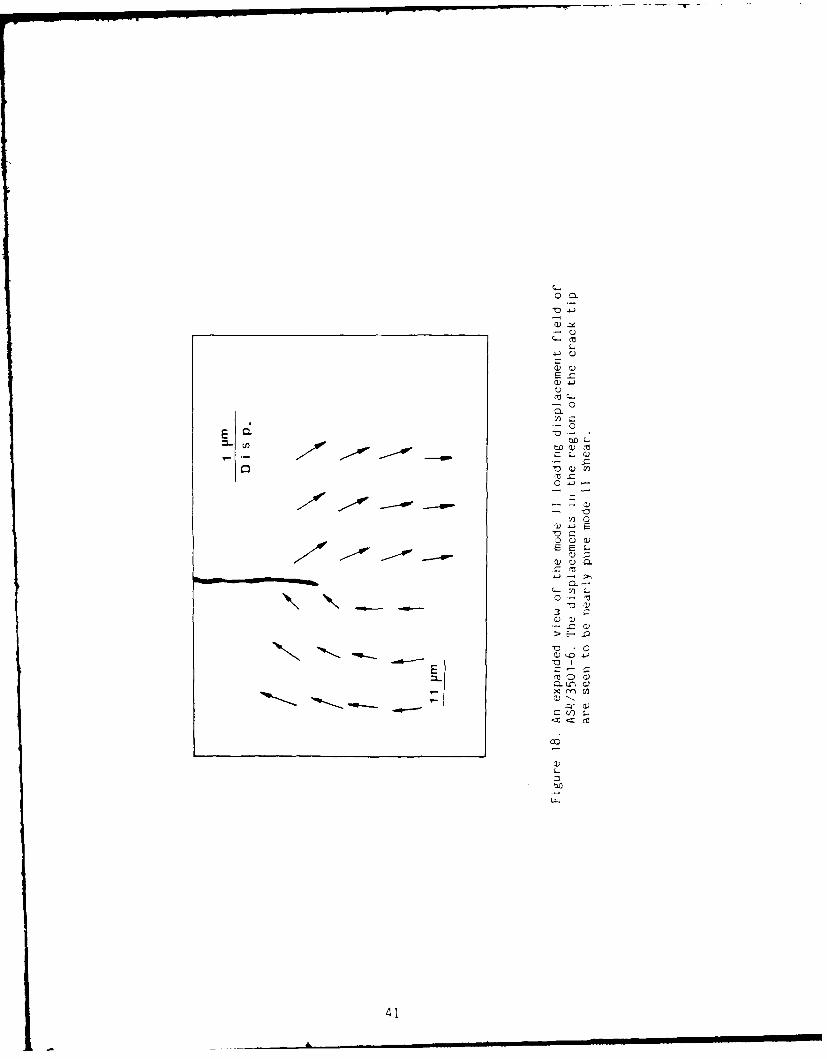
The displacement field that results for mode II
loading of AS4/3501-6 is given in Fig. 18, where a symmetric
displacement field with essentially pure mode II loading at
the crack tip is seen. In this field, the magnitude of the
displacements are on the order of 0.75 microns.
The resulting strain field (Fig. 19), as in the case
for the mode I loading of the Dow P7 system, is seen to be
confined in the resin rich region between the fibers, again a
result that would not be true for a composite made with a
more ductile resin. A maximum shear strain of approximately
100% occurs at the crack tip, with a very slow reduction in
magnitude with increasing distance ahead of the crack tip.
At the edge of the observed field, 33.0 microns ahead of the
crack tip, the magnitude of the shear strain was still 85%.
It is difficult to see how a composite with such a
brittle resin as the AS4/3501-6 could have such a large local
strain to failure until one recognizes that most of the
measured displacements are (as was the case for mode I) due
to extensive microcracking, hackle formation, and hackle
rotation. These can be seen in Figs. 6,9 and 10 in section
39

4J
M Q) C-)
0.
F=
cc '3 (v =-
4--) o -
0 CL
0 ' 0 C.
-Z 0 (, V4)
< EX
40
.-
0 C.
ca.
- o
bn 0• o
EE
0 .-.
S(1)
ID
41v
'0*
x '.0 V)
CZ 0)
0.Li 0
41

0 W )
0 rM C) - C)g.w
cu I
C E
E) o
IV 7j .
00 -0 E)
-- ) V)--- C"t m
0 .-n*
x)-0~~C
MEQ
42.c~C

4.1.
These results for the strain field for mode I and mode
II delaminaticn are consistent dith the observations of
deformation/damage zone size previously reported in 4.1 and
will be seen later in this report (section 4.3) to be
qualitatively consistent with finite element calculations of
the strain field decay ahead of a crack for these two loading
conditions.
4.2.2 Direct Measurement of Strain Field Using a Dot Pattern
The purpose of this study has been to develop a
technique which would permit the direct measurement of the
strain field around a crack tip with sufficient resolution to
make a comparison of the fields for cracks in neat resin
versus delamination cracks in composites made from the same
resin. The approach used has been to burn a very fine array
of dots onto the polished surface (perpendicular to the plane
of the crack) of a specimen using the electron beam in a
scanning electron microscope. The exact coordinates for each
of these points are determined before and after loading the
specimen, allowing the determination of the displacement of
each point. This displacement f'eld may then be
differentiated to give the strain field around the crack tip.
4.2.2.1 Experimental Procedure
With considerable trial and error, a technique has
been developed to burn a very systematic dot pattern onto the
43
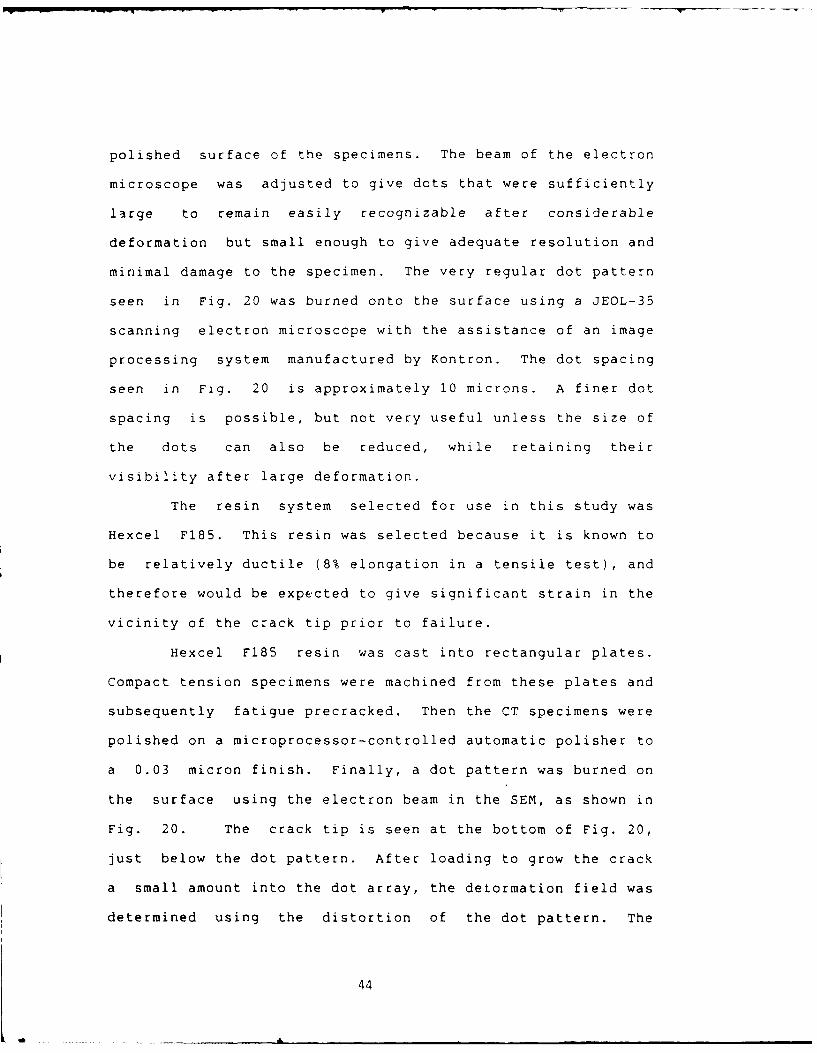
polished surface of the specimens. The beam of the electron
microscope was adjusted to give dots that were sufficiently
large to remain easily recognizable after considerable
deformation but small enough to give adequate resolution and
minimal damage to the specimen. The very regular dot pattern
seen in Fig. 20 was burned onto the surface using a JEOL-35
scanning electron microscope with the assistance of an image
processing system manufactured by Kontron. The dot spacing
seen in Fig. 20 is approximately 10 microns. A finer dot
spacing is possible, but not very useful unless the size of
the dots can also be reduced, while retaining their
visibility after large deformation.
The resin system selected for use in this study was
Hexcel F185. This resin was selected because it is known to
be relatively ductile (8% elongation in a tensile test), and
therefore would be expected to give significant strain in the
vicinity of the crack tip prior to failure.
Hexcel F185 resin was cast into rectangular plates.
Compact tension specimens were machined from these plates and
subsequently fatigue precracked. Then the CT specimens were
polished on a microprocessor-controlled automatic polisher to
a 0.03 micron finish. Finally, a dot pattern was burned on
the surface using the electron beam in the SEM, as shown in
Fig. 20. The crack tip is seen at the bottom of Fig. 20,
just below the dot pattern. After loading to grow the crack
a small amount into the dot array, the detormation field was
determined using the distortion of the dot pattern. The
44

displacement field and the associated strain field were
determined using the image processing system in conjunction
with a computer program written to numerically differentiate
the displacement field data.
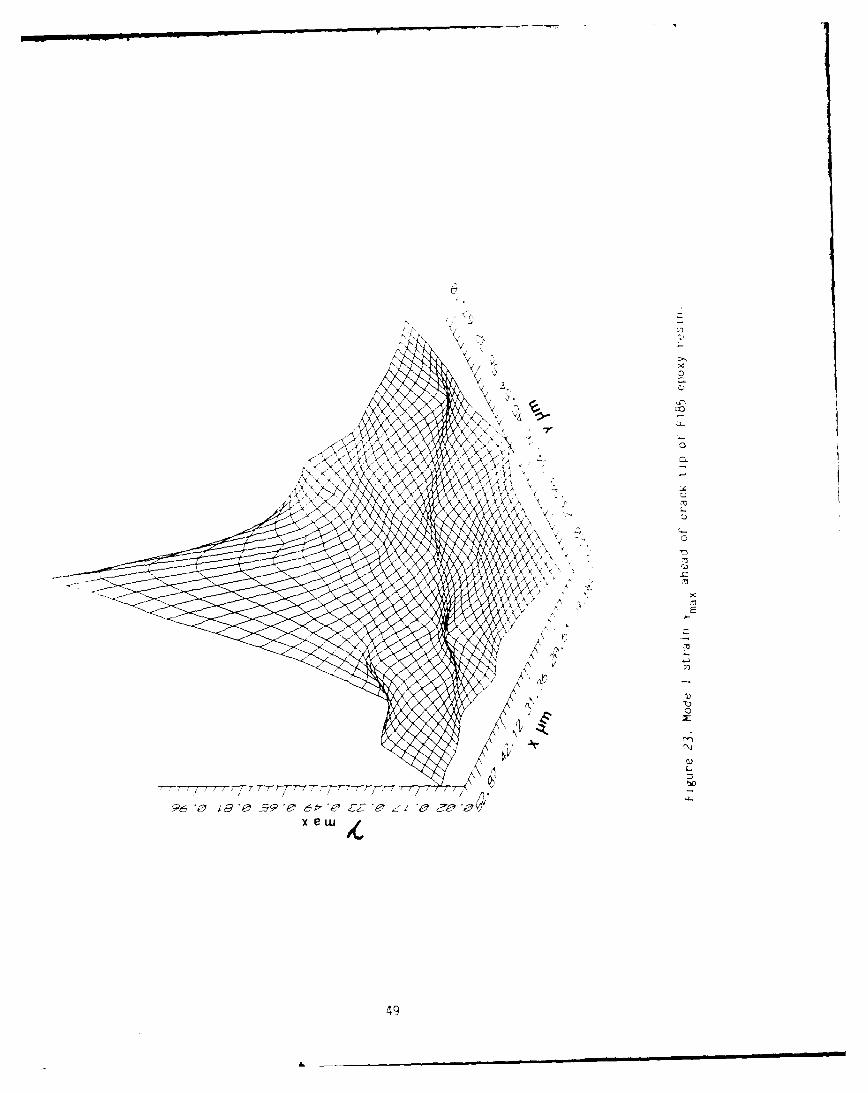
4.2.2.2 Results and Discussion
The results are presented in Figs. 21-23. The normal
strains as well as the principal shear strain are seen as a
function of x-y coordinates. The crack tip has coordinates
of y-5 7 .48, x-59.14. The compact tension specimen was loaded
in the x-direction with crack growth in the x-direction.
It should be emphasized that the three dimensional
plotting routine used to present the results graphically does
local smoothing prior to plotting. The polynominal curve fit
for the smoothing operation interpolates as well, giving a
much finer grid in the graphical results than was actually
used on the specimen surface. (Contrast actual grid size,
Fig. 20, to grid size seen in the three dimensional plots,
Figs. 21-23.)
The strain at yielding in F185 as measured in a
tensile test is about 1.2%. Thus, the region of nonlinear
deformation around the crack tip is seen to be quite
extensive. If it is remembered that carbon fibers typically
have diameters of about 7 microns, then the nonlinear
deformation zone would extend to at least five fiber
diameters above and below the plane of delamination if the
composite has a similar strain field around the tip of a
45
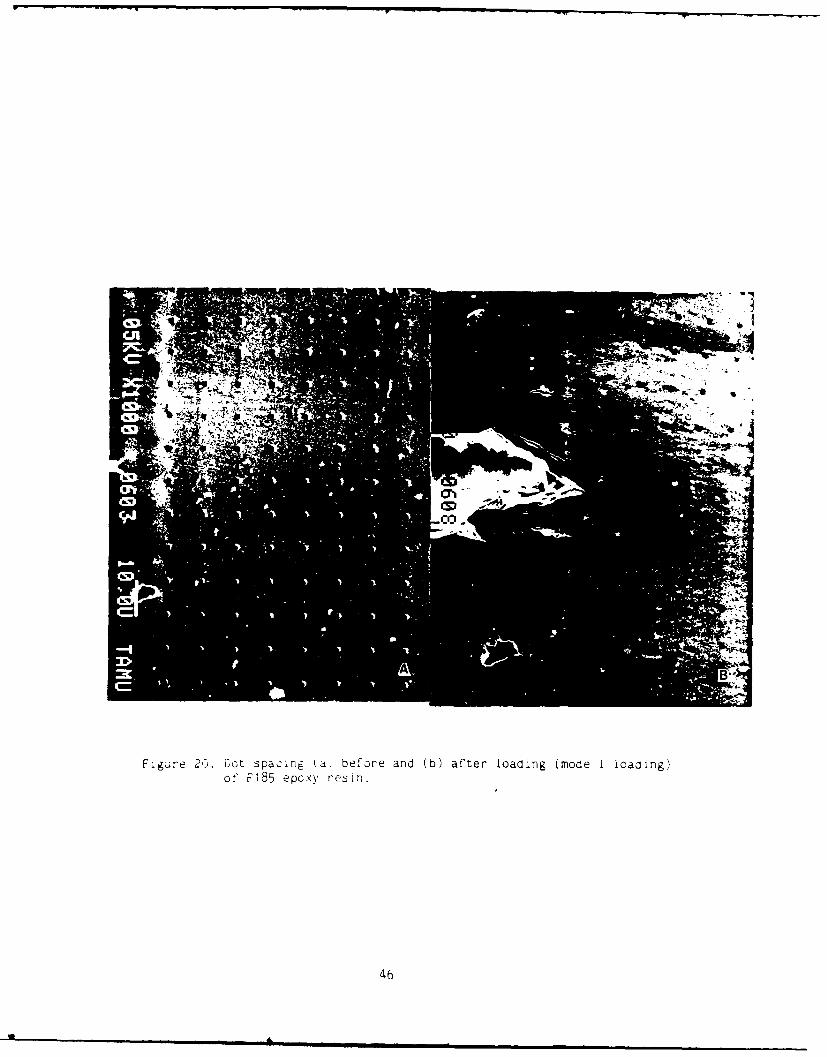
Fig ;re 26. Lot spacing (a) before and (b) after loading (mode I loading)of F185 epcx' resin.
46

00
Ix,
Y i)
Ax V~ ~
470

0~
Y ~
AC'-C)
V -~
Y -~ C
V --
V
C)
C)
C-0
C)
~
N ~
C)
E
C)
xx a
48
0
17
49-

growing delamination crack to that observed in Figs. 21-23
for the F185 neat resin. A qualitative indication of a
deformation zone of this size in a delaminating T6T145/F185
composite, is seen in Fig. 7 (section 4.1) and has previously
2been noted by Bradley and Cohen
A second important observation concerns the magnitude
of the local strain at the crack tip. The elongation
measured in a tensile test of F185 is 8%, with no apparent
necking. Thus, one might have assumed for micromechanics
modelling that the local strain to failure would be 8%, or
possibly less due to the effects of constaint. However, it
is clear that the tensile elongation greatly underestimates
the true local strain to failure at the tip of a growing
crack in F185. The measured value of 48% should be
considered a lower bound since it is measured over a 10
micron gage length at the crack tip in a very steep strain
gradient and would increase to an even higher value as crack
advance caused ductile fracture. The critical value for
local strain to failure for delamination crack growth is
probably somewhat lower than the value for crack growth in
the neat resin measured here due to debonding and constraint
produced by the fibers. Comparable results for crack growth
in a delaminating T6145/F185 composite were not available at
the time of the preparation of this report but should be
available soon in the new grant period.
One concern that should be mentioned is the question
of whether the surface strain measurements are in any way
50

representative of the bulk strain distribution. In materials
where cavitation or microcracking does not occur, one would
expect a significant difference between the strain
distribution for the plane-stress state of stress that exists
at the surface and the strain distribution that would exist
for the more nearly plane-strain state of stress in the bulk.
However, F185 with rubber particle toughening does cavitate,
relaxing the through-thickness stress. Thus, for this system
we believe the surface strain distribution is representative
of the bulk strain distribution.
Direct comparison of results from stereo-imaging
with results based on dot pattern distortion will also be
available soon under the new contract.
4.3 Analysis and Modeling
Analysis and modeling have been used in two ways to
better understand the experimental results of sections 4.1,
4.2, and 4.4. First, the very different size and shape of
the damage zone for mode I loading compared to mode II
loading has been studied using a finite element analysis in
which the constitutive relationship for a linear, orthotropic
continuum is assumed. While ignoring the details that would
be treated explicitly in a micromechanics model, this
approach has been quite successful in accounting for the
major distinctives between mode I and mode II delamination.
Second, a simple model has been proposed to account for the
observed differences in neat resin toughness compared to mode
51

I delamination toughness for composites made with ductile
resins. The results of these two areas of investigation will
be presented in this section.
4.3.1 Linear, Orthotropic Finite Element Analysis of Mode I
and Mode II Delamination
In this investigation, the stress fields ahead of the
crack tip of a split laminate specimen loaded to give mode I
delamination and mode II delamination have been determined by
means of a finite element analysis. The results are compared
to the observed damage zones developed ahead of the crack tip
for the same loading conditions, as reported in section 4.1.
A comparison with the direct strain field measurements of
section 4.2 is made.
4.3.1.1 Materials and Methods
The determination of the stress field ahead of the
crack tip of the split laminate specimen loaded under mode I
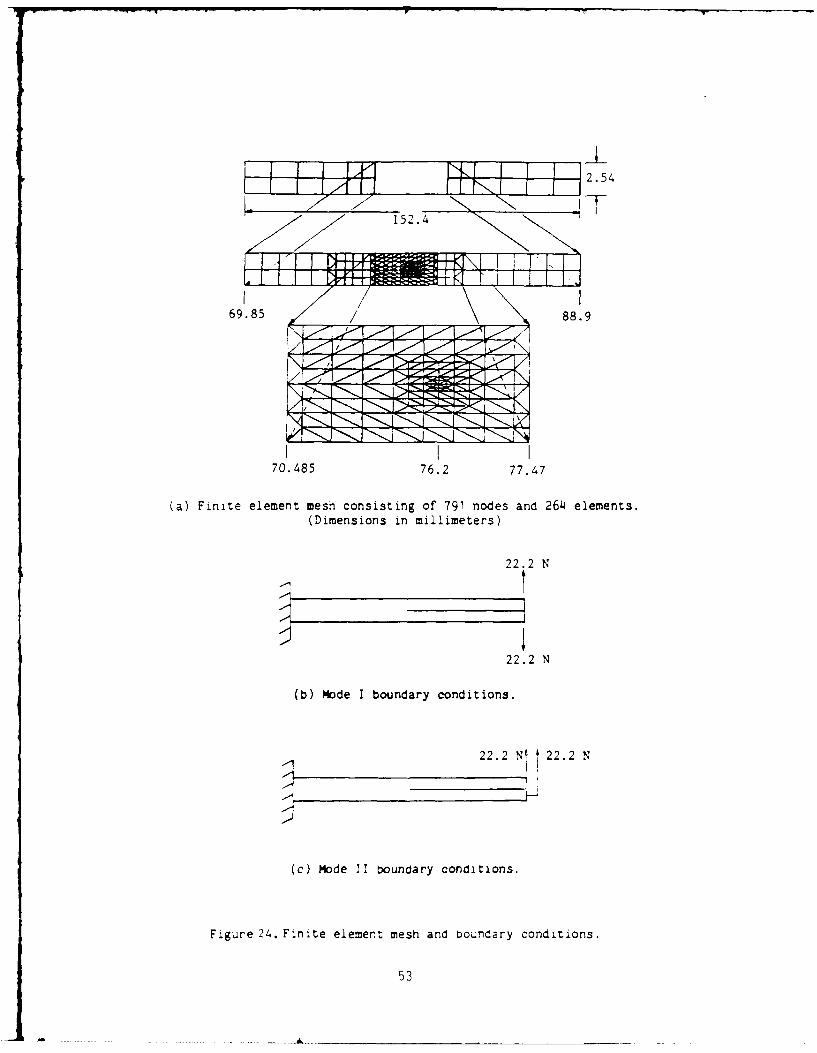
and mode II was accomplished by first generating a two
dimensional mesh 152.4 mm long by 2.54 mm thick consisting of
791 nodes and 294 elements as shown in Fig. 24a. Triangular
six-noded elements were used around the crack tip with
7mid-side nodes displaced to the quarter point 7 , and a
substantial refinement of the mesh around the crack tip was
made to overcome the difficulty imposed by the stress
singularity present at the crack tip This linear
orthotropic analysis has been made with a finite element
52
F1U I I T I - 2 .
77-
z z 12.54
L I IIL-. -I
69. 85 88.9
70.485 76.2 77.47
(a) Finite element mesh consisting of 791 nodes and 264 elements.(Dimensions in millimeters)
22.2 N
22.2 N
(b) Mode I boundary conditions.
22.2 N1 22.2 N
(c) Mode II boundary conditions.
Figure 24. Finite element mesh and boundary conditions.
53

8
algorithm developed by Henriksen The algorithm is based on
a nonlinear code updated with Lagrangian formulation using
six and/or eight noded isoparametric elements with two
degrees of freedom per node. Elastic constants for a
unidirectional laminate of AS4/3502 graphite/epoxy composite
9to be used in the analysis were obtained from Hercules
Mode I loading was simulated by applying a symmetric
load at the cracked end of the mesh as shown in Fig. 24b.
Mode II loading was introduced by asymmetrically loading the
cracked end (see Fig. 24c). The load level applied
corresponds to approximately the load at onset of crack
growth for these two modes of failure, as determined from
experimental measurements in combination with beam linear
beam theory. 10 Stresses were obtained and were plotted as a
function of distance ahead of the crack tip.
4.3.1.2 Results and Discussion
Figures 25 and 26 show the finite element results for
both mode I and mode II loading. Figure 25a is a Syy
(normal) stress contour plot from the vicinity of the crack
tip for mode I loading. The normal stress Syy which for this
loading and geometry is the principal normal stress S2 1
rapidly decreases ahead of the crack tip. Figure 25b
corresponds to the Sxy (shear) stress contour plot for a mode
II condition. Note how the shear stress drops off much more
slowly with distance ahead of the crack tip than does the
normal stress for mode I loading (Fig. 25a). Furthermore,
54

-6..9 Mi&
-6.~ 9 -~
2.5 mm Ahead crack Behind crack 2.5 M
(a) Syy S2, mode 1.
* --- 0-L2FA..... 6.9 MPa
~ -6.9 MPa
2.5 - Ahead crack Behind crack 2.5-
(b) Sxy S,, mode 11.
Figure 25. Stress contour plots for mode I and mode 11loading
55

the shape of the stress field is more narrow and elongated.
For this loading condition, Sxy = maximum shear stress = S1.
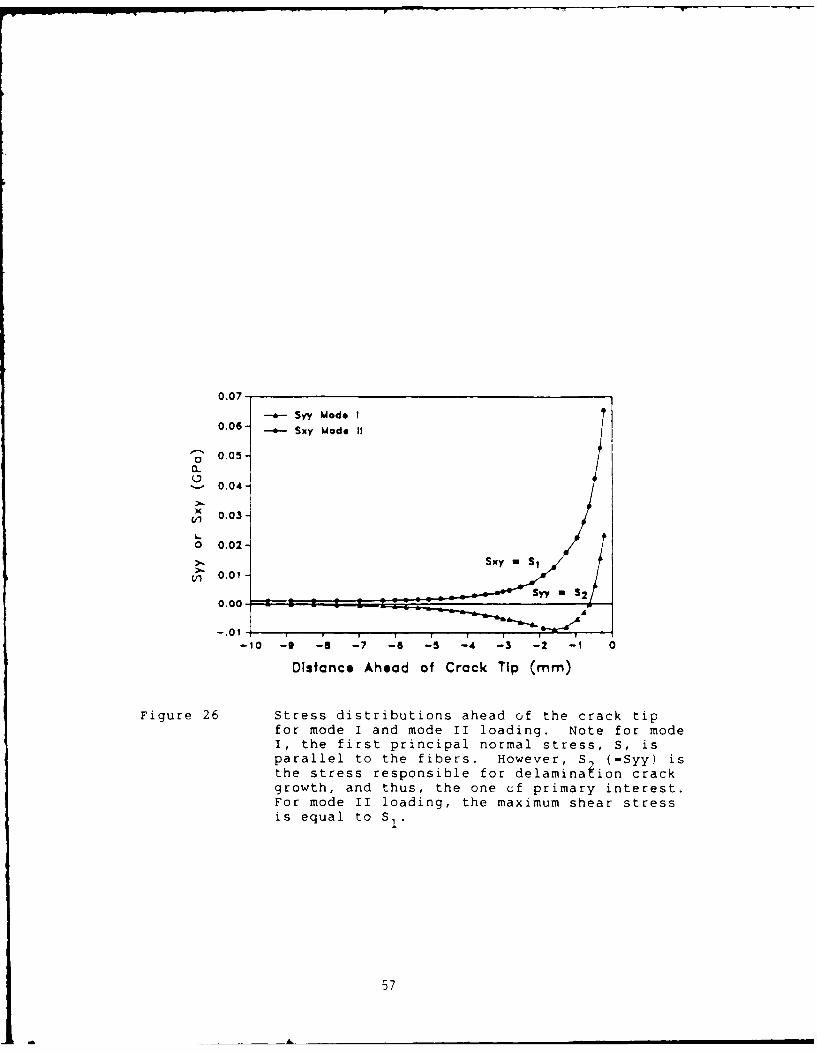
Figure 26 shows the stress distribution as a function of
distance ahead of the crack tip for mode I and mode II. In
the case of the normal stress for mode I, the stress drops
off rapidly until it is compressive at a distance of 0.76 mm
ahead of the crack tip. Finally, it gradually approaches a
zero stress level at approximately 8 mm from the crack tip
which is maintained all the way to the end of the beam. It
should be noted that the compressive stresses observed for
mode I loading are not expected to significantly influence
the fracture mode at the crack tip because they occur far
enough away from the crack tip. The mode I damage zones
sizes presented in section 4.1 (see Table 1) were between
.020 mm and .200 mm, well below the .76 mm indicated in the
analysis as the distance ahead of the crack beyond which the
stresses are compressive.
In the case of the shear stress distribution ahead of
the crack tip for mode II, it monotonically decreases to a
constant value. As can be seen, the shear stress ahead of
the crack tip for mode II loading decays much more slowly
than the normal stress for mode I loading. These results
indicate that the stress concentration at, the crack tip is
distributed over a larger distance for mode II loading than
for mode I loading. For mode II, the extent of the stress
field above and below the center plane is much smaller than
for mode I, as seen in the stress contour plots in Fig. 25.
56
0.07
-a- Syy Mods I0.06 - Sxy Mods II
- 0.05(L
, 0.04
V 0.03
o 0.02
1A, 0.01
0.00-
-. 01 A
-10 -9 -8 -7 -6 -5 -4 -3 -2 -1 0
Distance Ahead of Crack Tip (mm)
Figure 26 Stress distributions ahead of the crack tipfor mode I and mode II loading. Note for modeI, the first principal normal stress, S, isparallel to the fibers. However, S (=Syy) isthe stress responsible for delamination crackgrowth, and thus, the one cf primary interest.For mode II loading, the maximum shear stressis equal to S 1.
57
0.30--*--PLANE STRESS ISOTROPIC
PLANE STRAIN ISOTROPICo 0.25n -- PLANE STRESS ORTHOTROPIC
--- PLANE STRAIN ORTHOTROPIC0.20
440
--) ~MODE I LOADING0.15
• 0 .10o AS4/3502I (Orthotroplc
Co 0.05>
0.00 1-s -7 -6 -5 -4 -3 -2 -1 0
Distance Ahead of Crack Tip (mm)
(a)
0.16- K-- PLANE STRESS ISOTROPICa 0.14 .- PLANE STRAIN ISOTROPIC
I--- PLANE STRESS ORTHOTROPIC00.12 -i
-- -- PLANE STRAIN ORTHOTROPIC
fAin 0.10
0.08 MODE II LOADING
" 0.06
I0.04-Co 1 AS4/3502
> 0.02 (Orthofrople)'Otrpla
0.00--s -7 -6 -5 -4 -3 -2 -1 0
Distance Ahead of Crack Tip (Mm)
(b)
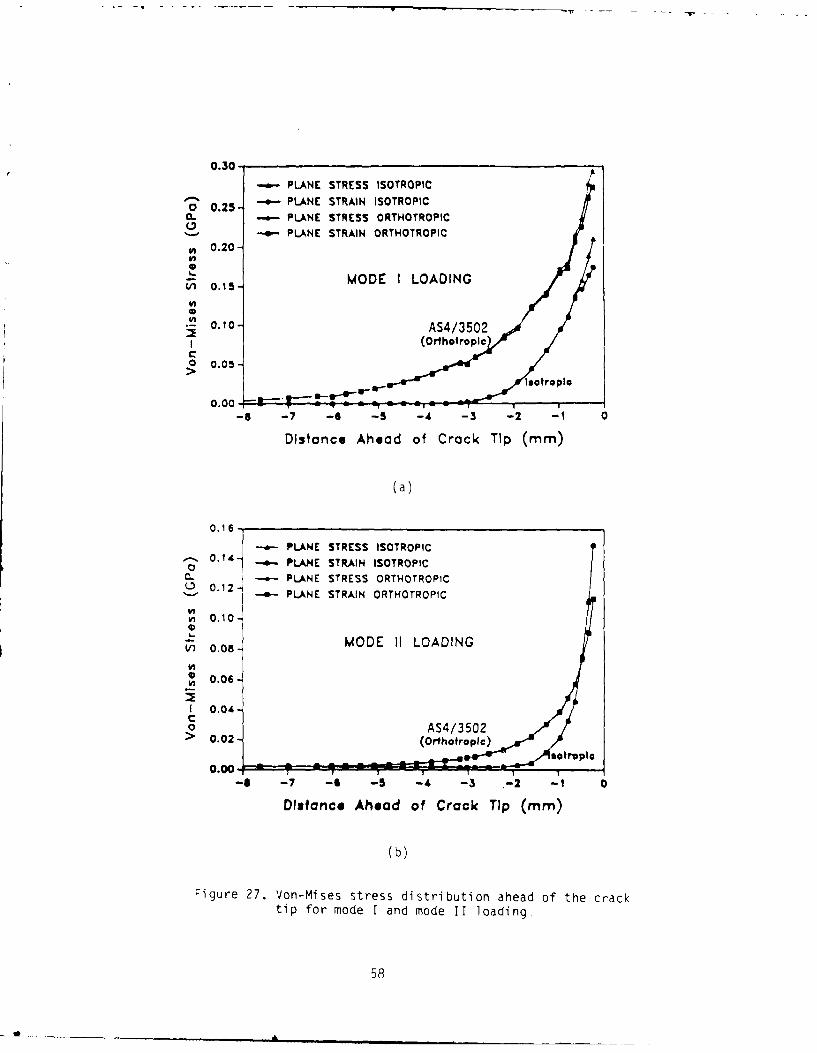
Figure 27. Von-Mises stress distribution ahead of the cracktip for mode I and mode II loading
58

A careful comparison of the stress fields of Figs. 25
and 26 with the damage zone shown in Figs. 6-8 for mode I and
mode II delamination reveals a direct correspondence between
them. The much longer and more narrow stress field predicted
by the linear, orthotropic analysis is clearly reflected in
the observed damage zones for mode I and mode II
delamination. There is also quantitative agreement with
measured strain fields, which also indicate a much more
gradual decay of the strain field ahead of the crack tip for
mode II loading than for mode I. It should be emphasized
that quantitative agreement between the directly measured
strain field and the calculated stress field would not be
expected. The stress field calculations ignored both
nonlinear behavior and microstructural details (fibers and
resin) since they assumed linear, orthotropic behavior.
Furthermore, there is no easy way to get from the measured
strain to the associated stress, since the nonlinear
constitutive relationship is unknown.
When dealing with damage zone development, the effect
of the state of stress, namely plane stress versus plane
strain, may be important. This is particularly true where
the principle shear stress plays a role in.the deformation of
fracture process. The damage zones shown in Figs. 6 and 7
were obviously made at the edge of the specimen where a plane
stress condition occurs. Therefore, in order to have a first
order approximation as t' the effect the difference in the
state of stress at the surface of the specimen where our
59
direct observations are made, and at the center were plane
strain conditions prevail, the Von-Mises stress for mode I
and mode II were plotted as functions of distance ahead of
the crack tip. The results in Fig. 27a indicate that for
mode I, the difference in the Von-Mises stress (or root mean
square shear stress) in plane stress versus plane strain is
approximately 10%. In the case of mode II, the difference is
negligible, as is evident in Fig. 27b. Therefore, it appears
that for these orthotropic materials, the difference between
plane stress and plane strain is not too significant and our
surface observations of damage zone size and detail should
not be very different than subsurface behavior. Previous
studies in which the postmortem appearance of the fracture
surface near a free edge to that at the center of a specimen11
are consistent with this interpretation A final
observation from Fig. 27 is that the stress field ahead of a
crack tip decays much more slowly for an orthotropic
materials with the crack parallel to the fibers than for an
isotropic material.
4.3.2 Modeling the Effect of Fibers on Mode I Delamination
Toughness
A first order estimate of the delamination fracture
toughness may be obtained by assuming that the delamination
fracture process is essentially the same as the fracture
process in the neat resin, except that the fibers act as a
rigid filler, reducing the volume of resin available to
60
L a
h
C = - ij dy dEij
Eij = ij
/
" 2h
/
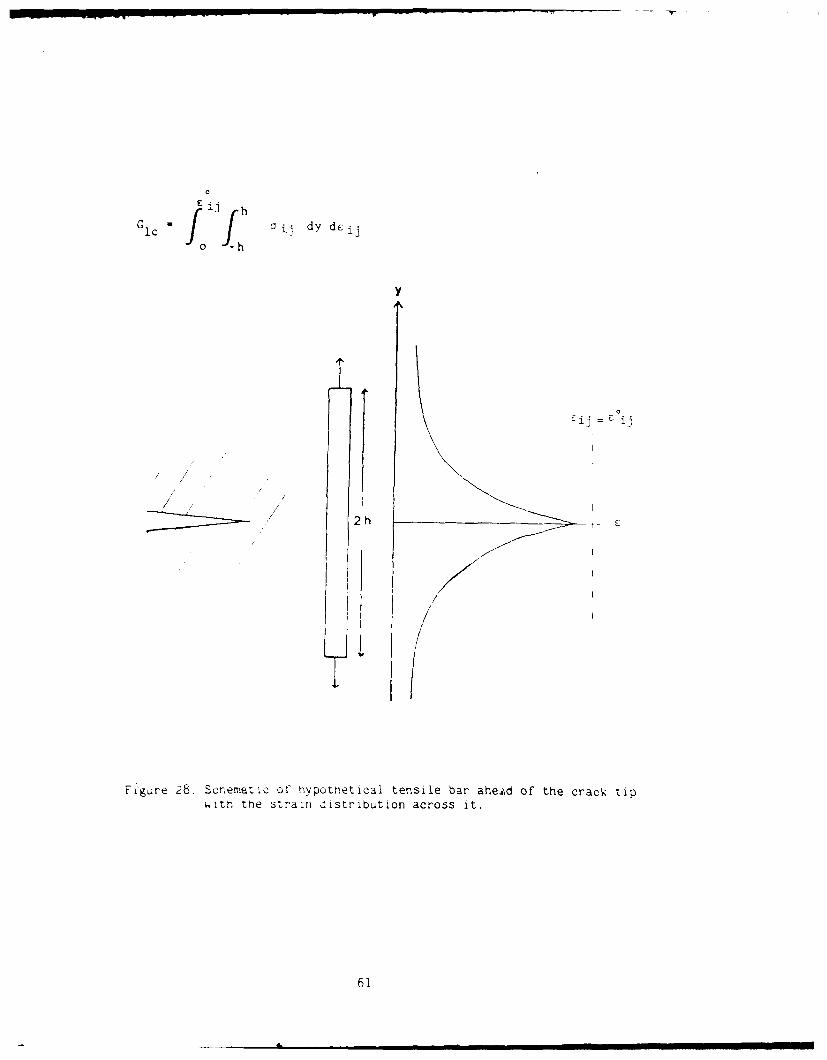
FigLre 28. Schematic oC hypothetical tensile bar ahe.d of the crack tipwitn the strain distribution across it.
61
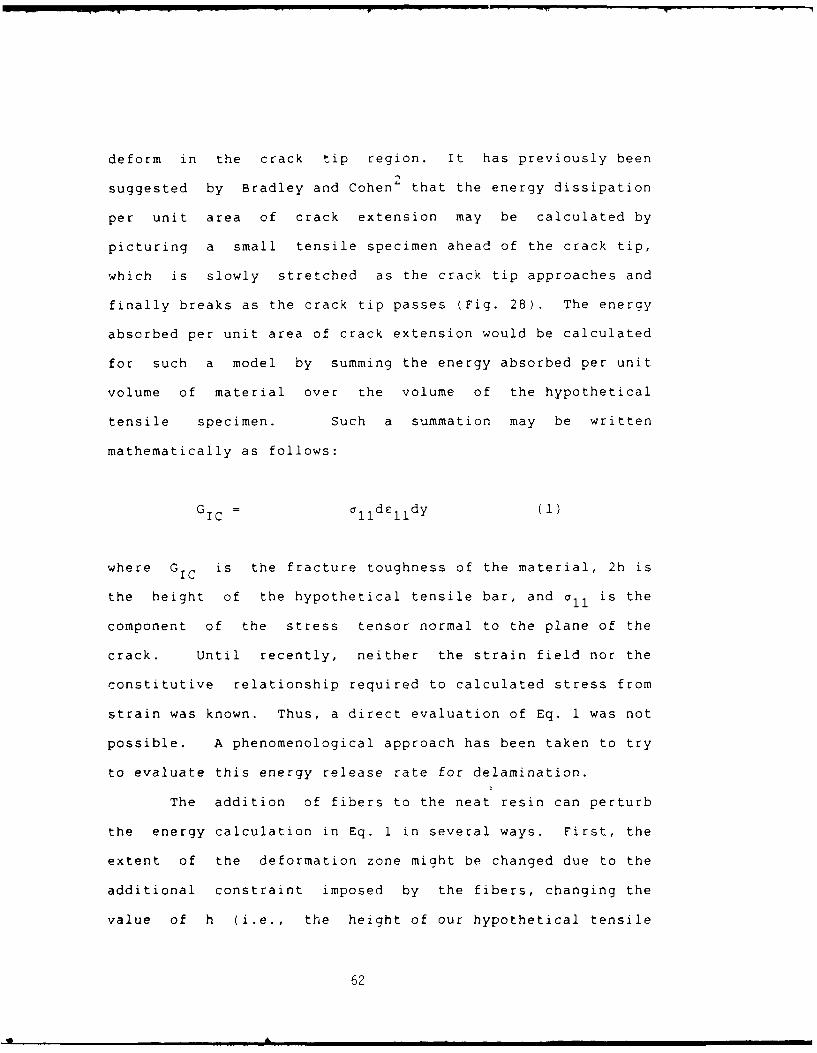
deform in the crack tip region. It has previously been
suggested by Bradley and Cohen 2 that the energy dissipation
per unit area of crack extension may be calculated by
picturing a small tensile specimen ahead of the crack tip,
which is slowly stretched as the crack tip approaches and
finally breaks as the crack tip passes (Fig. 28). The energy
absorbed per unit area of crack extension would be calculated
for such a model by summing the energy absorbed per unit
volume of material over the volume of the hypothetical
tensile specimen. Such a summation may be written
mathematically as follows:
GIC = a1 1dE 1 1dy (1)
where GIC is the fracture toughness of the material, 2h is
the height of the hypothetical tensile bar, and a11 is the
component of the stress tensor normal to the plane of the
crack. Until recently, neither the strain field nor the
constitutive relationship required to calculated stress from
strain was known. Thus, a direct evaluation of Eq. 1 was not
possible. A phenomenological approach has been taken to try
to evaluate this energy release rate for delamination.
The addition of fibers to the neat resin can perturb
the energy calculation in Eq. 1 in several ways. First, the
extent of the deformation zone might be changed due to the
additional constraint imposed by the fibers, changing the
value of h (i.e., the height of our hypothetical tensile
62

. . .. . . . '
specimen) in Eq. 1. Second, rigid filler would further
reduce the effective gage length of material capable of
deforming in our hypothetical tensile specimen. Third, fiber
debonding and/or constraint could change the local strain to
fracture. These three factors could potentially account for
the observed decrease in fracture toughness from 8100 J/m in
the F185 resin to 1900 J/m 2 in the composite delamination
fracture toughness. The first two of these three factors can
be quantified based on actual observations. If one assumes
that coating microcracking begins for strains above the
threshold strain; (say 3'), then the extent of the
microcracked zone can be used to approximately quantify the
magnitude of the h in Eq. 2.
A cross-section of the composite prepared
metallographically to reveal the microstructure (Fig. 29) may
be used to determine the volume fraction of fibers in the
hypothetical tensile specimen ahead of the crack tip. Since
the volume fraction is quite nonuniform, the microstructure
can be divided into three regions: the resin rich region
between plies with a fiber volume fraction of 19%; the ply
region with a volume fraction of fibers of 76%, and a
transition zone with a volume fraction of approximately 33%.
The relative heights of these three regions are shown in the
schematic in Fig. 30 along with the height of the
microcracked zone in the F185 resin. Using a simple rule of
mixtures approach, and taking account of the smaller
microcracked (and deformed) zone, 2h, one may estimate the
63
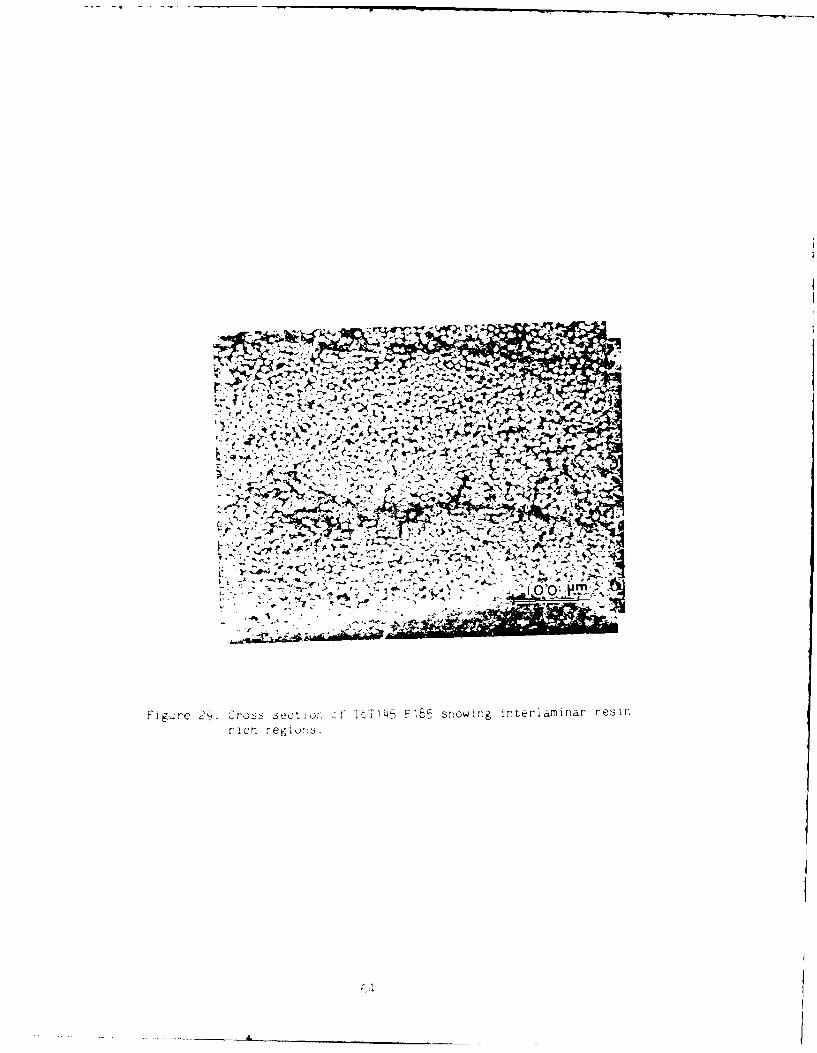
*7
Fig re2, L-05s ec l ., Ft,-,4 show~n . nt era r -,sr-
rich regTh4C 6.
delamination fracture toughness to be 4000 J/m 2 as shown
below:
G GIC [h (1-VA h (1-V B (1-V C (2)GIC = a f b f) + h(composite h0
delamination) 0
where GIC refers to composite delmination and GIC refers to
the neat resin. This caiculation implicitly assumes that the
local strain to fracture in the F185 resin and the composite
are the same and that the stress distribution is also
similar, at least on average. It is recognized that these
are crude assumptions at best.
The calculated value of Mode I delamination fracture
toughness of 4000 Jim2 is clearly much larger than the
2observed value of 1900 J1/m . This discrepancy is due to the
assumptions in the calculation that the strain field
distribution as well as the local strain to failure are
similar. In reality, fracture at the fiber/resin and/or
constraint due to the presence of the fibers should cause the
strain to fai1iire in the composite to be somewhat less than
that in the neat resin. Furthermore, the decay of the strain
field ahead of the crack tip is different for an orthotropic
material than for an isotropic one (See Fig. 27).
Thus, the incorporation of the recent measurements of
the strain field described in section 4.2 into this model
should bring the predictions more in- line with the observed
delamination toughness. This is currently being done under
65

I0
y
o h
h h
B
1C 2h 2h
__ resin 2h 130 jm
composite 2h 100 .m
Figure 30. Schematic snowing relative height of damage zone in F185
resin and T6T14S,'F185 composite.
66

the new contract. A constitutive relationship will have to
be either determined or assumed before this approach can be
fully implemented. With a constitutive relationship and the
measured strain fields, it would be possible to evaluate
directly Eq. 1 rather than using the more indirect,
phenomenological approach expressed in Eq. 2.
4.4 FRACTURE MECHANICS CHARACTERIZATION OF MATERIALS
In this section our work to develop better test
methods and analysis to determine the mode I and mode II
delamination fracture toughness of composite materials will
be described. The newer resin systems are significantly
tougher than the first generation resins for which the
current test methodology was developed. For these early
systems which were quite brittle, linear load-displacement
curves for split laminate testing is the norm and linear
elastic analysis is adequate to extract meaningful fracture
toughness parameters from the experimental data. As it has
become necessary to characterize some of the newer, tough
resins such as PEEK, both nonlinear and inelastic behavior
are frequently observed in the load-displacement records, and
thus, the usual linear beam theory is not adequate to obtain
meaningful fracture mechanics parameters from these test
results.
It has also been found that mode II testing with the
generally much higher critical energy release rates observed
for this mode of fracture is also much more likely than mode
67
I t ting tO exhibit ion!incar LlhVioL. The deiamination
fracture toughness characterization of multi-axial laminates
with the associated reduction in stiffness along the axis of
the split laminate being tested has also been found to often
give nonlinear behavior unless very thick specimens are
utilized.
Our efforts in response to these challenges have been
to develop a J-integral approach to delamination fracture
characterization for both mode I and mode II loading. These
two efforts will be described in the two subsections that
follow. The presentation in these subsections will be
somewhat more detailed than those in 4.1, 4.2 and 4.3 as most
of the results have not yet been published.
4.4.1 Mode I Delamination
The subject of the work reported in this section is
the means of determining the mode I delamination fracture
toughness of multidirectional composites. Material
characterization is a prerequisite for systematic design and
analysis of composite structures. The intent is to develop
and verify a theoretically-based method for characterizing
delamination fracture despite the complicating factors which
will be discussed.
4.4.1.1 Current Status of the Problem
Delamination of Unidirectional Composites--The
delamination of unidirectional composites, though not
68
, 6m mm • mm , m m m m m m m m

U
Figure 31 Schematic of the double cantilevered beam (DCB) specimenfor delaminAtion ,fudips
69

directly the subject of the present stuay, neveLLiit.*6 form
the background for it. Therefore, this discussion of the
current status of the problem begins with its review.
The great majority of studies of delamination
toughness have involved unidirectional composites. A major
motivation for this activity has been to understand the
relationship between neat resin fracture toughness and
12composite interlaminar toughness Several different
specimen designs have been used by various investigators13-16 Of special interest because of its wide use and
apparent utility is the double cantilevered beam (DCB)
specimen, as shown in Fig. 31. Numerous investigators have
16-18studied it as applied to unidirectional composites The
DCB specimen has also been applied to a planar isotropic
19short-fiber reinforced composite 1 9 In these studies the
necessary analyses have been developed and the procedure's
viability has been demonstrated by experiment.
Several different ways of analyzing DCB data have been
proposed. Various assumptions about material and specimen
behavior are made in each method. Analyses based on linear
beam theory, large displacement theory, empirical compliance
calibration, the area under the load-displacement curve, and
an energy rate interpretation of the J integral have been
used 1 6 '1 7 '2 0 The effectiveness of a particular method
depends on the situation at hand. For the case where there
is permanent deformation due to material damage, Keary et
al. 2 0 determined that the J integral is superior to
70
approaches based on linear beam theory and empirical
compliance calibration. This observation is salient to this
study since such damage has been observed in multidirectional
composites.
A similar conclusion can be drawn from Fig. 32 which
shows data generated in this program using DCB specimens.
The delamination fracture toughness determined using the area
method (G) and using a damage-dependent J integral (J) are
plotted versus crack length. One G and one J curve were
determined from each of three specimens. Not only does J
appear to give results which are more consistent over the
range of crack lengths, but it gives lower toughness values.
The overestimation of fracture energy using the area method
reflects that methods' unsuitability when damage is present
away from the crack tip. The stacking sequence used results
in damage in the legs of the specimens; the material was
Hexcel's T2C145/F155 in a 24-ply plate with the stacking
sequence [-+45/(+-45)2/(-+45)2/(+-45)2/(-+45)2/+-45 ] .
4.4.1.2 Delamination of Multidirectional Composites
In actual structures, laminate layups are not
generally unidirectional. Therefore data from unidirectional
tests can only be used directly in structural design and
analysis if it can be shown that the unidirectional data
reflects the response of the more complex material. Recent
studies show that this is not always the case. For example,
Nicholls and Gallagher2 1 have observed in their DCB tests
71

DASHED LINES: GSOLID LINES: J
10-3t SPECIMEN
8 2)= 601
=0= 602
3; •• ,, 6D2
=Am 6D6
Z X4
0 I I I I I I I
2.6 2.8 3.0 3.2 3.4 3.6 3.8 4.0 4.2 4.4 4.6 4.8
CRACK LENGTH (IN)
Figure 32. Fracture energy versus crack length using the area method (G)and a damage-dependent J integral (J) to analyze DCB data.The material is T2CI45/F!55 with a lay-up of
,-45/(T45) 21(+45) 2/(:45)21(7 45)2/(T45)21451.
72

almost a twofold increase iii fracturc cncr y nver the
unidirectional value when a crack travels at a +300 or +450
interface in ASl/3502 graphite/epoxy. The fracture surfaces
evidenced a change in mechanism which was responsible for the
greater toughness.
In this study just mentioned, several notable results
were obtained which were reflected in the recommendations for
further work. First, it was observed that when the crack was
propagating at the interface of two plies, neither of which
was parallel to the propagation direction, the crack tended
to jump between plies by forming another crack parallel to
the original crack, but on a different plane. They suggested
that a more detailed knowledge of the crack front shape in
this region would be helpful in understanding this
phenomenon. A second subject for additional work was the
transition between a region where the crack broke through a
ply and a region where growth occurred between two plies, one
of which had fiber parallel to the propagation direction. As
shown in Fig. 33, the transition zone was V-shaped, with the
first region tapering off into the second. This shape
suggests an edge effect, and thus a width effect. Knowledge
of the stress state across the width of the specimen would be
needed to explain this behavior. Thirdly, a wide range of
fracture toughness values was observed. There is therefore
reason to consider how to interpret the results in a way that
is relevant to analysis of crack growth in structures.
Given the complex delamination behavior of
73
uA~tiiect~nni comuosites, how can one compare the results
from the delamination testing between various layups? Also,
how do the toughness measurements correlate with the values
for the neat resin? By understanding the relationship
between the behavior of various layups, one hopes to be able
to predict the delamination performance of a proposed layup
based on the results of a few baseline tests, rather than
needing to make and test each potential layup. Also,
understanding the critical parameters which determine
toughness would lead to guidelines for the choice and
development of materials.
Chai22 also used the DCB geometry to study
delamination at various interfaces in multidirectional
layups. Like Nicholls and Gallagher, he found that
delamination energy correlated strongly with fracture
morphology. He observed that various mechanisms operated
during the course of a single test, and that transitions
between fracture mechanisms occurred unpredictably. In
general, the crack did not continue to grow in its plane, but
shitted interfaces as it propagated. Large differences in
the angles of the plies at the crack plane were noted to
encourage ply jumping. Recent tests by Goetz have
demonstrated that in the absence of 0 fibers to contain the
crack, it can leave the midplane and jump from ply to ply
until finally reaching the surface; during the process the
specimen behavior is radically altered. Such behavior is not
seen in the testing of unidirectional composites.
74

Z Region I
L
0
Region I|
I I
Figure 33. Schematic of transition between two regions on a fracture surface.Region I corresponds to the crack front breaking through a ply.Region I| appears as the crack propagates between two dissimilarlyoriented plies one of which is oriented parallel to the directionof crack propagation. (After [12].)
75

Chai observed local toughness changes on the order of
100% due to transitions in fracture mechanism. High fracture
energies were not necessarily due to fiber breakage; for
example, even when the crack traveled between two 00 plies,
the multiplanar character of the fracture lead to variations
in roughness prompting his statement that, "The range in
fracture energies found in the region of the 02 plies as
opposed to a single value may be cause for concern in the
fracture testing of unidirectional laminates."
A major conclusion in Chai's paper was that the mode I
interlaminar fracture energy was independent of test specimen
geometry (crack length and width), independent of ply
orientations at the delamination surface, and dependent only
on the matrix constituent. It should be noted, however, that
in order to make this statement Chai had to exclude from
consideration all regions of the fracture surface where fiber
breakage, pull-out, and ply-jumping were observed.
Essentially, by excluding fracture processes where the fibers
made a difference (on the basis of fracture surface
morphology), Chai insured that the matrix consistence was
determinative in the toughnesses measured. Indeed, in the
absence of such a screening of data on the basis of surface
morphology, a constant value of delamination toughness is not
obtained. When he compared the results of other
investigators with the hypothesis, it was largely
unsupported. In general, fracture energy appears to be
dependent on interface angle and potentially on fiber
76

orooerties as well.
The evidence he presents suggests that a less strong,
more precise conclusion is that minimum toughness is obtained
for matrix-dominated mechanisms, and that similar toughness
is sometimes obtained despite varying fracture morphology
details. Because a lower bound gives the most conservative
result in analysis, this is very significant. However,
identifying a constant lower bound does not fully explain the
data. Understanding the higher energy processes which lead
to higher delamination resistance is still necessary.
Another aspect of the paper's conclusion bears
scrutiny. The delamination toughness is stated to be
independent of DCB width. The results for specimens with a
range of widths agreed. For one material, the width was
varied from 4.2 to 8 mm and for another from 7.2 to 10.4 mm.
However, the thickness of the 48 ply layups were 6.1 and 6.7
mm, respectively. Since edge effects would be expected to be
seen over a distance on the order of the thickness2 3 , these
specimens were not nearly wide enough to produce a change in
behavioL, even if sa h a transiti on does occur in dider
specimens. Furthermore, evidence of edge effects is seen in
some of the fracture morphologies shown in the paper. Aside
from the effect of width, Chai cites the effect of specimen
geometry on the crack tip damage zone as a complicating
factor making interpretation of the toughness he reported
more difficult.
Jordan24 conducted delamination tests on
77

mii1ticirpctional laminates. Tests were performed using
layups with 00 fibers except at the fracture plane, at which
there was a +10 or +45 degree interface. For these cases,
the stiffnesses of the laminates were similar to that of the
unidirectional layup, and the toughness values were also
similar. However, he noted that as the percentage of
off-axis plies was increased and the axial modulus decreased,
the size of the zone of microcracking at the crack tip
increased, as did the amount of damage in the specimen away
from the crack tip. Analytical methods which did not account
for the effect of the far field damage gave results showing a
large increase in apparent fracture toughness. However, when
data reduction was performed using a damage-dependent J
integral, the intrinsic fracture energy was found to be
comparable to that for the unidirectional composite in three
of the four systems studied. This suggests, in accord with
Chai's conclusions, that there is an intrinsic fracture
energy which is independent of interface angle. In another
recent study 2 5 , a similar result was found by applying the J
integral to delamination. Such layup insensitivity nf
toughness suggests that the local normal interface stress,
rather than local layup-induced shear stress, is the primary
factor in delamination24 It should be noted that this
conclusion is based on limited data. Whether local shear
stress was insignificant or whether any amount of local shear
stress would be unimportant is not clear. Jordan's results
from mixed-mode tests on one composite suggest that when
78
externally-produced GII is over about 40% of the total energy
release rate (GT=GI+G ), GT will become sensitive to theT= II T
percentage of GII and will increase. Thus, if the results
from load-induced mixed-mode tests are relevant to the
analysis of delamination based on the local stress state, one
would expect local mode II conditions to be evidenced by an
increase in toughness.
The determination of mode I delamination fracture
toughness of muitidirectional composites poses numerous
questions--many of which do not exist for unidirectional
composites. When performing delamination tests, one is
seeking a geometry-independent material parameter. The
question of geometry dependence has not been adequately
addressed for multidirectional DCB specimens. The crack
front often takes the shape seen in Fig. 34a. The change in
curvature near the edge seems to be an edge effect. The
difference in crack length at the edge and the center if
typically .15 to .2 inches for a one inch wide specimen.
Compare this to the relatively mild curvature seen for a
unidirectional specimen (Fig. 34b). The difference in
curvature implies that the crack tip stress field is
significantly different for the two cases. To my knowleCie,
the causes and significance of this have n-t been addressed
:n the open literature. However, related work is currently
-ping done at Texas A&M University.
Figure 35 shows a record of the load versus applied
: .- 9ment curve for a typical DCB test. The smooth curve
79
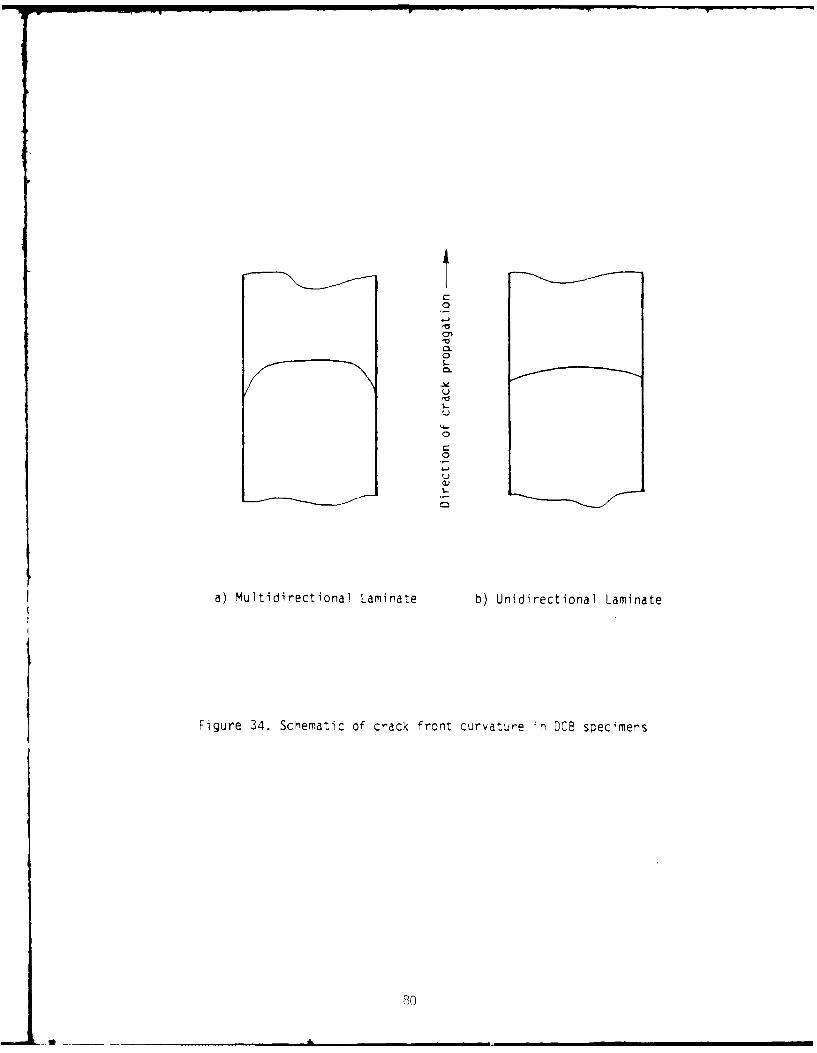
0
0C:0
00
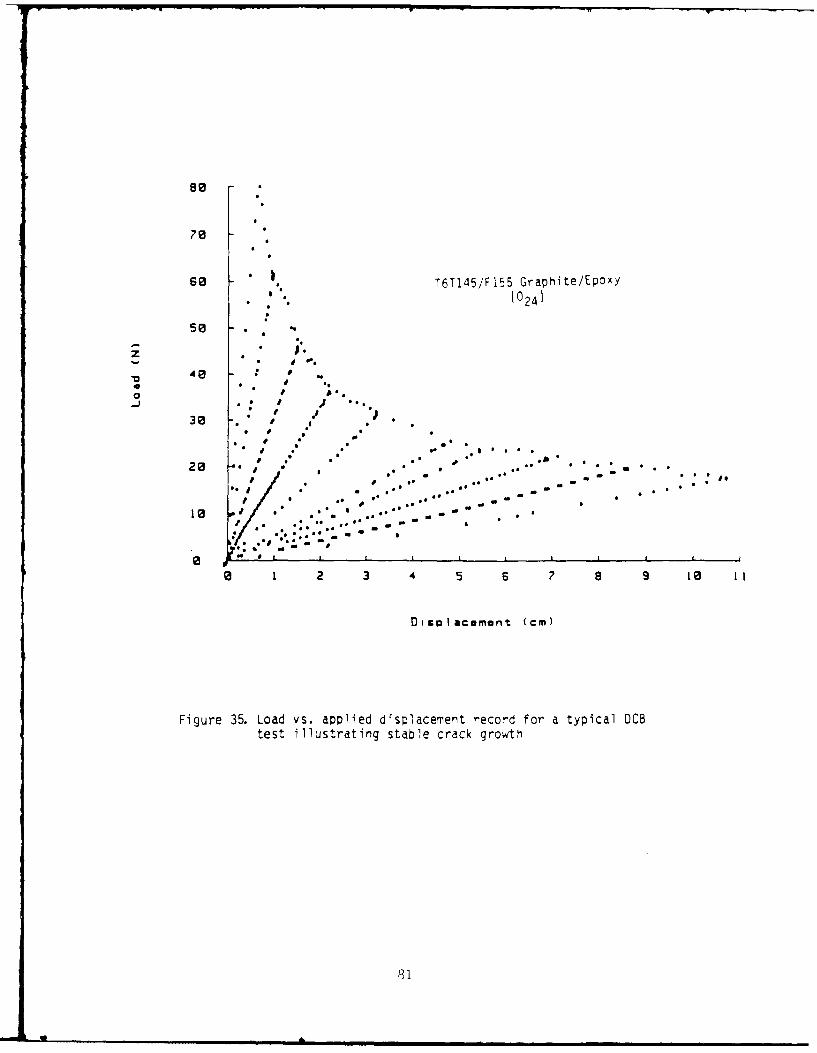
70
so T6TI45/F155 Graphite/EpOxY,0241
40 :D *.
30 P
20 O a
3I- -.* . .
2. 3 4 5 a
• ea
....- . .
10 * a eme* (cm)
Figure~~ 35. Lodv . ale ipaeetrcr o yia C
test illu s crc gr0 2 3 4 5 6 7 8 9 10 11
Dizl Iacament. (cm)
Figure 35. Load vs. applied displacement record for a typical 0GBtest illustrating stable crack growth
81

14
T6T145/F155 Graphite/EpoxyI±45/0 8/C 45) 2 /031/±4 51
12
*11
J. .0
1. 2 2.5
S-Iacoen
Fiur 36 Loa vs. aple dipacmn fo etilsrtn
untal crc growt
7 * *82
is the result of stable crack growth. In contrast, the curve
in Fig. 36 shows evidence of intermittent unstable growth
during the displacement-controlled test. Such data are more
difficult to interpret than those in Fig. 35. Tests
conducted on the current grant have shown that regions of
fast crack growth are generally regions of lower fracture
toughness. What is the significance of the arrest energy?
What is its geometry dependence? A second question is raised
by the parts of the curve which show increasing load with
increasing displacement coming from what is evidently damage
zone growth or stable crack growth. Is there some
significance of this behavior analogous to that seen in the
resistance curves commonly determined for metals? Such
questions have yet to be answered.
As mentioned previously, studies have shown that the
fracture energy of a specimen can vary widely with crack
length if fracture mode transitions (e.g., ply jumping) take
place. This creates a problem in data interpretation and
reportinq. Chai addressed this by screening his results to
isolate the lowest energy mechanisms, and then reporting the
lowest value as the interlaminar fracture toughness. Often
data reduction techniques are used which smooth out the data,
such as the area method 2 5 . There is a need for data analysis
which is able to capture the details of the various fracture
processes.
It has been reported that in some instances
multidirectional fracture toughness is similar to the
83
unidirectional value and in some it is not. The limits of
the generality of the former statement have yet to be
explored. The potential significance of such a correlation
is very great, since it would allow one to perform a simple
test to obtain information for many complex layups.
Previously, the generation of far-field damage (damage
away from the crack tip, e.g., in the legs of a DCB specimen)
was cited as a complicating factor in delamination testing.
Care must be taken to differentiate between energy going into
the fracture process and energy going into generation of the
far-field damage. Only a handful of investigators have
attempted to develop analyses and tests which compensate for
it 20,25 The degree of far-field damage is known to be
dependent on stacking sequence. More matrix-dominated layups
and layups with large differences in interface angles
generate more damage. In a DCB specimen, damage can be due
not only to bending stresses, but also to tensile stresses in
the legs near the loading points when the angle of rotation
of the legs is large.
Besides affecting the introduction of far-field
damage, the stacking sequence can potentially affect the
delamination process by producing local shear and twisting at
the crack tip, which may lead to partial crack closure or
26cause local mode II or mode loading
4.4.1.3 Objectives of Current Study
The primary objective of the present study has been to
84

develop a theoretically-based procedure for determining the
mode I delamination fracture toughness of multidirectional
composite materials.
The nature of the questions to be answered was
expressed in the previous section. Here are some of the
fundamental questions underlying the objective of the
proposed research:
o Under what conditions can a geometry-independent
measure of fracture energy be obtained?
o What is the cause and significance of crack front
curvature?
o what data analysis is necessary to capture the
details of the delamination process?
o What is the significance and geometry dependence of
the intermittent growth reflected in data such as
seen Fig. 34? What is the significance of the
increasing crack growth resistance?
o Under what conditions do various fracture
morphologies occur?
o How do observed toughness values relate to the
corresponding fracture morphologies?
o For a given crack tip damage state (constant
intrinsic fracture energy), what is the effect of
varying stacking sequence, i.e., changing the
amount of far-field damage?
o What is the effect of changing the crack tip stress
state through altering the stacking sequence?
85
0

o How does damage due to tensile stress (as opposed
to bending stress) impact the apparent toughness?
o How does the fracture energy depend on crack speed?
4.4.1.4 Experimental Investigation
To date, the focus of the work has been on application
of the J integral to double cantilever beam (DCB) tests in
order to investigate the importance of geometry, layup, rate
effects, and fracture morphology. The goal is to synthesize
principles which can guide the prediction of delamination
performance using limited material data. The following
discussion highlights the method used and results obtained to
date.
4.4.1.4.1 Materials and Layups--The material used in this
study is T2C145/F155, manufactured by Hexcel. It uses a
rubber-toughened epoxy matrix with about 6% rubber by weight.
The nominal fiber volume fraction for all the material tested
was 57%. This material system was chosen in order to
accentuaLe possible non-linear and viscoelastic responses for
a commercially available, toughened composite. It is also
currently being used for other work on this contract and
other contracts at Texas A&M, allowing sharing of material
data. Three layups were used. Hereafter, they will be
referred to using the following designations:
Designation Layup No. Plies
unidirectional [024 ] 24
86

fiber-dominated (+-45/0 8/-+45]antisym 24
angle-ply [+-45/(-+45) 2 (+-45)2 /-45]antisym. 24
The unidirectional layup is the one which has been most
commonly used in the literature to characterize delamination.
In this study it was used not only to examine delamination
between zero degree plies where ply interpenetration could
occur, but to give a baseline for evaluating data for
multidirectional layups. The fiber-dominated layup was used
to study delamination at a +-45 degree interface. Each leg
of the DCB specimen was made balanced and symmetric in order
to eliminate stretching-shearing and stretching-bending
coupling. Antisymmetry about the midplane of the laminate
was designated in order to put the delamination plane at a
+-45 degree interface. The stacking sequence for the
angle-ply layup was chosen to minimize bending-twisting
coupling as well.
4.4.1.4.2 Experimental Results--All data shown in the
following figures were generated using DCB specimens. The
fracture toughness was calculated using the J integral method
27of Schapery In this formulation J is calculated using the
moment at the crack tip during crack extension and the
moment-curvature relationship for one leg of the specimen.
The J integral is twice the area to the left of the
moment-curvature curve, as shown in Fig. 37. In the
following discussion, J will correspond to this path integral
definition. The energy release rate was also calculated for
87
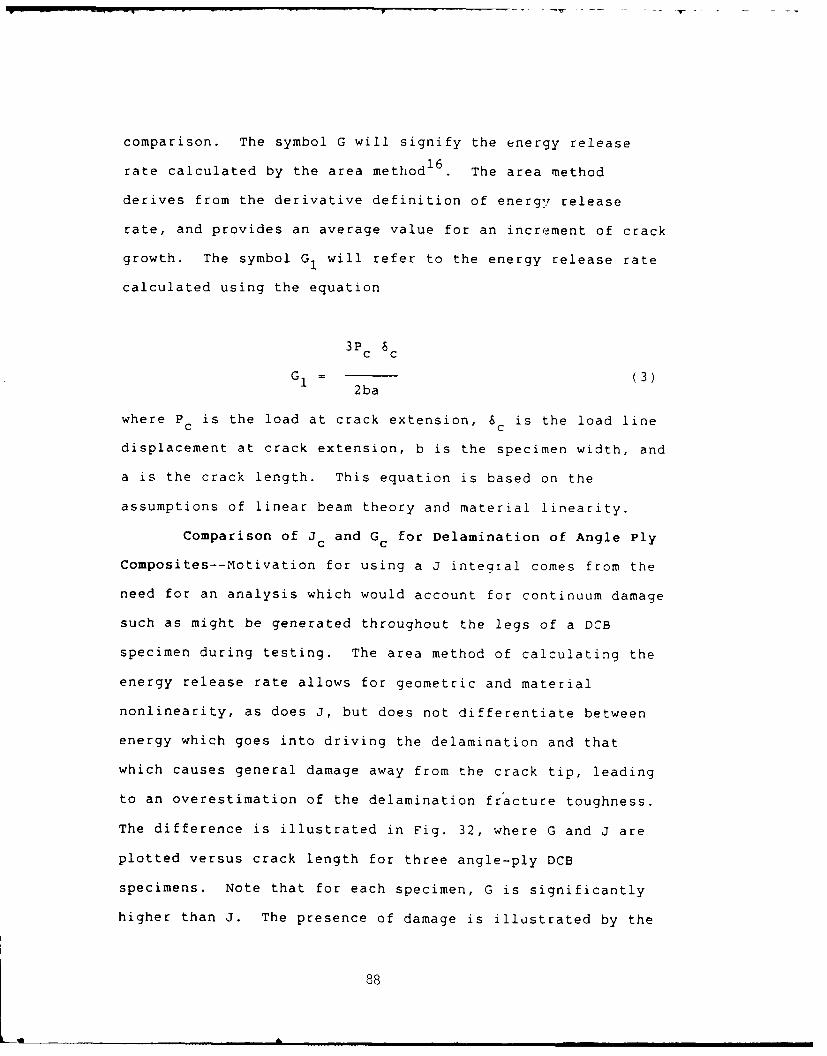
comparison. The symbol G will signify the energy release
rate calculated by the area method1 6 . The area method
derives from the derivative definition of energy release
rate, and provides an average value for an increment of crack
growth. The symbol G1 will refer to the energy release rate
calculated using the equation
3 P c S3c 6c
G= (3)2ba
where Pc is the load at crack extension, 6c is the load line
displacement at crack extension, b is the specimen width, and
a is the crack length. This equation is based on the
assumptions of linear beam theory and material linearity.
Comparison of Jc and Gc for Delamination of Angle Ply
Composites--Motivation for using a J integral comes from the
need for an analysis which would account for continuum damage
such as might be generated throughout the legs of a DCB
specimen during testing. The area method of calculating the
energy release rate allows for geometric and material
nonlinearity, as does J, but does not differentiate between
energy which goes into driving the delamination and that
which causes general damage away from the crack tip, leading
to an overestimation of the delamination fracture toughness.
The difference is illustrated in Fig. 32, where G and J are
plotted versus crack length for three angle-ply DCB
specimens. Note that for each specimen, G is significantly
higher than J. The presence of damage is illustrated by the
88

SP CONTOUR C
P
M M Ma
O
2 ac
= ] K (M) dM
OV 8 = width
k Ma = crack-tip moment
Figure 37. Double cantilever beam specimen, integration path, and moment-
curvature diagram for calculation of J [after 11
89
moment-curvature relazionship for the angle-ply layup, as
shown in Fig. 38. Note that the unloading portion of the
moment-curvature plot does not retrace the loading pcrti:n.
For layups containing a high percentage of 0 der -p
fibers, one would expect that G and J would give bette:
agreement, since continuum damage would be minimized. Thp
moment-curvature relationships for the unidirectional and
fiber-dominated layups were linear, and the unloading
portions of the curves retraced the loading portions. When
this is the case and linear beam theory applies, it can be
shown that J is equal to G1 calculated using Eq. 3. This
formulation is helpful when comparing energy release rate and
J because G1 is calculated for a particular point (as J is
for the linear and nonlinear cases), avoiding the averaging
of the area method. Figure 39 is the load-displacement
record from a fiber-dominated specimen which displayed the
development and breakdown of a tie zone, causing the
delamination resistance to increase and then suddenly drop
with crack growth. The corresponding G and J are plotted in
Fig. 40. Both initiation and arrest values are shown. The
two methods are in reasonably close agreement, supporting the
interpretation of the difference between energy release rate
and J for the angle-ply layup as being caused by damage.
Even when damage is not present, the simple expression in Eq.
3 does not always hold. When geometric nonlinearity is
present due to large rotations of the legs, the energy
release rate must be calculated using either the area method
90
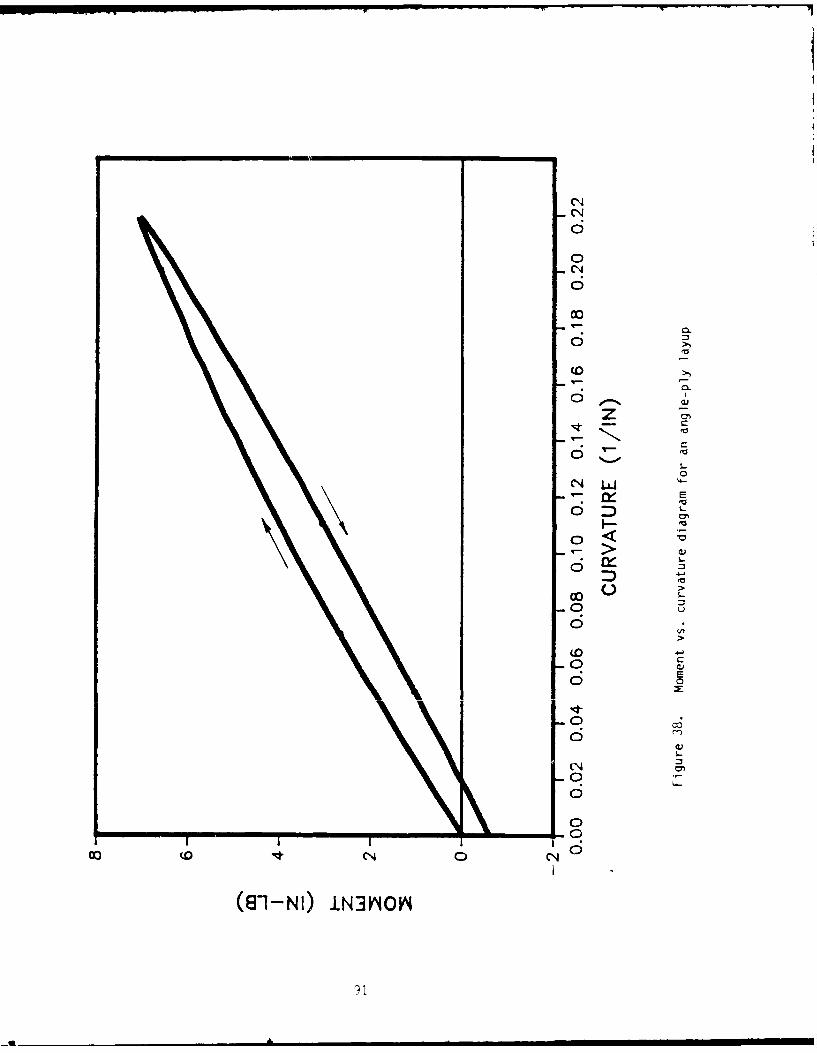
CN
0
00
z
- u
400
0<
oC5
00 ENC
o81-I 0NN I

c.4)
-C EC. 0c -7 .
Q - 0
CC
oc
C)
u 1
~>
S~~~ -l P 0-
92

MHO192 II1 PHYCTU MiV 1$iM
IL. OT 87

11111 ___11112 .0~2
1 .25 Hl 1-4 1.

(possibly losing information due to averaging) or using17
nonlinear beam theory
Geometry Dependence of J--The usefulness of J as a
characterizing parameter depends on its independence of
geometry, such as specimen width. To investigate the effect
of specimen width, angle-ply specimens 1/2, 1, and 2 inches
wide were tested. Representative results are given in Fig.
41. The high values for the 1 inch wide specimen for shorter
crack lengths were found to be assGciated with the complex
fracture morphology which developed near the starter crack.
For more nearly self-similar crack advance, it appears that
width does not have much effect on the fracture toughness
measured over the range of widths and crack lengths studied.
Recent work at Texas A&M2 8 indicates that the state of stress
in the legs of the DCB specimen is in the transition range
between plane strain and plane stress over the practical
range of crack length to width aspect rations. However, the
effects of the transition on J were not seen for the aspect
ratios used in our tests. However, there is another aspect
of specimen behavior which does show a marked width effect.
Unlike unidirectional composites, multidirectional composites
exhibit significantly curved crack fronts in DCB tests. The
curvature depends on the width of the specimen. Figure 42
compares the normalized crack front profile for 1/2 inch, 1
inch, and 2 inch wide specimens for several crack lengths.
Apparently the crack front curvature has two sources: the
antielastic curvature of the DCB leg and free edge effects.
93

0 go
0~IMI000
N-o cO
S- S-
0 I6
I.&-CD'U
*c E00 0z(Ni/e.i r (IV O
94I

z xL&J C1 r r
3g w
010
V0 10 (Uf
3.rf w
zz
LLI Z
404 >I ~ 00
o U'
C C
(N/ei -N
95U

The general trend appears to be decreasing curvature with
increasing crack length, but there is considerable scatter in
the behavior. The differences between the shapes of the
three plots are plain. The curvature associated with edge
effects is dominant for the 1/2 inch specimen, but becomes
less significant for increasing widths. These profiles were
taken from fracture surfaces where the crack arrested after
jumping forward, marking the surface.
Effect of Stacking Sequence on J--The effect of layup
on J was studied. It was found that when complex mechanisms
of fracture involving fiber breakage, ply jumping, extensive
fiber bridging, etc., were absent, the results for various
layups were often comparable. However, multidirectional
layups often displayed such mechanisms. Other
investigators 2 1 ,2 2 have reported similar behavior. Figure 43
illustrates the variety of behaviors observed. The
unidirectional specimen had a uniform toughness over a large
range of crack lengths. The fiber-dominated layup led to
large variations in J associated with tie zone development
and breakdown. Typically the fiber-dominated layup produced
data with the most scatter. Data interpretation was often
difficult. Such large variations in toughness for similar
21layups have been reported elsewhere Practically, this is
unfortunate, since one would like to use this layup to study
the effect of various fiber angles at the delamination plane
without resorting to making measurements of the
moment-curvature relationship (since the relationship is
96
Lum
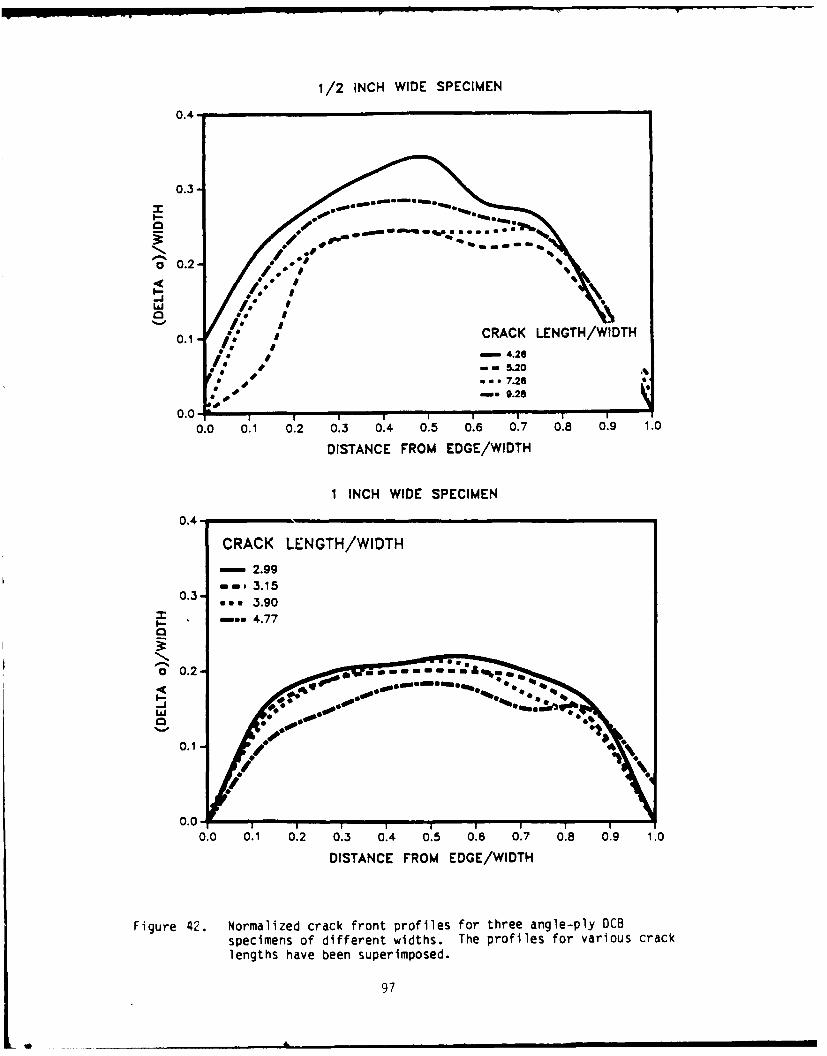
1/2 INCH WIDE SPECIMEN
0.4-
0.3
.2-0
4
o' 0.2
% op0.1CRACK LENGTH/WIDTH
-. 26-l 5.20
• , 7 .2 6=, 9.28
0.0 1 1 1
0.0 0.1 0.2 0.3 0.4 0.5 0.6 0.7 0.8 0.9 1.0
DISTANCE FROM EDGE/WIDTH
1 INCH WIDE SPECIMEN
0.4-
CRACK LENGTH/WIDTH
, 2.99ira, 3.150.3a ua 3.90"-mw 4.77
a 0.2-
-J o 6 o
0.1
0.0 U _ I
0.0 0.1 0.2 0.3 0.4 0.5 0.6 0.7 0.8 0.9 1.0
DISTANCE FROM EDGE/WIDTH
Figure 42. Normalized crack front profiles for three angle-ply DCBspecimens of different widths. The profiles for various cracklengths have been superimposed.
97
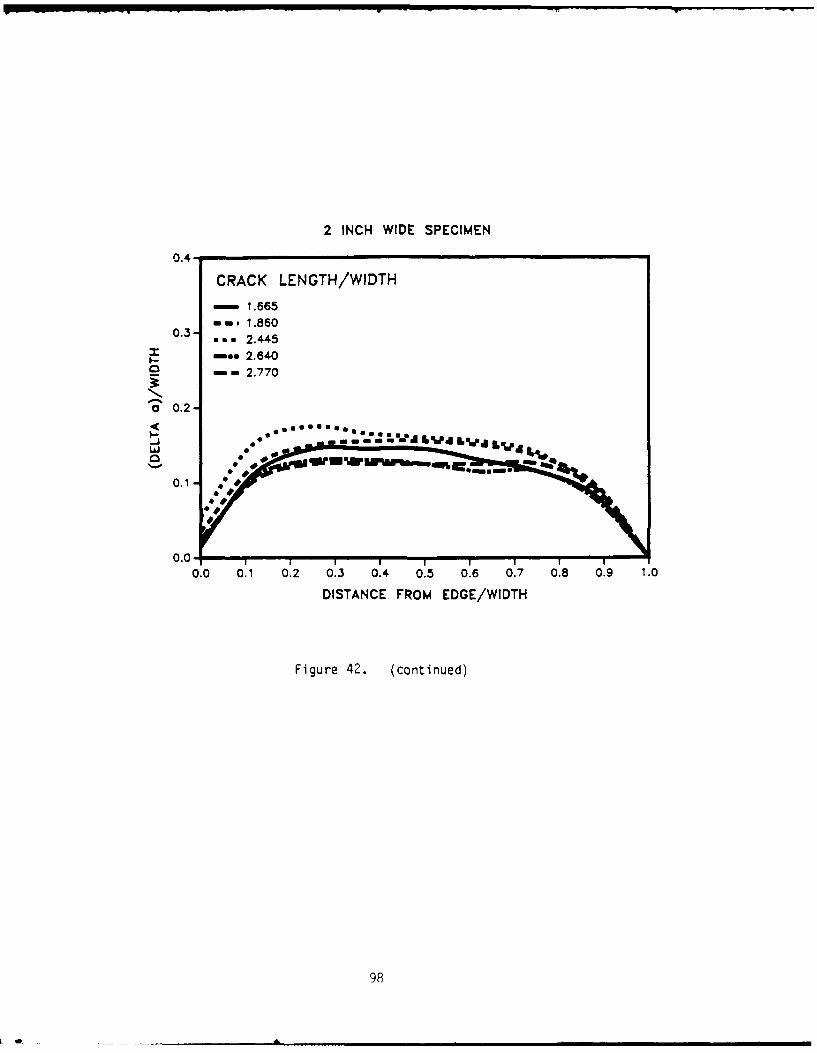
2 INCH WIDE SPECIMEN
0.4-
CRACK LENGTH/WIDTH
-1.665
iis1.8600.3- ass 2.445
-we 2.640-- mm 2.770
o0.2-
so usa.... %04L
0.0 0.1 0.2 0.3 0.4 0.5 0.6 0.7 0.8 0.9 1.0
DISTANCE FROM EDGE/WIDTH
Figure 42. (continued)
98
L 0

linear so that Eq. 3 can be used). The angle-ply layup,
being a "softer" layup, and with distributed (energy
absorbing) damage, exhibited less crack jumping and scatter
in the data. However, as shown in Fig. 43, complex fracture
mechanisms were sometimes present early in the test before
the delamination plane had been established.
The effect of fracture morphology is further
illustrated in Fig. 44 where features on the fracture
surfaces are related to the toughness measured. Note that
once a more or less uniform fracture morphology was
established, the toughness values settled into better
agreement. The two angle-ply specimens shown were next to
each other in the plate of material before cutting. Dark and
light bands were formed when the crack tip jumped forward,
then arrested. Dark regions were formed during rapid crack
advance; light regions correspond to slow crack growth.
These studies of the effect of layup illustrate a major
difference between unidirectional and multidirectional
laminate delamination behavior. The opportunity for more
mechanisms of fracture leads to a greater complexity of
behavior. It is therefore essential that attention be paid
to the fracture surface morphology when interpreting the
data.
Effect of Crack Speed on J--Tests were done to
investigate the dependence of J on crack speed. The results
for a unidirectional layup and a fiber-dominated layup are
given in Fig. 45. In both cases there is a slight decreasing
99
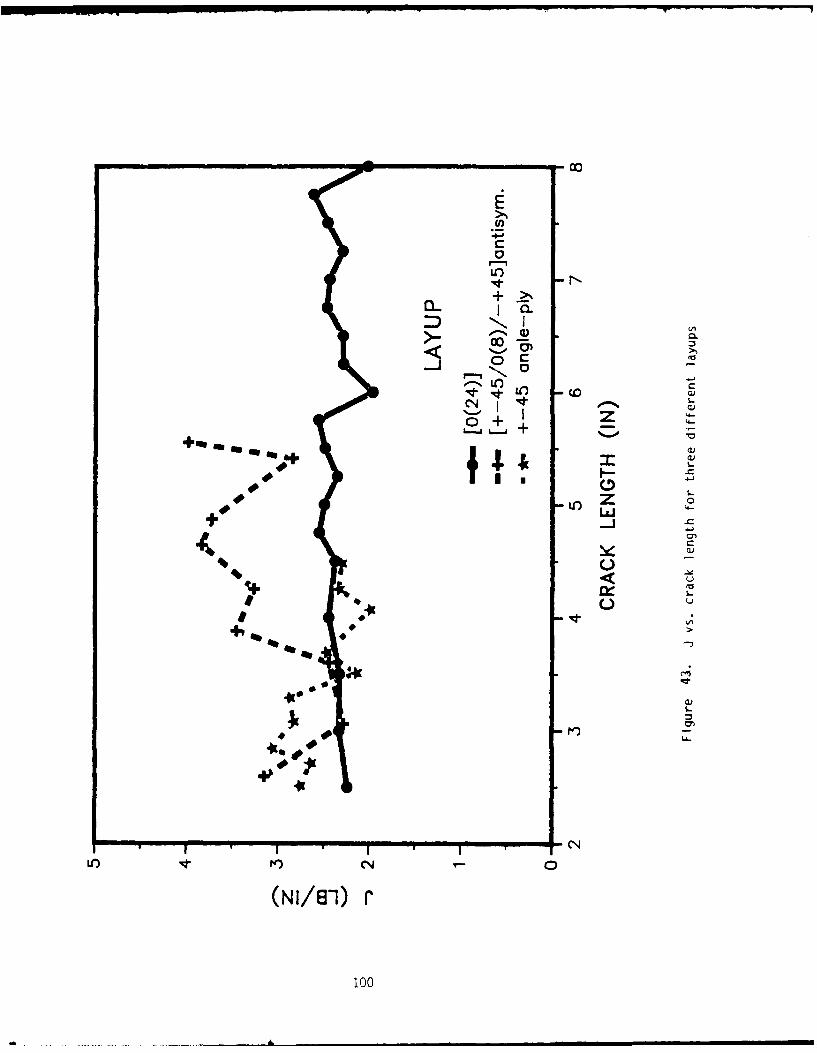
Uo
IL CL
0
N
01
CN:N
1+00
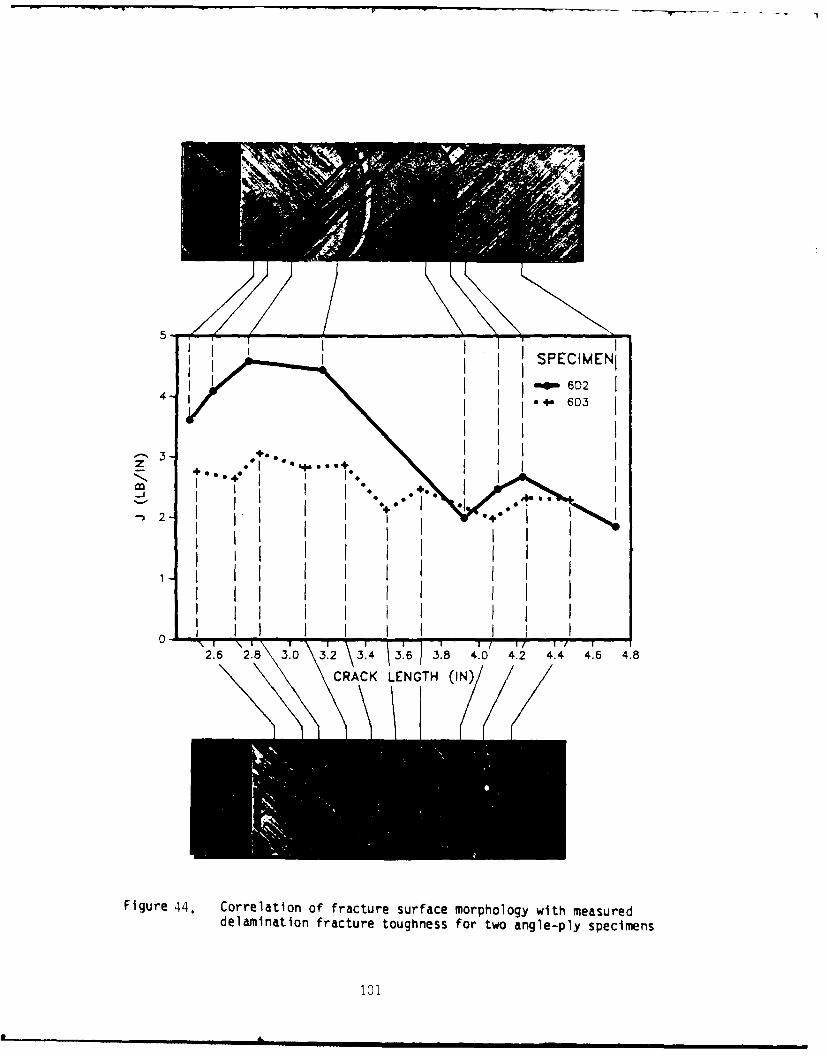
5
SPECIMEN
I 1 " 6D2 3I . ago+
I M I i I I I
i I I I I I I0 I I I I I I
SI I I I
2.6 2.8 3.0 3.2 3.4 3.6 3.8 4.0 4.2 4.4 4.6 4.8
CRACK LENGTH (IN)
Figure 44. Correlation of fracture surface morphology with measureddelamination fracture toughness for two angle-ply specimens
101

trend in J with increasing crack speed. This trend agrees
with the observation that when sudden crack jumping occurred,
a low value of toughness was usually measured. It is
significant to note that no strong trend can be established
for the range of crack speeds experienced by one specimen.
Thus, rate effects are not important in interpreting data for
individual specimens in this material tested at ambient
temperature.
Fracture Surface Morphology and J--The importance of
considering the fracture morphology when interpreting the
delamination toughness data has already been mentioned.
Macro- and microfractography were done to document the
fracture mechanisms which were observed. Two items are of
particular interest. First, when off-axis plies were present
at the fracture plane, toughness values were sometimes
elevated even in the absence of complex fracture mechanisms.
Apparently this was due to increased surface roughness caused
when bundles of fibers were pulled away from the fracture
surface. This feature was only observed for layups with
off-axis plies at the delamination plane. For a more brittle
system the phenomenon was found to give differences of a
factor of two in toughness between unidirectional and
off-axis specimens 2 5. Figure 46 is a cross-section of a
specimen (normal to the direction of crack propagation) at
the fracture surface. A bundle of fibers is separated from
the surface at this plane, but is attached to it at another
point.
102
.. ..... . . . .- i m m ~ m m

00
a) ©00
o 0 oV
- 0
0
Ec 0
a
+ 0
+ 0 ,,
0? +
CA)
0
100
+. .
+ 0)0' 1 'a(u~/q~))
10

A second phenomenon which is of significance is that
in almost all specimens tested, delamination was found to
occur within a ply rather than between two plies. Figure 47
shows a typical situation on a polished cross section at a
fracture surface. Note that the fracture plane does not pass
through the interply region, but stays a few fiber diameters
away from it. Practically, the oresence of resin-rich
regions and ply interfaces has only an indirect impact on the
mode I delamination toughness when such steady-state
morphology is present.
Future work under the follow-on grant is expanding on
these investigations of the effect of geometry, layup, rate
effects and fracture surface morphology. Further experiments
are being performed to explore the effect of specimen width,
especially as it relates to crack front curvature. The
effect of the number of plies and the bending stiffness of
the legs of the DCB specimen is being addressed. Also,
tests are being conducted with various fiber angles at the
delamination plane. The dependence of delamination toughness
on crack speed for matrix-dominated layups is also being
investigated over a wider range of displacement rates. An
attempt will be made to systematize the correlation between
fracture surface morphology and delamination toughness. In
addition to these continuing activities, new studies are
beginning to improve our understanding of the effect of
continuum damage on the apparent toughness. This will
probably include delamination tests which simulate mechanical
104

0
o~ 0000 0
I0
--FOE)
-= oo- --1%~f-" '1 .
) 0 + 0 X4 00
k U,
*7 0 0
S0 U- )
00
00
00--
'-.
I.5
0 +~
0U-
u
+ 00'
4 ( Q)l -,1Mt
0 >440
100

Figure 47a Micrograph of a polished section of a failed DCB specimenshowing the fracture surface. A bundle of fibers has beenpulled away from the surface. (150X)
Figure 47b. Micrograph of a polished section of a failed DCB specimenshowing the fracture surface. The large circles at the top arethe material used to mount the specimen for polishing. (lOOX)
106

states in real structures, such as tests using a modified DCB
specimen with bending and stretching inputs.
4.4.2 Mixed mode and Mode II Delamination of Composite
Materials
Our efforts in the characterization of mixed mode and
mode II delamination of composite materials have fallen into
three categories: (1) a comparison of the end notch flexure
and the end loaded flexure tests to see if they give
consistent values of Giic; (2) development of a J-integral
approach to evaluate mode II delamination fracture toughness
for composites made of resins which have significant
nonlinear behavior and/or split laminate specimens which give
significant geometric nonlinearity during testing; and (3)
determination of the G total as a function of the percentage
of GII as well as the state of stress ahead of the crack tip
for mixed mode loading. The results of our efforts in these
areas will be summarized in the three subsections that
follow.
4.4.2.1 Comparison of the End Notch Flexure Test and the
End-Loaded Split Laminate Test for Delamination of
Composite Materials
Several test configurations have been proposed for
measuring the resistance to delamination under mode II
loading, including the end-notched flexure (ENF) test and the
end-loaded split laminate (ELS) test. The end-notched
107
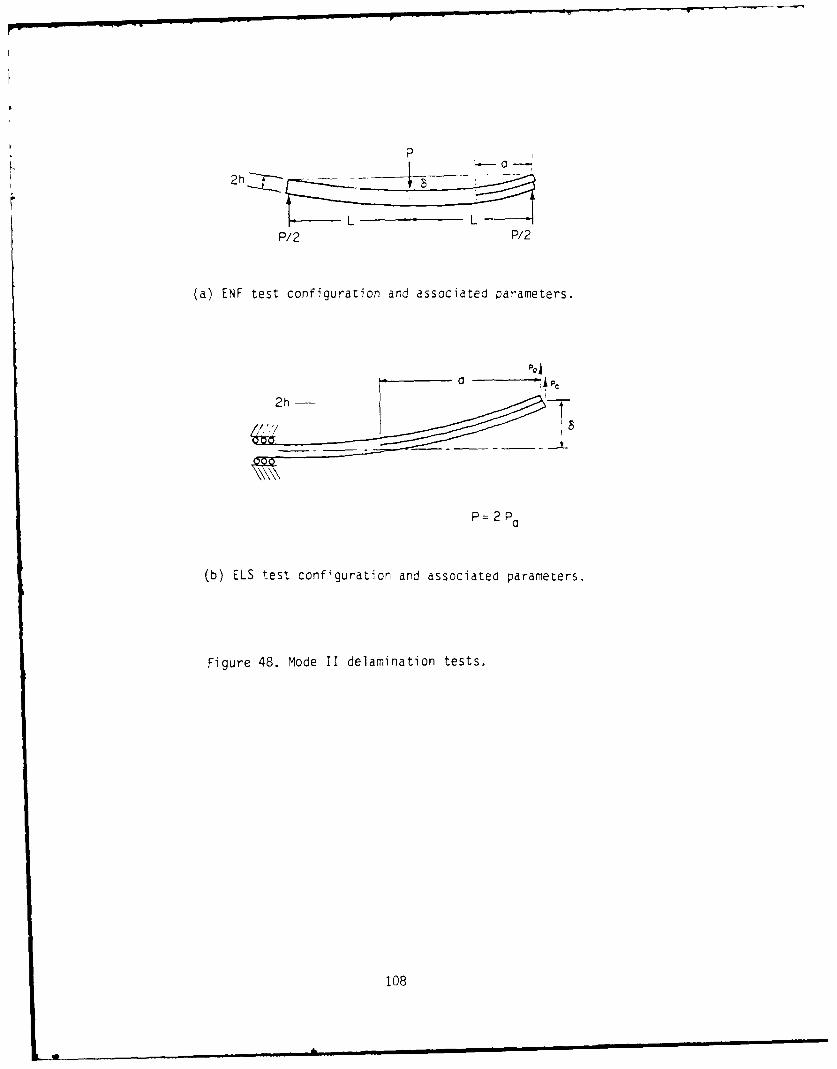
P
L LP/2 P/2
(a) ENF test configuration and associated parameters.
Clo
P= 2 Pa
(b) ELS test configuration and associated parameters.
Figure 48. Mode II delamination tests.
108
flexure test configuration can be seen in Fig. 48a. This
test consists of a laminate beam with a split on one end,
loaded in three point bending. The end loaded split laminate
test consists of a split laminate beam specimen which is
loaded at the cracked end and fixed at the opposite end (see
Fig. 48b). The experimental results from the ENF and ELS
test methods may be evaluated to give G IIc using equations
derived using linear beam theory; i.e., assuming geometric
linearity and linear elastic material behavior 3031 A
review of the current literature indicates that both test
30-32configurations are currently being used to measure GIIC
33During a recent finite element analysis , the ENF
test was found to be a pure mode II fracture test within the
constraints of small deflection theory. The study also
revealed that the interlaminar normal stress is identically
zero along the beam center line and the interlaminar shear
stress exhibits the expected singularity. A similar analysis
was performed for the ELS test configuration in this project
using the code described in 4.3. The results which were
presented in section 4.3.1.2 also indicate pure mode II
stressing along the center line.
4.4.2.1.1 Analysis
End-Notched Flexure (ENF) Test--The ENF test consists
of loading a split laminate beam specimen using a three point
bend fixture. Figure 48a shows the ENF test configuration
and associated test parameters. Calculation of the strain
109

0.074 Syy Mode I
0.06 -0 Sxy Mod*e1
o0.05-
-.- 0.04-
xV)0.03-
V ) 0 .0 1 -y 2
-10 -9 '-6 -7 -6 -5 -4 -3 -2 -1 0
Distance Ahead of Crack Tip (mm)
Figure 49, Stress distribution ahead of the crack tip formode I and mode 11 loading.
46
110

energy release rate GII assuming linear beam theory and
linear elastic material behavior gives the following
34result
9p 2 a2
9P2a 2CG = (4)
3 3
2b (2L +3a 3
where a is the initial crack length, b is the width, C is the
measured compliance, L is half-span length, and P is the
applied load at the center pin. The strain energy release
rate GII can also be obtained by means of an experimental
method for determining the relationship between compliance
and crack length. In this case, GII is given by3 4
3P 2ma2 b0
G = (5)II
2b2
where m is obtained from
3C = ma + const. (6)
This equation is obtained by making a least squares fit of a
straight line to experimental data from measured compliance
against crack length cubed. This data is obtained from
load-deflection curves at different crack lengths of one of
the tested coupons of width b0 '
End-Loaded Split Laminate (ELS) Test--The energy
release rate for pure mode II in this case is determined by
asymmetrically loading a split-laminate beam specimen.
1ii
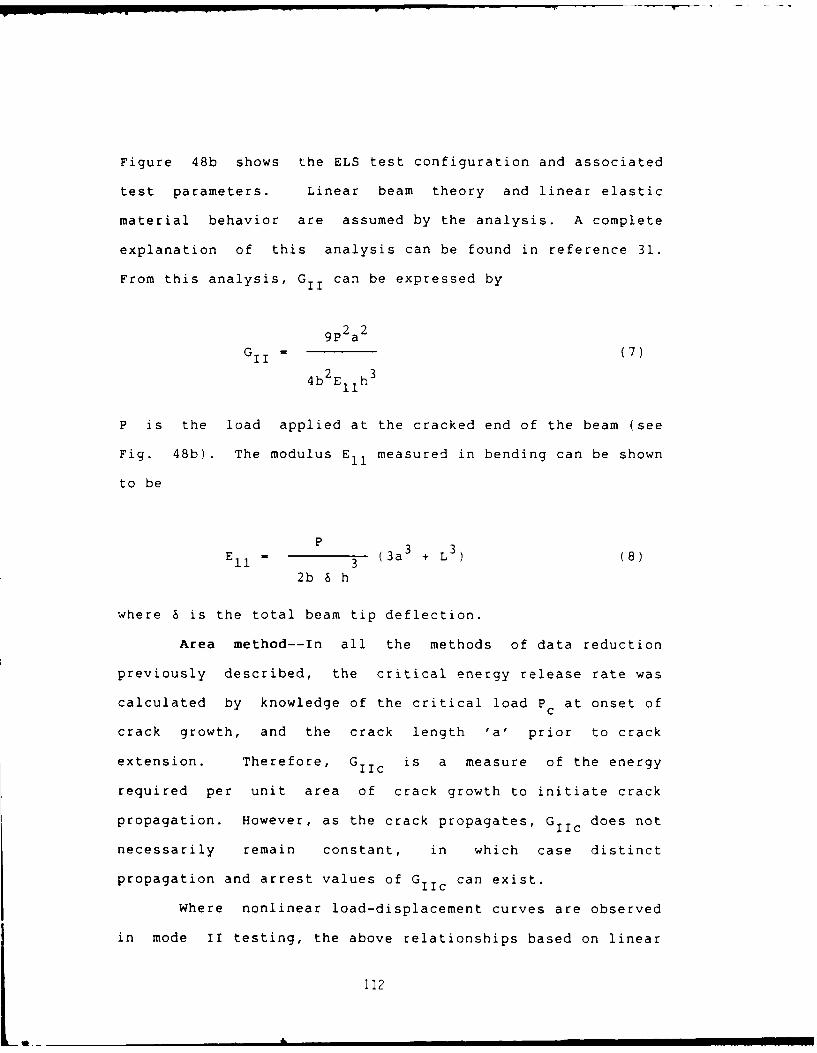
Figure 48b shows the ELS test configuration and associated
test parameters. Linear beam theory and linear elastic
material behavior are assumed by the analysis. A complete
explanation of this analysis can be found in reference 31.
From this analysis, GII can be expressed by
9P2 a
2
G II m (7)
4b2 E 1h
3
P is the load applied at the cracked end of the beam (see
Fig. 48b). The modulus E measured in bending can be shown
to be
11 3 (3a3 + L ) (8)2b 8 h
where 8 is the total beam tip deflection.
Area method--In all the methods of data reduction
previously described, the critical energy release rate was
calculated by knowledge of the critical load Pc at onset of
crack growth, and the crack length 'a' prior to crack
extension. Therefore, GIIc is a measure of the energy
required per unit area of crack growth to initiate crack
propagation. However, as the crack propagates, GIIc does not
necessarily remain constant, in which case distinct
propagation and arrest values of GIIc can exist.
Where nonlinear load-displacement curves are observed
in mode II testing, the above relationships based on linear
112

analysis are no longer accurate. An alternate approach for
evaluating the fracture toughness for nonlinear behavior is
the area method. In this case, GII is still the energy
required to create a new crack per unit area of crack surface
created. GII can then be given by
UG Ii - (9)
b 6a
U is the area between the load-deflection curve for loading
and unloading for a very small change 6a of crack growth (see
Fig. 50). An important advantage of this method is that only
elastic material behavior is required to predict GII.
Therefore, for geometrically non-linear and/or non-linear
elastic material responses, this method gives an average
release rate for the observed crack extension. For unstable
crack growth, it gives an average value for G IIc which
typically falls between the initiation and arrest values
measured for linear behavior. The load-displacement record
should return to the origin to guarantee that no significant
far field damage is included in U in Eq. 9. The inclusion of
energy dissipation in far field damage in the fracture energy
term U in Eq. 9 would give an erroneously high estimate of
G IIc For materials where GII is independent of crack growth
rate and crack growth increment (i.e., systems with minimal
fiber bridging and/or plastic wake), the average and
initiation GII should be identical. Furthermore, where slow
stable crack growth occurs, the average GIIc calculated from
P'3
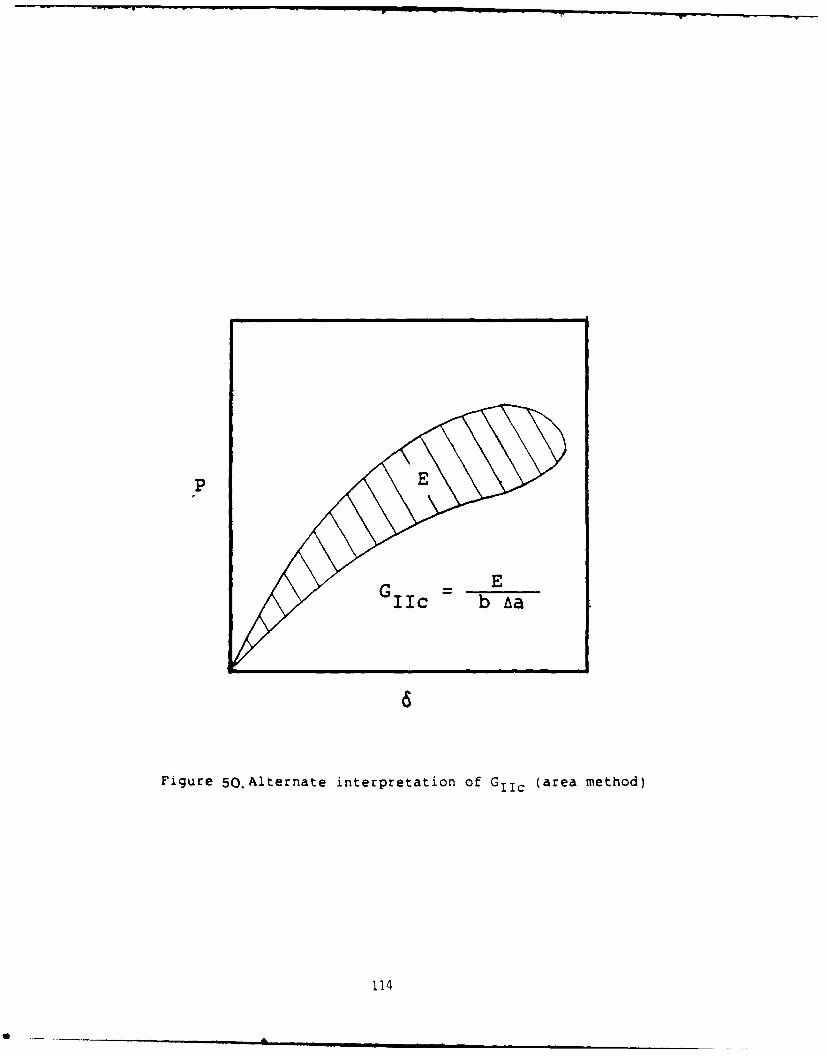
lp
G6I b&
Figure 50.Alterniate interpretation of Giic (area method)
114

the area method should equal the GIl c for initiation
calculated from linear beam theory. Another advantage of
this method is that GII is obtained without knowledge of the
materials's elastic properties and it is always given by Eq.
9, regardless of the test configuration used.
4.4.2.1.2 Experimental Procedure
Split laminate beam specimens approximately 152.4 mm
long, 25.4 mm wide, and 4.83 mm thick for the end-notched
(ENF) test and 292.1 mm long, 25.4 mm wide, and 3.05 mm thick
for the end-loaded split laminate (ELS) test were cut from 24
ply laminated panels of Hercules AS4/3502 and Hexcel
T6C145/F185 graphite/epoxy composites. The starting crack
was introduced in both panels by putting a teflon insert
0.127 mm thick at the midplane during layup. Loading tabs
were bonded to the cracked end of the ELS test specimens with
a two-part structural adhesive. A Tenslac UN-10A gray
brittle coating was also applied to the edges of the specimen
to facilitate measurement of crack length by making the
location of the crack tip more evident.
End-Notched Flexure Testing--Five specimens for each
graphite/epoxy system were tested using a three point bend
fixture with outer loading points 101.6 mm apart attached to
a closed loop servo-hydraulic test machine. Prior to
testing, the specimens were precracked in order to provide a
sharp crack tip from which to initiate the mode II fracture.
Load point displacements were measured by the ram
115

displacement and loads were monitored by a 2225 N load cell.
Real-time analog plots of the load-deflection curve were made
on an x-y recorder. The tests were conducted by positioning
the crack tip approximately midway between the center and one
of the outer loadings pins. Under displacement control
conditions and a ram rate of 2.54 mm/min, the specimens were
loaded until delamination crack growth occurred. Then, the
specimens were unloaded.
Since machine stroke displacement was used to measure
specimen deflection, a machine compliance experiment was
performed to make the necessary deflection corrections to the
data obtained during the mode II delamination tests.
G IIc calculations were made using Eq. 4 and measured
compliances after appropriate machine compliance corrections
had been made. It should be noted that corrections
associated with shear compliance were not taken into
consideration because no reliable values of the shear modulus
G12 were available. However, these corrections are usually
small and the omission was not thought to have a significant
effect on the measured GIic values. The measured compliances
were obtained by curve fitting the best straight line to the
load-displacement data from the loading part of the test.
Equations 5 and 6 were also used to calculate G IIc . To use
these two equations, a compliance calibration was performed
with one of the tested specimens. Finally, GIIc values
calculated by the area method were determined by means of Eq.
9. The energy absorbed in the creation of a new cracked
116

surface was approximated numerically by integrating the area
under the load/deflection curves obtained.
End-Loaded Split Laminate Testing--Two specimens for
each graphite/epoxy system chosen for this study were tested
in a closed loop servo-hydraulic machine. A mode I precrack
was introduced to the specimens to sharpen the initial crack
created by the teflon insert and to provide an initial crack
length to beam length (a/L) ratio of approximately 0.55,
35where stable crack growth is expected
Mode II delamination testing was done under
displacement control at a rate of 10.16 mm/min and 6.35
mm/min. Loads were recorded with a 445 N load cell.
Displacements were monitored using the ram displacement of
the test machine. The tests were conducted by loading the
specimens until the crack was allowed to grow approximately
10 mm to 38 mm. At that point the test was stopped and the
new crack location marked and recorded. This procedure was
repeated several times with the same specimen until the crack
tip was approximately 12.7 to 25.4 mm from the uncracked end.
The critical energy release rate G IIc waz calculated
by means of Eqs. 7 and 9. The modulus E was calculated
from the load-deflection test data and Eq 3. The energy
absorbed in the creation of a new cracked surface was
approximated numerically by integrating the area under each
loop in the load-deflection curves.
4.4.2.1.3 Results and Discussion
117
. . . . .. . . .. . . . .Im

End Notched Flexure (ENF) Test Results--Table 2 shows
the ENF test results for both graphite/epoxy systems
investigated. Method I corresponds to G IIc values obtained
using beam theory equations (Eq. 4) and measured compliances.
Method II results are based on the compliance calibration
(Eqs. 5 and 6). Method III refers to data reduction based on
the area method (Eq. 9) and the energy dissipated under the
load-deflection curve. Delamination crack growth occurred at
typical load values of 556 to 612.5 N for AS4/3502
graphite/,epoxy and was unstable for this material. Figure 51
shows a typical load-deflection curve of AS4/3502 graphite
epoxy showing the sudden drop of load as unstable
delamination crack growth occurs. This indicates that the
G Ilc values measured using the area method will be an average
of the initiation value and the value for rapid, unstable
crack growth. The very small nonlinearity just prior to
crack extension is probably associated with the development
of a crack tip damage zone.
The average critical energy release rate G IIc for
AS4/3502 using methods I, II, and III of data reduction were
2 / 2, 61560 J/m , 648 J/m 2 , and 613 Jim 2 , respectively.
Figure 52 shows a typical load-deflection curve
obtained for mode II delamination testing of T6C145/FI85
graphite/epoxy. Crack growth was stable as seen in the upper
part of the curve. However, the point at which crack growth
occurred is not well defined. Therefore, the maximum load
reached during each test was used to estimate the onset of
118

Table 2.- End-notched Flexure (ENF) Test Results.
GTI c (J/m2)
Materi Specimen 1 II I
AS4/3502 1 525 648 6132 508 630 5953 560 682 6134 5-3 648 630
AV. 543 648 613
----------------------------------------------------------------
T6CI45/F135 I - 22402 - 26952 - 2435
1995
Av. - 2398
* No ca'cula:ior of is posime cue to significant nonlinearity in1oao/def'ec:ion curves. one uses linear portion of curves to measurecompliance and Prax for crack extension (ignoring nonlinear behavior near
lmax)' Guc I deounc values oF 1225 may be calculated.
119

665
532
- 399
o 266
133 AS4/3502
0 1"
0 .51 1.02 1.53 2.04 2.55
DEFLECTION (mm)
Figure 51. Typical mode II delamination load/deflection record ofAS4,'3502 using the end-notched flexure test.
1780
1424
£ 1068
712
356 T6C145/FI85
0 .76 1.52 2.29 3.05 3. 1
DEFLECTION (um)
Figure 5. Typ1cdi mode 1: deiaminatior Ioal jefIection record ofT6C!45 F 189 s g tne endo-r.ct,-,ec f.exure test.
12

crack growth. These values were between 1390 and 1632 N.
The curve also indicates inelastic behavior of the material
(i.e., the unload curve did not return to the origin).
Therefore, the assumptions of the test have been violated.
It should be noted that the load-deflection curves at
different crack lengths used for the compliance calibration
also showed non-linear behavior. However, the energy release
rate obtained by the area method gives a better approximation
of the critical energy release rate G IIc because at least the
geometrically non-linear behavior of the specimen is taken
into consideration by this method. The calculated average
GIIc of 2400 J/m2 should be considered an upper bound
estimate of the mode II critical energy release rate of
T6C145/F185 because the inelastic behavior is not accounted
for in this analysis. A J-integral approach to be discussed
in the next section has been developed to obtain a more
meaningful measure of the mode II delamination fracture
toughness of this system.
End-Loaded Split Laminate (ELS) Test Results--The ELS
test results are seen in Table 3. Method I corresponds to
GIl c calculated using Eq. 7 and with E11 calculated from Eq.
8 and test data. Method II corresponds to the area miethod
(Eq. 9). An average E11 of 125.5 GPa for AS4/3502 and 109.9
GPa for T6C145/F185 were calculated. Figure 53 shows a
typical load-deflection curve obtained by testing one of the
AS4/3502 specimens. As seen in this figure, unstable crack
growth is observed for the first crack extension. This is
121
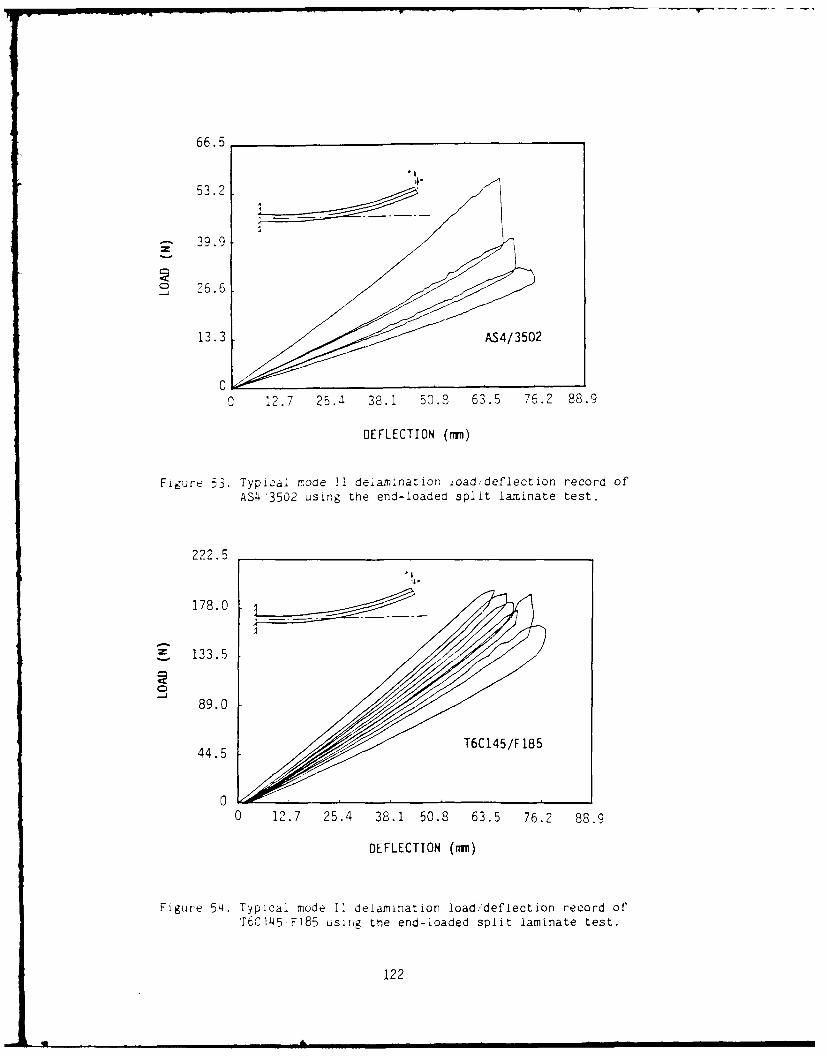
66.5 __ _ _ _ _ _ _ _ _ _ _ _ _ _ _ _ _ _ _ _ _ _ _ _
53.2
-~39.9
C 26.6
13.3 A430
00 12.7 25.4 38.1 50.3 63.5 76.2 88.9
DEFLECTION (rwr)
Figure 53. Typical mode 11 delamination ioad,/deflection record ofAS4 '3502 using the end-loaded split laminate test.
222.5
178.0
S 133.5
89.0
44.5 615F8
0 12.7 25.4 38.1 50.8 63.5 76.2 88.9
DEFLECTION (num)
Figure 54. Typical mode 1: delamination load,'deflection record ofT6C145 F185 using thie end-loaded split laminate test.
122
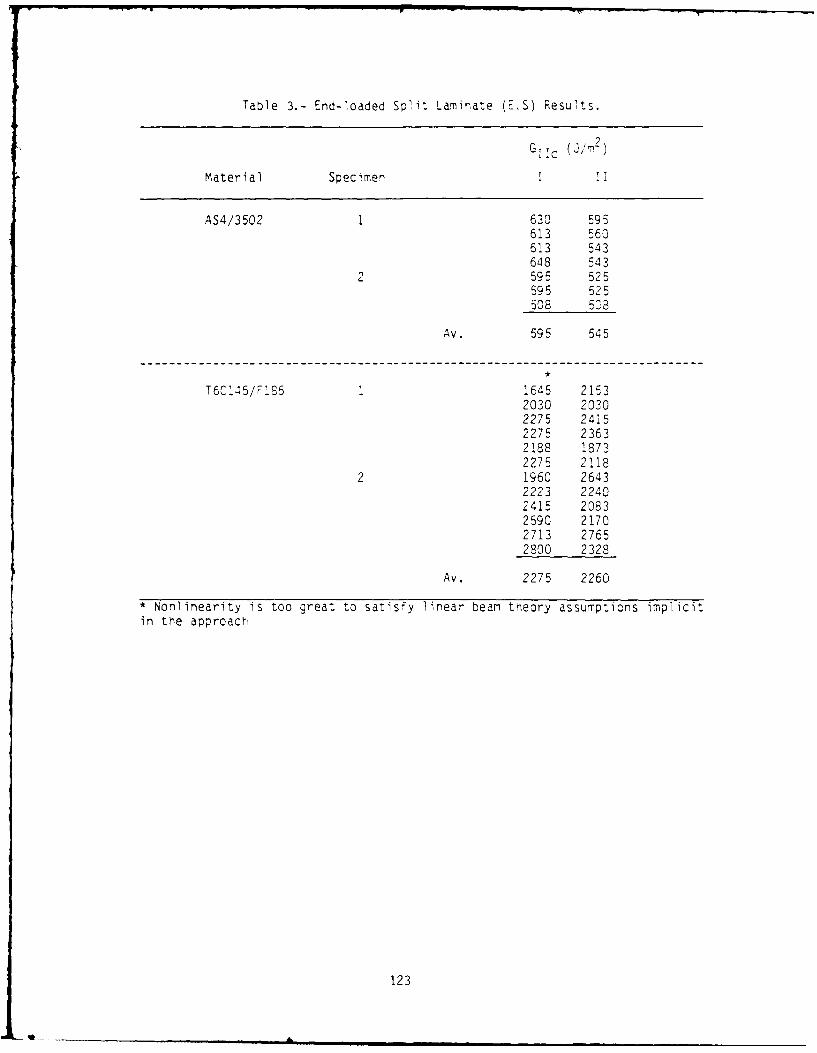
Table 3.- End-loaded Split Laminate (ELS) Results.
GI :c (J/m2
Material Specimen I 1.1
AS4/3502 1 630 595613 560613 543648 543
2 595 525595 525508 508
Av. 595 545
T6C'145/F'S5 1645 21532030 20302275 24152275 23632188 18732275 2118
2 1960 26432223 22402415 20832590 21702713 27652800 2328
Av. 2275 2260
* Nonlinearity is too great to satisfy linear beam theory assumptions implicitin the approach
123
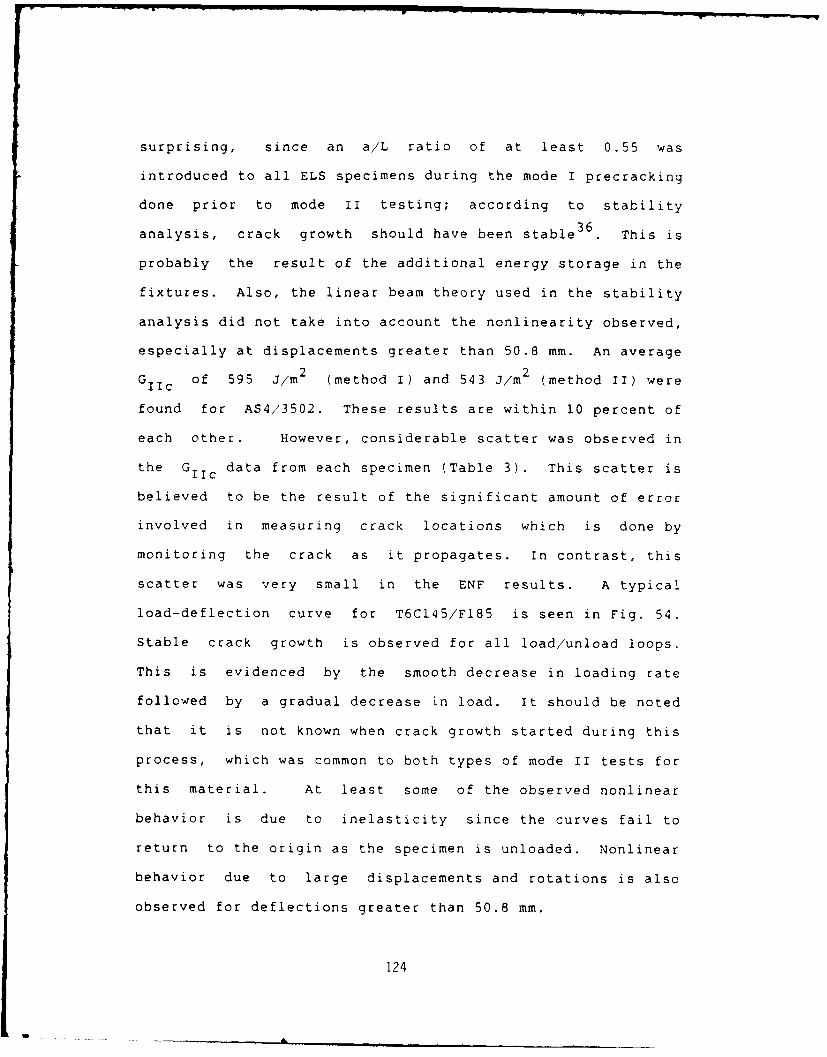
surprising, since an a/L ratio of at least 0.55 was
introduced to all ELS specimens during the mode I precracking
done prior to mode II testing; according to stability
analysis, crack growth should have been stable This is
probably the result of the additional energy storage in the
fixtures. Also, the linear beam theory used in the stability
analysis did not take into account the nonlinearity observed,
especially at displacements greater than 50.8 mm. An average
G of 595 J/m 2 (method I) and 543 J/m 2 (method II) were
found for AS4/3502. These results are within 10 percent of
each other. However, considerable scatter was observed in
the GII c data from each specimen (Table 3). This scatter is
believed to be the result of the significant amount of error
involved in measuring crack locations which is done by
monitoring the crack as it propagates. In contrast, this
scatter was very small in the ENF results. A typical
load-deflection curve for T6C145/F185 is seen in Fig. 54.
Stable crack growth is observed for all load/unload loops.
This is evidenced by the smooth decrease in loading rate
followed by a gradual decrease in load. It should be noted
that it is not known when crack growth started during this
process, which was common to both types of mode II tests for
this material. At least some of the observed nonlinear
behavior is due to inelasticity since the curves fail to
return to the origin as the specimen is unloaded. Nonlinear
behavior due to large displacements and rotations is also
observed for deflections greater than 50.8 mm.
124
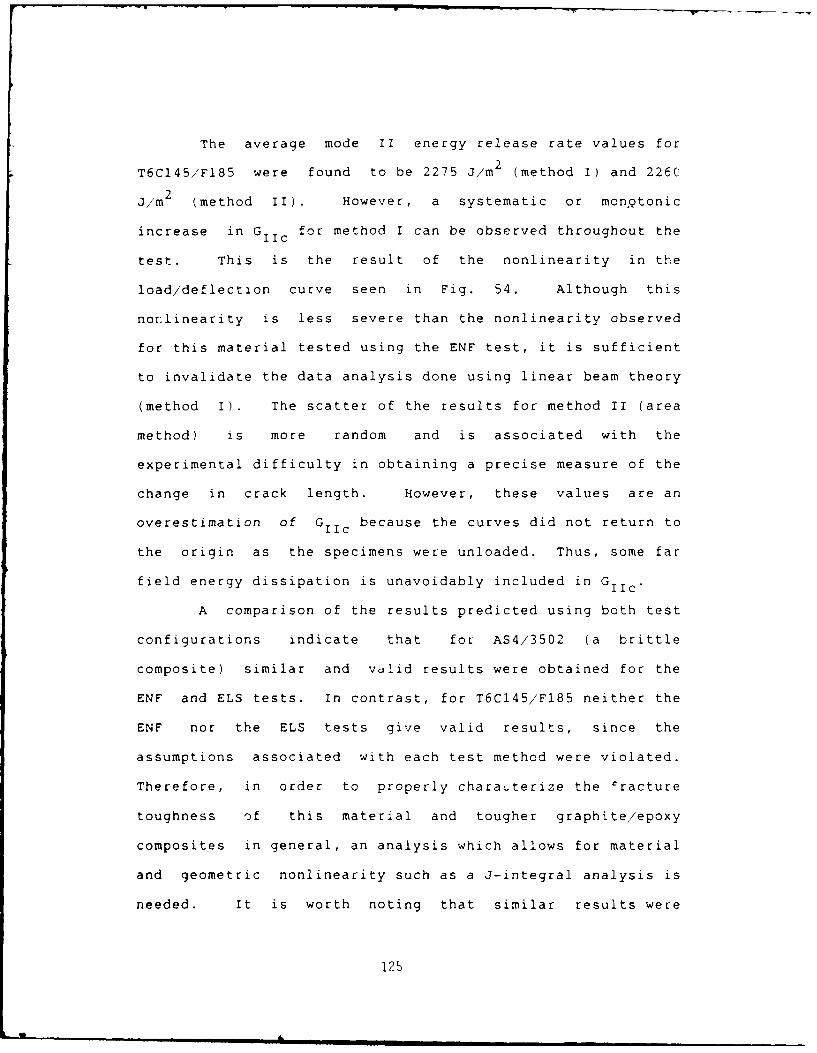
The average mode II energy release rate values for
T6CI45/F185 were found to be 2275 J/m 2 (method I) and 2260
J/m 2 (method II). However, a systematic or mon9tonic
increase in G II c for method I can be observed throughout the
test. This is the result of the nonlinearity in the
load/deflection curve seen in Fig. 54. Although this
nonlinearity is less severe than the nonlinearity observed
for this material tested using the ENF test, it is sufficient
to invalidate the data analysis done using linear beam theory
(method I). The scatter of the results for method II (area
method) is more random and is associated with the
experimental difficulty in obtaining a precise measure of the
change in crack length. However, these values are an
overestimation of Giic because the curves did not return to
the origin as the specimens were unloaded. Thus, some far
field energy dissipation is unavoidably included in GII e .
A comparison of the results predicted using both test
configurations indicate that for AS4/3502 (a brittle
composite) similar and valid results were obtained for the
ENF and ELS tests. In contrast, for T6C145/F185 neither the
ENF nor the ELS tests give valid results, since the
assumptions associated with each test method were violated.
Therefore, in order to properly charauterize the Cracture
toughness of this material and tougher graphite/epoxy
composites in general, an analysis which allows for material
and geometric nonlinearity such as a 3-integral analysis is
needed. It is worth noting that similar results were
125

obtained for the ENF and ELS when data was analysed using the
area method. However, both results should be considered
upper bounds of the mode II critical energy release rate of
the material. In the next subsection, an analysis for J Ic
will be presented.
4.4.2.2 J-Integral Approach for Mode II Delamination Fracture
Toughness Evaluation
Most of the current analyses to measure delamination
resistance in composites are elastic analyses based on linear
fracture mechanics (i.e. energy release rate). However,
these analyses may become inappropriate when the inelastic
material behavior observed in the delamination process is
sufficient to give nonlinear behavior in the measured
load-displacement curves and/or permanent deformation on
unloading. This inelastic behavior may be due to
microcracking or extensive resin deformation. In fact,
Corleto and Bradley have noted that under mode II loading,
composite systems with tough matrices show considerable
non-linear behavior due to extensive microcracking and
yielding of the resin prior to macroscopic delamination crack
37extension
Successful fracture characterizaticn of metals with
inelastic behavior (i.e. small scale yielding) has been done
38by means of Rice's path-independent J integral The use of
this parameter as a fracture criterion has been based on a
consideration of the Hutchinson-Rice-Rosengren (HRR) 3 9 4 0
126

crack tip model where the stress and strain fields ahead of a
crack may be characterized in intensity by J. McClintock 4 1
has further demonstrated that for deformation plasticity
theory a singularity in r (the radial distance from the crack
tip) exists which is strongly related to the J integral.
However, the path independence of this integral may not hold
true when variable damage develops as a result of unloading.
Therefore, the J integral is limited to linear, nonlinear
elastic, and elastic-plastic behavior under monotonic
loading. Alternatively, the critical value of J may be
thought of as giving the energy release rate required for
crack growth for nonlinear elastic materials.
In the case of fiber reinforced composite materials,
th~± use of the J integral as a failure criterion has been
very limited and confined to experimental approaches (i.e.,
indirectly measuring J from load-displacement data via its42-45 42
energy interpretation ). However, Agarwal et.al , have
shown that for short fiber composites, the stress-strain
behavior of the composite may be closely approximated by the
Ramberg-Osgood relation (i.e., a.. = al(E ) n )x, justifying
the use of the J integral as a fracture criterion for short
fiber reinforced composite materials. Furthermore, they
argued that since the local unloading of the matrix resulting
from microcracking and debonding at the interface does not
necessarily also occur in the fibers, this observed crack tip
damage does not lead to material unloading to the same extent
as a crack extension does in metals. Therefore, although the
127
requirement of no unloading is not completely met, its
influence will be quite small for some applications, and
thus, may be ignored for some applications.
In a recent investigation, an additional approach for
characterizing fracture of inelastic composite materials has46
been made by Schapery . He uses strain-energy like
potentials to characterize material response (i.e., a.. =
aw/a ij). Theoretical support for the existence of these
potentials is given by the thermodynamics of reversible
processes. The potentials are free energy and internal
energy for isothermal and adiabatic processes, respectively.
Schapery argues that if a potential of this nature exists, it
is often possible to use Rice's J integral theory 3 8 to
simplify fracture analysis.
In the present analysis, an approach similar to
Schapery's is proposed to evaluate the mode -I fracture
toughness of composite laminates with inelastic behavior. J
is defined for the end-loaded split laminate test (mode II)
specimen and the implications of the analysis reviewed.
Also, some limited assessment of the proposed method has been
done. A more complete evaluation of the utility of JII to
evaluate mode II delamination fracture is being undertaken in
the new contract.
4.4.2.2.1 Theoretical Model
Figure 5 shows the unsymmetric end-loaded split
laminate test used to determine the critical energy release
128

rate G II c for the mode II delamination of fiber-reinforced
composite materials. The test consists of loading an split
laminate at the cracked end, with the opposite end fixed to
achieve a mode II stress state at the crack tip. As has been
previously noted, inelastic behavior has been observed for
29composite systems with tough matrices Further, inelastic
behavior is expected if a significant volume fraction of off
angle fibers are present in the layup. This inelastic
behavior then invalidates the standard elastic methods used
to measure fracture toughness. In order to develop an
analysis where inelastic behavior is accounted for, consider
Rice's J integral, as extended to crack growth in inelastic
47media with large deformation by Schapery
J = C1 [w0dx 2 - T i (au ix ) dL (10)
where w0 is the work potential density, T i the tractions
along C 1 , and u i the displacements. A rigorous proof and
support for the use of work potentials to characterize the
behavior of materials and structures with damage is given
elsewhere. Figure 56 shows the counterclockwise integration
path C1 . The contribution to J from this contour comes from
the left and right vertical segments only, since for the
outer horizontal segments, dx 2 = T 1 = T 2 = 0 which also holds
true for the inner vertical segments (crack surfaces) if
friction is assumed to be negligible between the crack
surfaces. Further, assuming small strains and that the left
vertical segment experiences small rotations and right
129

2P
13 W3TH
L
Figure 55. End-loadec split laminate test used for mode il delaminationof composites.
x 2 L
Figjre 5c. Contour used to evaluate J11 for the end-loaded splitlaminate test.
130~

vertical segment is evaluated far enough away from the crack
tip and fixed end as to avoid nonuniformity in the stress
field, using small rotation theory
2 M du 2 1 M_ du 2
f- [ k dM - P k - - dM - 2P- ] (11)B 0dx I L B dx1 R
where M and du2/dx 1 are the moment and slope, respectively.
The subscript L and R indicate evaluation of the integrals
corresponding to the left and right vertical segments,
respectively. B is the width of the specimen. If k -
d2u2/dx 12 is used to obtain the slope, Equation 11 reduces to
M aM a
[2 fk dM] - [ dM (12)B 0 L 0 R
where Ma corresponds to the moment at the crack tip. (See
Appendix I for a detailed derivation of this equation).
Equation 12 indicates that the result is independent of the
location of the segments and both are equal to that evaluated
at the crack tip. This path independence will be met as long
as the crack propagates at a constant maximum moment Ma. For
a long laminate that is initially homogenous in the x1
direction, constaiit Ma indicates that the stress and strain
state in the neighborhood of the crack tip is independent of
crack length (self similar growth condi ions). Under this
condition, the energy release rate GII can be shown to be
equal to JII calculated using Eq. 12. Further, since small
131

rotations are only required from the fixed end up to the
neighborhood of the crack tip, Eq. 12 will also be valid for
large rotations at the loaded end. See Ref. 46 for further
explanation of the ability of this type of analysis to
characterize fracture.
Equation 12 can be shown to reduce to GII as gi',en by
linear beam theory by substituting k=M/EI, and noting that
M-M a-Pa for the left segment, M=M a=2Pa for the right segment,
48and I L=I R'8 This gives,
226 P a2
SII = (13)
where IR is the moment of inertia of the uncracked segment of
the beam.
4.4.2.2.2 Experimental Methods
Limited experimental verification of JII as given by
Eq. 12 has been done with a 1.0 x .121 in. x 8.0 in. and a
1.0 in. x .188 in. x 6.0 in. split laminate of unidirectional
AS4,/3502 and T6T145/"F185 composites, respectively. The
former one has a brittle matrix and the latter one a tough
matrix. Typical mode II delamination tests have been
performed on both composite systems, carefully recording the
moment arm (distance from load line to crack tip) and load at
onset of crack growth. Moment-curvature relationships (e.g.,
Fig. 57) for these composites have been obtained with beams
having one-half (cracked portion) and full lay-up (uncracked
132

119
portion) of the split laminates tested in mode II
delamination. Finally, JII calculations where obtained with
= - [ 2 (shaded area L) - (shaded area R)] (14)B
where shaded area L and shaded area R are shown in Fig. 57.
4.4.2.2.3 RESULTS AND DISCUSSION
Figure 58 shows the load/deflection curves obtained
for the delamination tests. Stable as well as unstable crack
growth occurred on both systems. Figures 59 and 60
correspond to the moment-curvature relationships. For both
systems these relationships were linear. Figures 61 and 62
show the JIIc and GIIc values measured, plotted as a function
of crack length for AS4/3502 and T6T145/Fl85, respectively.
Also, Tables 4 and 5 show the overall results obtained during
the tests. An average JIIc of 2.5 lb/in and a GIIc of 2.7
lb/in for AS4/3502 and JIIc of 12.0 lb/in and GIIc. In the
case of AS4/3502 the difference between J and G amounts to no
more than 10 percent. This small discrepancy can be
explained by carefully observing the load/deflection record
in Figure 58a. Notice how the curves consistently have a
steeper slope as the load increases indicating a stiffening
effect. Obviously, GII which is based on linear beam theory
will measure higher values of the energy release rate. This
stiffening effect is not well understood yet but in this
case, it seems that it is not due to large rotations and
133
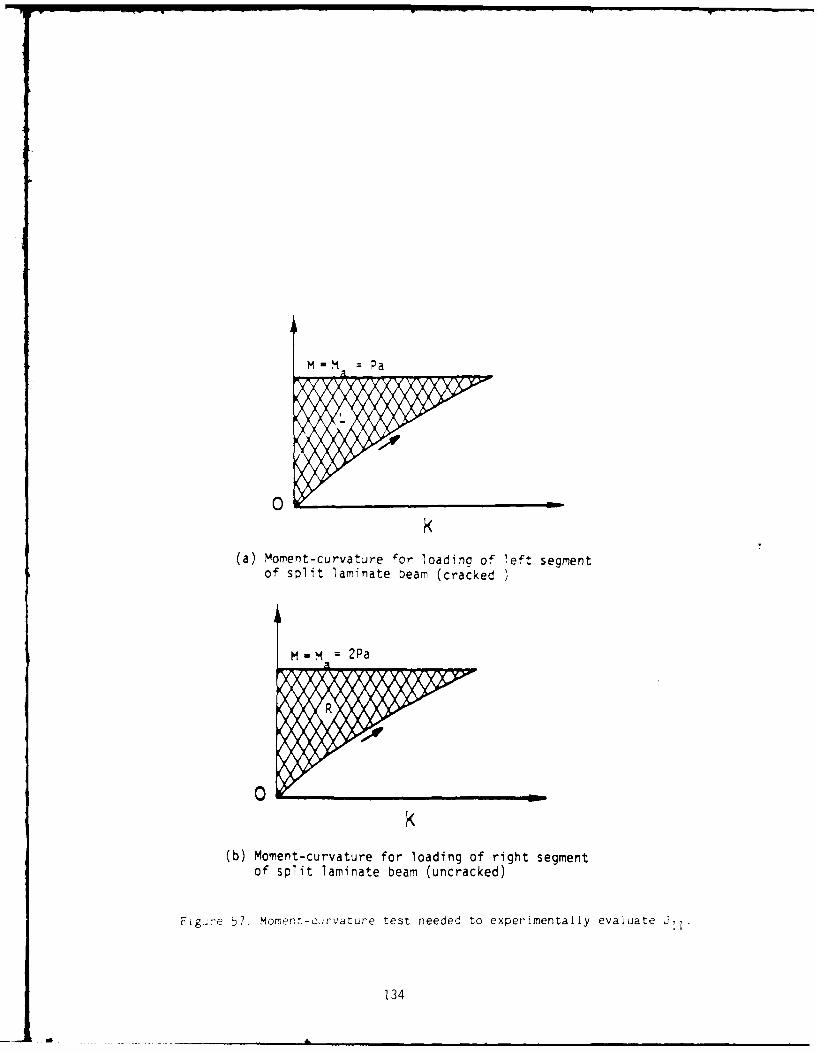
(a) moment-curvature 'or loadino of left segment
of split laminate beam (cracked
0
(b) Moment-curvature for loading of right segmentof split laminate beam (uncracked)
Figure 57. Momer,-citrvature test needed to experimentally evaluate J,
134

0 (L)
C 04
OE0
Q
UU
C14 c
Lj)0 -
.2
Ln
0o0E
q0 00
135
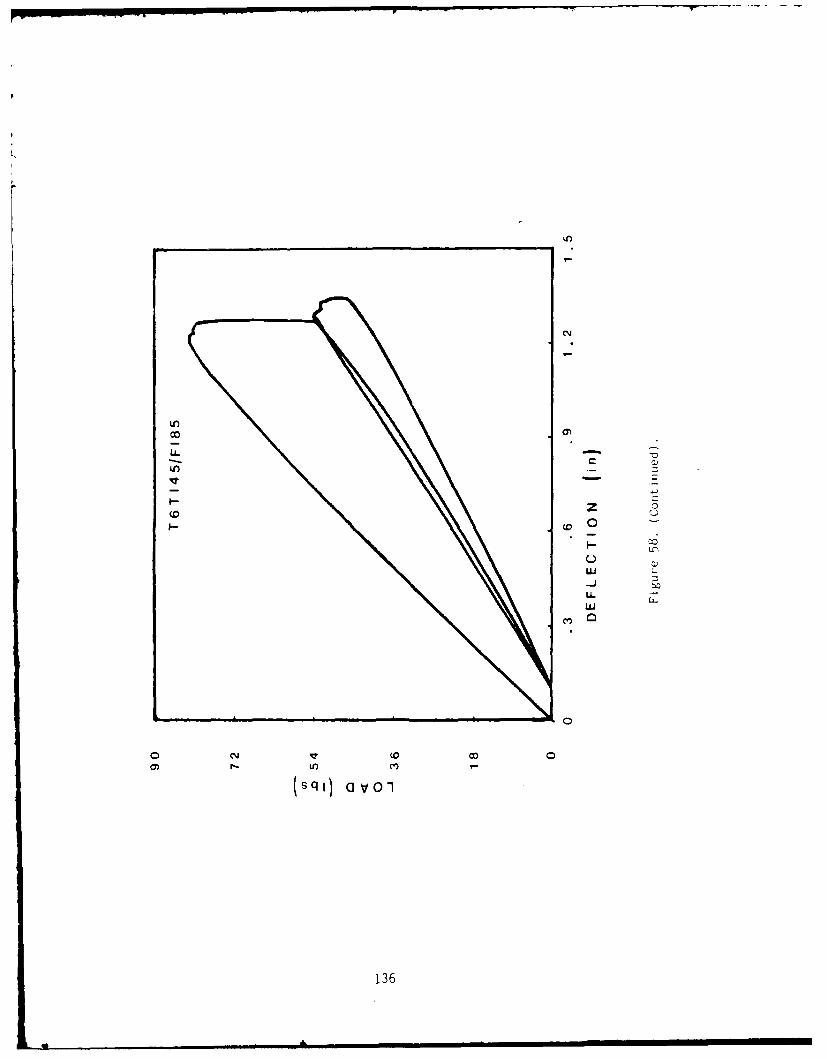
LI)00)
z0
-
LzL
0
136

AS4/3502 (Thickness = h/2)60-
50-
M 40-
z30-
zL&J
0= 20-
10-
0 -0.00 0.02 0.04 0.06 0.08 0.10 0.12 0.14 0.16
CURVATURE (1/IN)
Figure 59a. Moment-curvature relationship corresponding to the crackedportion of unidirectioanl AS4,'3502 composite.
137

AS4/3502 (Thickness : h)250-
200-
1 150-z
z:2 100-0
50-
000.00 0.01 0.02 0.03 0.04 0.05 0.06 0.07 0.08 0.09
CURVATURE (1/IN)
Figure 59b. Moment-curvature relationship corresponding to the uncrackedportion or" unidirectional A.4/3502 composite.
138

T6T145/F185 (Thickness = h/2)120-
100-
O 80-
z%.1
60-I
z:20- 40-
20-
00.00 0.01 0.02 0.03 0.04 0.05 0.06 0.07 0.08 0.09
CURVATURE (1/IN)
Figire 6ud. Moment.-Curvture reiAt oionsnp cc.rresponding to the cra c, Jportion of unidlrectionai T6T145 F185 composite,
139

T6T145/F185 (Thickness h)400-
300-
.J
z200-
zLbJ
0
100-
0.000 0.005 0.010 0.015 0.020 0.025 0.030
CURVATURE (1/IN)
Fi~gre 6oh. Mmert-curvature relationship corresponding to the uncrackedportion of unidirectional T6T145,'F185 composite,
140

AS4/3502 (Unidirectional)
2.9 -
* G (Linear Beam Theory)* J Integral
2.8-
Z'2.7-
2.6-
0-~2.5-
2.4
2.3 -I
6.6 6.7 6.8 6.9 7.0 7.1
CRACK LENGTH (IN)
Figure 61. Mode 11 fracture toughness as a function of crack length ofun,,directional., AS4;35O2 compos;ite.
141
deflections since the a//L ratios for this test are within the
linear regime. Instead, friction between the cracked
surfaces can be a factor contributing to the problem,
especially as the crack grows. If this is the case, the
proposed JII will not take into consideration these friction
effects, and thus, will give an artifically high indication
of the energy required per unit area of crack growth.
For T6T145/F185, G 1Ic is at least 20 to 25% higher
than JIIc* Observing the load/deflection record (Fig. 58b)
for this system during delamination, it can be seen that the
curves failed to return to the origin upon unloading,
indicating inelastic deformation during the test. It is very
clear that G IIc will yield a overestimate of the critical
energy release rate because some energy was dissipated in the
far field, but was included in the energy associated with
creating an new surface. Corleto and Bradley have noted that
the inelasticity for these composite systems with tough
matrices is the result of considerable matrix deformation and
37yielding ahead of the crack tip (long damage process zone)
In contrast, JIIc appears to successfully measure the
fracture toughness of this material as evidenced by the lower
Jc values measured. Further, the small scatter and
consistency found in the measured J IIc values indicate a
constant crack tip moment when the crack was growing.
Therefore, the path independence and self similar growth
conditions assumed by the analysis were not violated.
Finally, even these this limited results are
142

Table 4. Mode II Fracture Toughness of Unidirectional AS4/3502 Composite.
Crack Length Moment Arm PC McM G b/in(in) (in) (in-lb) (in-Yb)
6.53 6.4 9.9 31.68 63.36 2.53 2.386.6 6.45 9.95 32.09 64.18 2.61 2.446.72 6.5 9.9 32.18 64.35 2.68 2.466.79 6.6 9.86 32.54 65.08 2.7 2.516.88 6.7 9.69 32.46 64.92 2.68 2.507.05 6.8 9.5 32.1 64.2 2.71 2.447.17 6.75 9.57 32.3 64.6 2.85 2.47
Avg. 2.68 2.46
PC - Critical load.Mu - Crack tip moment applied to uncracked portion of split laminate.M - Crack tip moment applied to each of the cracked portions of
split laminate
Table 5. Mode II Fracture Toughness of Unidirectional T6T145/F185 Composite.
Crack Length Momen~t Arm P M M C11 II(in) (in) (lg) (in-Yb) (in-Yb) flb/in)
3.3 3.24 81.68 132.24 264.48 14.45 11.663.5 3.44 79.61 136.91 273.82 15.45 12.455.18 5.05 52.6 132.81 265.63 14.78 11.765.33 5.3 50.6 134.09 268.18 14.31 11.995.55 5.48 49. 134.26 268.52 14.35 12.02
Avg. 14.7 12.
143

M 1I45/171185 (Unidirectional)
16-
* G (Linear Beam Theory)
15-
14-
1.3
0
12
11 II
3.4 3.6 3.8 4.0 4.2 4.4 4.6 4.8 5.0 5.2 5.4
CRACK LENGTH (IN)
Figure 62. Mode ji 'ractuire toughness as a function Of CraCk length oilunidirect ional T6T1l45,F185 composite.
144

encouraging, a complete assessment of this analysis will
require testing composites with different extents of damage
induced by layups dominated by off axis fiber orientations.
Further, the effects of variable ply thickness and specimen
widths on J should be assessed.
4.4.2.3 MIXED MODE DELAMINATION
Using a asymmetrically loaded split laminate (see Fig.
63), one can achieve a variety of combinations of mode I and
mode II loading. The total energy release rate is given by
the sum of the mode I and mode II values, G + G lIC'
calculated using the relationships:
(Ps L C)2 3(P L c )
GT =G I +0 -I sca (15)BEI 4BEI
where I is the moment of inertia of one leg of the split
portion of the laminate, Ps = (Pu+P L )/2 and Pa = (Pu-PL)/2.
For composites made from brittle resins, the GT is seen to
increase with increasing percentage of mode ii loading,
especially above about 40% mode II. By contrast, the GT for
a composite made from a ductile resin system is found to have
very little dependence on the %GII used in achieving
delamiantion. Typical results have previously been presented
in Fig. 12 (section 4.1) with additional results provided in
Table 4. The reason for this behavior has previously been
explained in detail in section 4.1.
145

Ps
LC
tAe/2
B) SYMMETRIC LOAD-MPUE MODE I P
P0 's
C3 ASYMMETRIC LOAD - PURE MODE ]1
Figure 63 Schematic showing how asymmetric loading ofsplit laminate can introduce a mixedmode I/mode II state of stress at the cracktip.
146

4.5 FRACTORGRAPHY AND FAILURE ANALYSIS
There has been considerable confusion over whether it
is possible to determine crack growth direction in an
unambigeous way from the direction the hackles point. The
results of the in-situ observations in this study clearly
indicate that hackles can point either in the direction of
crack growth or opposite to the direction of crack growth, as
previously seen in Fig. 9. Furthermore, the development of
damage ahead of the crack tip gives some serious question
about how reliable some of the surface features may be in
determining crack growth direction. Unless all of the damage
ahead of the crack tip develops in a very consistent way,
using the artifacts that result from this damage can be
misleading in fractographic interpretation. A great deal
more work needs to be done to establish that such a regular
pattern is present in the development of the damage zone that
unambigous information concerning the crack growth direction
can be inferred form fracture surface details. More details
in this regard are contained in papers 5.4 and 5.6 section
5.0 of this report.
147
L.

REFERENCES
1. Standard Test Method for Plane-Strain Fracture
Toughness of Metallic Materials, American Society for
Testing and Materials Test E-399-81, Philadelphia,
1981.
2. Bradley, W.L. and Cohen, R.N., "Matrix Deformation and
Fracture in Graphite Reinforced Epoxies", Delamination
and Debonding of Materials ASTM STP 876, W.S. Johnson,
Ed., American Society for Testing and Materials,
Philadelphia, 1985, pp. 389-410.
3. Williams, D.R., Davidson, D.L., and Lankford, L.,
"Fatigue-crack-tip Plastic Strains by the
Stereoimaging Technique", Experimental Mechanics, Vol.
20, No. 4, April 1980.
4. Davidson, D.L., Lankford, L., "Fatigue Crack Tip
Strains in 7075 Aluminum Allow by Stereoimaging and
Their Use in Crack Growth Models", Special Technical
Publication 811, ASTM, 1983.
5. Davidson, D.L., "The Observation and Measurement of
Displacements and Strains by Stereoimaging", SEM 1979,
2, SEM, Inc., AMF, O'Hare, IL.
6. Avery, and Berlin, Interpretation of Aerial
Photography, fourth addition, Burgess, 1985.
7. Barsoum, R.S., "On the Use of Isoparametric Finite
Elements in Linear Fracture Mechanics", International
Journal for Numerical Methods in Engineerin , Vol. 10,
pp. 25-27, 1976.
148
0 ,

8. Henriksen, M. Engineering Department, Colorado School
of Mines Golden, Colorado, 80301.
9. Hercules Manual of AS4/3502 Graphite/Epoxy, Hercules
Corporation, Magma, Utah.
10. Vanderkley, P.S., "Mode I - Mode II Delamination
Fracture Toughness of a Unidirectional Graphite/Epoxy
Composite a M.S. Thesis, Texas A&M University, College
Station, Texas, 1981.
11. Jordan, W.M., and Bradley, W.L., "Effect of Resin
Content on the Delamination Fracture Behavior of
Graphite Epoxy Laminates", presented at the 29th
National SAMPE Symposium, April 3-5, 1984, and
appearing in the proceedings entitled: Technology
Vectors, pp. 1422-1437.
12. Hunston, D.L., "Composite Interlaminar Fracture:
Effect of Matrix Fracture Energy", Composites
Technology Review, vol. 6, 1984, pp. 176-180.
13. O'Brien, T.K., Johnston, N.J., Morris, D.H., and
Simonds, R.A., "A Simple Test for the Interlaminar
Fracture Toughness of Composites", SAMPE Journal,
July/August 1982, pp. 8-15.
14. Wang, S.S., and Mandell, J.F., "Analysis of
Delamination in Unidirectional and Crossplied Fiber
Composites Containing Surface Cracks", NASA Technical
Report NASA-CR-13524, May 1977.
15. Russell, A.J., and Street, K.N., "Moisture and
Temperature Effects on the Mixed-Mode Delamination
149
Fracture of Unidirectional Graphite/Epoxy", ASTM STP
676, 1985, pp. 349-370.
16. Whitney, J.M., Browning, C.E., and Hoogsteden, W., "A
Double Cantilever Beam Test for Characterizing Mode I
Delamination of Composite Materials", Journal of
Reinforced Plastics and Composites, vol. 1, Oct. 1982,
pp. 297-313.
17. Devitt, D.F., Schapery, R.A., and Bradley, W.L., "A
Method for Determining the Mode I Delamination
Toughness of Elastic and Viscoelastic Composite
Materials", Journal of Composite Materials, vol. 14,
Oct., 1980, pp. 270-285.
18. Weatherby, J.R., "Evaluation of Energy Release Rates
in Unidirectional Double Cantilevered Beam Fracture
Toughness Specimens", Mechanics and Materials Center
Report MM 4665-82-9, Texas A&M University, December
1982.
19. Wang, S.S., Suemasu, H., and Zahlan, N.M.,
"Interlaminar Fracture of Random Short-Fiber SMC
Composite," Journal of Composite Materials, vol. 18,
Novol. 1984, pp. 574-594.
20. Keary, P.E., Ilcewicz, L.B., Shaar, C., and Trostle,
J., "Mode I Interlaminar Fracture Toughness of
Composites Using Slender Double Cantilever Beam
Specimens", Journal of Composite Materials, vol. 19,
March 1985, pp. 154-177.
21. Nicholls, D.J., and Gallagher, J.P., "Determination of
150

GIC in Angle Ply Composites Using a Cantilever Beam
Test Method", Journal of Reinforced Plastics and
Composites, vol. 2, Jan. 1983, pp. 2-17.
22. Chai, H., "The Characterization of Mode I Delamination
Failure in Nonwoven, Multidirectional Laminates",
Composites, vol. 15, Oct. 1984, pp. 277-290.
23. Pipes, R.B., and Pagano, N.J., "Interlaminar Stresses
in Composite Laminates Under Uniform Axial Extension",
Journal of Composite Materials, vol. 4, No. 4, Oct.
1970, pp. 538-548.
24. Jordan, W.M., "The Effect of Resin Toughness on the
Delamination Fracture Behavior of Graphite/Epoxy
Composites", Ph.D. dissertation, Texas A&M University,
Dec., 1985.
25. Schapery, R.A., Jordan, W.M., and Goetz, D.P.,
"Delamination Analysis of composites with Distributed
Damage Using a J Integral", Proc. of the Int. Symp. on
Composite Materials and Structures, Beijing, China,
June 10-13, 1986.
26. Kuo, A.Y., and Wang, S.S., "A Dynamic Hybrid Finite
Element Analysis of Delamination in Composites",
T.&A.M. Report No. 466, University of Illinois, April,
1984.
27. Schapery, R.A., "Deformation and Fracture
Characterization of Inelastic Composite Materials
Using Potentials", Polymer Engineering and Science,
vol. 27, 1987, pp. 63-76.
151

28. Davidson, B.D., and Schapery, R.A., "Effect of Finite
Width and Crack Tip Constraint on Deflection and
Energy Release Rate of a Double-Cantilever Specimen",
to appear in Journal of Composite Materials.
29. Tse, M.K., Hibbs, M.F., and Bradley, W.L.,
"Delamination Fracture Studies of Some Toughened
Graphite/Epoxy Composites, Including Real Time
Fracture Observation in Scanning Electron Microscope".
ASTM Symposium on Toughened Composites, Houston,
Texas, March 13-15, 1985.
30. Murri, G.B., "GIIc Measurement of Toughened Matrix
Composites Using the End-Notched Flexure (ENF) Test".
ASTM Committee D30.02 Task Group on Interlaminar
Fracture Toughness, Dallas, Texas, 1984.
31. Vanderkley, P.S., "Mode I-Mode II Delamination
Fracture Toughness of a Unidirectional Graphite/Epoxy
Composite". Master of Science Thesis, Texas A&M
University, Dec. 1981.
32. Russell, A.J. and Street, K.N., "The Effect of Matrix
Toughness on Delamination: Static ana Fatigue Under
Mode II Shear Loading of Graphite Fiber Composites".
Presented at the NASA/ASTM Symposium on Toughened
Composites, Houston, Texas, March 13-15, 1985.
33. Gillespie, J.W., Carlsson, L.A., and Pipes, R.B.
"Finite Element Analysis of the End-Notched Flexure
Specimen for Measuring Mode II Fracture Toughness".
Center for Composite Materials, University of
152

Delaware, Newark, Delaware. To be published in
Composite Science and Technology.
34. Carlsson, L.A., Gillespie, J.W., and Pipes, R.B. "On
the Analysis and Design of the End-Notched Flexure
(ENF) Test Specimen for Mode II Testing". Center for
Composite Materials, College of Engineering,
University of Delaware Newark, Delaware. To be
published in the Journal of Composite Materials.
35. Henriksen, M., Engineering Department, Colorado School
of Mines, Golden, Colorado, 80301.
36. Schapery, R.A., Mechanics and Materials Center, Texas
A&M University, College Station, Texas, 77843.
(Private communication).
37. Corleto, C.R., and Bradley, W.L., "Mode II
Delamination Fracture Toughness of Unidirectional
Graphite/Epoxy Composites". Presented at the ASTM
Second Symposium on Composite Materials: Fatigue and
Fracture, Cincinnati, Ohio, April 1987.
38. Rice, J.R., "A Path Independent Integral and the
Approximate Analysis of Strain Concentration by
Notches and Cracks", J. Appl. Mech. vol. 35, pp.
379-387, 1986.
39. Rice, J.R., Rosengren, G.F., "Plane Strain Deformation
Near a Crack Tip in a Power Law Hardening Material",
J. Mech. Phys. Solids vol. 16, pp. 1-12, 1968.
40. Hutchinson, J.W., "Singular Behavior at the End of a
Tensile Crack in a Hardening Material", J. Mech. Phys.
153
Solids vol.16, pp. 13-31, 1968.
41. McClintock, F., "Plasticity Aspects of Fracture".
Fracture, Chap. 2, Vol. III (Edited by Liebowitz).
Academic Press, New York, 1971.
42. Agarwal, B.D., Patro, B.S., Kumar, P., "J Integral as
Fracture Criterion for Short Fibre Composites: An
Experimental Approach", Engineering Fracture
Mechanics, vol. 19, No. 4, pp. 675-684, 1984.
43. Agarwal, B.D., Kumar, P., and Khanna, S.K.,
"Determination of the Fracture Toughness of Fabric
Reinforced Composites by the J Integral Approach.
Compos. Sci. Technol., vol. 25 No. 4, pp. 311-323,
1986.
44. Keary, P.E., Ilcewicz, L.B., Shaar, C. and Trostle,
J., "Mode I Interlaminar Fracture Toughness of
Composites Using Slender Double Cantilever Beam
Specimens", J. of Compos. Mater. vol. 19, pp. 154-177,
1985.
45. Ilcewicz, L.B., Keary, P.E., Trostle, J.,
"Interlaminar Fracture Toughness Testing of Composite
Mode I and Mode II DCB Specimens", Boeing Commercial
Airplane Company, Advanced Composites Development
Program, P.O. Box 3707, M/S 6C-11, Seattle,
Washington.
46. Schapery, R.A., "Deformation and Fracture
Characterization of Inelastic Composite Materials
Using Potentials", Polymer Engineering and Science,
154

vol. 27, No. 1, 1987.
47. Schapery, R.A., "Correspondence Principles and a
Generalized J Integral for Large Deformation and
Fracture Analysis of Viscoelastic Media", Inter. Jour
Fracture vol. 25, pp. 195-223, 1984.
48. Vanderkley, P.S., "Mode I-Mode II Delamination
Fracture Toughness of a Unidirectional Graphite/Epoxy
Composite", Master of Science Thesis, Texas A&M
University (1981).
5.0 PUBLICATION RESULTING IN WHOLE OR IN PART FROM WORK
SUPPORTED BY AFOSR (Note all manuscripts not provided
in annual reports previously are provided in Appendix
II).
5.1 Jordan, W.M. and Bradley, W.L., "Effects of Resin
Content on Delamination Fracture Behavior of
Graphite/Epoxy Laminates", Technology Vectors, 1984,
pp. 1422-1437. (1984-1985 annual)
5.2 Jordan, W.M. and Bradley, W.L., "Micromechanisms of
Fracture in Toughened Graphite-Epo,:y Laminates",
Toughened Composites, ASTM STP 937, Norman J.
Johnston, Ed., American Society for Testing and
Materials, Philadelphia, 1987, pp. 95-114. (Appendix
II)
5.3 Hibbs, M.F., Tse, M.K. and Bradley, W.L.,
"Interlaminar Fracture Toughness and Real-Time
Fracture Mechanism of Some Toughened Graphite-Epoxy
155

Composites", Toughened Composites, ASTM STP 937,
Norman J. Johnston, Ed., American Society for Testing
and Materials, 1987, pp. 115-130. (Appendix II)
5.4 "The Meaning and Significance of Hackles in Composite
Materials Failure Analysis", Jordan, W.M., Hibbs, M.
and Bradley, W.L., Proceedings of International
Conference: Post Failure Analysis Techniques for
Fiber Reinforced Composites, Dayton, Ohio, July, 1985.
(1985-1986 annual)
5.5 Chakachery, E.A. and Bradley, W.L., "A Comparison of
the Crack Tip Damage Zone for Fracture of Hexcel F185
Neat Resin and T6T145/F185 Composite", Polymer
Engineering and Science, Vol. 27, pp. 33-40.
(Appendix II)
5.6 Hibbs, M.F. and Bradley, W.L., "Correlations Between
Micromechanical Failure Processes and the Delamination
Fracture Toughness of Graphite-Epoxy Systems,"
Fractography of Engineering Materials, ASTM STP 948,
J.E. Masters and J.J. An, Ed., American Society for
Testing and Materials, Philadelphia, 1987, pp.
(Appendix II)
5.7 Bradley, W.L. and Jordan, W.M., "The Relationship
Between Resin Ductility and Composite Delamination
Fracture Toughness", Proceedings of International
Symposium on Composite Materials and Structures,
Beijing, T.T. Loo and C.T. Sun, Ed., Technomic
Publishing Co., Inc., Lancaster, PA, 1986, pp.
156

445-451. (1985-1986 annual)
5.8 Schapery, R.A., Jordan, W.M. and Goetz, D.P.,
"Delamination Analysis of Composites with Distributed
Damage Using a J-Integral," Proceedings of
International Symposium on Composite Materials and
Structures, Beijing, T.T. Loo and C.T. Sun, Ed.,
Technomic Publishing Co., Inc., Lancaster, PA, 1986,
pp. 543-549. (1985-1986 annual)
5.9 Corleto, C., Bradley, W.L., and Henriksen, M.,
"Correspondence Between Stress Fields and Damage Zones
Ahead of Crack Tip of Composites Under Mode I and Mode
II Delamination," Sixth International Conference on
Composite Materials: ICCM-ECCM, Eds. Matthews,
Buskell, Hodgkinson, and Martin, London, Elsevier
Applied Science Publishers Ltd., Essex, England, 1987,
Vol. 3, pp. 3.378-3.387. (Appendix II)
5.10 Jones, Jr., R.E. and Bradley, W.L., "Fracture
Toughness Testing of Ductile Polymer Resins Using a
J-Integral Approach," Nonlinear Fracture Mechanics,
ASTM STP , John Landes, Ed., American Society for
Testing and Materials, Philadelphia, 1988, pp.
(Appendix II)
5.11 Corleto, C.R. and Bradley, W.L., "Mode II Delamination
Fracture Toughness of Unidirectional Graphite-Epoxy
Composites," Composite Materials: Fatigue and
Fracture, ASTM STP , Paul Lagace, Ed., American
Society for Testing and Materials, Philadelphia, PA,
157

1988, pp (Appendix II)
5.12 Hibbs, M.F. and Bradley, W.L., "Crack Tip Strain Field
Measurements Determined In-Situ in Scanning Electron
Microscope for Mode I Crack Extension in a Polymeric
Material," Proceedings of Society of Experimental
Mechanics Fall Conference-1987 (also submitted to
Journal of Experimental Mechanics). (Appendix II)
6.0 PRESENTATIONS MADE THAT WERE BASED ON WHOLE OR IN PART
ON WORK PERFORMED UNDER SPONSORSHIP OF THIS AFOSR
GRANT.
6.1 "Correspondence Between Stress Fields and Damage Zones
Ahead of Crack Tip of Composites Under Mode I and Mode
II Delamination", Sixth International Conference on
Composite Materials, London, England, July 1987.
6.2 "Fracture Studies in Neat and Fiber Reinforced
Thermoset Resins", invited presentation for Gordon
Research Conference on Thermosetting Plastics, New
London, New Hampshire, June, 1987.
6.3 "Micromechanics of Compressive Failures in Composite
Laminates", with Gail Guynn, and Mode II Delamination
Fracture Toughness of Unidirectional Graphite/Epoxy
Composites", with Carlos Corleto, ASTM Symposium on
Fatigue and Fracture in Composite Materials,
Cincinnati, Ohio, April, 1987.
6.4 "The Effect of Fiber Volume Fraction, Interfacial
158
Bonding and Fiber Alignment on the Compressive
Strength of Thermoplastic Composite Materials",
invited presentation to the Corporate Research and
Development Center of Phillips Petroleum,
Bartlesville, Oklahoma, March, 1987.
6,5 "The Application of Fracture Mechanics to Plastics"
and "In-Situ Fracture Studies in the Scanning Electron
Microscope of Delamination in Composite Materials",
invited presentation to the Dow Chemical Corporate
Research and Development Center, Midland, Michigan,
January, 1987.
6.6 "Various Problems in Measuring the Fracture Toughness
of Ductile Plastics Using J-Integral Approach",
invited presentation, the ASTM subcommittee meeting to
set up round robin on fracture toughness
characterization of plastics, Phoenix, AZ, November,
1986.
6.7 "Relationship Between Neat Resin Fracture Toughness
and Delamination Fracture Toughness of Composite
Materials", invited presentation to Phillips Petroleum
Corporate Research and Development, Bartlesville,
Oklahoma, November, 1986.
6.8 "Fracture Toughness Testing of Polyethylene Using a
J-Integral Approach", International Symposium on
Nonlinear Fracture Mechanics, Nashville, TN, October,
1986.
6.9 "The Relationship Between Resin Ductility and
159
0 __ mmmn

Composite Delamination Fracture Toughness",
International Symposium on Composite Materials, and
Structures, Beijing, China, June, 1986, invited.
6.10 "On Mode II Delamination Fracture Toughness
Measurements in Composite Materials," ASTM Annual
Meeting, Charleston, S.C., March, 1986, invited.
6.11 "Direct Observation of Fracture in Composites,"
lecture for Gordon Research Conference on Composites,
Santa Barbara, CA, January 1986, invited.
6.12 "The Meaning and Significance of Hackles in Composite
Materials," International Conference: Post Failure
Analysis Technique for Fiber Reinforced Composoites,
Dayton, Ohio, July, 1985 (sponsored by Wright
Patterson), invited.
6.13 "A Comparison of the Crack Tip Damage Zone for
Fracture of Hexcel F185 Neat Resin and T6TI45/F185
Composite Material," International Symposium on
Nonlinear Deformation, Fracture and Fatigue of
Polymeric Materials, Chicago, September, 1985,
invited.
6.14 "Correlations Between Micromechanical Failure Processes
and Delamination Fracture Toughnesses of
Graphite/Epoxy Composites," ASTM Symposium on
Fractography of Modern Engineering Materials,
Nashville, November, 1985, invited.
6.15 "Micromechanisms of Fracture in Toughened
Graphite/Epoxy Laminates," ASTM Symposium on Toughened
160

Composites, Houston, TX, March, 1985.
6.16 "Delamination Fracture Studies of Some Toughened
Graphite/Epoxy Composites, Including Real-Time
Fracture Observations in Scanning Electron
Microscope," ASTM Symposium on Toughened
Composites, Houston, TX, March, 1985.
6.17 "Delamination Fracture Behavior of
Graphite/Thermoplastic Composite Systems," invited,
NASA Langley, Hampton, VA., February, 1985.
6.18 "Micromechanics Modelling of Delamination Fracture in
Graphite/Epoxy Composites," Gordon Conference on
Composite Materials, Santa Barbara, CA., Jan., 1985.
6.19 "In-Situ Studies in Delamination of Graphite/Epoxy:
Recent Results", Air Force Composite Materials Review
Dayton, Ohio, Oct., 1984, invited.
6.20 "In-Situ Studies of T6T145/F185 Composite Materials,"
presented at the 6th International Fracture Symposium,
New Delhi, India, Dec., 1984.
6.21 "In-Situ SEM Studies of Fracture of Plastics and Fiber
Refinforne Plastics". w rhpmical, Research Center,
Freeport, TX, July 1984, invited.
7.0 PROFESSIONAL PERSONNEL ASSOCIATED WITH RESEARCH EFFORT
7.1 William M. Jordan, Ph.D., awarded, December, 1985,
dissertation title: "The Effects of Resin Toughness
on the Delamination Fracture E-'avior of
Graphite/Epoxy Composite".
161
7.2 Carlos Corleto, M.S., awarded, June, 1986, thesis
title: "Mode II Delamination Fracture Toughness of
Unidirectional Graphite/Epoxy Composites". Currently
working on Ph.D. in area of Mode II Delamination with
expected graduation date of December, 1988.
7.3 Mike Hibbs, Ph.D. candidate with expected graduation
date of Fall, 1987, working on strain field mapping
around crack tip.
7.4 Douglas Goetz, Ph.D. candidate for May, 1988, is
working on J-Integral approach for Mode I delamination
of multiaxial layups (supported half by Bradley and
half by Schapery).
162
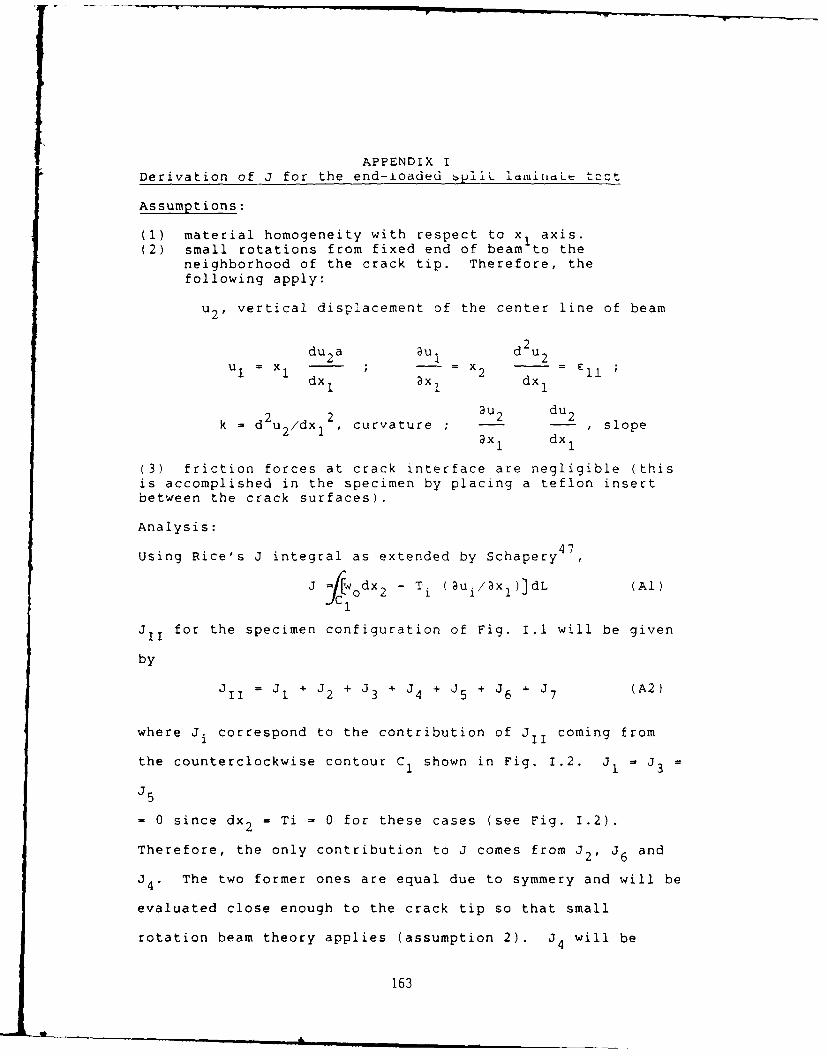
APPENDIX I
Derivation of J for the end-loaded bpiiL icltaLiuLe tzt
Assumptions:
(1) material homogeneity with respect to x1 axis.
(2) small rotations from fixed end of beam to the
neighborhood of the crack tip. Therefore, the
following apply:
u2P vertical displacement of the center line of beam
du 2 a au I d 2 u2
U1 = X 1 = x2 = l1dx 1 ax dx 1
2 au 2 du 2k = d u 2 /dx 1 , curvature x 1 , slopeax1 dx1
(3) friction forces at crack interface are negligible (thisis accomplished in the specimen by placing a teflon insertbetween the crack surfaces).
Analysis:
47Using Rice's J integral as extended by Schapery
3 fw odx2 - T. (au /ax 1 )]dL (Al)i fC1
JII for the specimen configuration of Fig. I.1 will be given
by
JII = Jl + J2 + J3 + J4 + J5 + J6 + J7 (A2)
where Ji correspond to the contribution of JII coming from
the counterclockwise contour C 1 shown in Fig. 1.2. Jl = 3=
J5
= 0 since dx 2 = Ti = 0 for these cases (see Fig. 1.2).
Therefore, the only contribution to J comes from J2' 16 and
34. The two former ones are equal due to symmery and will be
evaluated close enough to the crack tip so that small
rotation beam theory applies (assumption 2). 34 will be
163
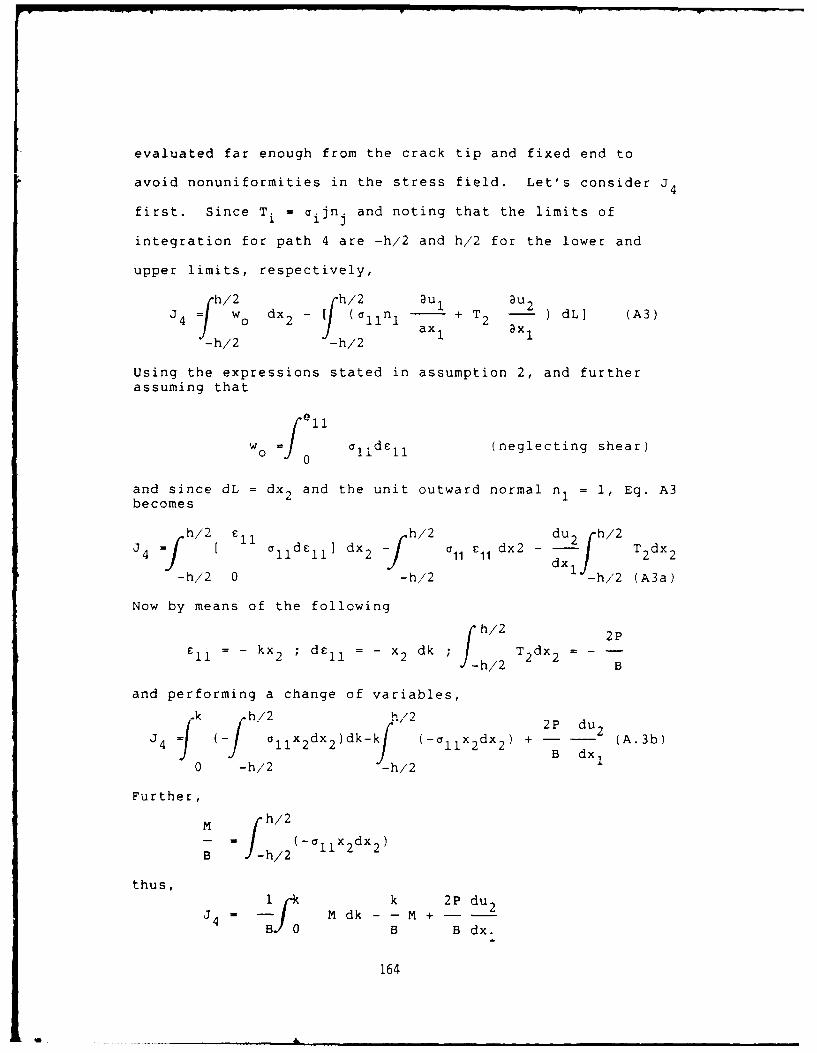
evaluated far enough from the crack tip and fixed end to
avoid nonuniformities in the stress field. Let's consider J4
first. Since T i = aijn. and noting that the limits of
integration for path 4 are -h/2 and h/2 for the lower and
upper limits, respectively,
fh/2 _fh/ 2 auI ua / w - [ (i in + T ) dL] (A3)4] o 21ax 2 ax 1
-h/2 -h/2
Using the expressions stated in assumption 2, and furtherassuming that
w o =fel lldl (neglecting shear)
and since dL = dx 2 and the unit outward normal n1 = 1, Eq. A3becomes
h/2 a d xh/2 a E d 2 -du 2 h/2 T4 = [ 11 d 11 ] dx2 a 11 dx2 - - T2dx 21 ~dx 1]
-h/2 0 -h/2 -h/2 (A3a)
Now by means of the following
f h/2 2P
E 11 - kx 2 ; dell = -x 2 dk ; I T 2 dx 2 =J-h/2 B
and performing a change of variables,
34 h 2h1 1x2 dx 2 )dk-k (-a1 1 X2dx 2) + (A.3b)B dx 1
0 -h/2 -h/2
Further,
M = h/2
B = h2 (-a 1 1 x2dx 2 )B J-h/2 1
thus,1 k k 2P du 2
3 4 = M dk - - M +--0 B B dx.
164

Inteqrating bv parts (u = M du = dM dv = dk v = k)
1 M M k 2P du 2J4 = - (M k- k dM) +-
B 0 B B dx 1
1 2Pdu 2 MJ4 = - dx k dM) (A3c)
B dx11
To evaluate J6 or J2 the same procedure as that followed for
34 was performed. For these cases one must notice that dL -
-dx 2 and nI = -1 and thus,
11 au du,. P= 6 1 1 de 1 1 dx 2 + 1 1 a dx 2 dx (A4)J6 =ax dx2 B A4
h/2 0 h/2 1
which can be reduced to
1 M P du 2j2 = J 6 = B-f k dM - x(A4a)2B B dx 1
Addidng J 2 6 and J4P
S M ddu 2
k dM - 2 jkdM - P- I (A2a)B dx L B 0 dx R
where the subscripts L and R indicate evaluation of the
quantities insidle brackets correspunding to the left
(paths 2 and 6) and right (path 4) vertical segments of the
beam.In order to establish the path independence of JIII it
will be evaluated at a distance xI from loaded end.
Left segment:
since d2 u 2/dx 12 = k, the slope of any segment in the cracked
part of the beam at a distance x1 from the loaded end is
given by
165
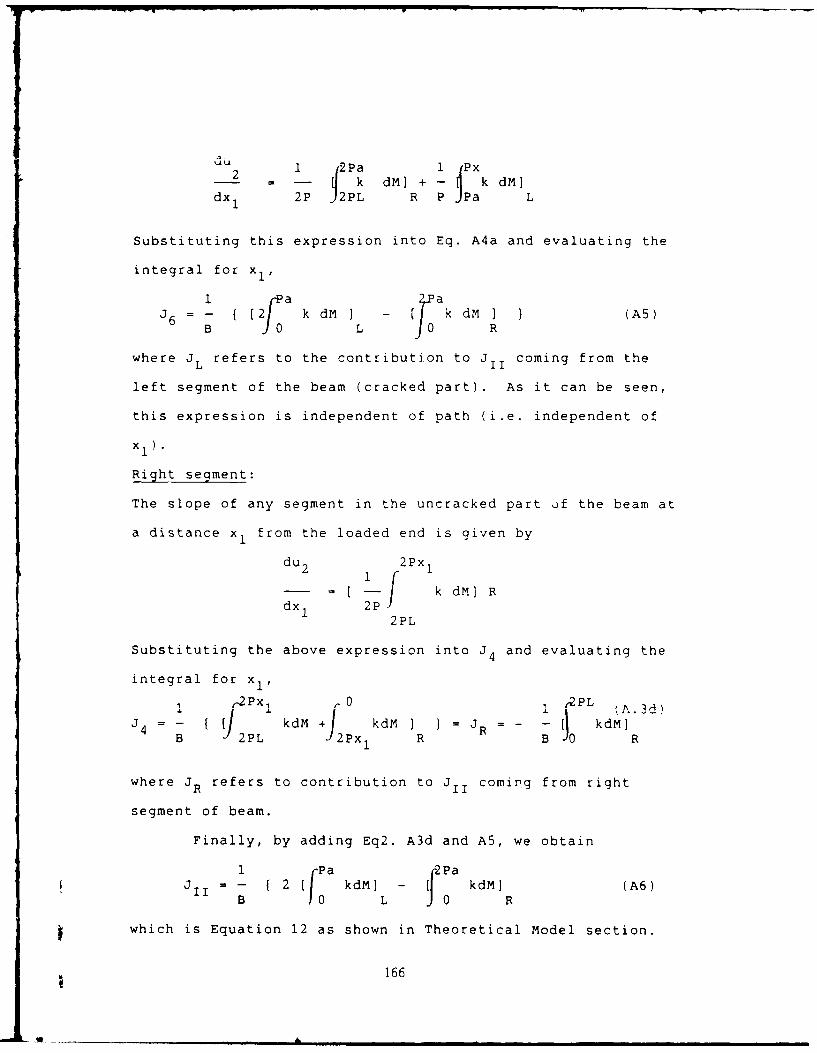
2 1 jQPa 1 (Px2- -- [ k dM]+- k dM
dx 2PJ 2PL R P Pa L
Substituting this expression into Eq. A4a and evaluating the
integral for xl,
1 f -- a k dM I - [ k dM I (A )
B L R
where JL refers to the contribution to JII coming from the
left segment of the beam (cracked part). As it can be seen,
this expression is independent of path (i.e. independent of
x1 ).
Right segment:
The slope of any segment in the uncracked part if the beam at
a distance x1 from the loaded end is given by
du 2 2Px 1
- = k dM] RSdx I 2P
2PL
Substituting the above expression into J4 and evaluating the
integral for xl,
-2Pxl C0 r2 PL 3d)
=- 4 kdM+J kdM] 1=R= - kdM]
B 2PL 2Px 1 R B 0 R
where JR refers to contribution to J coming from right
segment of beam.
Finally, by adding Eq2. A3d and A5, we obtain
1 f a F2= - { 2 kdM] - kdM] (A6)
B Jo L 0 R
which is Equation 12 as shown in Theoretical Model section.
166
Va ) etrs iI)L11 i d~r s c~ d 1.r~ ee
167

Mike F. Hibbs, 'Ming Kwan Tse, 2 and Walter L. Bradley
Interlaminar Fracture Toughness andReal-Time Fracture Mechanism of SomeToughened Graphite/Epoxy CompositesAuthorized Reprint from Special Technical Pub~icahan 937,1987COPYnight American Societ for Testing and Materials, 1916 Race Street Philadephia PA 19 103
REFERENCE: Hibbs, M. F. Tse. M. K. and Bradley, W. L., "titertarninar FractureToughness and Real-Time Fracture Mechanism of Some Toughened Graphite/EpoxyComaposites," Toughened Composites. ASTM .51? 937, Norman 1. Johnston. Ed. Amen -can Society for Testing and Materials. Philadelphia. 1987, pp. 115-130.
ABSTRACT: Five graphiteepoxy composites containing toughened epoxies prepared atDow Chemical and AS-A graphite fibers from Hercules have been studied in Mode 1. mixedmode, and Mode 11 to determine their delaumnation fracture toughnesses G, and thecontrol-ling microtnechanism of fracture. The G, values were determined using split laminatespecimiensa. The delamination fracture process was observed in real time in the scanningelection microscope. To increase delamination fracture toughness, both an improved inter-face as well as higher rein toughness were found to be required. Increasing Mode 11loading. particularly of the more brittle systems, gives a significantly greater resistanceto crack propagation as measured by the total energy release rate required to propagatethe crack
KEY WORDS: composite material. delamiunatioc, mixed mode, Mode 1, graphiteiepoxy.toughened. in situ fracture
Nomenclature
8 Specimen thicknessC Compliance of test couponE Elastic modulus in the fiber direction
G, Energy release rate for Modc I loading (opening mode)Go Energy release rate for Mode RI loading (in plane shear) !!a1nC-1 Critical energy release rate fof sable crack growd! for M.ode 1 on
G&. Critical energy release rate for stable crack growth for Mode II loading
'Research assiatant and professor. Mechanical Engineering Departmient. Texas A&M University.Engieeri Research Center. College Statio, TX 77843.
'Senuior research engineer. The Dow Chemical Company. Resins Research. B-1215 Bldg..FRaept , TX 77541.
115
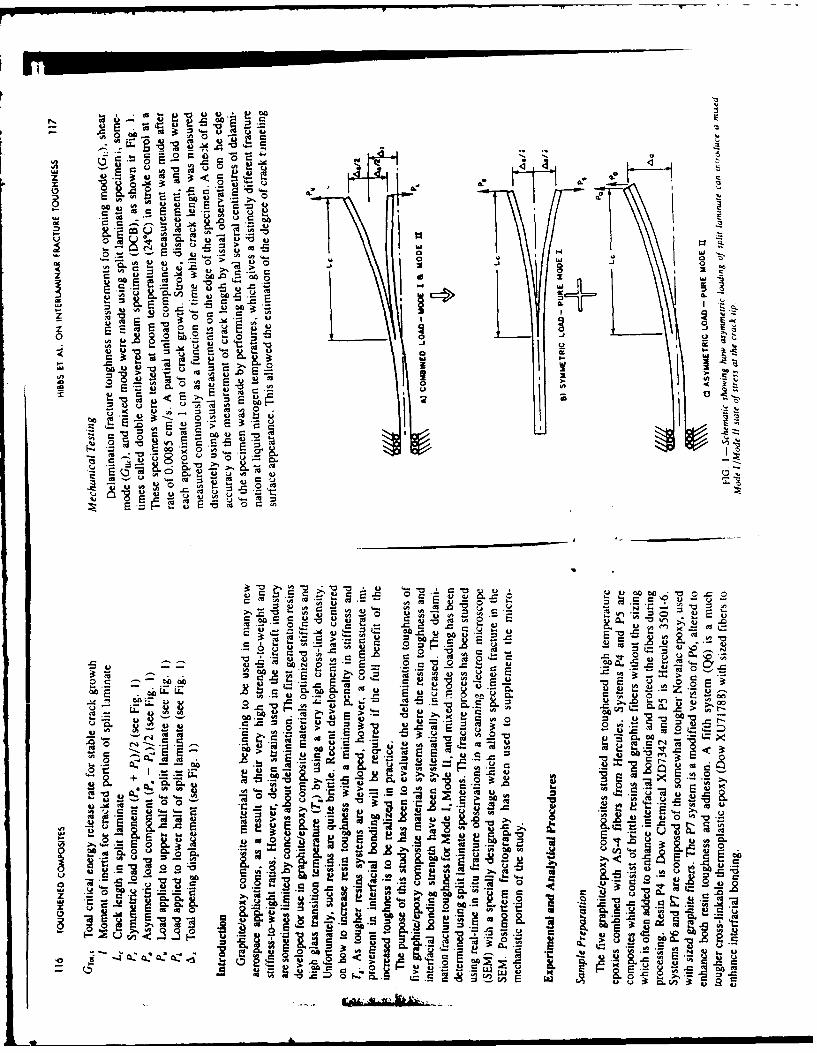
ILI
E -6 ,M -- J2
o > 0~9-CM0 .0 a
E E,
0 0 ~., C
E c ~ E.. ~
0 -, Nu '
0: 0 c
-~ -o-*uo
t- -- 5U- "O r-- Eo ~ -r- '
.00 "t 4 0 U u C
uu -. -a E u > =
+ ~ LL. .E
C> -r n - .
E _ Z, .0,S -01 0 -0 00 .. %.u 9- R 0 2
2 -52 5 i -
Im 0 0 0 'Go E ECJL '
o~
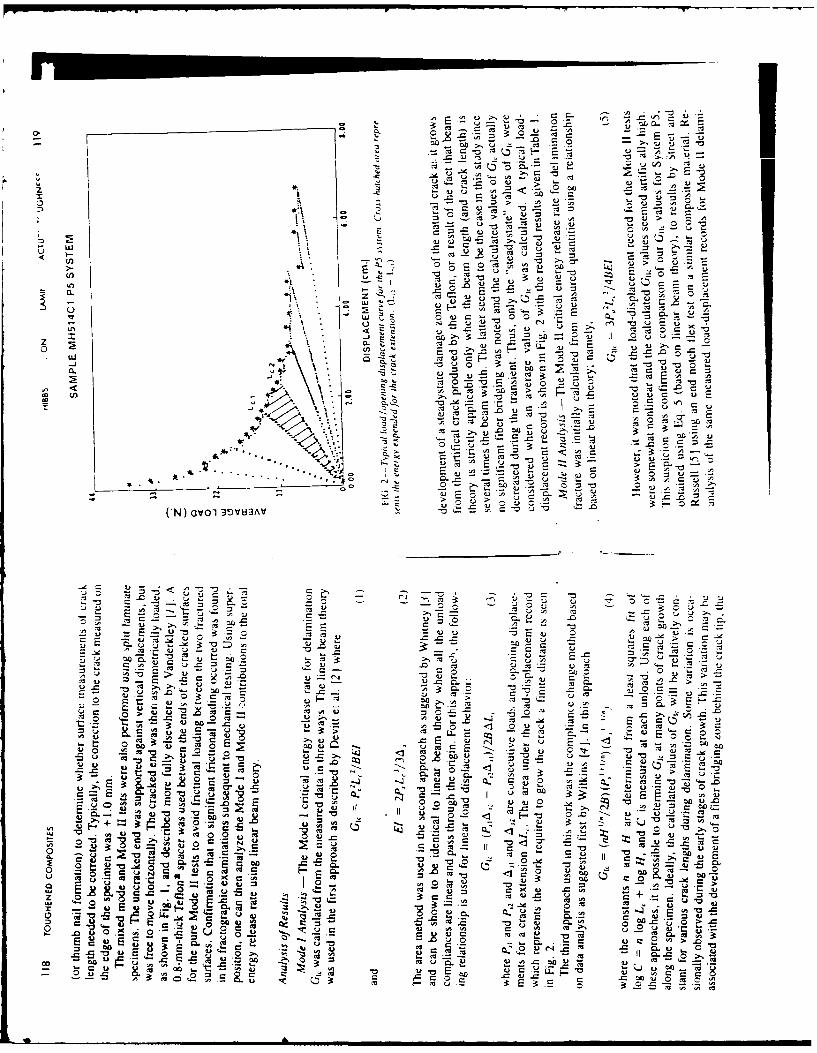
<. 2
u- u)
IL E .,-
-l v- u u v
, I~ E cw
) C
_j~~
U~ C'-
* ~ *4)) >Y' ~ C ~ )~M
~0 ..u.. 0y
J-4)
Z r 8 z
('N)4 OVO 30UA 70-
Cu E
to t: t E -c r
A- 0 -
- - ~- -= v~0
LjC 6 .z
U . E cQ -E 2 E o
4) * -1o --w
C3 m-
-4) 0"~ 0u S to
03 C..
0 4 0 oa) -u -t
"00 -2u
0 v~ m .c m.
4) E' C.
Q -- ~A Cu04 0: 0 44
4) 0 = - AC' - o" ~ 4
Cu~~ 40<j40
Cu '? o1 a- a!>C u r * )
- (" 0
0 "0 >. 0
"0~.0~cE0 -C,
Cu c ru.
c2 m~ u : E : S.2 -

0 U0
00.
-- u0 u~ - - co~ 'LL u I 00 -
0 0 U
c- S >) 7;-
'0~ Q .:o 73))0 .4
o~000~ r oj'~S "-4~~)'0 00 s.4m
-x 73.. -,; 0z u, 0 CL: - - =4 Q0 u
E- 4)n -v -V-0 Ma00 r- -3 1 -1-1 = :-+ 1U
oo U v a ~~0~u -C 2zz 0>4) - 4 '~ ~ ..
': CJO . o ~ )4 ~ ~ L 4
-0 440 = -0 " E 0
ob 00E 2 0 20 0
< 00
-u 0.. L- : x
LV7O A~JPP~
ob V8 L 8 I
60I !Mv0 3AV 09I 5"'0 a1LI 9L9 C6
cl 9601 8£! Ll 009 Z9E 01 96I 691 9,; ;L
16I oil ZIl 6L!0 i 8,966 MO Oro I~ Ia 8H L v 06I10 6PI OZI f811 C't, L 6
8Z19f 91 SLII 0,7 Lo
[flZI I 0£! ~0O 80 zi Z c IZl66l Ll I otz I VC 06
117 6f 1 991 86 z 6 ZI601 K-I UI ... 6 81 if
O 9d W3.LSAS
Li f '(D) '19 potp.7W 2iuuilduoj IW/r '(9) 1.9 (IUO-I( -9~ JtMur1 U/r (V) "0 PoNp1~i r-uv MIW -)'l 7 V N "d
meaQ indoj
Ou.,w,.vds Ujiq Vn)d( a of ("0g) PIOj afva)ji .ia I apow wiSoSuOia fo mqtwyjni)ji, Pidwz'g -- i glgv1.
C0
-- - - - -
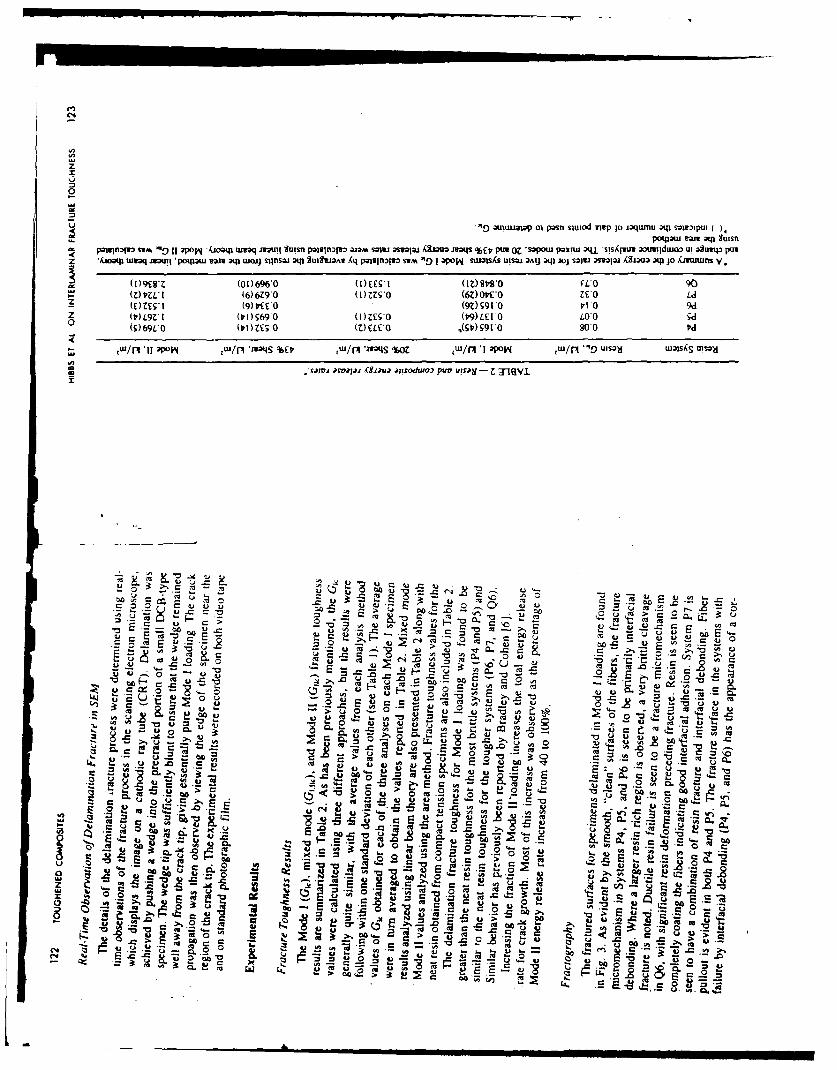
z
0
-49 autumW1 01 p~si s Wiod wep ;o sjqwisu -V smempui
paIljUl SUM 11 2fl J0UOQP1 W1Mq M*WI SUIisn po)Vwl:'M aj2A smiu ;Pmlw. f~- n~qp %E puu oZ Is-,ot poinu 4u stp ;usw ut itump puv
(I)9cgez (0 1) 696 Ma)'t Q (Z)'SWo %L 90)Q Z 1(6) 6Z9'0 (l)ZZg~o (6Z) OW0 zcvo £4
z OE1(9)vVEO .. (qz 9l9o r'10 9d
0 (S) 69L 0 VOIVO ~ (Z) C£EO '(SomIO 80'0 I'd
t W/fl 'If 2904 lfl 'U-tNs %ES IUW/p *wnis %O cw/tn 'I vow '/ -If) UISO3d w2OS s l
t, 00 -o r-.-
kn40 O u M
>~~~a .- , o, . o -
a~ ~ -u~ ~U a m ~
E- E- oCC
('44 '- .C'. a U~J..~ ~u
u~

E a4
-jr
zz ca
2 .2
~j - 5
<--) ~~ -~Al
.4 = -
x ok 4v
-~~~I n00~..H .~ ~.. , - c
0E

0~
0D
2 - '= 'C -a ~ -~
K) -
-a -~ -~-~ -~ f,-~ ~ --a ~
-~ -z -~ -J - ~-
n -~
-a - -
-a ~-.
1.~ ~- = C ~) ~a~, 4 -a -
It~
~) ~) '4
Cz ~zC
-C- C .~Z
'4
4 '4
4: -a -~
'4 '-"-.
0
~0U
C -C~C '4 '~-
z -~ -aI0 -, '~ ~ ~
0
- a-4 4 -~ .4
.C 4:-. a
a

ON -C )4 u U
Cu OO u M 43 0 0u'
Cu0 -. CuA e, -4) ; 00o, a~~ M. t 4.) C
U1 MI, Ur-'-
E QCU C ~ U~
2 - 00
-, u mC
5 0 Cu I-. u lu .O u .c
> oo E S E~ 3S 1 E3
-p o~ ME *~~~
o 0 E E~
u ,
5% g Cu 00 o S u ~
0~ -00
0 8
Z; _ 0. co s C
0
-0 c E~~ c -u 2 0 ..5
U- r- == - 'Co.' -IZ.. .
C- ~~0 r- U1 at -- ~~) . ~U O.
~0 2
mC~ U I0O C 00 ~ ~ 0
0 . 0... CuC- - uu 0S c SE
'44.E
23 Q Cu C r
--cCUU ~ ~E
"U ~ .C C u. C
C u cc ~U , C
C >.u . CC ~. -Cufl 4C ~u-
Cu 0 U- -- .c 0
.~~ 0 . Uu 0
r- 2 t u U to~
u U U U ~ u O A to 'I
E~ 0 CU 0
- m~ -0 -E
U C ' . C U0 Uo 0
U0
U - 00 00 U C_0 ..
5 3. .8 br CuU.2 ~
130 TOUGHENED COMPOSITES
[5 Russell, A.J. and Street, K.N.. -Moisture and Temperature Effects on the Mixed-Mode,:Delamination Fracture of Unudiectional GrnphittiEpoxy." in Delamination and Debonding oft,Materials. ASTM STP 876. W. S. Johnson, Ed., Ariencan Society for Testing and Matenals,.Philadelphia, 1985, pp. 349-370.
[6] Bradley. W. L. and Cohen, R. N.. "Matrix Defoemation and Fracture in Gnppte-ReinforcedEpoxims," in Delamination and Debonding of Materials. AS7TW STP 876. W. S. Johnsoo. Ed..American Society for Testing and Materials, Philadelphia, 1985, pp. 389-410.
[71 Hunston, D. L. and BulLman. G. W., "Characterization of Interlamiunar Crack Growth in Com-posimes: Double Cantilever Beam Studies." in 1985 Grant and Contract Review. NASA LangleyResearch Center Materials Division. Fatigue and Fracture Branch. Vol. II. 13-14 Feb. 1985

William M. Jordan' and Walter L. Bradley'
im~ Micromechanisms of Fracture inToughened Graphite-Epoxy Laminates
Autmned Reprint from Special Technical Publication 937, 1987Copyright Americani Society for Testing and Materials. 1916 Race Street Philadelphia. PA 19103
REFERENCE: Jordan. W. M. and Bradley, W. L., 'Mlcroniechansm of Fracture inToughened Graphite-Epoxy Laminates," Toughe-ned Composites. ASTM ST." 937.Norman J. Johnston, Ed.. American Society for Testing and Matenials. Philadelphia. 1987.pp. 95-114.
ABSTRACT: The combination of low cross-link density and elastomer additions has beenseen to give the most potent toughening for neat resins. A relatively small increment of theadditionasl neat resin fracture toughening above 800 J/m* is actually reflected in the delami-
,41 nation fracture toughness of a composite. Mode 11 delamninatton toughness of brittle systemsmay be an much as three times the Mode I delamination fracture toughness, while a ductilesystem may have a Mode 11 delamination fracture roughniess that is simtiar to the Mode Ivalue. The energy absorbed per unit area of crack extension for delamination seems to beindependent of ply orientation if proper accounting of the near and far field energy dissi-
KEY WORDS: composite materials, delamiunation. Mode 1. Mode It, mixed mode, tough-~ ,.*~ened epoxy
Nomenclature
8 Specimen3E Elastic modulus in the fiber direction
((:, f~f.Gk Critical energy release rate for stable crack growth for Mode I loadingGn Critical energy release rate for stable crack growth for Mode 11 loading
G~. Total critical energy release rate for mixed mode loadingI Moment of inertia for cracked portion of split laminate
L, Crack length in split laminateP, Asymmetric load Component (P. + P,)12 (see Fig. 1)
P. Symmetric load component (P. - PL)/2 (see Fig. 1)P. Load applied to upper half of split laminate (see Fig. 1)
A Ibis work performed at Texas A&M University was supported by the Air Force Office of ScientificResearch with Major David Glasgow as project inaistor.
'Research assistant ad professor of mechanical enigineertig. Mechanical Engineering Department.Z. Texas A&M University. College Stanion. TX 77943.
95
E Z C 2 E2 E2
a A2 00 W) - 0 -
II.~ LL.C0 qu 2u~~~~ u 4 ~
u~ LL u 2* .5~ 2 E 5 ou
o4 Cu u-~ o u. u .. mu 0a
: E
V1~ >~S l.2 0 C
Eh -~r A - -5
0. E
= ci
~~~~ 2oo0~*C
Cu ~ C-~~~~~1 C.- ; col)0 ~ Cu~ ...
0 0 - >0;- ~ o u . \ 0 2 u' o O C . 0 0
-a -& E
'o oo 0.'u
anu _ 6 0 Cu. = .g -Pc- - Ew'UC w 00In 06 to
22 C' cO
Q o z'. ",, cc ". o0 2 u E
o -. o o Eu
o2 u ou. I&sJ E -o:-
410
0.Cu .C;;
'0 C- C- In 0 C 0 2 ' 0 0i

0~ 0t Ell 2
c-u Lo E0 g-
u. =J~ - -0 - 2 2:
- 12- 0 a~ lUu* vU>U~
LU c
U0<OA~ U. -M, c-. 0 0
L U. >OaaL E au
~~- 0 -u-
2 '21
-r E
U0 '2 Z or- t,3
-r -- -I m.0 - U -
W CL
& >~
-03 23 'r-'u -
U mu~C E
U 0 T -E E C A
u :4 :0, ~
~~UU Z1-00.
-ul cc --*,4
U J:U A u~ oJ
>41 -, 0, ZE o - l
E' '7 -2 LC2

Gu U L U
o 4 " -6 C -j.
C ~ 73 -o gu. =v~ EEU -5 of
>
U M .-U M~0
I"
uC E
E U -J. L. -
ox -. L 2
tQ -- 5 Cu~ .
0 C 0-c 0 . C E u -Q) 0Z
-U
i5 -2 E Z
C 12 =J Cu
mw p~C m > .- - C.0 oo u 0 U
-~~ C C-
-~~ u~-
U w Q E
-0 4.U 4u- u .- >' oU 5 ~ ~
U E
C4. uO 'IV ~~L~ ~Cu N Ci Eo o2t zf 0~C C w Q.E U U cc~~ Cu cU ~
cz E
~~~~~~ 0-2! ECu C L ~
no~ Is :Cu
C- u Cu C .
> ~ . U ' E 7;..~ 72
2~~~r cU 52 u.~ ~ ~ 0 o~u .
> UU '2 L LIo ~ 7 0 ~O C A L. (U
Ru~ 0 u -C 0 C E
to C
E E O 2 0. C 4 C -. E Q
E~ U Cu - 0 Z) E <c
r-2 Cu 0 -2=>
C, = .- ~ Cu E j ~ C C
U m0

uU ~ a .- 4~ en u r 0
.~ 0 0U0.~ ~o ~In
E~ 0k- u , a 0. z-5 .0. 'A a -
UU Qo 10 >
~**a) C - 'u-- -- .
_ U70 v, .
~~ -0 0 0~U 0
-o~ ~ -~~U~~aE o -:73U mU~~' ~
(U "Ua~~'~
.23 "~0 0 c .2" 00 - >,~
0~ l ua
E -~ ".' S., 0~a -I .:3 0
'Uj 0 -S L;" _ '10U0 .- - 5- )
CL . a " 2 m m 72 0 50 r--
-r- .2 Ej wj Q
>0 -0 -
-to
z E)=I
it -
0, z- 'U :- a--
5. .= ., nv~~c- az5p~ -
It" >. E C.I
x u . LL. o
-; u
.. . .... .....
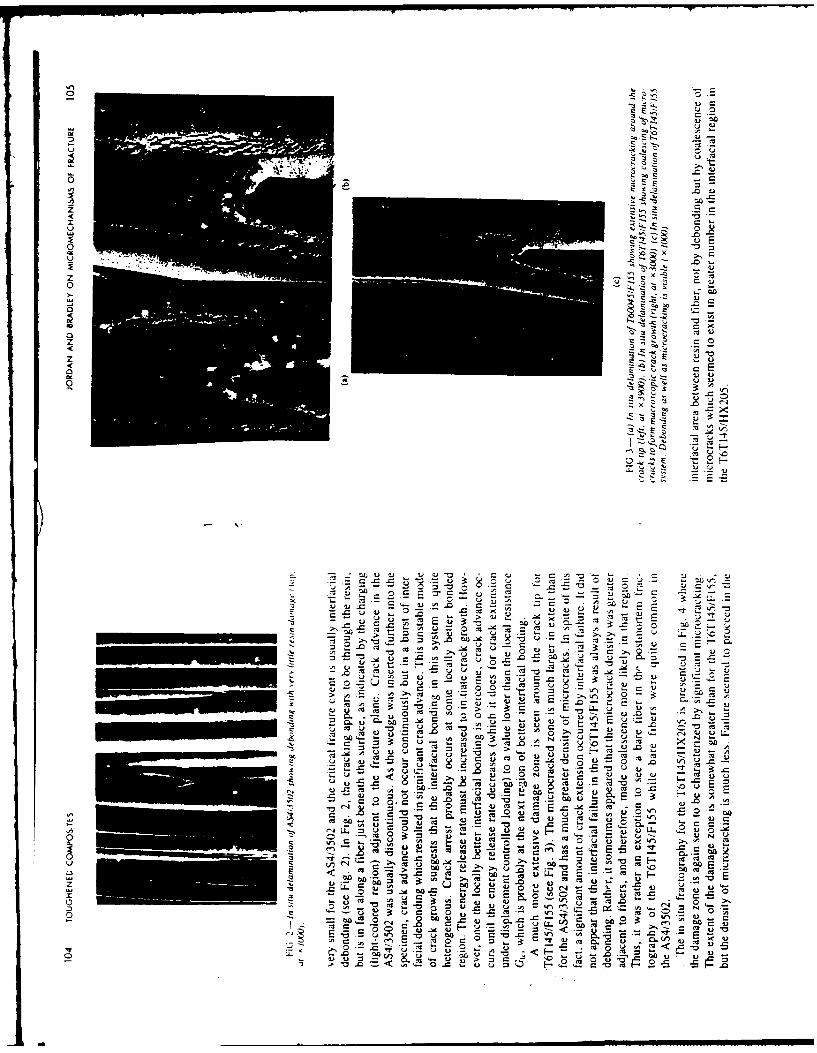
u 0
Z UtiIL t;
ji - - M~
oo Id m
ZE 2
E r
u u
-~ 5 ~ U U C U .. .
eU UC M- ~ ~ t U uU
2 E ~ -
U43 M
u QUu.s w. 8 ,
La 0 U. m C* m
E u 00 E .2
o -c -iAA EC
~ ~ JLL ~ 0ZUUU ~E t u U
__ __ __ _4_ Ia u c
-~ .1 = 0 >-~~

MR4
I-o
7A z
zi
a-.-
oj
4 u-
r- -u E
4S

z 79IC
4-5-47 A
Q6)
4)O --
0c 0 u~~
La.~ co O
z U an0
e 1!t " 0
X. 00
*- La be u 30 ~
0 8 s. I a-o §"- : .*9 "
N rk
X -5 1
.40-0
t9 0 F- -S-p-lo =-m
< ~

C' -~
U
U
(~~J
U
U
~ 0 U -~
- U U-= U
4 ~I ~U
U Uo - -~
U ~-
J2o -~ ~
44
U U4 ~ ~ -~
U 0 *~
o E .~.
-~0
~- , .C
4 UU ~ U~ U
U-~- ~*~*;-=
N
-~ 0.
o
o ~ ~
zI ~- ~.,
.0
0 4' 2 ~E
a
U----

-~~. -5a ~ ~
0~ C 'D
-e -c r W "-0 0 2 c r
.0~~~ 06 04 02'S
U, 00
-~~~t mU U
- - 3t o0 sr A!~
40 .a P. .5 Ut2 -C =o 0 M o. a M,0 ~ U
CC
0u.~~ -c -~5 E E*C , ~ ~ sE 0
z 0 -0 OU -E j
0 U lu JU. u -~
CU~~ ~ rJCU CU 2 0.2- 0-
0 'A r- U U cc
z 0 U0 0 0 0 v~ 4~ -,
-. V- Oc V-0 0 r-
-S 0 - O 0- ~ u~
t3 00 > =.
000..MU
-- 00 -ck C6.0
Cu ou E
u +1 0 ~ ~ ~ EU-
r~ai..;0 0Q
2 21>C u 0 v -V u -V r 0 C
UC)~30 00~ U -C 0~~. ( ,0
EU~ 2 U UC~ Oc± u t .
= 2E~~ 2 2~ 0 t u

114 TOUGt'ENED COAMOSITES
Mode 11 delamination fracture toughness that is similar to the Mode I value. Theenergy absorbed per unit area of crack extension for delamination seems to beindependent of ply orientation if proper accounting of the near and far fieldenergy dissipation is made.. -
Acknowledgment
The generous support of this work by the Air Force Office of Scien-tific Research (Major David Glasgow, project monitor) is acknowledged. RichMoulton's (Hexcel Corporation) assistance in providing the materials studied isalso recognized. The authors also acknowledge the technical support given bythe Electron Microscopy Center of Texas A&M University.
References[1] Scott. J M. and Phillips, D C., "Carbon Fibre Composites with Rubber Toughened Matrices,"
Journal of Materials Science. Vol. 10, 1975, pp. 551-562.(21 Bascom, W. D., Bitner. J. L., Moulton. R. J . and Siebart. A. R., "'The Interlaminar Fracture
of Organic-Matrix. Woven Reinforcement Composites,- Composites, Jan. 1980. pp. 9-18.[31 Bascom. W. D., Ting, R. Y, Moulton. R. J, Riew. C. K., and Siebert, A. R.. "'The Fracture
of an Epoxy Polymer Containing Elastomeric Modifiers," Journal of Materials Science,Vol. 16. 1981. pp. 2657-2664
[4) Vanderkley, P.S.. "Mode I-Mode I Delanination Fracture Toughness of a UnidirectionalGraphite/Epoxy Composite." Master's thesis, Texas A&M University, College Station, TX.Dec. 1981.
[5[ Cohen, R. N., "Effect of Resin Toughness on Fracture Behavior of Graphite/Epoxy Com-posites," Master's thesis. Texas A&M University, College Station, TX, Dec. 1982.
[61 Bradley, W. L. and Cohen R. N. "Matrix Deformation and Fracture in Graphite ReinforcedEpoxies," presented at ASTM Symposium on Delamination and Debonding of Materials,Pittsburgh, PA, 8-10 Nov. 1983
[71 Russell, A.J. and Street. K.N., "Moisture and Temperature Effects on the Mixed-ModeDelamination Fracture of Unidirectional Graphite/Epoxy," Delamination and Debonding ofMaterials. ASTM ..TP 876. S. Johnson, Ed.. American Society for Testing and MateriaJs,Philadelphia, 1985.
[81 Wilkins, D. J., Eisemann, I R., Cumin. R. A., and Margolis. W. S., "Characterizing Delami-nation Growth in Graphite-Epoxy, in Damage in Composite Materials: Basic Mechanisms,Accumulation. Tolerance and Characterization, ASTM STP 775, American Society for Testingand Materials, Philadelphia. 1982.
[91 Devitt, D. F., Schapery. R. A., and Bradley, W. L., "A Method for Determining the Mode IDelamination Fracture Toughness of Elastic snf Biscoelastic Composite Materials." Journal ofComposite Materials. Vol. 14, Oct. 1980.
[101 Theocris, P, S. and Stassinakis, C.A., "Crack Propagation in Fibrous Composite MaterialsStudied by SEM." Journal of Composite Materials, Vol. 15, March 1981, p. 133-141. • 4
(11] Mao, T. H., Beaumont, P. W. R., and Nixon. W. C.. "Direct Observations of Crack Propagationin Brittle Materials," Journal of Materials Science Letters, Vol. 2, 1983.
[121 Hunston, D. A., "Composite Interlaminar Fracture: Effect of Matrix Fracture Energy," .,. ,presented at ASTM Symposium ot Toughened Composites. Houston. TX, March 1985.
,11 a, H., -T'he Characterization ot Mode I Delamination Fallure in Non-Woven, Multi-Directional Laminates," Composites. Vol. 15, No. 4. Oct. 1984, pp. 277-290.
[14 1 Yee, A. F. and Pearson, R. A., "Toughening Mechanism in Elastomer-Modified EpoxyResais-Part I," NASA Contractor Report 3719, 1983, experimental work completed.
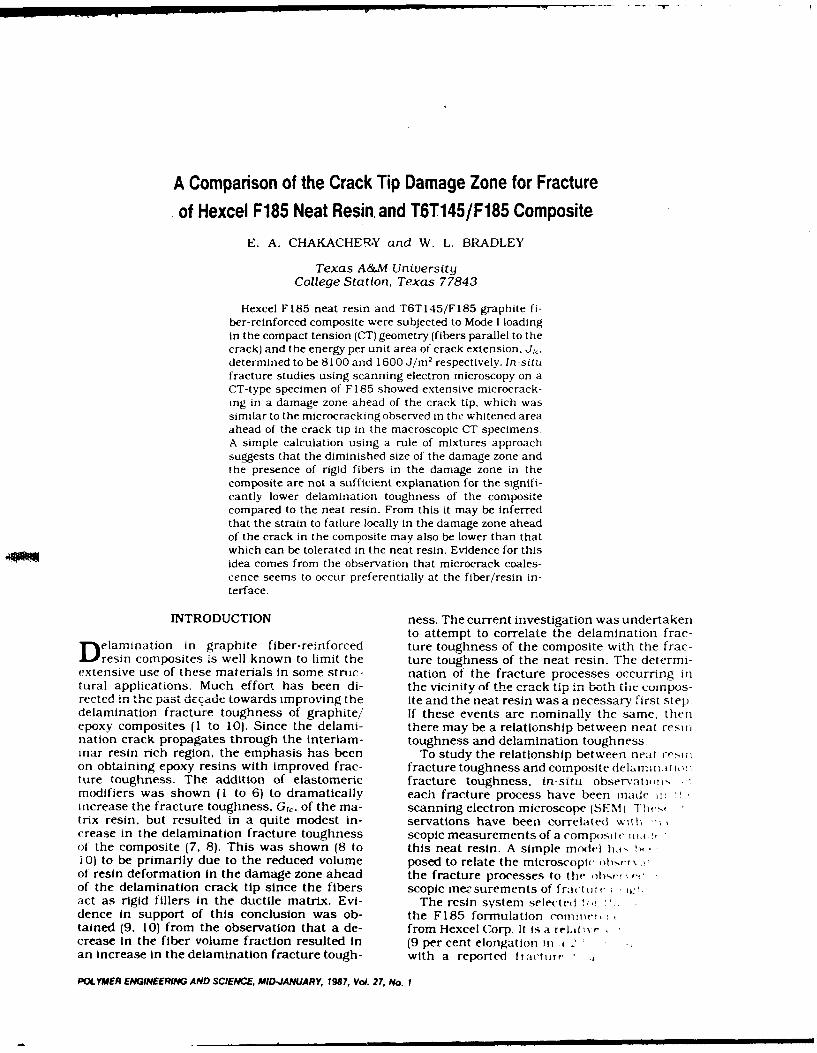
A Comparison of the Crack Tip Damage Zone for Fracture
of Hexcel F185 Neat Resin. and T6T145/F185 Composite
E. A. CHAKACHERY and W. L. BRADLEY
Texas A&M UniversityCollege Station, Texas 77843
Hexcel F185 neat resin and T6TI45/F185 graphite fi-ber-reinforced composite were subjected to Mode I loadingin the compact tension (CT) geometry (fibers parallel to thecrack) and the energy per unit area of crack extension. J1 .determined to be 8100 and 1600 J/m 2 respectively. In-situfracture studies using scanning electron microscopy on aCT-type specimen of F 185 showed extensive microcrack-ing in a damage zone ahead of the crack tip, which wassimilar to the microcracking observed in the whitened areaahead of the crack tip in the macroscopic CT specimens-A simple calculation using a rule of mixtures approachsuggests that the diminished size of the damage zone andthe presence of rigid fibers in the damage zone in thecomposite are not a sufficient explanation for the signifi-cantly lower delamination toughness of the compositecompared to the neat resin. From this it may be inferredthat the strain to failure locally in the damage zone aheadof the crack in the composite may also be lower than thatwhich can be tolerated in the neat resin. Evidence for thisidea comes from the observation that microcrack coales-cence seems to occur preferentially at the fiber/resin in-terface.
INTRODUCTION ness. The current investigation was undertakento attempt to correlate the delamination frac-
elamination in graphite fiber-reinforced ture toughness of the composite with the frac-resin composites is well known to limit the ture toughness of the neat resin. The determi-
extensive use of these materials in some struc- nation of the fracture processes occurring intural applications. Much effort has been di- the vicinity of the crack tip in both the cumpos-rected in thc past decade towards improving the ite and the neat resin was a necessary first step.delamination fracture toughness of graphite/ If these events are nominally the same, thenepoxy composites (1 to 10). Since the delami- there may be a relationship between neat resinnation crack propagates through the interlam- toughness and delamination toughness.inar resin rich region, the emphasis has been To study the relationship between neat re!IIon obtaining epoxy resins with improved frac- fracture toughness and composite del mim ii i,;iture toughness. The addition of elastomeric fracture toughness, in-situ observatmonmodifiers was shown (I to 6) to dramatically each fracture process have been made i:!increase the fracture toughness, Gt,. of the ma- scanning electron microscope (SEM) Th.,,trix resin, but resulted in a quite modest in- servations have been correlated w\ih -;,crease in the delamination fracture toughness scopic measurements of a composite 1tI.W,of the composite (7, 8). This was shown (8 to this neat resin. A simple model i.i' th,.i0) to be primarily due to the reduced volume posed to relate the microscopic Oh-xrx ,ol resin deformation In the damage zone ahead the fracture processes to the n,,br! ,of the delamination crack tip since the fibers scopic measurements of fractureact as rigid fillers in the ductile matrix. Evi- The resin system selected !i,, :dence In support of this conclusion was ob- the F185 formulation comrnwertained (9. 10) from the observation that a de- from Hexcel Corp. It isa rel.iuircrease in the fiber volume fraction resulted in (9 per cent elongation In ian increase in the delamination fracture tough- with a reported iracturr
POLYMER ENGINEERING AND SCIENCE, MID-JANUARY, 1987, Vol. 27, No. 1

END

II 1.0 1. D __
I2.0
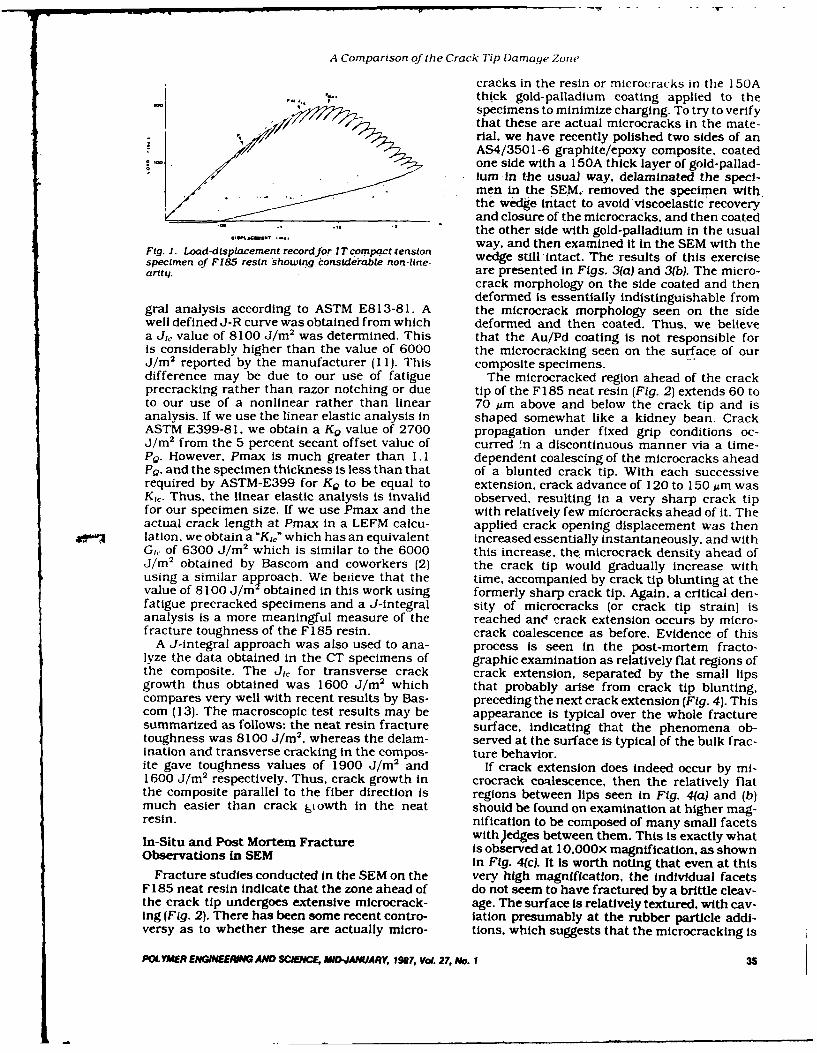
A Comparison of the Crack Tip Damage Zone
cracks in the resin or microcracks in the 150Athick gold-palladium coating applied to thespecimens to minimize charging. To try to verifythat these are actual microcracks in the mate-rial, we have recently polished two sides of anAS4/3501-6 graphite/epoxy composite, coatedone side with a 150A thick layer of gold-pallad-lum in the usual way. delaminated the sped-men in the SEM, removed the specimen withthe wedge intact to avoid viscoelastic recoveryand closure of the microcracks, and then coated
• S "the other side with gold-palladium in the usualF.. ooplceme rcro ln way. and then examined it in the SEM with theFig. . Load-dsplacement recordfr IT C.ompnxtstenslon wedge still intact. The results of this exercisespecimen of F185 resin 'showing eonside'rable norn-line-
arity. are presented in Figs. 3(a) and 3(b). The micro-crack morphology on the side coated and thendeformed is essentially indistinguishable from
gral analysis according to ASTM E813-81. A the microcrack morphology seen on the sidewell defined J-R curve was obtained from which deformed and then coated. Thus, we believea J1, value of 8100 J/m 2 was determined. This that the Au/Pd coating is not responsible foris considerably higher than the value of 6000 the microcracking seen on the surface of ourJ/m 2 reported by the manufacturer (11). This composite specimens.difference may be due to our use of fatigue The microcracked region ahead of the crackprecracking rather than razor notching or due tip of the F185 neat resin (Fig. 2) extends 60 toto our use of a nonlinear rather than linear 70 ;Lm above and below the crack tip and isanalysis. If we use the linear elastic analysis in shaped somewhat like a kidney bean. CrackASTM E399-81. we obtain a Kg value of 2700 propagation under fixed grip conditions oc-J/m 2 from the 5 percent secant offset value of curred In a discontinuous manner via a time-Pg. However, Pmax is much greater than 1.1 dependent coalescing of the microcracks aheadPg, and the specimen thickness is less than that of a blunted crack tip. With each successiverequired by ASTM-E399 for Kg to be equal to extension, crack advance of 120 to 150 um wasKi.. Thus, the linear elastic analysis is invalid observed, resulting in a very sharp crack tipfor our specimen size. If we use Pmax and the with relatively few microcracks ahead of it. Theactual crack length at Pmax in a LEFM calcu- applied crack opening displacement was thenlation. we obtain a "K,," which has an equivalent increased essentially instantaneously, and withG of 6300 J/m 2 which is similar to the 6000 this increase, the microcrack density ahead ofJ/m 2 obtained by Bascom and coworkers (2) the crack tip would gradually increase withusing a similar approach. We beiieve that the time, accompanied by crack tip blunting at thevalue of 8100 J/m obtained in this work using formerly sharp crack tip. Again. a critical den-fatigue precracked specimens and a J-integral sity of microcracks (or crack tip strain) isanalysis is a more meaningful measure of the reached an crack extension occurs by micro-fracture toughness of the F185 resin, crack coalescence as before. Evidence of this
A J-integral approach was also used to ana- process is seen in the post-mortem fracto-lyze the data obtained in the CT specimens of graphic examination as relatively flat regions ofthe composite. The J. for transverse crack crack extension, separated by the small lipsgrowth thus obtained was 1600 J/m 2 which that probably arise from crack tip blunting.compares very well with recent results by Bas- preceding the next crack extension (Fig. 4). Thiscom (13). The macroscopic test results may be appearance is typical over the whole fracturesummarized as follows: the neat resin fracture surface. indicating that the phenomena ob-toughness was 8100 J/m 2 . whereas the delam- served at the surface is typical of the bulk frac-ination and transverse cracking in the compos- ture behavior.ite gave toughness values of 1900 J/m 2 and If crack extension does indeed occur by mi-1600 J/m 2 respectively. Thus, crack growth in crocrack coalescence, then the relatively flatthe composite parallel to the fiber direction is regions between lips seen in Fig. 4(a) and (b)much easier than crack Uowth in the neat should be found on examination at higher mag-resin. nification to be composed of many small facets
In-Situ and Post Mortem Fracture with )edges between them. This is exactly whatObservations in SEM is observed at 10.OOOx magnification, as shownIn Fig. 4(c). It is worth noting that even at this
Fracture studies conducted in the SEM on the very high magnification, the individual facetsF 185 neat resin indicate that the zone ahead of do not seem to have fractured by a brittle cleav-the crack tip undergoes extensive microcrack- age. The surface is relatively textured, with cav-ing (Fig. 2). There has been some recent contro- iation presumably at the rubber particle addi-versy as to whether these are actually micro- tions. which suggests that the microcracking is
POLYMER ENGNEEROMl AND SCJENCE, MID.JAMARY, 1987, Vol. 27, No. 1 35
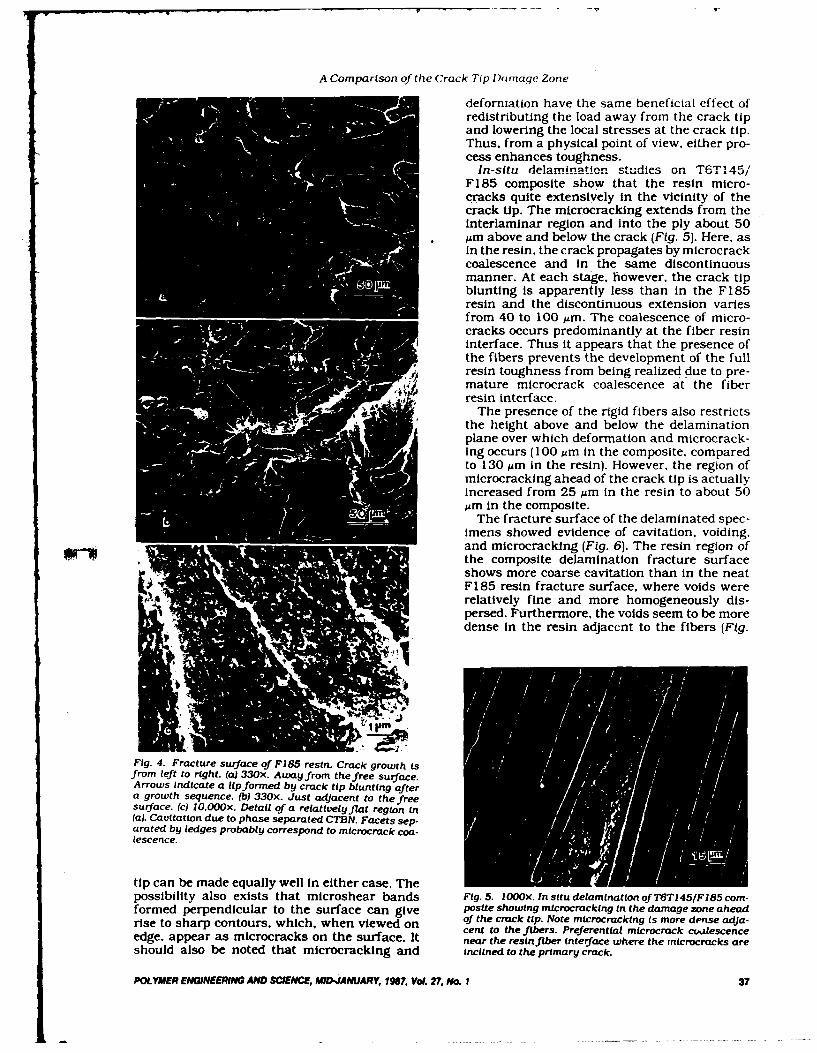
A Comparison of the Crack Tip DaImage Zone
deformation have the same beneficial effect ofredistributing the load away from the crack tipand lowering the local stresses at the crack tip.Thus, from a physical point of view, either pro-cess enhances toughness.
In-situ delamnination studies on T6T 1 45F185 composite show that the resin micro-cracks quite extensively in the vicinity of the
crack tip. The microcracking extends from theInterlaminar region and into the ply about 50Am above and below the crack (Fig. 5). Here, asin the resin, the crack propagates by microcrackcoalescence and in the same discontinuousmanner. At each stage, however, the crack tipblunting is apparently less than in the F185resin and the discontinuous extension variesfrom 40 to 100 um. The coalescence of micro-cracks occurs predominantly at the fiber resininterface. Thus it appears that the presence ofthe fibers prevents the development of the fullresin toughness from being realized due to pre-mature microcrack coalescence at the fiberresin interface.
The presence of the rigid fibers also restrictsthe height above and below the delaminationplane over which deformation and microcrack-Ing occurs ( 1 0 0
Mm in the composite, comparedto 130 um in the resin). However. the region ofmicrocracking ahead of the crack tip is actuallyincreased from 25 Mm in the resin to about 50Am in the composite.
The fracture surface of the delaminated spec-imens showed evidence of cavitation, voiding.and microcracking (Fig. 6). The resin region ofthe composite delamination fracture surfaceshows more coarse cavitation than in the neatF185 resin fracture surface, where voids wererelatively fine and more homogeneously dis-persed. Furthermore, the voids seem to be moredense In the resin adjacent to the fibers (Fig.
Fig. 4. Fracture surface of F185 resin. Crack growth isfrom left to right. (a) 330X. Away from the free surface.Arrows indicate a lp formed by crack tip blunting aftera growth sequence. (b) 330x. Just adjacent to the freesurface. (c) I0.000x. Detail of a relatively flat region in(a). Cavitation due to phase separated CTBN. Facets sep-arated by ledges probably correspond to microcrack coa-lescence.
tip can be made equally well In either case. Thepossibility also exists that microshear bands Fig. 5. I000X. In situ delamination of T6T145/F185 com-
formed perpendicular to the surface can give posite showing microcracking In the damage zone aheadrise to sharp contours. which, when viewed on of the crack tip. Note mtcrocracking is more dense adja-
cent to the fibers. Preferential microcrack coalescenceedge, appear as microcracks on the surface. It near the resin fiber interface where the mtcrocracks areshould also be noted that microcracking and inclined to the primary crack.
POLYMER ENGINEERING AND SCIENCE, MID-JANUARY, 1 7, Vol. 27, No. 1 37
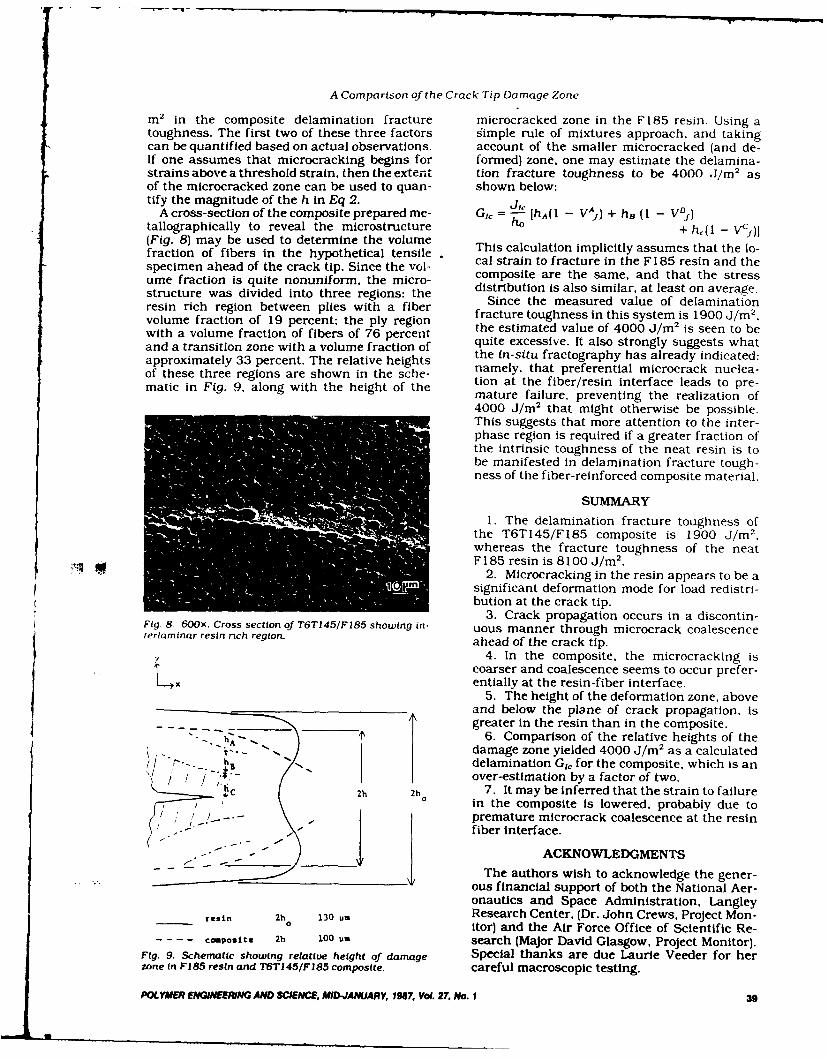
A Comparison of the Crack Tip Damage Zone
m 2 in the composite delamination fracture microcracked zone in the F185 resin. Using atoughness. The first two of these three factors simple rule of mixtures approach, and takingcan be quantified based on actual observations, account of the smaller microcracked (and de-If one assumes that microcracking begins for formed) zone. one may estimate the delamina-strains above a threshold strain, then the extent tion fracture toughness to be 4000 ./mr 2 asof the microcracked zone can be used to quan- shown below:tify the magnitude of the h in Eq 2.
A cross-section of the composite prepared me- G, -J 1-A + h, (I - VB)tallographically to reveal the microstructure h f)
(Fig 8) may be sed to ete min th vo ume+
h ( - VC A)
fraction of fibers in the hr thetical tensile This calculation implicitly assumes that the lo-fiypo cal strain to fracture in the F185 resin and thespecimen ahead of the crack tip. Since the vol- compsite arethe same, and th eume fraction is quite nonuniform, the micro- composite are the same, and that the stress
umtraction was qited nonnforee girothe distribution is also similar, at least on average.structure was divided into three regions: e Since the measured value of delaminationresin rich region between plies with a fiber fracture toughness in this system is 1900 J/m 2.volume fraction of 19 percent; the ply region the estimated value of 4000 J/m 2 is seen to beand a transition zone with a volume fraction of quite excessive. It also strongly suggests whataariation zone perit.he rlae heights the in-situ fractography has already indicated:approximately 33 percent. The relative he- namely. that preferential microcrack nuclea-of these three regions are shown in the sche- tion at the fiber/resin interface leads to pre-matic in Fig. 9. along with the height of the mature failure, preventing the realization of
4000 J/M 2 that might otherwise be possible.This suggests that more attention to the inter-phase region is required if a greater fraction ofthe intrinsic toughness of the neat resin is tobe manifested in delamination fracture tough-ness of the fiber-reinforced composite material.
SUMMARY
1. The delamination fracture toughness ofthe T6TI45/FI85 composite is 1900 J/m 2.whereas the fracture toughness of the neatF185 resin is 8100 J/m 2.
2. Microcracking in the resin appears to be asignificant deformation mode for load redistri-bution at the crack tip.
3. Crack propagation occurs in a discontin-Fig. 8. 600x. Cross section of T6T145/F185 showing in- uous manner through microcrack coalescenceterlaminar resin rich region, ahead of the crack tip.
4. In the composite, the microcracking iscoarser and coalescence seems to occur prefer-entially at the resin-fiber interface.
5. The height of the deformation zone, aboveand below the plane of crack propagation. is
___ t[' greater in the resin than in the composite..t h6. Comparison of the relative heights of theA.... damage zone yielded 4000 J/m 2 as a calculated
_ "-.- B delamination Gkc for the composite, which is an/over-estimation by a factor of two.
c 2h h 7. It may be Inferred that the strain to failurein the composite is lowered, probably due topremature microcrack coalescence at the resin
K.. I"... - Ifiber interface.-- - - ACKNOWLEDGMENTS
The authors wish to acknowledge the gener-ous financial support of both the National Aer-onautics and Space Administration, Langley
resin 2h 130 ur Research Center, (Dr. John Crews, Project Mon-o Itor) and the Air Force Office of Scientific Re-
composite 2h 100 U= search (Major David Glasgow, Project Monitor).Fig. 9. Schematic showing relative height of damage Special thanks are due Laurie Veeder for herzone in P185 resin and T6T145/F185 composite. careful macroscopic testing.
POL YMER ENGNEERING AND WIENCE, MID-JANUARY, 1987, Vol. 27, No. 1 39

Crack Tip Strain Field Measurements DeterminedIn-Situ in Scanning Electron Microscope of Mode I Crack
Extension in Polymeric Material
byM. Hibbs and W.L. BradleyMechanical EngineeringTexas A&M University
College Station, TX 77843
published inProceedings of Society of Experimental Mechanics
Fall Conference - 1987Savannah, Georgia
Crack Tip Strain Field Measurements Determined In-Situ in ScanningElectron Microscope for Mode [ Crack Extension in a Polymeric Material
by
M. Hibbs and W.L. BradleyMechanical Engineering
Texas A&M UniversityCollege Station, Texas 77843
INTRODUCTION
It has been recognized for some time that increasing the resin toughness in
composite materials does not give a proportionate increase in the delamination
fracture toughness of these materials.1,2 It has been suggested that the reason
for this smal ler increment of increase in delamination toughness compared to the
increment of increase in toughness in the neat resin is due to reduction in
crack tip strain possible in the composite due to interference of the fibers.
The addition ot fibers to a ductile resin system could potentiall y reduc
the crack tip strain for at least three reasons.3 - 5
Fi rst , failure in the
composite might occur at the fiber/matrix interface prior to the extraction of
the full potential ductility out of the resin. Second, the presence of fibers
could give local constraint in the vicinity of the crack tip, lowering the total
strain to failure observed. Third, the fibers can act as rigid filler, whicn
could reduce the plastic zone size in resins which have a neat resin plastic
zone size which is greater than the size of the resin rich region between plies
in the composite.
Chakachery and Bradley 5 and Jordan and Bradleyb have observed qualitatively
the above mentioned reduction in plastic zone size, comparing crack growth in a
ductile resin to dIelaminat ion in i graphite/epoxy compos ite made from the same
resin. Chakachery and Bradley5
attempted to quantify with a simple phenomeno-
logical model the reduction in fracture toughness in going from a tough resin to
delamination in a composite made from this resin. They were unsuccessfully in
tully accounting for the observed reduction in fracture toughness, most liktI v
because their model implicitly assumed that the local strain field in each case
was im i a r , w i r h the difference in toughness resulting primarily from the
presence ot rigid ftiller; namely, carbon fibers. Obviously, a more realistic
model would need to take into account the difference in the strain field around

the crack tip tor neat resin compared to delamination of a composite made o1
this resin.
The purpose ot this study has been to develop a technique which cul d
permit the direct measurement of the strain field around a crack tip with
sufficient resolution to see how distinctive the fields are for cracks in ielt
resin versus delamination cracks in composites made from the same resin. The
approach used ha s bee n t o b u r i a very f ine dot map onto the po1 ished surtit v
(perpendicular to the plane of the crack) of a specimen using the electron beam
in a scanning electron microscope. The exact coord inates for each of these
points are determined before and after loading the specimen, allowing the deter-
mination of the displacement of each point. This displacement field may then be
differentiated to give the strain field around the crack tip.
EXPERIMENTAL PROCEDURE
With considerable trial and error, a technique has been developed to burn a
very systemat ic dot pattern onto the po I ished surface of the specimens. The
beama of the electron microscope had to be odjusted to give a dots that were
sufficiently large to remain easily recognizable after considerable deformation
but sma Il enough to give adequate resolution. The very regular dot pattern seen
in Fig. IA was burned onto the surface using a JEOL-35 scanning electron micros-
cope with the assistance of an image processing system manuf acturered by Kon-
tron. The spacing seen in Figure IA is approximately 10 microns. A finer dot
spacIng is possible, but not very useful unless the size ot the dots can also be
reduced, while retaining their visibility after large deformation.
rhe resin system selected for use in this study was Hexce l F185. rhis
resin was selected because it is known to be relatively ductile ( 1)% e longation
itn a tensile test), and therefore would be expected to give significant strain
in the vicinity of the crack tip prior to failure. Furthermore, this svstm has
a large reduction in toughness in ,oing from the neat resin to delamination of
the composite (d000J/m2
to 2O0OJ/m2)5
. Thus, It was considered ideal for this
s tudy v
Hexcel F165 resin was cast Into rectangular plates. It was then machined
into compact tension speoimens which were subsequently fatigue precracked. Then
the specimens were pol Ished on a microprocesser to a 0.03 micron finish.
Final l y, the dot map was burned on the surface using the electron beam in the
SEM, as shown in Figure IA. The crack tip is seen at the bottom of Figure IA,
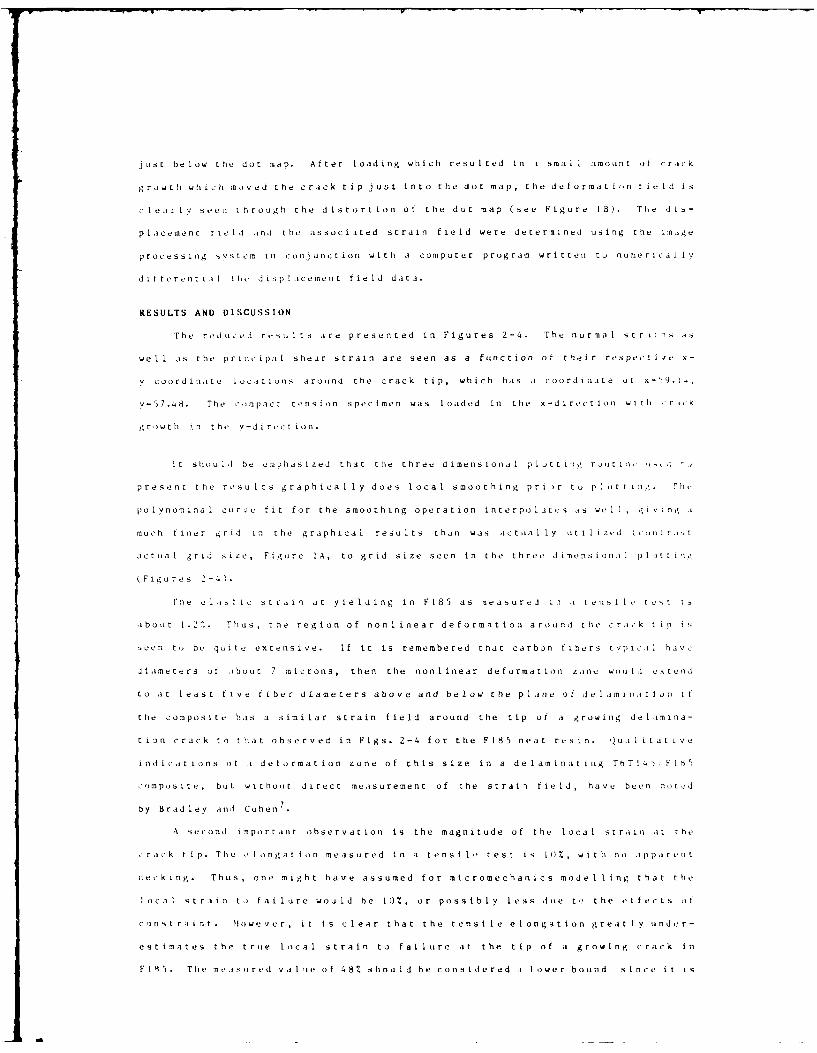
just below the dot map. After loading which resulted in a small amount of crack
growth which moved the crack tip just into the dot map, the deformation field is
clearly seenl through the distortion of the dot map (see Figure IB). The dis-
placement t 1e ld and the associited strain field were determined using the image
processing svstem in conjunction with a computer program written to numerical ly
dit ferentilt trit, displacement field data.
RESULTS AND DISCUSSION
The reduced results are presented in Figures 2-4. The normal strains as
well as the principal shear strain are seen as a function of their respect iye x-
v coordinate Locations around the crack tip, which has a coordinate or Y 9 .I.,
v=57.48. The compact tension specimen was loaded in the x-direction with r t' K
growth in the y-direction.
It should be emphasized that the three dimensional plotting routine ti1'u I j
present the results graphically does local smoothing prior to plotting. The
polynominal curve fit for the smoothing operation interpolates as we I, giving; a
much finer grid in the graphical results than was actual ly Ut i iz-a coLr. ,t
actual grid size, Figure IA, to grid size seen in the three dimnensional plotting
(Figures 2-4).
n l e e I Ist ic strain a t yielding in F185 as measured i nate n s i I e t es t I
a ,about .2 . Thus, the region of nonlinear deformation around the crack tip is
seen to be quite extensive. If it is remembered that carbon fibers typic I have
diameters or about 7 microns, then the nonlinear deformation zonc would extend
to ,at least five fiber diameters above and below the plane of del amin at ion i f
t he composite has a similar strain field around the tip of a growing delam ina-
tion crack to that observed in Figs. 2-4 for the F185 neat resin. Qua i ftat LVe
indications of a deformation zone of this size in a delaminating rbTl1 , FIS5
2 u in po s i t e , b u t w i t h o ut i i r e c t measurement o f t he strai ftie Id, have been n oted
by Bradley and Cohen7 .
A second important observation is the magnitude of the local strain at the
crack tip. The e longat ion measured in a tensile tes: is 1O%, with no app arent
n e c k i n g . Thus, one might have assumed for micromechanics mode 1 1 ing t ha t t le
Ioca l 1 t rain to failure would be Iot, or possibly less due to the et fects of
c o n s t r a i n t . Ho we v e r , i t i s clear that the tensile elongation great I y und e r-
e s t i ma t e s t he t r ue ,lc a 1 s t r a i n t o f a 1 1 iur e a t t he ti p o f a g row I n g c r a c k i n
F 1 4 5 . Tile me a s u red v a I e o f 48Z shou ld be cons idered a 1 ower bound s I n c e i t ts
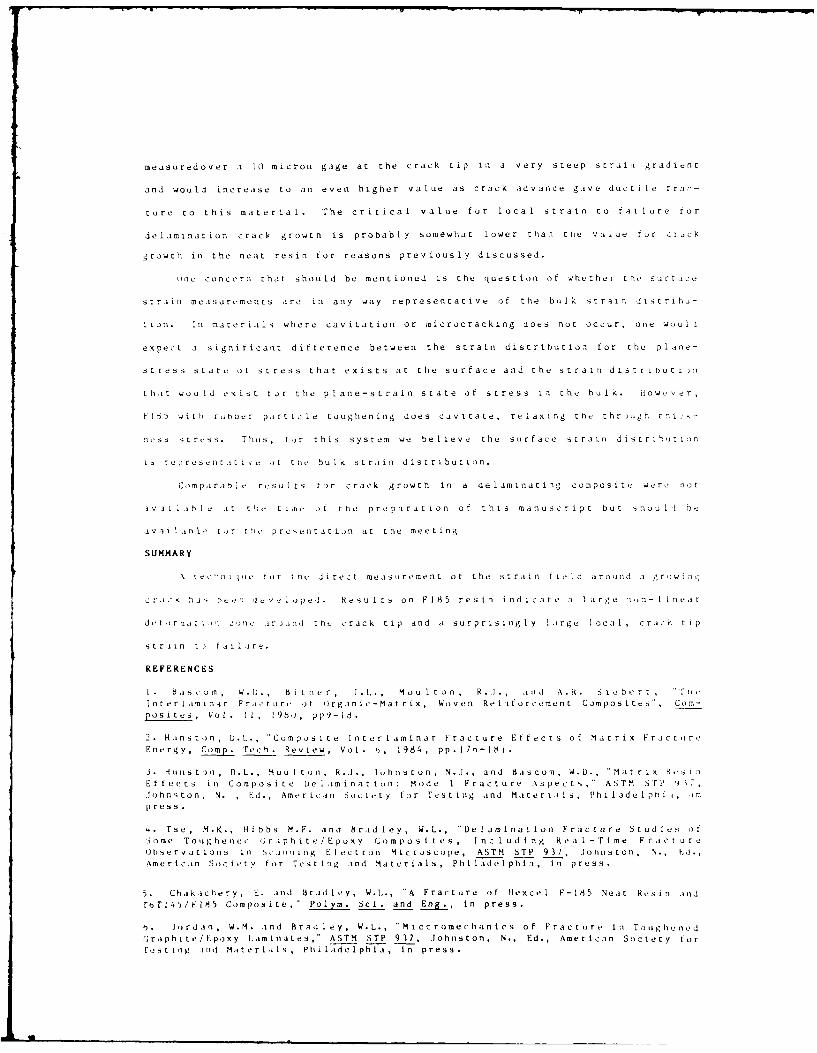
measuredover a to micron gage at the crack tip it, a very Steep strainl gradient
and would increase to an even higher value as crack advance gave ducti Le ra.:-
tour e cto t h is ma t er ialI. The critical v aIu e f or l ocaI s tr a in t o fat loure vfour
del I minat ion crac' growth i s probably somewhat lower thitan thte v aIu e t or c r ick
growth in the neat resin for reasons prev ious ly discussed.
strain meaisurements are in any way representative of thte bulIk st ra in d istcr i hu-
tion1. In naterials where cavitation or ricrocracking does not occur , on wouIA
e xp ect a significant difference between the Strain distribution foar t he plIane-
strIFes SState Ot Stress that exists at the surface and the Strain dis t ri1nuti in
t:hait wou ld exist for the plane-Strain state of stress in the bulk. i o w ,v e r
F I z5 4i it runovr pairt ic Le toughening does cavitate, rela x ing t he t h r rgi h ti: I,,-
!Ies sStress. thits, r or t h is s y stiem we bel1 1e ve thIte suitr f ace s tr a in d istLriho ti1)n
i., r e resen it L t e of t tte b uI K st ra ini d ist r ibu tio n .
C om pa rable r e s ultis f or c r ack growth i n a delaminiating composite wer e n oti
I V 3 i >hlIe a t t te ti111e 1) t he pr ep aradt i on o f t h is m an u sc r ipt b ut sthoulIi be
a va iablIe i ) t i pr es enit at ion at the meeting
SUMMARY
A techii iIote tfor tne direct measurement ofr t he s t r ain fi1elId a r o und a g rojwing.
ra k h1 ai e b e a V e 1 o p e d . R e sult s o n F1I8 5 re s in i n d i c a t e i I a r g e ni ) n - I n e a r
d et r na i ,i co)ne ir JUno thu crack tip and a su rp r is inigl1y l ar ge lc al1, cr a c tip
stLr I In LIo I ire
REFERENCES
L. Bis - oin, w . 1)., H ite r, .. L ., M oulto:)n , R .IA., a id A .R. S ie b ert L IIIn ter l am 1inar F ra ct u reo j Or ga n ic- M at r ix, Woven Reinforcement Composites", Co m-po si te S , Vol. I, 9 8.1 ), p 9 - 1
2. suLto n , U. L. Como s ite I nter Iaminar Fracture Efftects of Mat rix FractuireEnergy, comp. Tech. Review, Vol. 1), 1984, pp.1
7b-181.
3 . H unis t on, D .L ., Mouultt on, R .I. , Johnston, N.J., and haS c omin, W.V., "Mat ri 1 XeKInTEf fe ct in ii C ominpots ite el irin at i )n: Ito de I F ra ct ureL Asp1)ectIs, A STM SIrP 14 7 ,,Io hn st o n, N . K Rd ., Amr ic-ani So ci1e ty f or T e st ing a nd M at eri1alIs , Pil Ia d elIphi , mp re ss .
4 . Tse , M.-K., Hi b bs M .F. a nd 8 r ad I ey , W .L. DelI a mi na dcio n Fracture St ud ies of;iomine Tnoiugh e n e 0 Crap h it e /Ep o xy Cominp o s t tes I nc u d i ng R e aI-rt im e F r act ur eo b se rv at i on s i n ), j i i itg ElIt ,c t r uni Microscope, ASTM STP 937. J oh1n Sto)n , N ., a .,Amer icain Soic i ety f or r e s t in g a nd Ma t er ial1s , Phi I ad e t ph- i a , -n pr es s.
5. Chakachery, E. and Brad ley, W.1.., "A Fracture of Ilexcel F-185 Neat Re s In an dr6TI45/F1H5 Composite," Pol ym. Sc i. and Eng., in press.
h . Io r da n, W . M. a nd B r a dIe y, W .L. , *M ic cr omec h an ic s o f F ra c t ure I n To ugIte n edG;ra ph it e/ Epo xy Lam in atLe s, "ASTM sTp 9 37, Johnston, N., Ed., American Society foL)r
I S t L n y .i id Maite r i1 1 s v P hi 1 Itd e I ph i a , i n press.
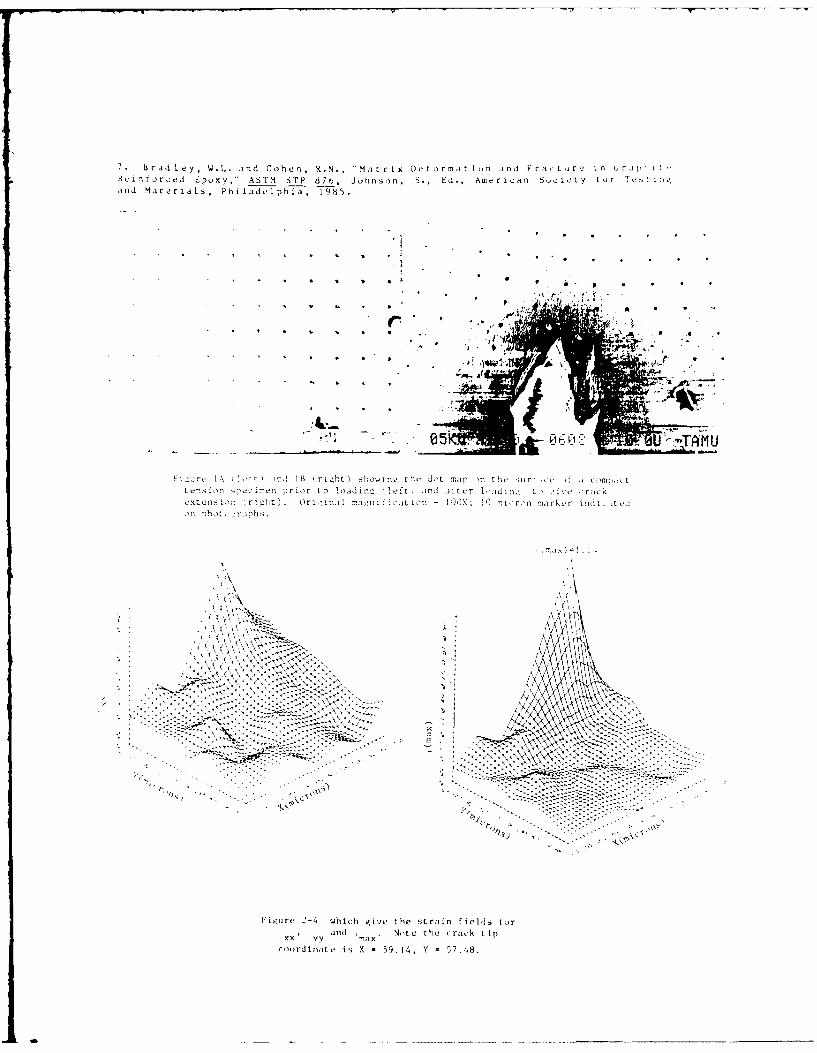
7 . B r ad le y, W.L. and Co he n ,R.N. , "Mat r i x D t ar ma t i n i1n d F ra c tuar C in fl r ! I tReinforced Epoxy,' A STM STP6 87 6 J u nn sn, S., Ed., American Soci et Y taor Tetca nd Materials, Ph iladelphia7, 1T985.
* . ., .
-0 -,A- U .
Fi:_ur, 1:% 1 t t ind] B rtc ht) sliowinc t le Jot iiop on the ur! I-. ) 0 coptenSiOn : 5,inen prior to loadinc ft ) id afrl,,md1:mc.I '' t I Ve croc Kextens'r,- (rjit). rin.1manif ic tton - -O:) m nuron noirkur in t rod
On pbot- 'phs.
Figur 2-4 whichvivethe train fiels)fo
7< I tan ax.Noete r~ktLoord nat is - 9, 1 , Y = 57.48
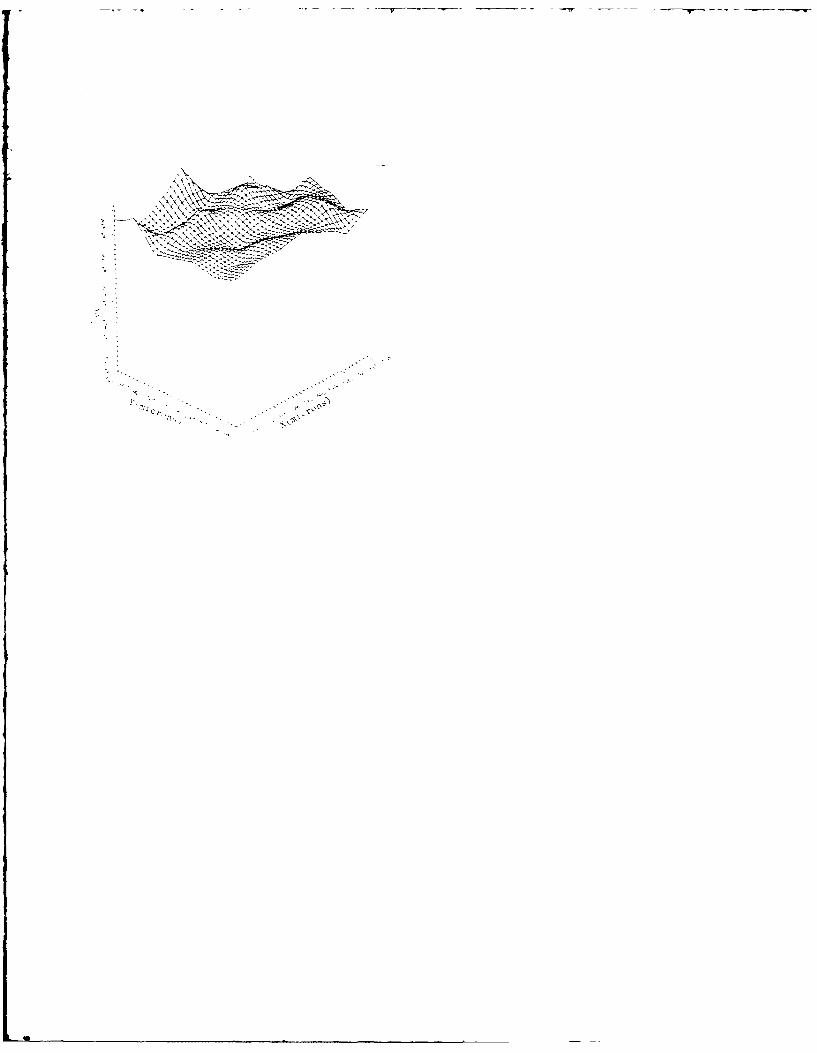
-I. - S -- - - .wY. - .- - .- p.--~---.w -~.
\ <K ~Ja~ Jt-~7W
"NV--S..

Correspondence Between Stress Field and DamageZones Ahead of Crack Tip of Composites Under Mode I
and Mode II Delamination
Carlos Corleto, Walter Bradley, andMogens Henriksen
Proceedings of Sixth International Conference on Composite
Materials: ICCM-ECCM, Eds. Mathews, Buskell, Hodgkinson, and
Martin, London, Elsevier Applied Sciences Publisher Ltd.,
Vol. 3, pp. 3.378-3.387 (1987).

CORRESPONDENCE BETWEEN STRESS FIELDS AND DAMAGE ZONES AHEAD OFCRACK TIP OF COMPOSITES UNDER MODE I AND MODE II DELAMINATION
Ca-'os Corletc, 'alter BracicyDepa:r'enr of chia.'ca- n~err~
Texas A&M U2versity,:oliege STxr -
ABSTRACT
The Stress f:tlc ahead of the crack tip of a split laninate specimen-oade- -,nce- moce and Ioce 1: del'aminaton "as been determined by meansof a fc7t:e element analys-s. The res-l:s have then been compared to theobserved dmage zone developed ahead of the crack tip for the same loadingconC:t ons. A d:rec: correspondence has been found between the stressf elds, damage zones observed, and resistance to delamination ofcomposites for this modes of delaminatior fracture.
INTRODUCTION
Fiber-reinforced composite materials usually offer poor resistance to
delamination. As a result, a complete understanding of the delamination
process is needed to properly design composite stractures and develop
materials with improved fracture toughness characteristics. An important
area of investigation is the determination of the stress field ahead of
the crack tip for the various modes of delamination fracture (i.e. mode I,
mode ", and mode !':), by means of fin-te element analyses. Furthermore,
these stress fielcs can be related to the corresponding observed damage
zones that devebo0 aheid of the growing crack as determined from in-s:tu
observations ,n tne reannng electron mzcro~cope. This combination of
analyses with direct c~servation of delam:natuun has been very useful in
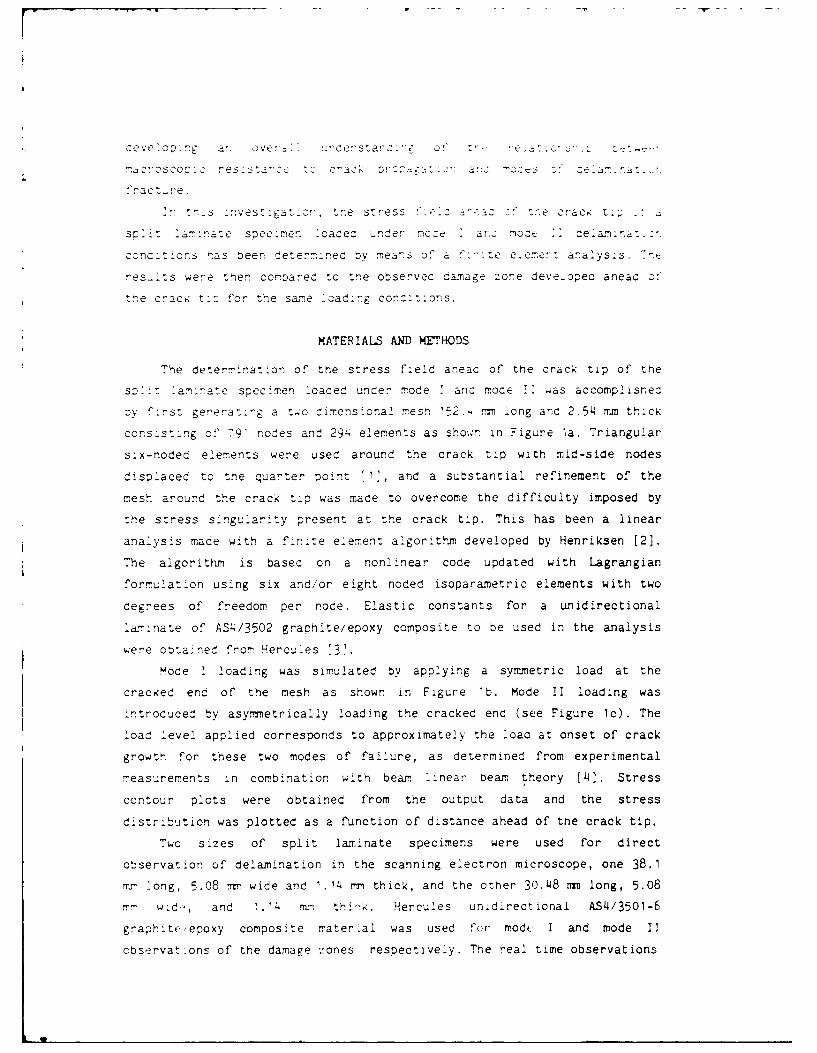
r
ceve op:ng at ove-Z. 0!ncerstac ." o" ,.-
ma roscc : res Z'a'c tc' 7.2r ' :3C DOC7. :" c !Anat
ract-re.
_r tnis 'nvest'gatr,' tne stress 'eac -"se crack t_ •
spc t "aninate specdme. loadec under mcce ar.2 motcEc -ce'am n, .
czndit:orns '.as beer :_etermnirec bv means of a f-r'te e-emer: analysis.
res-' Is were then compared to tne observed carnage zone deve-opec aneac
tne cracK t:2 for the sa-me 'ocig conc:tzons.
MATERIALS AND METHODS
The determination of the stress field aneac of the crack tip of the
s-l"am:hate specimen loaded under mode I anc moce " was accomplisrec
:)y first generating a two dimensional mesh '52.- -n long ant 2.54 mm thick
cons-sting of 79' nodes and 294 elements as sho:;n in Figure la. Triangular
six-noded elements were used around the crack tip with mid-side nodes
displaced to the quarter point '1', and a substantial refinement of the
mesh around the crack tip was made to overcome the difficulty imposed by
the stress singular.ty present at the crack tip. This has been a linear
analysis made with a finite element algorithm developed by Henriksen [2].
The algorithm is based on a nonlinear code updated with Lagrangian
formulation using six and/or eight noded isoparametric elements with two
degrees of freedom per node. Elastic constants for a unidirectional
laminate of AS4/3502 graphite/epoxy composite to be used in the analysis
were obtained from Hercules '3'.
Mode ' loading was simulated by applying a symmetric load at the
cracked end of the mesh as shown in Figure lb. Mode II loading was
Jntroduced by asymmetrically loading the cracked end (see Figure Ic). The
load level applied corresponds to approximately the loac at onset of crack
growth for these two modes of failure, as determined from experimental
measurements in combination with beam, linear beam theory [4]. Stress
contour plots were obtained from the output data and the stress
distribution was plotted as a function of distance ahead of the crack tip.
Two sizes of split laminate specimens were used for direct
observation of delamination in the scanning electron microscope, one 38.1
mr long, 5.08 r wide and 1. 14 mm thick, and the other 30.48 m long, 5.08
m! w:d .-, and '.14 m:m thi -k. Hercules unidirectional AS4/3501-6
graphite,epoxy composite mater al was used fcr, mode. I and mode I
cbservations of the damage zones respectively. The real time observations

celanat.on were made ir a JEOL-35 scanning electron microscope. Mode
delam~nation was achieved t. pushing a wedge into the precracked portion
of the longer split lamnate specimens, using the tensile stage of the
scanning electron microscope. The wedge was sufficiently blunt to ensure
that it remained well away from the crack tip, giving esentially pure mode
I loading. Mode 1 delamination was achieved by means of a specially
designed three point bend fixture installed to the tensile stage of the
scanning electron microscope. All surfaces observed were coated with a 150
A thick gold/palladiL film to minimize charging effects associated with
the nonconductive natu-re of the eooxy matrix of the composite. The
experimental results were recorded on standard tr,-x film.
RESULTS AND DISCUSSION
Figures 2 and 3 show the finite element results for both mode I and
mode 11 loac:ng. Figure 2a is a Syy (norma>) stress contour plot from the
vicinity of the crack tip for mode 1 loading. The normal stress Syy which
for this loading and geometry is the principal normal stress S2 , rapidly
decreases ahead of the crack tip. Figure 2b corresponds to the Sxy (shear)
stress contour plot for a mode " condition. Note how the shear stress
drops off much more slowly with distance ahead of the crack tip than does
the normal stress fcr mode ' loading (Figure 2a). Furthermore, the shape
of the stress field is more narrow and elongated. For this loading
condition, Sxv = maximum shear stress = S.. Figure 3 shows the stress
distribution as a function of distance ahead of the crack tip for mode I
and mode Ii. In the case of the normal stress for mode 1, the stress drops
off rapidly until it is compressive at a distance of 0.76 mm ahead of the
crack tip. Finally, it gradually approaches a zero stress level at
approximately 8 mm from the crack tip which is maintained all the way to
the end of the beam. It should be noted that the compressive stresses
observed are not expected to significantly influence the fracture mode at
the crack tip because it develops far enough away from the crack tip. In
the case of the shear stress distribution ahead of the crack tip for mode
!I, it monotonically decreases to a constant value. As it can be seen, the
shear stress ahead of the crack tip for mode I1 loading decays much slower
than the normal stress for mode I loading. These results indicate that the
stress concetration at the crack tip is distr-buted over a larger distance
for mode II loadinF than for mode I loa.ng. For mode II, the extent

96. 9 MPa
~20.7 MPa, '
2.5 =n Ahead crack ---- Behind crack 2.5 M
(a) Syy S2, mode !.
-6.9 Ma a
-----.. 0 Pa
6. MPa - -
2.5 m Ahead crack Behind crack 2.5 um
(b) Sxy S1, mode I.
Figure 2. Stress contour plots.
of the stressed material above and below the center plane being much
smaller than for mode 1, as seen in the stress contour plots in Figure 2.
Figure 4 corresponds to the observed damage zones developed ahead of
the crack tip for both mode I and mode 11 delaminatiin of AS4/3501-6. The
mode I damage zone is characterized by extensive microcracking of the
resin extending at least 90 microns ahead of the macroscopic crack tip and
approximately 7.5 microns above and below the primary plane of crack
advance. In the case of mode II, the damage zone extends much further
ahead of the crack tip (at least 180 microns) than the node I damage zone,
anc is approximately 5 microns in extent above and below the primary crack
planie.
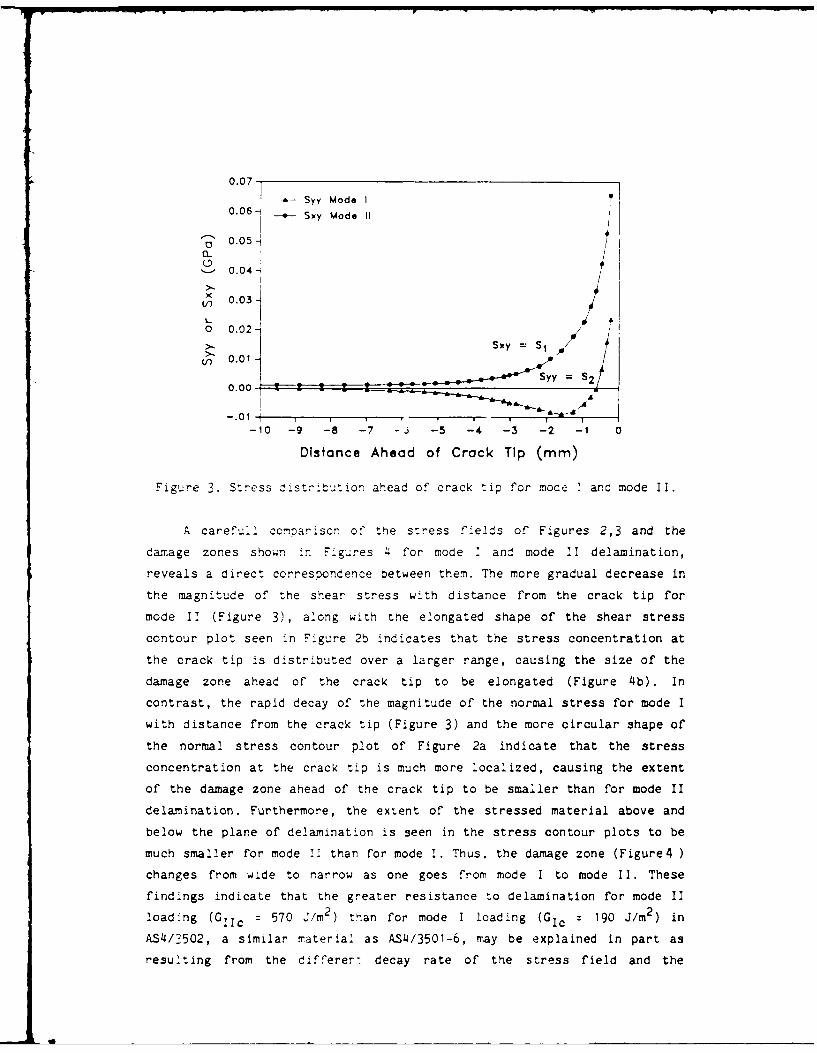
0.07 -I ---- Syy Mode I
0.06 - Sxy Mode II
- 0.051CL
0.04XV) 0.03
o 0.02 0
-0.01
-10 -9 -8 -7 - -5 -4 -3 -2 -1 0
Distance Ahead of Crack Tip (mm)
Figure 3. Stress ;.strtiution ahead of crack tip for moce : and mode I.
A carefull comparison of the stress fields of Figures 2,3 and the
damage zones shown in Figures 4 for mode I and mode II delamination,
reveals a direct correspondence between them. The more gradual decrease in
the magnitude of the shear stress with distance from the crack tip for
mode II (Figure 3), along with the elongated shape of the shear stress
contour plot seen in Figure 2b indicates that the stress concentration at
the crack tip is distributed over a larger range, causing the size of the
damage zone ahead of the crack tip to be elongated (Figure 4b). In
contrast, the rapid decay of the magnitude of the normal stress for mode I
with distance from the crack tip (Figure 3) and the more circular shape of
the normal stress contour plot of Figure 2a indicate that the stress
concentration at the crack tip is much more localized, causing the extent
of the damage zone ahead of the crack tip to be smaller than for mode II
delamination. Furthermore, the extent of the stressed material above and
below the plane of delamination is seen in the stress contour plots to be
much smaller for mode I1 than for mode I. Thus, the damage zone (Figure4)
changes from wide to narrow as one goes from mode I to mode 11. These
findings indicate that the greater resistance to delamination for mode II
loading (G:ic 2 570 /im2 ) than for mode I loading (Gic 190 JIm 2 ) in
AS4/3502, a similar material as AS4/3501-6, may be explained in part asresulting from the differer:- decay rate of the stress field and the
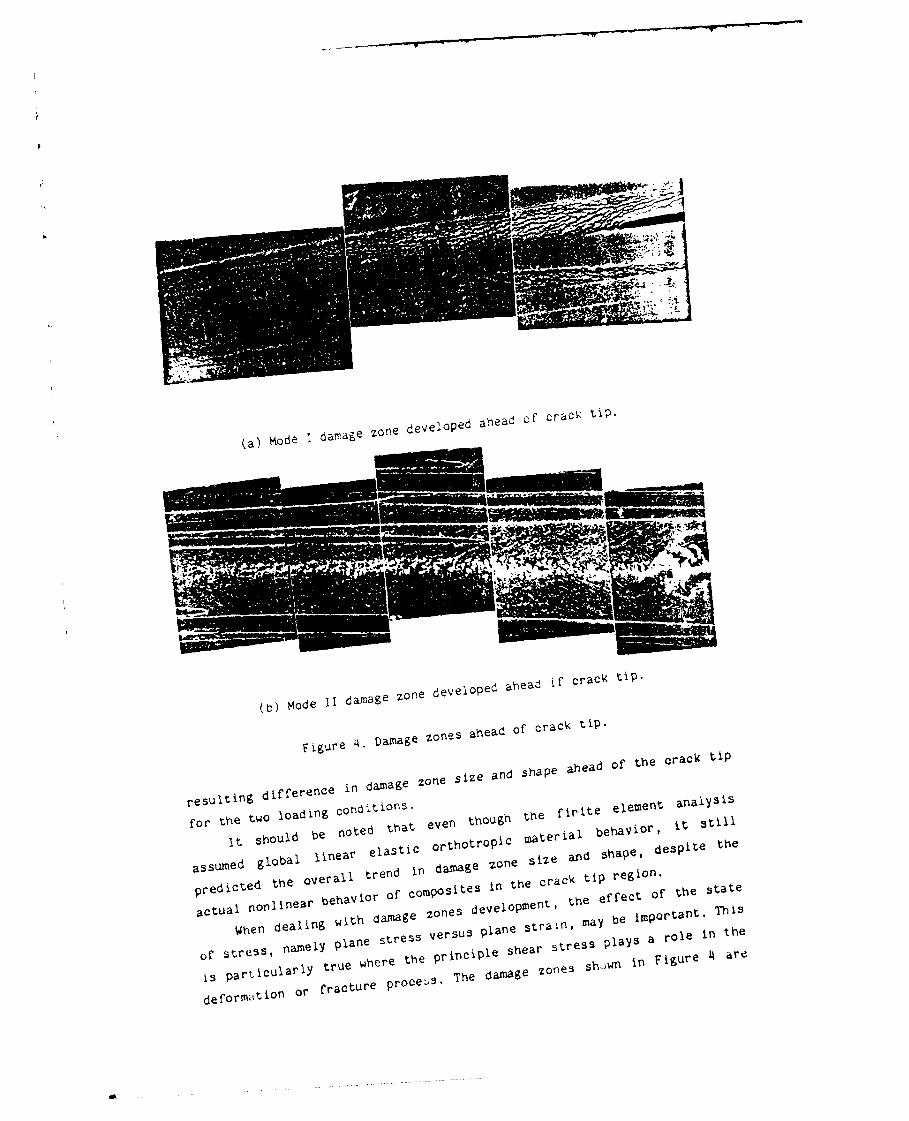
(a~mode aaezn developed ahead ofraCi' tP
(b) Mode ii damage zone developed
ahread if cracV( tip-
i g u r e 4 .D a m a g e z o n e s a h e a d f c r a c V~ t i p . h r c i
resulting difference in damage zone size and shape ah ead of teca~
i
for th two ul od in be n doted th t even thou gh~ the f irite e~elemet analy sis
assed obldb lne elati orhrP material behavior, It still
predicted the overall trend in daage zne tze acd tape e pitoth
aculnonlinear behavior of composite$
nteca~<tprgo
a hnctliuaihlamg zones developmentr the effect Of the state
ofe dteSS aln pl aane stes versus Plane strain, may be iluPortant. This
lal rue where the principle shear stres plaguare in ahe
de o m t o or fracture proce ;3 The da 3 O l s Wf in F g r 4 ar

0.30-PLANE STRESS ISOTROPIC
0.25 - PLANE STRAIN ISOTROPICO 0.25O - PLANE STRESS ORTHOTROPIC
--- " PLANE STRAIN ORTHOTROPIC A
, 0.20,
So.5 MODE I LOADING
{n 0 . 1 0 -/0.10 AS4/3502 i /I (Orhotroplc) 1" /
C a a0 0.05- oI
A Isofroplc
0.00 - s _ I - a _ ,-8 -7 -6 -5 -4 -3 -2 -1 0
Distance Ahead of Crack Tip (Mm)
(a)
0.16
-.-- PLANE STRESS ISOTROPIC/-., 0.14 PLANE STRAIN ISOTROPIC
0L ---- PLANE STRESS ORTHOTROPIC0 0.12
.-.- PLANE STRAIN ORTHOTROPIC
V) 0.10
S0.08- MODE II LOADING
ID 0.06
0.04-C0 AS4/3502> 0.02- (Orthotroptc) u
0.00.-- I I-6 -7 -6 -5 -4 -3 -2 - 0 o
Distonce Ahead of Crack Tip (mm)
(b)
Figure 5. Von-Mises stress for mode I and mode II loading.
obviously from the edge of the specimen where a plane stress conditionoccurs. Therefore, in order to have a first order approxmation as to theeffect t~e difference in the state of stress at the surface of the

specimen where our direct observations are made, and at the center were
plane strain conditions prevail, the Von-M:ses stress for mode I and mode
II was plotted as function of distance ahead of the crack tip. The results
in Figure 4a indicate that for mode 1, the difference in the Von-mises
stress (or root mean square shear stress) in plane stress versus plane
strain is approximately 10% . In the case of mode II, the difference is
negligible as evidenced in Figure 4b. Therefore, it appears that for these
orthotropic materials, the difference between plane stress and plane
strain is not too significant and our surface observations of damage zone
size and detail should not be very different than subsurface behavior.
Previous studies in which the post mortem appearance of the fracture
surface near a free edge to that at the center of a specimen are
consistent with this interpretation '6'. A final observation from Figure 4
:s that the stress field ahead of a crack tip decays much more slowly for
and orthotropic material with the crack parallel to the fibers than for an
isotropic material.
CONCLUSION
In sumnary, it has been founc trat tre t:fferert size and shape of
the damage zone observed when comparing mode I to mode 11 delamination is
consistent with the difference in the size and shape of the stress field
predicted by the finite element analysis. Furthermore, these differences
are also consistent with the difference in resistance to delamination of
brittle graphite/epoxy composites for the two types of delamination
studied. Also, there appears to be a very small difference between plane
stress and plane strain states of stress for orthotropic materials.
Therefore, the damage zones observed during in-situ delamination in the
scanning electron microscope should not vary significantly from the actual
damage zone that develops at the center of the specimens (plane strain
damage zone).
REFERENCES
1.- Barsoum, R.S. On the Use of Isoparametric Finite Elementsin Linear Fracture Mechanics. International Journal forNumerical Methods in Engineer:ng, Vol., 10 pp. 25-27, 1976.
2.- Henriksen, M. Engineering Departmen-, Colorado School of MiresGolden, Colorado, 80301.
3.- Hercules Mannual of AS4/3502 Craphi-e/Epoxy. Hercules Corporation

Magma, "ah.
4.- Vanderkley, P.S., Mode - Mode II Delamination FractLreToughness of a !nidlrectional Graphite/Epoxy Composite, aThesis, Texas A&M 2nivers:v, College Station, Texas, 1981
5.- Jordan, W. '. The Effect of Resin Toughness on Fracture Behaviorof GraphiteiEpoxy Composites, PhD Dissertation, Texas A&MUniversity College Station, Texas, 1985.
6.- Jordan, W.M., and Bradley, W.L., Effect of Resin Content on theDelamination Fracture Behavior of Graphite Epoxy Laminates, presentedat the 29th National SAMPE Symposium, April 3-5, 1984, and appearingin the proceedings entitled: Technology Vectors, pp. 1422-1437.

Fracture Toughness Testing of Polyethylene Pipe Materials
Robert E. Jones, Jr. and Walter L. Bradley
Department of Mechanical Engineering
Texas A&M UniversityCollege Station, TX 77843
Revised 6/1/87
Accepted, 7/1/87 for publication in ASTMSpecial Technical Publication
entitled
Nonlinear Fracture Mechanics
.. ....... .. .. ... ....

ABSTRACT: Multi-specimen J integral tests which are defined in
the Standard Test for Jlc' A Measure of Fracture Toughness (ASTM
E 813-81) have been conducted on side-grooved compact tension
specimens of medium and high density polyethylene. Specimens were
precracked with a razor blade, as has been common practice to
date, or were fatigue pre-cracked. Tests were performed over a
5OX range of crosshead rates in the quasi-static regime. Results
indicated that the razor notching gives a J-R curve which is
significantly higher than that obtained using fatigue precracked
specimens. A significant variation in the J-R curve was noted for
changes in the displacement rate due to the viscoelastic
character of the polyethylene. The orientation of the specimens,
which were cut from actual pipe, was found to have a significant
effect on the fracture toughness. The fracture toughness results
were correlated with fractographic results and the behavior of
side-grooved vs. non-side-grooved specimens was compared.
KEY WORDS: Polyethylene, Fracture (materials), Compact Tension
Test, Fatigue (materials)

INTRODUCTION
Thermoplastics are seeing increased use as structural
materials. With this increased structural use a need has arisen
for a method of determining useful fracture mechanics parameters
for failure prediction. Thermoplastics such as polyethylene (PE)
which have a high degree of ductility and exhibit strong
viscoelastic behavior present a problem for linear elastic
fracture mechanics (LEFM) testing procedures. Previous
investigators [1,2] have used the concepts of LEFM with tough PE
in an effort to determine a valid olane strain fracture toughness
(Klc). They encountered difficulty in doing so at temperatures
near normal operating conditions for PE piping. However, it has
been shown [3] that an elastic-plastic J integral approach as
defined in the Standard Test for Jlc' A Measure of Fracture
Toughness (ASTM E 813-81) will yield plane strain toughness
values for tough PE which meet the requirements of the standard
for valid J values when tested in the normal operating
temperature regime.
The question then arises as to the validity of a non linear
elastic analysis such as the J integral when applied to a
viscoelastic material. There is no currently approved standard
for determining the fracture toughness of viscoelastic materials.
However, R.A. Schapery '4' has shown that tte J integral may be
applied to fracture in viscoelastic media. Schapery assumes in
his analysis that the work of fracture in the process zone is
independent of the crack growth rate and that the significant
viscoelastic effect !rate dependence) is through the time
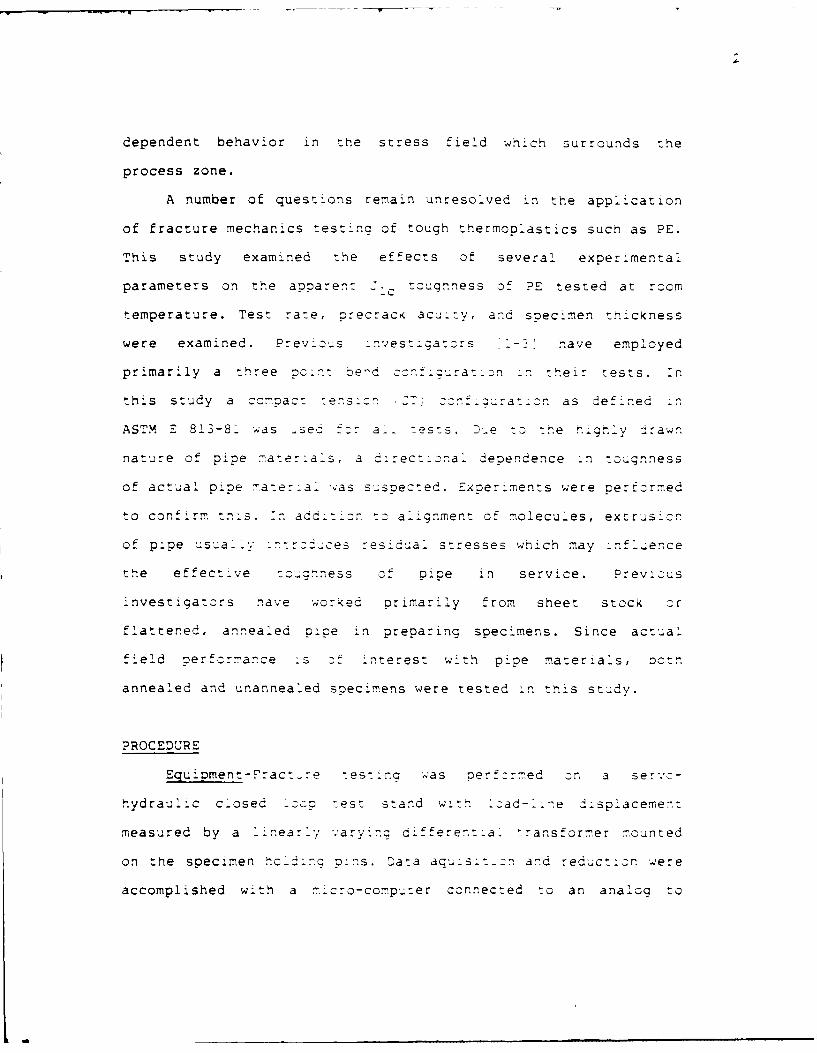
dependent behavior in the stress field which surrounds the
process zone.
A number of questions remain unresolved in the application
of fracture mechanics testing of tough thermoplastics such as PE.
This study examined the effects of several experimental
parameters on the apparent -c tougnness of PE tested at room
temperature. Test rate, precracK acuity, and specimen thickness
were examined. Prev:os investigators nave employed
primarily a three oint --end oonfiourat:on in their tests. :n
this study a compact tens'cn , cnf-ouraticn as defined in
ASTM E 813-81 was -se, f:o a- r ests. Due to the nignly drawn
nature of pipe 7aterials, a direct-o:naL dependence In tougnness
of actual pipe mater-a1 was suspected. Experiments were performed
to confirm tnis. :n addition to alignment of molecules, extrusion
of pipe usualy in-trduces residual stresses which may infuer.ce
the effect:ve toughness of ope in service. Previous
investigators nave wor~ed primarily from sheet stock Cr
flattened, annealed pipe in preparing specimens. Since actual
field Derformance is of interest with pipe mater:als, octn
annealed and unannealed soecimens were tested in this study.
PROCEDURE
Equipment-Fracture "estiln was perf:rmed on a servc-
hydraulic closed boo test stand witn !cad-Line displacement
measured by a l-nearL." vary:nq differentia1 transformer mounted
on the specimen holding pins. Data aquist:'tn and reduction were
accomplished with a micro-comouter connected to an analog to

digital signal processer. Specimens were observed during testing
through an optical stereo microscope and post mortem fractography
was performed in a scanning electron microscope (SEM).
Specimen Preoaration-2.54 cm CT specimens with uncracked
ligament lengths, b, of 1.5 cm were prepared from a high density
pipe grade polyethylene PE 3306 described in the Standard
Specification for Thermoccast-c Gas Pressure Pipe, Tubing, and
Fittings (ASTM E 2513-75b). Non-annealed specimens were produced
in two thicknesses, 0.635 cm and 0.556 cm, which were reduced 20
percent by side-grooving t0 3.508 cm and 0.445 cm respectively.
Annealed specimens were fut 7 stoc wincn had been heated to
130 0C, flattened, and then annealed for two hours at that
temperature. Specimens --t *-: this stock were 0.572 cm thick
after being reduced 20 percent Dy side-grocving. Two add-tional
specimens were out to a tnc-.ness of D.508 =n. One was reduced in
tnicness 20 cercent wztn s:oegrccves. Witn the exception of one
set, specimens were Cot w:tn tne starting notch in the
sng:tud~nal c:pe direct:cn; tn us, they are termed transverse
specimens -n the standard ASTM nomenclature. The remaining set of
soecimens was cut to test transverse pipe properties and are
termed longitudinal specimens 4n the ASTM nomenclature. The angle
of the sidegrooves was 45 degrees and where fatigue precracking
was used specimens were precracked before side grooves were
machined. Razor notched specimens were side grooved before
notching.
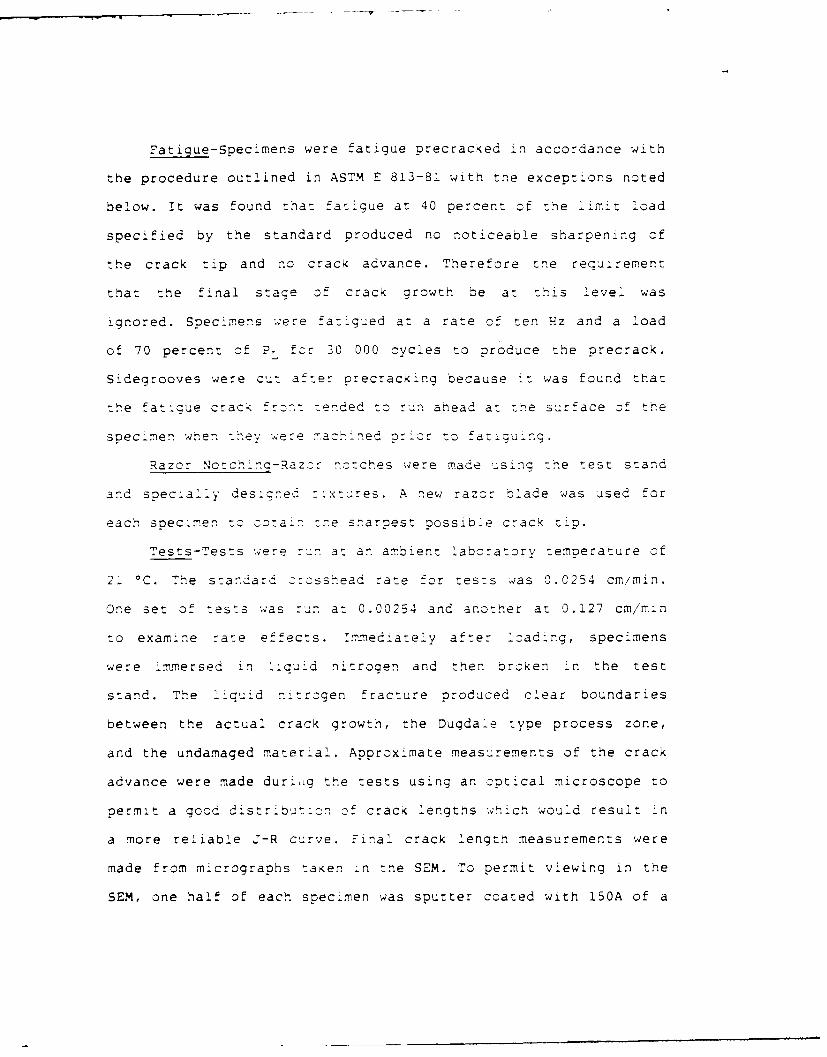
Fatigue-Specimens were fatigue precracked in accordance with
the procedure outlined in ASTM E 813-81 with the exceptions noted
below. It was found that fatigue at 40 percent of the limit load
specified by the standard produced no noticeable sharpening of
the crack tip and no crack advance. Therefore the requirement
that the final stage of crack growth be at this level was
ignored. Specimens were fatigued at a rate of ten Hz and a load
of 70 percent of P, for 30 000 cycles to produce the precrack.
Sidegrooves were cut after precracking because it was found that
the fatigue crack front tended to run ahead at the surface of the
specimen when tnhe- were nachined prior to fatiguing.
Razor Notchinc-Razcr notches were made using the test stand
and spec:ally designed f.xtures. A new razor blade was used for
each specimen to obtain :7e sharpest possible crack tip.
Tests-Tests were run at an ambient laboratory temperature of
21 OC. The standard zrossnead rate for tests was 0.0254 cm/min.
One set of tests was run at 0.00254 and another at 0.127 cm/min
to examine rate effects. immediately after loading, specimens
were imnersed in liquid nitrogen and then broken in the test
stand. The liquid nitrogen fracture produced clear boundaries
between the actual crack growth, the Dugdale type process zone,
and the undamaged material. Approximate measurements of the crack
advance were made durig the tests using an optical microscope to
permit a good distribution of crack lengths which would result in
a more reliable J-R curve. Final crack length measurements were
made from micrographs taken in the SEM. To permit viewing in the
SEM, one half of each specimen was sputter coated with 150A of a

gold-palladium alloy. The crack advance visible on the resulting
micrographs was measured at eleven points evenly spaced across
the specimen width. The mean of the nine inner points and the
average advance at the two surfaces was taken as the crack
advance. The micro-computer used to record load displacement data
was also used to calculate the areas under the load displacement
curves. Jlc was found from the resistance curve plotted according
to the procedure in ASTM E 813-81.
RESULTS
J Integral Testino-Resistance curves like the one shown in
Figure 1 were generated for each test. The results are summarized
in Table 1. The non-sidegrooved thin specimen (0.508 cm) showed a
high degree of crack t~p tonneLing which made it unusable in the
J determination. However, the identical specinmen sidegrooved 20
percent to a thickness of 0.4064 cm yielded a straight crack
front. The sidegrooved thin specimen yielded a J vilue that fell
just below the J-R curve for the thicker specimens ised in the
remainder of the tests.
ASTM E813-81 establishes minimum dimensions for specimens
which are necessary in testing of metals, for the J analysis to
be valid. The requirements are:
a. b,B > 25 j'lc Sy
b. dJ < Sy
These have been calculated for each of tne tests and are listed
in Table 1. Though -ne yield strength of PE can vary greatly with
strain rate, all tests easily satisfied the second requirement.

However, according to the standard, the unannealed razor notched
CT specimens were slightly smaller than the specified minimum.
This was also the case in the high crosshead rate test using
annealed material. These values are reported for comparison since
the standard does not strictly apply to this material. Tests
satisfying these requirements were not possible since thicker
stock was not available.
Fatigue precracking resulted in a drop in Jic of 33 percent
when compared to razor notched specimens in both annealed and
unannealed samples. Annealing decreased the measured Jlc by 47
percent in both fatigue precracked and razor notched tests.The
longitudinal specimens yielded a jc which was !I percent greater
than that determined for the transverse specimen tests.
Bluntina Line-n several of the multi-specimen tests, one
test was terminated before the onset of crack advance across the
entire crack front. The resulting points should have fallen on
the blunting line. As can be seen in Figure 2, the high rate test
required a steeper blunting line. When a yield stress measured at
a strain rate which corresponded to the rate of the fracture test
was used, the appropriate blunting line resulted.
Fractography-Comparison of the surfaces of the low rate and
medium rate fracture tests shows a marked similarity in
morphology but a significant difference in the scale of features.
(Figures 3 and 4). The difference in size of fibrils and voids
corresponds to the trend identified by Chan and Williams [5] and
Lee and Epstein [6. The lower rate has smailer voids and shorter
fibrils. The average diameters of the voids were measured from
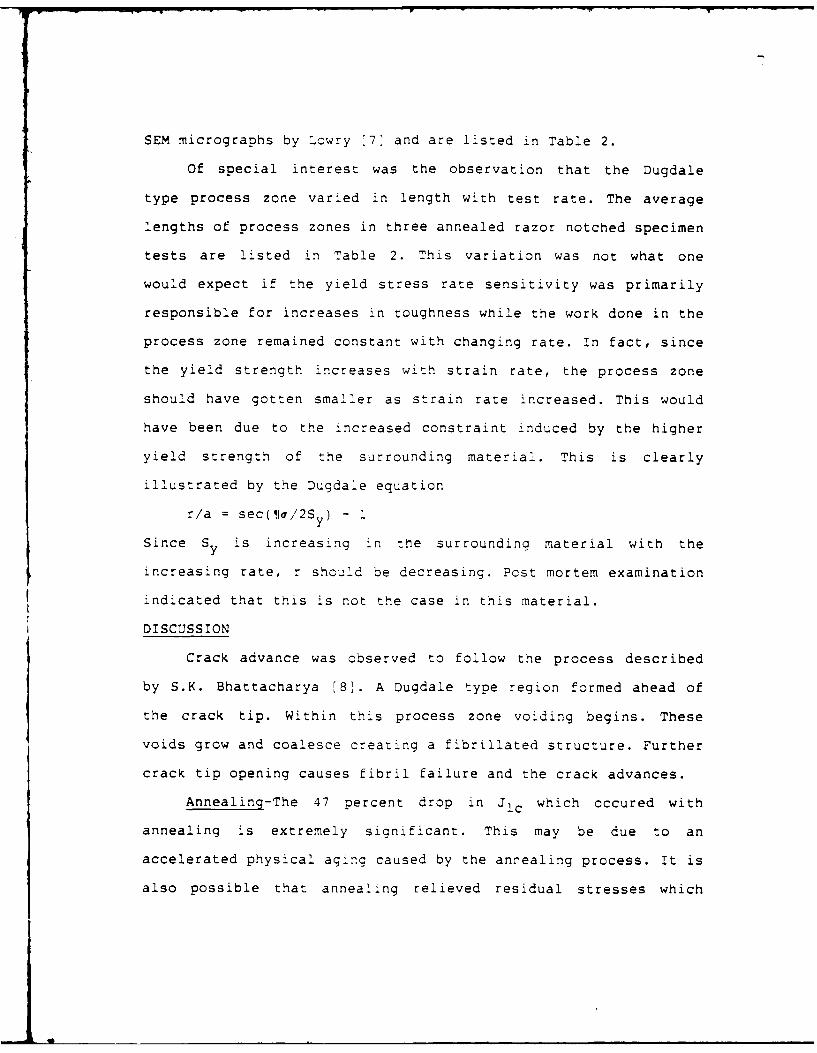
SEM micrographs by Lowry [7] and are listed ;n Table 2.
Of special interest was the observation that the Dugdale
type process zone varied in length with test rate. The average
lengths of process zones in three annealed razor notched specimen
tests are listed in Table 2. This variation was not what one
would expect if the yield stress rate sensitivity was primarily
responsible for increases in toughness while the work done in the
process zone remained constant with changing rate. In fact, since
the yield strength increases with strain rate, the process zone
should have gotten smaller as strain rate increased. This would
have been due to the increased constraint induced by the higher
yield strength of the surrounding material. This is clearly
illustrated by the Dugdale equation
r/a = sec(ifa/2Sy) -
Since Sy is increasing in the surrounding material with the
increasing rate, r should be decreasing. Post mortem examination
indicated that this is not the case in this material.
DISCUSSION
Crack advance was observed to follow the process described
by S.K. Bhattacharya [8,. A Dugdale type region formed ahead of
the crack tip. Within this process zone voiding begins. These
voids grow and coalesce creating a fibrillated structure. Further
crack tip opening causes fibril failure and the crack advances.
Annealing-The 47 percent drop in Jlc which occured with
annealing is extremely significant. This may be due to an
accelerated physical aging caused by the anrealing process. It is
also possible that annealing relieved residual stresses which

inhibit crack advance in the unannealed material. J.G. Williams
(9] has measured significant residual stresses in extrudea oipe.
In fact, the annealed specimens yielded a symmetric crack front
while unannealed material exhibited uneven crack advance
suggestive of the presence of residual stresses. These residual
stresses could have been responsible for the higher resistance to
crack growth in the original pipe material. It is also possible
that annealing modified the crystalline structure of the
material. Density measurements indicated a change in
crystallinity of less than one percent. However, spherulite size
may have been changed by the heat treatment, thus altering the
toughness. The annealing technique is commonly used when working
with pipe material but these results indicate that material so
treated may not reflect true pipe behavior.
Rate-The effect of rate on the magnitude of Jlc was much
greater than expected. The 300 percent increase in magnitude of
Jlc observed with the increase in test rate from the intermediate
rate to the high rate was surprising. From linear viscoelasticity
it can be shown that crack growth rate is related to stress
intensity by:
A = K2 (l+I/n)
if fracture energy is not a function of rate. For PE n can be
taken to be approximately 0.2 and the equatioi becomes:
c = - 12
By using the relationship between K and J for linear elastic
materials we can say that some equivalent "Jlc" is thus
proportional to a!/ 6 . Thus a fifty fold increase in test rate

(crack growth rate) will yield a 90 percent increase in J1 c.
Clearly this is not adequate to account for the increase in
measured J with the increasing test rate. Thus Schapery's (4]
assumption that the fracture energy is independent of' crack
growth rate does not hold in this system. Stated another way, the
far field viscoelastic effects are not sufficient to account for
the 300 percent increase in measured Jlc" Some two thirds of the
increase remain unaccounted for.
The changes in measured Jjc which correspond to changes in
the length and surface morphology of the process zone suggest
that the fracture process, and therefore the energy dissipated in
the process zone, is, in fact, rate dependent. The J integral can
be related to other material and fracture parameters. If we take
the standard relationship between J and CTOD:
J = m'SY'dCTOD
and assume that m is rate independent then J can be increased by
increasing the yield stress, Sy, or the CTOD.
As has already been stated, yield stress increases with
increasing strain rate. The strain rate dependence of the stress-
strain behavior of PE is demonstrated in Figure 5. The increase
in yield strength and rate of strain hardeni-Ig as the strain rate
is increased are clearly apparent. However the increase in yield
stress over the range of strain rates used i'r. these tests is less
than 25 percent. This is not nearly enough to account for the 200
percent increase in J which remains after far field
viscoelasticity is taken into account.
From the above equation it is clear that an increase in CTOD
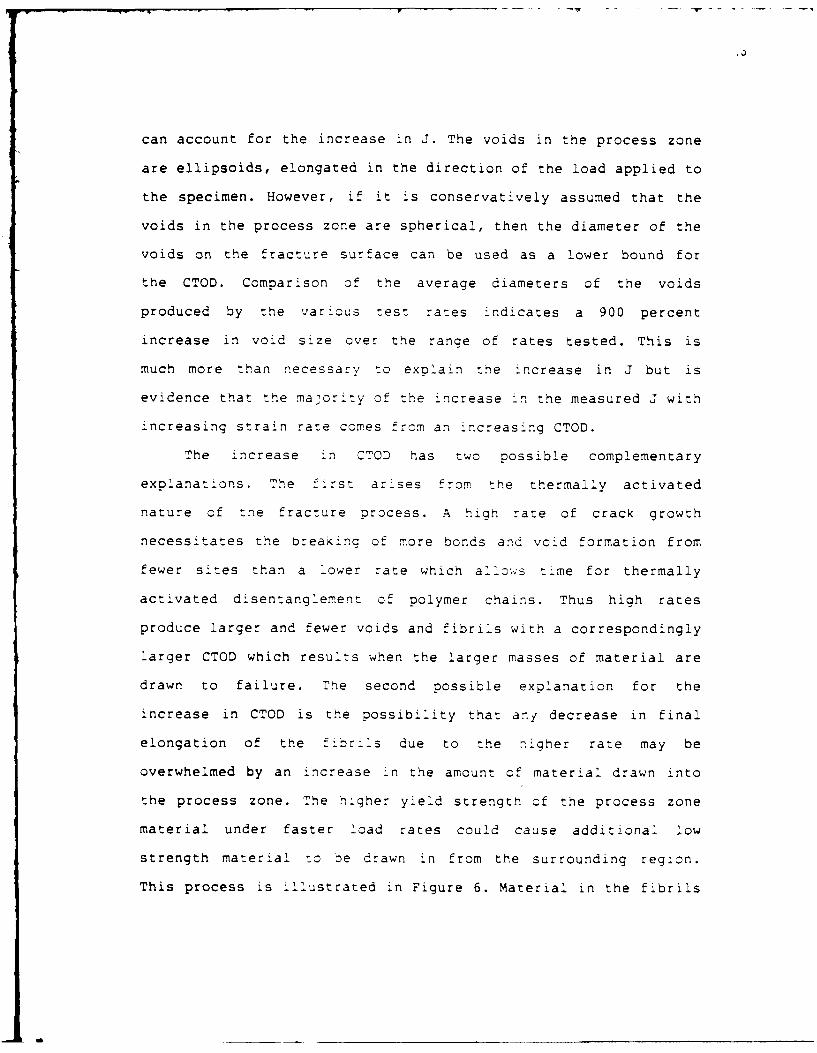
can account for the increase in J. The voids in the process zone
are ellipsoids, elongated in the direction of the load applied to
the specimen. However, if it is conservatively assumed that the
voids in the process zone are spherical, then the diameter of the
voids on the fracture surface can be used as a lower bound for
the CTOD. Comparison of the average diameters of the voids
produced by the various test rates indicates a 900 percent
increase in void size over the range of rates tested. This is
much more than necessary to explain the increase in J but is
evidence that the majority of the increase in the measured J with
increasing strain rate comes from an increasing CTOD.
The increase in CTOD has two possible complementary
explanations. The first arises from the thermally activated
nature of the fracture process. A high rate of crack growth
necessitates the breaking of more bonds and void formation from
fewer sites than a lower rate which allo s time for thermally
activated disentanglement of polymer chains. Thus high rates
produce larger and fewer voids and fibrils with a correspondingly
larger CTOD which results when the larger masses of material are
drawn to failure. The second possible explanation for the
increase in CTOD is the possibility that any decrease in final
elongation of the fibrils due to the nigher rate may be
overwhelmed by an increase in the amount of material drawn into
the process zone. The higher yield strength of the process zone
material under faster load rates could cause additional low
strength material to be drawn in from the surrounding region.
This process is illustrated in Figure 6. Material in the fibrils

has been highly elongated and its strength would correspond to
point B in Figure 5. The material on the edge of the process zone
is less severely deformed and would perhaps correspond to the
material condition at A in Figure 5. At the higher strain rates
the difference in strengths is much more pronounced, as can be
seen in Figure 5, so more material will be drawn into the fibril.
Precrackinq-The 33 percent drop in toughness between razor
notched and fatigue precracked specimens can probably be
explained in terms of the process zone. Fatigue precracking
introduces a process zone ahead of the actual crack tip. Razor
notching does not do so and thus razor notched specimens require
additional work input to cause voiding and fibrillation prior to
crack advance.
The suitability of razor notching vs. fatigue precracking
for these materials can be de:ermined only on the basis of the
actual nature of expected service damage. The observed decrease
in process zone length wi:th decreasing rate would suggest that in
the case of long term static field failures a small process zone
is to be expected. Thus razor notching which produces virtually
no Dugdale type zone would be most appropriate. However, if the
service load will be in fatigue or a mixture of fatigue and
static loading, then fatigue precracking is appropriate.
Thickness- The results of the thickness comparisons would
seem to indicate that very thin specimens can still yield valid
J's if they are sidegrooved. The amount of tunneling observed on
non-sidegrooved CT specimens indicates that sidegrooving is
essential for J integral testing of PE when

specimen thickness is approximately 0.5 cm.
Orientation-The 20 percent increase in Jlc which was
observed when specimen orientation was changed from the
longitudinal to the transverse pipe direction clearly
demonstrated the existence of residual alignment effects. Since
extrusion will tend to align polymer chains parallel to the axis
of the pipe, crack growth perpendicular to this axis should
encounter greater resistance. This was the case.
Blunting Line-The pre-initiation blunting point measured for
the high rate test clearly indicates that some account must be
taken of the strain rate dependence of the yield stress of the
material when the blunting line is calculated. If the appropriate
yield stress is used the blunting line will more accurately
reflect the actual benavlor of the soecimen.
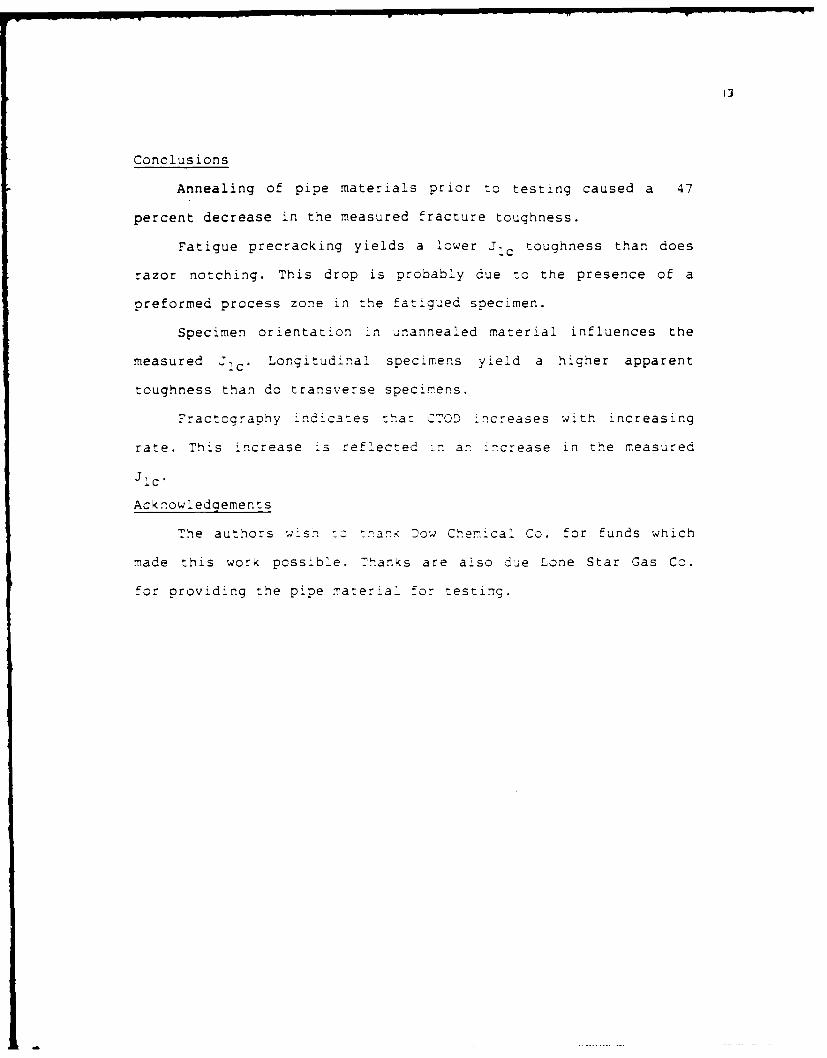
'3
Conclusions
Annealing of pipe materials prior to testing caused a 47
percent decrease in the measured fracture toughness.
Fatigue precracking yields a lower Jic toughness than does
razor notching. This drop is probably due to the presence of a
preformed process zone in the fatigued specimen.
Specimen orientation in unannealed material influences the
measured -Tc Longitudinal specimens yield a higher apparent
toughness than do transverse specimens.
Fractography indicates that CTOD Increases with increasing
rate. This increase is reflected Ln an increase in the measured
Jlc"
Acknowledgements
The authors wish -z -anK Dow Chemical Co. for funds which
made this work possible. Thanks are also de Lone Star Gas Co.
for providing the pipe material for testing.
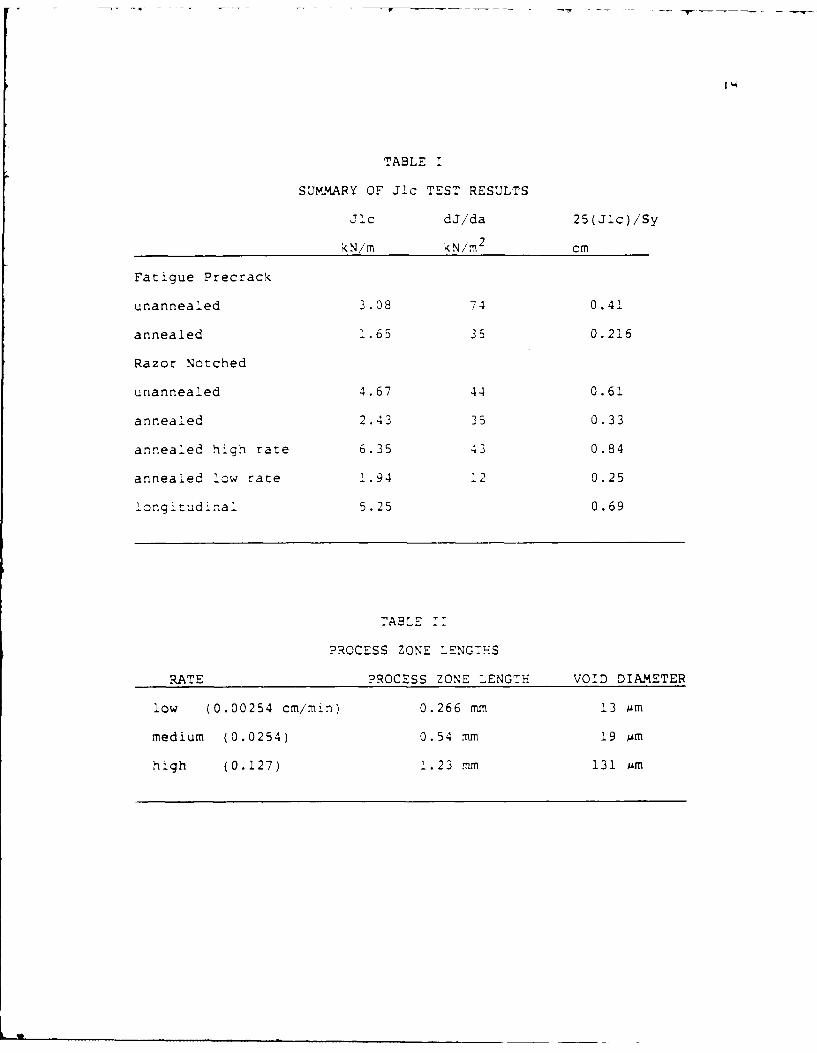
TABLE I
SUMMARY OF Jlc TEST RESULTS
Jlc dJ/da 25(Jlc)/Sy
kN/m kN/m 2 cm
Fatigue Precrack
unannealed 3.08 74 0.41
annealed 1.65 35 0.216
Razor Notched
unannealed 4.67 44 0.61
annealed 2.43 35 0.33
annealed high rate 6.35 43 0.84
annealed low rate 1.94 12 0.25
longitudinal 5.25 0.69
TABLE 11
PROCESS ZONE LENGTHS
RATE PROCESS ZONE LENGTH VOID DIAMETER
low (0.00254 cm/min) 0.266 mm 13 Am
medium (0.0254) 0.54 mm 19 Am
high (0.127) 1.23 mm 131 jsm

References
[1] Mandell, J.F., Roberts, D.R., McGarry, F.J.,
Polymer Engineering and Science, Vol 23, No.7,
May 1983, pp. 404-411
:21 Chan, M.K.V., Williams, J.G., Polymer Engineering and
Science, Vol. 21, No. 15, Oct. 1981, pp. 1019-1026
[3 Chan, M.K.V., Williams, J.G., international Journal
of Fracture, 1983, p. 145
:4' Schapery, R.A., international Journal of Fracture,
Vol. I (1975) p. 369
'5: Chan, M.K.V., WilLiams, J.3., Polymer, Vol. 24, No. 2,
Feb. 1983, pp. 234-244
'6: Lee, C.S., Eostein, M.M., Polvmer EnGineering and
Science, Vol. 22 fL982) o. 549
'7. Lowry, D., Texas A&M University, Personal Commnunication
[81 Bhattacharya, S.K., Brown, N., Journal of Material
Science, Vol. 19, 1984, o.2519
r9! Williams, J.G., Hodgkinson, J.M., Gray, A., Polymer
Engineering and Science, Vol. 21, No. 13, Sept. 1981,
pp. 822-828
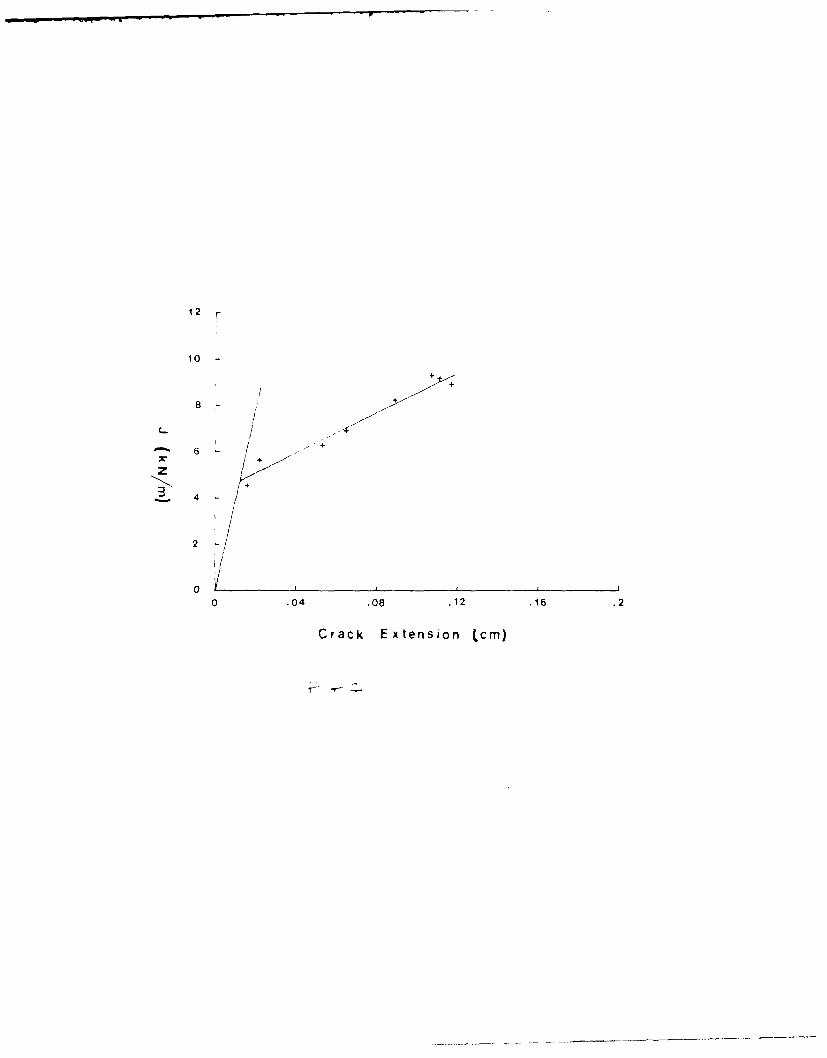
12
10
44
2+
8-0-
0- .0j0i12.6.
6-a~ E+ esin L

1 2
10
8-
z 6-
LOW
2
00 .04 .08 .12 .16 .2
Crack Extension (cm)

i 0.6/ min
100-
0B w04
50-
0.2 .4 6 .8
STRAIN
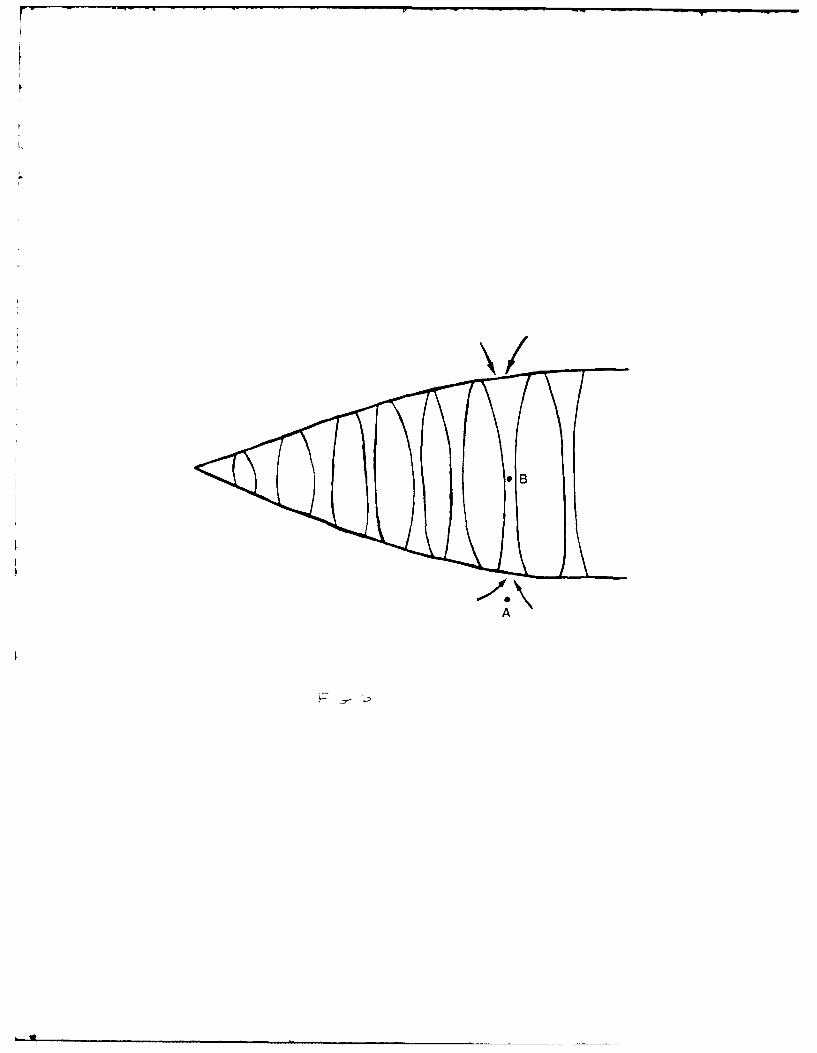
40A
Mode II Delamination Fracture Toughness ofUnidirectional Graphite/Epoxy Composites
Carlos R. Corleto and Walter L. BradleyMechanical EngineeringTexas A&M University
College Station, TX 77843
Accepted for publication inASTM STP entitled
Composite Materials: Fatigue and Fracture

TITLE OF PAPER: Mode II Delamination Fracture Toughness of UnidirectionalGraphite/Epoxy Composites.
AUTHORS: Carlos R. Corleto and Walter L. Bradley, MechanicalEnginnering Department, Texas A&M University, CollegeStation, Texas, 77843
KEY WORDS: Graphite/Epoxy, Delamination, Fracture Toughness, FailureAnalysis, Mode I, Finite Element Analysis.
ABSTRACT:
The mode II delamination fracture toughness of a ductile and a brittle
unidirectional graphite/epoxy composite has been studied using the end-notched
flexure (ENF) test and the end-loaded split laminate (ELS) test. The stress
field in the vicinity of the crack tip of a split laminate beam under mode II
(ELS test) and mode I conditions has been determined by means of a finite
element analys4 s. Also, the micromechanics of mode IT fracture have been
studied during in-situ and post-mortem observations of the fracture process.
Both the ENF and ELS test give similar values for GIIc. However, since elastic
material behavior is assumed in the analysis, the Girc results for a ductile
composite are somewhat uncertain because a small permanent deformation was
observed. The ELS test has been Found to provide a pure shear stress state in
the vicin 4 ty of the crack tip. The formation of hackles provides a more
tortuous path for the crack leading to an increased resistance to delamination
under mode II conditions compared to mode I for brittle composites. However,
extensive resin deformation and yie'ding p~ay a more significant role in the
fracture resistance of tough epoxy composites for mode II loading.

INTRODUCTION
One of the most important factors hincering the use of fiber reinforced
composite materials in structural applications is their inherently poor damage
tolerance for de'amination. The resistance of composites to Gelamination can
be well characte-4zec by tre de'aminat~or fracture toughness, measured as
energy dissipated per unit area of crack growth. Where behavior is essentially
linearly e'astic, tre fracture toucnness can be measured as an energy release
rate, G, of the material. Delamination in composites can occur due to tensile
stresses (mode 1), in-plane snear stresses (mode I), and tearing stresses
(mode .11). As a result, a complete understanding of these delamination
processes is neecec to properly des'gn composite structures and develop
materials with iroved fracture toughness characteristics. Several areas must
then be accressec order to throucr'y understand delamination. First, a
critical assessment of current methods usec to measure resistance to
delamination of comoosites is needed to verify tne validity of the analysis
or the various test ccn,;guratos. Furthermore, tle geometry indepencence of
the measured energy re'ease rates must be established by comparing measured
va'ues "or cierent test ceo-etr-es. P7n~te e'ement analyses may be used to
determine the state of stress at te crack tip where beam theory does not give
details about the stress field. Seconc, a study of the physical mechanisms
involved during the fracture process must be undertaken by means of in-situ
and post-mortem fracture observations. :rmestigations of this nature should
help in the understanding of the relationsnip between the macroscopic
resistance to crack propagation and the microiechanics of fracture.
Recent investigations indicate that increasing 2ode II loading,
particularly for brittle systems, results in a significantly greater
resistance to crack propagation as measured by the total energy release rate
required to propagate the crack I!. This indicates the need to throughly
understand mode II delamination in order to properly characterize this mode of

2
failure.
Several test configuratiors have been proposed for measuring tre
resistance to delamination under mode :" loading including the end-notchec
flexure (ENF) test and the end-loaded split laminate (ELS) test. The enc-
notched flexure test conf guratin car, be seen in Figure !a. This test
consists of a three point bend loading configuration by which a split laminate
beam specimen is de'am5 nated. The (ELS) test configuration snoWn in Figure 1D
also uses a s il't laminate beam specimen loaded at the c-acked end and .iXec
at the opposite end. Both the ENF ana ELS test methods evaluate GIlc frzm
equations derived using l]near beam theory and assume linear elastic materal
behavior [2,3. A current review of the literature 4neicates that bctn test
configurations are currently being used to measure G- c .2,3,41.
During a recent finite eleme-t analys~s (5', t"e EN- test as found to be
a pure mode :7 Fracture test within t1e ccnsta'nts of small deflection
theory. The study also revea'ec that the 4-'terlaminar normal stress is
identically ze-c along the beam center lire and the inter'aminar shear stress
exhibits the expected singu'arity. No ana'ys4s of this nature has yet been
done on the ELS test coniguraton.
As pointed out earlier, under increasing mce 11 loading, particularly
for more brittle systems, a significantly greater resistance to crack
propagation has been observed. Post-mortem observation studies in the scanning
electron microscopy indicate that this increase in fracture toughness is the
result of the development of hackles in the fractured surfaces [I2. Therefore,
the hackle formation process as well as damage zone processes ahead of the
crack tip need further study ty means of additiona' in-situ and post-mortem
delamination observations.
The objectives of this investigation have been (1) to measure the mode II
delamination fracture toughness of a ductile and a brittle graphite/epoxy
composite using the (ENF) test and the (ELS) test and compare the results, (2)

to determine tne stress fie'd in the vicnity ot the crack : o Ie (IES
specimen under moce 1: and moce T 'oadina conditions by means ,f a te
element analysis, and (3) to study the micromechanics of fracture using rea'-
time and post-mortem oservaticns of the fracture process and corre'ate te-
to the macroscoclca''y ctained energy re'ease rates 'or a bri'-'e ac c..ct"'e
comtos te.
ANALYSIS
'h E test ..- s ts c aCC a st:' 'amnate oeam specamen using a
:.ree c rot n e ' 4tre. -'c re Ia s4c.s t'e EN test conf;guration and
asszccatec test carraete-s. a' c 'at cn t e stra energy release 'ate 3T'
assu 'nc ',4 'ear beam t"eor-, all, -ea- e'ast'c mate-al benavior gives the
io''ow~rc result 5,l
9 2 a2
2 b (2L3+ 3a )
where a 4s the inltia' crack length, b is the width, C is the measured
compliance, L is ha'f-span length, and P 4s the applied load at the center
pn. The strain energy release G!! can also be obtained by means of an
experimental method "or determining the relationship between compliance and
crack length. In ths case, G:1 is given by 6
3 2 m 2b
G 02 (2)2b2
where m 4s obtained ,cm
C = ma3 + const. (3)
This expression is the result of a least squares fit of experimental data from
VI
-~e as ;rec cc'_-z a'-.es a:a'-st 4' :--e S:c' 'c 2,a e rgtnS :.e. nS
data i s 2::ta 4 ec - c - e'c :" C'es at d e'-e' -'-aC e~c-,s :r
of the tested cc-:-,ssz d t
End-'_oacec S-_t' a-a"ae { -SI -- s
The e-erc re ease r-ate -- C- _.r e - s t''s acs e "s dete'-''ec
as~r-etr~ca-j' 'cac4-c a st ;-'t- a'e _ea- sed"'-e-. 4'-e S"- t -S
t eSt C C'uC;a- o and( as S2C' 2tec teSt :a'a-ete'-S. -ear- team trecry a---
4 near elast~c rnate'-~a' end.c'0 ar-e ass_,ec, Dy te dala13s. Accm: ,e :e
exolanat~on) of th4S ara 'ys ;SC!- te 4: o,-C r rel'rence ' 3. FroM "1 , 'S
a-a 'ySsS "TCan te eX::-eSSe:-
2a2
P s t he ' oa d a-, Dec at tne c- a c <eo ed - th e Dea ',$See K.gure I). T re axia7
modulus En1 can a's:) be snoI-.v tc te
2 b_ _ 3
,h ere 41s the tcta' beam t":D deflection.
Area met-C.
in- a" the -etlocs o, data reducton previously described, the critical
energy release rate was CaIcuadted by knowledge of the Cr 'ticdl loac PC at
onset ol9 C-ack grcth, ard t'le crack 7e-gth 'a' pr-*or to crack extension.
Theefre '1 S a measure cf the energy requi red to 'i~t rc
propagat'cn. Hok.ever, as th-e Crack propagates, G, does not necessarily
re"a co-stant, n Ihc- case a propagation and arrest value of G11, can
ar4se. An alternate a"rocrcr eva'uat~ng tle fracture tougnness is the area
mnethocd. :n ns case, GTI ;s ;nterpreted as th)e energy re(quired to create a
new cracked suriace ar-ea. GTI can then be c&ve- by
5
. a (6)
J iS the area Detween the lcad-def'ecton curve for 'oading and unloading for
a very sma'' cha-ce :a of crack grcwth (see Ficure 2). An important
acvantace c '-4s -e--c 4s -,a, :!'y e'as-tc material behavior is required to
predict .Therece, fr zecmet 4ca-y non-7 -ear and/or non- inear elastic
material respo-ses, this netl c g'ves an average energy release rate for the
observed crack extens'on. ;or u-stat'e crack growth, it gives an average value
for GI c hich t, ca' "a''s te*.,eei the initiation and arrest values
measured for i 4-ea- oehav4: . --e 'oac-cisD'acement record should return to
the origin to g, a':ee tna -c s-g. 'fcant far field damage is included in U
in :du'at'n (5]. T.e "c~o' S-e e-ercy d ss~iat~on in far field damage in
the F'act,.re e~e-z :e_- _ 4, 6 ,u'o give an erroneously high estimate of
, .. or a'e-4a's .-ere 4., s -cece-cent of crack grow.th rate, and crack
gror dstace 74.e., systems -t minimal fiber bridging and/or platic
wake), the averade a-c n:-'a:;o" G , should ce identical. Furthermore, where
slow sta.o'e crack grcwth occ .'s, the average GTIc calculated from the area
method shculd eca' the ::c or '-< tation calculated from linear beam
theory. Anothe- advantaae o1 this method is that GT- is obtained without
know'edge of the matera' 's elastic properties and it is always given by
Eouation (6), rega-d'ess of the test configuration used.
EXPERIMENTAL PROCEDURE
SD' t laminate beam sQec2mens aproximate' I 2.4 .m. long, 25.4 mm.<de, and 4.?3 mm. thick for the end-nOtched (ENF) test and 292.1 m.long,
25.a mm. wide, arc 3.05 mm. thick for the end-'oaded so'it laminate (ELS) test
.ere cut From 24 ply precracked laminated panels of Hercules AS4/3502 and
"exce1 T6CIO5/F'95 grachite/epoxy composites. The starting crack was
4ntroduced on both oare's by means of a tef ,)n insert 0.127 mm. thick.
6
A!lumi num and brass tabs ere borcec to t~e crdICKec end of tne E'-S te st
specmrrens with a m'~xt.ue o E492V' struc.ra' acnes've and BI curing agent. -2n
IJN-10-A gray brittle coating was a'so appoeo to thle lateral sid es of the
specimen to fac4' tate montorng crack lccat'ors.
Fnd-Nctcned FKex_-~e -es*-'-,
PF'ye svec . e-s cr eack' q~a7,4-te/e:cvy s-istem ere tested sing a three
po'nt terc '' xture ." a t,.ta' 'erct, c-- 72.~. attached to a c 'csec o
servo-hycraul~c test -ac" -e . 3 -.ces'no tne soecimens -ere pre-
crac'<ed in order to Drov~ce a s-a-op crack t~p Prcm .r~cn to initiate -ne mocle
I' fracture. -cac -o~n: cUs,'ace~ets , ere measrec oy trne -am d~s-.Cemert
and loads . ere mc-''tc-ec o'. a : .'CaC Ce' . '2d' t.47e a-a'cQ o:t-s te
lcac-def'ect'c' ure ~ee -rac~e c" ar' x-.y rcczer. -,e tests -ere corcc-e
b -pcs4*t;cn4'c t~e s-.ec -e- 'n ',e t'e o~ e-c ~ e s.c- thttre
' ocat40o 3, -_e C-aCk 4S -saoox"aeyr4ca, et ee, t.'e center a~c ore
of the outer 'oaUc -s 2 -s. uc o-ao tccntro' cond't'o"rs and a ram
rate of 2.54 m-/-4n, the so ec4-e~s were ftadec j-t-' ce'armrat'or) crac< qtt
occurred. ' *e, te s-pec4me~s ere cc
S i ce racl, 4 e s: -ce W4so'ace'e-t ,,a s usec to measure s Pec 47,en
deflect4o-, a -a c -e co-: ' 4arce exoer4-enc was performed t o make tre
necessary delle C 4cn ccrrect~o-s to the data obta~red during the mode T
delaminatior tests.
calculations were mace using Equation (1) and measured compliancesMc
after apprcpriate -acn<-e ccm-o'ia-ce corrections had been made. It should be
noted that corrections assocated with shear comp,;ance were not taken into
cons~deration because no re iaD' e values of the shlear modulIus G12 were
available. However, these are sLua'y smal' arc t hi1s omission was not
thought to have a sign'' oant effect on the measured G11c values. The
measured compliances were obta~ned by curve fhtting tne best straight line to
the data during the loading part of the test. Equations (2) and (3) were also
used to calculate SIT 'o se these ',.o ecuat'o-s, ao' acea at
was p-er~orrred ,, o ne of thIne tested scec'mens. aa
ca'cu'ated by the area metcd here ,etermi~e,, by eas0Loa' ).'
energy absorbedi 4r the creat~on of a new cracKeC s rlace dSaQ'omae
numerically by integrating tne area incer tie _ocje, ect-'on Curyes Z- ta-ec.
-n_C-1eC S:; '_aM4ate Iest'4_a
,.o soec'"e-s oc- e-Ac: -_ao't,'ox system rsn 6rt~ to ere
tested 4n a 7mcce 1ce 7' I~xt, -e attac-ec, to a c'csec: oco) servonyC rd. ' -
mach 4 e. A moce I orecrack vas inrrC',Cec to the s-,ec4me-s to slna-,)en .-e
initil crack created by the tef'on 4'-Se~t a'C to :orov4Ce ar 4'n't'aT crazcK
length to bean' 'e-g-t' a,'- -atio c:o~x't y L5, -ee stan'e crac<
growth is exoectec 7
Mcde c ce'ar 4ato t escnc: -as co ,e Ic 2 o's.:'aoeert con tro
cc d itcons at a rate- of 112. 6 mm/n i n arc 6 .35 min oac s e re recoroec tn
a 445 N 'oac ce'1 . :S-'aoe-eS .era . z-:ce.: ;so :e , a7 c 4s;' acerre-t of
the test mna Ch 4e. -- e tests were ccuctec by load~nc tne s:ecine-s j-t~l the
crack was a''o~ed to Crow aporCX4mt' 01 n o3. m At that pointth
test was stocoeo- ano tne new crack location marked and recorded. This
procedujre Was re-,eated several t'mes wi4th the same specimen unti' the crack
tiD was a-.rrox4rnate'y 12.7 to 25.4 mm from the uncracked end.
The critical energy release rate Giic Was calculated by means of
Eauat~cns (4) and (6). The axial modulus E,1 wscmuae from the load-
def'ection test data anc Eouat~on (5). The energy absorbed inr the creation of
a new cracked surface was approximated numericall). by Integrating the area
under each loop 4n the 'oaCde4:!ection curves.
FHr4te Ele-e~t Anej vs~s
The stress f~eld in the vicinity of the crack tip of a split laminate
beam specimen under mod e 11 an d 7c-oe :was determined using a finite element
analysis. This was a linear ana'yss made with a finite element algorithm

deve Io~ed oy Herr sen -he a' goari 4 s b as ed on a no n] "Ine a, ccce :;cat-ec
4t' sc-a .cmdtO .Sg S, .x arc/Cr e4ont nocec 4scoarametr'~c
elements wit -.o ,ecrees of 4,eeccm -,e -ode.
T.0 overcome the ciff4cu'ty 4m~osec O)y tre sirgularity at --e cracK t-*:, a
substant 4a'i erement o th mesh in the v~clnty of the cracN ~ arc tre
use c' tr~arc'a- s~x 7aced elements arounC t-e Cr-ack 4~ D 4t -S 4 e rcces
c s'acec tote:a'e- o- a oe :e ese cracK t'p e'emne!'t conta-r,
a *-'a't : .:e c-rn 1. - trov~rc- a stress fie~c 4r~ch acrees ~t
thie th-ecret~ca' Stress s4-cj'arity o7 '4 ear fracture mecran 41CS. These
soec~~a' Icce a'-crar~'O~ 'to and constant strain moces,
thus sat~s<"c- A'' te ecessa'y rrCt'C-S "or monotonic ccive~gerce .
-hke ce'-e-ate:, -es, -ossso cces anc 294 'eTents arc car be seer
ir 4cu-e 3. vlLe 'oac-ng -as s':te y a:>,rg a symme:r'c- Ica., at trne
crac~ed e-'c c~ t -e '-esn. TYoce 7 'oac- ,as intrCCuced oy asymmetrical"y
1ad''4c t', -e ccec ----L >ES tes:,'.
The -ate~- a' 2)-oce'-tes jsec 4, t-'s 4:4-4e element ara>,s-s .ere f rcr-
ty~~~ica'na "r~rte o ~:'cgrote/eoxy lc:c~e. L rear
bean '.te3ry as ,,e as 14-ear elast4c material behavior were assu mec 4 the
aayss. Stress cortoz., p'cts Aere ootalred from the output data and tne
stress c~stribut~oar was a otted as a 7unction of distance areac of the
crack tip.
Scanning 5'ectr?* V~crosco:y
Sp' 4t lamrnate specimens approx4,ate'y 30.5 mm. lorg, 5.1 mm. doie, ard
1.02 mm. thick of nercj'es AS-:'3'3522 a-c 30C.5 mm. l,,rc:, 5.1 mm. wide arc 1. .2 -
mm. thick of Hexcel T6C145/F315 graph it'e/e:Doxy composites were cut from S ply
arc 6 ply laminated panels oF tnese two, materials. Specimen "mens~cns -ere
determined by the space allowed by the ters ,'e stage of the scarring electrocn
m~croscooe, anc stable crack growtn :r-ter~a 6. All specimens were polished
with 0.3 alumina powder and cleared ultrasonically in a scanning electron
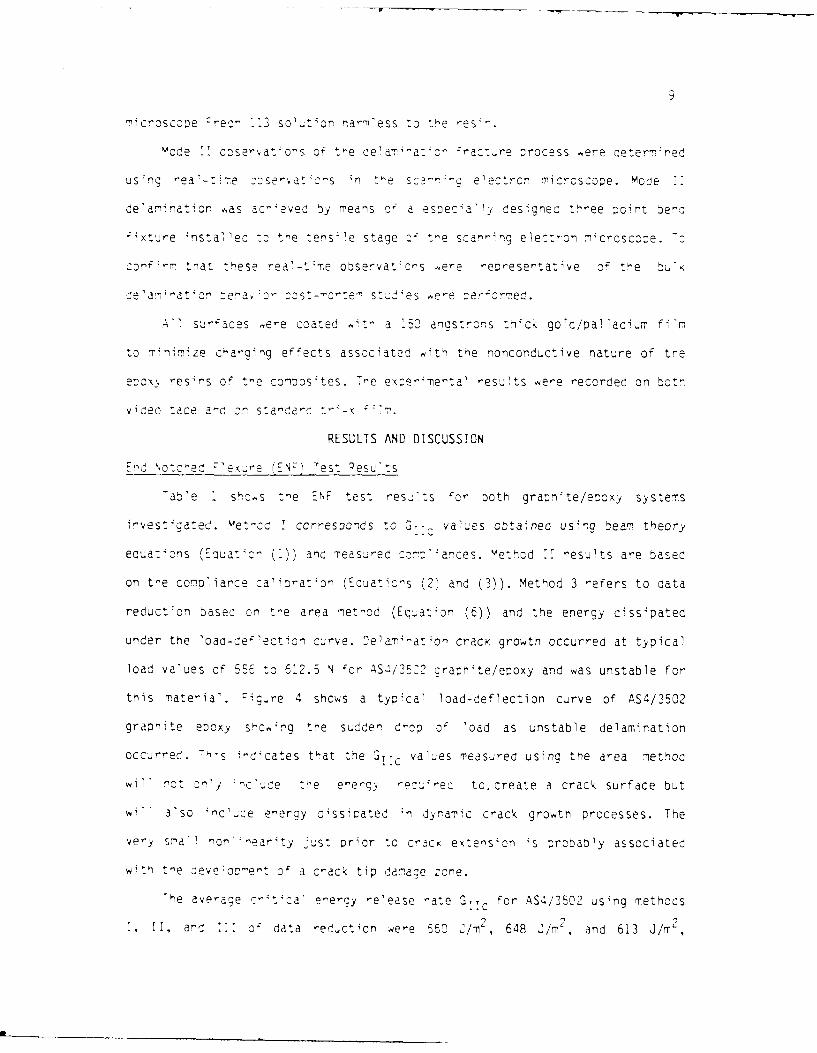
microscoce rec- !13) sol ut4on narm'ess to t-e res'".
Yooe " cnse,- at~o-s of the delam;'at_ n craot .re :orocess er-e ceterTwned
us'nc rea -t47e ::se~vat'o-s -':e el"''~ ectron rn'crcscope. moce 7
ce'arr4 nation Aas ac- eved oy means c,: a es:)ec~a' y des greo three :ooint Derc
, ;xture 4,nsta, ec to, the 'ens; e stage 2- t-e sca-,)4 - e lectron m4 croscc-e . -C
cznr r tn at t les 2 re a'-t ;me observ at 4 rs .ere recresentative _-; t he bou
4e'a_4 ,at~on Sa:o :ot,4zteS su -e ee :Der7rred.
AVsu.races were coatecd~ a 150 ancstrons th4 gUM/a 4a~ ~T
to m~ni'mze chargin~g efcects associated qith t1ne nonconductive nature of tre
eoox res~rs o7 t~e ConmOOS~teS. 7-e ex~-,fme-ta' resu'ts were recorded on botn
RESULTS AND DISCUSSION
E£"c oted ' r (E5N-1 'es' Pesufts
1 kostn EFtest resf ts ;o ohgraunite/ecoxy sy stems
invest 4gatec. vet- ,c ccrresoc-,ds tco .: va'Lues obtained using beam theory
ecua:4ons (oto ()anc mreaSrec Co_:o' 4ances. Method 11 results are basec
on tne ccru'oiarce Calibration (Ecuations (2" and (3)). Method 3 refers to cata
reduct'.on based on the area 7et,,.d (Eq uat 43n (6)) and t-he energy dissipated
under the load-deect~on curve. Delam;at~on crack growth occurred at typical
load values of 556 to 612.5 N ocr ASO1/35:2 graphite/epoxy and was unstable for
this material . Fiore 4 shows a typca' load-deflection curve of AS4/3502
grapnite epoxy slco4ng the sudden dr-op of load as unstable delamination
occurred. 7his ird~cates that the JTCvalues measured using the area methoc
Wil, not :O-y -c~e the eecy rezro to, create a crack surface but
4 also -c'uc;e energy d~ssicated 4n dyram, .c crack growth processes. The
v erYy sm~a' nor' ear~ty Just cror to cra4cK extens~cn s probably associated
4th t.-e 4evecc-~er- ol a crack tip damacge zone.
'he averace ortc'e-ergy -elease rate 'OT "or AS4/3502 usina methods
~. I. a-c c dta edjt~o wee 560 J/rn 648 /mand 613 J/m',

respect've>,. -iese values are a'' I't' s cercent c'ffererce of eacn other,
,.h'ch can o)e _co-scereo, -th ) te ex-perlmerta' error assoc'atec qotn ore
d~f~ert metroods Jl data reto:'otc- '- 'act, Y',rrI and 0B r~en have 4ncica-ec
that Sr:0 reasure-enots may vary, ' - 'etnod of data recuc-.on0 u: to. 9t w
no oons'stenlt P)att-ern -e var'a:'o 'In
Figure 5 shows a tyooia' 7 oac -cef'eoton curve oooaineo h7r "'ccc
oe'rniat'r tstc J,. Th-:-C; znree CracK Orc4tnl was stao a a
see" r tne :rCatCt cre.-owever, tn!e 00o'rt at wn, cn orac< cro2.
ocourrec is -ot - ce 'nec. -,ee-:re, ore maximum. 'oac reacnec C'geaon
test as jseO to- as: -ate te C-set :" rak t-. n"ese ad' e Aswere oetheen
1392 anc I E- 3 . -e crie a' s: -'a an ' -e'ast'c V oe"2 ' C17t
tre asscmpt'or-.s 2, t-e test -a e Dee- 'c. t 0c .oe noted ot or
cadc-ce7'eo:t on curl es atcd r~~ rC 'e-ct-s ,seC Inor t e cor:) anoe
Ca :)rat on a s s -o ,eil -cnr'e3r oea r. 7>'.eG Cr> ya es predte tyC
methocds T 2, -c ar a a" cs -caeer, the enrc~ry reease. rat
obtatred by tre area met-c-,c oies a tetraoorcxiat-Ln cP t"n e c ritijca,
energy re ease rate T: T b eCt.Se at 'atoe emtrcM non-'inear
b e ha v or 01 thIie sp: e men- iS taKen "-to consiceration by t i s meonor)c. Tre
ca'cu'ated averace s ., c / s ' c oe oors~oered an upper bouno
estimate ol: the mode 11 crti-cal energy release rate of T6C.I4S/FIS5 because
the ine'astc oelav~or is not acoo.--teo hr in this analysis. A4 2-integral
appIroacn needs to be deve'opec to Oota~n a more mean'ng4u' measure or the r-oce
11 delam~nat;cr Iact re toz-, ,-ess t"-is system.
End-Loaded So,4- t am rate (%_S Test "-esu'*ts
'The %-S test results are seen) r 'able ). Yetnoc T corresponds to GST -
ca'culated usi4ng Ecuatison (C' and .Nth E-, ca'culated from Equation (5) arci
test data. Metnoc 2 corres o-cds to the area -et"oc, (Sozation (6)). An average
E, o 125.5 SPa For tO4/35e? arc >9. a 'or T60t45/F!IQ-5 were calculated.

%-gure 6 sn)o.s a yc~c'o 'cac-ce, 'ect o- c..ve o:ota;-e: a-ter t2s-_-C ore
the AS4/3530 s:)eU'--e-s. As see" -' ns ",c-e, jrstao)e crac " crot' s
onserve,. ':or the *rS, -rack exte's':" ,es-.;te t-e ( a/'-) ratc c' at 'eas-
0.55 t-*cucec toc a' E-S s~ec'"'e-s '-h~" e mode ' recra:c.K Co-e :ror :
mcce .1 test4-c, r C, ICCord4nC to c e sta b ty cc's~cerat~o-S c tn' iS
cac'4rg a-c gceet sou,'c 'nave beer st-aD'e 7~.n's s 2)roa:Cy t-e es.'t
o 7 the acc' t'o'a' e-e-cy St'-aqe 'n tre - 'xt,"es. Nc'- inearty, esceo- - a
c4S7'aCerets -,da' aja a. I'' 'a as: c e associat-ed w 4 n tn
'm'ta t cs c re-a" :eam tn7ec-y jsec - te sta:o'>ty analysis. -1n averace
x" Te-c- d 4 -- (Tetnoc > ere 'ounc r~ 3 ,~"~
n es -: re s. s i--e -e-Ce-to- re c ea cn ot-e, . -c e~er,
s s Sd te- s -.e -evec 2 c :e t.e eesu t're " on ceg-ee c' error
-Evo S_, -s~C C~dC< ooaI-Cs ..14-) S LCa by 7oritori-1 t~e Crack as
~~~s. ~ -"c"'a: *'sscatte-r was very sna" in the EN resjts.A
~cet-~:~e or A K3 E s seen in F;Cure 7.Stao l
c a.- s oose'-vec :'a'' 'oai 'ac s. T ",s is ev-*Ie-,cec- ty tre
s-c- -:e:"eAse 4- c- -ate 7--CoeC Dv a ,ecrease 'n 'cad until tre crack
eiaS a"'-este_. . s-.c- ze -o'e c: tat t s not <knc , -hen crack qgrocwtn
st*a'-ae- *_ o2 t'4- -C s ooe s, .- -C - a S a c:O-7cO' _"ce'tanty for this mraterial
,cc, oot'" 'tj7es e cc tst*s . At'east so'e C17 t obcserved nonl1inrear
te I vt' s cu e to "astc oe -a v " si ce tr e te c j-v es 4ail1 to ret,urned to
*-H~e o-'c4" as t"e s:oec;-e, ;S "ac. No"' "ea'- De-avo'- asscc ,atec. with the
'tos: S "a bean l~eor-, e a'S- coServec or det~lctiors gr-eater
re ave'-ace "cce -eec re'ease -d' Vd' es for ,6C'45/FR135 were found
to ze 225/- 1'eo a-C' 22-6C /7- (-et.-oc 2'). 4cwever, a s~stenlatic or
mcrc tor ,C -creaSe " 'C'- -et Od 1can te ctserved tnrCL.cnOut th1e test.
t.'7 ""'r" cLurve seen i

Ficure 7. A Inocr ts rc-' near tj'y s ess severe tdn t e rcrK'nearit.
obser'ved for tv',s late ' tested u.s~rc tne Ertest, t I S suf 4 iient t,3
i nv a, ioate tre o a -a an a 'ys s cre _,s~ , ng ear beam t:reory (me tnhod T- 'e
scatter of --he -e s. s ': - -at-cc (area mret-cc) s more random and -1s
associated with -"e exioer4ne.rta, c;4,:cu'ty 4n cbta-;e a precise measure of
the crarce ;n crac< ler.-th. cever, -,ese va'.es are an overest~mation of
3~becau se teorves c' -o rt to the_ or' as dS e specimens ere
un'oac ec.
A comparison of .he reslt-s :)re C4oted j.slo both test configuratiors
4nd4cate that orc AS'l/35C-7 (a britt~e comrposi.te) si-illar results were obtairec
for tr-e E'IN an,- -_S ~ > c--rast, or T6b5~I5ptn) the EN 7 and E.3
test do -ot ,14ve id~c res-"s s~nce tre assujmoto-s assoc~atec it,) each test
-etoc ere v4ca-e c. >eecre, or cer to' plrolery cn aradc 1-e r-4ze tne
,Fractu re touognness :, t-s - at-er_4al arc toucner grap te/eo)oxy Corposites in
ce-era' , an ana",s's all~ ows Ior Mater~a' an.c ceo-etr' c nr4near-ty si-c-
as a >nera ' ee ed. at s sOo no- -t i'ar resu'ts were
co-a~rec ,or ta a-c r0 e- :a-a as a-alsec -s'-r. tne area methoc.
Hooever, toor res- 'Os sou' be cors4.e-ed -,Cer' bo.-c.s of the moce 7 T
critcal e-ergy release rate c, trne -ater4a'.
F4-'*e E'eme-o -rai s~
Figure 3 s "or s ore "-e ee resu 'ts of a spl it lamrinate be am
spec~mer tested u-Oer pur e -c-e I crdt4ors (double cantilever beam test).
174gure S a i s a stress ccotcur ol tr'"e no rma' (Sj y) stress . A perfectly
symmetric stress Cordi41tlo- 4s srocn t-rCUcrj tre beam .h~ckness indica3tina the
exp)ected mode 1lcac~rc. - e s'-ess 4S seerl to ran ;C'y rcrease as the crack
tip: is app)roached. Figure 2b shows tne Syy stress distribution ahead of the
crack tip at the mirdolane of the sp)ecimen. The Syy stress is a principal
normal stress alorg this plane and it rapidly drops off with distance from the
crak tp nti ~tisco~~prssve at a distance of 0.6 mm ahead of the crack
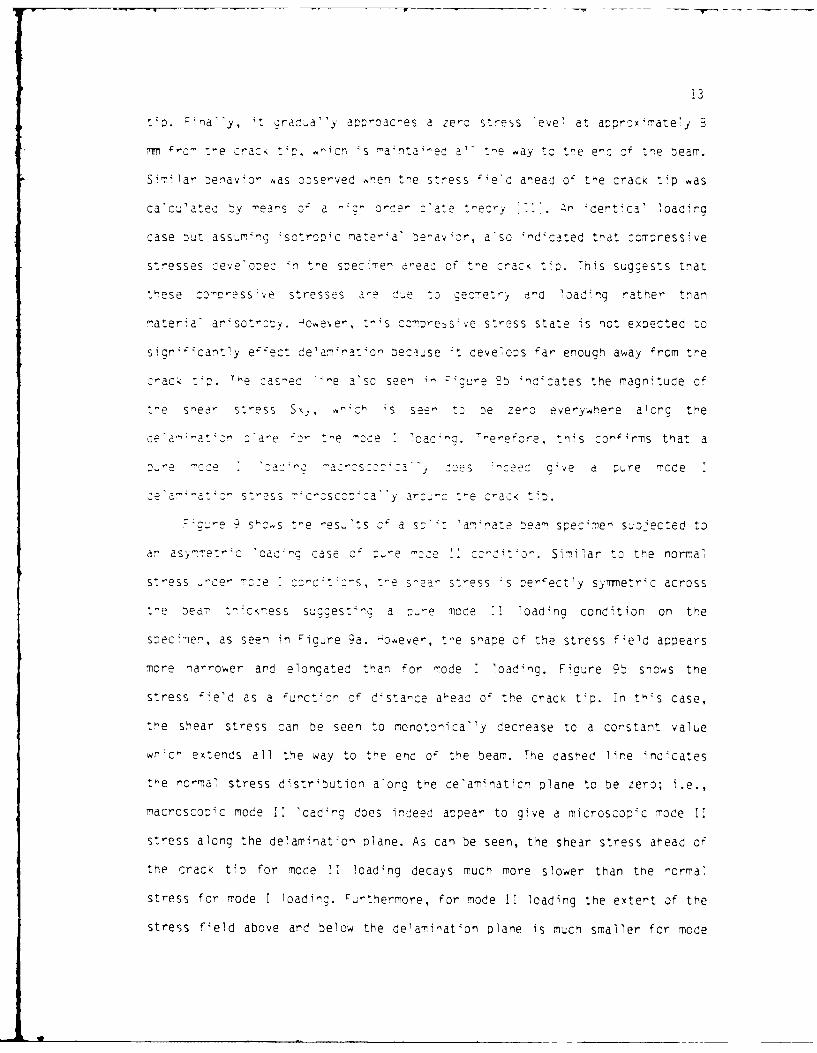
t'P. 'na''y, 't qraca' 'y approac'es a zero stress 'eve' at approx'mately S
-m O:-m : e crack t'o, .cn is -a4nta ned a'" *e ,ay to the end o t"e team.
Similar eav'or was ooserved hen t'e stress 4'e'c ahead of the cracK tip -ascalcu,'atec by -ea-s o0 a -*c" oce, :'ae t-eory . 4dent'cal loading
case Dut assum-ng 4sotrop)C natel'a' behavor, a'so indicated tr'at comaressive
stresses ieve:ec n the spec~men aea: of te crac< t~p. Tnis suggests that
these co-cress4e stresses a'e d~e to ceometry a'd lcoadng rather than
"ater'a' ansot~ooy. -o~ever, :"s co.oe s4 ve stress state is not exneced to
s In i:cantly eect de'amat4on tecause 4t ceve'oos far enough away from tne
cracK t4:o. T Ie cas-ec 'e a'so seen i- -cure 2b indicates the magnitude of
' e snear stress S, , -4c- 's see- to De zero everywhere a'ong the
ce'a4at_4o C, Da-e :2- t_ e -cce ''cac -o. -- erefore, tn's _onfirms that a
.. . ... . .. ... j 2;s ..ec c've a pure mode
de'a- 4 "a*_ 4- s--ess "-c-cscco4ca'y a'o "c 'e cac< t4p.
4 -ou'e s"cs *"e -es.'ts ' a s ' am ate team soec 4"me su.jected to
an asr-et" 4 c 'Cac c case C- :u.e -c-e . C-.' §o. Similar to the normal
stress -ce, -acze - co"U:* cs, t-e s-ea, stress 4s perfectly symmetric across
tne team thickress sugcest 4 -c a 2 re moce :: loading condition on the
saec 4ime, as seen in HIcure 9a. However, tle shape of the stress fie". appears
more narrower and elongated than for mode : loading. Figure 9b snows the
stress field as a u 4ct o of dsta-ce a-eao o7 the crack tip. In th-s case,
the shear stress can be seen to monotonica&y decrease to a constant value
which extends all the way to the end of the beam. The dashed line in 4cates
the normal stress distribution a'ong the delaminaticn plane to be zero; i.e.,
macroscopic mode 11 lcad 4 rng does indeed appear to give a microscopic mode i
stress along the delamination plane. As can be seen, the shear stress ahead of
the crack tip for mode 1 loading decays much more slower than the normal
stress for mode I loading. %jrthermore, for mode IT loading the extent of the
stress field above and below the delamination plane is much smaller for mode

14
' than for mode ~ as seer in the stress contours plots. This results are
consistent with the SEY observations of damage zone size and shape to be
reported in the next section.
Scanning Electron Microscopy Cbservatiors o Mode 1I de'am~nation
Fiaure 10 corresponds to real t nie observations under mode T
delamination of AS4/3502 graphite/ecoxy. Figure 10a shows part from the damage
zone ahead of the crack 14p which deve'oped as the specimen was being loaded
('eft side of micrograph). This damage zone is characterized by extensive
microcrac~ing and it was found to be at least 180 m long and extending about
5-m above and 5 _m below the o'ane of delamination, and resembling tre
shape of a Dugdale type damage zone, long and narrow. This elongated damage
zone is at least twice as long as the damage zone reported ahead of the crack
tip for mode T delaminat~or c" tre s4 MIar material AS4/3501-6 :12. This is
probably because for mode ., the resin rich region between plies behaves like
a soft material between rigid pVattens with all the strain being localized in
this region, and also because of the s'ower rate of decay of the stress field
under mode 1: compared to mode : revea'ed by the finite element analysis. The
hackle formation process often associated with mode II delamination of
composites made with relatively britt'e resins can also be seen in Figure 10.
First, microcracks start to form at approximately 45 deg. to the plane of the
plies (Figure lOa), perpendicular to the principal normal stress direction.
Then, macroscopic crack extension occurs as the sigmoidal shaped microcracks
begin to coa'esce, forming the hackles (Figures 10a and lOb). During this
process, some resin deformation must have accomparied the coalescence of
microcracks into hack'es as the gap between adjacent hackles results from
rotaton at the base when microcrack coalescence takes place. Note how the
i-a' hackle orientaon is steeper than the 45 deg. angle of orientation of
the 4-41a' microcracks 'rom which the hackles form. No clear indication of
crack growth directior is given by the hackle orientation on the fractured
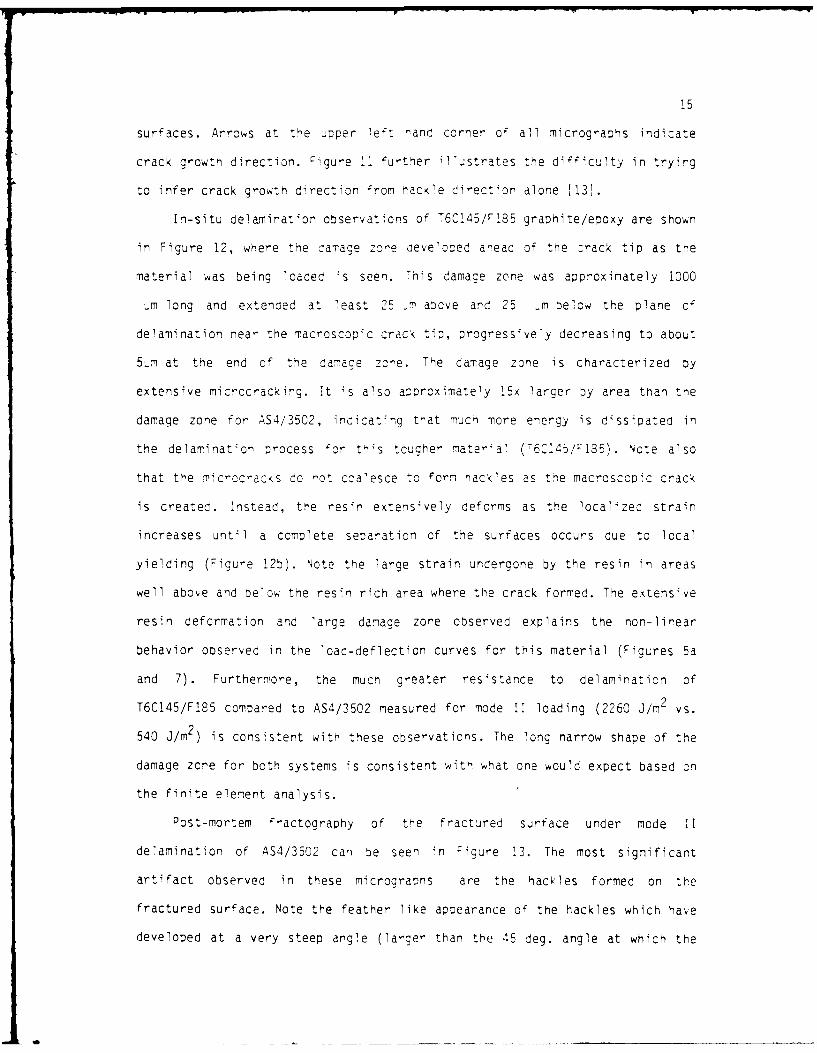
15
surfaces. Arrows at the upper left rand corner of all micrographs indicate
crack growth direction. Pigure 11 further illustrates the difficulty in trying
to infer crack growth direction from hackle direction alone [13 .
In-situ delamination observations o" T6C!45/F!85 graphite/epoxy are shown
in Figure 12, where the damace zone ceveloced anead of the -rack tip as the
material was being loaded is seen. This damage zone was approximately 1000
-m long and extended at least 25 -m above and 25 m below the plane c'
delamination near the macroscopic crack tip, progressively decreasing to about
5'm at the end of the damage zone. The damage zone is characterized Dy
extensive microcracking. Tt is also apprcximately 15x larger by area than the
damage zone for AS4/3502, indicating that mucn more energy is dissipated in
the delamination process 'or this tougher mater-a' (T6C145/F35). Note also
that the microcracKs do "ot coalesce to form hackles as the macroscopic crack
is created. Instead, the resn extensively deforms as the localized strain
increases until a complete separation of the surfaces occurs due to local
yielding (Figure 12b). Note the large strain undergone by the resin in areas
well above and below the resin rich area where the crack formed. The extensive
resin deformation and large damage zone observed explains the non-linear
behavior observed in the load-deflection curves for this material (Figures 5a
and 7). Furthermore, the much greater resistance to delamination of
T6C145/FI85 compared to AS4/3502 measured for mode I loading (2260 J/m2 vs.
540 J/m2) is consistent with these observations. The long narrow shape of the
damage zone for both systems is consistent with what one would expect based on
the finite element analysis.
Post-mortem fractography of the fractured surface under mode II
delamination of AS4/3502 can be seen in Figure 13. The most significant
artifact observed in these micrographs are the hackles formed on tre
fractured surface. Note the feather like appearance of the hackles which have
developed at a very steep angle (larger than the 45 deg. angle at which the

16
microcracks were observed to develop during the in-situ observations). See
Figure 13a. Therefore, the hackles undergo some rotation before full
separation of the fractured surfaces occurs. This is in good agreement with
the final hackle angle orientation from the in-situ observations (Figure 10)
Figures 13b and 13c show the detailed river pattern markings that develop on
the surface. No clear indication of crack growth direction is seen from the
river pactern markings on the hac 'es or the direction in which the hackles
point (Figure 1Oa). In fact, the direction the hackles and the river pattern
markings point wil' be determined by whether microcrack coalescence occurs on
the upper or lower boundary of the resin rich region between pl'es, and this
is a random process.
Post-mortem observatons o the :ract -e, srfce unoer mode T
delaminat4on of T6dc, E/rIS5 co=::s'te ca- :e seer "r r4gte 14. Note the
extensive rancom defor-atio- uncergc:e ty t-e es' , ct~rg t-at the resin
fai'ed due to yie'dio iIstead o :te or te:,:e 3 e 4eaoing to hackle
formation of the more De:4, eS'se s s-ch as AS4/3502.
Correlati n these 4ges 4t" c._e ' e . .- : 5ser'at~ons of this
materia',, t ca- :e _-e, (n-situ) do not
genera'y coa'esce to o'" 'acK'es. aa:-er, : ra lct e na1 fracture
is noted.
As it has bee, slo. a'"eady, the c,'t e- -e e'ease rate for
T6C145/F'.5 is a:"c,4-ate'y -e t a" ee- '-d- cr AS4/3502. Therefore,
it can be inferred tnat a7' hco Q te 'rmator D nc 'ac'es provides a more
tortuous path for the crack 'eacin to an increase r fractured toughness in
brittle composites, extersive resin de7ormat'on ano yie'ding p'ay a more
significant ro'e in t e acted cghess resstnce of tougher
graphite/epoxy systems. :n fact, the reported fracture tougnness of
T6CA45/F!85 under mode 1 conditions where 'ittle to no hackle formation is
observed is similar to the fracture toughness of the material under mode II

17
conditions
CONCLUSIONS
(1) Both the ENF and ELS test give similar values for the critical mode I
energy release rate G:Ic. However, since elastic material behavior is assumeo
in the analysis, the G-[c results for the ductile ccroosite are somewnat
uncertain because a small permanent defor'ation was observed.
(2) Dferent size and snaDe of damace zone observed wnen comparing moce I to
mode ': 4s ccnsistent w~tn tne d 4ee-ce *n the size and shape of the stress
field predicted by nite element ana'ys~s.
(3) The damage zone ceve oped a-eac o the crack tip at the onset of crack
growth under made 11 de'amination conditio-s is much larger by area for the
compos'te made usinc a more cuctile e.cxy (1185) than for the composite made
oth a nritte etaxy (3502).
(4) The c--at'cn of nac<7es Drov4ces a more tortuous path for the Crack
lead<ra to an increased resistance to de'am'nation under mode .1 conditions
comoared to mode cr brtt'e ccrs;tes. However, the extensive resin
deformation and yielding plays a more significant role in the fracture
toughress res~stance o tougher co-'os4es g4ving essentia'7y similar 'racture
toughness values under mode I and mode 'I cond~tions.

18
REFERENCES
1. Tse, M. K., Hibos, M. , an Brad'ey, W. L."Delamination Fracture Studiesof Some Toughened Grapnite/Epoxy Composites, Including Real Time FractureObservation in Scanning Elect-on Microscope". ASTM Symposium on TougnnedComposites, Houston, Texas, March 13-15, 1985.
2. Murri, G. B. "GTC Measurement of Toughened Matrix Composites Using theEnd-Notcned F e;ure (EN-) Test". ASTM Committee D30.02 Task Group onlnterlam nar rract.re Touahness, Da''as, Texas, 1984.
3. Vancerk'ey, P. S. "Mode :-Mode I: Delamination Fracture Toughness of aUnc~recticral Gra-.hte/Epoxy Coos4 te". Master of Science thesis, TexasA&M Jniversity, Dec. 1981
4. Russel' , A. 2. and Street, K. N. "The effect of Matrix Toughness onDelamination Static and Fatigue Fracture under Mode II Shear Loading ofGraohi:e ioer Camoosites'. Presented at the NASA/ASTM Symposium onTough'e-ec C~c- cs':es, -0_ston, Texas, March 13--1, 1985.
5. Gi] esp e, ". W., Carlsson, L.A. anc Pipes, R. B."Finite Element Analysiso7 the Enc-Nctcned P'exure Specimen for Measuring Mode 11 Fracture-cghiness'. Center for Composite Materia's, University of Delaware, Newark:e'a a-e. -o De puo'isnec in Composite Science anc Technology.
6. Ca,'ssc , _. A., G ' 'sie, J. W., and P es, R. 5. " On tle Analysis andDes~cn o, -,e Enc-Notchec -7exure (E ) Test SPecimen for Moce II Testing.Center for Ccmposite Materia's, Co'lege o, Egineering, University cfDe'aware Newark, Delaware. To be puolisnec In the Journal of CompositeMater4 a's.
7. He--iksen, M., Engineering Department, :o'craco School of Mines, GoldenColoraca, SC'I
8. Schapery, P. A., Mechanics and M ate' a's Center, Texas A&M University,College Station, Texas, 77'_. (Private communication).
9. Barsou7, R. S., Inte-at~ona' Jona for Numerical Methods inEnoinee-'qc, Vol. 10, 1976, pp.25-37.
10. Mur~i, G. B., and O'Bren, '. K. "nte,'amnar GT-' Evaluation ofToughened-Resin Matrix Composites jsing the End-Notched Flexure Test".NASA Langley Research Center Hampton, Virginia,1985.
11. Whitney, ". M. Comoostes Sc~e-ce and T echnolocy, Vol. 23, 1985 pp. 201-219.
12. Bradley, W. L., and Corleto, C. R. " The Significance of Hackles in theFailure Analysis of Grapnite/E-cxy Composite Materials'. MechanicalEngineering Division the Texas Engineering Experiment Station, TexasA&M University, College Station, Texas, 1986.
13. Hibbs, M. F., and Bradley, W. L., "Correlations Between MicromechanicalFailure Processes and the Delamination Fracture Toughness ofGraphite/Epoxy Systems". ASTM STP 948 (to be published).
14. Jordan, W. M. "The Effect of Resin Toughness on Fracture Behavior ofGraphite/Epoxy Composites", PhD Dissertation Texas A&M University, College

Stat~on, Texas, 1985.

2r0
Tadbe l.- Enc--- :eu 'exure (ENF) Test- Results.
Yater~al So ec 4.en IT
AS 1'352 5 5 4 61232 5C3 630 5 9
56:l 6E2 63
643 3
A 53 64 613
T6Cl145/F135 1I - 22402 -- 2695
3 - 243S5- 1995
Av. - - 2393
J~ Taca'. Sf -,CS Dse due to s 7c an : ronna:~coc ;~"cu'-ves. " ce uses l inear pcrticn-, o-! ci rv es to rneasu-,e
czz~~ea-c P7a :or crac< extens~cn. (5gror4-c rcnlIrear be ,avicr r-ear2max * lower~ va'ues -' 1225 m ay be ca~oul a.ed

21
Table 2.- -'nd-,cdie,. S-,' Lam''nate (----S) Resu'ts.
Mater~al Spec~me" I
613 S6
525
Av . 595 545
T -- 215 322C320 2203C2275 241E
225 2 3 63
11
2223 224C
2590C 2 172271' .3 27652S02 2323Q
AV. 2 2 75 2 262
*Nonlinearity is too gred: Z:o sat-s:y lirear Deam tneory a s sum.,ptions ip c

22
FIGURE CAPTIONS
Figure 'Mce ''test cncuratcns.
Figure .- Alternate >:ter retat-cn a47
Ficure 2.- Hnilce Element Mesh.
Figure :.- T ipical 'aad-e'ectacn curve of AS4/2502 testec usira the E.NF
test.
Zigu e 5 ' 'caa:-de' er-c- curve 3 C TrC'45/F195 tested using tne ENF
test con' gurat'an.
Rig;re 6.- >T~cal loac-cedFlectocn curve of AS4/3502 tested usina the ELS
test conlguraticn.
Fire .~ -tca 'aaaTet-cuv C125,/KSS- tested using t-,e EuS
test ca.n9 'c.ratan-.
Fi gure S.- F 4t-e e'ernert mc-e' reSU'ts
Figure 9.- S2Krte eeret maice Vi results.
Hgqure 12C.- Y')oe i-rs~tu deat~atcr o4 A24/352'2.
Figure --- TYoce A ~st ce'am~aa . IS/5I6 1'
F 4g-,re 12. - Ycde :: tn ex a'at4ato, fP T 1 5/w18
F4icure 13. klc~e A vost-rarte- cr-actcraary cC AS4/25902
Figqure 1.4.- TYcce A) cst -7omIcrte fractagra )hy a'o 6I4/%E
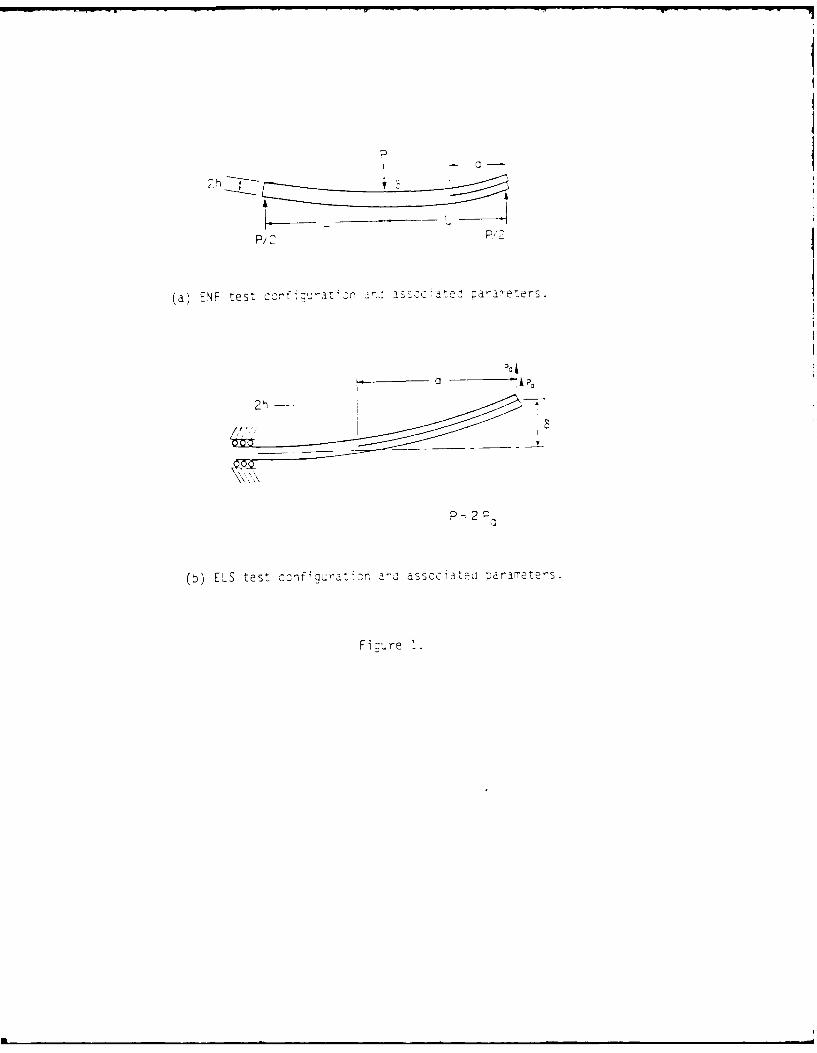
()ENF test ccrftcurattf '-nc;~e Pdr-a2etrs.
IP
22~
(b) ELS test Conf;Qura-t'Cr ~ ~ca~ aaee
F i re I.

2 54
70 48 76. 77.4
Figure 3.

AS4/3 50?
D[FLECTICN (
179:2
1424 _
712
356 T6Cl45/F 185
0. 1.52 2 .> 2 23.05 2
DEFLECTION (imn)I
Figure 5.

53.2
39.9
--26.6
13.3 A430
I 12.7 2-5.4 33.:i 52.3 63.5 75.2 8.
DEFLECTION (mmn)
Flcure 6.
222.5
178.0
4412.5 T64 4 /8
0
0 12.7 25.4 38.1 50.3 63.5 76.2 33.9
DEFLECTION (mmi)
Figure 7.
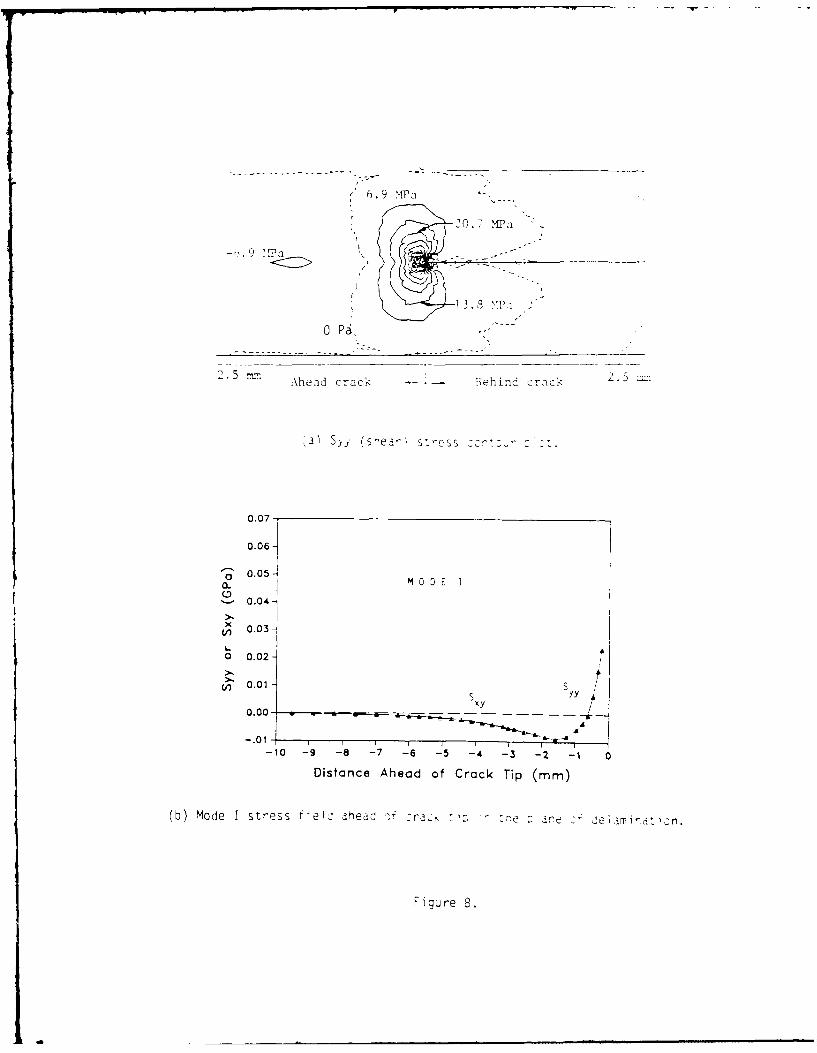
6 .9 ."fpa
99
0.07
0.06J
-~0.05~
0.04-1
V) 0.03-
Ul 0.01 S
0. 00 xy
A " A
.01!3.- -6 A
-10 - -3 1 0
Distance Ahead of Crack Tip (m.)
(b) Miode I stress fie!,, ar~edl -r Srdy , srte - r J mir
Figure.

- -- 0 Pa
: Ahead crack Behind crack2.
(3) S1 (ncr-a') s,.ress cnc~
0.07
0.06-
? 0.05-0D EQQ I I
'- 0.04 -
sxy
S
-1 9 - 7 -6 -5 -4 -3 -2 -1 0
Distance Ahead of Crock Tip (mm)
mot e 1: Stress F'id dread Drf :raCk t'P In -tre pare o: -lelamindt!Cn.
Figure 9.

V
C
w
-'I

Figure 11

Figure 12
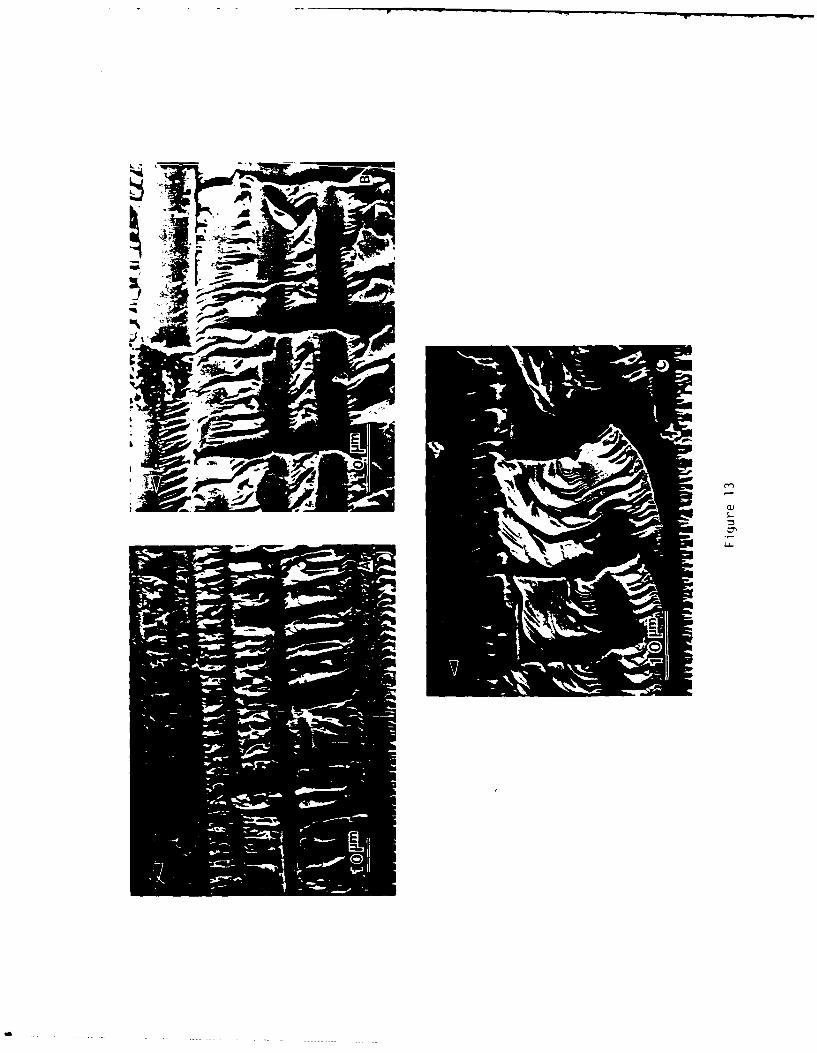
en
wS.-
U-
a
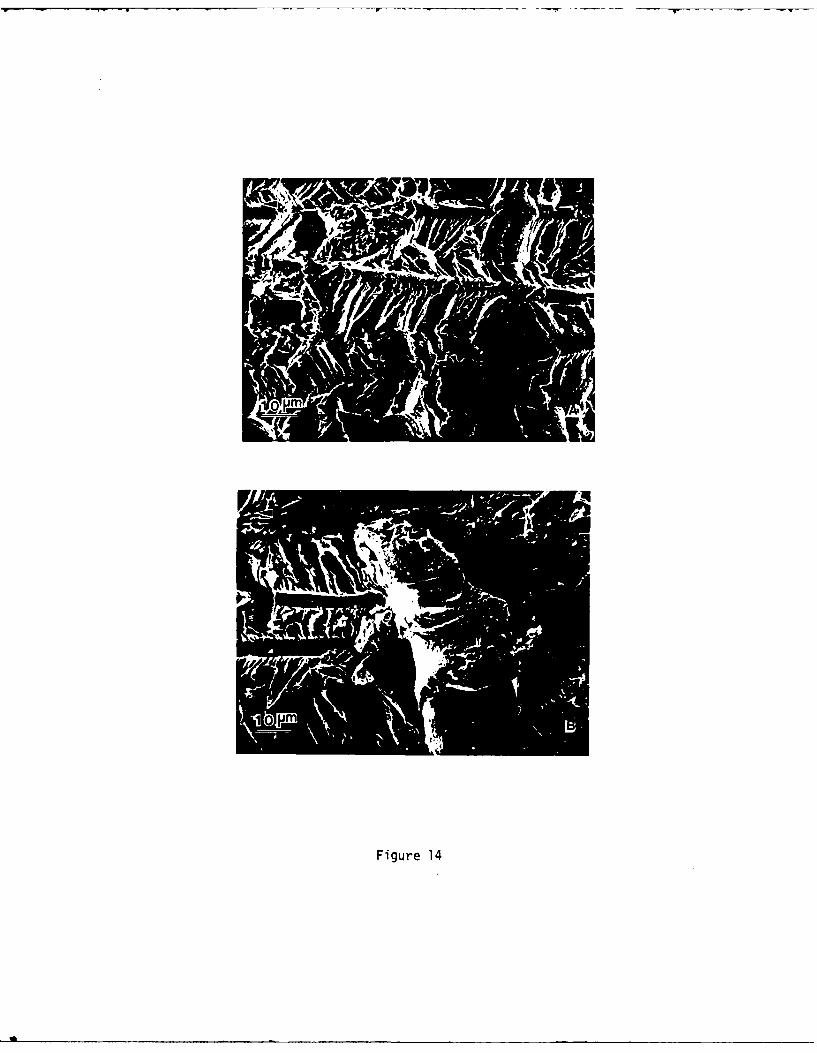
Figure 14

DAT