d d c - dticdepartment, thi« rand corporation, 1700 main streef, santa monica, california 90406....
TRANSCRIPT

SERIES A VOLUME 2
NUMBERS 1-7 |anuary-Jufy 1971 RM-6300/5-ARPA
Prepared for The Advanced Research Projects Age ncy
^J j-
D D C
Reproduced by
NATIONAL TECHNICAL INFORMATION SERVICE
B
Approv&I lor public releoe«; DfaaibuliOB üaSaaätsd
SANTA MONICA. 50406
DOCUMENT CONTROL DATA
I. ORIGINATING ACTIVITY
The Rand Corporation
2o. «EPORT SECUHITY QASSIflCATION
UNCLASSIFIED Jb. GROUP
3. REPORT TITIE
GEßSCIENCES BULLETIN SERIES A Volume 2 Nurrbers 1—7
4. AUTHORIS) (latt name, first namt. initial)
Edited by, Shishkevish, C.
5, REPORT DATE
January'- July 1971
7. CONTRACT OR GRANT NO.
DAHC15 67 C 0141
6a. TOTAt NO. Of PAGES
219
6b. NO. OF REPS
8. ORIGINATOR'S REPORT NO.
RM-6300/5-ARPA
9a. AVAHABIliTY/UMITATION NOTICES
DDC-A
9b. SPONSORING AGENCY
Advanced Research Projects Agenc
10. ABSTRACT
- A 7-inonth issue of the Rand periodical \ consisting of abstracts, annotations, transJations, news items, and analytical surveys of current Soviet and East European open scientific literature relevant to seismology and detection of underground nuclear explosions. Particular emphasis is given to Soviet research on shock waves published during the last two years. This issue includes a review of the effective- ness of seismic discriminants ^or under- ground nuclear explosions. An appendix provides a list of references used in this issue of the Bulletin. ( . ,.N
Details of Illustrations In this document may be better \ studied on microfiche
11. KEY WORUS
Rand Periodicals Geology Seismology Nuclear Explosions USSR—Science Bibliography
I . I

The Geosc'ences BulMin, Sedm A, Is a rr fng Soviet and Soviet i}ioc research on seismology and relut^i subjects, published by The RMND Corporation. Thcte desiring to ba pieced on automatic distribution for the Bulletin shou/d write to the Communicatior» Department, Thi« RAND Corporation, 1700 Main Streef, Santa Monica, California 90406.
This research Is support*! by the Advanced Research Pro{ce1sAgency, Department of Defense, under Contract No. DAHC- 15-d7-C-0141. Views or conclusions contained In this study should not be interpreted as representing the official opinion or policy of RAND or of the Department of Defense.
uttst* w
IT sssssss ttsrntmai/miuiiUTr ma
MUL m * »am.
I
I
ARPA ORDER NO. 189-1
Details of illustrations in this document may be better
studied on microfiche
GEOSCIENCES BULLETIN C. Shfchkevish, Editor
SERIES A VOLUME 2
NUMBERS 1-7
January-July 1971 RM-6300/5-ARPA
Prepared for The Advanced Research Proj'ects Agency
■fcartd SANTA MONICA, CA. 99406
THIS DOCUMENT HAS BEEN APPROVED FOR PUBLIC RELEASE AND SALE; ITS DISTRIBUTION IS UNLIMITED
■
Copyright © 1971 THt RAND CORPORATION
Rand maintains a number of special, subject bibliographies containing abstracts of Band publications in fields of wide current interest. The following bibliographies are available upon request-
Africa • Arms Control • Civil Defense • Combinatorics Communication Satellites * Communication Systems • Communist China
Computing Technology • Decisionmaking * East-West Trade Education • Foreign Aid • Health-related Research • Latin America
Linguistics • Long-range Forecasting • Maintenance Mathematical Modeling of Physiological Processes * Middle East
Policy Sciences • Pollution • Procurement and R&D Strategy Program Budgeting • SIMSCRIPT and Its Applications • Southeast Asia
Systems Analysis • Television • Urban Problems • USSR Water Resources • Weather Forecasting and Control
To obtain copies of these bibliographies, and to receive information on how to obtain copies of individual publications, write to: Communications Department, Rand, 1700 Main Street. Santa Monica, California 90406.
Published by The Rand Corporation

■
PREFACE
The Geosciences Bulletin, Series A, .Is a monthly publication* considting of abstracts, annotations, translations, book reviews and analytical surveys of Soviet and East European open-source scientific literature dealing with or related to detection of underground nuclear explosions. Subjects covered include seismology (excluding engineering seismology, seismic zoning and macroseismic effects of earthquakes), crustal and upper mantle ir/estigations, static high pressure and shock wave research, underground nuclear explosions and, occasionally, other related subjects. Only current scientific literature will be included in the Geosciences Bulletin, Series A.
The abstracts in the Bulletin are divided into sections according to subject. Within each section the abstracts are arranged alphabetically by author's last name. A full or slightly abbreviated title of the paper or monograph is listed first. The letters in brackets next to the title indicate the type of article: [C] - proceedings of a conference, meeting, or sym- posium; [E] - an experimental article; Cr] - a theoretical article; [R] - a revier/ article; IM] - a monograph; DVS] - an analysis and interpretation of selsmoTrarns from earthquakes and explosions and D3] - a survey or an analytical review paper prepared by the editor. When an article is written in a language other than Russian, that language is indicated in parenthesis 'allowing the source.
On>- volume consisting of twelve numbers of the Bulletin Is published annually. Each issue contains an alphabetical listing of references used in that issue. The references are grouped according to the tupe of publication, i.e., periodicals. Irregular publications, monographs, etc. The last issue (no. 12) of each volume will contain a subject index of references used in that volume.
Montly coverage shall begin with the November 1971 issue of the Bulletin.
-ill-

BLANK PAGE

mnMMVPfmnm
CONTENTS
Page No.
PREFACE iii
CONFERENCES 1
DETECTION OF UNDERGROUND NUCLEAR EXPLOSIONS 13
EARTHQUAKE PARAMETERS 21
INSTRUMENTATION 23
MICROSEISMS 45
PROCEEDINGS OF CONFERENCES 51
Seismic Sources and Focal Mechanism Determinations 51
Seismic Wave Parameters 52
Shock Waves 54
Surface Wave Dispersion 55
Theoretical Seismology 56
Miscellaneous 60
SEISMIC SOURCES AND FOCAL MECHANISM INVESTIGATIONS 61
SEISMIC WAVES 67
Converted Waves 67
Seismic Wave Attenuation 69
Seismic Wave Parameters 75
Surface Waves 79
SEISMICITY 81
SEISMOGRAPHIC SERVICE 85
SHOCK WAVES 87
STRUCTURE OF THE EARTH'S CRUST AND UPPER MANTLE 179
THEORETICAL SEISMOLOGY 185
UNDERGROUND NUCLEAR EXPLOSIONS 193
NEWSPAPER AND FBIS ITEMS 203
DEGREES 207
APPENDIX 1 (List of References Used in This Issue of the 209 Geosciences Bulletin, Series A)
-v-

■ ■ ■• ■■• -
CONFERENCES
A SUMMARY OF THE SECOND ALL UNION CONFERENCE ON EXPLOSION SEISMOLOGY* [C]
Belyavevskiy, N.A.and I.S. Vol'vovskiy, IN: Sovetskaya geologiya, no. 2, 1971, 165-172
The Second All Union Conference on Explosion Seismology (Deep Seismic Sounding - DSS) was held in Alma-Ata during 27 November - 2 December 1969. Seminars on methods and results of joint Interpretation of various geophysical data were held at the same time. The 234 specialists xrom 52 scientific and industrial organizations participating in the conference presented 60 lectures dealing with the results of investigations by means of explosion seismology including seismic profiling using Zemlya systems, and the most important theoretical and experi nental problems of deep seismic sounding. Since the la^t such meeting held in 1960, the volume of deep seismic sounding conducted in the USSR and the adjoining seas increased more than three times. More than 200 seismic sections with a total length of more than 60,000 km have been constructed. The most detailed DSS Investigations were performed in the Ukraine,, Soviet Central Asia, and Central and Southern Kazakhstan. Aereal crustal investigations by means of seismic systems equipped with magnetic recorders were conducted In many regions (Ural mountains, Ukraine, Kola Peninsula). Low-channel, portable systems such as "Zemlya," "Tayga," "ASS," and others are gaining wide acceptance.
The most important developments in methods of seismic investigations is the wide use of reflected, converted, and, in a few cases, shear waves. Quarry and other large explosions are being frequently utilized in solving regional problems. Simplified field systems are being used in inaccessible regions of Siberia and the Soviet Far East. In many regions the principle aim of detailed investigations is the study of steeply sloping interfaces to a depth of 15-20 km. More realistic models of the earth's crust are also used during interpretation. Methods have been developed for the solution of direct kinematic and dynamic problems for a wide class of models. Techniques necessary for the solution of ir verse problems are also being developed.
In opening the conference, V.V. Fedynski/ (Ministry of Geology of the USSR) emphasized the fact that the deep seismic sounding made it possible to determine the volume of the crust bound from below by the Mohorovicic discontinuity, to investigate the principle crustal interfaces in many regions, and to identify continental, oceanic, and transitional types of crust. Also, it became possible to classify deep-seated faults dissecting the crust into blocks, to reveal lateral differentiation of material in the uoper mantle, to outline the layered block structure of the crust, to determine certain important
* Slightly abbreviated translation.
-1-

connections between deep crvstal structure and the upper mantle, and to establish regularities in location of mineral resources.
In discussing future developments, Fedynskiy noted the desirability of combining DSS with other geophysical methods in order to investigate the deep structure of continents and oceans (including the structure along test sites having the most typical structures), and also the physical parameters of the crust which can not be determined by drilling, etc. He paid particular attention to problems encountered in developing optimal field methods and interpretation techniques, methods of investigating non-horizontal crustal interfaces, utilization of all types of geophysical interpretation methods for crustal studies, and the development of techniques of using secular variation of the natural terrestial fields associated with geotectonic processes.
Subsequent lectures dealt with the results of DSS investigation of the deep structure of the earth, joint interpretation of DSS with other geophysical data, and field observation methods.
Investigations of the Crust and Upper Mantle
A review of the results of crustal and upper mantle investigations perforrrod during the last 20 years was presented by N.A. Belyayevskiyand I.S. Vol'vovskiy (All Union Scientific Research Institute of Geophysical Prospecting Methods). In the last few years DSS has been used to investigate in considerable detail the crustal structure of geologically different regions (shields, platforms, mountains, land and marginal seas, and the Pacific Ocean Basin). These Investigations have widened considerably our understanding of the composition and structure of the earth's crust and upper mantle. Almost everywhere the earth's crust and upper mantle have been differentiated in respect to seismic velocity. Crustal blocks of different form and different dimensions have been identified and the presence of a gradient structure in the crust with a gradual increase of velocity with depth has been established. It was noted that sufficiently sharp velocity discontinuities, up to 0.4-0.5 and even 1 km/sec for a velocity ratio of more then 0.8-0.9, occur only at two interfaces - base- ment surface £üd the Mohorovicic discontinuity. A gradual increase of velocity with depth ah J occurs in the upper part of the mantle, where the velocity is iconsiderably .arger (8.9.5 km/sec) than it is in the crust below the basement (6-7.5 km/sec). Interfaces where the velocity changes more sharply (by as much as 0.2 km/sec or more) are also observed both in the crust and the upper mantle. The lecturers have shown the vertical distribution of interface velocities and their lateral variation along the principle crustal and upper mantle interfaces in the USSR and in large geostructural zones; variation of the layer and mean velocities within individual layers and the earth's crust as a whole; and maps of mean velocities of seismic waves in the earth's crust and interface velocities along the Mohorovicic discontinuity in the USSR and adjoining countries.
Joint utilization of DSS and other geophysical and geological data and the results of extrapolation made it possible to construct relief maps of the Mohorovicic discontinuity for individual regions and for the USSR as a whole, to construct maps and seismic sections showing the principle characteristics of the deep structure, to outline the overall layering of the earth's crust, and to
-2-

; ■ ■
prepare crustal models for a number of Jnrge geological structures. Analysis of the above noted data made it possible to describe the deep
structure of the territory of the USSR, to discuss the nature of deep seismic interfaces, and to establish certain regularities in the relationship between the deep crustal structure and geological structures identified in its upper part. In particular, it was noted that the average thickness of the crust in the USSR is 39 + 2 km. This is in good agreement with the average crustal thickness in North America, but exceeds considerably the average thickness of the con- tinental crust (33 km) determined by Jeffreys,Bullen, and others which, according to the lecturers are too low. The Alpine and Cenozoic folded regions are characterized by a considerable variation of crustal thickness even over short distances (a few dozen km). The thickness of the earth's crust within ancient continental platforms also varies. In these regions a connection was established between crustal thickness on one hand and the type and age of geological structures on the other. Stratification is characteristic not only of the earth's crust but also of the upper mantle down to a depth of at least 100-120 km on land and 30-35 km at sea. Although the Conrad discontinuity could not be reliably identified throughout the whole territory of the USSR, the existence of granitic and basaltic layers can hardly be questioned. At the present time, data are beginning to accumulate on differences in the nature of the Mohorovicic discontinuity, which in some regions is probably caused by phase transformations and in others by sharp changes in the chemical composition of the earth's crust and the upper mantle.
The motion of material deep within the earth was considered by Ye. V. Artyushkov and M. Ye. Artem'yev (Institute of Physics of the Earth). The lecturers criticized the concept of thermal convection being the principle cause of this motion. The authors believe that the Increase in the earth's core occurs at the expense of material in the lower mantle as a result of gravitational differentiation. The development of the lower mantle occurs at the same time as the formation of the upper mantle. The uprise of the lower mantle material Into the upper parts of the earth is accompanied by release of large amounts of energy, phase transformations, and partial melting. As a result of this, large lateral InhomogeneIties are formed in the mantle - different types of motion which are the primary cause of formation of very large tectonic structures take place.
New data on the structure of the upper Dnieper-Donets aulacogene were presented in a lecture delivered by I.A. Garkalenko (Ministry of Geology of the Ukraine), M.V. Chlrvlnskaya (Ukrainian Geophysical Trust), and others. These data verify that within this structure the thickness of the earth's crust (35-40 km) Is 10-12 km less than within the Ukrainian shield. The decrease in thickness of the crust occurs at the expense of the basaltic layer. However, in the Donbass region, the thickness of the sedimentary deposits increase to 17-20 km and crustal thickness increases to 42-48 km.
According to S.V. Potap'yev and I.K. Tuyezov (Sakhalin Complex Scientific Research Institute) use of aerial bombing instead of explosive charges made it possible to investigate the structure of the earth's crust of Slkhote-Alin (between lake Khanka and the coastal area of the Sea of Japan, in the region of
-
-3-

of Tetyukhe) in a short period of time. It was established that the depth to the Mohorovicic discontinuity in this region is between 36-38 km. Five crustal interfaces with interface velocities of 4.5-4.8, 5.6-6.3, 6.4-6.6, 6.7-7.7, and 8 km/sec were identified. The same technique was used in Yakutia, along the Zhatay-Arylakh sector. It was established that the crystalline basement is found at a depth of 2-10 km; Conrad discontinuity, at a depth of 20-25 km; and the Mohorovicic discontinuity at a depth of 35-40 km.
The data on the deep structure of Mugodzhar acquired by A.A. Abdulin, A.N. Antonenko, and T.K. Dubrovin (Institute of Geological Sciences of AN Kazakh SSR) indicate that the velocity distribution in this region is close to that of the Urals. The crustal thickness in this area varies between 58 km within the Tagil'-Magnitorgorsk synclinorium and 47 km in Tyumen-Kustanay Basin.
DSS investigations along the Temir Tau-Kuybyshev profile (B.A. Khrychev and others, Kazakh Geophysical Trust) have shown that the crustal blocks identified in these investigations differ in respect to their velocity parameters. The width of the transition zones between blocks is approximate!" 50 km.
The results of crustal investigations throughout Kazakhstan were described in a review paper presented by M.D. Morozov, G.P. Bekzhanov, N. Ya. Kunin, and others (Kazakh Geophysical Trust, Institute of Geological Sciences of the Academy of Kazakh SSR). It was shown that in most cases the separation between the granitic and the basaltic layer in Kazakhstan is not very clear. Many of the larger tectonic structures are clearly reflected in the relief of the Mohorovicic discontinuity. Typical of Kazakhstan is a small increase in the interface velocity of seismic waves along the Mohorovicic discontinuity.
Investigations performed by A.N. Antonenko and A.A. Popov in Central Kazakhstan (Kzyl Orda-Dzhezkazgan profile) (Institute of the Geological Sciences of the Academy of Sciences of KazakhSSR) have shown the presence of stable crustal and upper mantle interfaces which can be traced over a distance of 100 or more kilometers. The most extensive interfaces are found at a depth of 5-10 km and at the bottom of the crust. The thickness of the earth's crust dissected by deep-seated faults varies between 43 and 48 km.
Seismic investigation of the crust within the Tadzhik Basin (L.N. Fikhiyeva, Geology Branch of TadzhikSSR) has shown that the Paleozoic basement lies at a depth of 8-10 km and that the depth to the Mohorovicic discontinuity is 44- 45 km. The structure of the earth's crust in the basin is analogous to the crust of intermontane basins in Central Asia.
According to data obtained by S.V. Krylov, B.P. Mishen'kin, and others (Institute of Geology and Geophysics, Sakhalin Branch of ANUSSR), the thickness of the earth's crust within the Baykal rift zone is 36-39 km. The interface velocity along the Mohorovicic discontinuity (7.76 km/sec) is considerably lower than the same velocity in the neighboring regions of the Siberian plateau (8.1 km/sec). The Baykal rift zone and the Siberian platform are separated by a subcrustal fault.
Investigation of crustal seismic interfaces within Soviet Carpathia (V.B. Sollogub, A.V. Chekunov, and others. Institute of Geophysics of the Academy of Sciences UkrSSR) has shown that the Mohorovicic discontinuity is characterized
-4-

■
by an asymmetric root, the deepest part of which (55-60 km) lies not under Carpathian Mountains, but under the cis-Carpathian foredeep and the outer parts of the folded structure. The largest faults in this area are found along the southwestern boundary of the East European plateau and between Carpathia and the cis-Carpathian foredeep. Considerable differences were observed between the upper parts of different crustal seismic sections in this region. However, these differences decrease with depth and disappear almost completely.
M.M. Radzhabov (Azerbaydzhan Branch of the All Union Scientific Research Inst'cute of Geophysical Prospecting Methods) and R.R. Riger (Amorneftegeofizika) de jcribed the results of analysis of seismic data which have shown that the deep-lying interfaces within the southeastern submergence of the Grater Caucasus and the adjoining part of the Kura basin are transition layers characterized by a velocity gradient and most likely consist of a series of thin, wedging-out layers. The Mohorovicic discontinuity is a several km thick transition zone. The thickness of the earth's crust in this region varies between 30 km in the region of the epi-Hercinian platform (at sea) and 52 km in the region of Cenosoic folded structures (on land).
Deep seismic sounding performed in the Arctic Ocean (P.M. Eomenitskaya and U.G. Kiselev, Scientific Research Institute of Arctic Geology) have shown differences in gological structure of the Gakkel and Lomonosov ridges. The thickness of the crust under the Gakkel ridge varies between 3.5 and 15 km and the interface velocity along the Mohorovicic discontinuity is equal to 8.1-8.2 km/sec. Under the Lomonosov ridge, the crustal thickness is 18 km and the interface velocities in the upper part of the crust are 1.8-2.3, 3.5-4.7, and 5.7-6.2 km/sec. The seismic layers are separated by angular unconformities. Such layers were not observed under the Gakkel ridge. The unconsolldated material with velocity between 1.6 and 2.0 km/sec overlies directly the basaltic layer with velocity between 6.3 and 6.7 km/sec. According to the authors, the Gakkel ridge is a typical midoceanlc ridge, while the Lomonosov ridge is an epiplatform orogen formed along an area of what was previously part of the continental crust.
The results of first deep seismic sounding investigations of the earth's crust in Antarctica were described by A.B. Kogan (Scientific Research Geology Institute of the Arctic). It was established that the thickness of the earth's crust in this area is 40 km and that its structure Is typical of that found in continental areas.
According to the data provided by S.M. Zverev (Institute of Physics of the Earth) and Yu. P. Neprochnova (Institute of Oceanography of the Academy of Sciences USSR) numerous DSS investigations performed at sea made it possible to determine the structure of the earth's crust at more than 1200 stations, along 30,000 km of profiles. DSS investigations carried out in the Pacific Ocean have indicated differences in the wave fields, complex variation of Interface velocities in the crust and along the Mohorovicic discontinuity, and block structure of the crust and upper mantle.
The most recent data on the structure of the earth's crust and the upper mantle acquired in the transition zone between the continent and the north-
-5-
'■■■■■■■■

.
western part of the Pacific Ocean (S.M. Zverev and Yu. V. Tulina, Institute of Physics of the Earth) revealed the presence of block structure. The areas between different structures are characterized by narrow transition zones, where the thickness of the crust changes rapidly (between 10 and 20 km).
A comparison of the crustal structure under the Caspian, Black, and Mediterranean Seas (Ya. P. Malovitskiy, A.P. Milashin, and others. All Union Scientific Research Institute of Marine Geology and Geophysics, Institute of Oceanography of the Academy of Sciences USSR) shows that the crustal structure of the shelf areas is similar to the adjacent land areas. However, the narrow continental slope areas have transition crust. The central, usually the deep-v/ater parts, are characterized by a specific type of crust with a thickness of sediments between 10 and 15 km, and a very thin granitic layer (V = 5.8-6.5 km/sec) which sometimes is completely absent.
I.K. Tuyezov, A.A. Popov, and others (Sakhalin Complex Scientific Research Institute) noted that the thickness of the arth's crust in Sikhote Alin (34-36 km) decreases to a thickness of 10-15 km in the direction of the Sea of Japan and that the thickness of the sedimentary layer decreases from 2.5 to 0.5-2 km. The granitic layer wedges out under the deep part of the Sea of japan.
Field Methods
As was already noted by N.N. Puzyrev (Institute of Geology and Geophysics, Sakhalin Branch of the Academy of Sciences USSR) and I.P. Kosminskaya (Institute of Physics of '-ht Earth), further development of DSS requires an increase in information co» tent that can be provided by this method, necessitating an improvement in instrumentation, an increase in the frequency range used, an increase in the signal-';o-noise ratio, development of computer interpretation methods, standardization of computer programs for construction of seismic sections and velocity distiibutions taking into account spatial variations of crust and upper mantle parameters, etc. Part of the lecture also dealt with the effectiveners of field schemes used for solutions of different problems. The authors are in favor of maintaining a rigid sequence of field operations in new regions, with the less detailed investigations to be gradually followed by more detailed observations, and in favor of combining different observational schemes, so that the data acquired would provide a solution of a definite, previously unsolved problem.
A considerable amount of work on aereal seismic i; vestigations was performed in the Central Ural region, using quany blasts as sources of energy. Seismic data were acquired on the spatial characteristics of deep seismic interfaces, including those having considerable slopes (up to 30-50°).
Methods of conducting reconnaissance, aereal, and inline DSS investigations by means of point seismic sounding were described in a lecture by N.N. Puzryev, S.V. Krylov, and others (Institute of Geology and Geophysics of the Sakhalin Branch of the Academy of Sciences USSR), They also analyzed the results of investigations conducted in inaccessible regions of Western Siberia using techniques developed by the authors.
-6-

milWülilW' n.if&gHHWfai'
Theory of Seismic Waves and Interpretation of DSS Data. G.I. Petrashen' and P. Ya. Gel'chinskiy (Leningrad Branch of the Mathematics Institute) con- sidered the future development of seismic wave theory as an instrument of solving practical problems - description of fields for very complex (and dis- continuous along a profile) deterministic models of media and relatively simplr media using stochastic models and development of methods of solving inverse problems in seismic prospecting.
A.S. Alekseyev (Computer Center of the Sakhalin Branch of AN USSR) presented a review of new methods for the solution of inverse kinematic (linearized) problems for a two-dimenstional medium based on the extraction of a weak, anomalous, two-dimensional felocity field from the background of the principle linear variation of velocity. The author has obtained a number of new theoretical data pertaining to the solution of inverse dynamic problems related to multi-dimensional media.
The lecture presented by I.S. Berzon (Institute of Physics of the Earth) dealt primarily with the necessity of taking into account the structure of the upper, thinly layered part of the seismic section during interpretation of DSS data. Using examples of experimental investigations and theoretical computa- tions, she has shown that the upper, thinly layered medium can considerably change even the principal characteristics of deeply penetrating waves.
On the basis of analysis of different properties of observed seismic fields and the given theoretical investigations pertaining to solutions of direct and inverse seismic problems, I.P. Kosminskaya (Institute of Physics of the Earth) and N,I. Pavlenkova (Institute of Geophysics of the Academy of Sciences Ukrainian SSR) formulated the concept of generalized velocity models for continents and oceans. These models include velocities in homogeneous layers alternating with heterogeneous (Including low velocity) layers. Using statistical data on velocities, they determined the velocity range which includes all possible velocity distributions for continental and oceanic crusts.
The velocity ranges are as follows: 1. continental crust below the basement - 6+0.5 km/sec (0<h<20 km), 7+0.5 km/sec (20<h<hM,wherehM is the depth to the Mohorovicic discontinuity), and 8+0.3 km/sec (h>h ); 2 - oceanic crust below the basement (excluding the water layer and the sediments - 6.7 + 0.3 km/sec (0<h<hM) and 8.2 + 0.3 km/sec (h>hM). A theoretical analysis of practical applications of DSS was described in a lecture presented by A.V. Nikolayev (Institute of Physics of the Earth). The displacement field of elastic waves is separated into a deterministic and a random (scattering by random inhomogeneities) components. Analysis of the random component of the displacement fields of body waves - refracted and reflected - makes it possible to separate the effect of random factors disrupting spatial correlation of waves; "turbidity" (random inhomogeneity) of the medium, surface conditions, conditions of installation of instruments, and differences in recording channels.
T.I. Oblogina and V.B. Piyp, and others (Moscow State University) dis- cussed the results of interpretations of DSS data acquired in the region of the Karatau Ridge using the concept of a two-dimensional homogeneous model of the medium. They have established the dependences V = V(x,h) at horizontal levels at different depths below the earth's surface (h. = 10, 20, 30, and 40 km)
-7-
\
'

and also the dependence V = {r^^) et different points x = d. of the profile. According to the authors, the velocity gradient in different regions of the crustal section varies between 0.344-0.0514 sec"1.
An evaluation of a kinematic correspondence of models constructed with the observed wave field along several DSS profiles was described in a lecture presented by A.S. Alekseyev (Computer Center of the Sakhalin Branch of the Academy of Sciences USSR). The observed deviations for multilayered models of the earth's crust consisting of thick layers have a systematic character: the onset time of seismic waves gradually increases with increasing distance from the shot point, while the apparent velocities gradually become smaller than theoretical values. Consequently, the multilayered models of the crust are characterized by higher velocities than actually exist in the crust.
Theoretical analysis of reflected deep waves formed in the multilayered crust by superposition of millions of simultaneously arriving multiple reflections was given by Ye. K. Lossovskiy (Institute of Geophysics of the Academy of Sciences UkrainianSSR). Computations have shown that, on the average, the amplitudes of the multiply reflected waves are independent of the amount of layering in the many km thick crust and do not exceed the amplitudes of simultaneously arriving, singly reflected waves.
DSS data was used by M.M. Radzhabov(Azerbaydzhan Branch Vnllgeofizika) in deriving a formula for calculating ray velocities from effective velocities. The ray velocities obtained were used in constructing velocity models for the crystalline part of the earth's crust in the Caucasus. The authors also demonstrated the possibility of determining the nature of first arrivals from a plot of the variation of the first derivative of a difference travel-time curve with distance.
I.S. Berzon and P.S. Veytsman (Institute of Physics of the Earth) compared wave fields formed by thin and thick layered models. The greatest differences were observed in the case of subcritical reflections. It was established that the velocity gradient in the crust has a considerable effect on the distance at which waves reflected from the Mohorovicic discontinuity can be recorded and on the dynamic ratios of reflected with refracted waves.
Analysis of experimental and theoretical data performed by N.I. Davydova and G.G. Mikhota (Institute of Physics of the Earth) has shown that the amplitudes and frequencies of waves reflected from the Mohorovicic discontinuity are in qualitative agreement with theoretical values computed for a first order discontinuity. Qualitative differences observed between certain theoretical and experimental results make it necessary to consider other models of the transition region between the crust and the mantle.
N.N. Matveyeva (Linengrad Branch of the Mathematical Institute of the Academy of Sciences USSR), V.Z. Ryaboy, and M.I. Razinkova (VNIIgeofizika) have shown the possibility of investigating the upper mantle down to a depth of 80-100 km using 400-600 km long travel-time curves. In this depth range, velocities of longitudinal seismic waves vary between 7.8-8.0 and 9.0-9.5 km/sec. Ten or more km thick, low-velocity layers may be present in certain regions.
-8-

....
A series of lectures dealt with different aspects of computer analysis and Interpretation of DSS data. V.P. Valyus, I,N. Galkin, and A.L. Levshln (Institute of Physics of the Earth) described one of the first attempts for a computer solution of the inverse DSS problems. The velocity model for the crust was determined from the experimental travel-time curves and amplitude- distance curves of first arrivals. Of the 9C0 velocity models for regions with continental crusts for the transition zone between Asia and the Pacific Ocean considered, 30-50 models are characterized by seismic wave character- istics which differ from the initial data by not more than the experimental error. Compared to the usual kinematic interpretation, computer interpretation of the experimental data made it possible to obtain a wider class of solutions and to determine all parameters. The interpretation errors, which have to be taken into account for geological interpretation of DSS data, were evaluated. For example, a 0.2 sec error in constructing travel-time curves using DSS data acquired at sea and 0.2 unit error in constructing amplitude-distance curves from the same data lead to an error of 1-4 km in determining the depth to the Mohorovicic discontinuity and an error of 0.2-0.4 km/sec in determin- ing crustal velocities. It was concluded that observational techniques and interpretation methods using first onsets make it impossible to either verify or reject the existence of weak velocity inversions (with a gradient less than 0.015 km/sec).
The lecture delivered by I.K. Pushkarev, V.l. Shatsilov, and others (Kasakh Geophysical Trust) was devoted to all stages of computer processing of DSS data using at. an example DSS data acquired along the Kaskelenskiy profile in Kazakhstan. A few lectures dealt with utilization cf computers in seismic prospecting.
Toint Utilization of Methods of Explosion and Earthquake Seismology. Several special lectures dealt with coordination of methods oi explosion and earthquake seismology. A.N. Antonenko (Institute of Geological Sciences of the Kazakh Academy of Sciences USSR), N.K. Bulin (VSEGEI), B. Ye. Shcherbakova (VNIlgeofizika), and others reviewed and analyzed the state of the art and the possibilities of future developments of earthquake generated converted waves. Although this method has beon used in the USSR since 1956, it reached its widest development in 1964 in connection with the deployment of magnetic tape recording "Zemlya" systems. At the end of 1969, the total length of seismic profiles in the USSR determined by means of converted waves was about 10,000 km (the data were acquired at approximately 1200 observation sites). Converted waves from near and distant earthquakes and, in certain regions, converted waves from quarry blasts are used to construct seismic sections. The authors also considered certain aspects of the physical foundations of the method of converted waves, its applicability, identification of converted waves, stabil:ty of their recordinq, and correlation.
I.V. Pomerantseva and A.N. Mozzhenko (VNIlgeofizika) analysed the results of investigations of the earth's crust by means of the "Zemlya" systems performed during an almost 10-year period which elapsed since their deployment, They considered the field method for recording waves. The criteria of separat-
-9-

ing PS converted waves into reflected and multiply reflected waves and extraction of lateral PS waves were also discussed.
In a lecture by S.N, Al't^r, A.P. Ivanov, and others (Kazakh Geophysical Trusts it was shown that only the upper, seismicly sharpest interface, basement surface, ccn be reliably traced using converted PS and sometimes SP waves. Deeper crustal interfaces, including the Mohorovicic discontinuity can not be traced reliably using converted waves. The following optimal techniques for joint utilization of DSS and seismic investigations by means of the "Zemlya" systems were suggested: aereal observations using "Zemlya" systems in an area previously covered by DSS. This would make it possible to correlate interfaces identified from converted waves with the usual seismic interfaces and to investigate the velocity distribution.
Experience gained in using "Zemlya" systems in Uzbekistan was described by V.A. Pak (Institute of Geology and Geophysics, Academy of Sciences of Uzüek SSR),A.R. Mitrofanova (Uzbek Geophysical 'i-ust), and others.
A resolution adopted at the conference outlines the following principal aims of future seismic investigations of the earth's crust and the upper mantle: crustal and upper mantle investigations along prescribed reference profiles for solution of basic geological problems; seismic aereal reconnais- sance investigations; detailed investigation of the most important geological zones and regions in the areas of proposed superdeep drilling. It was pointed out thai It is necessary to increase the depth of investigations (in order to determine tn« structure of the upper mantle) and emphasize the applied aspects of deep seismic investigations. This should be achieved first of all by thorough analysis of interconnection between elements of deep crustal structures determined by explosion seismology and structure determined by geological methods. For this purpose, It is especially important to conduct deep seismic investigations jointly with other geophysical methods and to use joint geological-geophysical interpretation of the acquired data.
-10-

\ \
SECOND MEETING ON THE CRUSTAL AND UPPER MANTLE STRUCTURE IN THE EUROPEAN SOCIALIST COUNTRIES DETERMINED FROM SEISMIC SURFACE WAVE DISPERSION* [C]
Pavlova, L.N. IN: AN SSSR. Vestnlk, no. 10, 1970, 117-119
A conference dealing with the structure of the earth's crust and upper mantle in Eastern Europe determined from Love and Rayleigh wave dispersion was held in Moscow during 1-5 June, 1970. The meeting, organized by the Committee for Planetary Geophysical Research of the Academies of Sciences of Socialist Countries (KAPG symposium), was attended by Soviet, Hungarian, East German, Polish, and Rumanian geophysicists. In addition to the principal subject under consideration, lectures were presented on instruments, instrumental observations (especially those dealing with long-period seismic waves), and methods and techniques of processing and interpreting observational data on seismic surface waves.
In his opening lecture, the corresponding member of the Soviet Academy of Sciences, Ye. F. Savarenskly, dealt with future investigations of surface seismic waves in the member countries of the Committee.
H. Neuhofer and D. Guth described the results of observations of surface waves conducted at seismographic stations of the German Democratic Republic (GDR). A great deal of attention was devoted to accuracy in determining the onset time of surface phases at the station. Owing to the short distances between stations, this problem is of considerable Importance in determining phase and group velocities. The authors of the lecture have determined phase velocity dispersion curves for the territory of GDR. The next step in these investigations will be the determination of the crustal structure.
In another lecture, H. Neuhofer and G. Henschel discussed application of digital filtering to analysis of wave trains of surface waves. Their investigation dealt with the effectiveness and accuracy of filtering as it applies to dispersive phases. The filters Investigated were applied to real seismograms. The filtered seismograms were used to determine polarization constants for short-period surface waves.
E. Bisztricsany (Hungary) discussed investigations of magnitudes of earthquakes from duration of surface waves on the seismogram.
The lectures presented by Soviet specialists can be divided into three groups. The first group of papers dealt with methods. A considerable interest was aroused by a lecture by V.B. Glasko, Ye. F. Savarenskly, and A.B. Peshkova dealing with effectiveness of the method of regularization in investigations of the crustal structure based on dispersion of seismic surface waves. In
* Abbreviated translation. ■
-11-

'
determining surface wave dispersion directly from a seismogram, the principal source of error is distortion due to interference caused by simultaneous recording of the principal and higher modes and of microseisms. A lecture by A.L. Levshin and V.F. Pisarenko demonstrated the effectiveness of two- dimensional time spectral representation o: the oscillatory process in separating and obtaining greater details of characteristics of phases being investigated. They described a computer method of time-spectral analysis and provided examples of applications of this technique to synthetic and real seismograms. The kinematic aspects of generation of Rayleigh waves were considered in a lecture by Ye. F. Savarenskiy, S.A. Fedorova, and O, Ye. Starovoyt. The authors dercribed the results of modeling of surface waves and analysis of real seismograms.
The second group of lectures dealt with processing of observational data on surface waves, i.e., a construction of experimental dispersion curves and crustal studies in the Lesser Caucasus, Carpathla, Southeastern Eurasia, and Arabian Peninsula using d^'oersion curves. Included in the second group of papers were lectures given by D.I. Sikharulidve, A. Xh. Bagramyan, B.I. Volosetskiy, S.A. Kapitanova, V.M. Arkhangel'skaya, B.N. Shechkov, and A. Gergaui (UAR). The paper read by B.N. Shechkov dealt with application of different modifications of the surface wave method using data on the fundamental and higher modes to study tectonics of Eurasia. A few preliminary results were described dealing with the crustal structure in different regions. Of considerable interest were the results of crustal determination under the Moscow seismographic stations obtained by G.L. Kosarev. This investigation was performed using spectra of long-period compressional waves. A lecture by P.M. Karmaleyeva was devoted to dispersion of long-period surface waves acquired by means of quarts extensometers. Especially interesting were '■.he results of determinations of parameters of strong earthquakes originating in the Aleutian Islands (4 February 1965) and near Hokkaido (16 May 1968) determined from the amplitude spectra of long-period Love waves.
The third group of lectures dealt with instruments. One of the important problems in this area is the investigation of noise during recording of seismic waves by long-period pendulum seismographs. V.D. Feofilaktov proposed a classification of long-period noise based on its excitation sources, investigated the effect of different factors on the seismograph, and provided practical recommendations for reducing noise. Analysis of operation of a two-component quartz strain meter installed at the Obninsk Central Seismographic Observatory was described in a report by O. Ye. Starovoyt, V.D. Feofilaktov, L.L. Shul'pin, and M.I. Yaroshevich.
Reports by the representatives of the member countries of the conference dealing with instrumental recording and research in the area of seismic surface waves performed during 1968-1970 and the plans for 1971-1975 were presented at a special session.
-12-
mmmgummniuii»
DETECTION OF UNDERGROUND NUCLEAR EXPLOSIONS
A REVIEW OF THE EFFECTIVENESS OF SEISMIC DISCRIMINANTS FOR UNDERGROUND NUCLEAR EXPLOSIONS C. Shlshkevish [S]
A briet review is presented of the effectiveness of seismic methods of identifying underyiound nuclear explosions. The survey is based on papers published during 1968 - July 1971 and does not include earlier references or proceedings of the Woods-Hole Conference held in 1970.
According to U.S. and British seismologists, the number of shallow-focus earthquakes with focal depths h s 60-80 km and with body wave magnitude egivalent to underground nuclear explosions with a yield Y 2 2+ 1 kt originating each year throughout the world is between 5000 and 10,000 (2500- 5000) earthquakes according to Soviet data) (1] . Thus, excluding the possibility of on- site inspection, vigorously opposed by the Soviet Union, underground nuclear explosions must be identified from seismic records of a very large number of events acquired at teleseismic distances (A " 3000-10,000 km).
Evernden [2] lists seven different criteria for discrimination between shallow-focus earthquakes and underground nuclear explosions. According to his analysis, the criteria presented are valid to at least as low as m = 4 3/4.
A concensus of opinion among seismologists indicates that one of the fundamental ways of distinguishing the seimsic signatures of shallow-focus earthquakes and explosions is to compare relative generation of long and short- period seismic waves [3] . Presently this difference is usually measured by means of the (m:M) body wave-surface wave magnitude discriminant and by the Rayleight wave spectral ratio.
The m;M Discriminant
The SIPRI report [4] summarizing the opinions of a large group of seismologists from 10 countries concludes that the m:M criterion can be used to identify under- grou'H explosions with m ^ 4 3/4.
Analysis of long-period waves generated by underground nuclear explosions and by earthquakes in five different geographical and tectonic regions of the world performed by Lieberman and Pomeroy ßil indicates that the m:M criterion can be used for events with m > 5.
Using data on 28 earthquakes and 26 underground nuclear explosions in southwestern North America, recorded by the Canadian network of seismographlc stations, Basham [6] has established that the threshold for discriminating between earthquakes and underground nuclear explosions by means of the m:M discriminant is m ^ 4.5.
Basham [7] has also determined the magnitude threshold for discrimination by means of the m:M criterion using data on 36 underground nuclear explosions and 33 shallow-focus earthquakes in Asia recorded by 20 Canadian Stations. He
-13-
4

determined that the magnitude threshold for discrimination is m > 5.9, however, when the seismic noise is sufficiently low, the m:M criterion can be used to discriminate between events with m ^ 5.0. Basham has shown that owing to propagation path effects on the surface wave amplitudes, the m:M detection threshold for intercontinental distances decreases by unit magnitude m.
Using data on 45 underground nuclear explosions recorded at A = 2000- 10,000 km, Pasechnik, et al (B](see also [4]) concludes that the m:M criterion is effective down to magnitudes as low as m =4.19 . However, analysis of his data indicates that the magnitude threshold is actually m ^ 4.5.
P-Wave Spectral Discriminant
The SIPRI report [4] indicates that the P-wave spectra are a diagnostic aid and a possible discriminant for events with m > 5.25.
Analysis of P-wave spectra of underground nuclear explosions and four shallow-focus earthquakes with m = 5.9-6.6 recorded at A ~ 50c was performed by Wyss, et al [9] . It was determined that there were two potentially useful diagnostic features of P-wave spectra for earthquakes and explosions of comparable m from the same geographic and tectonic region: 1) peak frequency of explosions is almost an order of magnitude greater than the peak frequency of earthquakes; 2) a pronounced decay of the explosion spectra for frequencies less than the peak frequency, as compared to the earthquake spectra which remain flat at frequencies below the peak frequency.
Bakun and Johnson [10] have evaluated the P-wave spectral discriminant at short epicentral distances (A **• 2-4°) in order to encourage the application of this criterion for discrimination between earthquakes and explosions at large epicentral distances. An analysis of 69 events with M = 2.8-4.5 located within 100 km of the Nevada Test Site and recorded by a high-gain, short-period vertical Benioff seismograph shows that the Pg spectral ratio (0.6-1.25 Hz)/ (1.35-2.0 Hz) of ground displacement satisfcictorily discriminates Nevada Test Site explosions from "natural" earthquakes for a threshold magnitude at least as low as M = 3.2. This study verifies the potential usefulness of the P-wave spectral discriminant, however, the results of the analysis are limited to events recorded at short epicentral distances.
The Rayleigh Wave Spectral Ratio Discriminant
A new, high-gain, wide-band seismograph installed in Ogdensburg, New Jersey is described by Pomeroy, et al [11] • The magnification of the seismograph in the period range 20-50 sec is nearly two orders of magnitude higher than that of long-period vertical instruments of WWSSN. The peak magnification in the response curve is shifted from 25 sec, as for the WWSSN and LASA instruments, to 30-50 sec. Since microseismic noise drops off sharply at periods exceeding 20 sec, higher magnification and an increase in signal-to-noise ratio achieved at periods exceeding 20 sec, make it possible to record events as low as M = 2.7 [12]. The noise-free output at high magnification was attributed to rigid environmental control achieved by operating the system in an air-tight chamber in a deep mine, rather than a novel design of the instrument [11] .
-14-
.

rmmmm»
Monar, et al, [12] have analyzed the spectral ratios of Ai9_22/Mo-60 of Rayleigh waves, i.e., thu amplitude measured on the vertical seismogram of a 19 to 22 sec period of Rayleigh wave compared to its amplitude at a 40-60 sec period, of 51 Western United States earthquakes and underground nuclear explosions with m = 3.9-6.3 recorded by the high-gain seismograph at Ogdensburg. They have found a complete separation of explosions and shallow earthquakes for events of comparable m, i.e., for events studied Ai9-22/^40-60 0^ ^yl6^*1
waves was always less than 5.6 for earthquakes and always greater than 7.4 for explosions. Owing to the scarcity of data for events with m ^ 5, their conclusions are stricdy valid only for events with m > 5. However, Molnar, et al, point out that for thv3 events investigated the spectral ratio Ai9_22/A4Q_5(\ of Rayleigh waves appears to be independent of magnitude, indicating that the differences in the seismic spectra of earthquakes and explosions may persist even for events of m < 5.
The paper by Von Seggern and Lambert [13] differed from that of Molnar, et al, [12] on the importance of long-period Rayleigh waves from earthquakes and explosions as a useful criterion for identification of underground nuclear explosions. They tested two ratios involving the integral of energy averaged over many stations, Ai5_22/A22-48 an<^ ^10-22/^22-48' Using events from July 1962 to September 1968 recorded at LRSM and VELA stations in North America, they found that A^5.22^22-48 an^ ^10-79^22-48 very nearly separated the two populations, but only for the Western United Stetes and only if the ratios were normalized to a constant distance by an empirical relationship. When earthquakes and explosions from other regions were included, this separation was lost.
Analysis of limted data from a long-period, Press-Ewing, vertical seismo- graph and the prototype of a new mercury tiltmeter at the Agassiz station in Harvard performed by Derr [14] shows that the Rayleigh wave spectral ratio of short- to long-period energy provides a useful discriminant for underground explosions in the Western United States at A = 28-38° in the magnitude range 5.0 <m < 6.3 (3.5 <M < 5.6). It is pointed out that discrimination is better for Ogdensburg long-period, high-gain, vertical instruments than it is for an average of lower gain stations, perhaps because of the nearly constant path to one station and lack of instrumental and site corrections. However, in agreement with the results of Von Seggern and Lambert, the Rayleigh spectral ratio does not discriminate the large Milrow event in the Aleutians from earth- quakes in the same region due to significant long-period Rayleigh energy in the Milrow event which Derr attributes to release of tectonic stress. If this is the case, large explosions in vectonically active regions may be difficult to dis- criminate from earthquakes by Rayleigh wave spectral ratio [14].
Tsai and Aki [15] have determined that earthquakes at depths near 40 km exhibit surface wave spectra v ith pronounced minima due to destructive interference in the period ran^e studied by Molnar, et al. Tsai and Aki 0.6] have also established that earthquake-generated Rayleigh waves have a significantly different spectral shape in comparison with that of an explosion, except when the earthquake occurs very close to the earth's surface. These two factors make it impossible to apply the Rayleigh wave spectral ratio discriminant to very shallow events (less than a few km deep) and to events occurring at depths close to 40 km. It thus appears tK.at Rayleigh spectral ratio complements
-15-
m
the m:M discriminant by providing a clear separation of earthquakes and explosions at certain depths in some geographical regions where earthquakes are of low stress drop and are of strike slip mechanism [14,15,16].
The paper by Bakun and Johnson QO] includes the following paragraph:
"Using data from Berkeley broadband system at a distance of 500 km from Nevada Test Site, McEvilly and Peppin (1970 personal communication) have found a separation of the Nevada Test Site explosion and Nevada earthquake populations down to a threshold magnitude at least as low as m = 3.7. Surface waves for smaller events are lost in the background noise".
Although these results are highly significant, their validity can not presently be evaluated due to a lack of details.
Magnitude Versus Yield of Underground Nuclear Explosions
A considerable disagreement concerning the body wave magnitude versus yield relationship for underground nuclear explosions exists between Soviet and Western (especially USA) scientists. According to Pasechnik [4] , a 1 kt explosion in hard rock is equivalent to m = 4.6-4.8. Thirlaway [4] stated that a 1 kt explosion in granite is equivalent to m = 4.0. The latest determina- tion of the body wave magnitude versus yield relationship for underground explosions fired in the USA was performed by Evernden [17,18] . According to his analysis (Figure 1 in [l7]or Figure 3 in [18]), the body wave magnitude of a 2 kt explosion in hard rock is ^ 3.7 (m ^3.4 for a 1 kt explosion). Thus, a difference in body wave magnitude Am = 1.3 exists between the Soviet and the American results concerning the body wave magnitudes of low-yield under- ground nuclear explosions fired in hard rock. A recent Soviet article [19] attributes the systematic difference between the USCGS and Russian determinations of body wave magnitudes of earthquakes (0.7-1.2 magnitude units on the average) to differences in the frequency response of instruments, selection of different sections of seismograms for measuring A/T, and most of all, to conditions prevailing at seismic stations (I.e., improper station corrections). It is claimed that BMO, UBO, TFO, and WMO stations consistently report lower magnitudes than most other stations. Evernden [18] attributes the regional dependence of body wave magnitudes of underground explosions to differences in attenuation of body waves beneath different source and station sites.
Under optimal conditions the new, high-gain, long-period seismometers [12] are claimed to be capable of recording events» with M as low as 2.7 '- m = 3.7 for explosions) at epicentral distances of 30° or more (pl39 in [10]). Thus, a possibility can not be excluded that the best currently available
-16-
L»..niumiiimiwMiiimiiiniiiiiin n ii mi V i'tir mim-1- I I ■ i^^^m - —■- ■
seismographs operating under optimal conditions mdy eventually lower the body wave magnitude threshold for discrimination between earthquakes and underground nuclear explosions in hard rock to m = 3.7. According to Evernden's analysis Dl7,18] , an event with m = 3.7 corresponds to an underground nuclear explosion with Y = 2 kt. However, according to Russian data [7] , an event with m = 3.7 corresponds to an underground nuclear explosion with Y = 0.1 kt*. Such considerable differences between yields of underground nuclear explosions determined from m indicate the necessity of standardizing the USA and USSR techniques of determining body wave magnitudes.
It was recently established [18] that the yield of an underground nuclear explosion is more easily and accurately determined from M rather than m. Thus, one way to avoid the m versus Y controversy is £o determine the yield of underground explosions from surface wave magnitudes.
Conclusions
A review of scientific literature on seismic methods of Identifying under- ground nuclear explosions published during 1968 - June 1971 leads to the following conclusions concerning the effectiveness of such methods:
1. The m:M and the Rayleigh wave spectral ratio discriminants can be used to discriminate between earthquakes and underground nuclear explosions of body wave magnitudes m ^ 4.5.
2. The m:M and especially the Rayleigh wave spectral ratio discriminants appear to be very promising in lowering the threshold of discrimination to most events with surface wave magnitude M > 2.7 (equivalent body wave magnitude for explosions m = 3.7-3.9), i.e. # to the lower limit of event detection set by the noise level and detection capability of available high-gain, long-period seismographs.
3. More research is needed to verify the effectiveness of both the m:M and the Rayleigh wave spectral ratio discriminants. In particular, further Investigations are needed In the following areas:
a. Determination of the mechanism responsible for the fact that excitation of Love and Rayleigh waves at long periods is considerably lower for most events with the same body wave magnitude and a further study of limitations of this criterion for larger events by such factors as the release of tectonic strain.
b. Better knowledge of variation of long-period spectra of Rayleigh waves with focal depth (especially for near surface events and events at depths h ^ 40 km) and of the propagation effects on the surface wave spectra, such as attenuation, scattering, and Interference due to lateral inhomogenelties,
c. Improving or standardizing techniques of determining body wave magnitudes of small earthquakes and underqround nuclear exolosions.
* Extrapolated using the formula m - m' = n log -^r » and setting n = 1, ([4] p82-83). According to Pasechnik ([4] , p83), the value of n may even be less than 1.
-17-
;'"■■■■:,?■•.
d. Further application of the various seismic discriminants to very low magnitude events from different geographically significant areas, particularly for such events recorded by new, high-gain, wide-band, vertical instruments installed at sites other than Ogdensburg, New Jersey.
REFERENCES
1. Pasechnik, I.P. Identification of underground nuclear explosions. AN SSSR. Vestnik, no. 11, 1968, 99-104
2. Evernden, J.F. Identification of earthquakes and explosions by use of teleseismic data. Journal of Geophysical Research, v. 74, no. 15, 3828-3856
3. Evernden, J.F. Studies relating to magnitudes of earthquakes and explosions. Transactions of the American Geophysical Union, v. 52, no. 5, 1971
4. SIPRI. Seismic method for monitoring underground explosions. Stockholm. International Institute for Peace and Conflict Research. Stockholm, 1968
5. Liebermann, R.C. and P.W. Pomeroy. Relative excitation of surface waves by earthquakes and underground explosions. Journal of Geophysical Research, v. 74, no. 6, 1969, 1575-1590
6. Basham, P.W. Canadian magnitudes of earthquakes and nuclear explosions in Southwestern North America. Geophysical Journal of the Royal Astronomical Society, v. 17, no. 1, 1969, 1-13
7. Basham, P.W. Canadian detection and discrimination threshold for earthquakes and underground explosions in Asia. Canadian Journal of Earth Sciences, v. 6, no. 6, 1969, 1455-1458
8. Pasechnik, I.P., G.G. Dashkov, L.A. Polikarpova, and N.G. Gamburtseva. The magnitude discriminant for underground nuclear explosions. AN SSSR. Izvestiya. Fizika zemli, no. 1, 1970, 28-36
9. Wyss, M., T.C. Hanks, and R.C. Liebermann. Comparison of P-wave spectra of underground explosions and earthquakes. Journal of Geophysical Research, v. 76, no. 11, 1971, 2716-2719
10. Bakun, W.H. and L.R. Johnston. Short-period spectal discriminants for explosions. Geophysical Journal of the Royal Astronomical Society, v. 22, no. 2, 13S-1S2
11. Pomeroy, P.W., G.Hade, J. Savino, and R. Chander. Preliminary results from high-gain, wide-band, long-period electromagnetic seismograph system. Journal of Geophysical Research, v. 74, no. 12, 1969, 3295-3298
-18-
mrn^ff" ■ ■
12. Molnar, P., J. Savino, L.R. Sykes, R.C. Liebermann, G. Hade, and P. Pomeroy. Small earthquakes and explosions in Western North America recorded by new high-gain, long-period seismographs. Nature, v. 244, no. 5226, 1969, 1968-1273
13. Von Seggern, D. and D. Lambert. Dependence of theoretical and observed Raylelgh wave spectra on distance, magnitude, and source type (in press) [Quoted in the paper by Derr, see reference [14] ]
14. Derr, J.S. Discrimination of earthquakes and explosions by the Rayleigh- wave spectral ratio. Bulletin of the Seismological Society of America, v. 60, no. 5, 1970, 1953-1968
15. Tsay, Y.B. and K. Akl. Precise focal depth determination from amplitude spectra of surface waves. Journal of Geophysical Research, v. 75, no. 29, 1970, 5729-5743
16. Tsai, Y.B. and K. Akl. Amplitude spectra of surface waves from small earthquakes and underground nuclear explosions. Journal of Geophysical Research, v. 76, no. 17, 1971, 3940-3952
17. Evernden, J.F. Magnitude versus yield of explosions. Journal of Geophysical Research, v. 75, no. 5, 1970, 1028-1032
18. Evernden, J.F. and J. Filson. Regional dependence of surface wave versus body wave magnitudes. Journal of Geophysical Research, v. 76, no. 14, 1971, 3303-3308
19. Bune, V.l., N.A. Vvedenskaya, I.V. Gorbunova, N.V. Kondorskaya, N.S. Landyreva, and I.V. Fedorova. Correlation of MLH and mpv by data of the network of seismic stations of the USSR Geographical Journal of the Royal Astronomical Society, v. 19, no. 5, 1970, 533-542
-19-

EARTHQUAKE PARAMETERS
DETERMINATION OF COORDINATES OF SOVIET CENTRAL ASIAN EARTHQUAKES [AS]
Kondorskaya, N.V. and A.I. Zakharova. IN: AN SSSR. Izvestlya. Fizlka zemll, no. 9, 1970, 76-83
The principal characteristics of travel times of P phases generated by earthquakes occurring in Soviet Central Asia are investigated in order to formalize computer calculation of epicenter coordinates. The problem under investigation requires the determination of general regularities in variation of travel times with epicentral distance for individual regions of Soviet Central Asia and the determination of station residuals characteristic of similar focal zones. A statistical analysis of travel times of P from different rbcal zones recorded by Soviet Central Asian seismographic stations is performed. The weighting function which characterizes the reliability of a given station network is determined. It is shown that the distribution curve for residuals for the system of Soviet Central Asian seismographic stations varies for different regions in Central Asia, however, they can be unified into three groups corresponding to the northern »central, and southern parts of Soviet Central Asia. Thus, the determination of epicenters of earthquakes originating in Soviet Central Asia requires the use of at least three different travel time curves corresponding to the three Central Asian zones identified above.
A RELATIVE ANALYSIS OF THE RECURRENCE OF EARTHQUAKES AND ROCKBURSTS [T]
Neunhofer, H. IN: Deutsche Akademie der Wissenschaften, Berlin. Institute fur Geodynamik Jena. Veröffentlichungen. (Series] A, no. 13, 1969, 58-65 (In German)
It Is pointed out that both earthquakes and rockbursts obey a lognormal distribution in respect to energy, i.e.,
N (logEj-logEQ)2
n0 = r- exp [- ] ' U aE1(2TT)2 2al
which includes the following three parameters: EQ, M, and a. These parameters are then determined for both earthquakes and rockbursts. The regression lines are computed for each pair of parameters and the correlation coefficients between each pair are determined. The coefficients of regression were determined to be
-21- PRECEDIHG PAGE BUM
Www,.
different for earthquakes and for rockbursts. The possible causes of the differences are discussed.
-22-

■ ■ ■. ■• ■■■■■■
■ ■
INSTRUMENTATION *
OUARTZ-STABILIZED DRIVE FOR RECORDING EOUIPMENT [t]
Aronov, L. Ye. and M.K, Dubrovina. IN: AS USSR. Institute of Physics of the Earth. Seismic Instruments (AN SSSR. Institut fiziki zemli. Seysmicheskiye pribory) , Moskva, Izd-vo "Nauka," no. 5, 1969, 99-104
The GK-50 quartz oscillator and its companion power amplifier are des- cribed. Frequency stabilization is achieved with a K-38 quartz resonator with a natural frequency of 20 kHz. The frequency division factor is 400, in four stages (to 5 kHz, 1 kHz, 200 Hz, and 50 Hz). The GK-50 drive has the following parameters: output frequency — 50 Hz; pulse shape — square; out- put pulse amplitude — 2.5 v; output resistance — 560 ohms; feed voltage — 12 v; power consumption — 1.5 W; size — 250 x 145 x 200 mm; and weight — 3.9 kg. This thermostatted unit can also be used in work requiring a time service. The power amplifier was designed to work with the quartz-stabilized drive, and is used in conjunction with a set of three recorders. For large-scale observations, an additional (or back-up) amplifier is used, which is switched on automatically should the current jump or the primary amplifier fail. The parameters of the power amplifier are as follows: maximum voltage-gain factor — 20; rated power output — 20 W; noted voltage output — 12 v; feed voltage — 12 v; power consumption — 24 W; efficiency — 80%. Circuit diagrams are given for the two units and their operation is described in detail.
A LONG-PERIOD ELECTROMECHANICAL OSCILLATOR fc]
Aronov, L. Ye. and M. A. Lekhtman. IN: AS USSR. Institute of Physics of the Earth. Seismic instruments (AN SSSR. Institut fiziki zemli. Seysmicheskiye pribory), Moskva, Izd-vo "Nauka," no. 5, 1969, 105-109
A long-period oscillator has been developed by the Institute of the Physics of the Earth for laboratory measurements of the frequency response of almost all presently used (Soviet) seismometer systems. The unit generates sinusoidal oscillations in the 0.2 to 200 sec period range. The unit is described in some detail and a circuit diagram is given. Some of the basic specifications of this oscillator are: period range — 0.2 to 200 sec; instrument error — 5%; output voltage — to 8 v; power consumption — to 15 W; size — 402 x 201 x 300 mm; weight — 15 kg.
* All but four abstracts in this section were written by L. Boylan of Informatics Tlsco.
-23-
"
THE OSB-I Mp PORTABLE SEISMIC OSCILLOGRAPH
Borisevich, Ye. S.# S.A. Kastorskiy, and M.S. Mosyagina. IN: AS USSR. Institute of Physics of the Earth. Seismic instruments (AN SSSR. Institut fiziki zemli. Seysmicheskiye pribory), Moskva, Izd-vo "Nauka," no. 5, 1969, 90-98
Some advantages and disadvantages of the OSM-V1-M and OSB-I portable seismic recorder are briefly summarized. Modifications made in the OSB-I in developing the improved OSB-IMp include: the addition of a spring drive for use in areas where electricity is not readily available; the addition of a conventional strip-chart recording capability to augment the photographic recording (to be used for recording explosions); and many changes in the optics of the unit to enhance recording precision. Some of the specifications of the OSB-IMp oscillograph are: weight — 16 kg; length of light-sensitive paper — 450 mm; length of strip chart —12 m; and recording time — up to about 16 hours of continuous recording. Using light-sensitive paper at recording speeds of 60 and 120 mm/min, oscillation frequencies of up to 5 and 10 Hz, respectively, can be recorded. Low-lot production of the OSB-IMp was to have begun in 1968.
A DEVICE FOR MEASURING AND RECORDING VELOCITY AND ACCELERATION ÜE]
Borisevich, Ye. S.,, D.P. Kirnos, and V.M. Fremd. Otkrytiya, izobreteniya, promyshlennyye obraztsy, tovarnyye znaki, no. 7, 1971, 142 (Author's Certificate 295099).
As announced by the Institute of Physics of the Earth, an Author's Certificate has been issued for a device for measuring and recording earth- quake or explosion generated velocity and acceleration of vibrating objects (ground or structures). The unit contains a moving (wire) coil placed in a magnetic field, elastic supports, and a small mirror for optical recording of coll rotation. This device differs from similar such devices in that its sensitivity is increased and its size is reduced by equipping it with a balance in the form of a wire with a fuzed globule on one end and the other end of the wire attached at the axis of rotation of the coil.
-24-

THE UTILIZATION OF VISUAL HOT-PEN RECORDERS FOR REGISTRATION OF AFTERSHOCKS OF THE TASHKENT EARTHQUAKE IE]
Borisevlch, Ye. S., V. I. Ulomov, and V.M. Fremd. IN: AS USSR. Institute of Physics of the Earth. Seismic instruments (AN SSSR. Institut fiziki ?:emli. Seysmlcheskiye pribory), Moskva, Izd-vo "Nauka," no. 5, 1969, 142-146
On 20 April 1966, a three-component visual recording seismograph was installed at the Central Tashkent Seismological Observatory. This system consists of three SKM-3 seismometers (one vertical and two horizontal), a three-channel UPN-3 transistorized low-frequency amplifier, and anN-002 hot-pen recorder. Beginning with the main shock which occurred on 26 April, almost all aftershocks were recorded at a magnification of 3000, analyzed on the spot (without stopping the recorders), and were used to warn the population. Although not intended for permanent installation at Tashkent and despite several mechanical problems and minor equipment failures, the equipment showed its suitability for practical use, in particular, for use in recording aftershocks in the epicentral zone. Based on the experience gained, a number of minor equipment modifications are recommeded. It is noted that, equipped with an adequate triggering system, the equipment could be used as a means of obtaining rapid information on aftershocks, despite the fact that first arrivals would be missed. This is preconditioned by the presence of other continuously recording systems at the observa' /.
A DEVICE FOR INCREASING THE NATURAL PERIOD AND STABILITY OF PENDULUM SYSTEMS C* SEISMOMETERS [E]
Fedoseyenko, N. Ye., A.S. Deniskov, and L.F. Baranov. IN: AN SSSR Izvestiya, Fizika zemli, no. 6, 1970, 84-87
A method of astatizing the pendulum system by addition of a permanent magnet acting on the suspension system of the pendulum is described. The ring-shaped astatizing magnet i& attached to the seismometer frame in surh a manner that the nonlinear dependence of the interaction force of the magnet with the pendulum on the angle of rotation of the pendulum eliminates the dependence of the natural period on the displacement of the equilibrium position. The direction of the attraction force of the magnet which coincides with the direction of the supporting spiral spring makes it possible to achieve longer pendulum period. As an example, a device for increasing the pendulum period oi the SDK seismometer is described. A record of the seismometer adjusted to operate at a period of 7 sec and extended by means of ring magnets to a period of 22 sec is provided.
-25-

A PIEZOELECTRIC SEISMIC ACCELEROMETER WITH A FIELD-EFFECT TRANSISTOR f]
Fremd, V.M. IN: AS USSR. Institute of Physics of the Earth. Seismic instruments. (AN SSSR. Institut fiziki zemli. Seysmicheskiye pribory), Moskva, Izd-vo "Nauka," no. 5, 1969, 43-47
The article examines modifications to the AP-2 seismic acceleroneter, involving the addition of a field-effect transistor (FET) to the preamp circuit. The advantages of the FET in this application are outlined in general terms and a schematic of the FET preamp is given. For a supply voltage of 10 v, the amplifier current is only 0.7 ma. Three series-connected batteries provide 700-900 hours of continuous operation; this time can be increased four times, using a 2.8 amp-hr mercury battery. The frequency response of the amplifier is flat to very high frequencies. For a voltage transfer factor of 0.6, the accelerometer sensitivity is about 1 v/g. A three-component system consisting of three AP-2M accelerometers was tested during the Medeo explosion of 21 October 1966. For this test, the accelerometers were connected to an ISO-II recorder. Recording channel amplitude-frequency response was tested and proved to be flat between 0.1 and 20 Hz. It is concluded that the piezoelectric FET accelerometer and the frequency response of the system are suitable for recording high-intensity earthquakes; however, care must be exercised in balancing the recorder galvanometers.
A THREE-COMPONENT PIEZOELECTRIC SEISMIC ACCELEROMETER WITH A COMMON INERTIAL MASS [E]
Fremd, V.M. IN: AS USSR. Institute of Physics of the Earth. Seismic instruments (AN SSSR. Institut fiziki zemli. Seysmicheskiye pribory), Moskva, Izd-vo "Nauka," no. 5, 1969, 48-50
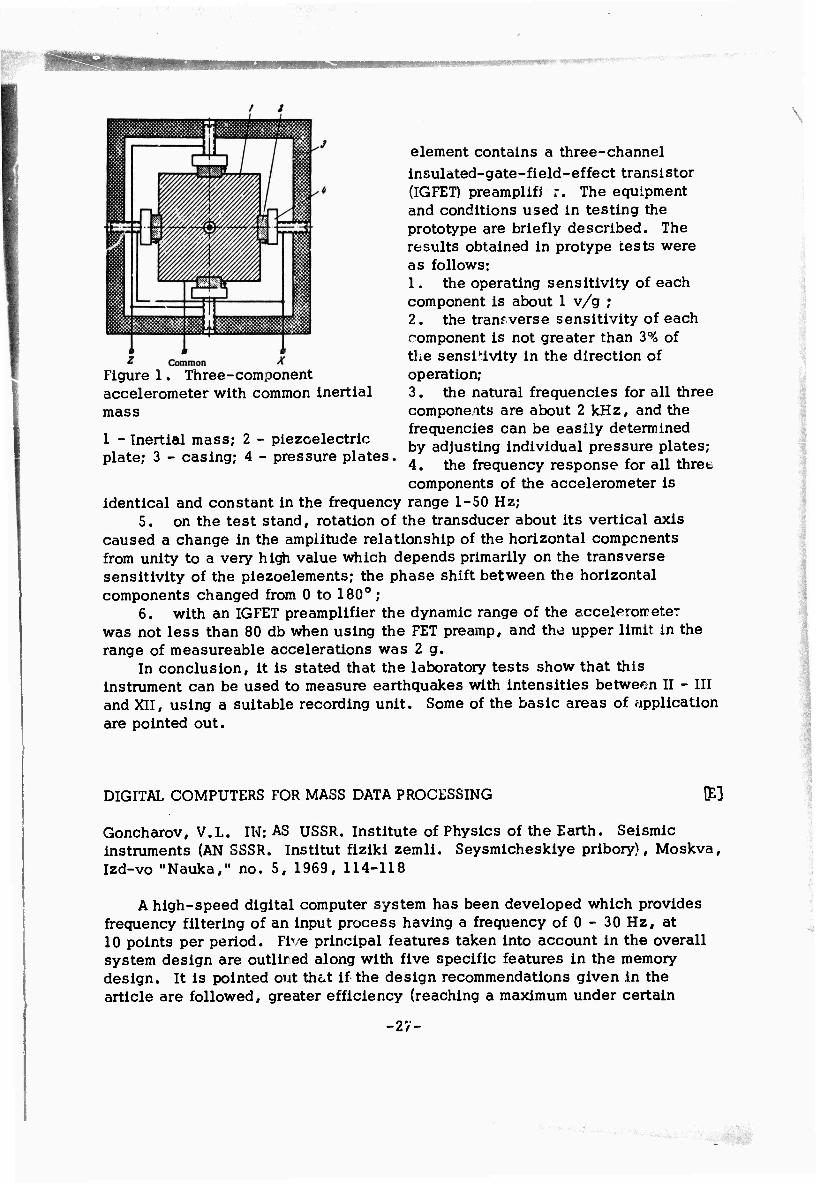
The Department of Seismological and Recording Equipment of the Institute of Physics of the Earth has built and tested a prototype model of a three- component piezoelectric accelerometer with a common inertial mass (see Figure 1) The inertial mass consists of a brass cube 7.5 cm on a side, weighing about 1.5 kg with 0 2 cm thick and 2.5 cm in diameter zirconate-lead titanate plates attached to the center of each side of the cube. The capacitance of each plate was about 3000 pf. The arrows in Figure 1 indicate the direction in which the piezoceramic plates are polarized. Each of the two opposing pressure plates are electrically interconnected, and the leads from each pair of plates represent the individual component outputs (X and Z in Figure 1). Another reference output terminal common to all the components is the inertiP.l mass (COM in Figure 1). The pressure plates are electrically insulated from the housing which is also a cube 15 cm on a side, and, in addition to the sensing
-26-
vtaß&i*- -^■■•^sj-
element contains a three-channel insuläted-gate-fleld-effect transistor (IGFET) preamplifi r. The equipment and conditions used in testing the prototype are briefly described. The results obtained in protype tests were as follows: 1. the operating sensitivity of each component is about 1 v/g ; 2. the tram verse sensitivity of each romponent is not greater than 3% of the sensi'ivity in the direction of operation; 3. the natural frequencies for all three components are about 2 kHz, and the frequencies can be easily determined by adjusting Individual pressure plates; 4. the frequency response for all three components of the accelerometer is
identical and constant in the frequency range 1-50 Hz; 5. on the test stand, rotation of the transducer about its vertical axis
caused a change in the amplitude relationship of the horizontal components from unity to a very high value which depends primarily on the transverse sensitivity of the plezoelements; the phase shift between the horizontal components changed from 0 to 180°;
6. with an IGFET preamplifier the dynamic range of the ecceleroireter was not less than 80 db when using the FET preamp, and the upper limit in the range of measureable accelerations was 2 g.
In conclusion, it is stated that the laboratory tests show that this instrument can be used to measure earthquakes with intensities between II - III and XII, using a suitable recording unit. Some of the basic areas of application are pointed out.
Common Figure 1. Three-component accelerometer with common inertial mass
1 - Inertial mass; 2 - piezoelectric plate; 3 - casing; 4 - pressure plates.
DIGITAL COMPUTERS FOR MASS DATA PROCESSING m Goncharov, V.L. IN: AS USSR. Institute of Physics of the Earth. Seismic instruments (AN SSSR. Institut fiziki zemli. Seysmicheskiye pribory), Moskva, Izd-vo "Nauka," no. 5, 1969, 114-118
A high-speed digital computer system has been developed which provides frequency filtering of an input process having a frequency of 0 - 30 Hz, at 10 points per period. Five principal features taken into account in the overall system design are outlired along with five specific features in the memory design. It is pointed out that If the design recommendations given in the article are followed, greater efficiency (reaching a maximum under certain
-27-

conditions' can be achieved. The system described can be used to develop a special-purpose computer for mass data processing in a number of disciplines where continuous statistical processing of random variables is required.
THE VBP-5 SEISMIC DETECTOR FOR SEPARATE RECORDING OF TRANSLATION AL AND ROTATIONAL MOTION [E,T]
Kharin, D.A. and L.I. Simonov. IN: AS USSR. Institute of Physics of the Earth. Seismic instruments. (AN SSSR. Institut fiziki zemli. Seysmicheskiye pribory), Moskva, Izd-vo "Nauka," no. 5, 1969, 51-66
The theory is developed and the operating principles, design, and laboratory tests are described of a magnetoe]ectric seismic detector intended for separate galvanometer recording of linear and angular motions. The seismometer consists of tv/o similar pendulums aligned on a common axis of rotation, with the pendulum masses suspended on opposite sides of the axis of rotation. Laboratory tests involving changes of pendulum arrangement are described. In the final design of the detector, its parameters were as follows: pendulum mass — 130 g; moment of inertia relative to the axis of rotation — 3150 g x cm^; natural period — 2.0 sec; reduced pendulum length — 100 cm; damping constant — 0.5; induction coil resistance — 16 ohms; and sensitivity ~ 3.7 mv x sec/cm. Magnification curves resulting from shake table tests differed by not more than 7-10% from the computed values.
GENERAL PURPOSE BROAD-BAND SEISMOGRAPHS AND A UNIFIED METHOD OF DETERMINING INSTRUMENTAL CONSTANTS [K,E ]
Kirnos, D.P., V.T. Arkhangel'skiy, Z.I. Aranovich, and V.D. Feofilaktov. IN: AS USSR. Institute of Physics of the Earth. Seismic instruments. (AN SSSR. Institut fiziki zemli. Seysmicheskiye pribory), Moskva, Izd-vo "Nauka," no. 5, 1969, 3-34
The authors review the efforts undertaken at the Institute of Physics of the Earth of the USSR Academy of Sciences to improve the general purpose SVKD vertical and SGKD horizontal seismographs and to develop standardized procedures for determining and adjusting instrumental constants. The improvements involved efforts to extend the flat portion of the response curve to ground motion with periods of up to 20 sec at a magnification of 1000. Instrumental modifications and the results of laboratory and field tests of the modified SVK-3 vertical and SGK-3 horizontal seismographs are described. Expressions are given for determining various instrumental constants and procedures for adjusting the instrument components are outlined. The final tests were performed at the Central Geophysical Observatory of the Institute
-28-

m
of Physics of the Earth in 1965-1966. At ground motion of 1 - lOOp,, both seismographs exhibited satisfactory linear response and kept their pendulum- equilibrium zero point accurate to about 1%, although the SVK-3 pendulum is highly temperature dependent and requires additional heat insulation. In order to record earthquakes with M > 7.5, it is recommended that an additional delay-type, low-gain recorder unit be coupled to the basic seismograph system in order to avoid the recorder pen leaving the paper during recording of the maximum phase. The necessity for futher study of the effects of long- period noise on recordings with these instruments is pointed out. Due to the simplicity and accuracy of the proposed method, the authors recommend that it be adopted for use by the seismological stations of the USSR.
EXPERIENCE IN THE USE OF THE SD-1 LONG-PERIOD SEISMOGRAPH |E]
Kirnos, D.P. and O.Ye. Starovoyt. IN: AS USSR. Institute of Physics of the Earth. Seismic Instruments (AN SSSR. Institut fiziki zemli. Seysmicheskiye pribory), Moskva, Izd-vo "Nauka," no. 5, 1969, 151-156
Using an SKD seismometer (with modified transducer coil parameters) and a slightly modified East German SPG long-period (90 sec) galvanometer, the SD-1 long-period instrument was developed which has a magnification approaching that of a standard, general-purpose seismograph. The SD-1 seismometer has the following instrumental constants: Ts = 25 sec, Tg = 90 sec, Ds = 1, Dg = 0.5, a^ = 0.2-0.25. Vertical and horizontal models were installed at Moscow State University and at Obninsk, respectively, and comparison tests with a Fress-Ewing seismographs were made. Sample recordings acquired by the various systems are compared. Seven months of recording with the horizontal SD-1 (SGD-1) seismograph have shown that it provides excellent recording of long- period surface waves from events with M < 7.5 and body waves for events with M <8 at epicentral distances exceeding 50-60°.
TIME OF EXPLOSION REFERENCING IN MARINE SEISMIC WORK IE]
Maksimov, O.A., V.l. Myachkin, A.M. Palenov, and V.B. Preobrazhenskiy. IN: AS USSR. Institute of Physics of the Earth. Seismic instruments (AN SSSR. Institut fiziki zemli. Seysmicheskiye pribory), Moskva, Izd-vo "Nauka," no. 5, 1969, 139-141
A relatively simple transistorized arrangement for marking (referencing) the time of explosion, using a waterproofed battery, wires, and a galvanometer in a loop circuit, is described. The battery portion of the loop is connected to the charge, and the circuit breaks with the explosion. The device provides for the radio transmission of the true time of explosion am1 coordinated time marks
-29-

. BiBuJUiiiMIMUBI
from the shot ship to the receiving points. A circuit diagram for the transmitter and sample recordings made by the shot and receiving ships are given.
THE MAIN CONTROL CONSOLE OF THE OBNINSK CENTRAL GEOPHYSICAL OBSERVATORY OF THE INSTITUTE OF PHYSICS OF THE EARTH OF THE SOVIET ACADEMY OF SCIENCES fe]
Mishatkin, V.N. , A.P. Nefed'yev, V.D. Feofilaktov, and V.A. Burimov. IN: AS USSR. Institute of Physics of the Earth. Seismic instruments (AN SSSR. Institute fiziki zemli. Seysmicheskiye pribory), Moskva, Izd-vo "Nauka," no. 5, 1969,119-132
The functional components and operation of the main control console of the Central Geophysical Observatory at Obninsk is outlined. The console provides centralized automatic control of monitoring equipment, including various seismographs, tiltmeters, gravimeters, and strain seismographs. The telemetering sensor units for the above systems are in an underground installation 30 m below ground level. The main (recording and display) console is located at some distance from the sensors. The principal recording method used by the Observatory is photographic galvanometer recording; however, allowance has been made for the future use of different recording systems. The functional components of the console are as follows:
1. the control system and recorder-failure warning system; 2. time service system and time-signal shaping system; 3. earthquake warning system; 4. sensor/recorder channel calibration pulse system; and 5. auxiliary systems (remote switching, start/stop code shaping systems,
etc. A block diagram of the console is given and the operation of the above
components are outlined in some detail. The earthquake warning system utilizes sound and light systems based on motion levels from three types of instruments. The overall design used in the main control console can be used as a prototype for similar units.
THE ARS-M SELF-CONTAINED,RADIO-CONTROLLED SEISMOGRAPH WITH MAGNETIC RECORDING IE]
Nikolayenko, Yu. B., N.I. Kalashanikov, and V.N. Goncharskiy. IN: Otbor i peredacha informatsii, no. 19, 1969, 29-32
A detailed description of the ARS-1 M radio-controlled seismograph is given. The unit is battery powered and is designed for use in remote locations where it can be activated by radio command. Figure 1 shows a functional block
-30-
i

Figure 1. ARS-M seismograph block diagram
I - Photosensitive AGC; 2 - LC filter; 3 - seismic signal tape head; 4 - bias oscillator; 5 - signal amplifier; 6 - time mark head; 7 - tape drive; 8 - rf operated power relay; 9 - seismic signal receiver; 10 - voltage regulator; II - batteries; 12 - command receiver
diagram of the seismograph. The input seismic signal is amplified and tape recorded with synchronizing time marks on standard 6.25 mm width tape. The amplifier bandpass is 20-100 Hz. On receiving a 100 Hz command signal, power is switched to all circuits and the recorder operates for the duration of the command (up to 5 seconds); when not recording, the unit remains in a stand-by mode with only the radio receiver draw- ing power. Other specifications include: seismic signal sensitivity, 3 mv; input noise level, 2 mv or less; tape speed, 10 mm/sec (constant within 0.25% in any recording interval); total recording sessions, at least ten; rf carrier frequency, 36.025 MHz; operating life on one set of batteries, 15 hours.
CERTAIN ASPECTS OF HOT-PEN RECORDING OF SEISMIC PROCESSES
Polskiy, E.M. IN: AN SSSR. Izvestiya. Fizika zemli, no. 6, 1970, 88-91
[E]
Two inherent problems in the use of hot-pen recorders in seismographs are analyzed: fading or loss of signal trace because of heat loss to the paper and drum and skipping of the pen on the paper at high transport speeds. At high paper speeds, as much as half the heating power in the pen wire may be dis- sipated by the paper and drum if current compensation is not provided. This can be done by inserting an insulating layer between paper and drum, and also by including a heat compensation circuit which automatically optimizes pen current as a function of signal amplitude, frequency, and paper speed. Roughness of the paper surface is the limiting factor causing skips at high speeds; the normal pen weight overcomes this up to some critical relative velocity between pen and paper. If this rate is exceeded weight must be added to the pen head to insure contact for a continuous trace. A formula is derived for determining the contact force to be exerted by the hot pen on the paper as a function of frequency and amplitude of the signal and the roughness of the paper.
-31-

'^^''WBHHHMiHHHH
HOT-PEN RECORDERS (£]
Pol'skiy.Ye. M. IN: AS USSR. Institute of Physics of the Earth. Seismic instruments (AN SSSR. Institut fiziki zemli. Seysmicheskiye pribory), Moskva, Izd-vo "Nauka," no. 5, 1969, 133-138
Various types of Soviet and non-Soviet recording units are described and a table of specifications for 16 non-Soviet recording units is given. A description of two Soviet hot-pen recorders (N-002 and PP-6) is provided, however, both have been previously described in a 1964 collection of articles entitled, "AS USSR. Institute of Physics of the Earth. New instruments for recording seismic phenomena (AN SSSR. Institut fiziki zemli. Novyey pribory dlya registratsiy seysmicheskikh yavleniy)," Moskva, Izd-vo "Nauka," no. 35 (20), 1964, 30-35 and 54-60.
TESTING SEISMIC INSTRUMENTS OPERATING IN A STAND-BY MODE jjl]
Preobrazhenskiy, V.B., V.V. Stepanov, V.V. Shteynberg. IN: AS USSR. Institute of Physics of the Earth. Seismic instruments (AN SSSR. Institut fiziki zemli. Seysmicheskiye pribory), Moskva, Izd-vo "Nauka," no. 5, 1969, 147-150
The following seismographic systems for recording local earthquakes, setup on Kamchatka in 1966, are briefly described: V) an SZZ-II unit (with a VEG1K seismometer and POB-12M recorder); (2) an N-700 recorder and FEPU trigger (using a VEG1K or S5S seismometer and GB-series galvanometers); (3) an ISO-II engineering seismology recorder with electronic trigger (using VEG1K or S5S seismometer and SB-IV galvanometer); and (4) a UAR strong motion system (using velocimeters). The frequency response of the SZZ-II unit is flat in the 1-10 Hz frequency range (after some preamp and demodulator modifications). The unit has automatic shut-down after 35-45 sec of recording. The N-700/FEPU combination has 45-60 sec of recording time per earthquake but fails to record during the first 0.5-1 sec. This combination has a very flat response from 0.75 to 9 sec (magnification—200) and from 0.8 to 10 sec (magnification—25) and its main advantage is its simplicity and reliability. The ISO-II oscillograph uses VEG1K seismometers (magnification- 100), S5S seismometers (magnification — 15), or VBP-3 seismometers (magnification —5). It fails to record during the first 0.2 sec. Mechanical problems were encountered in this equipment and changes are recommended. Little is mentioned of the UAR strong motion system.
-32-
ELECTRONIC TRIGGERING UNIT FOR AN ISO-RECORDING UNIT S]
Rozenberg, I.M. and V.V. Stepanov. IN: AS USSR. Institute of Physics of the Earth. Seismic instruments (AN SSSR. Institut fiziki zemli. Seysmicheskiye pribory), Moskva, Izd-vo "Nauka," no. 5, 1969, 110-113
An electronic triggering unit designed for use with seismic recorders operating in a stand-by mode is described. Using a modified VEGIK seismometer (coil resistance — 2000 ohms), as triggering source, the triggering unit ensured reliable recording of shocks with intensity greater or equal to II. A unit set up in 1966 in Kamchatka showed that the recorder was triggered by a 20^signal at 5 Hz, using a coil with a resistance of 1000 ohms. A circuit diagram is given, as is a graph showing the triggering characteristics as a function of ground motion and input signal.
RECORDING THE AFTERSHOCKS OF THE TASHKENT EARTHQUAKE USING ENGINEERING-SEISMOLOGY RECORDING UNITS [E]
Rustanovich, D.N., V.V. Stepanov, and V.M. Fremd. IN: AS USSR. Institute of Physics of the Earth. Seismic instruments (AN SSSR. Institut fiziki zemli. Seysmicheskiye pribory), Moskva, Izd-vo "Nauka," no. 5, 1969, 157-160
The use of four ISO-II stand-by recording units in recording aftershocks from the Tashkent earthquake is described. An experimental triggering unit was tested with one of the VEGIK-equipped seismographs. Following some modifications, this system responded to aftershocks with intensity II and higher. The experience in Tashkent demonstrated the usefullnr.ss, economy, simplicity, and reliability of the ISO-II recording unit in this application. Three improve- ments are recommended which should make the ISO-II adaptable to regional seismological studies as well as engineering work.
PEN-WRITING SEISMOGRAPHS [R]
Rykov, A.V. IN: AS USSR. Institute of Physics of the Earth. Seismic instruments (AN SSSR. Institute fiziki zemli. Seismicheskiye pribory), Moskva, Izd-vo "Nauka," no. 5, 1969, 35-38
This brief review of pen-writing seismographs deals primarily with instruments with inductance transducers developed in the Soviet Union. The advantages of such instruments over long-period seismographs with capacitance transducers are emphasized. The very brief, general discussion contains no new data on capacitance transducer seismographs.
-33-

FM CAPACITANCE ACCELEROMETER (£]
Shnirman, G.L., A.A. Razorenov, and B.Z. Gorbenko. IN: AS USSR. Institute of Physics of the Earth, Seismic instruments (AN SSSR. Institut fiziki zemli. Seysmicheskiye pribory), Moskva, Izd-vo "Nauka," no. 5, 1969, 39-42
In an effort to record explosion generated acceleration the Institute of Physics of the Earth of the USSR Academy of Sciences has developed an FM capacitance accelerometer (see Figure 1). The transducer consists of a flat Duralumin diaphragm, which serves as a moving electrode of a differential capacitor and reacts through flexure to accelerations perpendicular to it. The acceleration increases the capacitance in one section of the capacitor and reduces it in the other. Both capacitor sections feature a high-frequency oscillator in their circuits. Diaphragm flexure causes a corresponding increase and decrease in the oscillator frequencies which pass to a mixer featuring a low-frequency filter at the output for discriminating the difference frequency.
Figure 1. Differential capacitor design
1 - Body; 2 - diaphragm; 3 - body; 4,5 - bolts; 6 - metal collar; 7 - insulating washer; 8 - insulating bushing; 9 - electrode; (Dimensions in mm)
The above design was used to build accelerometers rated at 60, 120, 600, 1200, and 6000 m/sec2. The accelerometer circuitry was transistorized and together with the differential capacitor and dry-cell batteries (nine volts) was housed in a casing. The circuit is turned so that the initial difference frequency is about 8 kHz. In a stand-by mode, the sensor output voltage is one volt and the voltage at the output end of the 2-km-long cable is 0.8 volts. Accelerometer sensitivity is adjusted by changing the thickness of the diaphragm, the gap
-34-

mmmmmmmmmmmmm*mwm-
dimensions, and the initial oscillator frequencies. Calibration and integrity tests for a sample group of accelerometers are described briefly, and the difference between the results of the dynamic and static calibration tests fall within the limits of measurement error. A three-channel, tube-type signal converter , used in the field for signal recording, is also described.
HIGH-GAIN VISIBLY RECORDING SEISMOGRAPHS [E]
Sidorov, I.B. and V.M. Fremd. IN: AS USSR. Institute of Physics of the Earth. Seismic instruments (AN SSSR. Institut fiziki zemli. Seysmicheykiye pribory), Moskva, Izd-vo "Nauka," no. 5, 1969, 161-169
An attempt is made to evaluate the maximum possibilities offered by the visibly-recording, high-gain, three-component seismograph system consisting of an SKM-3 electromagnetic seismometer, the UPN-3 amplifier, and the N-002 three-channel hot-pen recorder. Formulas are derived for computing the frequency response characteristics of such a system based on certain optimum parameters. Recommendations for selecting optimum instrumental constants and circuitry parameters are given.
SM-2M SEISMOMETER [E]
Tokmakov, V.A. IN: AS USSR. Institute of Physics of the Earth. Seismic instruments (AN SSSR. Institut fiziki zemli. Seysmicheskiye pribory), Moskva, Izd-vo "Nauka," no. 5, 1969, 67-71
The institute of Physics of the Earth has designed a new pendulum seismometer (the SM-2M) with an electromagnetic transducer. The present design proceeds from an attempt to improve on the shortcomings of the older, widely used VEG1K seismometer. The unit is versatile to the extend that it can be removed easily and reinstalled at a 90° angle to Its previous position. I.e., it can be easily used as a horizontal or a vertical seismometer. The unit has a single induction coil. A low-impedance coll is used when operating with the GB-III, GB-IV, or GB-VII galvanometers preferred by the Institute of Physics of the Earth. A high-impedance coil is used for recording channels having a high-impedance input element (e.g., amplifier) between the seis- mometer and the galvanometer. The basic specifications of the SM-2M seis- mometer are as follows:
Reduced length 8.7 cm Moment of inertia 0.85 x 10 gr x cm Natural period 1.5 sec
-35-
.
Period adjustment limits for operation as a vertical motion seismometer 0.7-2.2 sec
Period adjustment limits for operation as a horizontal motion seismometer 0.8-2.3 sec
Amplitude limit +3.0 mm
For the low-resistance coil
Coil resistance 140 ohm Shunt resistance 150 ohm Equivalent resistance 72 ohm Sensitivity with the shunt connected 200 mv/(cm/sec) Damping constant 92 ohm/sec
For the high-resistance coil
Coil resistance 3000 ohm Shunt resistance 6000 ohm Equivalent resistance 2000 ohm Sensitivity with the shunt connected 1650 mv/Ccm/sec) Damping constant 4500 ohm/sec
IDENTIFICATION OF PHASE CHARACTERISTICS OF SEISMOGRAPHS FORMING PART OF THE SEISMOGRAPHIC NETWORK D"]
Teupser, Ch. IN: Deutsche Akademie der Wissenschaften, Berlin. Institut fur Geodynamik Jena. Veröffentlichungen. [Series]A, no. 13, 1969, 10-18 (In German)
The effect of galvanometer and seismometer parameters on the phase frequency characteristic of an electrodynamic seismograph are analyzed. It is shown that differences in natural periods of galvanometers do not exert an excessively strong effect on the similarity of phase characteristics of the station network, however, in order to maintain this similarity it is required that the damping constants of galvanometers be adjusted accordingly. It was determined that the error in determining the periods and damping of seismometer and galvanometer should not exceed 3% . The period of the instrument during its operation should also be stable to within 3%. The effect of the coupling coefficient was also analyzed. It is shown, that the coupling coefficient can be neglected only when it is smaller than 0.1.
-36-
--
EQUILIBRIUM STABILITY OF AN ELECTRODYNAMIC SEISMOGRAPH [T]
Ullmann, W. IN: Deutsche Akademie der Wissenschaften, Berlin. Institut fur Geodynamik Jena. Veröffentlichungen. [Series] A, no. 13, 1969, 19-38 (In German)
The stability of the equilibrium position of an electrodynamic seismograph considered to be a system having n degrees of freedom and consisting of an electrically coupled seismometer and galvanometer is analyzed. The equilibrium position of the seismograph is represented in the form of a solution of a system of independent, nonlinear, differential equations. The stability of these solutions is determined using Lyapunov's theorem. The stability criteria are derived from the characteristic equation of the system. The ranges of variation of the principal mechanical and electrical parameters of seismographs are given. The connecting circuit elements are considered to be differential terms of arbitrary order which can also be nonlinear. In particular, for a seismograph with 3 degrees of freedom, the order of the differential term:; does not exceed two. Examples of electrodynamic seismographs with and without resonant circuits are discussed.
INSTRUMENTS AND METHODS OF MEASURING SEISMIC SIGNALS [E] ■
Vukomanovic, U. IN: Izgradnja, v. 23, no. 4, 1969, 37-45 (In Serbocroatian)
The instruments and methods of measuring particle velocity, displacement, and acceleration of ground used to investigate the seismic effect of underground quarry blasts are described. The magnetoelectric method of measuring particle velocities was used. The principle parts of the sensor are a coil, rigidly connected to the frame, and the inertial magnetic mass inside the frame, and attached to it by springs with natural frequency between 2 and 5 Hz. Ground motion at these frequencies set the frame in motion. If the frequency of ground motion is higher than the natural frequency of the magnetic mass, the emf induced in the coil is proportional to the mass velocity of the ground. The ground displacement and motion were determined by integrating and differentiat- ing the output signal generated by the sensor. Multichannel oscillographic records were used to register the signals from the sensors. As a rule, signals with amplitudes 0.1-1.5 cm/sec and a frequency of 5-50 Hz were measured with an error not exceeding 10%. The results of measurements of the three components' particle velocity generated by seismic waves from underground explosions with charges up to several tons fired individually or as a series of charges at depths down to 30 m are given. The possibility of firing charges In populated regions is discussed and different methods of decreasing the seismic effect of such explosions is considered. It is suggested that seismic methods be used in determining the optimal delay times and the best distribution of boreholes in order to diminish the seismic effect of large, short-delay explosions.
-37-
■m

■■■■■■^■■■^.'.■-^"rv
ULTRA-LONG-PERIOD GALVANOMETERS fc]
Yaroshevlch, M.I. IN: AN SSSR. Izvestlya. Fizika zemll, no. 8, 1970, 38-89
The principal parameters of the ultra-long-period DG-300 and DG-500 galvanometers with Tg = 360 and 510 sec, respectively, are given. A con- siderable difference between these galvanometer - and the Lehner galvanometer is the possibility of using DG-300 and DG-500 galvanometers with large damping, i.e., in integrating mode. This is achieved by using large critical resistance in comparison with the internal resistance of the galvanometer. The internal resistance and the electromagnetic damping constant of the DG-300 galvanometer are 70-80 Ihm and 3400-3700 ohm, respectively. In the case of the DG-500, the internal resistance and damping constants are 90-100 and 6700-7000 ohm, respectively. The free damping of the galvanometers being described is about 0.4-0.5. The design characteristics and the results of laboratory testing of DG-300 and DG-500 galvanometers is briefly described.
LONG-PERIOD SEISMOGRAPHS 1E,T]
Zhigal'tsev, A.A. and M.P. Zarayskiy. IN: AS USSR. Institute of Physics of the Earth. Seismic instruments (AN SSSR. Institut fiziki zemli. Seysmicheskiye pribory), Moskva, Izd-vo "Nauka," no. 5, 1969, 72-89
A number of long-period seismographs using short-period seismometers and predominantly double-integrating photogalvanometer amplifiers are described. The FI-1 single integrating photoamplifier is described, and its modification into a double-integrating or "two-stage" amplifier (FI-2) is outlined. By suppressing the feedback between the two stages, it was possible to retain some of the advantages of the FI-1 and yet provide double integration and high voltage gain. Low input noise, high gain, mechanical stability, and design simplicity make these integrating photoamplifiers adaptable to a wide range of long-period seismographs. Another device described is a strong-motion recorder which uses an S5S (or other stable) short-period seismometer to register ground motion from 15x10-5 to 15 mm. The problem of providing mechanical stability was solved by placing the FI-1 single-integrating photoamplifier and the oscillograph in a special shock-absorbing casing. The system is desigied so that the photoamplifier integrating band corresponds to the seismometer damping time; thus, a signal proportional to ground velocity is formed at the amplifier output. The N-007 recorder operating in a stand-by mode records both velocity and ground motion. Velocity recording is done with a GB series short- period galvanometer with normal damping. The motion-recording channel, performs another Integration by means of an overdamped, short-period recording galvan- ometer the damping time of which is equivalent to the damping time of the photoamplifier galvanometer and the seismometer. An FI-2 equipped wide-band.
-38-

long-period velocigraph is described in wh ich the effects of feedback between the galvanometers in the photoamplifier stages and between the photoamplifier and the seismometer were checked experimentally. The results showed no effect on the recording quality. Using an SKD-O seismometer, it proved possible to develop a long-period velocigraph with a response characteristic of 12-260 sec. Maximum sensitivity is 3.5 v sec/p,, the maximum signal at the output is 6 v, and the peak magnification is 5 x 10"^ sec. Dynamic range at maximum sensitivity is inversely proportional to the recorded period and is equal to 2 x 10 /T, where T is the wave period.
Another FI-2 equipped device described is a wide-band, long-period seismograph which operates on the long-period slope of the response curve of a short-period seismometer. In this setup, a third integration is performed by either a recording galvanometer or a third-stage FI-1. The latter is particularly advantageous when a large output signal is required. Any mirror galvanometer or visual-display recorder may be used with this arrangement. Using an SKD-O seismometer, a long-period seismograph with a response characteristic of 12-230 sec is developed. Maximum sensitivity is 2 x 10~2 v/^and the peak magnification is 2 x 10^, with a dynamic range (at maximum sensitivity) of 40 dt.
To reduce the problem of increased noise effects in the long-period sector of the curve of a long-period seismograph, a long-period discrete-band seismic recording unit was developed. In this unit, the operating frequency range is broken up into sufficiently wide discrete bands, with the magnification in each band related to the noise spectrum curve for the band. This unit useö an FI-2 double integrator and an SKD-O seismometer. In the discrete-band filter set, each filter has one output for velocity and one for motion (displacement), and consists of 10 L-filters. Within each discrete channel, four filters shape the short- period slope, two shape the long-period slope, and four shape the flat portion of the response curve. Instrumental noise (reduced to the input) and the dynamic range are the same as for the long-period velocigraph.
Using SVK-3M seismometers, three of the above-described systems (the velocigraph, the wide-band, long-period seismometer, and the discrete-band seismic recording unit) were assembled and tested at the Sochi observatory.
s
:
-39-

mmmmmmmmmmmmmmmSmmiKBm:-^
SELF RECORDING SEISMIC BUOY SYSTEM t]
Zverev, S.M., V.S. Novikov, G.N. Akimov, Yu. M. Afanas'yev, S.A. Kastorskiy, and V.M. Shablltskiy. IN: Izvestiya, Fizika zemli, no. 5, 1971, 102-113
Following a brief discussion of the state-of-the-art and shortcomings of Soviet and non-Soviet buoy systems and ocean bottom seismographs used in marine deep seismic sounding (MDSS), the authors describe the ABSS* self- recording seismic buoy system. This system has been under development by the Institute of the Physics of the Earth since 1965. Ärphasis in the design aspect was placed on (1) the development of a highly^fcurate thermostatted quartz clock capable of operating over a 15 day period v»th drift not exceeding + 0.01 sec for that period and (2) the development of JaJpre effective hydrophone suspension system to improve noise decoupling. The lÄrophone uses either a lead titanate or lead zirconato-lead titanate transduqpr and a tube-type preamplifier. Hydrophone response is flat from 2-3 Hz, and its sensitivity (with the preamp) is 40-50 ^v/dyne/cm^. Dynamic range is 120 db. The design calls for three parallel amplifiers with gain of 1000, 30, and 1 and flat response in the 2-1000 Hz range. Amplifier outputs are connected to three magnetic-tape recording heads which are biased at 1500 Hz. The low-speed (1 mm/sec) tape recorder has four channels, with the fourth used xor precision time "eferencing. Tape capacity is 360 m and the system is capable of 3-4 days of continuous operation. Some of the system's specifications are as follows:
Recording range 2-.40 Hz 2
0.5 dyne/cm Minimum recordable signal Dynamic range at 3 magnification 'evels 80-100 db Maximum time correlation error + 0.01 sec Power consumption:
Recorder 1 w Clock (at 30oC) 1.5 w Clock (at 0oC) 2.5 w
Casing diameter 180 mm Casing length 1500 mm Weight 60 kg Maximum operating depth (casing) to 200 m Normal operating depth 6C m
* Developed by the Special Design Bureau of the Institute of Physics of the Earth and also called the AS-4S buoy system.
-40-

■■pni ■ Oipjawwg»'
K
A PRB-66 seai-ch/recovery radio buoy with a radio-detection range of 50 mm and visual (Ught-slgnal) detection range of 4nm Is used with the ABSS system. Under radio control by the ship, the operating endurance is up to 15 days. In continuous operation, its life is 2 days.
The precision time scaling system in the ABSS consists of a quartz oscillator in an active thermostat, a frequency divider, and a coding unit. Signals (100 Hz) from the oscillator leave the frequency divider as second and minute ticks which are fed to the coding unit consisting of a 15-digit, flip-flop counter and a circuit for controlling the polarity of the 15-second ticks following each minute tick. The clock is compared with a precision time reference Just before and after its use with the buoy system. The results of laboratory and field tests of a prototype clock showed that the interpolation error in computing clock drift over a 15-day period and, subsequently, the error in referencing the clock to absolute time, does not exceed +0.01 sec, for ambient temperature variation from 0 to 30° C.
Major emphasis in the article is on the development and testing of a noise-suppressing suspension system for the hydrophone (see Figure 1). The basic suspension system was designed by S.M. Zverev and V.S. Novikov and it was patented by them in 1967. The original patent abstract* describes the system as being comprised of multiple components differing in their degree
of elasticity. A nonstretchable, flexible line (not shown in Figure 1) is attached parallel to each component in the system. The length of this line is approximately equal to the total stretch limit of the suspension system. Tests were made with two basic suspension- system configurations : (a) usiag the above- described suspension between the surface float and the Instrumentation casing, with a conven- tional, neutrally buoyant link between the hydrophone and the instrumentation casing (a Li Figure 1) and (b) using the above- described suspension troughout (b in Figure 1).
The following tests under various full-system configurations were made: (1) When the ABSS was tethered to a drifting ship (2 knots), the amplitudes
of various frequency components of background noise were 80-150 dynes/cm^. With cable slacking and for the best case, noise was reduced 15 times to about 5-12 dynes/cm^ or 2-4 times above expected regional background noise. High noise values at 15-20 Hz were encountered and are attributed to ship noise.
(2) The ABSS was attached to a moored buoy in a 1-1.5 knot current. On one seismogram, the background no^se varied by a factor of 3, and from tape to tape, by as much as 5-8. In the range of deep seismic wave frequencies, the background did not go below 5-7 dynes/cm^ and it was generally equal to
Figure 1. Noise suppressing suspension system for the hydrophone
♦Author Certificate No. 200792, published in Izobreteniya, promyshlennyye obraztsy, tovarnyye znakl, no. 17, 1967, 85.
-41-

■
15-20 dynes/cm . With this system configuration, the noise component values in the 15-20 Hz range were several times less than those observed with the ship and cable and were close co the regional noise values, thu3 showing the moored system as being suitable for observations in that range of frequencies.
(3) The ABSS was arranged as shown in Figure lb, with the hydrophone placed in a fairing consisting of a casing identical in size to the instrumentation casing. The surface float was a small freely drifting buoy. In this test, the sea state reached 4-5 Beaufort. The variation in background noise among several recordings did not exceed a factor of 2 and, in the seismic frequencies, the noise remained at 2-4 dynes/cm2. A comparison of these results with the best-case ship test indicates that the suspension system provides the same beckground noise values in the 4-8 Hz range and even better results in the 15-20 Hz range. A similar test with an unfaired hydrophone produced a 3-10- fold increase in background noise. This was due in part to a 0.5 knot difference in relative hydrophone motions.
(4) Further tests indicated that low background noise is encountered when the diameters of the instrumentation casing and hydrophone fairing are large, and the surface float is small. In this case, the background level is almost independent of weather conditions. In a moored system, these dimensions are of no consequence, since the noise level is related primarily to the water flow velocity around the hydrophone.
In evaluating the effectiveness of the ABSS system, the two major noise sources — sea surface waves and horizontal flow around the hydrophone — are considered. To suppress surface-related noise, the use of the elastic suspension system is recommended, with the hydrophone and associated rec- " ;quipment placed at the recording depth (60-70 m). Flow noise decoupling is a more difficult porbJem; however, it can be improved by using large casings for the instrumentation and the hydrophone. In this way, the casings act as "drogues" in the horizontal currents and better coupling between the equipment and the water is effected. Added to this is the use of a small surface float less subject to wind drift.
The ABSS self-recording seismic buoy was used in 1967 in the Indian and Pacific Oceans. The configuration shown in Figure la was used with a moored buoy to record seismic waves from explosions (MDSS) and local earthquakes in the central part of the Indian Ocean. Four hundred and eighty-seven local earthquakes were recorded during 4 days of continuous recording. It was determined that, for the first onsets (P waves), the amplitude at 18 Hz exceeds the lower frequency amplitudes. For S waves (propagating as compressional waves in water), the amplitude correlation depends on the difference between S and P waves . For ts - = 6.0 and 7.6 sec, the correlation between S and P waves is inverse, i.e., as the distance increases, lower frequencies predominate in the S waves and the P waves retain their high-frequency characteristic.
Deep waves from explosions were recorded coincident to earthquakes and under the same conditions. It is known that seismic-wave amplitudes differ very little at distances 20-25 km. In this case, the background noise was less stable than the seismic wave amplitudes. A high degree of background noise limited the recording range of seismic waves to 30-40 km (for 25-kg charges).
-42-

tämmmmmmmmmom .....,,. -..;.,|,.,V.;iS......,.,,.
In the fall of 1967, the system illustrated in Figure lb was used with a drifting buoy. Using 130-kg charges, a 130-km-long profile was run off the coast of Kamchatka. Seismograms from the Pacific Ocean tests are given, in which the arrivals of acoustic waves and seismic waves from explosions are clearly visible. Interesting recordings were made of high-frequency waves arriving at 5.4-6.0 - 8.2-9.5 and 10-8 minute intervals after the arrival of the acoustic waves. Preliminary evaluation attributes these to waves reflected from the steep slopes of the Kurile-Kamchatka and Aleutian deep-sea trenches. In effect, these waves, propagating through the water, are noise. When explosions are repeated every 5 minutes, these waves superpose on the seismic waves from subsequent explosions and make discrimination difficult.
■43-
N
MICROSEISMS
SPECTRAL COMPOSITION OF MOTION DURING A MICROSEISMIC STORM [AS]
Genschel, G. IN: Deutsche Akademie der WiSi enschaften, Berlin. Institute fur Geodynamic Jena. Veröffentlichungen. [Series] A, no. 13, 1969, 39-43 (In German)
The spectral composition of microseismic motion during a microseismic storm which occurred on 15 November 1966 and was recorded by identical instruments at three GDR seismographic stations is investigated. The variation of the spectral composition of motion makes it possible to Investigate the development of the microseismic Ftorm. It was established that the spectra computed for different components during tue same periods of time coincide. The correlation coefficients computed for spectra of the three stations are between 0.97 and 0.99. The predominant spectral periods vary between 8.2 + 0.4 and 5.8+ 0.4 sec.
PROPAGATION OF MICROSEISMIC MOTION IN AN ISENTROPIC MEDIUM IÄS]
Tabulevich, V.N. IN: AN SSSR. Izvestiya, Fizika zemli, no. 9, 1970, 72-75
The microseisms propagating along and perpendicular to the principal geological structures with the Baykal rift zone and the Caspian Sea are investigated. The location of sources of storm-generated microseisms in the Caspian Sea, corresponding to tne regions of standing waves, is determined by analyzing weather maps of the Caspian Sea and the sea swell determined from Shuleykin formulas. These data were determined to be in good agreement with the results of analysis of amplitudes of microseisms recorded by a number of seismographic stations. It is shown that a decrease of amplitudes of microseisms is proportional to the distance from the source raised to a power of n, where n = 2.2 and 0.7 for directions of propagation along and perpendicular to the trend of the Greater Caucasian Ridge. The similarities in propagation of microseisms and shallow earthquake generated surface waves is pointed out. Analogous results were also obtained for sources of microseisms in the Baykal rift zone,
PRECEDING PAGE BUUK
-45-

.. ,.-
SEISMIC EFFECT OF TROPICAL CYCLONES* [T,AS]
Vinnik, L.P. IN: ANSSSR. Doklady, v. 194, no. 4, 1970, 815-817
It was recently shown \1,2] that a considerable part of energy of micro- seisms within quiet intercontinental regions is carried by compressional waves with a very high apparent velocity. Eventhough the earlier data made it possible to assume that sea waves are the principal source of microseismic compressional waves [l], as yet nothing definite is known concerning the origin of these waves. In this paper, we shall describe cetain results of investigations of sources of n^croseismic compressional waves, using data obtained by analyzing the structure of microseisms previously published by the author p] . The method of analyzing the structure of microseisms is basically a wave number expansion of random field. If peaks occur in statistical spectra of wave numbers u)i and («o. they are connected with relatively intense plane waves existing in the wave field. In the case of a wave with an angular frequency v, one measures the apparent velocity u and propagation azimuth a:
? 2 2 u= v/Uj + iu2) ; 0-= arctan (u^/u^)
The epicentral distance can be estimated from the apparent velocity of the compressional wave. The azimuth and epicentral distance are determined by the position of the source.
We have determined source coordinates of compressional waves using 5 seismograms of 4-6 sec microseisms recorded during different days in October 1961 by seismic stations in the region of Ust'-Kamenogorsk . The 70% confidence Interval in evaluating epicenter coordinates at a distance of about 10^ km was determined approximately to be a circle with a radius of 1500 kir.. It should be noted that a few quite obvious improvements could increase the accuracy of determining the epicenter by this method to 300-500 km.
A comparison of epicenters of microseismic compressional waves with weather conditions has established that one of the primary sources of these waves is the tropical cyclone (typhoone) in the Pacific Ocean. As an example, we will consider a very simple case. Figure 1 shows a world weather map for 240000 GT, 5 October 1961. A single compressional wave with its epicenter in the equatorial region of the Pacific Ocean (epicentral distance of about 9000 km) can be clearly identified from the records of microseisms acquired during that day. The weather pattern on that particular day was very simple. The only disturbance, tropical cyclone Violet (the center of which was at 18° N, 143° E), was observed in the large ocean area surrounding the epicentral zone. The small difference between the position of the typhoon and the epicentral zone can probably be attributed to an error in evaluation of the epicentral distance.
* Translation.
-46-
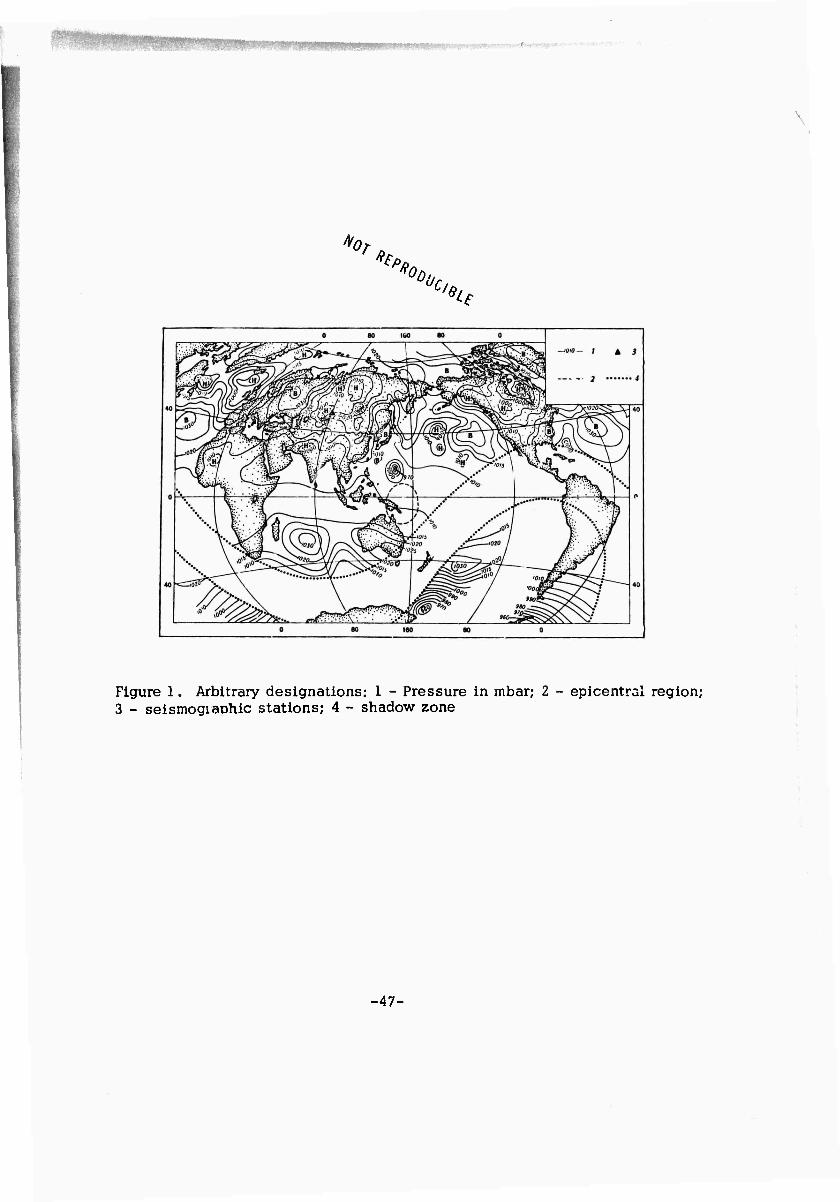
<
^ ^ep V %
^
Figure 1. Arbitrary designations: 1 - Pressure in mbar; 2 - epicent-i reainn- 3 - seismogiaphic stations; 4 - shadow zone epjcentrai region;
-47-

- - ■ +
The source parameters can be evaluated from the amplitude of the compres- sional wave. For this purpose, we will utilize an expression for average
acting at Jvt intensity of a compressional wave radiated by vertical force P e the circumference of a small disc located on the surface of a solid hemisphere [4];
6W= TTf2m4Pj: [$(e) ]2cos e de/pa3, (1)
where 6W is the average intensity radiatec' into a ray tube with a small solid angle de where e is the angle with the horizontal axis, equal to TT/2 for an axis directed downward; |$(e) | is the indicatrix, which in the case under consideration is approximately equal to 0.05, p is the density, a is the velocity of the compressional wave, f = V/2IT , and m is the velocity ratio of shear with compressional waves. Although in the case under consideration the pressure is applied to the surface of the water layer, sufficient justification exists for the assumption that the formula being used will provide a good approximation. On the other hand,using the formula developed in C5], we can write:
2 2 r 6W= 2TTR sin Asin e pa V exp{vldt/Q) |dA|, (2)
where R is the radius of the earth, A is the epicentral distance, V is the mean square of displacement velocity in the incident compressional wave at the point of observation, t is the travel time along the ray, and Q is the Q-factor. In addition to this, we know that
2 2 - sin e IdA |=R(tan e - sin e)2
cos el de' a |d2T/dA2| (3)
2 2 where d T/dA is the second derivative of travel time of the compressional wave with epicentral distance. Using formulas (1), (2), and (3), we get
"0 = 2R3
02a3
V2 2 P 2
sin Aexp(Wat/Q) (tan ( [f(e)]2f2m4 |d2T/d&2|
2 i sin e)2
Substituting the values of a, a, m for the average crustal parameters, the values of sin A, tan e, sin e, |d2T/dA2 I, Jdt/Q for A= 80° , f = 0.2 Hz, V2 = 10"^ cm2/sec"2 determined from the results of our observations into the above formula we find that P »6.5 x 10¹⁶ dynes.
We will use the well-known Longuet-Higgins theory. The area of a storm can be divided into a large number of small, independent radiators. The total force depends on the total area of the storm, the average height of waves within opposed groups h, and aiea Q occuppied by each group within
-48-

W^fK^smsmmmKmmmmmK^ifiK^^i^mm^-f'1-
\ a wave number plane. Then,
P0«4TTfbh2v0
2(S/n)\ (4)
3 where PQ = 1 gr/cm is the density of water, VQ = ZTT/TQ, and T« is the mean period of sea waves. Within the central part of the cyclone the energy of waves can be divided approximately equally between all directions. Assuming that the range of wave periods varies between 8 and 12 sec, n= 0.5 x 10~6cm~2 and vn « 0.63 sec-1. Substituting? = 6.5 x 10¹⁶ dynes
into formula (4), we find that h^S2 »5.8 x 10lzcm . In particular, assuming that h = 3 x 102cm; S « 4 x 1015cm2 = 4 x 10⁵km2. These computations ar^ in good agreement with actual dimensions.
It is known that when a vertical force is applied to the surface of a solid hemisphere, 68% of the seismic energy will be expended in generating Rayleigh waves and only 7% in generating compressional waves [4] The presence of the water layer increases the amount of energy spent in generating a surface wave by approximately an order of magnitude. Geometrical spreading of the wave front and the associated decrease of amplitude with distance for surface waves is considerably smaller than it is for compressional waves. Nevertheless, when the source is far out in the ocean, long travel time, low Q, and variation of curstal structure result in total attenuation of the seismic surface wave. This explains the failure of numerous attempts for an early detection of cyclones over the ocean using surface waves. In «ddition to this, in most cases observations were conducted near coastal areas where the high level of coastal noise prevented extraction of weaker phases from distant sources.
REFERENCES
1. Vinnik, L.P. IN: AN SSSR. Doklady, v. 162, no. 5, 1965
2. Vinnik, L.P. Papers presented at the Ninth Assembly of the European Seismological Commission, Copenhagen, 1966
3. Vinnik, L.P. Structure of microseisms and certain problems of arraying in seismology (Structura microseysm i nekotoryye voprosy metodiki gruppirovaniya v seysmologii), Izd-vo "Nauka," 1968
4. Miller, G.F. and H. Pursey. Proceedings of the Royal Society, Series A, v. 233, no. 1192, 1955
5. Kogan, S. Ya. AN SSSR. Izvestiya, Seriya geofizicheskiya, no. 5, 1960
6. Bullen, K.E. An introduction to the theory of seismology, Cambridge University Press 1963
7. Longuet-Higgins, M,S. Philosophical transactions of the Royal Society, v. A 243, no. 1, 1950, 857
-49-
•

mmmmmmmm^
PROCEEDINGS OF CONFERENCES*
Seismic Sources and Focal Mechanism Determinations
TECTONOPHYSICAL EVALUATION OF STRESSES IN THE EARTH'S CRUST I^S]
Gzovskiy, N.V. IN: Lectures presented at the All Union Conference on Rock Mechanics, (Doklady Vsesoyuznoy konferentsii po mekhanike gornykh porod), Apatity, 1970, Z-26
The problems connected with the distribution and evaluation of the maximum shear stresses wlrhin the hypocenter of a crustal earthquake are discussed in connection with evolution of tectonic processes. It is pointed out that the maximum shear stresses can be evaluated from energy of elastic waves radiated by foci of strong earthquakes. In seismlcally and tectonically active regions the energy of earthquakes reaches 10-^ - 10^ J. Therefore, an expression for the maximum stresses can be derived on the assumption that they are distributed equally Inside the focus in the form Tmax =(2 GUs/v)2, where G is the arbitrarily instantaneous elastic, shear modulus; Us is the energy of the earthquake; and v is the assumed volume of the hypocenter. Seismological methods do not take into account the fraction of energy expended in pla-stic deformation of the crust and rupturing inside the focus, thus leading to a smaller value of computed stresses. Tectonophysical methods of evaluating stresses are based on investigations of regularities in tha state of stress around the rupture of the earth's crust. In doing so, one rejects the hypothesis of simultaneous stress release inside the focus, a fact completely substantiated in laboratory investigations by the polarization optical method. Laboratory experimentis on models made from optically active materials have established that stresses around a rupture (model of a focus) are not distributed equally. The greatest amount of stress release occurs near the central part of the rupture, while a considerable Increase in stresses occurs near its ends. The maximum shear stresses characterize approximately the deviatoric part of the stress tensor, In order to evaluate the state of stress of rocks in geophysics and in mining, in the first approximation one assumes that the spherical tensor (3 dimensional pressure) coincides with the hydrostatic pressure. The author shows that as a result of considerable shear stresses existing in the earth's crust, this assumption is not fulfilled. Homogeneous and heterogeneous tectonic stress fields within the USSR are analyzed and the upper limit of maximum shear stresses in the earth's crust within the USSR and the direction of principal stresses at earthquake hypocenters are plotted.
* The conference papers abstracted in this section are unavailable to the Editor. The abstracts of these papers were taken from "Referativniy Zhurnal, Geofizika" and "Referativniy Zhurnal, Mekhanika" and occasionally from other sources.
PRECEDING PAGE BUNK -51- "
,

^ "^K;
Seismic Wave Parameters
THE SPECTRA OF P AND PS PHASES GENERATED BY EARTHQUAKES AND EXPLOSIONS. SPECTRAL CONTENT OF THE BACKGROUND IN THE CARPATHIAN REGION DETERMINED FROM RECORDS OF "ZEMLYA" SEISMIC SYSTEMS (AS]
Kutas, V.V. IN: Lectures presented at II and III Scientific Technical Conference of Young Ukrainian Geophysicists), (Materialy II 1 Til nauchno- tekhnlcheskoy konferentsly molodykh geofizikov Ukrainy), 1966-1968. Kiev, Izd-vo "Naukova dumka," 1968, 122-124
Seismograms of earthquakes with energy E = 10^ and 10^ I recorded at ep<central distances A = 0.5, 9, 9.5, 11.5, 21, 75, 77, and 134° were used in computing the spectra of refracted P and converted PS phases. It was determined that the shape of the spectra of refracted P phases from near and distant earthquakes is analogous. A clearly defined principal peak on the spectral function appears at frequencies of 1 - 1.5 Hz and a single or several secondary peaks also appear at frequencies of 2-5 Hz. The amplitude spectrum 15(f)] of the secondary peaks is between 0.5 and 0.2 of that for the principal maximum. In comparing the spectra from the same focus a connection was noted between the energy and frequency of the maximum of the amplitude spectra, i.e., higher frequencies appear in spectra of weaker earthquakes. The principal shock displays a sharper peak, the intensity of [S(f)]max for the spectral peak of the principal shock is three times larger than that for aftershocks, and the frequency of the spectral maximum is 0.2-0.3 Hz lower than for aftershocks. In comparing the amplitude spectra of earthquakes with different epicentral distances it was established that the frequency of the peak in spectra of strong distant earthquakes (E al016D occurs at 0.5 and 0.75 Hz U « 80°); for distant weak shocks (E = 1013J), at 1.0 and 1.6 Hz; for near strong earthquakes, at 0.9 and l.l Hz (A= 10-15); for near weak earthquakes, at 2.1, 3.2, and 3.5 Hz; and for local earthquakes, at ~ 4 Hz (A« 0.5°). In respect to its shape, the spectra of converted PS waves with Atpg_p = 1, 1.3, 1.8, and 5-6 sec is analogous to the spectra of refrac ;ed waves. The ratio of intensities of [S(f)]max
of converted with refracted waves varies between 0.56 and 1.66. The frequency of the peak of the spectral function for PS phase is equal to or is greater than for the P phase and their ratio varies between 1 and 0.7. The principal peak of the spectral function of onsets of P generated by explosions fired during deep seismic sounding at epicentral distances of 12, 20, 25, 50, 80, and 90 km has a smoother shape in comparison with spectra of earthquake generated P phases. and is characterized by an absence of secondary peaks. The frequency of the peak of the spectra of converted waves is almost identical to that for P. Some of the converted phases are more intense and others less intense than P waves. The spectral background of noise which includes external noise and instrumental noise connected with magnetic recording, transcription, and amplification of signals was also investigated. The intensity of the background noise was found
-52-

\ '
to be 0.3-0.005 of the intensity of earthquake generated P or PS. The frequency of the peak of the spectral function of background (3.5-4.8 Hz) is 2-3 Hz higher than for earthquake generated P and PS phases and coincides with secondary, very low intensity spectral peaks. Thus, the principal peak of spectra for near and distant earthquakes remains undistorted. It was established that the back- ground exerts considerable influence on records of weak shocks and weak near and local earthquakes. This was attributed to the fact that the frequency range of the background and of weak explosions and of weak near and local earth- quakes coincide, making it difficult to extract the seismic signals from the background noise.
-S3-

>hock Waves
STRUCTURAL CHANGES ASSOCIATED WITH THE EFFECT OF SHOCK WAVES TRANSMITTED THROUGH A SINGLE CRYSTAL ^ ]
Adadurov, G.A. and V. Sh. Shekhtman. IN: The Second All Union Symposium on Combustion and Explosion (Vtoroy vsesoyuzniy Simposium po goreniyu i vzryvu. Author's abstract of the paper), Chernogolovka, 1969, 275-277
The results of shock experiments on single crystals of copper and molybdenum are briefly described. The shock waves are generated by impact- ing one mm thick aluminum flyers on 3-5 mm thick specimens. In these experiments, the pressure reached in copper and molybdenum was 517 and 455 kbar, respectively. It is noted that to some degree the monocrystall*ne material was changed to polycrystallinr material. This effect decreased with the depth from the surface at which the shock wave impacted the specimens,
THE IMPORTANCE OF DSHEAR] STRENGTH DURING UNLOADING OF SHOCK COMPRESSED MEDIUM S]
Novikov, S.A. and L.M. Sinitsyna. IN: The Second All Union Symposium on Combustion and Explosion (Vtoroy vsesoyuzniy Simposium po gorenyu i vzryvu. Author's abstract of the paper). Chernogolovka, 1969, 283-286
It is pointed out that in considering attenuation of strong shock waves it is necessary to take into account the shear strength of materials. It is noted that the critical shear strength c^ behind the shock wave increases with pressure. The results of experiments on aluminum (ac = 12.5 - 22 kbar) and copper (29 - 41 kbar) are described. The fact that ac for lead is equal to zero is attributed to melting. It is also noted that the critical shear decreases with temperature, which is quite high behind the shock wave.
-54-
Surface Wave Dispersion
DISPERSION OF SEISMIC SURFACE WAVES AND THE CRUSTAL STRUCTURE OF SOVIET CARPATHIA IAS ]
\
-
Volosetskiy, B.I. IN: Lectures presented at II and III Scientific Technical Conference of Young Ukrainian Geophysicists(Materialy II i III nauchno- tekhnicheskoy konferentsiy molodykh geofizikov Ukrainy), 1966-1968. Kiev, Izd-vo "Naukova dumka," 1968, 133-134
The dispersion of seismic Love and Rayleigh waves was investigated using the records of the network of seismographic stations in the Carpathian region. The phase velocities were determined along the lines between Lvov-Uzhgorod, Lvov-Chernovtsy, Uzhgorod-Kosov, Uzhgorod-Chernovtsy, and Rakhov-Kosov. The phase velocity dispersion was compared with theoretically computed dispersion for a three-layered crustal model. The data acquired indicate that the crustal thickness Increases from 40 km in the southwestern part of the Russian plateau to 50-55 km under the folded Carpathian Mountains. The data on short-period seismic surface waves indicate that the thickness of the sedimentary layer within the southwestern part of the Russian platform is about 5-7 km and that it Increases to 12-15 km under the Carpathian Ridge.
-55-
.
Theoretical Seismology
INVESTIGATION OF RAYLEIGH WAVES FROM A N OVING SOURCE IN A NON-IDEAL ELASTIC MEDIUM Cr]
Molotkov, L.A. IN: The IV All Union Symposium on Propagation of Elastic and Elastic-Plastic Waves. Abstracts of papers ^TV Vsesoyuzniy Simposium po rasprostraneniyu uprugikh i uprugo plasticl^skikh voln. Tezisy dokladov). Kishinev, 1968, 62
Rayleigh waves generated by a moving source and propagated In a homogene- ous elastic half space are anal zed. The source is attached to the circumference of a circle expending in accordance with an arbitrary law. An exact solution of the problem is obtained using integral transformations. Analysis of the field obtained shows the existence of primary waves formed initially and secondary waves formed at later times. Asymptotic expressions are obtained for primary and secondary Rayleigh waves in both ideally and non-ideally elastic media. The asymptotic formulas are used to derive equations for the wave fronts of Rayleigh waves and the time between the onset of primary and secondary waves. Numerical computation anc qualitative analysis revealed the shape of the synthetic Rayloigh wave seismograms. The variation of the amplitude and the period with distance, depth, and attenuation factor was also determined. The conditions required for superposition of primary with secondary waves are established.
CERTAIN PROBLEMS OF PLANE WAVE PROPAGATION IN ANISOTROPIC MEDIA Cr]
Mukhammadiyev, K. and I. G. Filippov . IN: The IV Al! Union Symposium on Propagation of Elastic and Elastic-Plastic Waves. Abstracts of papers (IV Vsesoyuzniy Simposium po rasprostraneniyu uprugikh i uprugo plasticheskikh voln. Tezisy dokladov). Kishinev, 1968, 64
Wave propagation in an anisotropic elastic layer of soil overlying a rigid base (rock), when a predetermined vertical or horizontal displacement of particles of the medium takes place along the boundary between the soil layer and the rock at a constant speed, is analyzed. It is pointed out that problems of this kind can be used to Investigate the effect of underground disturbances (the effect of earthquake hypocenters) on the displacement of particles of the medium at the free surface of a layer.
-56-
■...i~i«,,,,.,
-
NONSTATIONAPY SH WAVES IN AN ELASTIC SPHERE WITH A WAVEGUIDE ET]
Mukhina, I.V. IN: The IV All Union Symposium on Propagation of Elastic and Elastic-Plastic Waves. Abstracts of papers fIV Vsesoyuzniy Simposium po rasprostraneniyu uprugikh i uorugo plasticheskikh voln. Tezisy dokladov). Kishinev, 1968, 65-66
An analysis is presented of wave propagation in waveguides. The author considers an elastic sphere r = R with elastic constants X , u, and density p assumed to be functions of r only. Axial symmetry is also assumed. The time variation of the point source is given by Dirac's delta function 6(t). i Several models are considered: the velocity of shear waves b(r) = [Mrt/p (r)]2
is continuous and has a smooth peak at r = Rj < R; the velocity b(r) is dis- continuous at the peak at r = Rj < R in such a manner that b(Rj + 0) >b(Rj - 0); the source is located at the surface of the sphere, or inside the waveguide at r = Rs < Rj. The displacement field V(r, ®, t) obtained by solving Lame's equation for SH phases is investigated. Except at the source point, the surface of the sphere is stress free. The analysis is based on asymptotic expansions in terms of the distance to the wave front Y = t - r(r, ®), where r(r, ®) is the eikonal. In the case when b(r) is a continuous function, the problem is solved in the ray approximation and the validity of the formulas obtained is evaluated. It was established that when bOr) is discontinuous,a shadow zone is formed and the ray approximation can not be used to investigate grazing waves propagated in the shadow zone. Formulas for these waves were obtained form standard problems using the localization principle. It was established that in the shadow zone and outside of it where the ray tube expands considerably, the field intensity is weak. However, the wave fields differ greatly in respect to their properties. The ray solution and formulas for grazing waves provide an evaluation on both sides for solution of the case when b(r\ is weakly dis- continuous .
ON THE PROBLEM OF REFLECTION OF ELASTIC WAVES FROM A PLANE BOUNDARY IN THE CASE OF GRAZING INCIDENCE [J]
Ogurtsov, K.I. and Kh. M. Imenitova. IN: The IV All Union Symposium on Propagation of Elastic and Elastic-Plastic Waves. Abstracts of papers (IV Vsesoyuzniy Simposium po rasprostraneniyu uprugikh i uprugo plasticheskikh voln. Tezisy dokladov). Kishinev, 19ü8, 70
A grazing plane wave along a plane, stress free boundary can most simply be generated by means of an equally distributed interaction at one of the two planes of a bench. Certain interactions of this type can generate wave fields in the corner area, which prior to the arrival of reflections from other boundaries are equivalent to corresponding theoretical solutions for quarter space, subject to certain mixed boundary conditions. Such solutions can be obtained from solutions for a half space by superposing a series of nonstationary waves excited by moving sources on the Incident grazing wave. As a result, the effect
-57-

■ *mimmmmmmmmmm^^^m^^^^^^^ ■
of "stationary reflection" of the grazing plane wave Is manifested after a long period of time in the form of solutions corresponding to sources moving with the velocity of shear or compressional waves.
WAVE MOTION IN AN ANISOTROPIC HALF-SPACE CAUSED BY A ROTATIONAL PULSE APPLIED AT ITS SURFACE U]
Sabodash, Yu. F. and I.G. Filippov. IN: The IV All Union Symposium on Propagation of Elastic and Elastic-Plastic Waves. Abstracts of papers (IV Vsesoyuznly Simposium po rasprostraneniyu uprugikh 1 uprugo plastlchesklkh voln. Tezisy dokladov). Kishinev, 1968, 86-87
Wave propagation in an anisotropic half-space is considered. The waves are generated by a rotational pulse applied Instantaneously to the surface of a half-space. Assuming that the anisotropic half-space has a symmetry axis in respect to mechanical properties, the problem can be reduced to the determination of the only component of the displacement vector u@ differing fAam zero (cylindrical coordinates are used with z being the axis of symmetry and the surface of the half-space being given by z = 0). An exact solution Is obtained in the case when the stress r QZ= cp(t) . In the more general case,
solution is obtained by series expansion of the boundary function. It was determined that a plane elastic wave followed by a wave of the type of a semiellipsoid of rotation (a type of diffracted wave) Is propagated in the anisotropic half-space. Computations were performed to determine the stresses Tr(g|önd Tzg in the disturbed area.
ELASTIC WAVE PROPAGATION IN A SPHERICAL LAYER TAKING INTO ACCOUNT THE PHYSICAL NONUNEARITY OF MATERIAL [T]
Sabodash, P.P., I.G. Filippov, and I.A. Tsurpal, IN: The IV All Union Symposium on Propagation of Elastic and Elastic-Plastic Waves. Abstracts of papers (IV Vsesoyuznly Simposium po rasprostraneniyu uprugikh 1 uprugo plastlchesklkh voln. Tezisy dokladov). Kishinev, 1968, 87
Propagation of spherically symmetric waves In a spherical elastic layer Is analyzed. The waves are generated by a uniform nonstatlonary pressure applied to points at the sphere's boundaries. It is assumed that stress and strains are small and that Hooke's law is replaced by a nonlinear elastic law. Solution of the linear problem Is obtained by sequential superposition of the problem of propagation of a spherically elastic wave in an unbound medium, generated by pressure at the wall of a cavity having a finite radius with the problem of propagation of an elastic wave inside a sphere generated by pressure applied
-58-
■ - . .

to the sphere's surface. The problem Is solved In terms of diverging and converging wave functions, taking Into account three reflections. The basic assumptions and equations for propagation of spherical waves In a nonlinear elastic medium are used to find a solution of the same problem with the physical nonllnearlty of material taken Into account.
I
-59-

■
•
Miscellaneous
CERTAIN RESULTS OF SEISMOLOGICAL INVESTIGATIONS ON THE BOTTOM OF THE BLACK SEA AND THE INDIAN OCEAN [AS]
Sedov, V.V. IN: The Fourth Scientific Reporting Conference of the Geology Department of the Moscow University. Abstracts of papers. (IV Nauchnaya otchetnaya konferentsiya geologicheskogo fakul'teta Moskovskogo universlteta. Tezlsy dokladov). Moskva, 1969, 53-54
Seismological investigations conducted in order to establish the optimal conditions for registering seismic events on the ocean bottom and the possibility of utilizing ocean bottom seismographs for solution of a wide class of seismological problems are described. The DS-l-F seismograph with a large- capacity memory was used in the experiments. The level and the frequency content of ocean bottom noise in the range of 1-20 Hz were determined at various depths and under different surface conditions. It was determined that a considerable increase in effective sensitivity can be achieved in many sea and ocean regions by using ocean bottom seismic instruments. The high effective sensitivity of the ocean bottom seismograph made it possible to obtain data on selsmiclty of different regions in the Indian Ocean during the second cruise of R/V "Akademlk Kurchatov." It is pointed out that the use of ocean bottom seismographs to investigate the crust and upper mantle structure by means of refraction surveys (deep seismic sounding) at sea expands considerably the application of this method. Its use eliminates the interfering effect of direct water waves in investigations of upper sedimentary layers, increases the number of phases that can be interpreted, makes it easier to utilize dynamic characteristics of seismic signals, increase work efficiency, etc. Deep seismic sounding in which DS-l-F ocean bottom seismographs were used was conducted in the Black Sea and the Indian Ocean rift zone.
-60-

SEISMIC SOURCES AND FOCX MECHANISM INVESTIGATIONS
POSSIBIU1Y OF EVALUATING THE (SPATIAL) EXTENT OF A FOCUS OF AN EARTHQUAKE FROM KINEMATIC DATA* [AS]
Gorbunova, I.V. and N.V. Kondorskaya. IN: AN SSSR. Doklady, v. 192, no. 5, 1970, 1033-1036
An earthquake is a complicated process of rupturing of the earth's crust or the mantle which has a considerable duration and spatial extent. Depending on the strength of the earthquake and the character of rupturing, focal regions may be quite large, reaching several hundred kilometers. Nevertheless, at the present, the earthquake focus is represented as a point hypocenter and the origin time is understood to refer to the beginning of an earthquake. These idealizations limit considerably the concepts of seismicity and seismic regime and the possibility of solving a number of problems associated with earthquake prediction.
Improvements in seismic observations and in the determination of travel- time curves of seismic waves made it possible to determine the epicenters of earthquakes with a considerable degree of accuracy, which in many cases, is believed to be+ 5-10 km. However, systematic errors existed between epicenter coordinates of strong earthquakes determined from seismograms acquired by near and teleseismic stations. On one hand this was caused by insufficiently complete observational systems (especially near the focal region) and, on the other, by inherent Inconsistency of data. Por example, earlier arrivals (by 8-10 sec) observed on the seismograms could not be correlated with data from other seismographic stations and were automatically excluded from final processing. Analysis of the causes responsible for the systematic residuals indicates the presence of several disturbance points inside one focal region.
The different disturbance points are formed during rupturing of the earth's crust as a result of an earthquake. The determination of these disturbance points requires separation of data from the general observation system into several intrinsically consistent data groups.
In this paper a method is proposed for separation of observation systems using ratios of f^, residuals of onsets of seismic waves from different hypo- centers
h = tp - v (1)
(t is the observed travel time of seismic waves and tp* is the Jeffreys-Bullen time), with a residual corresponding to any hypocenter in the focal zone. For this reason, we computed station residuals for all possible hypocenters and compared the results obtained among each other. Additional computations of station residuals were also performed for different focal depths and different ratios 6i
Öl - Ifi'/fi" (2)
* Translation. An expanded, but otherwise identical, English version of this article was published in the Geophysical Journal of the Royal Astronomical Society, v. 20, no. 5, 1970, 457-471. (Note added in proof).
-61-
■ ■■.. ■■■■ ■'■ ■■ •■■ ■'■■■■ ■ ■
■MMHMMKHI
where f^' and f," are residuals for two different hypocenters. The ratio 64 determines the behavior of station residuals for the whole system
and makes It possible to reveal the best location of hypocenters from the point of view of minimizing the residuals.
The ratio 6^ for individual stations of the system under consideration is evaluated for different focal depths. If all stations in the system recorded first onsets from the same point in the focal zone, all station values of 6^ for one of the hypocenters would be less than or equal to 1. However, if the stations recorded onsets radiated from different points within the focal zone, the station values of 6, would be Inconsistent, namely, it would be impossible to determine a single hypocenter for which all 6j[ ^ 1. For different hypocenters, 6} £ 1 for all stations. For the same hypocenter, ö^ would be less than or equal to 1 for some stations and greater than 1 for other stations. Therefore, depending on the ratio 6^, It is possible to identify systems of stations giving consistent data on onset times of seismic waves. This method can be applied to any observational system, including both near and teleseismic stations distributed sufficiently well in respect to azimuth.
Unique instrumental data for the December 10, 1967 earthquake in India in the city of Koyna acquired in the epicentre] range between 0.1° and 100° made it possible to use this method to determine two intrinsically consistent observation systems: a system of near (A<20O ) and a system of distant (A>20o) stations (see Figure 1).
Figure 1 shows individual values of 6^ computed for two possible hypo- centers. It can be seen from Figure la that observation of waves at distances A < 20° result in minimal values of %, and in minimal values of residuals for depths less than 10 km. From Figure lb it can be seen that the least values of 61 for a large number of teleseismic stations corresponds to depths of GO- SO km. The points on the surface of the earth corresponding to these hypo- center points were found to be displaced relatively to each other (Figure 2).
The accuracy evaluated in accordance with OL ] and represented in Figure 2 in the form of confidence ellipses Indicates that the descrepancy is not caused by errors in determining epicenter coordinates. The difference in epicenter coordinates can be attributed to the horizontal extent of the focal zone (20- 25 km) extending from SW to NE. The disagreement in location of hypocenters Indicates the considerable vertical extent of the fault plane from a depth of 0-10 km to a depth of 60-70 km). Figure 3 is a schematic diagram of the Koyna earthquake hypocenter.
The motion at the hypocenter occurred along an almost vertical fault plane extending from the surface tc a depth of about 60-70 km. The apparent rupture velocity determined from differences in location and the origin time of Initial and final disturbances is equal to about 3 km/sec, which is in good agreement with data given in L2-4] .
The considerable focal depth of this earthquake is verified by the following dynamic factors:
1. The ratio of maximum motion of body with surface waves determined from MpV and MJJJ in accordance with 03] has shown that the depth of the
-62-
■ •■ ■ ■■.. ,■. :...... ■ .

rmmmm?*
-63-
i
i SSL
20
IS
to
20 td
10 8 6
h-W
/^ W 8 6
A-Ä?
^ ^
^ ^/
^ X '/ ^
4-^ b
I l !■ I l I I I I 1 I I 111 I I l I I /^ 40 BO 80 W
h-iO
25
20
15
10
• «
3S\
20
15
h.60
jff tD B M tan» 91 *« «• — 20 *0 S
h-60-BO
t
iO \
20 40 SB 80 WIT M 40
15
80 IOC
nil« . •.•
—.im mfriTi i n II II n IM fi^MM MI . ' 20 40 SO 00 nor 20 40 SO 80 too'
aaateak^i. 20 48
TI.^M,M,,r
Figure 1. A plot of Individual measurements of 6i as a fUiiction of focal depth a - Epicenter no. 1; b - epicenter no. 2; fi" - residual for epicenter no. 1 (h = 0)
„--'-- ■
.'

30 45 n'o
ft or *** \ 0Üt
% ^
Figure 2. Location of epicenters no. 1 and no. 2
a - Epicenters, b - seismo- graphic stations; confidence ellipse; 1 - Arabian Sea; 2 - Mahabaleshwar; 3 - Satara; 4 - Koyna
22 km
»• ?£—C-^
Figure 3. Schematic diagram of the Koyna earthquake hypocenter
WWWWWWk 0.1m
Figure 4. A plot of differences between observed and mean surface wave magnitudes (gMi = Mi-Mave). Positive values of deviations are denoted by arrows toward the stations, negative, away from the stations
1 - Goris; 2 - Bakurlani; 3 - Baku; 4 - Kyzyl-Arvat; 5 - Frunze; 6 - Sochi; 7 - Simferopol'; 8 - Lvov; 9 - Tbilisi; 10 - Makhach-Kala; 11 - lerevan; 12 - Pulkovo; 13 - Sverdlovsk; 14 - Semipalatinsk; 15 - Tiksi; 16 - Magadan; 17 - Yakutsk; 18 - Przheval'sk; 19 - Vladivostok; 20 - Alma-Ata; 21 - Yuzhno- Sakhalinsk; 22 - Tashkent
-64-
.--^(jüeftssaiÄSui«*«

>:>^ :;-'-7. ■MMMMMHRM
hypocenter no. 2 is equal to 60 + 5 km. 2. Analysis of seismograms from 16 Soviet stations located at
eplcentral distances of 25-60° in different regions of the USSR (Soviet Central Asia, Caucasia, Turkmenia, platform regions) revealed the presence of a converted sP wave, reflected near the epicenter at a focal depth h = 65 km.
3. The ratio between different frequencies in the spectra of P determined from seismograms of the Obninsk seismographic station, equipped with SKD instruments, determined by computing a - the slope of the envelope of the spectra] function in accordance with the technique described In [6] shows that the focal depth h = 60-70 km.
The directionality of radiation of surface waves also indicates considerable extent of the focal zone. Figure 4 shows locations of seismographic stations plotted in polar coordinates, the data from which was sufficient to determine the surface wave magnitude. The mean magnitude determined from the data of 23 stations was 6.4+0.4. We have also calculated the differences between the magnitude determined from data of individual stations and the mean value (öee Figure 4).
The surface waves were more intense in the N-NE direction and weaker in the W direction.
The results obtained provide a confirmation, based on the instrumental data, oi the explanation proposed in [5]for the observed macroseismic effects of this earthquake, which did not correspond to the effects expected from a surface or a deep shock. The isoseismals are irregular, i.e., the main macroseismic effect was caused by the region of initial disturbance, located near the surface.
A system of near stations (no. 1) made it possible to determine the hypo- center of the initial distrubance. The corresponding hypocenter point on the surface of the earth coincides with the region of maximum destruction. In view of its depth (60-70 km), the termination of the process in the focal zone (hypocenter no. 2) accompanied by a large release of energy did not cause too much destmction of the surface of the earth (its intensity was less than VI.) However, its presence has disturbed considerably the usual pattern observed on the surface of the earth during a shallow focus earthquake [7].
^65-
■ • ■. :-■: ■ : ■ ■ ■■■■■■■■-■-■

REFERENCES
1. N.P. Kondorskaya. Abstracts of papers presented at the Kishinev Session of the Union of Seismology held in September 1966.
2. Press, F. Journal of Geophysical Research, v. 70, no. 10, 1965, 239e
3. Press, F., A. Ben-Menachem., and N. Tikoz. Journal of Geophysical Research, v. 66, 1961, 3471
4. L. Manstnha. Bulletin of the Seismological Society of America, v. 54, 1964, 369
5. Petrushevskiy, B.A., N.V. Kondorskaya, and N.V. Shebalin. IN: AN SSSR. Izvestiya. Fizika zemll, no. 11, 1966
6. Kondorskaya, N.V., L.N. Pavlova IN: AN SSSR. Izvestiya. Fizika zemli, no. 5, 1967
7. Gubin, I.E. Seismic Zoning of Indian Peninsula. New Delhy, 1969
8. Soloviev, S.L. and O.N. Solovieva. Studia geophysica et geodetica, no. 12, 1968
-66-

SEISMIC WAVES
Converted Waves
QUALITATIVE INTERPRETATION OF TRAVEL-TIME CURVES OF CONVERTED WAVES GENERATED BY EARTHQUAKES AND DISTANT EXPLOSIONS [T ]
Dlkgof, Yu. A. IN: Instruments, methods, and imerprotation of geophysical data (Apparatura, metodika i interpretatsiya geofizlcheskuch nablyudeniy), Kazan', no. 4, 1970, 62-81
Formulas are derived for determining the thickness of layers from the differences in onset times between converted PS and logitudinal P waves for both horizontal and sloping interfaces. In the case of sloping interfaces, the determination of depth requires the knowledge of their slopes. It is suggested that the time field method, which can only be used in cases when the azimuth of the arriving ray and the azimuth of the slope of the interface are the same, be utilized in the absence of such data. The technique of con- structing such an interface is described. When the two azimuths are not the same, it is suggested that the data from earthquakes for which the differences in azimuths in arrival of P and SP waves do not exceed 10-20° and the azimuth of the observation line is equal to the mean arithmetic azimuth of arrival of P and PS, be used. In such a case the errors arising in using the time field method are quite small.
THE IMPORTANCE OF MULTIPLES ON SEISMOGRAMS OF DISTANT EARTHQUAKES IAS]
Trigubova, K.V. IN: Geologiya I geofizika, no, 10, 1969, 99-103
The results of analysis of phases generated by distant earthquakes occurring in western Ciscaucasia and recorded by horizontal detectors of the "Zemlya" seismic systems are given. It is noted that the converted P2S1 phase recorded first on the seismograms of "Zemlya" seismic systems and formed at the basement surface or at an interface inside the sedimentary complex is followed by a large number of phases usually interpreted as being transmitted converted waves from deep crustal and upper mantle interfaces. The intensity of some of these waves is equal to or exceeds the intensity of the first converted phase. However, in the presence of low-speed sedimentary layers In the upper part of the crust, intense multiples can be generated at the basement surface and other upper crustal interfaces. Computations have shown that the converted P2P1P1SJ wave formed between the day surface and the first conversion interface should have the highest intensity in comparison with
-67-
■ ■ ■ ■
other converted multiples and that its intensity should be close to that of P2Sj. Judging by their travel times, and depending on the depth of occurrence of. an interface responsible for the multiples, the P2P1P1S1 can be erroneously identified as transmitted, converted PS waves from the Conrad and Mohorovicic discontinuities. In such a case, the true, singly-reflected, converted waves from these interfaces can not be extracted from the record. It is suggested that the intensity and travel times of principal multiples for specific crustal sections be calculated and that the corresponding sectors of the seismograms excluded from the interpretation of seismic data acquired by the "Zemlya" systems.
-68-

..-.—..■■
Seslmlc Wave Attenuation
NUCLEAR EXPLOSION GENERATED PP AND ATTENUATION OF COMPRESSIONAL WAVES IN THE UPPER MANTLE * [T,AS]
Vinnik, L.P. and G.G. Dashkov. IN: AN SSSR. Doklady, v. 190, no. 6, 1970, 1340-1343
Th-a amrlltudes of PP are analyzed using the method described In [L] which is based on the icct that the problems associated with the effects of source and the instrument can be evoided by measuring the amplitude ratios of different body phases on the same seismogram rather than thoir absolute amplitudes. A specific characteristic of body waves is a large amplitude scatter caused by a number of factors. There are reasons to believe that the amplitude of a seismic wave being a random quantity obeys a lognormal distribution. In such a case, the only dat^ that can be extracted *s the average p, and variance a^ of the logarithm of the amplitude ratio (averaged over source and station coordinates). Owing to the amplitude scatter, a later arriving phase can be extracted from only a part of a seismogram. In such a case p, and a^ can be found using the method described in [1] .
In those N cases when both phases can be extracted, we measure pi - their amplitude ratio. In M cases, when one of the phases is obscurred by the background noise, we measure ai, amplitude ratio of the background with the amplitude of the extracted phase.
The jo. and a parameters can be determined from the maximum of the likeli- hood function:
N M . /i « \2 _ log at-V-
L(u.a)--yr!l!l2: _Nloga + y log [1+ «( V^ + C' ^ 2CT2 " ^ (2a) *
1=1 ZCT J=l
(1)
X 2 2 P -t where $(x) ■ T— J e dt • and c is the normalizing constant.
. (")* 0
The average ratio of energy flux densities X can be found from the following formula:
X2 = exp (n+ a2 - 2 a2) ,
where ap is the variance of a logarlth of the amplitude of a wave appearing in the numerator of the ratio. For underground generated compressional waves with a frequency of about 1 Hz ap2 is estimated to be 0.3-0,4.
We will use the results of analysis of seismograms of underground nuclear explosions fired at different test sites and recorded by short-period Instruments installed at USSR seismographic stations. All data are indpendent in the
Translation. —69—

• MM
sense of [1]. The predominant frequency of compresslonal waves is always about 1 Hz.
Figure 1 shows the results of measurements of App/Ap. A plot of the function given by formula (1) for A= 28-37° is shown in Figure 2. It was determined that in this case ^, a, and K are 1.35, 1.1, and 0.45, respectively. In the range of epicentral distances between 85 and 101°, it was determined that IO, =-1.5, a= 1.0, and X= 1.27. In other epicentral distance ranges where the number of values of ß is small, evaluation of u., and especially of a , is unreliable. In the range of A between 85 and 101° the ratios of App/Ap vary with the epicentral distance, therefore, evaluations of \i. and o in this case are strictly formal, and the values of a are too high. Analogous computations of PcP phase reflected from the core have shown that a »1.3 [1] , and the values of a pcp was determined to be three times greater than that of op2. This result seems to indicate the presence of a lateral inhomogenlous zone at the bottom of the mantle. The scatter of amplitudes can be considered as an Indicator of the degree of lateral inhomogenelty, where the latter term is used in a broad sense of both inhomogenelty and Irregularity of the reflector (in those cases when we are discussing reflections). A comparison of data on the scatter of amplitudes of PP and PcP waves makes it possible to assume that in respect to the degree of lateral inhomogenelty, the zone at the bottom of the mantle is comparable with that of the crust and the upper mantle.
Analysis of the amplitudes of PP phases makes it possible to approach the problem of absorption of compresslonal waves in the upper mantle. The difficulties associated with this problem are first of all connected with the fact that variation of the amplitude of the refracted wave with distance depends not only on absorption but also on the geometrical spreading factor. Taking into account th<? geometrical spreading factor requires a reliable knowledge of the second derivative of the travel time with depth or the first derivative of velocity with depth. However, both quantities are measured with low accuracy. The evaluation of the geometrical spreading factor can be avoided by comparing the spectra of phases at different epicentral distances or the spectra of different phases. This currently popular method made it possible to evaluate relative variations of attenuation constants for different rays, but was found to be less effective in obtaining absolute values. Below, we will consider another approach to this problem.
Let's assume that the amplitude-distance curve Ap(A) for a definite frequency f is known for two epicentral distances: Aj and A2 = 2A^ and that the value of the ratio App(A2)/Ap(A2) is also known. Disregarding absorption, the energy of a disturbance from a symmetric surface source per unit area of a wave front having an angle of emergence 1 is equal to [2]
E = sin Atan 1 di dA
where c is a constant. Taking into account absorption and reflection and assuming sinusoidal motion we obtain
2 r2A2p(Ai) sin Z^i exp[-2TTfT (Ai)/Qa(A1) ] (2) A PP(A2) = 2 sin A2
-70-
,
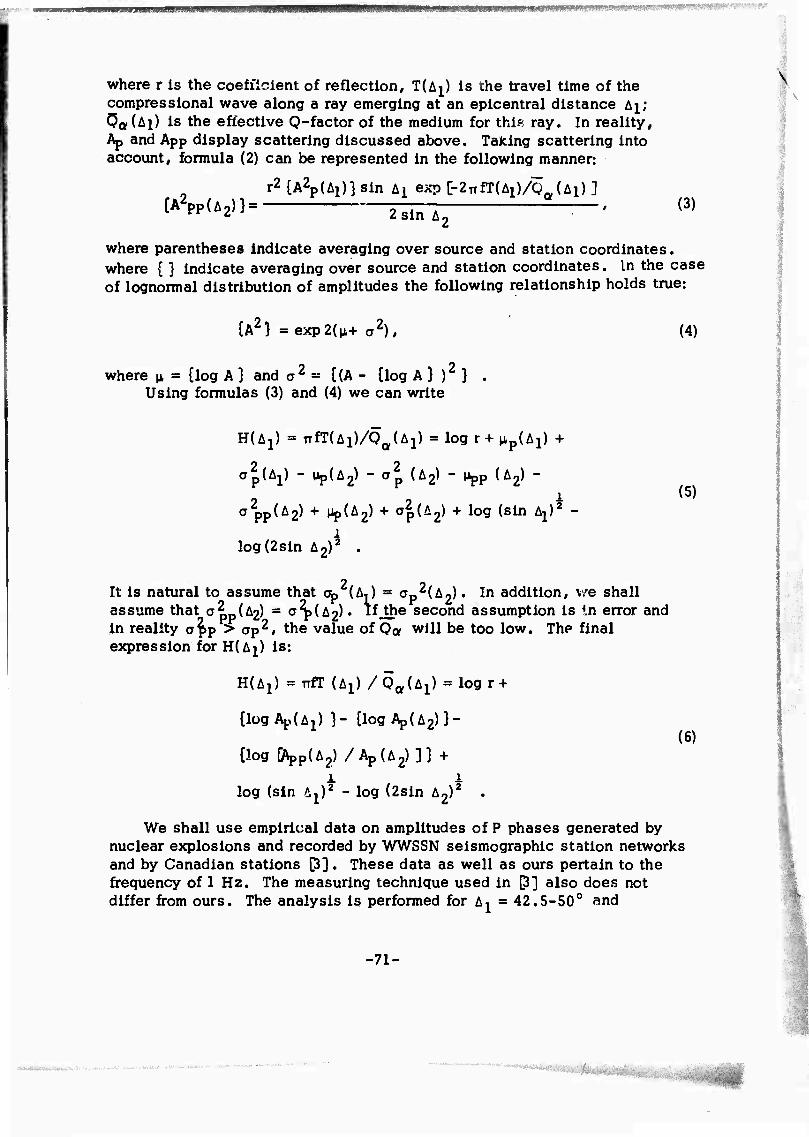
mmsmmmi&r'''
where r is the coefficient of reflection, TUj) is the travel time of the compressional wave along a ray emerging at an epicentral distance Aj; <3a(Ai) is the effective O-factor of the medium for this ray. In reality, Ap and App display scattering discussed above. Taking scattering into account, formula (2) can be represented in the following manner:
{A2PpU2)} =
r2 {A2p(A1)} sin ^ exp [-2TTfT(A1)/Qa(Ai) ]
2 sin A, (3)
where parentheses indicate averaging over source and station coordinates. where { } indicate averaging over source and station coordinates. In the case of lognormal distribution of amplitudes the following relationship holds true:
{A2} = exp2(^+ a2),
where p, = {log A } and a2 = {(A - {log A 3 ) } . Using formulas (3) and (4) we can write
(4)
(5)
H(A1) = TifTiäi)/Qa{L1) = log r + ^(A^ +
a^Aj) - upU^ - a2 (A2) - Mpp U2) -
a2pp(A2) + PpCAg) + ^pC^ + log (sin ^ ' 1
log(2sin A2)2 .
It is natural to assume that Op (A,) = ap2^) • In addition, v/e shall assume that a pp(A2) = a2p(A2) • If Jhe second assumption is In error and in reality a^p > ap2/ the value of Q« will be too low. The final expression for HCAJ) is:
HUj) = nfT (Ai) /Qa^i) = logr +
{logApCA!) }- {log Ap(A2)3-
{log CÄpp(A2) /ApCA^]} + i i
log (sin Aj)2 - log (2sin A2)2 •
We shall use empirical data on amplitudes of P phases generated by nuclear explosions and recorded by WWSSN seismographic station networks and by Canadian stations [3]. These data as well as ours pertain to the frequency of 1 Hz. The measuring technique used in p] also does not differ from ours. The analysis is performed for Ai = 42.5-50° and
(6)
-71-
......
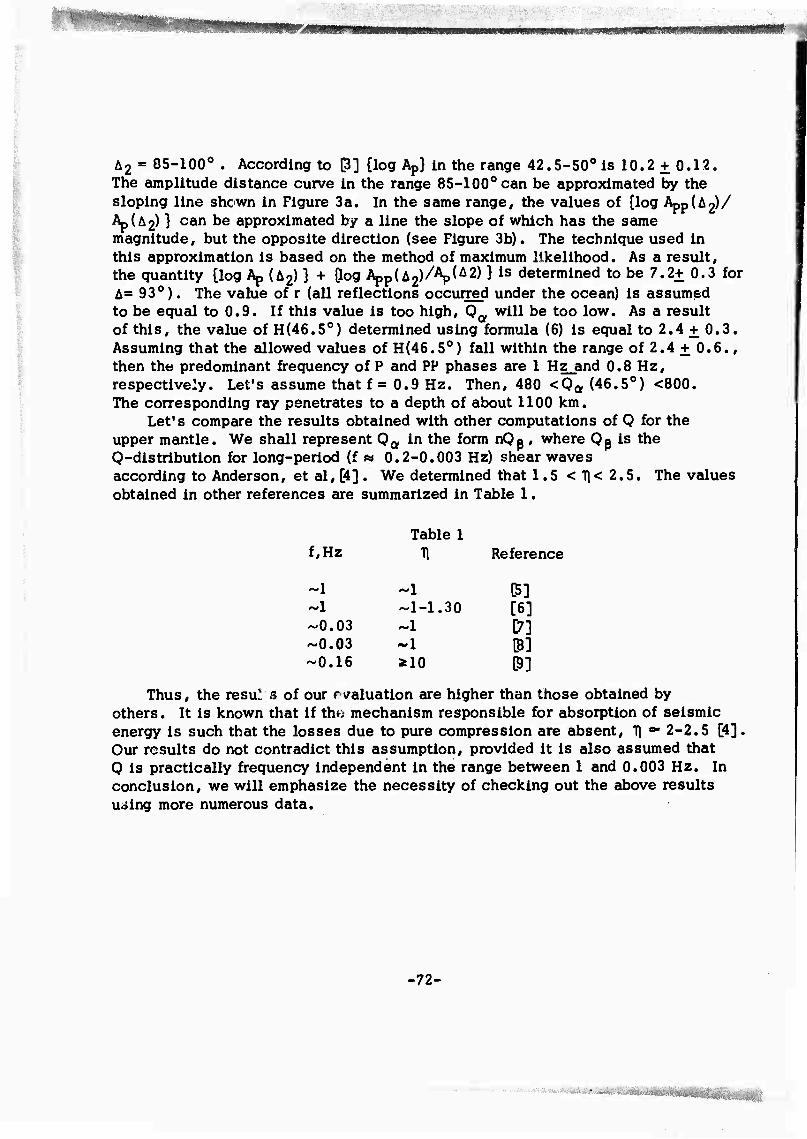
A2 = 85-100° . According to [3] {log Ap) in the range 42.5-50° is 10.2 + 0.12. The amplitude distance curve in the range 85-100° can be approximated by the sloping line shown in Figure 3a. In the same range, the values of {log kppiL^/ Ap(A2) } can be approximated by a line the slope of which has the same magnitude, but the opposite direction (see Figure 3b). The technique used in this approximation is based on the method of maximum likelihood. As a result, the quantity {log Ap U2) } + (log App^/V^H is determined to be 7.2+ 0.3 for A= 93°). The value of r (all reflections occurred under the ocean) is assumed to be equal to 0.9. If this value is too high, Q0/ will be too low. As a result of this, the value of H(46.50) determined using formula (6) is equal to 2.4 + 0.3. Assuming that the allowed values of H(46.5°) fall within the range of 2.4 + 0.6., then the predominant frequency of P and PP phases are 1 Hz_and 0.8 Hz, respectively. Let's assume that f = 0.9 Hz. Then, 480 <Qa (46.5°) <800. The corresponding ray penetrates to a depth of about 1100 km.
Let's compare the results obtained with other computations of 0 for the upper mantle. We shall represent Oa in the form nQp , where Op is the Q-distribution for long-period (f « 0.2-0.003 Hz) shear waves according to Anderson, et al, [4] . We determined that 1.5<T\<2,5. The values obtained in other references are summarized in Table 1.
Table 1 f,Hz 1\ Reference
~1 ~1 D5] ~1 -1-1.30 [6] ~0.03 ~1 [7] ~0.03 ~1 (5] ~0.16 ilO $]
Thus, the resu! s of our «-valuation are higher than those obtained by others. It is known that if the mechanism responsible for absorption of seismic energy is such that the losses due to pure compression are absent, T] •■ 2-2.5 [4]. Our results do not contradict this assumption, provided it is also assumed that 0 is practically frequency independent in the range between 1 and 0.003 Hz. In conclusion, we will emphasize the necessity of checking out the above results uoing more numerous data.
-72-
■ ■..■ i - :
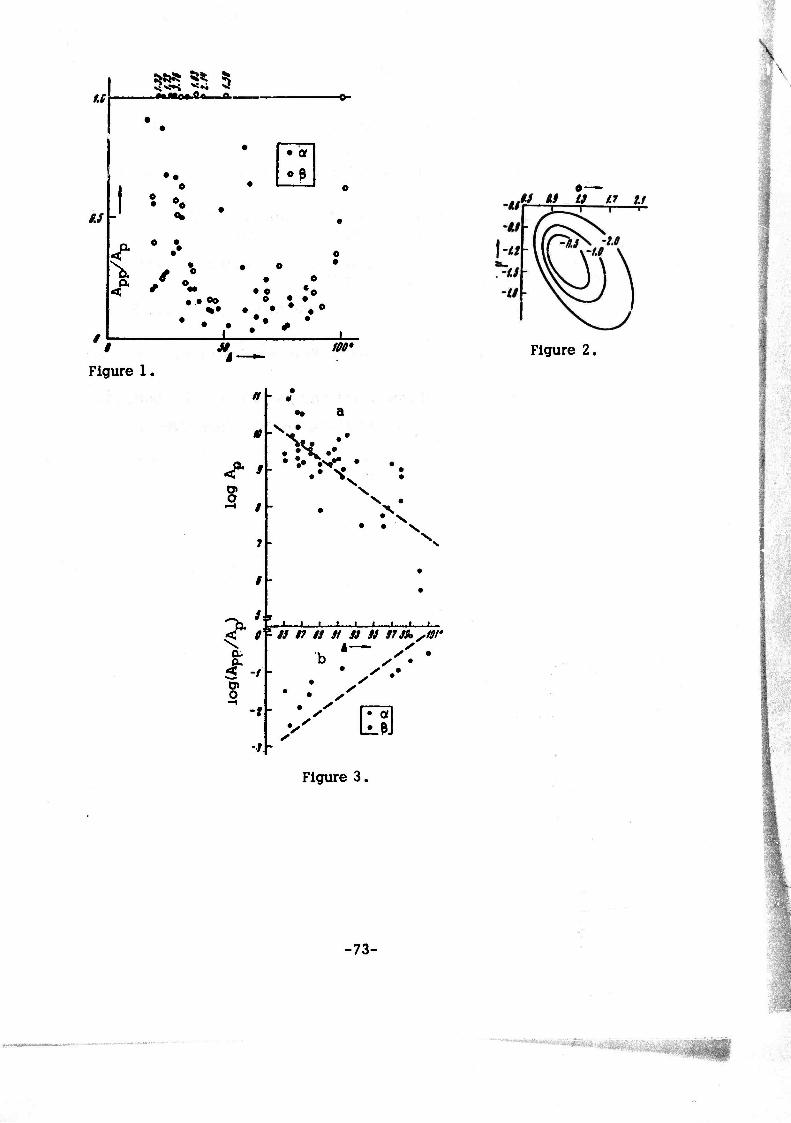
u
UV
£8^ $
• • • • a
\
•• e
•
• •? 0
•
< f:- • •00
*• • . •
1
0 0
• e • O «0 e • •
• • * ••
Figure 1. \
f >
•• a
• V» •
N •
T.'t-i
1 < -f
o
_l I I I I L.
s • <c fif is n is si is is niksW
•b Ä"^ y'
s
LeJ
Figure 3.
u u u n ti
Figure 2.
-73-
. ■. ü
REFERENCES
1. Vinnik, L.P. and G.G. Dashkov. IN: AN SSSR. Doklady, v. 184, no. 6, 1969, 1327
2. Bullen, K.E. An introduction to the theory of seismology. "Cambridge University Press," 1963
3. Carpenter, E.W.,P.D. Marshall, and A. Douglas. Geophysical Journal of the Royal Astronomical Society, v. 13, 1967, 61
4. Anderson, D.L., A. Ben-Menahem, and C.B. Archambeau. Journal of Geophysical Research, v. 70, 1965, 1441 -
5. Kanamory, H. Journal of Geophysical Research, v. 72, no. 2, 1967, 583
6. Kanamory, H. Bulletin of the Earthquake Research Institute, v. 45, Part II,
| 1967
7. Teng, T.L. Journal of Geophysical Research, v. 73, no. 6, 1968, 2195
8. Hirasawa, T. and K. Takano. Geophysical Notes. University of Tokyo, v. 20, no. 1-2, 1967
-74-
Seismic Wave Parameters
ANALYSIS OF CODAS OF SHALLOW-FOCUS EARTHQUAKES [AS]
Bisztricsany, E. IN: Geoflzikai kozlemenyek, v. 19, no. 3-4, 1970, 21-^9 (In English)
The recurrence curve for periods was constructed using the data on 1000 codas acquired at eplcentral distances between 5 and 50°. Three recurrence peaks at 5.6-6.5, 7.6-8.5, and 9.6-10.5 sec appear on the recurrence curve. At the surface of the earth, the codas generate vertical displacements on the order of a few microns. In investigating the amplitudes of the earth as a function of periods, the least squares analysis provides the following equation:
T= 2.8 Z - 0.47 Z2+ 1.83, (1)
where T is the period of the coda and Z is its amplitude. Equation (1) was used to determine the T and Z series for maxima of recurrence curves. Two pair of close values (T, T' and Z, Z^were selected from these series and were substituted into the equation for Rayleigh waves
T x T' log Z'/Z Z0S= ^'-^0.772 ™ '
where z is the thickness of the layer. The following values of A T and z« (in km) were obtained: 5.6-6.6, 7.5-8.7, 9.4-10.7, and 13.2, 18.4, 29.6, respectively. Each of the quantities given above can be correlated with one of the principal crustal layers in the Carpathian basin determined from deep seismic sounding data. The first quantity can not be interpreted uniquely; the second quantity corresponds to the thickness of the crust down to the Conrad discontinuity; and the third, to the thickness of the crust down to the Mohorovicic discontinuity. The investigations performed verify that codas can be considered as almost free oscillations of weakly coupled layers.
-75-
CERTAIN CHARACTERISTICS OF SEISMIC BODY WAVES AND THEIR USE IN OBTAINING A MORE PRECISE LOCATION OF EARTHQUAKE HYPOCENTERS C&S]
Bormann, P. IN: Deutsche Akademie der Wissenschaften, Berlin. Institut fur Geodynamik Jena. Veröffentlichungen. (Series] A, no. 14, 1969, 21-32 (In German)
The relative frequency of appearance of onsets of seismic body waves on records of Moxa seismographic stations is investigated. It was established that the frequency of appearance of the same phases depends on the epicentral distance. Three groups of regions were distinguished on the basis of this criterion. The distribution of the frequencies of appearance within each group was found to obey normal distribution. It is noted that the most difficult to interpret is a recording of a sequence of shocks rapidly following each other from different hypocenters located within the same tectonic zone. The dynamic characteristics of such phases do not differ from a sequence of P, pP, and sP phases generated by deep earthquakes and direct waves from a near-surface shock. The P, pP, and SP phases generated by deep earthquakes can be extracted if they are recorded by several stations located on different sides from the epicenter. The amplitude ratio for such phases has a distinct azimuthal dependence.
INVESTIGATION OF TRAVEL TIME DIFFERENCES BETWEEN OBSERVED AND TRUE ARRIVAL TIMES OF P PHASES RECORDED AT THE MOXA STATION lAS,T ]
Bormann, P. IN Deutsche Akademie der Wissenschaften, Berlin. Institut fur Geodynamik Jena. Veröffentlichungen. [Series] A, no. 13, 1969, 44-57 (In German)
The method and the results of statistical analysis of differences between the observed and true arrival times of P phases are described. The analysis is based on the data published by the Moscow Center. It is noted that frequency distribution of residuals is characterized by distinct differences in respect to focal regions. The reasons for such an effect are discussed. It is pointed out that it is possible to evaluate the quality of work or a seismographic station and the computer center and also to determine the errors in computing travel times, the causes of which are connected with the anomalous crustal or upper mantle structure.
-76-

INVESTIGATION OF THE RELATIVE FREQUENCY DISTRIBUTION OF TRAVEL TIME DIFFERENCES DETERMINED FROM P-WAVE DATA ACQUIRED AT THE MOXA SEISMOGRAPHIC STATION m Bormann, P. IN: Deutsche Akademie der Wissenschaften, Berlin. Institut fur Geodynamik Jena. Veröffentlichungen. DSeries] , no. 13, 1969, 277-284 (In English)
This paper is a continuation of an earlier investigation of travel time differences between observed and true arrival times of P phase residuals for the Moxa seismographic station. This study is based on data published by the Washington Center for the period January 1966-June 1967. A systematic difference is noted between the new results obtained using Washington data from the results of computations performed using Moscow data.
A STUDY OF RELATIVE FREQUENCY DISTRIBUTION OF TRAVEL TIME RESIDUALS FROM P-WAVE OBSERVATIONS AT THE STATION MOXA |AS]
Bormann, P. IN: Deutsche Akademie der Wissenschaften, Berlin. Institut fur Geodynamik Jena. Veröffentlichungen. [Series] B # no. 14, 1969, 33-39 (In German)
The mean difference between observed and true arrival times of P waves recorded by the Moxa seismographic station is zero. In the case of PP and SS phases this difference varies for different regions. A comparison of the above noted differences between PP and SS phases and P made it possible to reach certain conclusions concerning differences in the velocity distribution and the structure of the earth's crust. It was established that PP reflected under oceans and under continents arrive 3.8 sec and 1.0 sec ahead of P. In the case of SS, no differences in arrival times are observed between these phases traveling along ocearlc and continental paths.
A REPORT SUMMARIZING THE VELOCITY OF EARTHQUAKE WAVES AND THE STRUCTURE OF THE EARTH'S CRUST IN THE BALTIC SHIELD IAS]
Penttila, E. IN: Geophysica, no. 10, 1968, 11-23 (In English)
The data on velocities of seismic waves and on crustal thickness in the Baltic shield territory are summarized using the data available from seismic prospecting and from studies of earthquakes. It was determined that the most likely velocities of seismic waves for the regions are as follows: V =6.10
-77-
...... ■" ^^^^»«fe^fc^i
km/sec, V » 6.60 km/sec, V = 8.20 km/sec, V ■ 3.55 km/sec, V = 3.80 Hb n g b
km/sec, and V =4.65 km/sec. The thickness of the granitic layer varies n
between 18 km (Gulf of Bothnia) and 22-23 km (Finland^. The thickness of the basaltic layer varies between 24 km in the Gulf of Bothnia and 12-16 km in the eastern part of Finland. The total crustal thickness in the crustal region of the Gulf of Bothnia is about 40 km, but decreases east and west, to a thickness of 10-12 km in the area of the Sea of Norway.
RECORDING OF DISTANT QUARRY BLASTS BY MASS PRODUCED DSS AND CMRW SEISMIC SYSTEMS [AS]
Ryaboy, V.Z, and I.N. Galkin. IN: Razvedochnaya geofizika, no. 39, 1970, 46-53
The possibility of recording mantle waves by means of mass produced CMRW and DSS seismic systems at distances up to 1000 km is discussed. Statistical processing of published travel times of first arrivals of seisnic waves from earthquakes and large quarry blasts made it possible to determine the following expression for the mean crustal and mean mantle travel time curves: t = x/5.96 +2.12 and t = x/7.9 +8.3, respectively (the correlation coefficient was equal to 0.97 and 0.99 for crustal and mantle travel time curves, respectively). The corresponding mean square time deviations characterizing the inhomogeniety of the upper part of the earth and the mantle were determined to be 1.67 and 2.62 sec, respectively. A method of adjusting the gain of the seismic systems prior to their use is discussed. The specifications of instruments for registration of distant explosions are given (frequency band between 1-2 and 15-20 Hz, minimum signal, 10"^ cm; maximum gain, 10^; instantaneous dynamic range, 70 db; total dynamic range, 100 db.
-78-

Surface Waves
INVESTIGATION OF CRUSTAL STRUCTURE OF THE EURASIAN CONTINENT BY MEANS OF GROUP VELOCITY DISPERSION OF KAYLEIGH AND LOVE WAVES [AS]
Guth, D. IN: Deutsche Akademie der Wissenschaften, Berlin. Institute fur Geodynamik Jena. Veröffentlichungen. [Series] A , no. 13, 1969, 66-81 (In German)
Crustal investigations by means of seismic surface wave dispersion are discussed. The dispersion curves for one of the crustal models are compared with dispersion curves of group velocities of Love and Rayleigh waves generated by earthquakes originating in the Sinkiang Province of China, Tibet, and Formosa. It was determined that crustal thickness is not less than 40 km. It is pointed out that the results of analysis depend on the azimuths of wave paths.
CRUSTAL THICKNESS IN THE KURIL-OKHOTSK REGION DETERMINED FROM LOVE AND RALEIGH WAVE DISPERSION
IAS]
Ivanshchenko, A.I. and S.L. Solov'yev. IN: Geologiya i geofizika, no. 9, 1969, 94-102
The seismograms of 68 earthquakes originating in the Kuril-Kamchatka region and recorded by Soviet Far-Eastern seismographic stations are analyzed in order to determine group velocities of seismic Love and Rayleigh waves in different sectors of the Kuril-Okhotsk region. Individual areas characterized by similar dispersion are identified. For each such sector the observed dispersion of Love and Rayleigh waves is compared with theoretical dispersion for simple crustal models. The results obtained are generally in agreement with the results of deep seismic sounding investigations conducted in the Kuril-Kamchatka region. A correlation is established between the group velocity at a fixed period (T = 20 sec) and the average crustal thickness determined from deep seismic sounding conducted along profiles. This variation is used to approximately determine the crustal thickness in those sectors of the Kuril-Okhotsk region, where deep seismic sounding has not yet been performed.
-79-
.
A PROCEDURE FOR DETERMINATION OF THE SURFACE WAVE GROUP VELOCITY [T.E]
Porkka, M.T. IN: Geophyslca, no. 10, 1968, 1-9 (In English)
A simplified method of determining group velocities of surface waves based on the use of only the arrival times of extremum points on photographic records is described. The periods and the travel times were determined with the aid of parabolic approximation using the method of least squares. In those cases, when smoothing of experimental points, achieved during this operation, was insufficient, additional filtering of initial points and computation of their period and travel times was used. An experimental check of the method was performed using records of surface waves generated by earthquakes occurring in the Kurile Islands and in Japan and recorded by Nurmiyarvi seismographic station. The dispersion curves obtained by this method are in good agreement with dispersion curves determined by other methods.
-80-
SEISMICITY
EARTHQUAKES IN FINLAND, 1965-1968 SEISMOLOGICAL NOTES [AS]
Kataja, A., H. Korhonen, and E. Penttlla. 125-127 (In English)
IN: Geophysica, no. 10# 1968,
Eleven earthquakes with intensity III-V originated in Finland during the last four years. All of these earthquakes occurred in the northern part of the country, in an area between 65.0 - 67.4° N and 27 ~ 27.40E. This article summarizes the basic data on these events.
SEISMICITY AND CRUSTAL STRUCTURE OFIANTARCTICA] IAS]
Kogan, S.D., I.P. Pasechnik, and D.D. Sultanov. IN: Atlas of the Antarctic (Atlas Antarktiki), Leningrad, Izd-vo "Gidrometeoizdat," v. 2, 1969, 195-205
The seismic data acquired during the IGY and IGC by 15 Antarctic stations (USA, USSR, Chile, Argentina, Australia, New Zealand, and France), equipped with high-gain instruments were used in compiling a seismic map for Antarctica and a catalog containing data on 765 earthquakes. The earthquakes are classified according to their focal depths and energy. Analysis of seismic data shows that a characteristic feature of Antarctic earthquakes is the large period of body waves. It was established that while Antarctica is aseismic, the water areas surrounding this continent are characterized by high seismic activity. A local earthquake recorded by the Scott station (New Zealand) was a volcanic shock. The fact that the Antarctic's seismic belt coincides with alplng folding (Southern Antilles Ridge, African-Antarctic Ridge, Australian-Antarctic Ridge, and Southern South Pacific Rise) verifies the occurrence of recent, sharply- defferentiated, tectonic movements. The dispersion of Love and Rayleigh waves was used to determine the crustal thickness of Antarctica. It was established that the thickness of the earth's crust in Eastern Antarctica (between 30 and 40 km) is typical of continental platform areas. On the basis of variable crustal thick- ness (on the average between 25-30 km). Western Antarctica can be classified as an archipelago. The area between Antarctica and underwater alpine folding is characterized by oceanic crust, with crustal thickness varying between 5 and 10 km.
-81-
-/■ '
■■

, _ -v
MORPHOLOGICAL STRUCTURE, PRESENT DAY MOTION, AND SEISMICITY OF THE TERRITORY OF THE CITY OF TASHKENT [AS]
Lange, K.O. IN: AN SSSR, Doklady, v. 194, no. 4, 1970, 987-900
Geomorphological Investigations conducted in Tashkent have revealed close connection between earthquake hypocenters and the present day vertical motion of the earth's crust and morphological structures. The most important features in forming morphological structure of the territory of the city are the slightly sloping faults within the sedimentary overburden. Several morphological characteristics make it possible to outline certain linear, "tectonically-weakened" zones, the development of which was caused by stresses generated in the sedimentary complex during its formation. The uplift of the earth's crust due to earthquakes is a local phenomena confined within boundaries of stable Pleistocene-Holocene uplift revealed geomorphologically. The epicenters of the main shock and most of the aftershocks are located near the top of an anticline located within a slightly sloping tectonic saddle separating two local Pleistoceao-Holocene uplifts. The tectonic activity of the saddles and their connection with the development of the Paleozoic base- ment indicates that they are structural entities where seismic stresses can be generated and can thus be considered to be seismicly dangerous zones.
EARTHQUAKES ORIGINATING IN CRIMEA AND THE ADJACENT PARTS OF THE BLACK SEA ^
Popov, I.I. IN: Geology of the USSR (Geologiya) SSR# Moscow,Izd-vo "Nedra," v. 8, Part 1, 1969, 447-479
Both historical and instrumental data are used in describing seismlcity of Crimea and the adjacent Black Sea Basin. Historical data for the period between IV B.C. and 1925 were used in compiling a catalog of earthquakes of sufficient intensity to be felt by the population. The catalog of more recent earthquakes (between 1927 and 1963) is based on the instrumental data. It was established that the hypocenters of earthquakes with magnitudes between 3^ and 6^ originate in the crust (h =» 10-40 km). The strongest earthquake recorded during the last 160 years originated in 1927 southeast of Yalta (44.4° N, 34.5° E, M = 6i). The intensity of the shock near the epicenter reached VIII. The aftershocks of this earthquake were recorded until 1963. The magnitude of the largest of th'i aftershocks varied between M = 3i - 42. Analysis of seismic data indicates the presence of three seismicly active zones in Crimea (Yalta-Alushta, Sevastopol', and Feodosiya-Kerch). The most active of the three areas is the Yalta-Aluchta zone, extending almost parallel to the southern coast of Crimea. However, earthquakes also occur in the deep part of the Black Sea Basin and near the coast of Tamanskiy Peninsula. Accord-
-82-

nHHHBHttaaHHM mmmmmmmmm&v*'.
ing to Benloff s theory, the most intense strain release in the aresa occurred during 1928-1929 and 1947-1949.
THE HORIZONTAL SPREAD OF CRATONIC EARTHQUAKES AND THE CORRESPOND- ING BLOCK MOVEMENTS [AS]
Teisseyre, R., E. Penttila, H.V. Tuominen, and E. Vesanen. IN: Geophysica, no. I0f 1968, 55-68 (In English)
The spatial-temporal distribution of earthquakes originating since 1930 in the Fenno-Scandinavian shield was investigated. The motions characterizing the present day tectonics of this shield are considered from the point of view of block dynamics. The dislocations resulting from horizontal and vertical displacements are represented graphically. The horizontal displacements lead to formation of stress barriers which are overcome at the expense of an instantaneous release of huge amounts of energy. Vertical motions are responsible for only relatively weak earthquakes. The intensity of all earth- quakes recorded in the area varied between III and VI. Several locations of faults are identified, the positions of which are in good agreement with geological data. The foci of earthquakes considered are located in the earth's crust.
CERTAIN RESULTS OF SEISMIC INVESTIGATIONS CONDUCTED IN MIRNOYE IN 1966 D^S]
Trlpol'nlkov, V.P. Transactions of the Soviet Antarctic Expedition (Trudy Sovetskoy antarkticheskoy yekspeditsly), Leningrad, Izd-vo "Gidrometeoizdat," v. S3, 1970, 176-184
It is pointed out that in 1966 the Mirnoye seismographic station recorded 1500 earthquakes and shock associated with movement of snow and ice. The intensity of local earthquakes recorded by SVKM seismographs during 1966 is tabulated. The possibility of determining the direction toward the source of mlcroselsmic storms from the orientation of polarization axis of microselsmic motion was Investigated. An attempt was made to separate mlcroselsmic motion in respect to different sources and to determine the physical nature of seismic waves from their polarization.
-83-
,.;.... -..
gwiB,iiiiii—jimiHiuM
INTRODUCTION TO THE STUDY OF SEISMICITY. PART I 00 ■■ . .......
Ullmann, W. and R. Maaz. IN: Deutsche Akademie der Wissenschaften, Berlin, Institut fur Geodynamik Jena. Veröffentlichungen. [Series] A, no. 13, 1969, 104-118 (In German)
A general definition ot seismicity is given and a brief review of this concept as invisioned by various researchers is presented. Formulas are derived for evaluating local seismicity S at a point Z during a time period V; for evaluating seismicity of a three-dimensional space F during a time period V; and for evaluating seismicity of the same space at a time t. It is shown that these evaluations can be performed knowing the seismicity at a point Z at a time t, i.e., S[Z,t] , which is the result of superposition of the effect of several earthquakes. It is also shown that in determining S[r,V] it is insufficient to take into account only those phenomena which occurred in a region F during time V. In conclusion, the problem of determining the seismic energy flux on the basis of previous investigations of various processes occurring at the epicenter is presented.
-84-

SEISMOGRAPHIC SERVICE
THE NETWORK OF STANDARD SEISMOGRAPHIC STATIONS IN THE DGR £]
Genschel, G. and Ch. Teupser. IN: Deutsche Akademie der Wissenschaften, Berlin. Institut fur Geodynamik Jena. Veröffentlichungen. [Series] A, no. 13, 1969, 7-9 (In German)
A network of seismographic stations equipped with standard SSJ-I seismo- graphs has been set up in the GDR in the last few years. In addition to the previously operating central seismographic station at Moxa, it includes the following stations: Kolm, Berggieshubel, Halle, Potsdam, Oderberg, Pritzwalk, and Arkona. The seismographic stations are arranged in the shape of a triangle having two 100 km-long sides extending from north to south, across the whole of the territory of the GDR. The instrumental constants of the standard seismographs are as follows: Ts = 20 sec, Ds = 0.5, Tg = 1.2 sec, Dg =Ts/2Tg. It is noted that the background noise at the northern stations is approximately 3 times higher than at the southern stations. Correspondingly, the magnification of instruments in the northern part of the country is about 300, while in the southern part of the country it is close to 1000. The network of seismographic stations was set up primarily in order to investigate the internal structure of the earth.
SEISMIC DATA ACQUIRED BY JENA AND MOXA SEISMOGRAPHIC STATIONS DURING 1964 [ÄS]
Gerecke, F. IN: Deutsche Akademie der Wissenschaften, Berlin. Institute fur Geodynamik Jena. Veröffentlichungen, no. 10, 1970, 361p (In German)
The Jena seismographic station is located in the building housing the Geodynamics Institute in Jena (GDR). The Moxa central seismographic station is also part of the same institute. Both stations are equipped with a large number of seismic Instruments some of which were manufactured in the Soviet Union. Newly developed seismographic instruments are tested at the Moxa station. The instrumental constants and frequency response of seismo- graphs installed at the two stations are described. Catalogs of earthquakes recorded at the Jena and Moxa seismographic stations during 1964 are given.
-85-
THE POSSIBILITY OF AND CONDITIONS FOR STANDARDIZING THE NETWORK OF SEISMOGRAPHIC STATIONS IN BULGARIA AND INVESTIGATION OF THE MICROSEISMIC NOISE LEVEL Dl/E]
.
Khristoskov, L. IN: Deutsche Akademie der Wissenschaften, Berlin. Institut fur Geodynamik Jena. Veröffentlichungen. [Series] A, no. 14, 1969, 59-72 (In German)
A general description of the seismographic stations in Bulgaria is given. The condition under which recording of seismic waves at these stations is performed and the effect of microseismic noise on recording at these stations is discussed.
-86-

SHOCK WAVES
HUGONIOT CURVES OF POROUS METALS * [T,E]
Alekseyev, Yu. L., V.P. Ratnlkov, and A.P. Rybakov. IN: Zhurnal prikladnoy mekhaniki 1 tekhnicheskoy fizikl, no. 2, 1971, 101-105
This paper deals with shock compression and unloading of metals taking into account air contained in pores between grains of solid metal. The pressure and temperature ranges of air during shock compression considered in this paper are such that the contribution of thermal radiation of air to pressure and energy is insignificant. It is determined that within the limits of experimental errors, the Hugoniot data on Ni, Cu, and W in the pressure range 40-850 kbar are in agreement with theoretical data. The results of experiments on unload- ing of porous copper at a pressure of 485 kbar are also given.
The porous metal consists of metal grains and air pores. Shock-loaded, porous metals can be characterized by average values of shock and wave velocities and an average pressure, which is between air pressure and pressure of grains of solid metal. The material inside the grains is compressed and heated to density and temperature corresponding to solid metal at the same pressure. In multiple shock compression of air, only the first two waves are considered to be strong, and the pressure in each of these waves is considered to be close to the limiting pressure. Compression of air by later, weak waves is not taken into account. The specific volume of powder is taken to be equal to the sum of the specific volumes of air and solid metal multiplied by their fraction by weight.
The experimental data on unloading of porous copper indicate that the unloading process is determined by isentropic expansion of compressed grains of solid metal. In the pressure range between 485 and ~100 kbar,the volume of air remains constant and equal to its volume in the state at which unloading begins. This can apparently be explained by the fact that owing to the effect of cooling (and also compression)of air caused by heat transfer, the expansion of air under these conditions is not an isentropic process.
The authors of DM have suggested that approximate Hugoniot curves of porous materials can be obtained by taking into account the finite compression of air filling the pores between grains of solid material. According to [1] , the pressure between grains and the air tends to an equilibrium, however, thermal equilibrium is not established during the brief period required for transmission of the shock wave (about 1 jisec).
It is assumed that if the Fourier number F = AT /R << 1 (A is the thermal conductivity of the grain material, R is the characteristic dimension, and T is the characteristic time, i.e., shock wave duration), the equalization of temperature has not yet begun.
For example, in the case of copper with a characteristic grain dimension of several dozen microns F =" 1/10; i.e., in this case it apparently can be assumed that equalization of temperatures has not yet begun and the specific volume of powder is equal to the sum of specific volumes of air and solid
f-
* Slightly abbreviated translation.
-87-
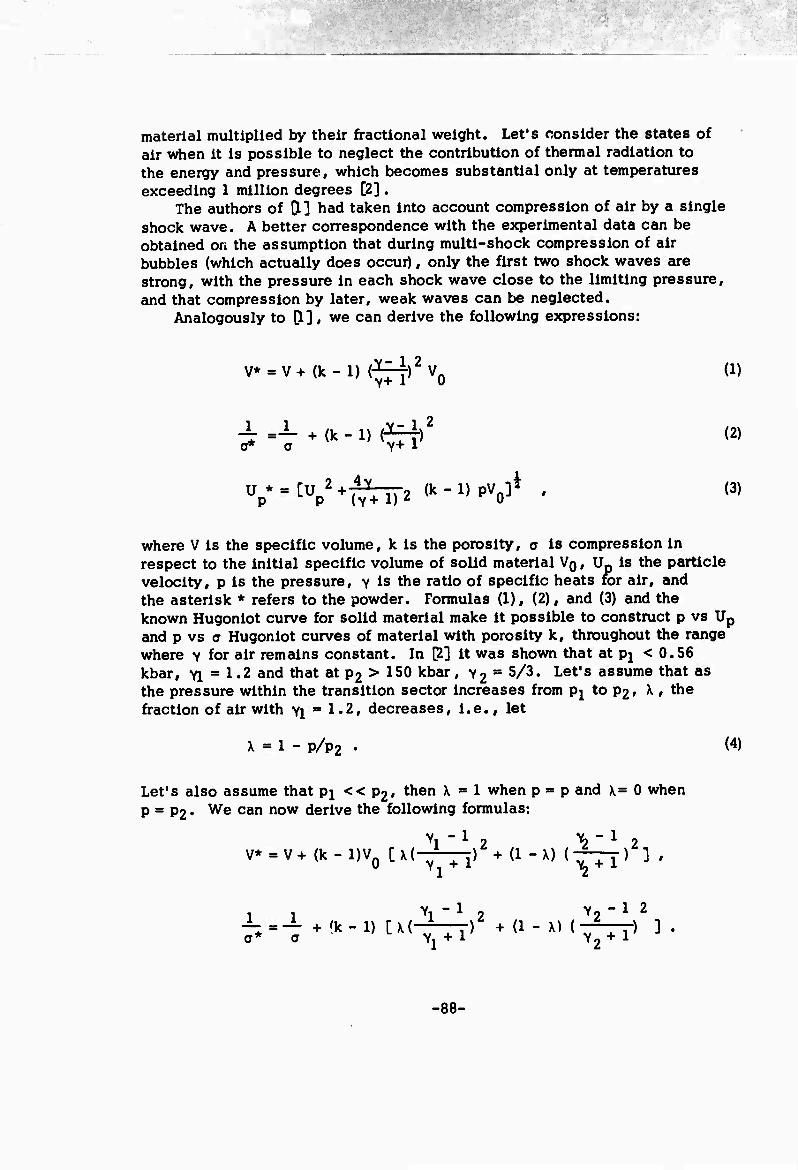
material multiplied by their fractional weight. Let's consider the states of air when it is possible to neglect the contribution of thermal radiation to the energy and pressure, which becomes substantial only at temperatures exceeding 1 million degrees [2] .
The authors of [1] had taken into account compression of air by a single shock wave. A better correspondence with the experimental data can be obtained on the assumption that during multi-shock compression of air bubbles (which actually does occur), only the first two shock waves are strong, with the pressure in each shock wave close to the limiting pressure, and that compression by later, weak waves can be neglected.
Analogously to [1] , we can derive the following expressions:
v* = v+(k-i) (^7Y)2v0 (1)
* i-+(k-l)(*^i)2 (2) a* a Y+ 1
V ■ CUP
2+WVTT
2
(k"l) pVo]i • (3)
where V is the specific volume, k is the porosity, a is compression in respect to the initial specific volume of solid material VQ , Up is the particle velocity, p is the pressure, y is the ratio of specific heats for air, and the asterisk * refers to the powder. Formulas (1), (2), and (3) and the known Hugoniot curve for solid material make it possible to construct p vs Up and p vs a Hugoniot curves of material with porosity k, throughout the range where y for air remains constant. In p] it was shown that at pj < 0.56 kbar, yi =1.2 and that at pg > 150 kbar, Y2 = 5/3' Let,s assume that as the pressure within the transition sector increases from p^ to P2 # \ , the fraction of air with YJ = 1.2, decreases, i.e., let
\ = 1 - p/p2 . (4)
Let's also assume that pj << P2» then X = 1 when p = p and x= 0 when p = P2. We can now derive the following formulas:
Yl " 1 2 \~1 2 v* = v+(k-i)v0 [x(-^T1)%(i-x) (~TT) ] •
11 Yl - 1 2 Y2 - 1 2
^=^ +'k-l) [X(-LTT) +(1- ^ (-T-TT) 3- o * a ' L x Y, + 1 Vo + 1
-88-

>;.!■ -
An analogous expression can be derived for the particle velocity in the transition range.
The unloading process of shock compressed porous material can apparently be represented in the following manner. The grain material of a solid in
state p* a* expands along the isentrope. Two processes apparently compete in air bubbles: 1. cooling caused by heat transfer accompanied by compres- sion and 2. isentropic expansion of air. In cooling, the decrease in volume can be set proportional to the decrease in temperature and to the ratio of pressures
2_
r2
T2 P*
V„*0 T *(
In isentropic expansion, the increase in volume Is proportional to the temperature and the ratio of pressures, i.e..
= (-E^-vl/Y
V * v2
)■
We shall now summarize some of the experimental results on porous Ni, Cu, and W in the pressure range in which no experimental data are presently available and compare these data with theoretical results.
The densities and porosities of specimens were as follows: Ni (3.75, 2.75), Cu (2.97, 3.01), and W (9.00, 2.15).
The Hugoniot curves of specimens were determined by means of impedance matching [2] , using four different explosive systems. In order to avoid the shock tilt due to lateral unloading, the ratio of the diameter of the specimen to its height was made sufficiently large, varying between 10 and 20. Eight measurements of shock velocities were performed in each experiment on the same sample. Between two and four experiments for each of the powders were performed using each explosive system.
The deviation of the initial density of specimens from nominal density did not exceed 1.5%. Nevertheless, the results of experiments were corrected for the small density deviations. The maximum corrections did not exceed 1% and in most cases was only a few tenths of a percent.
The experimental Hugoniot data are summarized in Table 1 which shows particle velocity in the standard (Up(st#)), shock velocity in the specimen (Us) and Up, p, and a. The numbers in parenthesis in columns 3-6 are the mean square errors computed using the following formulas derived from an expression for variance of a function of two variables connected by a linear relationship [3] :
-89-
.■ . ■ ■ ; ■ :

■
xu =^ P m I
Xr> = ,XTT + X TT I . X = (ka - 1) |X p Up Us a Up - X, U.
m» 1 + pO(St.) cst. + 2Bst.(2up(st.)-V Uc
(5)
where x is the relative value of the mean square error [4], p is the initial density, c and ß are coefficients appearing in the Up vs Us relationship, and subscript St. indicates standard material.
We have also determined release curves for porous copper (k = 3.01) initially loaded to p*0 = 485 kbar. This was achieved by placing less rigid materials (water and foam polystyrene with three different densities) behind the specimen of porous copper. The Us- Up curves for foam polystyrene were obtained by interpolating the experimental data given in C5]. An experimental check verified the validity of this Interpolation.
Table 2 shows the experimental data on unloading of porous (k = 3.01) copper from the state p*0 = 485 kbar, a*0 = 1.058, and Up*0 = 3.35 km/sec (In the case of air, we give the free surface velocity). Figure 1 shows the the experimentally determined p vs Up curves for Nl, Cu, and W (circles) and the results of computations (continuous lines) obtained using formula (3). Figure 2 shows the p vs a curves for the same materials. It can be seen from Figure 1 that the theoretical p vs Up curves for porous metals computed taking Into account air between grains are In good agreement with experimental data. It can be seen from Figure 2 that theoretical p vs a curves are In somewhat poorer agreement with the experimental data. This can be attributed to a large error In computing o 05] . The available experimental data on shock compaction of porous metals [6-9] In the pressure range up to 1 Mbar also verify the validity of the scheme proposed above. However, most of the results obtained In [6-8] refer to pressures exceeding 1 Mbar. At such high pressures It is necessary to take into account thermal radiation of air. Owing to evaporation of part of the metal from the grain surface, the effect of thermal radiation will apparently result in the average pressure of powder being less than that determined from formula (2). A comparison of the results achieved at high pressures [6-8]Is In qualitative agreement with this assumption.
Similarly to [B], the experimental results on unloading of shock-compacted, porous copper can be summarized by the following formula:
p = a(W-Up) + b(W-Up)' (6)
where a = pncn; b = pnjä; p , c , and eare the Initial density and the
coeffients in theUs vsUp relationship for a solid metal; and W Is the particle
velocity at p = 0. In the p vs a coordinates the unloading curve can be
-90-
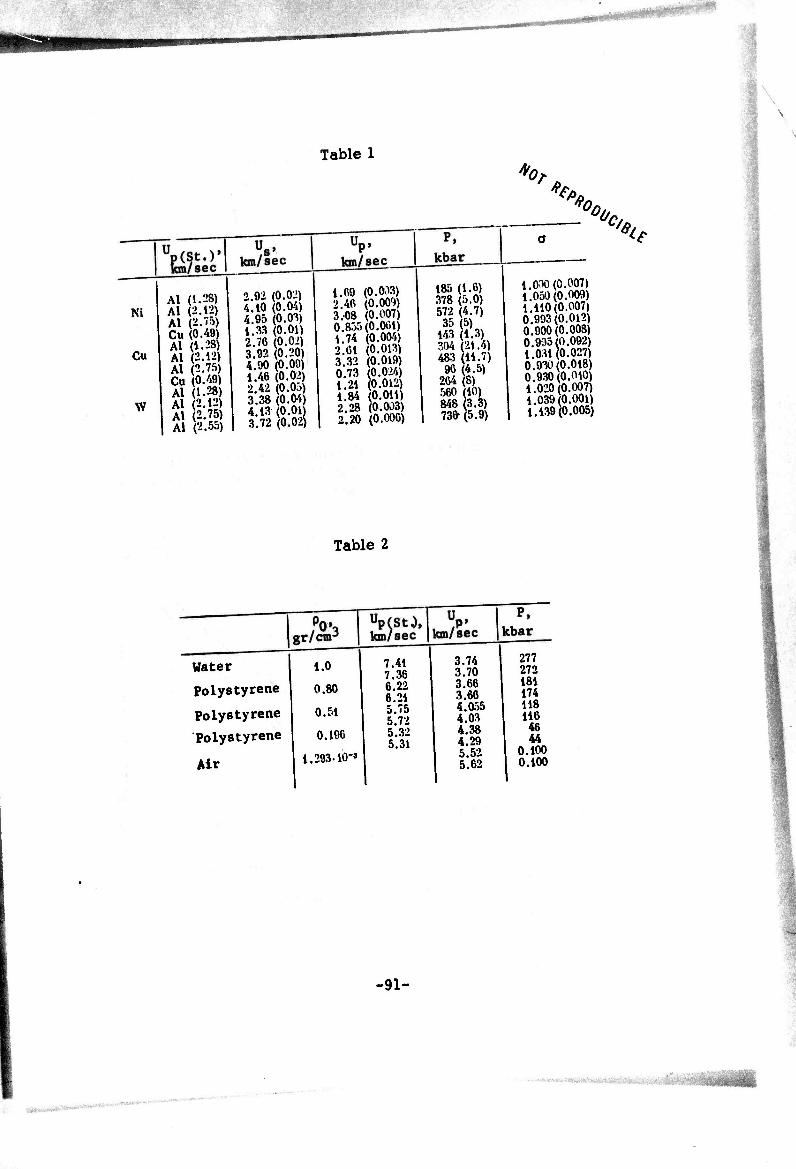
Table 1
Kl
Cu
w
Al (1.28) Al (2.12 Al (2.751 Cu(0.49i Al (1.28) Al (2.12) Al (2.75) Cu (0.49) Al (1.23) Al (2.12) Al 2.75) Al (2.55)
2.92 (0.02) 4.10 (0.04) 4.95 (0.03) 1.33 (0.01) 2.76 (0.02) 3.92 (0.20) 4.90 (0.09) 1.46 (0.02) 2.42 (0.05) 3.38 (0.04) 4.13 (0.01) 3.72 (0.02)
1.69 (0.003) 2.46 (0.009) 3.08 (0.007) 0.855(0.001) 1.74 (0.004)
(0.013) (0.019) (0.024) (0.012) (0.011) (0.003) (0.000)
2.61 3.32 0.73 1.21 1.84 2.28 2.20
185 (1.6) 378 (5.0) 572 (4.7)
35 (5) 143 1.3) 304 (21.4) 483 (11.7)
96 (4.5) 264 8) 560 (10) 848 (3.3) 73& (5.9)
*or
's. ie
1.000(0.007) 1.050(0.009) 1.110(0.007) 0.993(0.012) 0.900(0.008) 0.995(0.092) 1.031(0.027) 0.930(0.018) 0.930(0.010) 1.020(0.007) 1.039 0.001) 1.139(0.005)
Table 2
Water 1.0
Polystyrene 0.80
Polystyrene 0.51
Polystyrene 0.196
Air 1.293.10-»
7.41 7.36 6.22 6.21 5.75 5.72 5.32 5.31
3.74 3.70 3.66 3.66 4.055 4.03 4.38 4.29 5.52 5.62
277 272 181 174 118 116
46 44
o.ioo 0.100
-91-
•
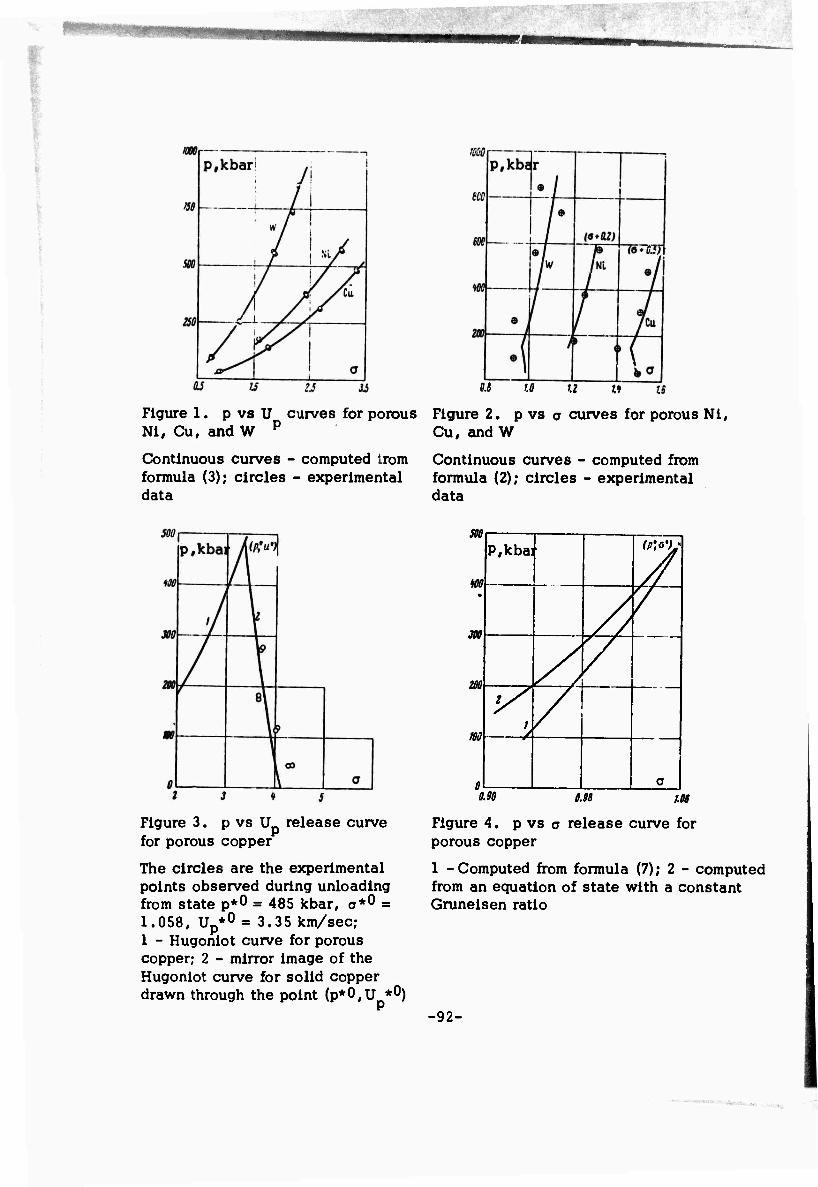
W 11 1.2 »
Figure 1. p vs U curves for porous Figure 2. p vs a curves for porous Nl, Ni, Cu, and W p Cu, and W
Continuous curves - computed Irom Continuous curves - computed from formula (3); circles - experimental formula (2); circles - experimental data data
Figure 3. p vs U- release curve for porous copper
The circles are the experimental points observed during unloading from state p*0 = 485 kbar, a*0 = 1.058, Up*0 = 3.35 km/sec; 1 - Hugoniot curve for porous copper; 2 - mirror image of the Hugoniot curve for solid copper drawn through the point (p*0/U *0)
MO
WO
Pfkbai
•
Ml A //-
w \A V 103 /
0 a 0.90 0.98 MS
Figure 4. p vs a release curve for porous copper
1 -Computed from formula (7); 2 - computed from an equation of state with a constant Gruneisen ratio
-92-
:
■3
•

yupwwi
I, 5'J- '-
represented by the following formula: ^
2 *u
,1 . p0 , , a + 4bp ..-1 = ( —n + log I -r K— )) a* 4b a + 4bp
(7)
where p* and a* are coordinates of the point where unloading begins. The validity of formulas (6) and (7) was checked for solid copper by calculating the unloading curve from the state p ■ 485 kbar, a - 1.224, and Up = 1.0 km/sec using formulas (6) and (7) and by comparing the results obtained with the release curve passing through the same point, computed from the well-known equation of state with a constant Gruneisen ratio. Complete agreement was achieved between the curve computed from formula (7) and the release curve computed from the equation of state.
The experimental data on unloading of porous copper from the state p*0 « 485 kbar, a*0 = 1.058, Up*0 = 3.35 km/sec are shown in Figure 3 which also shows the Hugoniot curve for porous copper (curve 1) and the mirror image of the Hugoniot curve for solid copper through point (p*0, Up*0) (curve 2). Equation (7) was used to determine the unloading curve in the form of p vs a variation (line 1 on Figure 4). Line 2 on the same figure is the release curve computed from the equation of state with a constant Gruneisen ratio.
Analysis of the results indicates that unloading of shock compacted, porous copper is determined by isentropic expansion of grains of solid metal. An identical result was also obtained in 03] .
In particular, a comparison of the unloading curve for porous copper (line 1 in Figure 4 and the experimental data) with the unloading curve for solid copper indicates that the volume of air in the pressure range between 485 and 100 kbar remains practically constant and is equal to its volume in state p*0, a*0, which is the initial state at which unloading begins. Apparently, the two competing processes (isentropic expansion and compres- sion due to heat transfer in air bubbles) compensate each other. However, the expansion of air should eventually predominate. This would cause deviation of the unloading curve for porous metal toward higher particle velocities (and decreasing densities). The lower points on the _ release curve for copper and foam polystyrene with density p. = 0.19 gr/cm indicate that such a deviation actually takes place.
-93-
.;..,,,.,-.. pgi
REFERENCES
1. Voskoboynikov, I.M., A. N. Afanasenkov, and V.M. Bogomolov. Generalized Hugoniot for organic liquids. IN: Fizika goreniya i vzryva, v. 3, no. 4, 1967, 585
2. Zel'dovich, Ya. B. and Yu. P. Rayzer. Physics of shock waves and high temperature hydrodynamic phenomena. Moscow. Izd-vo, "Nauka," 1966
3. Smirnov, N.V. and I.V. Dunin-Barkovskiy. A short course in mathematical statistics for technical applications. Moscow, Izd-vo "Fizmatgiz," 1959
4. Zaydel', A.N. Elementary methods of evaluating measurement errors. Leningrad, Izd-vo "Nauka," 1967
5. Dudoladov, I.P., V.l. Rakitin, Yu.N. Sutulov, andG.S. Telegin. Shock compaction of polystyrene having different initial density. IN: Zhurnal prikladnoy mekhaniki i tekhnlcheskoy fiziki, no. 4, 1969, 148
6. Krupnlkov, K.K., M.I. Brazhnik, and V.P. Krv.pnikova. Shock compression of porous tungsten. IN: Zhurnal eksperimental'noy i teoreticheskoy fiziki, v. 42, no. 3, 1962, 675
7. Kormer, S.B., A.I. Funtikov, V.D. Urlin, and A.N. Kolesnikova. Dynamic compression of porous metals and the high temperature equation of state with variable specific heat. IN: Zhurnal eksperimental'noy i teoreticheskoy fiziki, v. 42, no. 3, 1962, 686
8. Skidmore, I.C. and E. Morris. Experimental equation of state data for uranium and its interpretation in the critical region. Thermodynamics of nuclear materials, Vienna, 1962
9. Boade, R.R. Compression of porous copper by shock waves. Journal of Applied Physics, v. 39, no. 12, 1968, 5693
-94-
j, ,

«W ■"?■!
INVESTIGATION OF CLAYS AND CLAYEY SHALE AT STRONG DYNAMIC LOADS* (£]
Al'tshuler, i..V. and M.N. Pavlovskiy. IN: Zhurnal prikladnoy mekhaniki i tekhnicheskoy fizlki, no. 1, 1971, 171-176
The results of investigations of shock compression of several types of sedimentary rocks are described. Hugoniot curves at pressures to 500 kbar were obtained and initial sectors of release adiabats were determined for 4 different types of clays and shales. Certain characteristics of Hugoniot curves associated with phase transitions and the limits of applicability of methods of constructing Hugoniot curves for the complex systems being investigated from the Hugoniots of their components were established.
1. Shock Compression
The investigations were performed on two types of almost white surface clays (A) having different water content, two types of green clays (B) originally found at considerable depth and having the same water content as (A), and also clayey shales (C). It was determined that the principal component of specimens is silica (silica and kaolinite type minerals in the case of green clay and shale). In the remainder of this article subscripts 4 and 20 to capital letters A and B will indicate water content in percent.
The shock compression measurements were performed by the method of impedance matching [1,2]. The shock velocity was measured by electrical contactors &] . The thickness of specimens used in the experiments was 4-6 mm. The Hugoniot curves of aluminum and iron given in [3] were utilized in constructing pressure vs particle velocity curves. Ine specimens were mounted on the back of the standards. The release adiabats of standards were assumed to be identical to mirror images of their Hugoniot curves [2] .
The results of experiments are summarized in Table 1. The following designations are used in this table and in the text: c. - initial density,
U ,g . - particle velocity of the -.tandard which usually was aluminum (in
those cases when the standard was made of copper, the values of particle velocity were marked by a dash), U - shock velocity, U - particle velocity s p in the specimen, P - pressure, p - density, and V - specific volume of shock compressed material.
The data summarized in Table 1 are plotted in Figure 1 in the form of Us vs Up curves. It was established that the experimental data for clays can be adequately described by the following relationships:
Us(A20) =3-05+ 1-23 V Us(A4) = 2-78+ i-21 V
Us(B,n) ' Z-ZO+l-SO V US(BJ -1-60+ 1-47 V
(1.1)
(1.2)
* Translation. -95-
.■

l-t
(U •-H Xi (0 H
. '
u
ro 9
(n 8 s
I fM
I
Jl
«
4J CO
o Q.
c
I o 0« a
W<n« «n^wevi flScoJnwcM <n«Äw «n« «www www odd dddd ddddd dddd ddddodooo
oj W to «M ocn-* wwcnm^ wmm-d* co »n ca co co-* J* J*--^
•4-0000 b-UNVQO •4-VQ^WQ VOOVtOITN O Q W Ovt-VO ONQ-*
HHH »' H i4 f4 HHHHW HHHW HHHHHHHHH
UMTN 00
H-* HW-SF HHJft- H^- HHW w (ncn-ap^Fin
Ä^« S^^S? ^&S^ S^ÄÄ fiS?ÄÖäf^S5l • •• • • • * ••••• •••• ••••••••• O H ro OHHcn OHH «n-* O O H co OHHHHHWWW
358 Ä^Ä^ l?:59&:& ^8^5 RSSS«»^^ Jt Jt t- dtj* UWO crtJt tfWOOO WOO-^VO tf\ ll\ «*\\0 VO NO vo vo t-
0\Jt p 0\JtOO 0\-*OPP U\0\Op OS Jf (O O CQ O-4-rl W
OHW drHHW drHHWcn ddrHW OHHHHHHHW
• •• • • • • ••••• www wwww wwwww
o < <
o
H w
«*
1= w
-96-
;*M«l««ili««Bl䫻Ļ.»!iUiäB,jj^

The variation of velocity of a relatively weak, diverging shock wave in white clay with 20% water content, where the shock wave is generated by a small spherical charge of TNT and hexogen, with distance R to the center of the charge was also measured (see Figure 2).
w U. km/sec
s |
2
0 i i i
Figure 1. Shock velocity vs particle velocity curves (U and U are in s p km/sec)
1 - Clay A20; 2 - clay A4; 3 - clay
B20; 4 ' clay B4; 5 ~ shale
NOT REPRODUCIBLE
Figure 2. U vs R/RTTE curve for
white cleiy A_n
U is shock velocity in km/sec;
is the radius of the spherical «HI charge equal to 25 mm and R is the distance from the center of the charge
The trajectory of motion of shock waves and shock velocities were measured by contactors imbedded in clays at different distances from the charge. These measurements made it possible to determine that the sound velocity in wet clay almost coincides with the sound velocity in water.
The data plotted in Figure 2 made it possible to construct approximately the initial sector of the Us vs Up curve for clay A20. By analogy, the. same configuration was assigned to the initial sector of clay B2o« The difference between shock compression of clay and shale can be clearly observed on the Us vs Up curve shown in Figure 1. The Us vs Up curve for shale consists of several sectors, with the initial sector forming a straight, almost horizontal line resembling the initial graphite-diamond sector of the Us vs Up curve for graphite. A horizontal sector indicating the occurrence of a second order phase transition follows a small sector of a rapid increase in shock velocity at P = 280 kbar. The upper branch of the Hugoniot curve of shale is that for a high pressure phase. The P vs V Hugoniot curves for four types of clays and shale constructed from their Us vs Up curves are shown in Figure 3. In this figure the experimental Hugoniot curves are represented by continuous lines (lines 1 and 2). The Hugoniot curve for shale consists of two branches, one for low and one for high pressure phases. The Hugoniot curves for clays consist of monotonically increasing curves which at pressures above 100 kbar are almost parallel to each other.
-97-

s*mm
2. The Structure of Rarefaction Waves
The clays and shales are complex multicomponent minerological systems which may undergo many phase transitions. At finite transition times, comparable with recording times, the Hugoniot curves are the loci of nonequilibrium states of variable phase composition. What's more, the experimental Hugoniot curves can remain monotonic, and their shape can differ very little from that of Hugoniot curves for stable homogeneous media (see Figure 4a). The data on the actual state of the medium under compression can be determined by observing rarefaction waves. As is known, the slope of the release adiabat and the maximum velocity of the rarefaction wave are related by the following formula:
V2(bP/öV)s = C2 (2.1)
In the absense of phase transitions (curve 01234 in Figure 4a is the Hugoniot for a homogeneous medium, the absolute value of the slope of the release adiabat (line 2-5) will be smaller than that of the Hugoniot. If in addition to the initial phase,the medium contains a considerable amount of higher-density phase, unloading will occur along line 2-5'. Additional proof of phase transitions would be the appearance of rarefaction shock waves [5-7], the shock front of which would be characterized by a Jump-like return of material (line 6-0') to its Initial state
In interpreting experimental data ~c is necessary to take into account the possible effect of shear strength [1,8]. In media with a considerable dynamic yield point, an elastic stress state corresponds to the beginning of the release stage. The velocity of elastic rarefaction waves Ce > C. In the general case it is very difficult to differentiate between elastic-plastic release curves and release curves for heterogeneous media. An electromagnetic (EM) method of measuring particle velocities 0,7,9] was used to record shock and rarefaction waves in clays and shales. A diagram of the experimental assembly is shown in Figure 4b and typical oscillograms in Figure 5.
The initial rise of the trace on the oscillogram indicates the arrival of the shock wave at the EM gauge. A centered rarefaction wave (see Figure 6) begins to propagate into the specimen after the shock wave reaches the free surface (kmn in Figure 6 shows free surface motion). The second rise on the oscillogram corresponds to the arrival of the rarefaction wave at the EM gauge at a time tj (abode in Figure 6 shows EM gauge's motion). Time t2 characterizes dispersion of the rarefaction wave. Using the values of tj and Up measured during the experiments and the known values of L and Ug, it is easy to calculate the maximum sound velocity behind the shock wave. From Figure 6 it follows that:
r-u i L I Ultl C " Ul + tj - L/D (2.2)
-98-
-,..-—'■
mm
o.is 0.30 o.5S tf<tf(b) (äüär OM o.ts o.so o.ss v */„- \c\0.lS 0.30 0.35 V/Cm /gr
Figure 3. Hugoniot curves for 4 types of clay and shale
o o'y
Figure 4a. Shock Hugoniot and pressure release curves
wmmmm Fr-T;w. .■.■.■>...- ■ ■ i ■ TTT-rrr.r-i
Figure 4b. Experimental arrangement
1 - Charge; 2 - standard; 3 - specimen; 4 - TT-shaped aluminum foil EM gauges placed to a depth L = 6 mm
-99-
IBJMafiBfBSgi ■ •■ \
tf M>sec
mmmmmb
V/VWMWMWWV
Figure 5, Typical oscil- logram of shock and rarefaction waves in clay (a) and shale (b)
Figure 6. Time vs distance plot
1 - U ; 2 - U ; 3 - C.-U ; p p2 2 .P2
4 - C. -U ; 5 - Uc 1 Pj s
The maximum rarefaction wave velocities for shale (C), dry (BJ and wet
(B ) green clay, and dry (AJ white clay computed from formula (2.2) are
given in Table 2. Table 2
No. Specimen p0 P ü8
U P
P/P0 P V C
1 B4 2.15
99 3.51 1.31 1.594 3.43 0.292 7.17 2 178 4.38 1.89 1.760 3.79 0.264 6.79 3 B20 2.03
107 4.16 1.27 1.440 2.92 0.343 5.61 4 188. 5 5.02 1.85 1.583 3.21 0.311 7.60 5 A4 2.25
146. 6 4.52 1.44 1.470 3.30 0.303 4.90 6 227 5.14 1.96 1.616 3.64 0.275 4.87 7 C 2.77 276 6.00 1.64 1.378 3.82 0.262 6.3
The arrows on oscillograms in Figure 5 denote the times at which rarefaction waves were generated when the shock waves reached the free surface of the specimen. The time interval between the initial rise of the trace on the oscillogram and the arrow is equal to I/Us.
The arrows (4 in Figure 3) denote the most likely location of the initial sectors of release adiabats. In the case of white clay (Figure 3a) the slopes of the release adiabat are close to the slopes of the Hugoniot curves. This indicates an absence of nonequilibrium heterogeneous states at least in the pressure range of the Hugoniot curves investigated (between 100 and 230 kbar) and also a negligibly small effect of shear strength related phenomena.
A different picture is observed for wet and dry samples of green clay (Figure 3b). The slopes of the release adiabats are much steeper than those of Hugoniots. The position of these curves indicates the presence of higher
-100-
IJWBBIWiWBWWIl^ 'I''f
density, less compressible components. Figure 5 and other oscillograms obtained under similar conditions
show that rarefaction waves in shales are quite complex, with reflected shock waves appearing at the end of the process. Figure 3c shows quali- tatively the release adiabat plotted together with the Hugoniot curve. The release adiabat contains a steeply sloping sector (dash-dot curve 2) characterizing compression of dense phases and shock transition (dot-dash curve 3). A hysterisis loop formed by the Hugoniot-release adiabat can be clearly seen in Figure 3.
3. Discussion of Results
Each of the clays investigated consisted of liquid and solid phases. Neglecting inhomogeneity of the solid phase, we shall consider clays to be two component systems consisting of water and a dry component. According to DO] , the volume of the shock compressed mixture consists of a sum of component volumes where each component is compressed separately. The volume of the mixture is given by the following expression:
V(P) = aV0(P) + (1 - a) Vd(P) , (3.1)
where a is the fraction of water by weight, V0(P) is the specific volume of water exposed to shock pressure P, and V^ is the specific volume of the dry component.
The Hugoniot curve of water was determined in [11,12] . Its specific volume for a number of pressures is given in the second column in Table 3. Column 4 in that table gives the specific volume of the dry fraction determined from the Hugoniot curve of wet (20%) white clay and water using equation (3.1). The same relationship was then used to construct the Hugoniot curve of dry (4%) clay, dot-dash curve (curve 3) In Figure 3a. It can be seen from that figure that at pressures exceeding 120 kbar good agreement exists between the experimental and the computed Hugoniot curves. However, considerable disagreement occurs at low pressures. In the opinion of the authors, this disagreement can be attributed to porosity of dry clay samples. Considerable pressure is required for total closing of voids, i.e., even at 100 kbar their volume is approximately equal to 2.5% of the total volume of the compressed sample.
Similar results are obtained by analogous construction for green clays (see Figure 3b) for which the pressure required for total closing of voids is approximately 60 kbar. The most important result observed in the case of shale is the clear manifestation of phase transitions at pressures corresponding to those along the Initial sector of the Hugoniot curve.
Interesting conclusions can be reached by comparing Hugoniot curves of dry clays with those of shale (see Figure 7). At P4** 200 kbar compression of green clay (2 in Figure 7),due to phase transitions, exceeds considerably compression of white clay (1). At higher pressures Hugoniot curves approach each other. The Hugoniot curve for shale (3) »which is characterized by higher
-101-
■ ,■-■ ■ ■■ ■■■■

0) X) 10 H
&
owe»
Is
|l tu
%4 • o o
si
n o o
1| 3"!
-4- UNCO-* SO-* tTvOQ PO00-* H cOtofnWWWCMCVKMCVICVJOl • ••••• oooooooooooo
2
CO ON Q CO f OWO lf\ UN t- Q f*S(ncr>l*\cvi(vi«cvic«wcu • •••«•••••• oooooooooooo
COMÄS^ W CM OJ CVI CU Si M • •••••«»••«• oooooooooooo
en-* t-1-\0 O^vö ^ >A t- P «o flSfoNS?hcvi«ojoi<vi««oJ oooooooooooo
HOOOOOOOOOOO
O Q H H « <VJ fO (n-* jf ö>
-102-

pvk bar
w \ !
V i
1
m \ \ j
^ \
' ' j 1
n ^^ m 0.30 ttJiV. cm /gr
Figure 7. Hugoniot curves for white clay (1), green clay (2), and shale (3)
density in the initial state, approaches the Hugoniot curve of white clay at P =- 140 kbar. The phase transition at approxi- mately 280 kbar results in the Hugoniot curve of shale being almost identical to the Hugoniot curve of green clay. At pressures exceeding 500 kbar, all three Hugoniot curves are almost identical, reflecting a general characteristic in compression of silicates and aluminosillcates, Compression of this common group of minerals to high pressures results in formation of close-packed structure formed by oxygen ions, characterized by similar compression and specific volumes.
REFERENCES
1. Al'tshuler, L.V. Utilization of shock waves in hijh-pressure physics. IN: Uspekhi flzlcheskikh nauk, v. 85, no. 2, 1965, 197
2. Al'tshuler, L.V., M.N. Pavlovskly, L.V. Kuleshova, and G.V. Simakov. Investigation of alkali metal halldes at high shock pressures and temperatures. IN: Fizika tverdogo tela, v. 5, no. 1, 1963, 279
3. Al'tshuler, L.V., S.B. Kormer, A.A. Bakanova, and R.F. Trunin. Equations of state of aluminum, copper, and lead In the range of high pressures. IN: Zhumal eksperimental'noy 1 teoreticheskoy fiziki, v. 38, no. 3, I960, 790
4. Pavlovskly, M.N. andV.P. Drakln. Metallic phase of carbon. IN: Zhurnal eksperimental'noy 1 teoreticheskoy fiziki. Pis'ma v redak- tslyu, v. 4, no. 5, 1966,64
5. Zel'dovlch, Ya. B. andYu. P. Rayzer. Physics of shock waves and high-temperature hydrodynamic phenomena. Moscow, izd-vo "Hzmatgiz," 1963
6. Ivanov, A.G. and S.A. Novlkov. Reflected shock rarefaction waves in iron and steel. IN: Zhurnal eksperimental'noy 1 teoreticheskoy fiziki, v. 40( no. 6, 1961, 1880
7. Al'tshuler, L.V., M.N. Pavlovskly, and V.P. Drakln. Characteristics of phase transition in loading and unloading shock waves. IN: Zhurnal eksperimental'noy 1 teoreticheskoy fiziki, v. 52, no. 2, 1967, 400
-103-
... ;.■,:.-;/ .■ ''■-■■.■..

"■rr ■?.■•■ ^i-^v0'V^' —
8. Al'tshuler, L.V., S.B. Kormer, M.I. Brazhnlk, L.A. Viadimirov, M.P. Speranskaya, and A.I. Funtikov. Isentropic compression of aluminum, copper, and iron at high pressures. IN: Zhurnal eksperimental1
noy i teoreticheskoy fiziki, v. 38, no. 4, 1960, 1061
9. Pavlovskiy, M. N. Formation of metallic modifications of germanium and silica under condition of shock compression. IN: Fizika tevrdogo tela, v. 9, no. 11, 1967, 3192
10. Dremin, A. N. and I.A. Karpukhin. M ethod of determining Hugoniot curves of dispersive materials. IN: Zhurnal prikladnoy mekhaniki i technicheskoy fiziki, no. 3, 1960, 184
11. Walsh, J.M. and M.H. Rice. Equation of state of water to 250 kbar. Journal of Chemical Physics, v. 26, no. 4, 1957, 824
12. Al'tshuler, L.V., A.A. Bakanova, andP.F. Trunin. Phase transitions during compression of water by strong shock waves. IN: AN SSSR. Doklady, v. 121, no. 1, 1958, 67
-104-
—-rr

':-'\ ■ ft ■ ■■-:-■-
. ■-.
MAGNETOELECTRIC METHOD OF DETERMINING DENSITY BEHIND COLLIDING SHOCK WAVES* [ E ]
Al'tshuler, L.V. and M.N. Pavlovskiy. IN: Zhurnal prikladnoy mekhaniki i tekhnicheskoy fizlkl, no. 2, 1971, 110-114
The data acquired by means of shock waves are most accurate when the material under investigation undergoes single-shock compression and when it does not undergo phase transitions into other crystalline modifications. A sequence of several shock waves instead of a single discontinuity is formed in elastic-plastic media and in materials undergoing phase transitions. The determination of Hugoniot data for such specimens is less accurate than for materials undergoing single-shock compression. Considerable difficulties also arise in investigations of media characterized by relaxation in which shock waves propagate with a variable velocity. Direct methods of recording density of material at high pressure during a prolonged time interval is a highly desirable goal for investigations of such complex phenomena. In particular, it is of interest to investigate states produced by head-on collision of shock waves having flat-topped profiles. A pressure which is constant throughout the whole specimen and which is several times greater than the pressure in the incident shock waves is achieved by this method. During collision of shock waves, the medium undergoes two-stage (two-shock) loading, with a smaller increase in entropy than that which occurs during single-shock compression.
In [1 ] the density of material behind the shock front of colliding waves was investigated by means of pulsed x-ray diffraction of compressed sections of the medium. In this manner, double-shock compression states were recorded in the pressure range between 500 and 900 kbar in paraffin, water, plexiglass, magnesium, and aluminum. In this paper, we summarize the results of density determination of shock compressed, nonconducting specimens. The results of measurements of double-shock compression of paraffin, clay, and crystalline KCX and NaCX are also given. The method used in the investigation is a modification of the well-known magnetoelectric method of recording particle velocities developed by Ye. K. Zavoyskiy C2] .
1, Experimental Arrangement. In order to determine the degree of compression, the specimen being investigated is placed in a constant magnetic field. A conductor in the shape of an almost closed loop is imbedded in the specimen with the plane of the conductor perpendicular to the magnetic lines of force. An electromotive force is induced in the conductor during compression
E=-Hf lO-W/sec, nf =^ , (1.1)
where i is the magnetic flux.
* Slightly abbreviated translation.
-105-
It follows from equation (1.1) that at an arbitrary time t after beginning of compression the area of the conductor is
S(t)=S0"H"J !E,dt* (1*2)
0
The average density of the conductor material is
w.v , .t
'I-'O^-SH^1 ' J(t) = J CE]dt' (1'3)
where S« and S are the initial area of the conductor and the area at a time t, respectively; E is the voltage in volts; H is the magnetic field strength in Oersteds, p- is the initial density of the medium, and P2 is the density of the medium behind the shock front.
In order to compute p2, it is necessary to determine J(t), which is equal to the area under the curve recorded by the oscillograph, at the end of compression, when the reflected shock waves leave the conductor. The shape of the conductor is immaterial and can be arbitrary. However, the initial area of the conductor must be known. In addition to density, one must determine the pressure during collision of shock waves. The best method of measuring pressure would be by means of manganin gauges imbedded in the plane of the conductor. This would make it possible to acquire the necessary data without reversal to kinematic parameters of shock waves, i.e., by a new and completely independent technique. However, in th^se experiments the pressure was determined from the amplitude of the incident shock waves.
Figure 1 shows the arrangement used in double-shock compression experiments. The measurements were performed by means of electromagnetic gauges in the shape of rectangular frames, the long sides of which were arranged parallel to the incident shock waves. Figure 2 is an x vs t plot of motion of the frame during simultaneous and nonsimultaneous arrival of shock waves at the gauge. In the first case, the average particle velocity of the sides of the gauge affected by the incident shock wave is proportional to one-half of the rise shown in that figure; in the second case it is given by formula (1.4)
V (Jj + i J2 + J3) (Ht)'1 . (1.4)
The function J2 corresponds to the motion of both sides of the gauge and the functions Ji and J3 correspond to individual motion of its left or its right side at the beginning or at the end of collision. If the shock wave strength behind the wave front of the incident shock waves decreases, the velocities with which the opposite sides of the frame approach each other also decrease 1 Under these conditions, the material behind the wave fronts of reflected waves acquires a small negative rarefaction velocity and the record of emf for waves
-106-
Z'-mmMvvM,,^^ . «iäteft
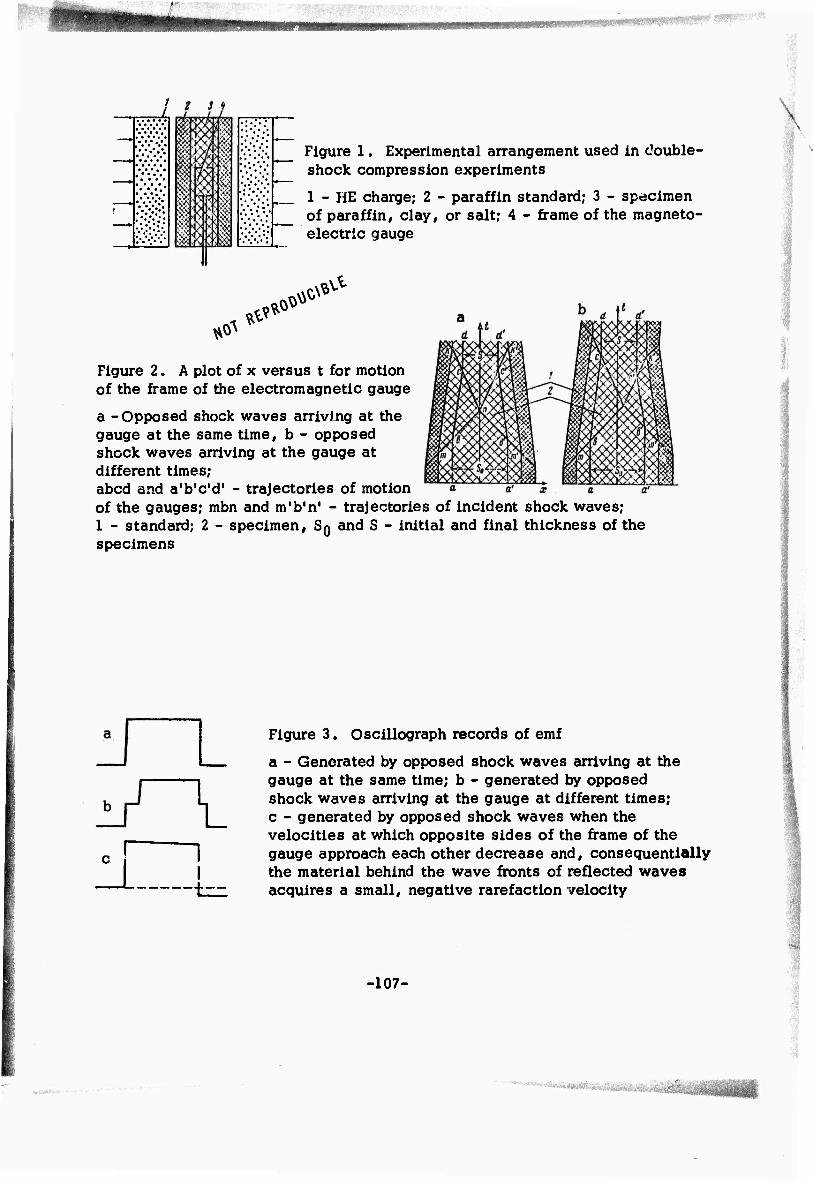
.
^
Figure 1. Experimental arrangement used in double- shock compression experiments
1 - HE charge; 2 - paraffin standard; 3 - specimen of paraffin, clay, or salt; 4 - frame of the magneto- electric gauge
^ ^
^ *\S
Figure 2. A plot of x versus t for motion of the frame of the electromagnetic gauge
a -Opposed shock waves arriving at the gauge at the same time, b - opposed shock waves arriving at the gauge at different times; abed and a'b'c'd' - trajectories of motion of the gauges; mbn and m'b'n' - trajectories of incident shock waves; 1 - standard; 2 - specimen, SQ and S - initial and final thickness of the specimens
i
v Figure 3. Oscillograph records of emf
a - Generated by opposed shock waves arriving at the gauge at the same time; b - generated by opposed shock waves arriving at the gauge at different times; c - generated by opposed shock waves when the velocities at which opposite sides of the frame of the gauge approach each other decrease and, consequentially the material behind the wave fronts of reflected waves acquires a small, negative rarefaction velocity
-107-
■' - ■■ -.;■■.
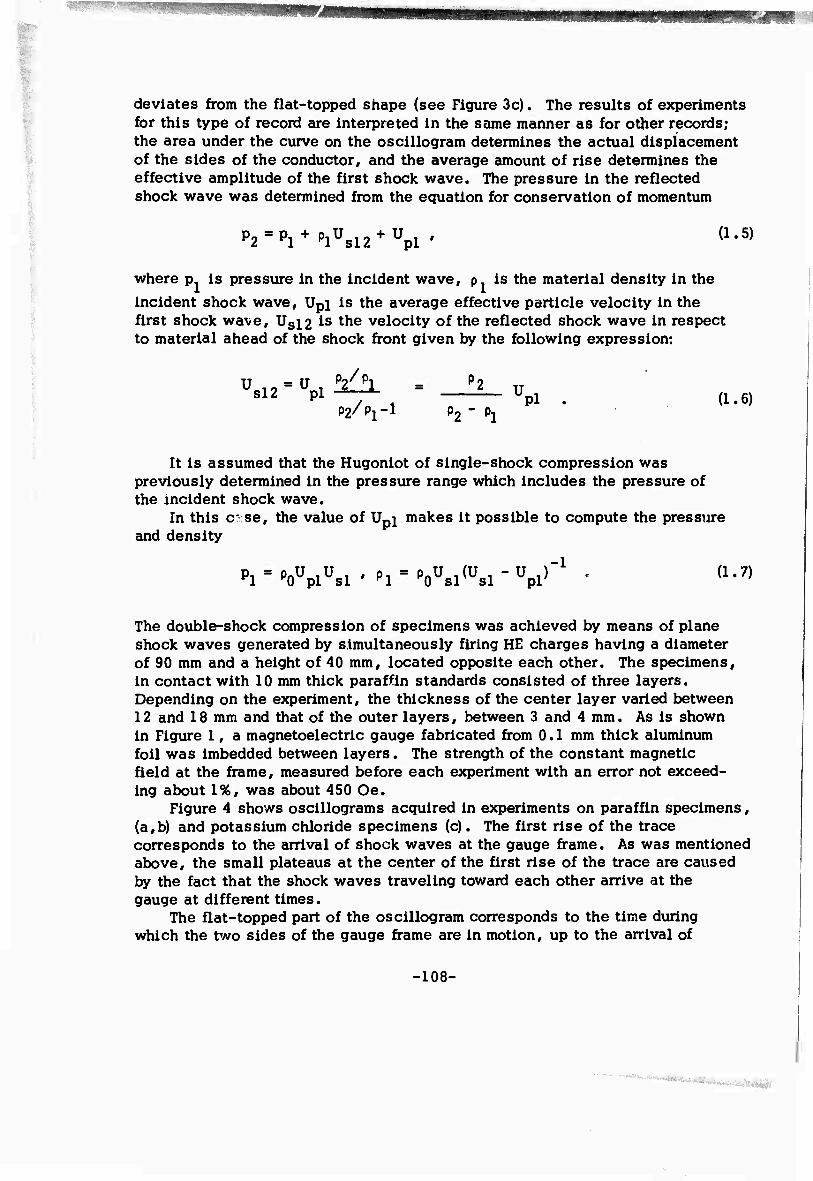
deviates from the flat-topped shape (see Figure 3c). The results of experiments for this type of record are interpreted in the same manner as for other records; the area under the curve on the oscillogram determines the actual displacement of the sides of the conductor, and the average amount of rise determines the effective amplitude of the first shock wave. The pressure in the reflected shock wave was determined from the equation for conservation of momentum
P2 = Pl+PlUsl2 + Upl ' (1-5)
where p. is pressure in the incident wave, p. is the material density in the incident shock wave, Upi is the average effective particle velocity in the first shock wave, Usi2 is the velocity of the reflected shock wave in respect to material ahead of the shock front given by the following expression:
"pi . (1.6) usl2 = upl!2^L = _^v
P2/PJ-1 P2 - Pj
It is assumed that the Hugoniot of single-shock compression was previously determined in the pressure range which includes the pressure of the incident shock wave.
In this c-se, the value of Upj makes it possible to compute the pressure and density
"l-'oVsl-'l-VslNsl-V"1 • (1-7)
The double-shock compression of specimens was achieved by means of plane shock waves generated by simultaneously firing HE charges having a diameter of 90 mm and a height of 40 mm, located opposite each other. The specimens, in contact with 10 mm thick paraffin standards consisted of three layers. Depending on the experiment, the thickness of the center layer varied between 12 and 18 mm and that of the outer layers, between 3 and 4 mm. As is shown in Figure 1, a magnetoelectric gauge fabricated from 0.1 mm thick aluminum foil was imbedded between layers. The strength of the constant magnetic field at the frame, measured before each experiment with an error not exceed- ing about 1%, was about 450 Oe.
Figure 4 shows oscillograms acquired in experiments on paraffin specimens, (a,b) and potassium chloride specimens (c). The first rise of the trace corresponds to the arrival of shock waves at the gauge frame. As was mentioned above, the small plateaus at the center of the first rise of the trace are caused by the fact that the shock waves traveling toward each other arrive at the gauge at different times.
The flat-topped part of the oscillogram corresponds to the time during which the two sides of the gauge frame are in motion, up to the arrival of
-108-
ȟa
„,,s;,SI.,..;iT.V,;:,: ,,.,.,,j.nv
reflected waves, after which the motion of the frame stops, the induced emf and the trace on the oscillogram drop down to zero. The plateau at the center of the rear front of the pulse corresponds to the difference in the arrival time of reflected shock waves at the frame of the gauge. The difference in their arrival time is considerably smaller than the difference in the arrival time of first shock waves. This is caused by compression of the frame of the gauge and a considerably larger velocity of reflected shock waves. Experiments performed under identical conditions have shown that eventhough some individual differences in the behavior of oscillographic curves do occur, the integral characteristics of the process (total displacement, average velocity) remain very stable.
2. Two-Shock Compression of Clay, Paraffin, Potassium Chloride, and Sodium Chloride. The pressure and density behind colliding shock waves were measured in specimens of paraffin, clay, and single crystals of potassium chloride and sodium chloride. The Hugoniot data of materials under investigation were determined from particle velocities generated by first shock waves using the available data on compression of these substances given in 0. ,3,4] . The computations were performed using the following formulas taken from those references: U = 3.30+ 1.31 U for paraffin, U = 2.78+ 1.21 U for "white" s p J p clay with water content of about 4% (A), Us = 3.40 + 135 U for NaCX and U = 2.05 + 1.62 Up for the second phase of KC i. The shock Hugoniot data for KCijoO' N^^lOO' "whlte" clay with water content of about 4% (A) and paraffin (B) are summarized in Table 1 and in Figure 5 (in the form of P vs a Hugoniot curves. Figure 5c compares the data given in Table 1 vith single- shock compression Hugoniot data given in C>,6] . It can be seen from Figure 5 that the results of the measurements of double-shock compression of paraffin, clay,and KCi are in good agreement with single-shock compression Hugoniot curves, i.e., in accordance with theory, the experimental points obtained in double-shock compression experiments are displaced to the right of single-shock compression Hugoniot points, i.e., toward higher densities.
The positions of experimental points for NaCi compressed along the (100) axis clearly indicate the presence of polymorphic transition in NaCi at a pressure of about 270 kbar, apparently to a CsCjHype structure. The results obtained verify the data given in [6], where a phase transition in NaC i was observed at approximately the same pressure.
The fact that polymorphic transition of NaCi was observed during double- shock compression experiments can be attributed to an increase in shear stresses, i.e., only the initial stages of transformations were observed during single-shock compression of NaC 102,7] . A cusp in the Hugoniot curve for NaCi at about 1.5 Mbar noted in 0]can apparently be attributed to melting.
t
\
-109-
. ..■■■;. .■
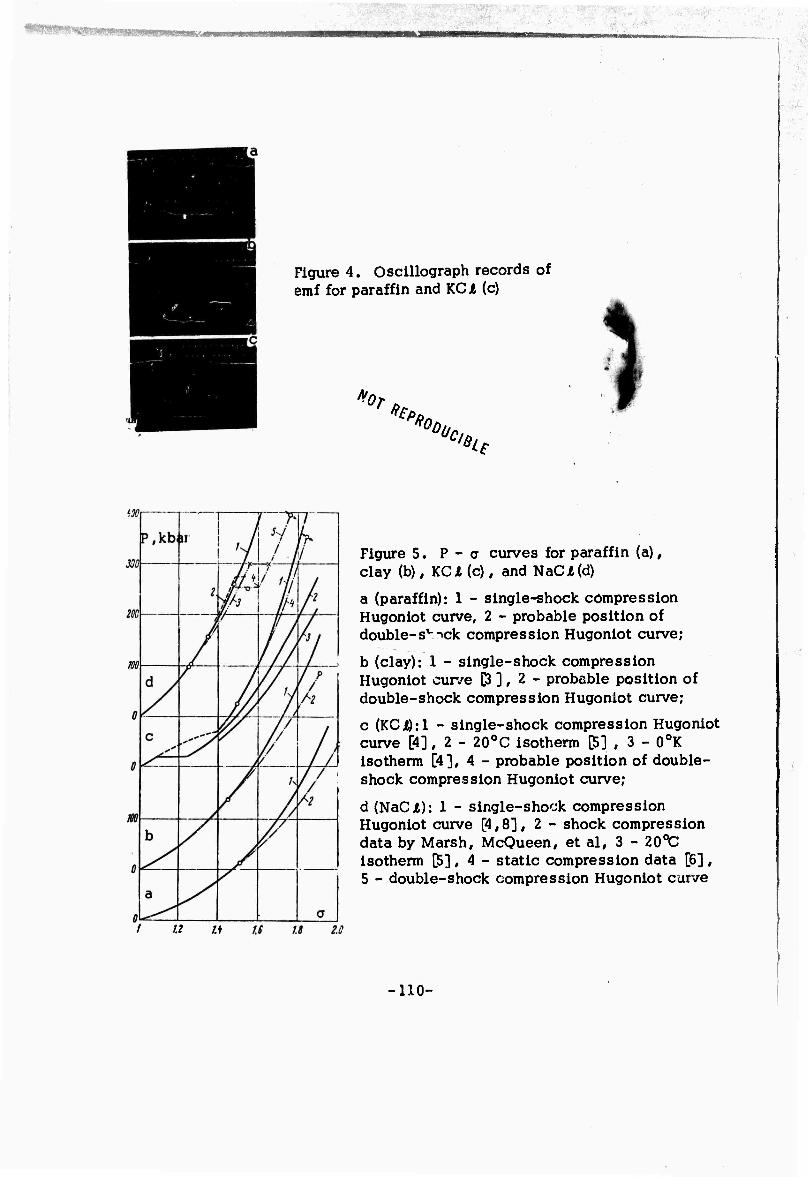
Figure 4. Oscillograph records of emf for paraffin and KG I (c)
fr or fiffi '%
% '*ie
Figure 5. P - a curves for paraffin (a), clay (b), KCA (c), and NaCjt(d)
a (paraffin): 1 - single-shock compression Hugoniot curve, 2 - probable position of double-s'-ock compression Hugoniot curve;
b (clay): 1 - single-shock compression Hugoniot curve D ] , 2 - probable position of double-shock compression Hugoniot curve;
c (KCi):l - single-shock compression Hugoniot curve [4], 2 - 20oC isotherm p] , 3 - 0oK isotherm [4], 4 - probable position of double- shock compression Hugoniot curve;
d (NaCjt): 1 - single-shock compression Hugoniot curve [4,8], 2 - shock compression data by Marsh, McQueen, et al, 3 - 20oC isotherm [5] , 4 - static compression data [6] , 5 - double-shock compression Hugoniot curve
/ u a
-no-

•■.■■=!■ • '
Table 1* %
^/> ^
% ^f
Material p0 U
s üP Pl Pl Usl2 P2 P2
KCl 1.99 4.36 1.44 125 2.97 7.70 454 3.00 4.71 0.90 97.5 2.71 6.30 203 3.20
NaCA 2.ir> 4.77 1.00 103.2 2.70 5.45 252 3.35 5.26 1.37 155.7 2.92 5.97 395.7 3.81
A 2.13 4.49 1.42 137.5 3.12 5.68 387 4.10 B 0.9 5.90 2.03 109 1.37 8.43 344 1.81
* A - "white" clay with ~4% water content, B - paraffin, p0 - Initial density (gr/cm3)
Single shock-compression: U , - shock velocity (km/sec), U , - si pi particle velocity (km/sec), p. - pressure (kbar), pl - density behind
first shock wave (gr/cm )
Double shock compression (compression by reflected shock waves): Usi2 - shock velocity of reflected waves relative to material In motion (km/sec), p. - pressure due to double-shock compression (kbai), fu - final density (gr/cia3)
-111-
■

».:;;
REFERENCES
1. Al'tshuler, L.V. and A.P. Petmnin. X-ray investigation of light materials during oblique collision of shock waves. IN: Zhurnal tekhnicheskoy fiziki, v. 31, no. 6, 1961
2. Al'tshuler, L.V. Utilization of shock waves in high-pressure physics. IN: Uspekhi fizicheskikh nauk, v. 85, no. 2, 1965, 197
3. Al'tshuler, L.V. and M.N. Pavlovskiy. Investigation of clays and clayey shale at strong dynamic loads. IN: Zhurnal prikladnoy mekhaniki i tekhnicheskoy fiziki, no. 1, 1971, 171
4. Al'tshuler, L.V., M.N. Pavlovskiy, L.V. Kuleshova, and G.V. Simakov. Shock compression investigation of alkali halides under high pressures and temperatures. IN: Fizika tverdogo tela, v. 5, no. 1, 1963, 279
5. E.A. Perez-Albuerne and G.H. Drickamer. Effect of high pressures on the compressibility of seven crystals having the NaCX or CsCA structure. Journal of Chemical Physics, v. 43, no. 4, 1965, 1381
6. Basset, W.A., T. Takanashi,Ho-Kwang Mao, and J.S. Weaver. Pressure induced phase transformations in NaCjfc. Journal of Applied Physics, v. 39, no. I, 1968, 319
7. Al'tshuler, L.V., M.I. Brazhnik, V.N. German, and L.I. Mirkin. Explosion deformation of single crystals. IN: Fizika tverdogo tela, v. 9, no. 11, 1967, 3063
8 ihuler, L.V. f L.V. Kuleshova, and M.N. Pavlovskiy. Dynamic compression, equation of state, and electrical conductivity of sodium chloride at high pressures. IN: Zhurnal eksperimental'noy i teoreticheskoy fiziki, v. 39, no. 1(7), 16
9. Kormer, S.B., M.V. Sinitsin, A.I. Funtikov, V.D. Urlin, and A.V. Blinov. Investigation of compression of five ionic compounds to pressures of 5 Mbar. IN: Zhurnal eksperimental'noy i teoreticheskoy fiziki, v. 47, no. 4, 1964, 1202
-112-
■ ■ "
PRESERVATION AND INVESTIGATION OF SHOCK COMPRESSED SINGLE CRYSTALS OF FLUORITE (E ]
Batsanov, S.S., Ye. M. Malyshev, L.I. Kobets, and V.P. Ivanov. IN: Fizika gorenlya i vzryva, v. 5, no. 3, 1969, 444-446
Specimens of single crystals of fluorlte prepared by cleaving along the 111 plane and embedded in fluorite powder compressed to 90% of its density in crystal form were tube shocked to pressures of 50, 63, 69, and 74 kbar. The shock waves were generated by detonating 25, 50, 75. and 100 gr hexogen charges in contact with one side of a rectangular steel tube containing the specimen. Examination of explosively impacted specimens shows that fluorite samples were covered with cracks along the cleavage planes, decreasing their transparency. The degree of perfection of fluorite specimens prior to and after shock loading was investigated by means of x-ray diffraction. It was determined that single crystal structure of fluorite was preserved after exposure to shock waves, however, the specimens exhibited radial asterism indicating considerable misorientation of large regions of specimens and the presence of strong stresses. The dislocation structure of specimens was investigated by means of etching. It was determined that the density of dislocations in the shock loaded specimens Increased from 4 x 10^ to 4,8 x 10⁷ - 5.6 x 107 cm • cm~^. The increase in density of dislocations with increasing pressure was accompanied by an increase in microhardness attributed to misorientation of large regions of specimens.
-113-
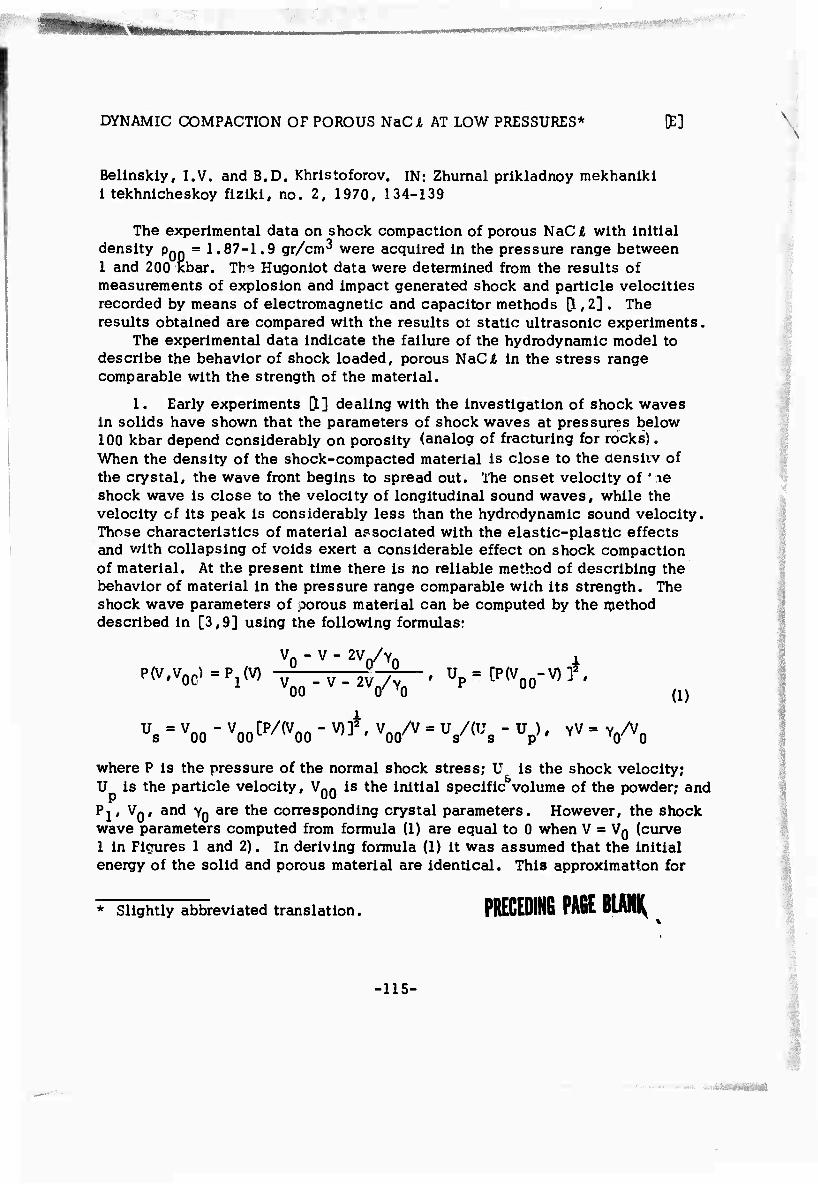
DYNAMIC COMPACTION OF POROUS NaCi AT LOW PRESSURES* fc]
Bellnskly, I.V. and B.D. Khrlstoforov. IN: Zhurnal prlkladnoy mekhaniki 1 tekhnlcheskoy flzikl, no. 2, 1970, 134-139
The experimental data on shock compaction of porous NaCl with initial density p00 = 1.87-1.9 gr/cm^ were acquired in the pressure range between 1 and 200 kbar. The Hugoniot data were determined from the results of measurements of explosion and impact generated shock and particle velocities recorded by means of electromagnetic and capacitor methods U, 2] . The results obtained are compared with the results ot static ultrasonic experiments,
The experimental data indicate the failure of the hydrodynamic model to describe the behavior of shock loaded, porous NaCl in the stress range comparable with the strength of the material.
1. Early experiments [1] dealing with the investigation of shock waves in solids have shown that the parameters of shock waves at pressures below 100 kbar depend considerably on porosity {analog of fracturing for rocks). When the density of the shock-compacted material is close to the densiiv of the crystal, the wave front begins to spread out. The onset velocity of ' le shock wave is close to the velocity of longitudinal sound waves, while the velocity of its peak is considerably less than the hydrodynamic sound velocity. Those characteristics of material associated with the elastic-plastic effects and with collapsing of voids exert a considerable effect on shock compaction of material. At the present time there is no reliable method of describing the behavior of material in the pressure range comparable with its strength. The shock wave parameters of porous material can be computed by the method described in [3,9] using the following formulasr
P(V#V0C) =P (V) V0 - V - 2V /Y0 i
a)
"s - voo - voo CP/(voo - W • V* - V(,;s - V ■ W - VV,, where P is the pressure of the normal shock stress; U is the shock velocity; U is the particle velocity, VQ0 is the initial specific volume of the powder; and Pj, VQ, and Yg are the corresponding crystal parameters. However, the shock wave parameters computed from formula (1) are equal to 0 when V = VQ (curve 1 in Figures 1 and 2). In deriving formula (1) it was assumed that the initial energy of the solid and porous material are identical. This approximation for
* Slightly abbreviated translation. PRECEDING PACE UAty
-115-

■i
Figure 1. a - Variation of the shock velocity Us
with the peak particle velocity Up; b - variation of the peak particle velocity Up with the relative density p/p«; 1 - computed from formula (1); 2 - linear Us(Up) relationship; 3 - onset velocity of the elastic wave; I - experimental shock and particle velocities; II - experimental particle velocities and densities; III - impact experiments; IV - ultrasonic measurements
P.kbar
Figure 2. Variation of the normal compressive stress on the relative density p/pQ
1 - Computed from formula (1); 2 - Hooke's law for a plane stress state; 3 - Bridgman's data; 3* - static compression data on a jacketed specimen of NaCjfc with PQQ = 1.87 gr/cm3. The upper left hand corner shows the range of low- pressures plotted on a larger scale.
-116-
::-^>\, -
the Grunelsen ratio Y is convenient and does not lead to considerable errors in the low-pressure range. ThePj (V) dependence was taken from [5].
Actually, the collapsing of voids is connected with fracturing and plastic deformation of powder grains. Therefore, at stresses close to the strength of the grains computations based on the hydrodynamic model will not describe the actual effects. As a result, shock compaction of NaCjJ powder in the low-pressure range was determined experimentally.
2. The plane shock vaves in specimens of Nad were generated by explosion or impact of thin aluminum plates. In explosion experiments the charges consisted of mixtures of TNT-hexogene 30/50 or TNT-benzoic acid 50/50 of varying density with a diameter of 100 and 84 mm. The required strength and rectangular profile of the shock waves were achieved by separating the charge from the specimen by inter-layers of brass, benzole acid, or air. Use of explosive lenses made it possible to generate shock waves with shock tilt not exceeding 0.1 a sec. The impact of 0.5 mm aluminum flyer plates on 5 mm brass standards generated a plane shock wave. The flyer plate tilt and curvature did not exceed 0.2 jjisec. The velocity of flyers varied between 1.65 and 1.72 km/sec. The cylindrical specimens of NaCA powder which had an 84 mm diameter and a thickness oetween 2 and 25 mm, the grain dimensions of which were about 0.3 mm, were compressed to densities of 1.87 and 1.88-1.90 gr/cm in impact and explosion experiments, respectively.
The particle and shock wave velocities generated by HE charges were measured by two electromagnetic gauges imbedded in the specimen and separated from each other by a distance of 5-7 mm. The gauge displacement and the density of the shock-compressed material were determined by integrating recordings of particle velocity over time. The signals from the gauges were recorded simultaneously by two OK-17 oscillographs and one OK-33 oscillograph. The error in determining the shock and particle velocities was about + 3%. A systematic 3% under-estimate of particle velocity may have occurred as a result of not taking into account the steep slope of the shock front and the Internal resistance of the gauge. In flyer plate experiments the particle velocity was measured by the electromagnetic method and its free surface velocity Uf<s> by the capacitor method. In addition, the transit time of the shock wave through the sample Was also determined. The time of impact was recorded by an electrical contactor. Throughout the whole range of measurements it was assumed that Uf#s# is equal to 2 U . At Up>100 m/sec, both methods of determining particle velocity of material provided identical results. In experiments performed, the shock velocity was detemTined by graphic differentiation of the onset and the peak of the wave on the time- distance curve of the shock wave which was constructed from measurements of the transit time of the shock wave between the impact surface and the gauge.
The elastic constants of specimens under normal conditions were determined from velocities Cj and C2 of longitudinal and shear sound waves measured on an ultrasonic UZIS-LYETI-4 device at a frequency of 1.67 MHz.
-117-
.' ■

.,,. iVH^ßm^m^.
The computations were based on a comparison of the transit times in the specimen and standard consisting of an 18 percent solution of alcohol in distilled water, the sound velocity in which is equal to 1600 +10 m/sec. Specimens with a density between 1.56 and 2.15 gr/cm and grain dimensions less than 0.11. about 0.3 and greater than 0.4 mm , and also NaCi single crystal specimens were used in the experiments. The error in individual ultrasonic measurements was approximately 3%.
3. The measured values of Cj and C^ were utilized in computing the hydrodynamic sound velocity C3 = (K/PQO)
5 , Poisson's ratio v , Young's
modulus E, bulk modulus K, and rigidity G. It was established that the values of elastic constants increase with increasing density and, within the accuracy of the experimental error, are independent of grain dimensions. The results of measurements in the crystal coincide with other data [6] . It was determined that the variation of Cj and C2 with density could be expressed by the following linear relationship:
Cj = 3.47p00 - 2.95, C2 = 1.90p00 - 1.49,
3 3 where C is in km/sec and p is in gr/cm . At PQ« = 1.87 gr/cm , C, = 3.54, C2 = 2.06, and C3 = 2.64 km/sec. At PQQ = 1.89 gr/cm3, Cj = 3.61, C2 = 2.10, and C3 = 2.68 km/sec.
A plot of particle velocities vs time generated in explosion and impact experiments is shown in Figures 3a and 3b, respectively. A precursor is observed at peak particle velocities less than 850 m/sec. The velocity of its onset is about 3.5 km/sec, a value which coincides with the measured velocity of longitudinal sound waves. Therefore, the precursor is apparently an elastic wave. In the paiiicle velocity range 300 < U- ^ 850 m/sec, the precursor is followed by a shock wave. At Up ^ 300 m/sec, the wave front becomes less steep and, at lower peak particle velocities, the wave can not be considered a shock wave. Formation of the above noted character- istics of the shock wave profile in the region of loading is independent of the nature of the source of shock waves an .1 depends only on their strength. The rise time of the wave front increases with distance traversed and, under conditions of the experimen s, reached 7 y.sec. Figure 4 shows the onset velocity (curve I) and velocity of the wave's peak (curve II) at the impact plotted in m vs t coordinates, where m is the mass coordinate. The same figure shows the equal particle vf.'locity lines determined during processing of experimental records. Each line shows the particle velocity in m/sec. The equal velocity lines begin at the point m = 0.4 gr/cm^, where U- is « 800 m/sec at the time of formation of the two-wave structure, and terminate at line II. The velocity of the wave's peak decreases at m ^ 1, but begins to increase at larger distances. The slope of the equal velocity lines decreases with decreasing particle velocity.
The Hugoniot data at low pressures were determined by integrating the equations of motion and the equation of continuity over a given range of
•118-

mmmmmm
U_f km/sec '0—&
Figure 3. Particle velocity profile U as a function of time t
P a - Explosion generated; b - impact generated
t, p. sec
Figure 4. A plot of m vs t (impact compression diagram)
I - Wave front; II - unloading wave; III - constant velocity curves. The numbers on the curves III are the particle velocities in m/sec.
-119-
.. ,.,.

^HHNHMHHI ■.y-:!-f.':;-/fx^i :•*•:*; ■(;-i?':'v"
particle velocities in the loading region (see Figure 4)
6P(m,t) + 6u(m.t) = 0 , 5V(m.t)„ bu(mtt) bm bt bt bm
(2)
where P(m,t) is the normal stress. Integrating {?,), we obtain
m p(m#t)=.J ™^dm+{p{t).
M
dt + * (m) .
(3)
Integration of (2) is performed from the shock front of the elastic wave with coordinates M,T issuming that at the shock front P = 0 and V = VQ«.
From this if follows that cp(t) = 0 and t(m) = VQQ. Integrating the first equation for t = T and the second equation for m = M and using the condition that Up(M,T) = 0 we obtain:
m P(m,t) = - -^ J u(m,t)dm, V(m,t) - V00 = A- J u(m,t) dt (4)
M
Equation (4) was solved numerically using a difference technique. Designating
Pm P1
J(m,t) = | u(m#t)dm, r(m,t) = J u(m#t) dt,
M T
we can rewrite (4) in the following form:
Pim^tJ = - Km^t^ M^ - Km^^- At.)
Vim.,^) - V00=
2^ r(m -! Am , t^ - rCmj - Am »tj,)
2Ami
(5)
Equations (5) provide normal stresses P and specific volume V at any point of the loading region with a given Up, m, and t.
The strains in the region of the shock front were determined from the measured displacement of the electromagnetic gauge using the following formula:
-120-

«ST*- ■J- '
e = voo-v
voo
1 T AX
— Ju(M,t)dt, t= — 0
where AX is the distance between two gauges and U is the average shock velocity between the two gauges. For a given e , U was taken to be an average between the values of Us at the end of the recording of the first gauge and at the front of the second. The Hugoniot data were determined from the measured values of Us, Up, Uf>s>, and e with the aid of the conservation equations at the shock front. '(The parameters of the precursor were neglected.) The shock compression parameters at low pressures were determined from formula (5).
4. Figure 1 is a plot of the experimental shock velocity vs particle velocity. The crosses designate the results of explosion experiments in which Us was measured between the two gauges. The points designate shock velocity computed from the experimental data using the formula Us = (Upp/pQQ) (p/pno"-) • Tlie circles show the velocity of the wave's peak during
impact determined by graphical differentiation of the tiir' distance curve of the wave's peak shown in Figure 4. The velocity of he weve's peak is a phase velocity and does not define completely the propagation velocity of the whole compressional wave. In the case of strong shock waves the experi- mental curve lies on the average ~3% above the computed curve 1, so that the experimental data exceed slightly the possible systematic experimental error. As particle velocity decreases, the shock velocity decreases rapidly, reaching a minimum approximately equal to Cjl at U »150 m/sec. As U
decreases further, the velocity of the wave's peak increases, approaching sound velocity, and the computed curve 1 approaches zero. The linear relationship between the particle velocity and shock velocity given by the expression Up = 2.68 + 1.43 Up, drawn through the value of the hydrodynamic sound velocity C3 at Up = 0, and the experimental points in the high-pressure range (curve 2) describe the results of experiments in the range of Up ^ 850 m/sec. At Up = 850 m/sec, curve 2 lies approximately 5% above the experimental data.
Figure 1 b shows the dependence of Up on p/ pn, computed from formula (1), and a plot of the experimental data. In the low-pressure range the material reaches density of the single crystal at the peak particle velocity Up «250 m/sec. The particle velocity at p/p« = 1 computed from formula (1) is zero. At p/pg > 1.03, the experimental curve is in good agreement, but lies slightly above the computed curve 1.
Figure 2 shows the normal stresses during compression of NaC£ as a function of p/p« computed from experimental data. In the range pn/p >1.03 the experimental results are in agreement with calculations (curve 1). The observed difference of about 6% corresponds to the difference in the variation of the particle velocity vs shock velocity shown in Figure la. The same figure shows the low-pressure range on a somewhat larger scale. The data
;;A
-121-
i -A*ijr.k J „,,
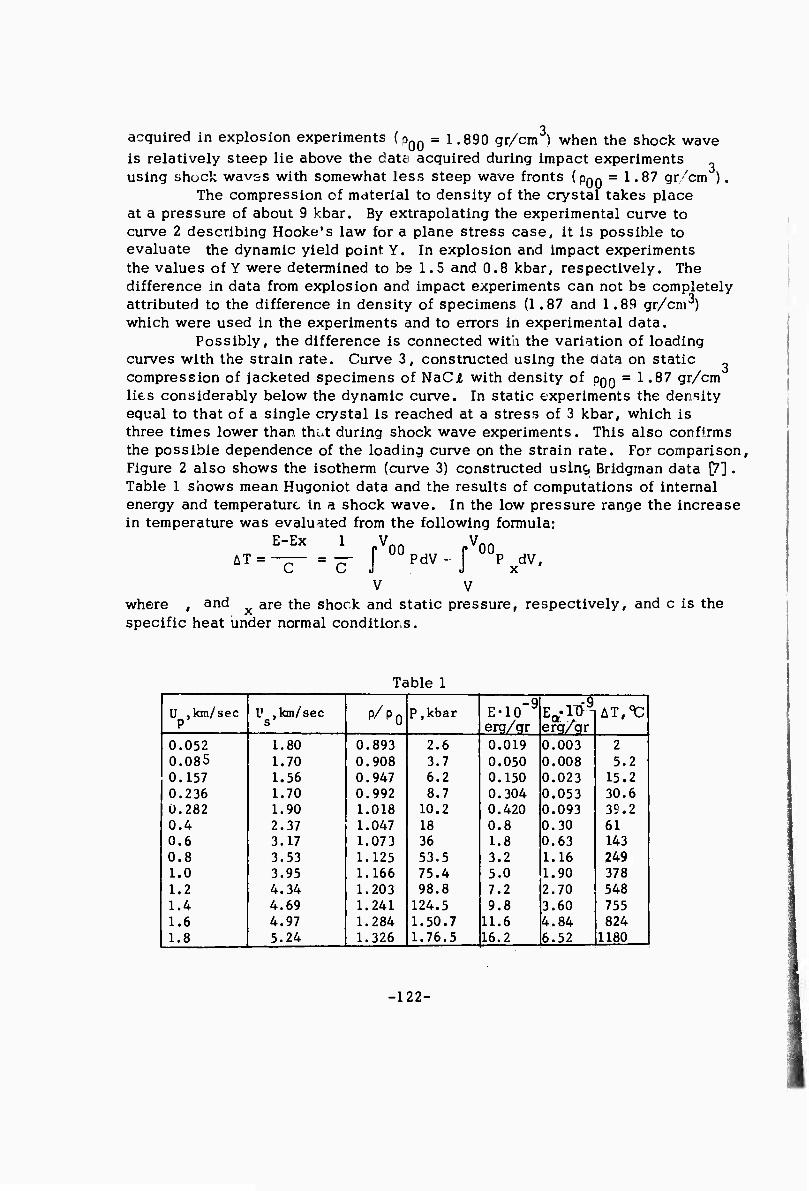
acquired in explosion experiments {p00 = l .890 gr/cm ) when the shock wave is relatively steep lie above the date acquired during impact experiments using shock wavss with somewhat less steep wave fronts (pQQ = 1.87 gr/cm ).
The compression of material to density of the crystal takes place at a pressure of about 9 kbar. By extrapolating the experimental curve to curve 2 describing Hooke's law for a plane stress case, it is possible to evaluate the dynamic yield point Y. In explosion and impact experiments the values of Y were determined to be 1.5 and 0.8 kbar, respectively. The difference in data from explosion and impact experiments can not be completely attributed to the difference in density of specimens (1.87 and 1.89 gr/cm3) which were used in the experiments and to errors in experimental data.
Possibly, the difference is connected with the variation of loading curves with the strain rate. Curve 3, constructed using the aata on static compression of jacketed specimens of NaCA with density of OQQ = 1.87 gr/cm lies considerably below the dynamic curve. In static experiments the density equal to that of a single crystal is reached at a stress of 3 kbar, which is three times lower than, thüt during shock wave experiments. This also confirms the possible dependence of the loading curve on the strain rate. For comparison. Figure 2 also shows the isotherm (curve 3) constructed usinc, Bridgman data [7] . Table 1 shows mean Hugoniot data and the results of computations of internal energy and temperature in a shock wave. In the low pressure range the increase in temperature was evaluated from the following formula:
E-Ex AT =
C
1 Vnn V 00 P dV,
x V V
where , and x are the shock and static pressure, respectively, and c is the specific heat under normal conditions.
Table 1
U .km/sec U ,km/sec P/P0 P,kbar E-10 .9
erg/gr AT,^
P s erg/gr 0.052 1.80 0.893 2.6 0.019 0.003 2 | 0.085 1.70 0.908 3.7 0.050 0.008 5.2 0.157 1.56 0.947 6.2 0.150 0.023 15.2 0.236 1.70 0.992 8.7 0.304 0.053 30.6 0.282 1.90 1.018 10.2 0.420 0.093 3S.2 0.4 2.37 1.047 18 0.8 0.30 61 0.6 3.17 1.073 36 1.8 0.63 143 0.8 3.53 1.125 53.5 3.2 1.16 249 1.0 3.95 1.166 75.4 5.0 1.90 378 1.2 4.34 1.203 98.8 7.2 2.70 548 1.4 4.69 1.241 124.5 9.8 3.60 755 1.6 4.97 1.284 1.50.7 11.6 4.84 824 1.8 5.24 1.326 1.76.5 16.2 6.52 1180 i
-122-

5. Investigations of behavior of shock-loaded, porous NaCA at pressures up to 200 kbar indicate the presence of three different state regions. In the first region (U- >850 m/sec), in the first approximation, the material can be considered as ideal liquid and the Hugoniot can be described by a linear shock vs particle velocity relationship constructed using experimental data. The Hugoniot computed from the Mie Gruneisen equation of state and the Hugoniot for single crystal C5] lie below shock comaction data for a powder by an amount exceeding slightly the systematic experimental error. Analogous results were also observed in experiments with porous metals [7].
In the second region 250 ^ U ~ 850 m/sec a two-wave structure is observed during propagation of the shock wave through material. In this region the material behaves as an elastic-plastic substance. The first wave propagates with a velocity coinciding with sound velocity (Ci =3.61 km/sec). The shock front is spread out. This wave is apparently associated with elastic compression of material as a whole. The particle velocity of the elastic wave in the region of its intersection with the shock front of the sub- sequent plastic wave is ~ 30 km/sec, corresponding to a pressure of ~ 1.5 kbar, a value which is close to the value cf the yield point determined from the P (P/PQ) curve in Figure 2. The velocity of the plastic shock wave at Up « 300 m/sec is approximately 1.5 times smaller than that determined from the linear Us vs Up relationship. In the third region (Up < 250 m/sec, p<Po. and where the shock wave strength is insufficient to collapse the pores) the front of the plastic wave spreads out by an amount which Increases with decreasing strength of the shock wave and increasing length of the path traversed in the material. The elastic wave closely follows the plastic waves and the two are difficult to separate. The velocity of the wave's peak has a minimum value at Up « 150 m/sec =- C^/2. In view of the fact that the state of material at lower particle velocity approaches the state of elastic compres- sion, the peak velocity of the wave increases, approaching C^ . TheP (p/pg) curve is concave toward the p/p« axis (see Figure 2).
At the present time th'-re is no adequate description of the behavior of porous materials shock com; acted to density less than the density of a single crystal. Therefore, the results of shock experiments were compared with the date on static deformation of specimens. A considerable difference Is observed between shock wave and static compression curves in the pressure range where the material still retains porosity. Collapsing of pores of material during these processes occurs at 9 and 3 kbar, respectively. The Hugoniot curve computed by the usual methods from the static curve practically coincides with the later The material is not heated during this process. Therefore, the high temperature computed from the measured dynamic curve (see Table 1), Is apparently associated with heating due to friction during compaction or grains of material and their plastic flow Into the pores. In this case, one can also expect that loading time shall exert some Influence on the deformation of specimens. This apparently has an effect on the difference between P(p/(k) curves for shock loading by short-duration and long-duration waves and the static deformation curves.
-123-
REFERENCES
1. Belinskiy, I.V. and B.D. Khristoforov. Viscosity of NaC£ during shock compression. IN: Zhurnal prikladnoy mekhaniki i tekhnicheskoy fiziki no. 1, 1968
2. Belinskiy, I.V. and B.D. Khristoforov. Attenuation of impact generated plane shock waves in aluminum. IN: Zhurnal prikladnoy mekhaniki i tekhnicheskoy fiziki, no. 3, 1967
3. Zel'dovich, Ya. B. and Yu. P. Rayzer. Physics of shock waves and high temperature hydrodynamic phenomena. Moscow. Izd-vo "Nauka," 1966
4. Alder, B.J. Physical experiments with strong shock waves. Chapter 13 in "Solids under pressure," edited by W. Paul and D.M. Warschauer, McGraw Hill, Inc., 1963
5. Al'tshuler, L.V., L.V. Kuleshova, and M.N. Pavlovskiy. Dynamic compression, equation of state, and electrical conductivity of sodium- chloride at high pressure. IN: Zhurnal eksperimental'noy i teoreticbeskoy fiziki, v. 39, no. 1(7), 1960
6. Physical Acoustics (Fizicheskaya akustika), Izd-vo "Mir," 1968
7. Bridgman, P.W. The compression of 46 substances to 50f 000 kg/cm . Proceedings of the American Academy of Arts am. Sciences, v. 74, no. 3, 1940
8. Thouvenin. I. Effect of a shock wave on a porous solid. Proceedings of the 4th (International) symposium on detonation held in White Oak, Maryland in 1965. Washington, 1967, 258-265
9. Baum, F.A., K.P. Stanyukovich, and B.I. Shekhter. Physics of detonations (Fizika vzryva.) Izd-vo "Fizmatglz," 1959
-124-
jTjjBUlJ'aii', --«s»'
SHOCK WAVE GENERATED PHASE TRANSITIONS OCCURRING IN ROCK SALT [E]
Brazhnik, N.I., L.V. Al'tshuler, and L.A. Tarasova. IN: Fizika goreniya i vzryva, v. 5, no. 4, 1969, 513-516.
It is pointed out that there is no widely accepted, unified point of view concerning the existence of a phase transition ir NaC£ . Therefore, the authors performed shock wave experiments on NaC£ single crystals wfiich were then investigated in order to establish the possibility of a phase tran- sition of NaCX into a higher density form. The Hugoniot data for specimens at initial temperature between -160 and +750C shock compressed along 111 and 001 axes at pressures between 40 and 350 kbar did not reveal the presence of a new phase. Thus, it was assumed that the higher density phase is not preserved in the metastable state during the pressure release stage. Therefore, the presence of a phase transition was investigated by means of x-ray, i.e., by the presence or absence of polycrystalline component of the initial phase with an arbitrary orientation of crystals formed as a result of double phase recrystnllization. X-ray analysis using an unfiltered beam of x-rays revealed the presence of the polycrystalline component along different axes of NaCA single crystals. The optimum pressure and temperature ranges for shock compression of specimens along the 111 axis during which the polycrystalline component was formed are 100-300 kbar and ZOO-öOOt. The polycrystalline component was not observed at pressures of 30 and 350 kbar. The pressure and temperature ranges along which phase transformation does occur during chock compression of specimens along the 001 axis were considerably narrower. Analysis of the experimental data thus reveals the presence of a phase transition in NaC£ .
-125-

. I
COMPUTATION OF HUGONIOTS FOR MIXTURES AND FOR POROUS MATERIALS t [T,E]
Doronln, G.S. and V.P. Stupnikov. IN: AN SSSR. Izvestiya. Sibirskoye otdeleniye. Seriya tekhnicheskikh nauk, v. 3, no. 1, 1970, 102-105
A method for the experimental determination of a Hugoniot curve of material from the Hugoniot curve of a mixture of this substance with other material with a known Hugoniot curve was considered in [1] . We shall consider the inverse p/oblem, i.e.. computation of a Hugoniot cuive of a mixture from the known Hugoniot curvas and concentrations of its components. Let x and 1-x be the concentrations by weight of the first and the second components of a mixture. Then, using the laws of conservation of mass and momentum for the mixture and for each of the components at the same pressure P*, it .s possible to derive a relationship between particle velocities of the mixture Uj f2 and the components Ui and U2:
Ul 2 =XlJl + (1 'X,U2 ' (1)
It is assumed that during ?hock compression of the mixture to pressure P* each component of the mixture will have the same density as during compres- sion of this component to pressure P*.
Physically, formula (1) implies conservation of energy. An expression analogous to formula (1) can be obtained for a mixture consisting of three or more components.
Table 1 shows the results of computations of a Hugoniot curve for a mixture of marble and paraffin computed from formula (1) and the experimental data given in [1 ].
Table 1
l,2(exp) U. _, . x*.% P.kbar km/sec 1.2(comp)
77.3 J9.5 0.59 0.59 74.8 51 0.73 0.72 72.3 71 0.93 0.92 77.4 81 0.97 0.96 78.0 97 1.09 1.10 73.0 105 1.13 1.15 74.9 153 1.59 1.59
t
4...^ .».Bw...... „«..»^ ..v,.. ...=..^„ 4.» ,.<.<v^t. from ni • ** x is the concentration of marble.
PRECEDING PA6E BLANK Translation.
-127-

mmmm
The additive approach to computation of Hugoniot curves of mixtures has been previously used in [3] to compute Hugoniot curves for water-saturated soils throughout a narrow pressure range.
Hugoniot Curves for Porous Materials
The construction of Hugoniot curves for porous materials was previously considered in [4,5] . The authors utilized the model of plane parallel collid- ing plates and did not take into account the effect of air in the pores. In this paper, we shall consider shock compression of porous materials from the energy point of view, taking into account the effect of air in pores.
The volume occupied by a porous body, VQQ can be considered to be a sum of the volume of the body VQ and the volume of pores Vp, i.e. , VQQ = Vg + Vp. Let's assume that energy expended in compressing a porous material by a shock wave to pressure P* consists of energy expended in compressing a solid body and the wc k done In collapsing the pores. In a real case, the pores are filled with gas (air). We shall assume that in compressing a porous body by a shock wave, the air in the pores is compressed alonn the Hugoniot curve, reaching limiting compression h = (Y+ 1)/(Y - 1) - b (y =1.4 for air). In this case the work done in collapsing the pores is equal to
P*(V ~ 4VJ = "T P*V^ p 6 p 6 p
In this case we can derive an expression connecting particle velocities of porous U* and solid U-. bodies at pressure P*:
2 2 S IT = U. +7 P*V
* 1 6 p (2)
A sinilar expression was obtained in [6] in considering shock compression of porous organic materials.
Formula (2) can be rewritten in a more meaningful form by introducing porosity m = VQQ/VQ, I.e.,
2 2 u* =u1 + | (m-1) ^ 6 p0
(3)
where p^ = 1/VQ is the density of solid material. It can be seen that when m = 1, IJ* = Uj, and that as porosity increases, U* deviates more and more from Uj. Formula (3) can be derived from formula (1) by considering porous material as a mixture of solid meterial with air.
Table 2 summarizes the previously published experimental Hugoniot data (P and Up) and the results of calculations using formula (3) for a number of metals and alkali halides. The mean deviation of computed data from the experimental data is about 2%, i.e., it is within the limits of the experimental
-128-
I

■ ^ ■■
error. The maximum deviation (one case only) is about 4%. However, a considerably larger deviation, up to 10-15%, exists for porous materials with anomalous shock compression [10].
We have also performed computations on the assumption that the pores of materials given in Table 2 are completely collapsed by the shock wave. The results obtained show that in the pressure range beginning at ~ 200 kbar a large deviation (~ 10-15%) exists between computational and experimental data. This appears to substantiate our assumption that limiting compression of air, h = 6, is reached within the pores. However, in the low-pressure range, characterized by anomalous compression of porous materials, computations on the assumption of total collapse of pores are in good agreement with the experimental data [10].
Thus, it can be assumed that compression of porous materials by weak shock waves (to ~ 100 kbar) results in a complete collapse of pores, while compression by stronger shock waves (s 200 kbar) results in limiting compression of air in pores, h egual to 6.
Computation of U^ for a porous mixture of two materials should be performed using the following formula:
uf = xU? + (1 - x)U^ + | (ra - 1)— , (4) * i z i pa(j
where pacj is the additive initial density of the mixture. For the purpose of comparison we have computed the HugorJot curve
for a mixture of powders of.NaC£ and LiF with concentration by weight, x=l -x=0.5 and porosity m = 1.047. It was determined that, for example, at a pressure of 225 kbar Uexp = 1.66 km/sec and Ucornp = 1.64 km/sec.
The following conclusions can be reached in view of the good agreement between the experimental and computational data:
1. The energy of a porous body during shock compression consists of compressive energy of a solid body and the work expended in collapsing pores«
2. The formation of the shock front in a mixture or porous material is affected not by individual particles, but by the average de isity. This is possible if the thickness of the shock front is at least several times greater than the dimensions of the individual particles.
-129-

CM
01 r-l
« H
^ U a <u § co o ̂ ^ u
to 1
o (U
a ca X ^^ 0) 1
u cfl
*i J3 PU s
3
^-i n) •H 1—1
M CT) <U 1 I
4J
1
in >—I r». iTi rO i-H m m O" ro
^o CM vr vo r»
Ch o ^ co »d* --" -* m o •* vo CM vo r>. r>«
o> co in in o ro en m in co CM r-l o\ vo ^d-
>-• o o o o
m oo m o
O oo o vo
co <r
n y a <u 6 CO o ■"«s^
Ü 1 o »• (U
a »i X ̂ <u 1
h M
oT ̂
e
r-l «0 •fl u 0) JJ m S
•i-i
oocoi-ivocoi-tvoocooocnoor^vo cMoor>.ois»0'-<inO'-irooinr>
csio^mmvovocM'-d'ininvovovo
Oir-lvOr^vOOi-ICOvOCMOCMOO CMOOvOTivDO'-linO'-lcOO^Or^
cMcn-4,.d'invo\ocM>d,in(nvDvovo
cMr-»coin>*<tincsioo.<j-CTiOO\o> vo^vo<tcr>^<-i<-ivOrvj<i-i>.inin i-irninvoooooaii-if^>*<tin\ovD
oooooooooooooo
t-H
m
m oo
CM
O to
vo o •* syi ci m vo a»
CM VO CM VO
O VO vo Ov CO m VO r-l
CM VO CM l~«
00 00 Ov vO in m oo vo >-i ON O m
o o o o
I—I I-I
<!■ m • •
t-H CM
u
r>. m I-I r«» ov r^» CM CM
i-i in CM vo
ov vo m en ON oo CM on
■-I m CM vo
oo o CT» CM CM i-l vO CM CM in r-l i-l
O '-1 o i-l
u CO u
VO CM r^ cn
m r-l
CM ov «* ON vO
00 vO
ON
o ON VO
i—l
o ON ON o vO
i-l vO <t CM
m ON
ON CM
00 r-i oo
00 r-i
ON o o o m ON 00 oo cn
■-I cn r-l CM CM r^ in vO vO r» -* co m ON m vO o r-i
<)■ m a\ vO o I-l
.* oo
■sj- VO r» CM
CM r-l
ON cn
CO ON vO
m vO
oo o
m in m
oo ON
r-l o o vO o r^ >* CM
CM o CM <* ON
r-i
oo 00 r-i
cn O O m r-i ON «*
i-H CO r-l CM CM r-l in vO vO vO m oo in ON vO vO o 1-1
<!• m oo vO o r-l
•sf 00
00 r-l a\ o
m r-l m
CM m r-l ON
in oo r-l m o
I-l o» cn
cn o o
CN O
vO CM vO
1-1
o >* CM o O m oo vo -* CM ON m CM in
CD O ON
ON vO >* 00
0^ cn NO
1^- vO
CM ■* o vO cn
r-i m o i-i O o c-g r-t i-H o CM r- CM m rH r-l cn CM CM vO I-l <!• CM f».
cn o • r-i
• r-l
vO ON
CM
ON ON • m •
cn oo -* o • • r-l CM
00 ON
CM
m • r-i
o O • CM
r-l o • cn
o o • cn ••* r-i
in
• r-l
O O
cn
vO
r-l
1 1 1 1 00 1—1
r-l <
i—1
00 1—I
5
r—i 00 i-J
•ft Z
1—i CO 1—1 ■o
-130-
. -.^oa-*^''-. ■
REFERENCES
1. Dremin, A.D. and A.I. Karpukhin. A method of determining Hugoniot curves for dispersed materials. IN: Zhurnal prikladnoy mekhaniki i tekhnicheskoy fiziki, no. 3, I960, 184
2. Dremin, A.D. and G.A. Adadurov. Hugoniot curve for marble. IN: AN SSSR. Doklady, v. 128, no. 2, 1959, 261
3. Lyakhov, G.N. Principles of explosion dynamics in soils and in liquid media (Osnovy dinamiki vzryva v gruntakh i zhidkikh sredakh). Moscow, Izd-vo "Nedra," 1964
4. Touyenin, J. Le journal de physique, v. 27, no. 3-4, 1966
5. Ileyda, J.F. Lecture presented at the 4th International Symposium of High Dynamic Pressures, Paris, 1967
6. Voskoboynikov, I.M., A.N. Afanasenkov, andV.N. Bogomolov. Generalized Flugoniot curve for organic liquids. IN: Fizika gorenlya i vzryva, no. 4, 1967, 585
7. Krupnikov, K.K., M.I. Brazhnik, and V.P. Krupnikova. Shock compaction of porous tungsten. IN: Zhurnal eksperimental'noy i teoreticheskoy fiziki, v. 42, no. 3, 1962, 675
8. Kormer, S.B., A.I. Funtikov, V.D. Urlin, and A.N. KoJesnikova. Dynamic compression of porous metals and the high temperature equation of state v/ith variable specific heat. IN: Zhurnal eksperimental'noy i teoreticheskoy fiziki, v. 42, no. 3, 1962, 686
9. Kormer, S.B.,M.V. Sinitsyn, A.I. Funtikov, V.D. Urlin, and A.V. Blinov. Investigation of compression of five ionic compounds to pressures of 5 Mbar. IN: Zhurnal eksperimental'noy i teoreticheskoy fiziki, v. 47, no. 4 (10), 1964, 1201
10. Trofimov, V.S., G.A. Adadurov, S.V. Pershin, and A.N. Dremin. Fizika goreniya i vzryva, v. 4, no. 2, 1968, 244
■
-131-

METHOD OF INVESTIGATING PHASE TRANSITIONS AT HIGH PRESSURES BY MEANS OF SHOCK COMPACTION OF POROUS SUBSTANCES« [E]
i
Funtikov , A.I. IN: Fizlka goreniya 1 vzryva, v. 5, no. 4, 1969# 510-512
A number of authors have investigated Hugoniot curves during phase transitions of materials, particularly during melting. In [1,2], It was established that Hugoniot curves display cuspc at the boundaries between liquid and solid phases. However, owing to errors in measuring Hugoniot data, considerable uncertainty exists in the actual location of cusps on the Hugoniot curves [3,4]. The errors are Introduced during measurements of shock and particle velocities in the material being investigated and during determination of the strength of the shock wave interacting with the specimen.
The earliest evaluation of the melting temperature during shock compres- sion of aluminum and NaCi was performed by Mineyev and Savlnov [5] using the results of measurements of viscosity behind the shock wave. The fact that the temperature behind the shock wave is the parameter most strongly affected by melting, made it possible to determine sectors of the melting curve near its Intersection with the Hugoniot curve for NaCi and KCi by measuring the temperature in these materials [6]. The results obtained in [6] were utilized in developing a method of investigating phase transitions by shock compaction of porous materials, which was used by the authors to Investigate melting.
Let's consider the location of Hugoniot curves of material with normal and lower-than-normal Initial densities plotted on a T-P diagram. The porosity m is defined as the ratio of normal density with the Initial density. Figure 1 shows the Hugoniot curves of copper, computed from equations of state [41, bound by the malting curve. The single charge cu ve** within the solid phase region of the substance is bound by the Hugonio'. curve correspond- ing to the limiting porosity m. . The dependence of the shock velocity on the
initial density determined under single charge conditions is a one-parameter dependence and can be measured with a relatively high accuracy in simple experiments. The difference between equations of state for liquid and solid phases leads to the appearance of a cusps on the single charge curve. Computations based on the equations of state for ionic compounds p,6] and metals [4,7] have shown that shock velocity along the sector of a single charge curve corresponding to the liquid phase is greater than that correspond- ing to the solid phase (2-6% for ionic compounds and 1-2% for metals). Care- ful measurements of shock velocities in specimens with different densities reveal these cusps.
* Slightly abbreviated translation. ** A single charge curve is a curve obtained by plotting some Hugoniot parameter vs porosity of the specimen for the same shock wave strength in the standard [Editor's comment] .
-132-

'
Tx 103/oK
\
0.2 0.4 0.6 P,Mbar
Figure 1. T-P diagram for copper (numbers indicate porosity)
1 - Hugoniot and melting curves; 2 - single charge line U, km/sec
0.2 0.4 0.6 0.8 1/m
Figure 2. Variation of the shock velocity measured under conditions of a single charge with the reduced initial density (dark points refer to liquid phase, light points to solid phase)
1 - KC£; 2 - NaCjC; 3 - L1F; 4 - Aj&; 5 - Cu
In the experiments performed we used TNT- hexogen 5/5 charges with a diameter of 120 and a length of 220 mm, in which a plane shock wave was formed by a special lens. The initial state behind the shock wave in the aluminum standard corresponding to a pressure of P = 330 kbar and a relative compression cr = 1.28 and subsequent states during compression by the reflected shock wave or pressure release lie in the solid phase reoion of material. Figure 2 shows the experimental data tor certain ionic compounds and metals.
The control data for LiF pertaining to the solid phase form a continuous curve without any cusps while other ionic compounds display cusps. In view of the small number of experimental points, the data for aluminum and copper should be considered preliminary. The dependences obtained can be used to determine the limiting porosity. Computation of melting temperature of m , are performed using equations of state for the
solid . In the above mentioned limited pressure and temperature ranges, the thermal contribution of electrons is negligible and the Mie-Gruneisen equation of state can be used. For ionic compounds investigated we used equations of state determined in [3,6] which adequately describe the available data (initial sector of the Hugoniot curve, static compression curve at T = 293° K, release data under normal conditions) and which in the case of NaCi and KCA are in agreement with the experimental data on temperatures at the shock front.
It should be noted that at sufficiently high m.. the error in the value of the melting tempera- ture depends slightly on the error in mj^, how- ever, the error in computing pressure which is performed in accordance with the usual procedure using a P-Up Hugoniot curve increases considerably.
Thus, the melting temperature can be determined from the following expression:
P-P„ T =• m
;
p0YCva
where C is the specific heat at constant volume, P is the zero degree
pressure, and y is the Gruneisen ratio. The results of the experiments
-133-

are as follows:
Material mlim P,Mbar TxlO3,^
KCJI
NaCi 1.32 1.85
0.170 0.132
3.62 3.70
It can be seen from Figure 3 that the data for KC£ coincide with the results of [61. For NaCA(Figure 4) the melting temperature is closer to the melting curve of the second phase with bcc structure, which possibly is associated with properties of NaCX discussed in [3] .
Investigation of shock compression of porous materials provides data on melting curves at high pressures which exceed considerably static pressures, but at which reliable determination of Hugoniot data is possible. In the case of optically transparent ionic compounds investigated by the method described abovt, results can be obtained in an intermediate pressure range between static data and melting temperature on the Hugoniot curve for a single crystal. This method also presents new possibilities for opaque materials. Investigations of melting of rocks, iron, and its alloys are especially interesting in connection with the structure of the earth. The method described can be used not only for investigations of melting, but also of phase transformations at high pressui >s.
Txl03A
Figures. T-P diagram for KCjt
1 - Phase transition curve for KCi(I) ; 2 - results of tempera- ture measurements given m [6] (the rest of the legend is identical to that in Figure 1)
Tx 10 ,0K
o o.i oa as a<pfMbar
Figure 4. T-P diagram for NaCA
1 - dot-dash curve is the phase transition curve for NaC£(II) from C3] (the rest of the legend is identical to that in Figures 1 and 3)
REFERENCES
1. Urlin, V.D. and A.A. Ivanov. IN: AN SSSR. Doklady, v. 149, 1963, 1303
2. Kuznetsov, N.M. IN: AN SSSR. Doklady, v. 155, 1964, 156
-134-

Wdwws» ivvmi*fKm»*,**:i*-'~
3.
4.
5.
7.
Kormer, S.B., M.V. Sinitsyn, A.I. Funtikov, V.D. Urlin, and A.V. Blinov. Investigation of compression of five ionic compounds to pressures of 5 Mbar. IN: Zhurnal eksperimental'noy i teoreticheskoy fiziki, v. 47, no. 4(10), 1964, 1202
Urlin, V.D. Melting at superhigh pressures generated in a shock wave. IN: Zhurnal eksperimental'noy i teoreticheskoy fiziki, v. 49, no. 2, 1965, 485
Mineyev, V.N. and Ye. V. Savinov. Ductility and melting temperature of aluminum, lead, and sodium chloride during shock compression. IN: Zhurnal eksperimental'noy i teoreticheskoy fiziki, v. 52, no. 3, 1967, 629
Kormer, S.B., M.V. Sinitsyn, G.A. Kirillov, V.D. Urlin. Experimental determination of temperatures of shock compressed NaCA and KC£ and their melting curves to pressures of 700 kbar. IN: Zhurnal eksperimental'- noy i teoreticheskoy fiziki, v. 48, no. 4, 1965, 1033
Kormer, S.B., A.I. Funtikov, V.D. Urlin, and A.N. Kolesnikov. Dynamic compression of porous metals and the high temperature equation of state with variable specific heat. IN: Zhurnal eksperimental'noy i teoreticheskoy fiziki, v. 42, no. 3, 1962, 686
"s
-135-

■■■■■■■■
EQUATION OF STATE AND ISENTROPIC COMPRESSION OF MARBLE* [T, E ]
Kusov, N.F. and I.I. Sharipdzhanov. IN: AN SSSR. Sibirskoye otdeleniye. Fiziko-tekhnlcheskiyeproblemy razrabotki polezenykh iskopayemykh, no. 2, 1970, 99-102
Investigation of processes connected with propagation and interaction of strong shock waves requires knowledge of the Hugonlot curve and the equation of state of material. While the experimental Hugonlot curves have been determined for many materials, equations of state for solids have been thoroughly investigated only for metals and alkali halides CL-4]. Approximate, generalized equations of state for solids have been derived in [5,6] . Although these equations of state have certain advantages, they also have a numöer of defflciencies. Certain characteristics of real materials can not be taken into account as a result of the generalization. For example, phase transformations, the occurrence of which determines important characteristics of shock wave structure are not taken into account. The errors (~20%) arising as a result of generalization make it impossible to use these equations of state for analysis of a number of processes.
In this paper we whall derive an expression for the Isentropic equation of state (Including 0oK isotherm) for complex solids (rocks, plastics, etc.) which holds true for the plastic region and which can be solved using Hugonlot data. As an example, we have computed parameters of the equation of state for two phases of marble.
At pressures generated by strong explosions the electronic componer s of energy and pressure can be neglected. In this sufflcently accurate approximation the equation of state for solids in the form given in [1,9] is
P(ü,E) = PX(U) + :4rIET ,
E = Ex+ET , (1)
Ex-JUPx(u)du, Uk
where u is the specific volume; T is the Kelvin temperature; E is the internal energy per unit mass; E<j. and Ex are the thermal and elastic components of the Internal energy, respectively; u^ is the specific volume at 0oK and 0 pressure; y{v) is the mean value of the Grunelsen ratio in the temperature range 0-T; Px(u) Is the 0° K isotherm and also the isentropic equation of state. From thermodynamics we have
dE = TdS Pdu , p^^ m ^ ,2,
Slightly abbreviated translation.
-137- :

a^^Wisa^lljjIIMIMllllllUIIIIWWIWiii,. i.ay*w;il»WWWMi
where S is the entropy. For an isentropic process
dE = - P d u . s s (3)
Using formula (3) and the equation of state riven by formula (1) we can obtain the following expression for the isentropic equation of state:
Pc(u) = P (u) + 0(8)-^ exp [ - r ^ du] , s X U J U
(4)
where C(S) is a constant. Assuming that y is a constant, and using the condition that Px = 0, formula (4) is analogous to the isentropic equation of state for an ideal gas [1] .
Using equation (1) and the Rankine-Hugoniot relation for energy
EH = E0 + '(PH + P0)(U0-1J) ' (5)
where indices 0 and H denote the vdues ahead and behind the shock front, we can obtain the following expression for variation of Hugoniot pressure with volume [1]:
H
Px + ^rlE0-)-J Pxc',u+j>g(u0 - u)
(6)
1- JL(u0-u)
Solving formula (6) for J Px du, using formula (4), and differentiating in
respect to u, we obtain
du V Y s s ^u L H Y .-ePJ+Pc=^-[PTJ(^- ^-^--rA(o0-u)]. (7)
P "l
The solution cf equation (7) can be written in the following form:
Ps^t1-^ (u0-^PH(u)-2^ P0(lJ0-ü)-
^ exp ( - J" ^ du) fexp (J^du) {[1 - ^ (u0 - uo uo uo
-us-
es)
u)TPH(u) -

-.
Pn(un - u)]du+ C-^ U U u
exp .J u du)
where C is an arbiträr/ constant. Equation (8) defines a family of curves
each differing from the other by the functionC -*- exp [ - -^- du ] • One u J u
u0 of these curves is the 0oK isotherm. The constant of integration Cx for the 0oK isotherm Px(u) and the specific volume at 0° K can be found from the conditions that
Px(uk''0 (9)
and that Px(u) in the form of equation (8) must satisfy the integral equation (6). Usually, the volume dependence of the Gruneisen ratio is found from the differential relationship between Px(u) and Y(U). In our case, this approach can not be used for the following two reasons. First of all, as was shown in [2] , solution of equation (7) becomes unstable in respect to small variations of Pfj^u) an<^ secondly, reliable criteria for applicability of these relationships for complex media do not exist. Computer analysis of formula (8) has shown that when Y(U) is varied so that vdü = Yn, the
solution of equation (7) at p /p- ^ 1.5 is almost independent of the type of function used for y (u) (see also [2,6]). Physically, this can be explained by the fact that an increase in entropy behind the shock front is small [1] . Thus, a relatively rough approximation can be used for Y(U) . We shall utilize the linear approximation for the Gruneisen ratio [7,8]
Y = a + b (10)
where a = 2/3 and b = YQ " 2/3.
U^ing the following linear relationship between shock velocity Us and particle velocity Up.:
U = A + BU s p
and neglecting PQ, we get
A2z P = ~—2 ^H un(l - BS
(11)
(12)
where u= 1 - V/UQ. Using (10) and (12) the third term in formula (8) can be expanded in series. Finally, equation (7) can be reduced to the following
-139-

....
isentropic equation of state:
P 'u)=— {[1 -(b+— ) —] S' -o 1-Z 2 (1-ßz)2
h
(b + YT-7 z2 Y aizi5+ c (b +r^T) (1"z)"a exp (bz)' 1=0
where
a0 = i, aj = 2/3 B , a2 = -|- (3B " -^J ,
am =^TT {B C(m+1)B -B~(Y0+2)+-1-b] +
m^2
(Yn + m+ 1) a ( - b a . 0 m-i m-2
The results of computations of 0oK Isotherms for two phases of raarbla are given In Table 1 and In Figure 1. The experimental data from (1 ] for the second phase of marble were recomputed using the following relationship between shock and particle velocities determined in [5]: U (km/sec) = 5.25 + 1.39 Up.
For both phases, the computed initial densities at 0oK are smaller than the density of aragonlte. Consequently, in the pressure range 50,000- 500,000 atmospheres, the transition from calcite to aragonlte does not occur during shock compression. The computed isotherm for the first phase of marble falls below the experimental curve Til ]by 1000-5000 atmospheres. These differences are caused partly by experimental errors and partly by the mlcrostructure of marble.
The temperature dependence of the specific heat of calcite [12] was used to compute the internal energy at room tomperature from the formula
E = f 293C dT, 0 «J u
0
Owing to the small change of density during phase transition, the heat of transition and the surface energy of grains were not taken into account in the computation. The value of YQ ^ ^e second phase of marble was determined from the approxinr-ate formula (10) using ehe data given in [11]. The experimental method of di-termlnlng the Gruneis^n ratio described in [11] leads to considerable errors. Therefore, the value of Y determined by this method is apparently two time?, larger than the actual value. Therefore,
-140-

g—WMWwrysr
-IA\-
\
0)
-a ro 6
co
M (0
a o % *-> 0) x:
i-H V/) XI g to C H 0)
JC ■!-•
o u
o o 0)
(0 IM 0) <-• <D
(0 »-. fO a,
CJ
ON ON * l-i CM r^ v* (0 *" XI
00 vO • •
) S m ro
ro <r. C>J r^
^ NO m co ro
• • o o
vO r^ t^ Ö o
ON
•*
1-1 ON
l£) CM NO
Ö • i^. NO • CO CM
ON «*
to m o O CM
b • CM ON • i-i t-t
00
^ <!■ 00
Ö in CM 00 o ON <-* • • ON O
(N CM 00
CO in ro
Ö NO CO CM NO • • m o
00 o eg ■-• o
m oo b r^ ON
• • CM O
CO CO r* ■-<
I—I st ^ b CO ON
• • .-1 o
o m m b d d o in
>■ oo rv
• • r-l C)
r-i r^ CM NO
0Q O CO • •
CM r-l
>-■ m oo
3 5 • • O ON .-1 l-l CO «*
<0 (0 ro j3 H
fti H H
I O
o c o en 3 K
c (0
m
i x: •u O m
o o
0) (0 I s D> IM
(JH NM
~^ o ro o
■M ro •M (0
3 ' ^ 0)
I 6 ro 0 X!
0) IM *J .-H 3 *"
e I o ^ ü IM
0) 5
§1 Ü 0)
4-- •£
ot> o ^
W o i i
il CM
0 m (0 rH
i
co c
X Q) a a T3 X
CO «
0) W
5 S ^ s E a> c +J 0) 3 x a CO *f
ro 3 Cr 0) a) X ■M
E I 0
a a) C CO
o 2 «■§.
S s x: a 0 a)
^2 ä 1 IM
in «2
P,kbar

'""• 1—TTWilUJWMJ.UtMM.sUtf11 mmmmmmmm
the 0° K isotherm for the second phase of marble at p/pQ > 1.4 exhibits anomalous behavior, i.e., its second derivative in respect to volume is negative.
REFERENCES
1. Zel'dovich, Ya. B. andYu. P. Rayzer. Physics of shock waves and high-temperature hydrodynamic phenomena. (Fizika udarnikh voln i vysokotemperaturnykh gidrodinamicheskikh yavleniy) Izd-vo "Nauka," 1966
2. Kormer, S.B., V.D. Urlin, and L.T. Popova. Interpolated equation of state and its application to description of experimental data on shock compression of metals. IN: Fizika teverdogo tela, v. 3, no. 7, 1961, 2131
3. Zharkov, V.N. and V.A. Kalinin. Equation of state of iron to pressures of several million atmospheres. IN: AN SSSR, Doklady, v. 135, no. 4, 1960, 811
4. Al'tshuler, L.V. M.N. Pavlovskiy, and L.V. Kuleshova. Investigation of alkali halides at high pressures and temperatures generated by shock compression. IN: Fizika tverdogo tela, v. 5, no. 1, 1963, 279
5. Gogolev, V.M., V.G. Myrkin, and G.I. Yablokova. An approximate equation of state for solids. IN: Zhurnal prikladnoy mekhaniki i tekhnicheskoy fiziki, no. 5, 1963, 93
6. Koryavov, V.P. An approximate equation of state for solids. IN: Zhurnal yrikladnoy mekhaniki i tekhnicheskoy fiziki, no. 5, 1965, 123
7. Alder, B.J. Physical experiments with strong Shockwaves, Ch. 13. Solids Underpressure, Edited by W. Paul and D.N. Warschauber, McGraw Hill Co., 1963
8. Bakanova, A.A., -,P. Doduladov, and R.F. Trunin. Compression of alkali metals by . :rong shock waves. IN: Fizika tverdogo tela, v. 7, no. 6, 196 , 1615
9. Skidmore, I.C. An introduction to shock waves in solids. Applied Materials Research, v. 4, no. 3, 1965, 131
10. Dremin, A.N. and G.A. Adadurov. Hugoniot curve for marble. IN: AN SSSR. Doklady, v. 128, no. 2, 1959, 261
11. Adadurov, G.A., D.B. Balashov, and A.N. Dremin. Investigation of hulk compressibility of marble at high pressures. IN: AN SSSR. Izvestiya, seriya geofizicheskaya, no. 5, 1961, 712
12. Handbook of chemistry (Spravochnik khimika), v. 1, Izd-vo "Khimiya," 1966
-142-
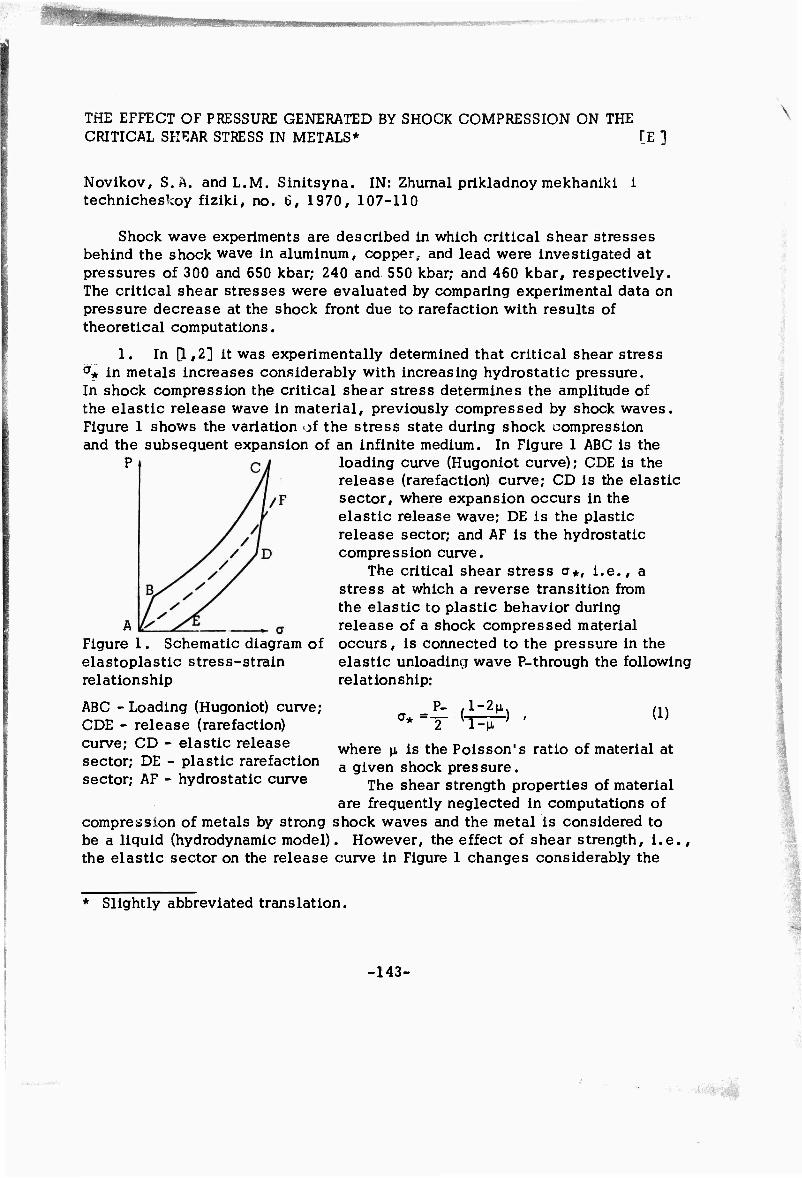
iinmiiQMn«ffi9nswmnH"nnR ■
THE EFFECT OF PRESSURE GENERATED BY SHOCK COMPRESSION ON THE CRITICAL SHEAR STRESS IN METALS* [E ]
Novlkov, S.A. and L.M. Sinitsyna. IN: Zhurnal prikladnoy mekhaniki i technicheskoy fiziki, no. 6, 1970, 107-110
Shock wave experiments are described in which critical shear stresses behind the Shockwave in aluminum, copper,- and lead were investigated at pressures of 300 and 650 kbar; 240 and 550 kbar; and 460 kbar, respectively. The critical shear stresses were evaluated by comparing experimental data on pressure decrease at the shock front due to rarefaction with results of theoretical computations.
1. In [1,2] it was experimentally determined that critical shear stress <** in metals increases considerably with increasing hydrostatic pressure. In shock compression the critical shear stress determines the amplitude of the elastic release wave in material, previously compressed by shock waves. Figure 1 shows the variation of the stress state during shock compression and the subsequent expansion of an infinite medium. In Figure 1 ABC is the
loading curve (Hugoniot curve); ODE is the release (rarefaction) curve; CD is the elastic sector, where expansion occurs in the elastic release wave; DE is the plastic release sector; and AF is the hydrostatic compression curve.
The critical shear stress a*, i.e., a stress at which a reverse transition from the elastic to plastic behavior during release of a shock compressed material occurs, is connected to the pressure in the elastic unloading wave P-through the following relationship:
Figure 1. Schematic diagram of elastoplastic stress-strain relationship
ABC -Loading (Hugoniot) curve; CDE - release (rarefaction) curve; CD - elastic release sector; DE - plastic rarefaction sector; AF - hydrostatic curve
compression of metals by strong be a liquid (hydrodynamic model) the elastic sector on the release
CT, =h (iliü) * 2 1-ü
(1)
where p. is the Poisson's ratio of material at a given shock pressure.
The shear strength properties of material are frequently neglected in computations of
shock waves and the metal is considered to . However, the effect of shear strength, i.e. curve in Figure 1 changes considerably the
* Slightly abbreviated translation.
-143-

flow pattern during shock compression [3]. Experiments described in [41 have for the first time demonstrated the
importance of critical shear stress in shock wave experiments, where the critical shear stress at a pressure of 100 kbar was determined to be 28.5 kbar. This result was verified in experiments performed on aluminum [5], where the critical shear stresses at pressures of 110 and 345 kbar were determined to be 8.6 and 22 kbar, respectively*. The results of numerical computations in which the effect of elastic unloading on propagation and attenuation of elastic waves in solids was taken into account, are given in [6].
In this paper, the values of a* were determined in a manner sinvlar to that used in [4,5], i.e., by comparing computed and experimental variations characterizing pressure release at the shock wave front in metals due to the elastic rarefaction wave.
2. The critical shear stresses behind the shock front were determined using the results of investigations of pressure attenuation at the shock front where the shock wave is generated by impact of a thin plate on the sample of like material. The method used can be best described by considering the pressure release at the shock wave front due to its interaction with the elastic relief wave plotted in x, t coordinates on Figure 2 (x is the path and t is the time). Two shock waves (1 and 2 in Figure 2) are generated when
the thin plate impacts on the sample. The release wave (3) overtaking the shock compression wave is generated upon reflection of the shock wave (1) in the plate from its free surface. Release in metal occurs initially in the elastic release wave (3), and then, to 0 pressure, in the plastic wave (4) (CD and DE curves in Figure 1, respectively). The velocity of the elastic release wave exceeds the velocity of the elastic release wave. When the elastic release wave interacts with the shock wave, the pressure at the shock wave decreases by an amount which depends on the amplitude of the elastic release wave, i.e., the critical shear stress. A weak elastic coupres- sion wave (5) propagates in the Pample to the left. This wave then interacts with the plastic release wave and an elastic release wave (6), propagating to the right, overtakes the shock wave. T^e process is repeated until the
Figure 2. Time-distance diagram illustrating wave trajectories
A - Flyer plate; B - semi-infinite target; 1 - Rear facing shock wave; 2 - shock front; 3 - elastic relief fan; 4 - plastic rarefaction fan; 5 - reflected compression; 6 - elastic relief wave
* The critical shear stress values were computed from pressures P_ determined in [5]at n = 0.31.
-144-

pressure at the shock wave decreases to zero.
3. The experiments were performed on samples of aluminum, A-l; copper, C-l; and lead, Pb. The samples under investigation were used as received (unannealed). The quantity measured in the experiments was the free surface velocity (Uf#s#) of the sample.
The experimental arrangement is shown in Figure 3. The variation of Uf#s# = Uf s (x) was determined in experiments using target wedges. The use*of target wedges makes it possible to obtain Uf#s# = Uf>s# (x) in each experiment in the range 0 < x<h (where h is the maximum sample thickness). The shock wave in the target was generated by impact of a
2 mm thick flyer plate (4) made from the same material as the target (1). The effect of pressure from the explosion products on propagation of the shock wave in the sample was eliminated by means of a second plate (3) identical to (4), placed between the flyer and the explosive lens (5) and accelerated by the explosion. Upon impact, the flyer was accelerated to a velocity equal to that of plate (3) and the velocity of plate (3) decreased considerably. The effect of spalling was excluded by means of a 5 mm air gap between the charge and plate (3). The velocity of the flyer (4) impacting on the target was measured
decay of the shock gener- ated by a flying plate
1 - Target wedge; 2 - foil; 3 - plate; 4 - flyer plate; 5 - HE explosive lens; 6 - lucite block
Figure 3. Experimental arrangement iormeasming ^ ;pec'ially 'erfomed experiments' using HE
charges with different composition. Photographic or electrical contactor measurements of the time interval between the constant when the shock wave reaches the free surface and a contactor (or a lucite block (6) ) at a distance of 3-4 mm from the target surface were used to determine the free surface velocity. A 0.2 mm thick aluminum foil (2) was stretched tightly over the target in order to exclude
the effect of spalling on velocity. The experimental data provided in [B] were used to correct the decrease in velocity of the free surface due to spalling which occurred in experiments with copper samples.
4. The effect of flow behind the shock wave taking into account its interaction with the elastic release waves was calculated on the basis of known equations of state of these metals given in [9] . The experimental and theoretical dependences Uf#s = Uf#s#(x) for aluminum at P = 680 kbar and lead at P = 460 kbar are shown in Figures 4a and 4b, respectively. The hatched areas (4) in these figures were determined by the scatter in the experimental data in each series of the same type of experiments. The dashed curves (1) show the results of hydrodynamic computations (a* = 0), continuous lines (3) and (4^ (Figure 4a) are the computed dependences for
-145-

Figure 4. Measured and computed free surface velocity vs distance into aluminum target at P = 680 kbar (a) and lead at P = 460 kbar (b)
Dot-dash curves (1) - Hydro- dynamic (a* = 0) computations; hatched areas (2) - experimental data scatter observed in a series of the same type of experiments; continuous curves (3 and 4) - com- puted variation for P_ = 70 and P_ = 100 kbar
P_ = 70 kbar and P_ = 100 kbar. Similarly to [4 ], in performing computations the variation of Poisson's ratio with pressure was not taken into account (p, was taken to be 0.31, 0.43, and 0.44 for aluminum, copper, and lead, respectively).
It is interesting to note that not a single experimental curve displays a discontinuous decrease in the free surface velocity. Apparently, this can be explained by the fact that the transition from the elastic to plastic t ehavior during expansion of shock compressed metals occurs along the smooth curve and not along the curve exhibiting a cusp (CDE) in Figure 1). Such a behavior of metals in transition from elas ic to plastic behavior is to be expected from the results achieved in [10] .
From three to four experiments were performed for each material using the same velocity of the flier plate. The critical shear stress corresponding to a given pressure behind a shock wave was taken to be the value of a* , for which the computed dependence Uf#s> = Uf s (x) fitted best the experimental data. The error in determining a* by comparing experimental with theoretical data, was taken to be the interval between values of a* , the computed Uf#s# = Uf#s>(x) curves for which were in
contact with the upper and lower boundaries of the hatched arecs. It can be seen from Figure 4b that the experimental dependence Uf#s# = IL- s (x) for lead is well described by the hydrodynamic curve.
For the metals investigated the critical shear stresses, the pressure in the elastic release v^ave P_, and the shock pressure P are as follows:
AJJ
Cu Pb
300- -680 17- ■29 340- -860 25- ■41
460 0
60-100 90-150
0
-146-

HHp*-'
5. A comparison of experimental with theoretical data clearly demonstrates the importance of shear strength for aluminum and copper in the range of shock wave pressures (to 680 kbar for dluminum and 860 kbar for copper) indicated. Figure 5 is a plot of a* vs shock wave pressure based on the results of shock wave experiments described in this paper and [4,5] . This figure also summarizes the result of hydrostatic pressure on a* in aluminum, copper, and lead [1,2]. It can be seen that the data on aluminum can be satisfactorily fitted by a single curve.
As the pressure in the shock wave increases so does the temperature behind the shock wave. The effect of these factors, temperature and pressure, on the critical shear stress is diametrically opposite. Apparently, at the shock wave pressure, at which melting of the metal occurs, a* is practically equal to zero. Therefore, the variation cr^ = a (P) during shock compression should display a maximum.
According to the results of theoretical and experimental investigations [11,12] melting of aluminum, copper, and lead behind the shock wave occurs in the pressure range P = 1050-2020, 2050-2550, and 410- 1240 kbar, respectively. The fact that tue results of these experiments show that a* for lead at a pressure of 460 kbar is practically equal to zero, confirms the fact that copper melts at this pressure.
.
P,kbar so: mo
Figure 5. a^ vs P variation
Shock wave experiments: 1 - Aluminum [4]; 2 - aluminum [5]; 3 - aluminum, this reference; 4 - copper, this reference; 5 - lead, this reference. Static experiments: 6 - aluminum [1]; 7 - copper [2]; 8 - lead [1]
REFERENCES
4.
Bridgman, P.VV. Large plastic flow and fracture. (Russian translation of the 1952 edition of the monograph)
Voronov, F.F. and L.F. Vereshchagin. The effect of hydrostatic pressure on elastic properties of metals. I. Experimental data. IN: Fizika metallov i metallovedeniye, v. 11, no. 3, 1961
Morland, L.W. The propagation of plane irrotational waves through an elasto-plastic medium. Philosophical transactions of the Royal Society, London, Series A, v. 251, no. 997, 1959
Curran, D.R. Nonhydrodynamic attenuation of shock waves in aluminum. Journal of applied physics, v. 34, no. 9, 1963
-147-
/ ■

5. Erkman, J.O. and A.B. Christensen. Attenuation of shock waves in aluminum. Journal of applied physics, v. 38, no. 13, 1967
6. Che-Hung Mok. Effects of solid strength on the propagation and attenuation of spherical and plane shock waves. Journal of applied physics, v. 39, no. 4, 1968
7. Al'tshuler, L.V. Application of shock waves in high pressure physics. IN: Uspekhi fizicheskikh nauk, v. 85, no. 2, 1965
8. Novikov, S.A., I.I. Davidov, and A.G. Ivanov. Investigation of fracturing of steel, aluminum, and copper by explosive loading. IN: Fizika metallov i metallovedeniye, v. 21, no. 4, 1966
9. Al'tshuler, L.V., S.B. Kormer, M.I. Brazhnik, L.A. Vladimirov, M.P. Speranskaya, and A.I. Funtikov. Isentropic compression of aluminum, copper, lead, and iron at high pressures. IN: Zhurnal eksperimantal'noy i teoreticheskoy fiziki, v. 38, no. 4, 1960
10. Novikov, S.A., V.A. Sinitsyn, A.G. Ivanov, and L.V. Vasil'yev. Elastic plastic properties of a number of explosively loaded metals. IN: Fizika metallov i metallovedeniye, v. 21, no. 3, 1966
11. Mineyev, V.N. and Ye. V. Savinov. Ductility and melting temperature of aluminum, lead, and sodium chloride during shock compression. IN: Zhurnal eksperimental'noy i teoreticheskoy fiziki, v. 52, no. 3, 1967
12. Urlin, V.D. Melting at superhigh pressures generated in a shock wave. IN: Zhurnal eksperimental'noy i teoreticheskoy fiziki, v. 49, no. 2, 1965
-148-

SHOCK COMPRESSION OF DIAMOND* [E ] \
Pavlovskiy, M.N. IN: Fiz'ka tverdogo tela, v. 13, no. 3, 1971, 893-895
This paper summarizes the results of investigation of shock compression of completely transparent, natural single crystals of diamond (initial density PQ = 3.51 gr/cm^) and of porous specimens of diamond (initial density PQQ = 1.90 gr/cm3) having grain dimensions of 10-14 p,. The thickness of the specimens used in the experiments was about 4 mm and their diameter (about 11 mm) was sufficient i.ot to expect measurement errors due to lateral unloading. The single crystal specimens were cut from crystals of diamond in the form of octahedrons. Thus, shock compression of specimens was in the direction of the fourfold (L4) symmetry axis. The shock compression measurements were performed by the impedance match method Q] using the instrumental arrangement described in CL-3] . Shock velocities were measured by electrical contactors [1-3]. The standards and the flyer plates were made of aluminum and iron, the shock Hugoniot curves of which are well known p]. It was assumed that the reflected wave (cross) curve for the standard is a mirror image of the Hugoniot curves.
The results of experiments are plotted in Figures 1 and 2 in the form of shock (Us) vs particle (Up) velocity and shock pressure (?) vs relative compression (a = p/pn) curves, respectively. In the case of single crystal diamond, the variation of shock velocity with particle velocity can be des- cribed quite well by the following linear relationship: Us = 12.16 + 1.00 Up. Figure 2 also shows variation of the final density of the shock compressed specimens of diamond with shock pressure.
It can be seen from Figure 1 that, similarly to graphite [4,5], but different from silicon and germanium [6] , the variation of the shock velocity vs particle velocity curve for diamond does not display any cusps indicating structural rearrangement of the crystalline lattice. A comparison of the Hugoniot curve of diamond with the Hugoniot curves of other materials indicates that the shock compression of diamond is much smaller than that of other substances investigated [1,7].
The shock compression experiments made it possible to evaluate the dimensionless Gruneisen ratio y using the following equation OB]:
Y =
P V -P V rlrooJYo . 1] (P2-P1)V1
where P2 and Pi are the Hugoniot pressures for porous and single crystal diamond at the same specific volume Vi, and where VQO and VQ are the
* Abbreviated translation.
-149-
-.-
■ '.
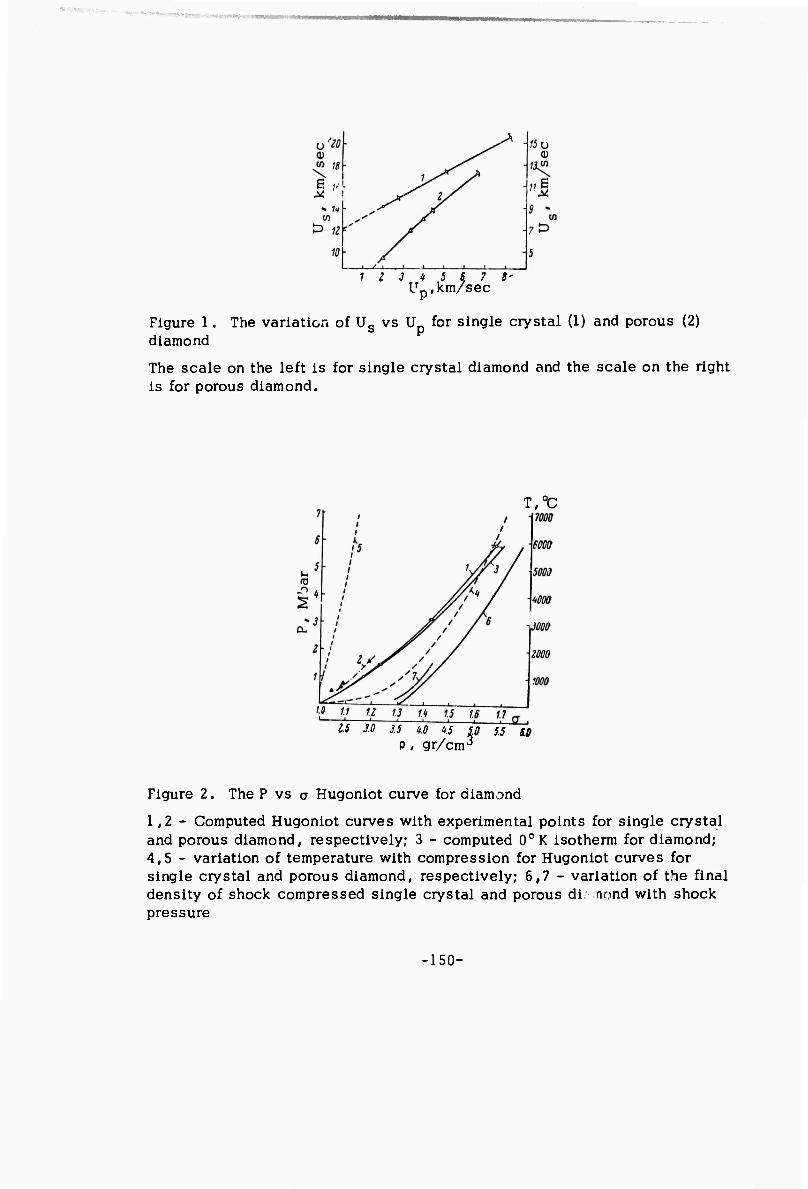
■ ■■■■ ,
J ^ J « 5 fi 7 « Up,km/sec
Figure 1. The variation of Us vs U for single crystal (I) and porous (2) diamond
The scale on the left is for single crystal diamond and the scale on the right is for porous diamond.
T/C
IS 3.0 3.5 1.0 1.5 50 5.5 S.0 p, gr/cm3
Figure 2. The P vs a Hugoniot curve for diamond
1,2 - Computed Hugoniot curves with experimental points for single crystal and porous diamond, respectively; 3 - computed 0oK isotherm for diamond; 4,5 - variation of temperature with compression for Hugoniot curves for single crystal and porous diamond, respectively; 6,7 - variation of the final density of shock compressed single crystal and porous di: aond with shock pressure
-150-

■
initial specific volumes of porous and single crystal diamond, respectively, For the upper point on the Hugoniot curve of porous diamond Y= 0.48. The initial value of the Gruneisen ratio YQ = KQVQ/CV, where K is the bulk modulus, a is the coefficient of expansion, and Cv is the specific heat at constant volume is ^ 0.9.
Similarly to [9] , the experimental data obtained were described using the following formulas for the Hugoniot and the 0° isotherm:
PH = 'oV n(h-ma)
poco i r —
X n (
r/u n + 1, n 2n n- r
(an-l).
n - 1 a- (h+ 1)] ,
where CQ is the initial sound velocity, and h = 1 + 2/y is the limiting compression (m = PQ/PQQ)-
The best fit for the experimental data was achieved (see Figure 2) at h= 5, n= 2.6, Co = 12.16 km/sec, and pg = 3.51 gr/cm^. The Hugoniot temperature was computed from the following formula:
T0K= 300° + (1/2)PH(V0 - V) ■- Ex
(where Ex is the cold, 0oK, component of energy and Cv = D(e/T), where D is the Debye function), by successive approximations.
The characteristic Debye temperature ® for diamond was taken to be 2000° K. The Hugoniot temperatures for diamond determined in this manner are shown in Figure 2. It can be seen from this figure that these curves are substantially smaller than those for iron and copper [7] at the same shock pressure.
REFERENCES
1. Al'tshuler, L.V. Application of shock waves in high pressure physics. IN: Uspekhi fizicheskikh nauk, v. 83, no. 2, 1965, 197
2. Al'tshuler, L.V., S.B. Kormer, A.A. Bakanova, and R.F. Trunin. Equations of state of aluminum, copper, and lead in the high pressure range. IN: Zhurnal eksperimental'noy i teoreticheskoy fiziki, v. 38, no. 3, 1960, 790
3. Al'tshuler, L.V., M.N. Pavlovskiy, L.V. Kuleshova, and G.V. Simakov. Shock compression investigations of alkali halides under high pressures and temperatures. IN: Fizika tverdogo tela, v. 5, no. 1, 19 53, 279
-151-

4. Pavlovskiy, M.N. and V.T. Drakin. Concerning the problem of the metallic phase of carbon. IN: Zhurnal experimental'noy i teoreticheskoy fiziki. Pis'ma v redaktsiyu, v. 4, no. 5, 1966, 169
5. Trunin, P.F., G.V. Simakov, B.N. Moyseyev, L.V. Popov, and M.A. Podurets. Existence of a metallic state of carbon during shock compression. IN: Zhurnal experimental'noy i teoreticheskoy fiziki, v. 56, no. 4, 1969, 1169
6. Pavlovskiy, M.N. Formation of metallic modifications of germanium and silicon by shock compression. IN: Fizika tverdogo tela, v. 9, no. 11, 1967, 3192
7. Al'tshuler, L.V. A.A. Bakanova, and R.F. Trunin. Hugoniot curves and 0° isotherms for t;even metals at high pressures. IN: Zhurnal eksperimental" noy i teoreticheskoy fiziki, v. 42, no. 1, 1962, 91
8. Al'tshuler, L.V., K.K. Krupnikov, B.N. Ledenev, V.l. Zhuchikhin, and M.I. Brazhnik. Shock compression and equation of state of iron at high pressures. IN: Zhurnal eksperimental'noy i teoreticheskoy fiziki, v. 34, no.4, 1958, 874
9. Dudaladov, I.P., V.l. Rakitin, Yu. N. Sutulov, and G.S. Telegin. Shock compression of polystirene with different initial density. IN: Zhurnal prikladnoy matematiki i tekhnicheskoy fiziki, no. 4, 1969, 148
-152-

e.wcai^wjjwwpwtwwi*1^
SHOCK COMPRESSION OF SIX VERY HARD SUBSTANCES* CE]
Pavlcvskiy, M.N. IN: Fizika tverdogo tela, v. 12, no, 7, 1970, 2175-2178
A
^
The results of shock compression experiments on single crystals of Aj^Oß (ruby), polycrystalline A£203 (corundum), BeO, B4C, WC, and TaC performed using the experimental arrangement described in [L-31 are summarized. The shock velocities in almost pure specimens of materials (except for berillium which contained ~ 0.5% impurities) were measured by electrical contactors. The impedance match solutions were obtained using the mirror images of Hugoniot curves of standards (aluminum, copper, iron) given in p]. The pertinent data and the results of experiments are summarized in Table 1. Figures 1 and 2 show the shock vs particle velocity curves for the materials investigated. Figure 1 also shows the data on BeO and corundum at pressures to ~0.7 and 1.5 Mbar, respectively, acquired by McQueen and Marsh [4] . The difference in positions of shock vs particle velocity curves for Ajt203 (Figure 1) can apparently be attributed to differences in the crystalline structure and initial densities of the specimens used in shock experiments. The ceramic specimens of corundum investigated by the authors were made of TsM-332 alloy. It can be seen from Figure 1 that a sm Jl difference also exists between the low-pressure data for BeO acquired by McQueen and Marsh [4] and that described in this paper.
The experiments performed indicate that an almost constant shock velocity Us =- 10.4 km/sec is recorded in BeO at particle velocities Vp ~ 2.2 km/sec. Observations performed using a large number of electrical contactors at different distances from the specimen have shown an absence of jump-dis- continuous changes in the free surface velocity of BeO which, in the presence of a multiple wave structure, would indicate polymorphic transitions in this material. Similar conclusions were reached on the basis of shock wave experiments in BeO where particle velocities were determined by the magneto- electric method [1,5,6], Unfortunately, piezoelectric effects made it impossible to record the elastic release wave which preceeds the plastic wave and which would provide the most logical explanation for the above noted phenomenon.
It may also be possible that the specimens of BeO used in [4] differed somewhat from the specimens u%ed in this wprk (hexagonal wurtzite structure with lattice constants a= 2.700 A,c = 4.384 A, and x-ray diffraction density of 3.007 gr/cm3.
PEFERENCES
1. Al'tshuler, L.V. Utilization of shock waves in high-pressure physics. IN: Uspekhi fizicheskikh nauk, v. 85, no. 2, 1965, 197
2. Al'tshuler, L.V., M.N. Pavlovskiy, L.V. Kuleshova, andG.V. Simakov. Investigation of alkali halides at high shock pressures and temperatures. IN: Fizika tverdogo tela, v. 5, no. 1, 1963, 279
.
* Abbreviated translation. -153-

.«,:■....,-.;.
^ A ^
& ^
$y
Table 1"'
Material PO
gr/cm-^ Standard
Jst. Uc
km/sec kbar p/pr
i3/j cm-'/gr
A1203 4.00 < ' (Ruby)
A1203
(Corundum) 3.92
BeO 2.86 1
V 2.51 1
WC 15.60 1
TaC 14.21 j
Al
Fe
Cu
Al
Fe
Cu Al
Fe
Al
Fe
Al
Fe
Al Fe
1.50 10.40 2 70 11.43
4.55 14.50 i 700 17.43
0.35 8.92 1.14 9.32 1 50 9.40 2 82 10.3'J 3.70 11.02 4 55 12.59
1.76 10.33 | 2.70 10.71 3.70 12.00 4.55 14.44
1.14 11.39 1.50 11.50 2 70 12.28 4 55 14.73
114 5.43 1 50 5.00 2.70 6.39 4 55 9.18
150 5.531 2 70 6.34 4 55 9.48 |
1.02 2.00
0.37 0.80 1.10 2.25 3.03 5.50
3.41 5.78
0.91 1.25 2.43 5.9G
0.45 0.G2 1.25 3.00
0.03 1.33 3 78
120 1.104 4.42 918 1.211 4.84
3010 1.500 6.26 5"70 1.992 7.90
131 1.044 4.09 OO'l 1.093 4.29 407 1.132 4.43 513 1.27S 5.01
1330 1.3S3 5.44 2-10 1.775 6.96
053 1.272 3.64! 74S 1.297 3.71 |
1 70 1.397 3.99 1 2390 1.008 4.76
200 1.080 2.72 3G1 1.123 2.S2 '50 1.2 40 i .13
2200 1.680 4.22
3S2 1.091 17.10 549 1.123 17.53
1244 1.243 19.46 5250 1.003 26.03
5.32 1.141 16.20 1 93 1.208 18.00 liOCO 1.657 23.55
0.220 0.207
0.160 0.126
0.245 0.233 0.226 0.200 O.lSi 0.114
0.275 0.270 0.251 0.210
0.308 0.355 0.320 0.237
0.0585 0.0509 0.0514 0.0384
0.0018 0.0550 0.0424
* p - initial density, U - m?.3s velocity in the standard, Us nnd U -
shock and particle velocities in the specimen, UH - Hugoniot pressure,
p and V - density and specific volume behind the shock front, respectively.
-154-

■v
J 4 U .km/sec
Figure 1. U vs U curves s p
1 - Ceramic BeO, 2 - BeO using data from [4], 3 - single crystal ruby; 4 - ceramic corundum; 5,6 - ceramic and single crystal corundum, respectively, using data from [4]
The scale on the left is for AA2O3 > the scale on the right is for BeO.
Up, km/sec
Figure 2. U vs U curves s p 1 -• B4C; 2 - TaC; 3 - WC
The scale on the left is for B4C and WC, the scale on the right is for TaC, ■
■
-155-

mMmmmmiwrnmrnummmmmmmmmmmmmmmmmmmmmm-m
3. Al'tshuler, L.V., S.B. Kormer, A.A. Bakanova, and R.F. Trunin. Equations of state of aluminum, copper, and lead in the range of high pressures. IN: Zhurnal eksperimental'noy i teoreticheskoy fiziki, v. 38, no. 3, 1960, 790
4. Compendum of shock wave data. University of California, Lovermore, 1966
5. Pavlovskly, M.N. Formation of metallic modifications of germanium and silica under condition of shock compression. IN: Fizika tevrdogo tela, v. 9, no. 11, 1967, 3192
5. Al'tshuler, L.V., M.N. Pavlovskly, and V.P. Drakin. Characteristics of phase transition in loading and unloading shock waves. IN: Zhumal eksperimental'noy i teoreticheskoy fiziki, v. 52, no. 2, 1967, 400
-156-

IJI .tllt-lülUllllLILlL-.- lUULjnil IMIIIIIIIIIM millllWHIIIIIII "
\
A CERTAIN PROPERTY OF SHOCK COMPRESSION OF QUARTZITE* I£]
Podurets, A.M. andR.F. Trunin. IN: AN SSSR. Doklady, v. 195, no. 4, 1970, 811-813
It is pointed out that the absence of a two-wave structure in the two-phase coexistence state for specimens of shock compressed quartz or quartzite in the pressure range P = 120-330 kbar, where shock velocity is constant (Us = 5.75 km/sec), is attributed to lack of a complete thermodynamic equilibrium between quartz and stishovite. In the presence of a thermodynamic equilibrium, the unique concentration of the two phases at each pressure, which results in the shock velocity being constant, is established by equality of Gibbs potentials for each phase. The absence of a complete thermodynamic equilibrium requires the existence of a new mechanism responsible for the concentration ratio of quartz with stishovite being constant at each pressure. In this paper, the authors suggest that stability of the shock wave is responsible for the above noted phenomenon. The fact that the shock induced quartz-stishovite transition, the occurrence of which in static experiments requires considerable time (a few dozen minutes), takes place is attributed to formation of a large number of dislocations by the advancing shock front, increasing greatly the growth of crystals of the higher density phase.
According to the authors' concept, the transition from a low-density to a high-density phase occurs at the shock front and the concentration of each phase behind the shock is practically constant. Therefore, breaking up of a strong shock wave into several lower amplitude shock waves, sequentially compressing the material being examined, would result in a decrease of the amount of the higher-density phase. As will be shown below, the concentration of the higher-density phase during a two-stage compression is smaller than during one-stage compression at the same pressure. This can be seen from Figure 1 which shows the Hugoniot curve for quartzite in the presence of a complete thermodynamic equilibrium and an experimentally determined Hugoniot curve. If a point on the Hugoniot curve located above B corresponds to the shock front, as usual, the wave will be stable and the material behind the shock front will consist primarily of a higher-density phase - stishovite. Let's assume that the pressure at the shock front decreases. The point on the Hugoniot curve would be displaced into position Bj and would be located below ray OAB. Such a wave would be unstable and would break into two waves. The material would be compressed to the same pressures twice the concentration of the higher- density phase would decrease sharply, and the second Hugoniot curve, beginning at point A, would occupy a position above ray OAB. Figure 1 also shows the second experimentally determined Hugoniot curve. (The fact that the second Hugoniot curve lies above the first also indicatps the absence of a complete thermodynamic equilibrium.) Since the velocity of the second wave AB2 would exceed the velocity of the first wave OA, the waves would overtake each other, forming one wave. The concentration of the higher-density phase would once again increase and the point on the Hugoniot curve under consideration would
-157-

Pfkbar
Figure 1. a - First equilibrium Hugoniot curve; b - first experimental Hugoniot curve; c - second experimental Hugoniot curve
tend to the left. The only stable equilibrium position is formed by the points located along the ray. Therefore, the concentration of the higher-density phase along the first Hugoniot curve is automatically smaller than the maximum possible concentration, i.e., the concentration is determined by the fact that the Hugoniot curve has to coincide with line AB. It should be noted, that the stability mechanism described here is very inflexible, i.e., small deviation from equilibrium position results in the appearance of a finite restoring force, required by the fact that in transition across the ray, single stage compression changes jump-like to two-stage compreäsion, no other intermediate transitions are possible - there are either two waves, or one wave. One of the two shock waves AO and AB2 propagating in the same directions will sooner or later catch up with each other. Therefore, the second experimental Hugoniot curve was determined by reflecting the first shock wave OA from different rigid obstacles, so that the two waves propagated toward each other. It should be noted that the Hugoniot curves for many rocks are characterized by the same characteristics as those described above, possiblly caused by the presence of quartz.
-158-
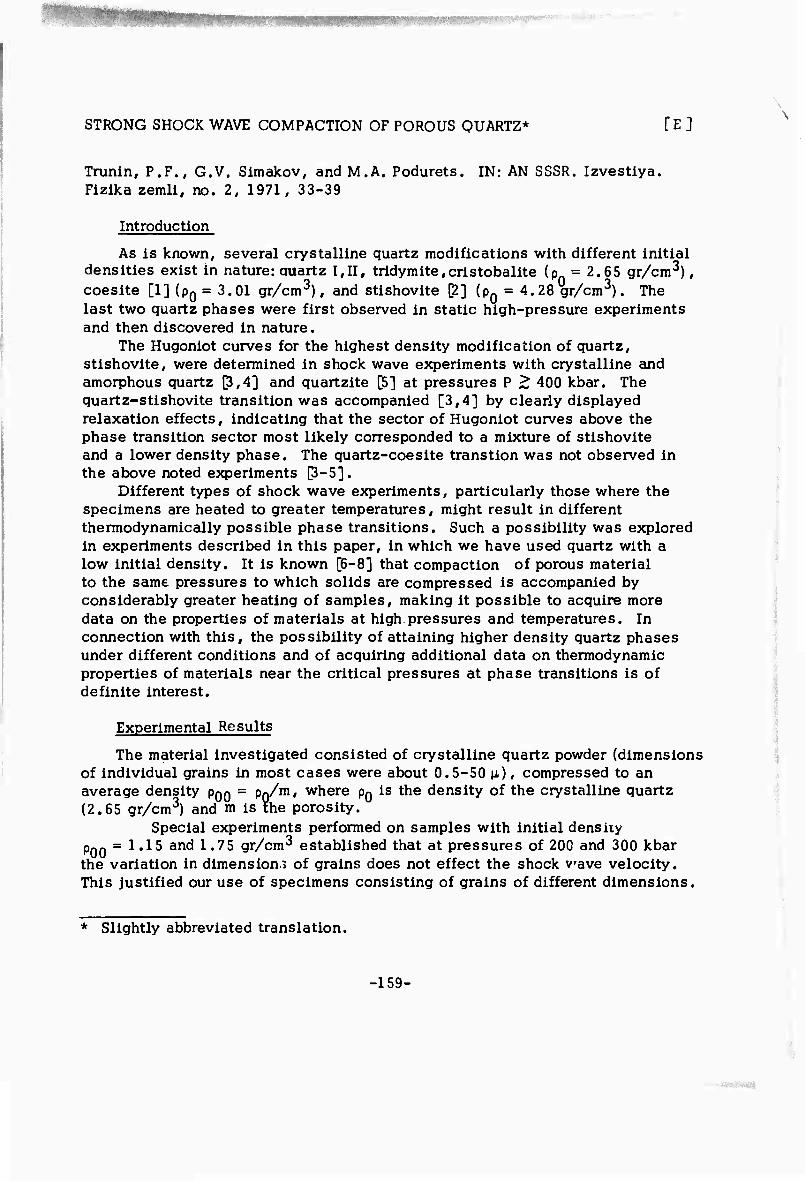
STRONG SHOCK WAVE COMPACTION OF POROUS QUARTZ* [E ]
Trunln, P.P., G.V. Simakov, and M.A. Podurets. IN: AN SSSR. Izvestlya. Fizlka zemli, no. 2, 1971, 33-39
Introduction
As is known, several crystalline quartz modifications with different initial densities exist in nature: quartz I,II, tridymite,cristobalite (p = 2.65 gr/cm3), coesite [1] (p0 = 3.01 gr/cm3), and stishovite ß] (p0 = 4.28 gr/cm3). The last two quartz phases were first observed in static high-pressure experiments and then discovered in nature.
The Hugoniot curves for the highest density modification of quartz, stishovite, were determined in shock wave experiments with crystalline and amorphous quartz [3,4] and quartzite C5] at pressures P > 400 kbar. The quartz-stishovite transition was accompanied [3,4] by clearly displayed relaxation effects, indicating that the sector of Hugoniot curves above the phase transition sector most likely corresponded to a mixture of stishovite and a lower density phase. The quartz-coesite transtion was not observed in the above noted experiments p-5].
Different types of shock wave experiments, particularly those where the specimens are heated to greater temperatures, might result in different thermodynamically possible phase transitions. Such a possibility was explored in experiments described in this paper, in which we have used quartz with a low initial density. It is known [6-8] that compaction of porous material to the same pressures to which solids are compressed is accompanied by considerably greater heating of samples, making it possible to acquire more data on the properties of materials at high pressures and temperatures. In connection with this, the possibility of attaining higher density quartz phases under different conditions and of acquiring additional data on thermodynamic properties of materials near the critical pressures at phase transitions is of definite interest.
Experimental Results
The material investigated consisted of crystalline quartz powder (dimensions of individual grains in most cases were about 0.5-50 |i), compressed to an average density PQQ = PQ/HI, where PQ is the density of the crystalline quartz (2.65 gr/cm3) and m is the porosity.
Special experiments performed on samples with initial density p00 = 1.15 and 1.75 gr/cm3 established that at pressures of 200 and 300 kbar the variation in dimension? of grains does not effect the shock vave velocity. This justified our use of specimens consisting of grains of different dimensions.
\
* Slightly abbreviated translation.
-159-
■
StHHHMIMflBHI
The highest porosity of samples used, which was somewhat larger than the porosity of quartz powder material, was thai of specimens with initial density pgo = 1.15 gr/cm . Experiments on specimens with pgo = 2.2 gr/cm were performed on samples of amorphous (fuzed) quartz. Intermediate densities {pnn = 1.35, 1.55, and 1.75 gr/cmh were obtained by compressing samples at different initial pressures.
As usual, impedance match method [91 was used to determine the Hugoniot curves of samples. The strong shock waves were "generated by different explosive systems, the use of which is required to provide the necessary experimental data throughout the wide pressure and density ranges under consideration. In each series of experiments shock velocity was determined from 5-10 independent experimental measurements. The actual number of recordings was determined by the condition that the mean square error of the average value of shock velocity should not exceed + 1.5-2%. For a known Hugoniot for the standard, the error in determining Aa = P/PQ * (3/2) a (ma - 1) A Us/Us increases with increasing a .
The Hugoniot data obtained from the experiments are summarized in Table 1. Some of the shock velocities determined uqder conditions that the shock wave in the standard is constant Q3] , i.e., ut\ing the same charge and varying m [7],is shown in Figure 1. This figure shows that at 1 <m < 1.71 the curves decreased monotonically with increasing m. As will be shown below", the nonmonotonic decrease at larger values of m# is apparently associated with a different phase of quartz. The lines Us(m) can be used to construct Hugoniot curves of samples with intermediate densities (between PQ = 2.65 and PQ ■ 1.55 gr/cm3). The experimental data obtained are sum- marized in Figures 2 and 3 in the form of shock-particle velocity (Us-U ) and pressure-density(P-p) curves. The data on shock compression of monocrystalllne and amorphous quartz taken from [3-5] are also plotted on these figures.
In the experiments performed, particular attention was given to investi- gations of porous quartz with initial density PQQ = 1.15, 1.35, and 1.75 gr/cm . In the case of amorphous quartz (p00 = 2.20 gr/cm ), the compression of which was investigated by Wackerle [3] at pressures to 700 kbar, the pressure range was increased to ~ 2000 kbar.
Discussion of Results
It can be seen from Figure 2 that the experimental Us-Up curve for all specimens except the modification with initial density PQQ = 1.15 gr/cm^, exhibit discontinuities characterized by relatively sharp changes in mass velocity. Although the boundaries of the discontinuities were not determined exactly (except for the Us-Up curve for p«« = 1.75 gr/cm , where the boundaries were definitely established) it Is preferable to describe the data by the usual method. Both sectors of US-UD and P-p curves before and following dls continuities) can be described Tby linear relationships of the form D = C0 + Xu, where values of constants are given in Table 2. The second
-160-

p
Table 1
1 "2 «0 ■
Parameters M easured
o 01
>
0 0) w
> «0
E
■2 3 1 4J
CO
« .* M M
0 Oi
o co 0. G Q.
o. CO ö » 0
1.15 Al 3.70 7.97 5.24 477 2.919 3.354 Al 2.72 6.12 4.00 282 2.887 3.320 Cu 1.71 4.76 3.01 165 2.720 3.128 Al 1.50 3.78 2.375 103 2.690 3.093 Al 1.14 3.03 1.87 65.2 2.612 3.000
Al 3.70 8.18 5.00 552 2.572 3.472 1.35 Al 3.29 7.48 4.50 454 2.510 3.389
Al 2.72 6.21 3.845 322 2.626 3.546 Cu 1,6k 4.78 2.83 183 2.451 3.309 Al I.50 3.84 2.29 119 2.477 3.344 Al 1.14 3.48 1.71 80.4 1.966 2.654 Al O.69 2.71 1.115 41.3 1.686 2.276
Al 3.70 7.80 4.88 590 2.671 4.140 Al 3.29 6.99 4.42 479 2.720 4.216 Al 2.72 6.00 3.74 348.4 2.654 4.116
1.55 Cu 1.64 4.62 2.795 200 2.532 3.925 Al 1.80 4.25 2.63 173 2.623 4.065 Al 1.50 3.83 2.22 132 2.379 3.687 Al 1.14 3.40 1.72 90.6 2.024 3.137 Al O.69 2.65 1.095 45.O 1.704 2.641
1.77 Al 7.65 14.58 9.00 2320 2.613 4.629 Pe 4.'j6 11.06 6.85 1326 2.627 4.595 Al 3.70 7.82 4.71 644 2.515 4.400 Al 2.72 5.96 3.64 379.5 2.570 4.495 Cu 1.71 4.91 2.92 250.9 2.467 4.313 Cu 1.64 4.59 2.76 221.7 2.508 4.390
1.75 Al l.Bo 4.28 2.55 191.0 2.475 4.330 Al 1.50 4.14 2.13 154.3 2.060 3.604 Al 1.14 3.57 1.68 105.0 1.899 3.322 Al O.69 2.74 1.08 51.8 1.651 2.890 Cu 0.37 2.10 0.62 22.8 1.419 2.482
Pe 4.56 11.50 6.52 I65O 2.31 5.08 2.2 Al 3.72 6.395 3.32 466.5 2.08 4.575
Al 1.50 5.02 1.88 207.0 1.599 3.518
-161-

-
Figure 1. Experimemelly determined variation of the shock velocity as a function of porosity (m)
1 - Experimental data; 2 - extrapolation to crystallographlc density; 3 - coesite-stishovite transition; *- mean square deviations
U , km/sec s
6 8 V , km/sec
Figure 2. Shock velocity (Us) vs particle velocity (U ) curves
1 - Data acquired in this paper; 2 - taken from p]; hatched areas show possible boundaries of phase transitions
-162-

. -....■-, ■.;.--j-.
\
branch above the Us ^const. line corresponds to a high density phase of quartz - coesite or stishovite (see Figure 3). A peculiarity of these sectors is the relatively small value of CQZ which indicates a small variation of compression of these phases at high pressures (p = const, at C J . The Hugoniot curves in Figure 3 are clearly divided into two groups. The first group includes Hugoniot curves for specimens with initial density PQQ = 1.15 and 1.35 gr/cm . Beginning with P ~ 60-100 kbar, the Hugoniots became much steeper, indicating that these sectors correspond to the coesite phase of quartz. Indeed, extrapolation to 0° pressure is in good agreement with the initial state of coesite, the initial density of which pn = 3.01 gr/cm^. The second group (at P ^ 200-400 kbart includes Hugoniots with initial density of 1.75, 2.2, and 2.65 gr/cm , which, judging by their position, correspond to the stishovite phase. In this respect, the position of the Hugoniot curve with initial density PQQ = 1.75 gr/cm3 , the extrapolation of which to 0 pressure corresponds completely to the initial state of stishovite, is very significant. The position of Hugoniots with p« = 2.2 and 2.65 gr/cm3
in the area of the stishovite phase, and particularly the fact that extrapolation of these Hugoniots to 0° pressure does not intersect the initial state of stishovite, can apparently be attributed to relaxation phenomena, which are more clearly expressed at lower temperatures (temperature increases with increasing initial density). The clearest manifestation of this effect is displayed during transition of quartz with Initial crystallographic density to stishovite.
In the pressure range 150 <P < 500 kbar, intermediate position is occupied by Hugoniot of quartz with initial density PQQ = 1.55 gr/cm3. Under these conditions the Hugoniot apparently corresponds to a mixture of two different phases - coesite and stishovite, where structural rearrangement of the crystalline lattice* probably terminates at P = 500 kbar. A possibility which can not be excluded is that even at these pressures the Hugoniot curve corresponds to a mixture of components with an unquestionable predominance of stishovite phase.
The position of Hugoniots shown in Figure 3 makes It possible to evaluate the phase equilibrium curve between coesite and stishovite In the range of relatively high pressures and temperatures. The evaluation can be performed using the following assumptions.
1. At P > 500 kbar the Hugoniot curve for Initial density PQQ = 1.55 gr/cm3 corresponds to the thermodynamically stable stishovite phase. Analogously, the Hugoniot for p00 = 1.35 gr/cm3 corresponds to the coesite phase.
2. In this range of pressures and temperatures the material at the shock wave front does not melt, or If It does, the liquid maintains the
* The Instability of the Hugoniot after a phase transition is characterized (see Figure 3) by considerably larger experimental scatter of points at these pressures.
-163-

'■
mm
101.15 Iß5 I.S 1.75 Z.O Z.Z 2.5 265 3.0 3.5 tf.O U.28 U.5 5.0
Figure 3. Hugoniot curves (see Figure 2 for legend)
Table 2
1st Phase 2nd Phase I P.0'3 jr/cm C01 h C02 X2 2.65 3.68 2.12 2.20 1.596 2.20 5.0 - 1.17 1.585 1.75 1.25 1.375 0.25 1.580 1.55 1.37 1.446 0.40 1.505 1.35 1.35 1.243 0.17 1.612 1.15 ? 7 0.31 1.460
-164-

B,
10
6
P,kbar -T'W'C'
J?
LL gr/cm' zoo m 600
structure of soJid stishovite and coesite. Using these assumptions/ setting the specific heat Cv = const. = ZR/M, and neglecting elastic components of compression energy, it is possible to evaluate the temperature along the Hugoniots (T «Pfj (l/pon ~ 1/p)/ 2CV) and thus to determine the position of the phase equilibrium curve for coesite-stishovite. The results of the evaluation are shown in Figure 4, where they are plotted together with the phase equilibrium curves obtained under static conditions [12-141.
The experimental data at relatively low pressures (the region of phase transitions of the lattice) is characterized by a number of peculiarities which can not be explained within the framework of the theory developed in [6,15]. Indeed, according to [6,15], the work performed by external pressure during adiabatic compression of porous bodies is expended in closing voids between particles and is associated with overcoming frictional forces between them and with their deformation. It was assumed,and investigations [^,8] have verified the fact, that even a low strength shock wave compresses porous material to density of a solid, so that the initial crystallographic density of material is the initial point which serves as the origin of tht -ocus of Hugoniots for different initial densities. This is not observed in our experiments. Each individual density of quartz p00
serves as the initial point for its own Hugoniot and there are actually no indications that general states P = 0, p = PQ exist for the Hugoniot curves investigated by us. Another specific characteristic is the existence of pressure ranges in which materials with lower porosity exhibit larger compaction. This differs from the usual behavior where compaction decreases with increasing porosity. Formally, this leads to negative values of the Gruneisen constant, an impossibility within the framework of the theory of thermodynamic equilibrium of phases. Therefore, one must assume that at these pressures the experimental data correspond to nonequilibrium states and are, therefore, characterized by structural rearrangement processes of crystalline structure, associated with reaction kinetics taking place at the shock wave front [161. These peculiarities occur near regions of phase transitions. No anomalous characteristics in position of Hugoniot curves occur at high pressures.
Figure 4. Interpolated plot of coesite-stishovite phase equilibrium curve
Hatched areas - variation of temperature during shock compression. Initial sectors are plotted using data in [14,17]
1 - Quartz; 2 - coesite; 3 - stishovite
■
Conclusions
1. Experimental Hugoniot curves were obtained for quartz with
-165-

■
different initial densities. The position of Hugonlot curves indicate the presence of quartz-coesite and quartz-stlshovite transitions.
2. The coesite-stlshovite transition curve was evaluated at pressures and temperatures considerably exceeding those of static measurements.
3. The experimental results obtained in the pressure range of phase transitions indicate an absence of thermodynamic equilibrium during compression of quartz and the fact that complicated kinetic processes take place at the shock wave front.
REFERENCES
1. Goes, L. Jr. A new dense crystalline silica. Science, no. 118, 1953, 131
2. Stishov, S.M. and S.V. Popova. New dense modification of silica. IN: Gtokhimiya, no. 10, 1961, 837
3. WackerJe, J. Shock-wave compression of quartz. Journal of Applied Physics, v. 32, no. 3, 19Ö2, 922
4. Al'tshuler, L.V., P.P. Trunin, and G.V. Simakov. Shock compression of periclase and quartz and the composition of the lower mantle of the earth. IN: AN SSSR. Izvestlya. Fizika zemli, no. 10, 1965, 1
5. Trunin, P.P., G.V. Simakov, N.A. Podurets, B.N. Molseyev, and L.V. Popov, Dynamic compression of quartz and quartzlte at high pressures. IN: AN SSSR. Izvestlya. Fizika zemli, no. 1, 1971, 13
6. Zel'dovich, Ya. B. Investigation of equation of state by means of mechanical measurements. IN: Zhurnal eksperlmental'noy 1 teoretlcheskoy fiziki, v. 32, no. 5, 1957, 1577
7. Krupnikov, K.K., M.I. Brazhnik, and V.P. Krupnikova. Shock compres- sion of porous tungsten. IN: Zhurnal eksperlmental'noy 1 teoretlcheskoy fiziki, v. 42, no. 3, 1962, 675
8. Kormer, S.B., A.I. Funtikov, V.D. Urlin, and A.N. Kolesnlkova. Dynamic compression of porous metals and the high temperature equation of state with variable specific heat. IN: Zhurnal eksperimental'noy 1 teoretlcheskoy fiziki, v. 42, no. 3, 1962, 686
9. Al'tshuler, L.V., K.K. Krupnikov, and M.I. Brazhnik. Dynamic compres- sion of metals at pressures between 400 and 4 million atmospheres. IN: Zhurnal eksperlmental'noy 1 teoretlcheskoy fiziki, v. 34, no. 3, 1958, 886
10. Al'tshuler, L.V., N.N. Pavlovskiy, L,V. Kuleshova, and G.V. Simakov. Investigation of alkali metal halides at high shock pressures and temperatures. IN: Fizika tverdogo tela, v. 5, no. 1, 1963, 279
-166-

. nMwiiMiiiin'ini .-'■«■:.-r~~--..
11. Al'tshuler, L.V., S.B. Kormer, A.A. Bakanova, and R.F. Trunin. Equations ot state of aluminum, copper, and lead in the range of high pressures. IN: Zhurnal eksperimental'noy i teoreticheskay fiziki, v. 38, no. 3, 1960, 790
12. Stishov, S.M. Equilibrium line between coesite and rutile form f silica. IN: AN SSSR. Doklady, v. 148, no. 5, 1963, 1186
13. Ostrovskiy, Ya. A. Experimental determination of the equilibrium curve between coesite and stishovite. IN: AN SSSR. Izvestiya. Seriya geologicheskaya, no. 10, 1965, 132
14. Akimoto, S. and Y. Syono. The coesite-stishovite transition. Technical report of ISSP, Series A, no. 327, 1968.
15. Zel'dovic'u, Ya. B. andYu. P. Rayzer. Physics of shock waves and high temperature hydrodynamlc phenomenon. Moscow. Izd-vo "Fizmatgiz," 1963
16. Podurets, M.A. and R.F. Trunin. A certain property of shock compression of quartzite. IN: AN SSSR. Doklady, v. 195, no. 4, 1970, 811
17. Boyd, F.R. and J.L. England. The quartz-coesite transition, journal of Geophysical Research, v. 65, no. 2, 1960, 749
-167-

ne^mm$*^'.:iS:-- i' ''■"
DYNAMIC COMPRESSION OF QUARTZ AND QUARTZITE AT HIGH PRESSURES* [E 1
Trunin, P.P., G.V. Simakov, M.A. Podurets, B.N. Moyseyev, and L.V. Popov. IN: AN SSSR. Izvestiya. Fizlka zemll, no. 1, 1971, 13-20
From the point of view of geophysics the immense interest in behavior of quartz under high pressure can be attributed primarily to its importance as a major constituent of the earth's mantle [1-3] and to the existence of high density modifications which are stable under normal conditions [4,5]. There- fore, the discovery of coesite [4] , a high density form of quartz (initial density p0 = 3.01 gr/cm ), and especially of stishovite [5], the highest density polymorph with stracture of rutile (p0 = 4.3 gr/cm^), in static experiments was a significant achievement. These discoveries have qualitatively confirmed the density distribution within the earth [6,7] according to which a sharp increase in density occurs in the B and C regions of the mantle. Subsequent shock wave experiments with alpha crystalline quartz compressed to P 2 400 kbar [8,9] have definitely established the existence of the stishovite phase.
From the point of view of internal structure of the earth, experimental observation of even higher deasity forms of quartz would be quite significant. According to Ramsey's theory [10,11], the discontinuous increase in density at the mantle-core boundary, is caused by a metallic phase transition. Quartz being the major constituent of the mantle would then also undergo a phase transition with a considerable increase in density.
Although crystallographic data [12] do not provide a sufficient justification for the increase in density assumed to take place at the core-mantle boundary (A p «4.5 gr/cm3), observation of additional density discontinuities on the P-p curve of quartz at high pressures would, to some degree, validate con- clusions reached in [10,11] . Owing to the fact that static experiments are presently limited to pressures of ~ 500 kbar, only shock wave investigations can provide answers to the problem under consideration. Earlier such experiments [8,9] extended the pressure range of quartz to ~ 2 Mbar. However, at pressures 400 <P <2000 kbar, the Hugoniot curve corresponding to the stishovite phase exhibited a monotonic increase without any density disconti- nuities which could indicate the existence of even higher than stishovite density phases of quartz. It is possible that due to the sluggishness associated with complex rearrangement of the crystal lattice of quartz, pressures of ~ 2 Mbar achieved during a very brief time in shock loaded specimens are insuf- ficient for definite occurrence and recording of phase transitions. Therefore, we have conducted new experiments in order to investigate the shock compres- sion of quartz at considerably higher pressures.
In the experiments performed, we have also increased the shock loading time by increasing substantially the thickness of specimens. The use of thicker specimens is very important from the point of view of completion of phase transitions, i.e., a delay or an incomplete phase transition in thin
Slightly abbreviated translation.
-169-
PRECEDIN6 PAGE BUR^
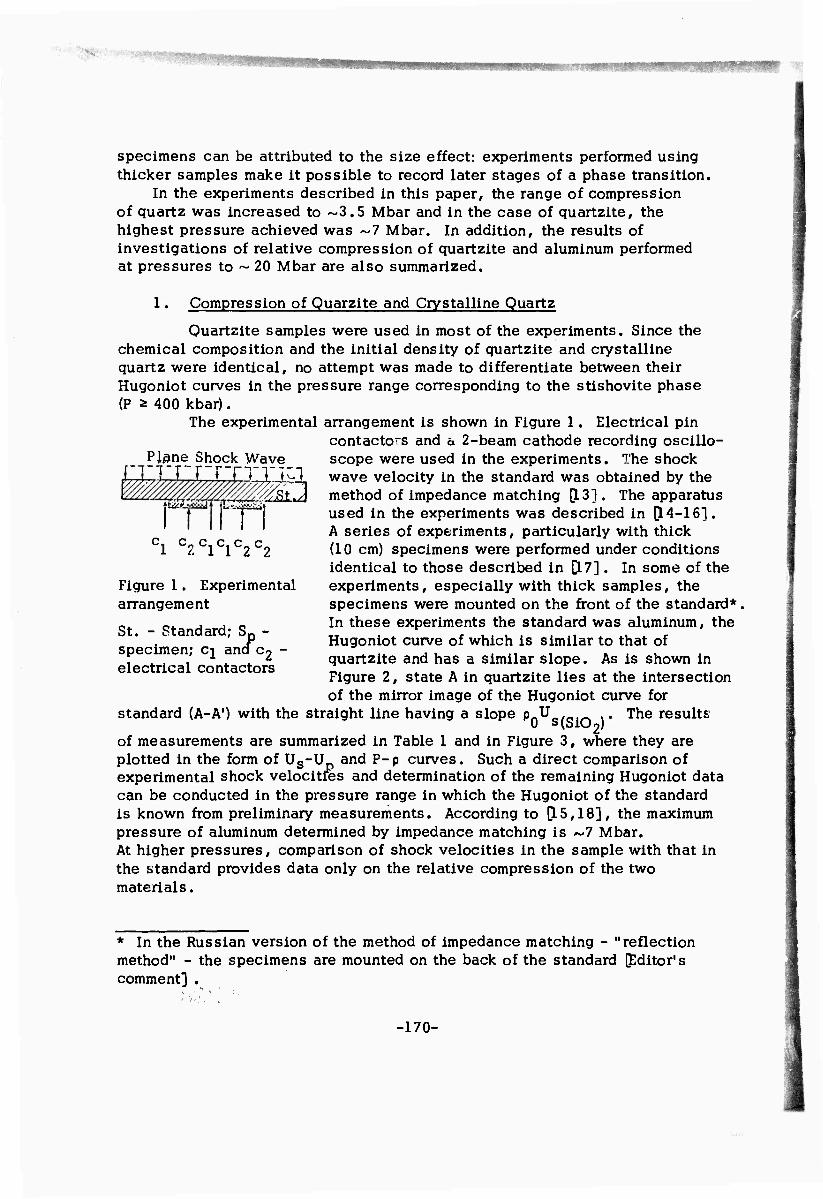
Pi^ne Shock Wave rxixrixixia
»t-s/i/vcZZi L»...w:^;;| psp
specimens can be attributed to the size effect: experiments performed using thicker samples make it possible to record later stages of a phase transition.
In the experiments described in this paper, the range of compression of quartz was increased to ~3.5 Mbar and in the case of quartzite, the highest pressure achieved was ~7 Mbar. In addition, the results of investigations of relative compression of quartzite and aluminum performed at pressures to ~ 20 Mbar are also summarized.
1. Compression of Quarzite and Crystalline Quartz
Quartzite samples were used in most of the experiments. Since the chemical composition and the initial density of quartzite and crystalline quartz were identical, no attempt was made to differentiate between their Hugoniot curves in the pressure range corresponding to the stishovite phase (P ^ 400 kbar).
The experimental arrangement is shown in Figure 1. Electrical pin contactors and a 2-beam cathode recording oscillo- scope were used in the experiments. The shock wave velocity in the standard was obtained by the method of impedance matching [13]. The apparatus used in the experiments was described in [14-16]. A series of experiments, particularly with thick (10 cm) specimens were performed under conditions identical to those described in [17]. In some of the experiments, especially with thick samples, the specimens were mounted on the front of the standard*, In these experiments the standard was aluminum, the Hugoniot curve of which is similar to that of quartzite and has a similar slope. As is shown in Figure 2, state A in quartzite lies at the intersection of the mirror image of the Hugoniot curve for
standard (A-A1) with the straight line having a slope pnU The results
of measurements are summarized in Table 1 and in Figure 3, where they are plotted in the form of Us-U and P-p curves. Such a direct comparison of experimental shock velocities and determination of the remaining Hugoniot data can be conducted in the pressure range in which the Hugoniot of the standard is known from preliminary measurements. According to [15,18], the maximum pressure of aluminum determined by impedance matching is ~7 Mbar. At higher pressures, comparison of shock velocities in the sample with that in the standard provides data only on the relative compression of the two materials.
1 C2C1C1C2C2
Figure 1. Experimental arrangement
St. - Standard; Sp - specimen; cj and C2 - electrical contactors
* In the Russian version of the method of impedance matching - "reflection method" - the specimens are mounted on the back of the standard [Editor's comment] .
-170-

f—I
H
« 5 £
•ö
s
s
m
Öl
>"
I o
0) o
I I
J?^gS^ PS^S ^PJÜÄSJS! gJg »^ • • • • j- J*- jt irvvo w oi cvi m <n en-* -& -* UNVO ITWD VO
tf\<no U\ t-J* QrOHQOOQGQirNOlOOOirvOQOQ o\oo tr <fs. cn^t IF H oo tr\ H H F-co »n05 m ö «rkooO>w\ H H w <n-* oo öS uv2) u\ IT»
Hvo rou\
Ol POfll p «MÄH-* <Mf\0O (A-* dOQ »-0Q CVI Jt • ••••••••«•••••••«A
CVI CO cn\0 COOOOOHHOICM COVO W b-CO rj
• ••••••••••••••••A« NX) S-00 Oj UMAUMAlTMfMA ITWO 00 CU OV OO irvOO
d TtTi-ri-H-ri-riTt'H'rt'rirt-H'rl-ri ■H »<NMMNtlHMNNtlMNNMH«MH
ararafarararararararararararar«ärararar
I oo
I iAIAlR COOOCOOOOOOOOOOOOOOOCOCOOOOOOO
.(• ■!• -I- •!• -I- -I- -I- -I- -I- -I- •!• -I- -I- -I- •!•
HOJOJ-*VOOOOOHHHHC«-JtO( t-00 H
n i§gg MM ••i ''*»s?-I-a •!-9» -i-HS o ^ H H H o o o ^ i33Jj5fl3ij
i i g
I o
I
Evo'
I!
'4
-171-
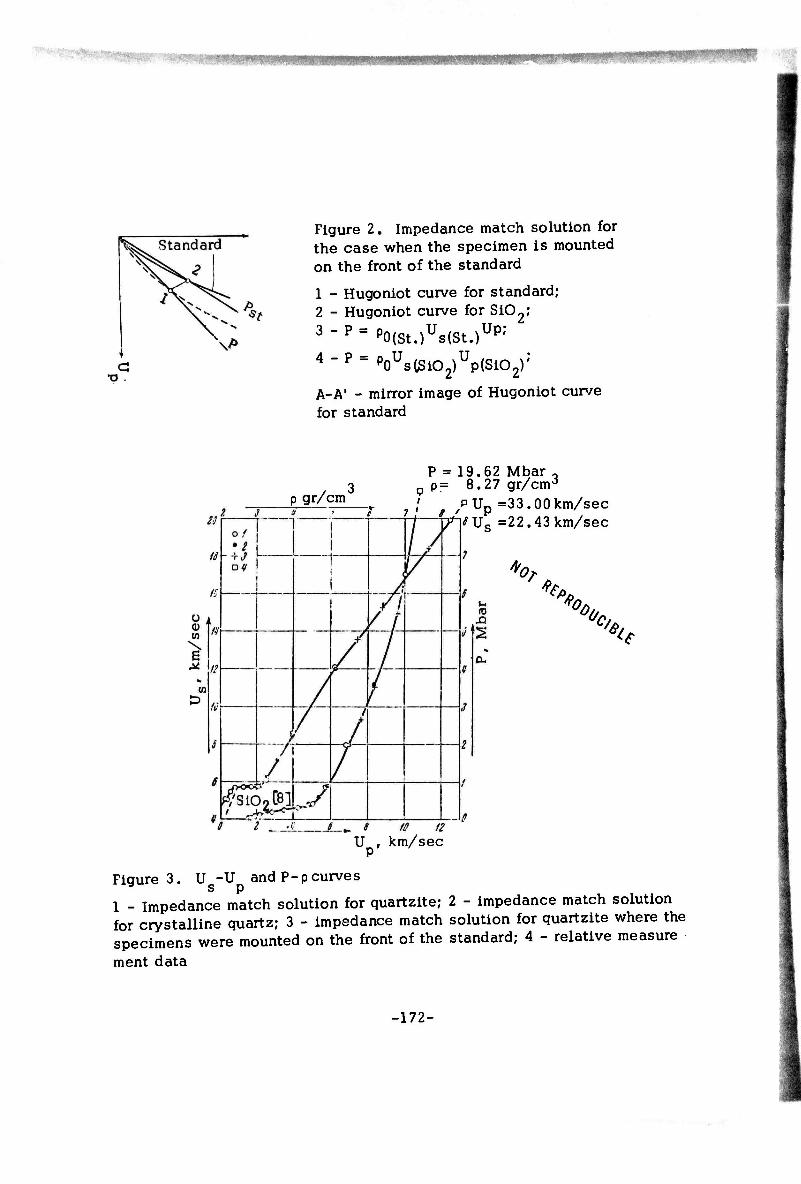
Figure 2. Impedance match solution for the case when the specimen is mounted on the front of the standard
1 - Hugoniot curve for standard; 2 - Hugoniot curve for SiO-, 3 " P = P0(St.)Us(St.)UP;
4"P= p0UsCSiO2)Up(SiO2);
A-A' - mirror image of Hugoniot curve for standard
P = 19.62 Mbar - p= 8.27 gr/cmJ
p gr/cnT ^ , ^ Up =33.00 km/sec ' '—T?^^US =22.43 km/sec
*, Of fy \
te
U , km/sec
Figure3. U -U and P-p curves s p 1 - Impedance match solution for quartzite; 2 - impedance match solution for crystalline quartz; 3 - impedance match solution for quartzite where the specimens were mounted on the front of the standard; 4 - relative measure ment data
-172-

-
2. Relative Compression of Quartzite and Aluminum
The methods described in [17,19] were used to measure shock velocity during its transition through a 300-500 mm thick quartzite layer mounted on a 120 mm thick layer of aluminum. The great thickness of the specimens made it possible to record shock velocity in aluminum and in quartzite with high accuracy. The transit time Intervals recorded by diametrically located contactor pairs differed by not more than 0.5%. The results of measurements refer to shock velocities at the center of the specimen and the standard (see Figure 4). The shock velocities at the boundary between the specimen and the standard were computed by Introducing small correction due to attenuation. The shock velocities measured in these experiments and some low-pressure data are plotted in Figure 5.
U , km/sec Us(Ai)'km/sec
31
23
v/////////m$$s& Figure 4. A schematic diagram for measuring shock velocity In quartzite and aluminum. Experi- mental shock velocities refer to the center of the specimen and the center of the standard
1 - U ,. . x =32.54 km/sec; s(AjJ)
2-Us(SiO2) = 33-00km/seC;
3 - electrical contactors
a
e io u n Us(Si02)'
km/seC
Figure 5. A plot of experimentally determined shock velocity of aluminum vs shock velocity of quartzite (see Figure 3 for legend)
The cusp on the curve (dashed line) is associated with the electronic phase
transition in aluminum determined in (18,20,23] . At shock velocity in aluminum U ,. . >12 km/sec, the relationship between the shock velocity
S \ri JO}
in aluminum and that in quartzite can be approximated by the following equation:
U ,R ,x = 3.761 + 0.735 U /c._ . + 0.416 x 10 s(Ajt) s(Si02) -2 U
s(S102)
In the analysis performed below, we will assume that the Hugonlot curve of the standard material (aluminum) is known to the pressure range computed by
-173-

quantum statistical methods. The P-a Hugoniot for the standard is shown in Figure 6. Up to pressure of ~ 5 Mbar, the Hugoniot curve for aluminum was
determined experimentally [15, 18, P,Mbar mo
100
10
o.i
/ K U 1 s
p ^ s x
A K- /
1 \ -f * ■f <
20,24] , while at pressures exceeding 300 Mbar it was computed theoretically. The Thomas- Fermi model [21] was used to compute the electronic contribution while thermal contribution of the lattice was calculated according to D. 8] f The required elastic shock wave data used were taken to be close to those in [15] . Graphic interpolation was used to extend the Hugoniot curve for aluminum into the intermediate
Si02 pressure range (5 Mbar <P <300 Mbar). A * The sector of the Hugoniot for
Hugoniot curves for aluminum aluminum interpolated to ~50 Mbar was approximated by the following relationship:
Figure 6, and quartzite (c = p/pg)
1 - Quartzite; 2,3 - computations; 4 - interpolation (for remainder of the legend see Figure 3) U. c+x^-p« P.CVHo-l)
^-"■[rr-H where \= 1.218 and C«' = 5.28 km/sec.
The usual method of impedance matching was used to determine pressure and particle velocity in quartzite. The results of experimental measurements are shown in Figure 6 and several of the characteristic experimental points on the Hugoniot curve for quartz are given in Table 1. It was established that at maximum compression (P ~20 Mbar) the relative error in position of Hugoniot curves for aluminum and quartzite, (Ap /p)rei ^ + 0.03.
3. Discussion of Results
The experimental data are illustrated in Figures 3,5, and 6. Figure 3 shows the results of impedance matching calculations. It can be seen from this figure that at pressures to ~ 400 kbar the data on crystalline quartz [8] and quartzite differ from each other. This can apparently be attributed to individual properties of the crystalline structure of both materials. The phase transition region in quartzite corresponds apprcdmately to a constant shock velocity (U ,_._ v »5.72 km/sec). However, the particle velocity behind
S (biOo)
the shock wave varies strongly with the strength of the pressure impulse (between 0.75 and 2.30 km/sec). In the stishovite pressure range (P > 400 kbar),
-174-

the individual properties of quartz and quartzite are not revealed in any manner - the results of measurements of shock compression of both materials coincide completely.
Throughout the whole range of measurements investigated by impedance matching, the Us-Up Hugoniot of quartz (Figure 3) can be represented by sectors of two lines intersecting at Us «12 km/sec (P ~ 2 Mbar). The first of these sectors can be expressed in the following form:
;1 U = C ' - \. U (C ' = 2.19 km/sec, slope X. = 1.60); s 0 1 p 0 f t r i
and the second by
U = C '' - X0 U (C" = 4.29 km/sec, slope x = 1.262). S- 0 2 p 0 2
The experimentally determined sharp variation of the slope of the Kugoniot curve can be explained [22] by changes in the aggregate state of quartz, particularly by its melting under these conditions. The fact that in dielectrics the variation of the slope of the Us-U Hugoniots is less dependent on the electronic component in th^ equation of state (in metals, this fact makes it impossible to record a sharp cüsp on the Us-U Hugoniots) is a factor favorable to revealing changes in the aggregate state of quartz.
In the experiments performed in the pressure range P > 2 Mbar the thickness of specimens varied between a fraction of a centimeter and tens of centimeters (see Table 1). Identical results were obtained in both cases. These experiments thus show the absence of the size efrect during compression of quartz under these conditions. The P-p Hugoniot for quartz summarizing the results of measurements determined by impedance matching in the pressure range between 400 kbar and 7 Mbar displays smooth, monotonic variation without any density discontinuities indicating changes in its crystalline structure. The same conclusion can be reached from the relative compression of quartzite and aluminum determined to pressures of ~ 20 Mbar.
Figure 6 shows the results of interpolation of the experimental Hugoniot curve to very high pressures, determined by quantum statistical methods. The Hugoniot of quartz at P > 200 Mbar was calculated by adding specific volumes of silicon and oxygen for stoichiometeric ratio of quartz at a fixed temperature and pressure. The individual properties of oxygen and silicon were computed in the same manner an they were in the case of aluminum.
The smooth manner in which the interpolated Hugoniot joins the computed Hugoniot curve verifies the experimental data on the absence of any additional density discontinuities on the sector of the Hugoniot curve for the stishovite phase. Important factors making it possible to reach this conclusion are the quantum mechanical calculations by G.M. Gandel'man for aluminum [23] , which have shown that at pressures between 2 and hundreds Mbar, the Hugoniot for aluminum is a smooth, monotonically increasing curve. The reliability of these computations can not be questioned, for they
-175-
.
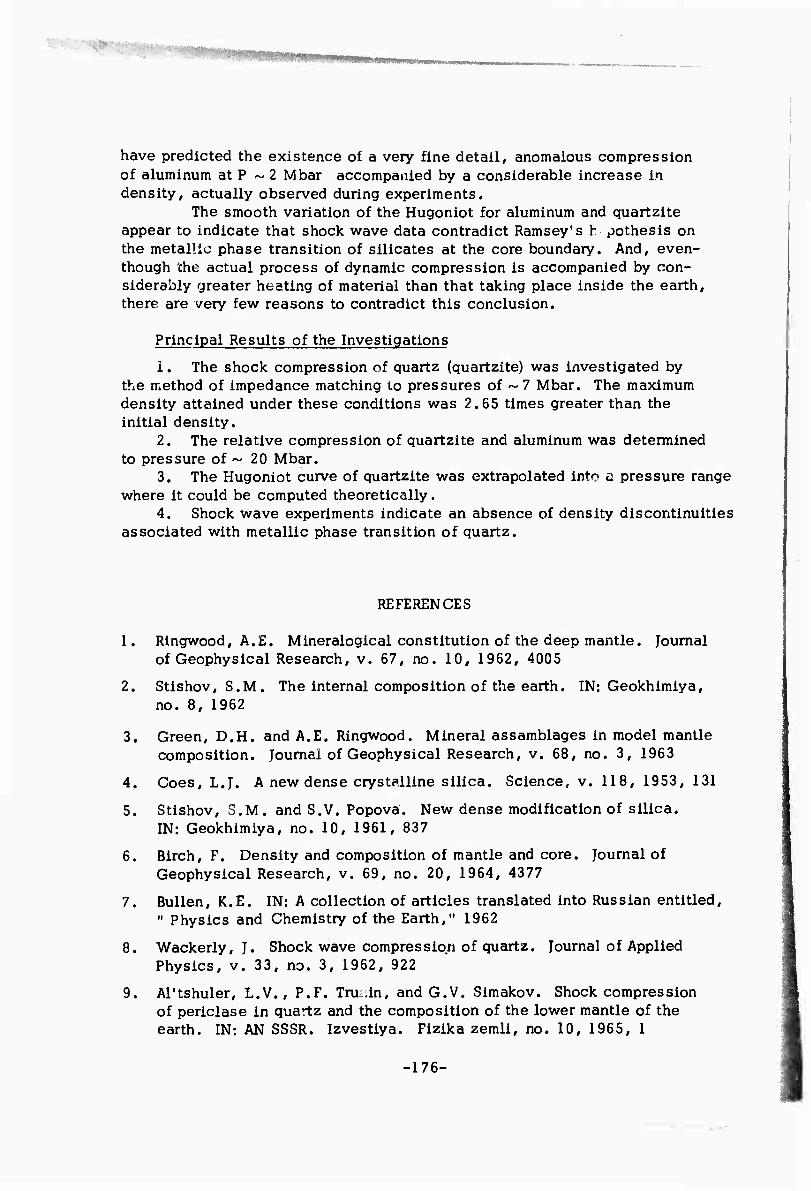
■
have predicted the existence of a very fine detail, anomalous compression of aluminum at P ~ 2 Mbar accompanied by a considerable increase in density, actually observed during experiments.
The smooth variation of the Hugoniot for aluminum and quartzite appear to indicate that shock wave data contradict Ramsey's h pothesis on the metallic phase transition of silicates at the core boundary. And, even- though the actual process of dynamic compression is accompanied by con- siderably greater heating of material than that taking place inside the earth, there are very few reasons to contradict this conclusion.
Principal Results of the Investigations
1. The shock compression of quartz (quartzite) was investigated by the method of impedance matching to pressures of ~ 7 Mbar. The maximum density attained under these conditions was 2.65 times greater than the initial density.
2. The relative compression of quartzite and aluminum was determined to pressure of ~ 20 Mbar.
3. The Hugoniot curve of quartzite was extrapolated into a pressure range where it could be computed theoretically.
4. Shock wave experiments indicate an absence of density discontinuities associated with metallic phase transition of quartz.
REFERENCES
1. Ringwood, A.£. Mineralogical constitution of the deep mantle. Journal of Geophysical Research, v. 67, no. 10, 1962, 4005
2. Stishov, S.M. The internal composition of the earth. IN: Geokhimiya, no. 8, 1962
3. Green, D.H. and A.E. Ringwood. Mineral assamblages in model mantle composition. Journal of Geophysical Research, v. 68, no. 3, 1963
4. Goes, L.J. A new dense crystalline silica. Science, v. 118, 1953, 131
5. Stishov, S.M. and S.V. Popova. New dense modification of silica. IN: Geokhimiya, no. 10, 1961, 837
6. Birch, F. Density and composition of mantle and core. Journal of Geophysical Research, v. 69, no. 20, 1964, 4377
7. Bullen, K.E. IN: A collection of articles translated into Russian entitled, " Physics and Chemistry of the Earth," 1962
8. Wackerly, J. Shock wave compression of quartz. Journal of Applied Physics, v. 33, no. 3, 1962, 922
9. Al'tshuler, L.V., P.P. Trunin, and G.V. Simakov. Shock compression of periclase in quartz and the composition of the lower mantle of the earth. IN: AN SSSR. Izvestiya. Fizika zemli, no. 10, 1965, 1
-176-

SSjpwW*
\
10. Lodochnikov, V.N. Certain general problems associated with basaltic rock magma. IN Vserosiyskoye mineralogicheskoye obshchestvo. Zapiski, Series 2, no. 64, 1939
11. Ramsey, W.H. On the constitution of the terrestrial planets. Monthly Notices of the Royal Astronomical Society, v. 108, 1948
12. Birch, F. Composition of the earth's mantle. Geophysical Journal, v. 4, 1961, 295
13. Al'tshuler, L.V., K.K. Krupnikov, and M.I. Brazhnik. Dynamic compression of metals at pressures between 400 and 4 milUon atmospheres. IN: Zhurnal eksperimental'noy i teoretichesicoy fiziki, v. 34, no. 4, 1958, 886
14. Al'tshuler, L.V., M.N. Pavlovskiy, L.V. Kuleshova, and G.V. Simakov. Shock compression investigations of alkali metal halides under high pressures and temperatures. IN: Fizika tverdogo tela, v. 5, no. 1, 1963, 279
15. Al'tshuler, L.V., S.B. Kormer, A.A. Bakanova, and R.F. Trunin. Equations of state of aluminum, copper, and lead in high-pressure range. IN: Zhurnal eksperimental'noy i teoreticheskay fiziki, v. 38, no. 3, 1969, 790
16. Al'tshuler, L.V., A.A. Bakanova, and R.F. Trunin. Hugoniot curves and 0° isotherms for seven metals at high pressures. IN: Zurnal eksperimental'noy i teoreticheskoy fiziki, v. 42, no. 1, 1962, 91
17. Al'tshuler, L.V., B.N. Moyseyev, L.V. Popov, G.V. Simakov, and R.F. Trunin. Relative compression of iron and lead at pressures of 31-34 Mbar. IN: Zhurnal eksperimental'noy i teoreticheskay fiziki, v. 54, no. 3, 1968, 785
18. Kormer, S.B., A.I. Funtikov, V.D. Urlin, and A.N. Kolesnikova. Dynamic compression of porous metals and the high temperature equation of state with variable specific heat. IN: Zhurnal eksperimental'noy i teoreticheskoy fiziki, v. 42, no. 3, 1962, 686
19. Trunin, R.F., M.A. Podurets, B.N. Moyseyev, G.V. Simakov, and L.V. Popov. Relative compression of copper, cadmium, and lead at high pressures. IN: Zhurnal eksperimental'noy i teoreticheskoy fiziki, v. 56, no. 4, 1969, 1171
20. Scidmore, C. and E. Morris. Experimental equation of state data for uranium and its interpretation in the critical region. Proceedings of symposium, Vienna, May, 1962
21. Latter, R. Fermi statistical model for atoms. Physical Review, v. 99, 1955, 1854
22. Urlin, V.D. Melting at superhigh pressures generated in a shock wave. IN: Zhurnal eksperimental'noy i teoreticheskoy fiziki, v. 49, no. 2 (8), 1965, 485
-177-

23. Gandel'man, G.M. Quantum mechanical theory of equations of state of potassium, aluminum, and iron. IN: Zhurnal eksperimental'noy i teoreticheskoy fiziki, v. 51, 1966, 147
24. Al'tshuler, L.V. and A.A. Bakanova. Electronic structure and compression of metals at high pressures. IN; Uspekhi fizicheskikh nauk, v. 9G, no. 2, 1968, 193
-178-

mmmimmm*-
STRUCTURE OF THE EARTH'S CRUST AND UPPER MANTLE
EXPERIMENTAL DATA ON THE HIGH VELOCITY LAYER IN THE UPPER MANTLE* [ASj
Neprochnov, Yu. P. and L.N. Rykunov. IN: AN SSSR. Doklady, v. 194, no. 1, 1970, 80-82
In the last few years deep seismic sounding (DSS) provided data on lateral inhomogeneities in the uppermost part of the mantle. In continental areas, compressional seismic waves with a velocity of 8 4-9.0 km/sec were determined to e.\ist at relatively shallow depths under the Mohorovicic discontinuity [1,5]. A detailed DSS profile in the western part of the Pacific Ocean revealed an interface with a velocity of 8.6-8.8 km/sec at a depth of 22 km (approximately 10 km below the Mohorovicic discontinuity) [2]. These velocities are higher than velocities given by the Gutenberg model.
In 1966-1967 the Institute of Oceanology of the Academy of Sciences USSR and the Department of Terrestrial Physics of the Moscow University conducted a large volume of marine DSS using highly sensitive, ocean-bottom seismo- graphs. These instruments made it possible to record deep waves from explosions at relatively short distances. Analysis of kinematic and dynamic characterist'cs of refracted waves recorded along certain DSS profiles in the Black Sea and the Indian Ocean provided new data on the high-velocity layer under the Mohorovicic discontinuity.
Excellent records of deep refracted waves were acquired along DSS profile no. 27, run in the western part of the Black Sea basin p]. These waves were recorded at distances up to 160 km using 130 kg charges of TNT. The P^ from the Mohorovicic discontinuity are recorded as first arrivals beginning at a dlstarce of about 40 km. Their apparent velocity is 8.0-8.2 km/sec and their travel-time curves are rectilinear. A cusp or. the travel-time curve of first arrivals and an increase In velocity to 8.8 km/sec is observed at a distance of about 120 km from the shot point. This criterion and the dynamic characteristics Indicate a crossover from P^1 to P¥ , recorded as first arrivals to the end of the profile.
Opposed travel-time curves for PM waves and waves corresponding to the principal crustal layers were used to construct a seismic section along the profile extending across the western part of the Black Sea. An average velocity distribution Is shown in Figure 1. It can be seen from this figure that the Mohorovicic discontinuity is located at a depth of 19 km and an interface with a velocity of 8.8 km/sec at a depth of approximately 30 km.
In order to identify the principal phases and to analyze their dynamic characteristics, we have constructed amplitude-distance curves and compared them with theoretical curves for models of the medium close to the real model (see Figure 2). The best agreement between experimental and theoretical data was found to exist for a model of an absorbing, inhomogenious, layered medium. According to computations by B.S. Chekln [8], attenuation of refracted waves in weakly-gradient media at short distances from the source is close to attenuation of head (H) waves. However, beginning at a certain distance, the
* Translation. -179-
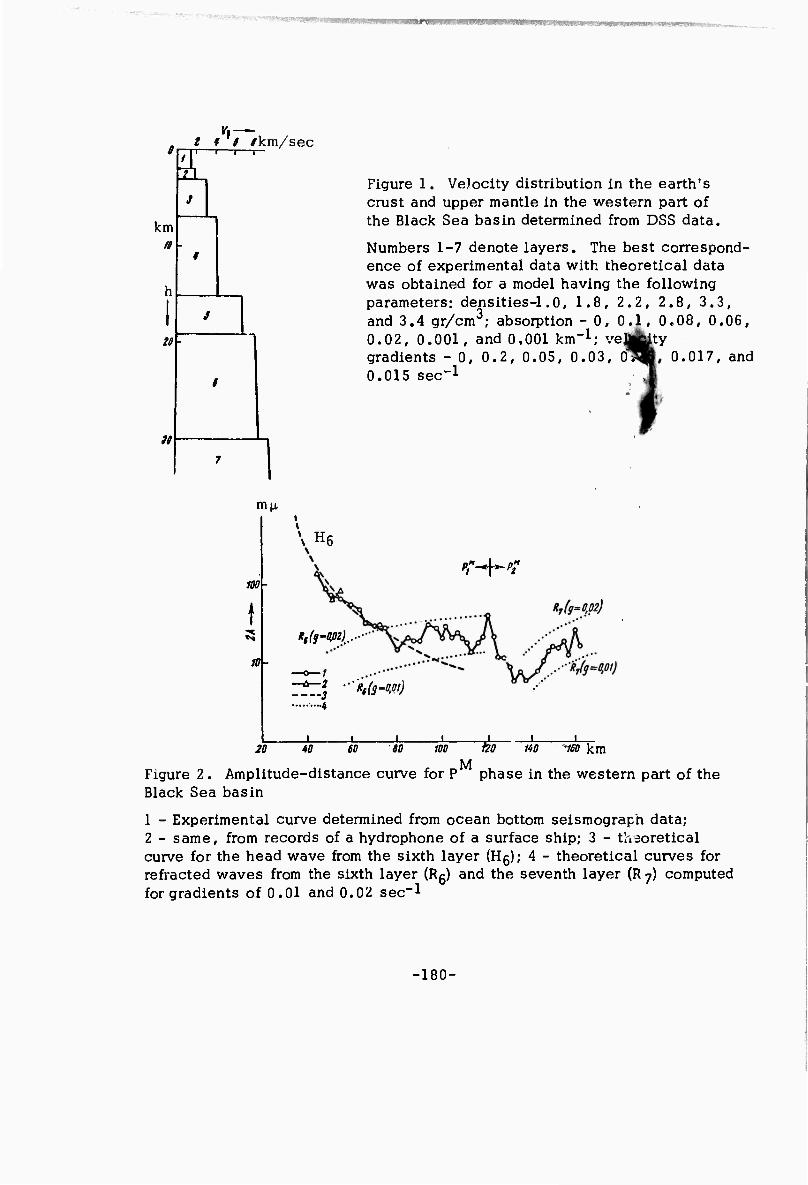
" "•(^»BWIBMW«».™».,,,,
ä km
n
20
30
iff /km/sec r 1 1—
Figure 1. Velocity distribution in the earth's crust and upper mantle in the western part of the Black Sea basin determined from DSS data.
Numbers 1-7 denote layers. The best correspond- ence of experimental data with theoretical data was obtained for a model having the following parameters: densities-1.0, 1.8, 2.2, 2.8, 3.3, and 3.4 gr/cm ; absorption - 0, 0.1 0.02, 0.001, and 0,001 km"1; ve gradients - 0, 0.2, 0.05, 0.03, 01 0.015 sec-1
0.08, 0.06, ty
0.017, and
m^
f to
20
\ He T-^M"
*i(9-402).
Z^7J3 ""*f(3-w) —4
40 SO 80 100 i6r AW -iso km
Figure 2. Amplitude-distance curve for P Black Sea basin
M phase in the western part of the
1 - Experimental curve determined from ocean bottom seismograph data; 2 - same, from records of a hydrophone of a surface ship; 3 - theoretical curve for the head wave from the sixth layer (Hß); 4 - theoretical curves for refracted waves from the sixth layer (Rg) and the seventh layer (R 7) computed for gradients of 0.01 and 0.02 sec"l
-180-

PüüfSW*
variation of amplitudes of first arrivals will take place in accordance with that for refracted (R) waves (see curves Hg and Rg in Figure 2). Therefore, an approximate theoretical amplitude-distance curve for a weakly refracted wave will consist of two branches. At first it will coincide with the curve for the head wave, and then (when the refracted wave computed from asymptotic formulas becomes more intense than the head wave), with a curve for a refracted wave.
The experimental amplitude-distance curve for P constructed from records of the ocean-bottom seismograph is similar to the curve described above. There- fore, this phase is a weakly refracted, mantle wave. The vertical velocity gradient may be evaluated by comparing experimental curves with theoretical curves. It was established that its average value is 0.017 sec~^
A peak on the experimental amplitude-distance curve for first arrivals at .stance of about 120 km is associated with the crossover for P1^ onsets.
120-135 km sector, the intensity of this wave decreases fairly rapidly withflistance (in accordance with the law for head waves), and the amplitudes once ligain begin to increase regularly. The amplitude-distance curve indicates that pM can be considered a weakly refracted wave. The velocity gradient under the 8.8 km/sec interface is approximately 0.015 sec"! .
DSS performed in a joint expedition by R/V "Akademik Kurchatov" and "Vityaz* " [4] also revealed the presence of a high-velocity layer in the upper mantle under the Carlsberg rift valley. The 84 km-long DSS profile extended over the axial part of the rift valley. The investigations were performed using 25 kg TNT charges. A system of opposed and overlapping travel-time curves of refracted waves were constructed using data acquired at 5 recording stations. Analsyis of seismograms and travel-time curves along the profile revealed three phases with interface velocities of 5.0, 7.4, and 9.0 km/sec. Figure 3 shows the velocity distribution for that area. The structure of the crust and the upper mantle differs considerably from the structure of oceanic basins. Normal velocities of 8.0-8.2 km/sec, characteristic of the Mohorovlcic discontinuity, were no* observed under the bottom of the rift valley.
The P1^ phase, with an interface velocity of 9 km/sec, is recorded as firyt arrival at distances exceeding 40 km and as a later arrival at a distance of 28-40 km. A comparison of the experimental and theoretical amplitude-distance curves indicates that in terms of attenuation of the P^1 phase with distance, the P^ phase can be considered to be a refracted wave propagating in a layer with a velocity gradient of about 0.03 sec'l.
The high-velocity layer in the upper mantle under the Black Sea basin, found at a depth of 30 km, apparently indicates densification of mantle material which led to prolonged, intense warping of the basin and accumulation of a thick layer of sediments. It should be noted, that an analogous assumption of densification of the upper mantle under the Black Sea (only at a much greater depth) was also proposed earlier by S.I. Subbotin Oi. the basis of analysis of gravity data and seismic data on the thickness and structure of the crust.
The high-velocity layer under the Carlsberg lift valley at a depth of about 15 km indicates the presence of an uplift of upper mantle material in the rift zone which is also confirmed by petrographic data and physical properties
-181-
\
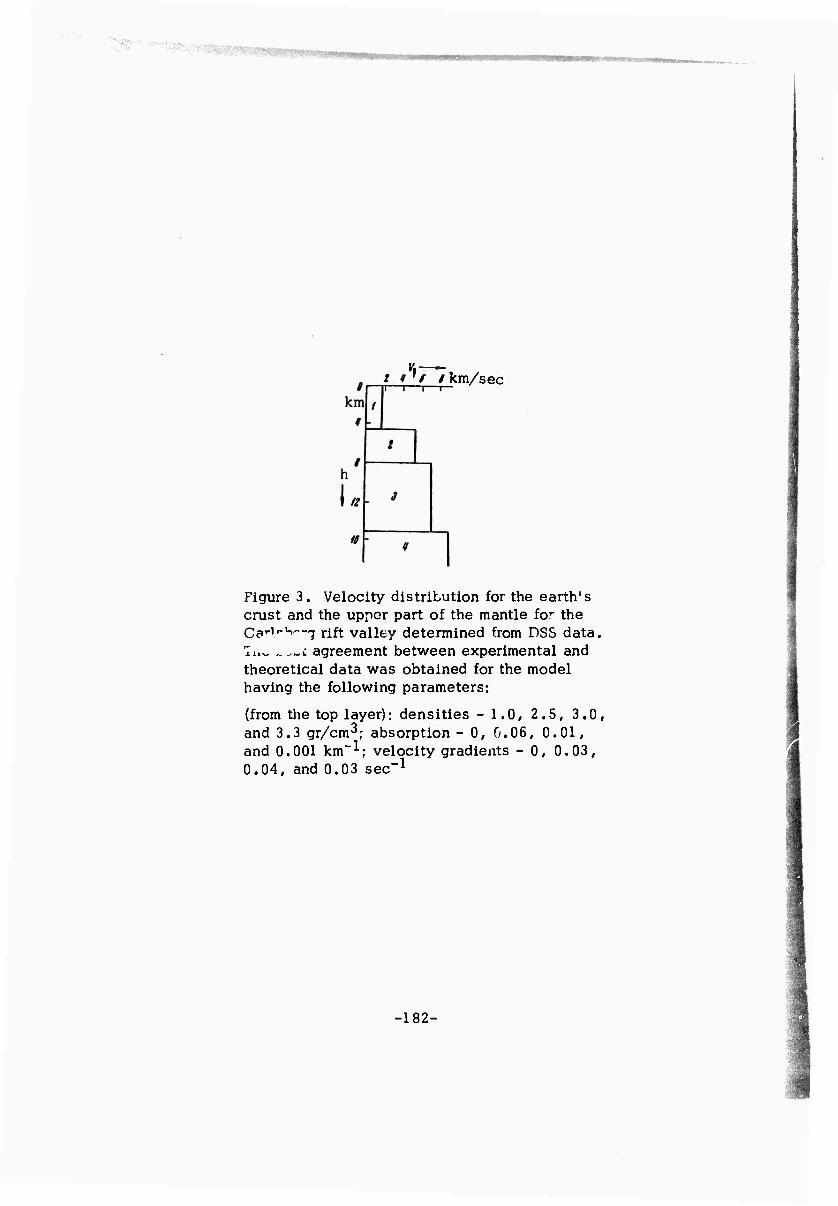
•
r — I Jill ^^m/sec
Figure 3. Velocity distribution for the earth's crust and the upper part of the mantle for the Ca'1/^'-! rift valley determined from DSS data. lu. .-c agreement between experimental and theoretical data was obtained for the model having the following parameters:
(from the top layer): densities - 1.0, 2.5, 3.0, and 3.3 gr/cm^; absorption - 0, G.06, 0.01, and 0.001 km~^; velocity gradients - 0, 0.03, 0.04, and 0.03 sec-1
-182-
^IgMjliigiiMWJiMiilBM^^ '^H' '
.
of rock samples dragged from the bottom of the ocean in this region [7]
REFERENCES
1. Kosmlnskaya, I.P. Method of deep seismic sounding of the earth's crust and the upper mantle (Method glubinnogo seysmicheskogo zondirovanya zemnoy kory i verkhov mantii). Izd-vo "Nauka," 1968
2. Kosminskaya, I.P. and S.M. Zverev. Problems of seismic investigations in the transition zones between continents and oceans. IN: AN SSSR. Otdeleniye nauk o Zemle. Vyyezdnaya sessiya, Khabarovsk i Yuzhno- Sakhalin, 1965. Stroyeniye i razvitiye zemnoy kory na Sovetskom Dal'nem Vostoke; trudy sessii (Structure and evolution of the earth's crust in the Soviet Far East). Moskva. Izd-vo "Nauka," 1969, 66-81
3. Malovitskiy, Ya. P., Yu. P. Neprochnov, I.A. Garkalenko, Ye. A Starshinova, K.G. Milashina, M. Ya. Komornaya, L.N. Rykunov, B.V. Kholopov, and V.V. Sedov. Crustal structure in the western part of the Black Sea. IN: AN SSSR. Doklady, v. 186, no. 4, 1969, 905-907
4. Neprochnov, Yu. P.,,V.M. Kovylin, I.N. Yel'nikov, L.N. Rykunov, and S.M. Zverev. Deep seismic sounding in the Indian Ocean during the joint expedition of R.V. "Akademik Kurchatov" and R.V. "Vityaz"'. IN: AN SSSR. Doklady, v. 185, no. 4, 1969, 917-920
5. Sollogub, V.B. On the nature of seismic crustal interfaces. IN: AN UkrSSR. Geofizicheskiy sbornik, no. 25, 1968, 5-17
6. Subbotin, S.I. Crustal structure of the Black Sea and the causes of i*s formation. IN: AN UkrSSR. Geofizicheskiy sbornik, no. 12, 1965, 3-17
7. Udintsev, G.B. Structure of the rift zone of the Indian Ocean. IN: AN SSSR. Doklady, v. 185, no. 4, 921-924
8. Chekin, B.S. The effect of a small inhomogeneity in a refractor on the head wave. IN: AN SSSR. Izvestiya. Fizika zemli, no. 3, 1965, 1-10
9. Yanovskaya, T.B. Program for computation of travel-time and amplitude- distance curves for body waves in a layered medium. IN: AS USSR. Problems in dynamic theory of seismic wave propagation, no. 8 (AN SSSR. Voprosy dinamicheskoy teorii rasprostraneniya seysmicheskikh voln, no. 8), Izd-vo "Nauka," 1966, 87-92
-183-
THEORETICAL SEISMOLOGY
NUMERICAL METHOD FOR SOLUTION OF INVERSE THREE-DIMENSIONAL KINEMATIC SEISMOLOGICAL PROBLEMS [T]
Alekseyev, A.S., M.M. Lavrent'yev, R.G. Mukhomedov, and V.G. Romanov. IN: Mathematical problems in geophysics (Matematicheskiye problemy geofiziki) , Novosibirsk, no. 1, 1969, 179-201
A method of determining three-dimensional inhomogeneity of the mantle using travel times of refracted waves is developed. It is pointed out that the travel time curve provides integral information on the velocity model in the caso when the rays are sufficiently dense. The major difficulty in solving the problem under consideration is the poor knowledge of the crustal structure and of epicenter coordinates. The earth without the crust is assumed to be a sphere with a unit radius. The travel times between any two points are known and the solution sought is the velocity distribution inside the sphere. A linearized version of the problem is considered with the velocity in the medium approximated by two terms. The first term depends only on the distance to the center (Jeffrey*s-Bullen velocity model is assumed), and the second term, (much smaller than the first term), on the lateral inhomogeneity. It is shown that it's possible to determine velocity inhomogeneity for each great circle of this sphere and that this solution is unique.
APPLICATION OF THE RAY METHOD TO NUMERICAL COMPUTATION OF TRAVEL TIMES AND AMPLITUDES OF SEISMIC WAVES FOR TWO-DIMENSIONAL BLOCK MODELS [£]
Belonosova, A.V. IN: Mathematical problems in geophysics (Matematicheskf/e problemy geofiziki), Novosibirsk, no. 1, 1969, 212-/'M
A universal aloganthm and a program for computer calculation of travel times and amplitudes of seismic waves, based on the geometrical approximation is developed for a wide class of models of real media (arbitrary, piece-wise smooth, two-dimensiona1, layered block medium). The principal "ifficulty consists of algorithmic description of the geometry of connected regions of the medium and a large number of mutually intersecting interfaces. The direct kinematic problem of computing the minimum travel time is reduced to the Cauchy boundary problem which is solved by the Runge-Kutta method. The dynamic problem consists of computing the complex displacement vector for a wave. The results of preliminary computer calculations of the characteristics of the wave field for idealized models are given. The results obtained are in good agreement with exact computations. The results of computations of complex, practical models for seismic prospecting and deep seismic sounding are also
9iven• PRECEDING PAGE BLANK -185-

fJWüWlB :!!Vtmfm>^vKmmmmmmm»fmmy!iw'^m»mjmKem*^!mte^
DETERMINATION OF DENSITY INSIDE THE EARTH CT]
Karkevich, G.A. IN: Transactions of the Novosibirsk Institute of Applied Geodesy, Aerial Photography, and Cartography (Trudy Novosibirskogo Instituta inzhernoy geodesiy/'aerofotos" yemki,! kartografii), no. 23, 1969 (1970), 21-29
The Adams-Williamson equation in the form
d6 dr
g6 , 2 4 = "-a— + a 6 T , where $ = v -— v
is the density, r is the radius, T is the difference between the actual temperature gradient and the adiabatic gradient, a is the thermal expansion coefficient, g is the gravitational constant, and Vp and vs are the velocities of compressional and shear waves, respectively is used to derive the foUowing expression for the density distribution along the radius of the earth, in terms of velocities of seismic waves, without substituting entropy for temperature
de = _gi_ dr " " k + t
where k d(A6)
*= r ~ir -6x; k and ka are the isothermal and adiabatic incompressibilities, respectively, and x = dm/m is the relative increase in mass of elementary volume due to concentration of material as a result of a change in its chemical composition. The first term can be represented in the following form:
^ (l + CvTv2/f) ,
where Y is the Gruneisen ratio. The possibility of evaluating the variation
of ♦ with depth 13 discussed.
-186-
**

MKPP^ fgjgfägffiffw*^-^'-" ■
THOMSON-HASKELL MATRIX METHOD FOR DETERMINING LOVE WAVE DISPERSION CT]
Saastamoinen, P. IN: Geophysica, no. 10, 1968, 35-43 (In English)
A medium consisting of a finite number of plane parallel layers over- laying a half space is considered. The density and rigidity within each layer can vaiy linearly with depth but can only change jump-discontinuously at their boundaries. The distribution of Love wave amplitudes within each layer is expressed in terms of degenerate hypergeometric functions. The dis- placement of stresses at layer boundaries are connected by a matrix, the elements of which are expressed in terms of known functions. A method of computing matrix elements for layers characterized by linear dependence of density and rigidity with depth is outlined. A scheme for including homogeneous layers alternating with layers with linear variation of parameters is described.
-187-

- -;- ■
ATTENUATION OF SPHEROIDAL OSCILLATIONS OF THE EARTH AT SMALL VALUES OF A* [AS.T]
Zharkov, V.N. and V.M. Lyubimov. 1970, 574-576
IN: AN SSSR. Doklady, v. 191, no. 3,
'' i previous papers [1,2] we have considered attenuation of torsional and radiai oscillations of the earth. In the case of torsional oscillations comparison of experimental data with theoretical data made it possible to determine roughly the distribution of the dissipation function 0 for the earth's mantle. The perturbation theory developed for radial oscillations of the earth together with the 0 distribution obtained by the authors made it possible to explain the anomalously large 0 values for radial oscillations observed after the Chilean earthquake [2] . This appears to indicate that the Q distribution for the earth's mantle obtained in [1] is close to the real distribution. All available data indicate that Q for the liquid core of the earth is at least an order of magnitude larger than 0 for the mantle. Therefore, at the present time, dissipation in the core has to be neglected due to a lack of experimental data.
A perturbation theory for spheroidal oscillations of the earth was developed in [3] . This made it possible to continue investigations begun in [1,2] and to consider attenuation of spheriodal oscillations of the earth. In this paper we will summarize the results of computations for the fundamental mode (n = 0), for 1= 1-27 and the first 4 higher modes (n = 1, 2, 3,4) for £= 1-7. These oscillations are interesting from the point of view of their dependence on properties of the earth's core, while oscillations with larger i are displaced from the core into the mantle.
Gutenburg-Bullen A (GBA) model was used in the computations. This model was described in sufficient detail in our previous papers and was used by Pekeris and his colleagues [4] . In this model, the crust and the mantle are divided into 34 layers with piece-wise constant parameters. The core of the earth is liquid and is divided into 7 layers: inner core, transitior layer, and outer core consist- ing of 5 layers. In principle, the number of layer.; can be increased, however, for our purposes it is immaterial. Integration of the differential equations was performed from the center of the earth. Exact solutions in terms of Bessel functions [5] are known for tht first section - inner core. The solution was the.i extended by the Runge-Kutta method to the boundary between the core and the mantle and through the mantle and the crust of the eartli to the earth's surface. Perturbation theory [2] was used to compute the derivatives of frequency in respect to parameters of the problem under consideration, i.e., in respect to density, bulk modulus, and rigidity in each layer (K p,, KJ^, H i, respectively, where i is the number of the layer). As usual, it was assumea that dissipation takes place only during shearing processes and, therefore, depends only on K^ .
In actual calculations the dissipation in the core was neglected and the
* Translation.
188-
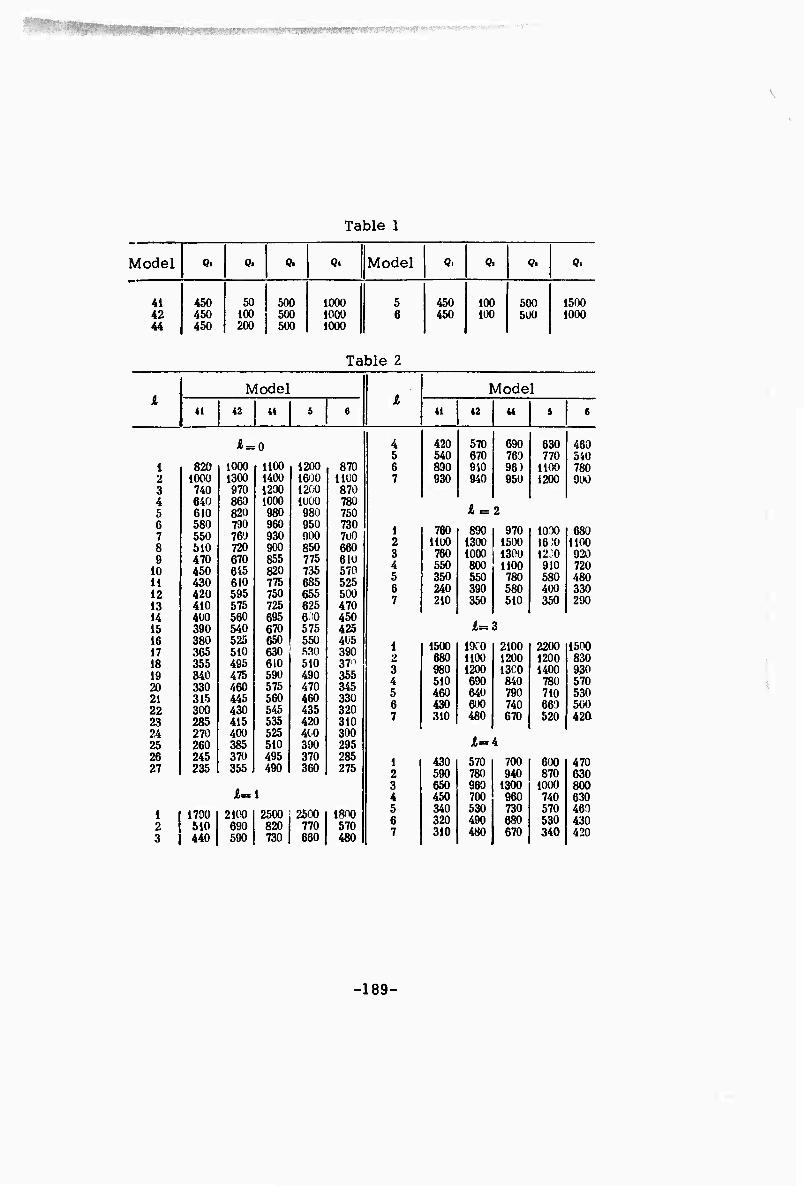
.,; - . ,
Table 1
Model Qt Q. <?. «4 Model Q. <?. <?. Q.
41 42 44
450 450 450
50 100 200
500 500 500
1000 1000 1000
5 6
450 450
100 100
500 500
1500 1000
Table 2
1 2 3 4 5 6 7 8 9
10 11 12 13 14 15 16 17 18 19 20 21 22 23 24 25 26 27
1 2 3
1790 510 440
Model 41 42 44
1=0
• 820 1000 1 1100 1200 . 1000 1300 1400 1600
1 740 970 1200 1200 640 860 1000 1000 610 820 980 980 580 790 960 950 550 760 930 900 510 720 900 830 470 670 855 775 450 615 820 735 430 610 775 685 420 595 750 655 410 575 725 625 4U0 560 695 6-0 390 540 670 575 380 525 650 550 365 510 630 530 1 355 495 6i0 510 340 475 590 490 330 460 575 470 315 445 560 460 300 430 545 435 285 415 535 420 270 400 525 410 260 385 510 390 245 370 495 370
| 235 355 1 490 360
JU=1
2100 690 590
2500 ! 2500 820 770 730 660
870 1100 870 780 750 730 700 660 610 570 525 500 470 450 425 405 390 37' 355 345 330 320 310 300 295 285 275
1800 570 480
Model 41
1 2 3 4 5 6 7
420 540 890 930
42
570 670 9-40 940
£ = 2
44
£=3
A=4
690 630 763 770 96) 1100 950 1200
1 760 890 970 1000 [ 1100 1300 1500 16 ;o 760 1000 1300 12:0 550 800 HOG 910 350 550 780 580 240 390 580 400 210 350 510 350
1 1500 igro 2100 2200 | 680 1100 1200 1200 980 1200 13C0 1400 510 690 840 780 460 640 790 710 430 600 740 660 310 480 670 520
1 430 570 700 600 1 590 780 940 870 650 960 1300 1000 450 700 960 740 340 530 730 570 320 490 680 530 310 480 670 340
460 340 780 9LK)
680 1100 920 720 480 330 290
1500 830 930 570 530 500 420
470 630 800 630 460 430 420
-189-

mmmmmmmmmmmammmtmwmmmmmm. ■mmmm
34 layers of the crust and the mantle were combined into 4 layers (j = 1,2,3,4):
1. Zone A - crust ( 0 ^ 2 s 38 km), 2. Zr e B - upper mantle (38 ^^^300 km), 3. Zone C - transition layer (300 ^ As: 1000 km), 4. Zone D - lower mantle (1000 ^£^2900 km).
The parameters computed in this paper are as follows;
.'-^2".. ?-iS«,. ^-iS/.. S-iSn* (i) i=J0 <=»? »=18 *-»
where (ioi is the dimensionless rigidity in the i-th layer, Rj = Hui|i,oi, and KQ is dimensionless resonant frequency. The formula used to compute 0 is given by:
^'k™' (2, where Qj(j = 1,2,3,4) - is the Q distribution for the mantle of the earth [1] . In [1] we have estimated a preliminary Qj distribution given in Table 1. Using the presently available experimental data the best Oj distribution for the mantle is given by model 6. The results of computations of Q values for spheroidal oscillations nS ^ are given in Table 2.
The most important results of the present computations are the large 0 values for spheroidal oscillations with small JL. Some of the uncertainties will probably not change the Q values by more than 100-200. Therefore, 0 for QS^ for laodel 6 U= 1-7) is ~ 1100-700. The experimental data given in [4] show that for 0S^{1= 2-7) 0 =-400-300. We believe that these values were determined with insufficient accuracy and are incorrect. Partially, this was shown by Smith [6] in a lecture prepared for the XIV General Assembly of the International Geophysical Union. According to Smith, careful review of all data has shown that nonstationary noise may have considerable effect on the measured 0 values for low orders of spheroidal and torsional oscillations and that the earlier published Q values may have been significantly lower than the actual values. The results given in Table 1 can serve as guidelines for experimental seismologists in determining the real values of Q for nS % from observational data.
-190-

mmmmm ■
^
REFERENCES
1. Zharkov, V.N,, V.M. Lyubimov, A.A. Movchan, and A,I. Movchan. The influence of physical parameters of the mantle on resonant periods of torsional oscillations of the earth. IN: AN SSSR. Izvestiya. Fizika zemli , no. 2, 1967, 3-12
2. Zharkov, V.N. and V.M. Lyubimov. Attenuation of radial oscillations of the earth. IN: AN SSSR. Doklady, v. 177, no. 2, 318-321
3. Zharkov, V.N., and V.M. Lyubimov. Perturbation theory for spheroidal oscillations of the earth. IN: AN SSSR. Doklady, v. 180, no. 2, 1968, 347-349
4. Free oscillations of the earth. (A collection of translations). Moscow, 1964
5. Zharkov, V.N. Elementary theory of spheroidal oscillations of the earth. IN: AN SSSR. Izvestiya. Fizika zemli, no. 8, 1967, 3-13
6. Smith, S.W. Transactions of the American Geophysical Union, v. 48, no. 2, 1967, 409-412
-191-
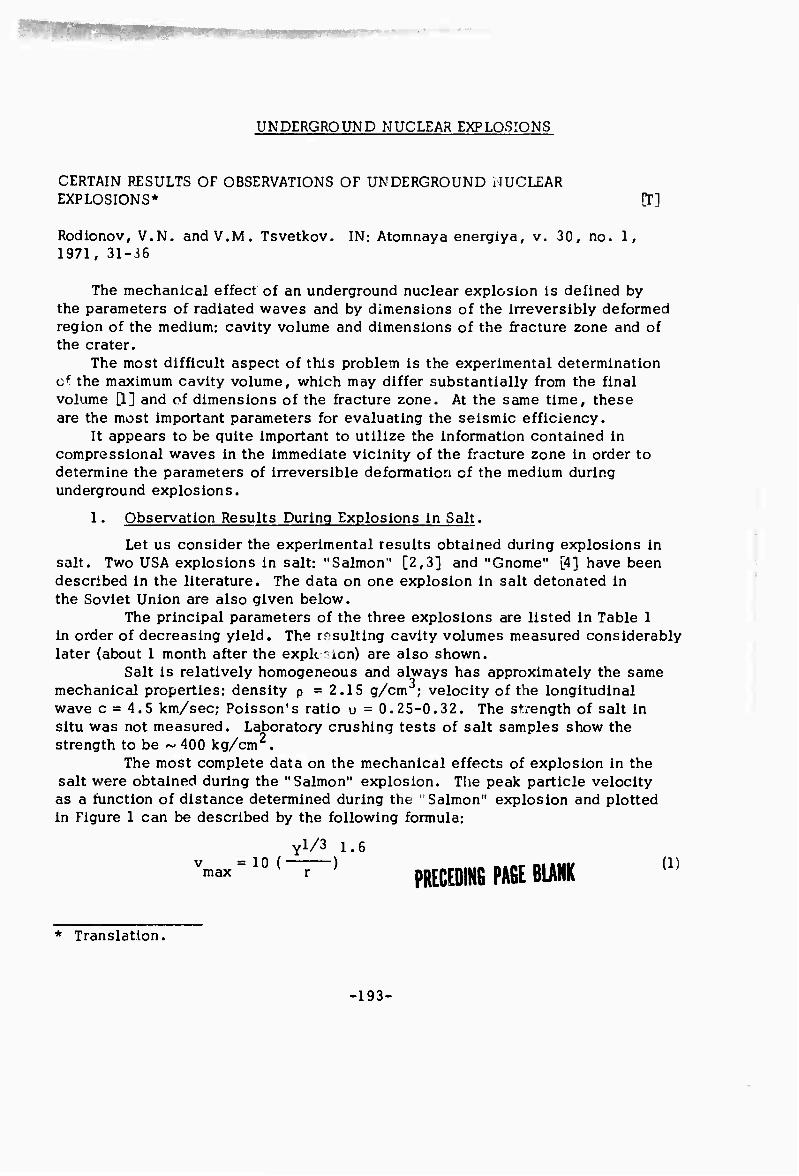
UNDERGROUND NUCLEAR EXPLOSIONS
CERTAIN RESULTS OF OBSERVATIONS OF UNDERGROUND ilUCLEAR EXPLOSIONS* Cr]
Rodionov, V.N. and V.M. Tsvetkov. IN: Atomnaya energiya, v. 30, no. 1, 1971, 31-36
The mechanical effect of an underground nuclear explosion is defined by the parameters of radiated waves and by dimensions of the irreversibly deformed region of the medium: cavity volume and dimensions of the fracture zone and of the crater.
The most difficult aspect of this problem is the experimental determination cf the maximum cavity volume, which may differ substantially from the final volume [1] and of dimensions of the fracture zone. At the same time, these are the most important parameters for evaluating the seismic efficiency.
It appears to be quite important to utilize the information contained in compressional waves in the immediate vicinity of the fracture zone in order to determine the parameters of irreversible deformation cf the medium during underground explosions.
1. Observation Results During Explosions in Salt.
Let us consider the experimental results obtained during explosions in salt. Two USA explosions in salt: "Salmon" [2,3] and "Gnome" [4] have been described in the literature. The data on one explosion in salt detonated in the Soviet Union are also given below.
The principal parameters of the three explosions are listed in Table 1 in order of decreasing yield. The resulting cavity volumes measured considerably later (about 1 month after the explosion) are also shown.
Salt is relatively homogeneous and always has approximately the same mechanical properties: density p =2.15 g/cm ; velocity of the longitudinal wave c = 4.5 km/sec; Poisson's ratio u = 0.25-0.32. The strength of salt in situ was not measured. Laboratory crushing tests of salt samples show the strength to be ~ 400 kg/cm .
The most complete data on the mechanical effects of explosion in the salt were obtained during the "Salmon" explosion. The peak particle velocity as a function of distance determined during the "Salmon" explosion and plotted in Figure 1 can be described by the following formula:
yl/3 1.6 V v = 10 (——) .Ä R1«r DIMIV (D PRECEDING PAGE BLANK
* Translation.
-193-

Table 1
Principal Explosion Parameters
Explosion YieHY (kt of TNT)
Depth of Burst
Exploded in
Final Cavity ! Volume. V '
{103m3)
First 5.3 828 borehole 20 (Salmon)
Second 3.5 360 3
30 m chamber 23 (Gnome)
Third 1.1 160 borehole 10 ! (Soviet)
u 0) w \ 6
o
Yl/3 ' kgl/3
Firuge 1. Peak velocity as a function of distance
0 - First explosJon; + second explosion; computed from (1); average for second explosion computed from (3)
-194-

Peak dispjacement in the compressional wave (Figure 2) can be approximated by the following formula:
u =1.35Y (■ max r 1/3, Y1^!.6 (2)
where Y it* the yield (kg of TNT), r is distance from the center of the explosion (m), vmax is peak particle velocity (m/sec) and umax is peak displacement (mm).
Numerous measurements of permanent displacements were made during the "Salmon" explosion. In spite of the large scatter, these data shown in Figure 2 are of exceptional interest.
Figures 1 and 2 also show the experimental data obtained during two other explosions. These data are close to those for the "Salmon" explosion, with only the peak velocity, given by formula (3), observed during the "Gnome" detonation at equivalent distance being somewhat lefs:
Y1/3 1 6 v =6ir- ) max r (3)
CO \
CO
O
n i
\L -05 $i
•^, ^ OX •• \ ^ • \ V \ V
\ M \ ^\ . 1
• \ oX -V v- —
•
-J \ -o» V
log m
Yl/3 kgl/3
Figure 2. Medium displacement as a function of distance
o. A/ + - Peak displacements for first, second, and third explosions, respectively; o - permanent displacement for explosion I; computed from (2); computed using the technique described in section 2.
-195-
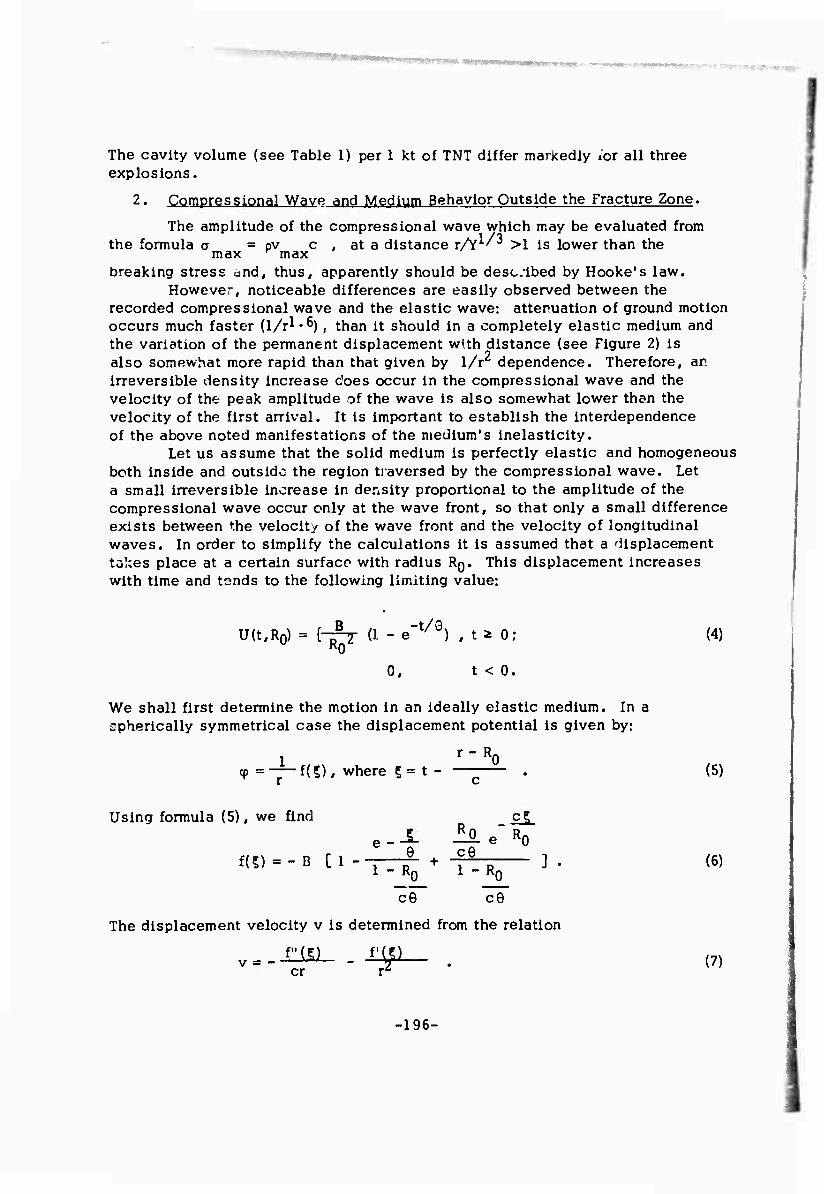
The cavity volume (see Table 1) per 1 kt of TNT differ markedly ior all three explosions.
2. Compressional Wave and Medium Behavior Outside the Fracture Zone.
The amplitude of the compressional wave which may be evaluated from the formula a = pv c , at a distance r/Y^/3 >1 is lower than the max r max breaking stress and, thus, apparently should be desc.ibed by Hooke's law.
However, noticeable differences are easily observed between the recorded compressional wave and the elastic wave: attenuation of ground motion occurs much faster (l/r^*^), than it should in a completely elastic medium and the variation of the permanent displacement with distance (see Figure 2) is also somewhat more rapid than that given by 1/r dependence. Therefore, an irreversible density increase does occur in the compressional wave and the velocity of the peak amplitude of the wave is also somewhat lower than the velocity of the first arrival. It is important to establish the interdependence of the above noted manifestations of the medium's inelasticity.
Let us assume that the solid medium is perfectly elastic and homogeneous both inside and outside the region traversed by the compressional wave. Let a small irreversible increase in density proportional to the amplitude of the compressional wave occur only at the wave front, so that only a small difference exists between the velocity of the wave front and the velocity of longitudinal waves. In order to simplify the calculations it is assumed that a displacement takes place at a certain surface with radius RQ. This displacement increases with time and tends to the following limiting value:
U(t.Ro) = {-^T 0- - e't/0) , t s 0; (4)
0, t < 0.
We shall first determine the motion in an ideally elastic medium. In a spherically symmetrical case the displacement potential is given by:
1 r-Ro cp =-^f(S), where S=t- — . (5)
Using formula (5), we find c^
e.Ju liLe'^O f(?) = - B [ 1 - -j f + -f^-r ] . (6)
i - R0 l - RQ
c6 ce
The displacement velocity v is determined from the relation
v = .illlL .X^L_ . (7) cr r^
-196-
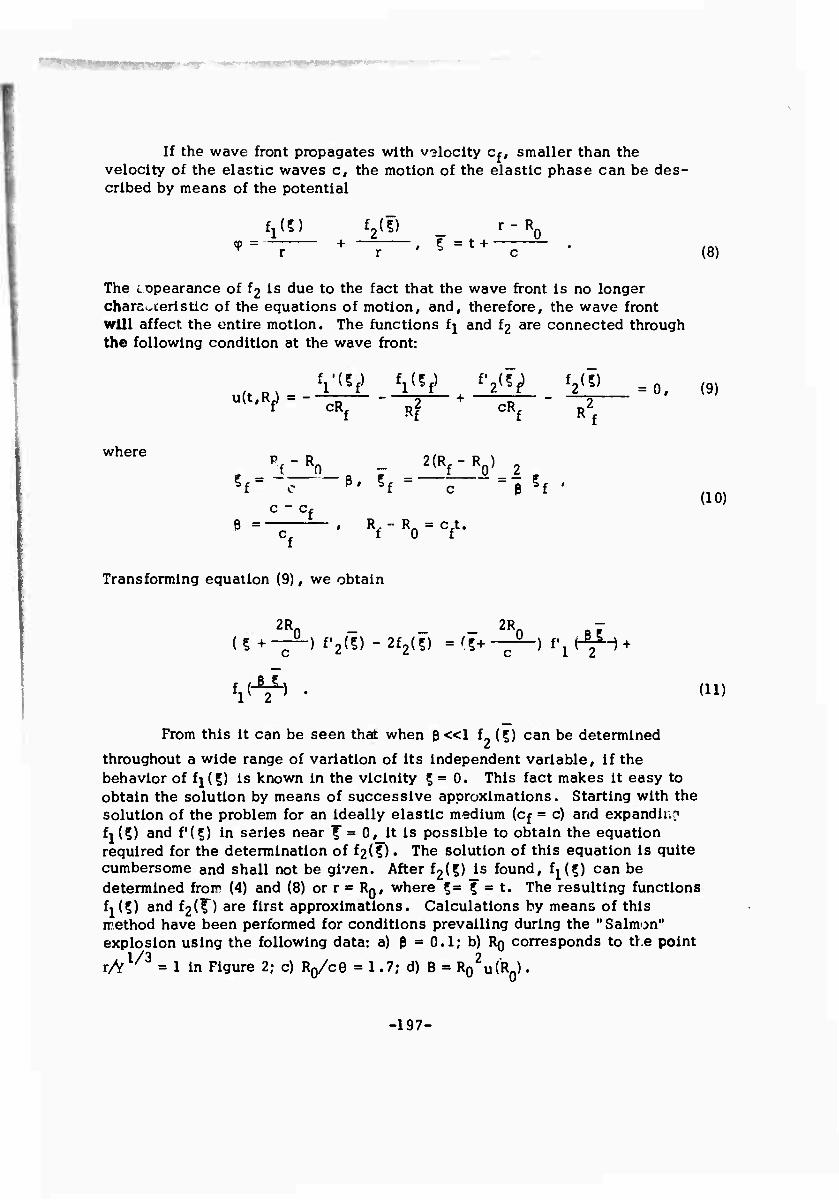
If the wave front propagates with v3locity c^, smaller than the velocity of the elastic waves c, the motion of the elastic phase can be des- cribed by means of the potential
^(5) f2(|) _ r-R0
*=- + -7—' ? =t + -7— ' (8)
The copearance of f2 Is due to the fact that the wave front Is no longer chars^cerlstlc of the equations of motion, and, therefore, the wave front will affect the entire motion. The functions fj and f2 are connected through the following condition at the wave front:
(9)
(10)
^'V = " cRf - Rf2 + cRf - -^-
Sf~ c P# 5f ^ c " p 5f '
Transforming equation (9), we obtain
2R 2R ~ ( ? + -^-) f'2il) - 2f2(5) - (?+ -~--) f'j (-^I-) +
fjC-^i . (ii)
From this It can be seen that when 0 «1 f? (§) can be determined
throughout a wide range of variation of Its Independent variable. If the behavior of fi(5) is known In the vicinity 5=0. This fact makes It easy to obtain the solution by means of successive approximations. Starting with the solution of the problem for an Ideally elastic medium (cf = c) and expanding fj(§) and f'il) In series near X = 0, It Is possible to obtain the equation required for the determination of f2(f). The solution of this equation is quite cumbersome and shall not be given. After f2(5) Is found, ^(5) can be determined from (4) and (8) or r = RQ, where 5= ? = t. The resulting functions MS) and f2(D are first approximations. Calculations by means of this method have been performed for conditions prevailing during the "Salmon" explosion using the following data: a) p = 0.1; b) Rn corresponds to the point
1/3 2 r/V ' =1 in Figure 2; c) RQ/CG = 1.7; d) B = R0 u (RJ •
-197-
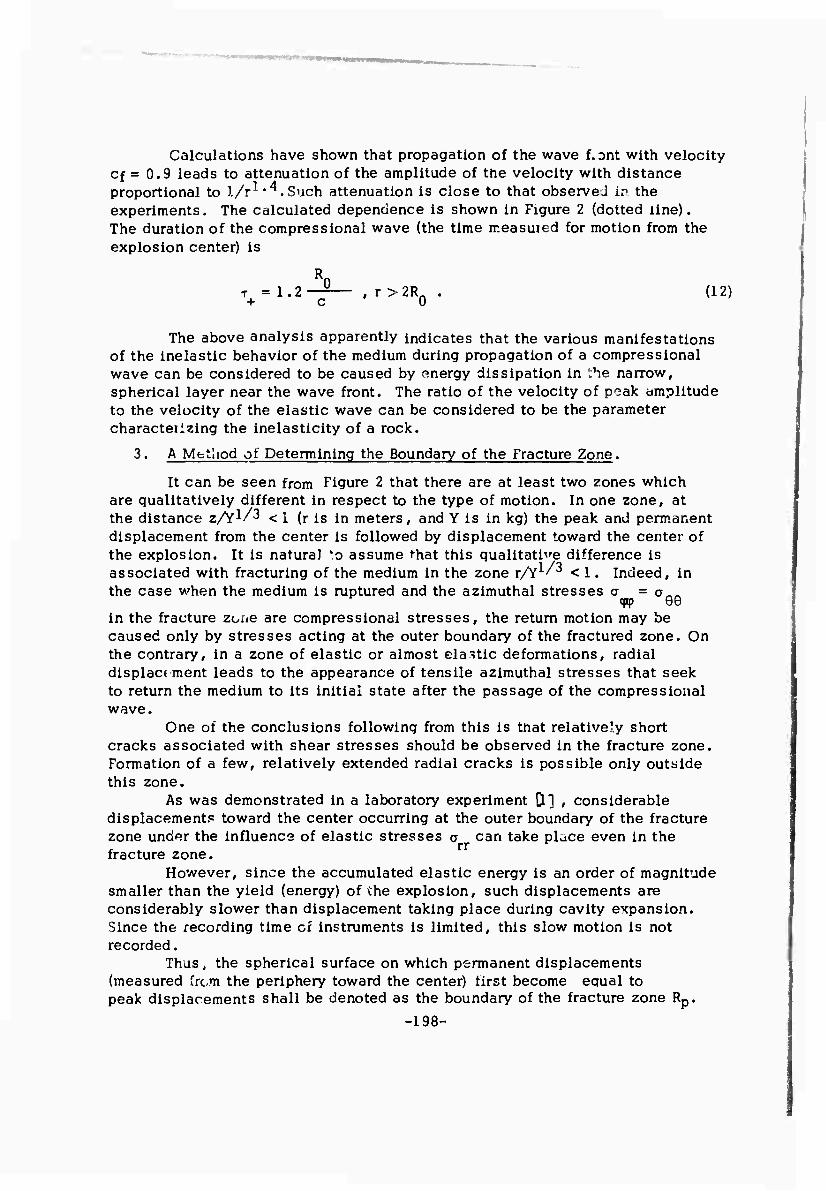
Calculations have shown that propagation of the wave font with velocity cf = 0.9 leads to attenuation of the amplitude of tne velocity with distance proportional to 1/r^ '^.Such attenuation is close to that observei In the experiments. The calculated dependence is shown in Figure 2 (dotted iine). The duration of the compressional wave (the time measured for motion from the explosion center) is
R T = 1.2—^— , r >2Rn . (12) + c 0
The above analysis apparently indicates that the various manifestations of the inelastic behavior of the medium during propagation of a compressional wave can be considered to be caused by energy dissipation in the narrow, spherical layer near the wave front. The ratio of the velocity of peak amplitude to the velocity of the elastic wave can be considered to be the parameter characteiizing the inelasticity of a rock.
3. A Mfcthod ot Determining the Boundary of the Fracture Zone.
It can be seen from Figure 2 that there are at least two zones which are qualitatively different in respect to the type of motion. In one zone, at the distance z/Y^/S < i (r is in meters, and Y is in kg) the peak and permanent displacement from the center is followed by displacement toward the center of the explosion. It is natural '".o assume that this qualitative difference is associated with fracturing of the medium in the zone xftr'^ < 1. Indeed, in the case when the medium is ruptured and the azimuthal stresses a = a^^
cpp ee in the fracture zoae are compressional stresses, the return motion may be caused only by stresses acting at the outer boundary of the fractured zone. On the contrary, in a zone of elastic or almost elastic deformations, radial displacement leads to the appearance of tensile azimuthal stresses that seek to return the medium to its initial state after the passage of the compressional wave.
One of the conclusions following from this is tnat relatively short cracks associated with shear stresses should be observed in the fracture zone. Formation of a few, relatively extended radial cracks is possible only outside this zone.
As was demonstrated in a laboratory experiment D-] , considerable displacements toward the center occurring at the outer boundary of the fracture zone under the influence of elastic stresses a can take place even in the fracture zone.
However, since the accumulated elastic energy is an order of magnitude smaller than the yield (energy) of the explosion, such displacements are considerably slower than displacement taking place during cavity expansion. Since the recording time of instruments is limited, this slow motion is not recorded.
Thus, the spherical surface on which permanent displacements (measured Trcm the periphery toward the center) first become equal to peak displacements shall be denoted as the boundary of the fracture zone Rp.
-198-

■MM m
In othar words, the velocity of radial displacements on this surface can only be positive. Unfortunately, direct determination of the boundary of the fracture zone of the medium from experimental data is possible only for the "Salmon" explosion. For other explosions, permanent displacements were either not measured, or not measured with sufficient reliability.
In this connection, the following technique is proposed for the determination of the boundary of the fracture zone. The solution of the problem of wave propagation in an almost elastic medium, discussed in the preceeding section, makes it possible to determine the relationship between the radius of the fracture zone or the zone of inelastic stresses R», set equal to RQ, and the duration of the positive phase of the compressional wave T+ by means of the relationship given by (12). However, it is more convenient to use a similar parameter G, defined in the following manner:
e^iernL = "max v v
max max
(since for r = Rp permanent displacements arf» equal to peak displacements , i.e., u = u .
perm max).
Experiments indicate that the peak velocity and peak displacement vary with distance in accordance with the same law. This means tnat 9 may te determined from vmax and urnax measured at any distance from the center of the explosion r >Rp.
The fracture zone radius can be found from the experimentally determined parameter 6. For the "Salmon" explosion the dimensions of the fracture zone calculated in such a manner coincide with the value corresponding to the intersection point of the peak and permanent displacements. Knowing the dimensions of the fracture zone and the displacement of the medium at r = R it is possible to calculate the strength of the medium a* = - ^rjr _R by means of the theory of elasticity. p
Calculated values of a* (see Table 2) are close to the compressional strength of salt determined by axial compression. The slightly k ver strength for salt for the "Gnome" experiment could be associated with some specific properties of that salt deposit. However, this trivial explanation has an alternative. Let us assume that fracturing of salt occurs upon reaching a critical shearing stress as. Then, the condition for fracturing at the boundary of the elastic region may be written in a form
CTrr " a = - ac . 11 cap s
The following relation for radial and azimuthal stresses applies to an elastic medium:
epep rr
-199-

^1^
Explosion
Table 2
Parameters of the Medium at the Boundary of the Fracture Zone a*
R u (R ) ,mm , , 7 9, msec p,m p kg/cttr
Salmon 23.5 100 220 600 Gnome 25.5 195 138 350 Soviet 14 107 130 600
When overburden pressure pgh is taken into account, we obtain
arr = " T a s " pgh ;
(14)
aW=Jt as- pgh-
From this expression it follows that the azimuthal stress decreases with depth and changes from tensile to compressive stress. In this connection it can be assumed that at shallow depths fracturing of the medium begins with formation of radial fractures and that crushing occurs later. At the same time, preliminary rupturing of the medium by radial fracturing is not possible at larger depths. This indicates that different conditions apply at the boundary of the fracture zone in the case of a shallow explosion
a =0 and a = - a , cpcp rr s
and that this fact may explain the observed variation of a* with depth. Assuming that radijl fractures at the boundary of the fracture zone have
been formed only during the third explosion, the mean value of cr can be determined from the first two explosions (as = 520 kg/cm).
4. Decrease of Density of the Medium in the Fracture Zone.
The dimensions of the fracture zone and displacements at its boundary make it possible to determine the volume displaced in the elastic region from the following formula:
V=4R2u(R) . P P
The displaced volume calculated using the values of R and u(R ) given in Table 2 was found to be several times larger than the rinal cavity volume (Table 3).
-200-

This effect may be attributed to two causes. Firstly, as was shown by the laboratory experiment, the cavity may contract as a result of stresses acting at the outer boundary of the fracture zone. The cavity volume was measured considerably later after its formation, so that maximum cavity size at the time for which the displaced volume was de termed are actually unknown. Secondly, since strains are large, but the stresses compressing the fractured medium are approximately equal to the tensile stresses, it is impossible to exclude the possibility of density decrease in the fracture zone. A decrease in density during deformation has been verified during experiments performed on explosions in sandy soil [5] . This effect was also observed in laboratory crushing tests of rock samples [6] .
Simple calculation can clarify the importance of each process. It follows from the results obtained in (1 ] that maximum cavity volume
Vmax depends on the yield of the explosion and the strength and elastic properties of the medium, i.e.,
P = v = T1Y, (15) max max
where T] is the fraction of explosion energy expended in forming the cavity, (it can be assumed to be constant and equal to 0.6 both in the case of brittle fracture and in the case of plastic flow) and Pmax is a parameter which depends on the strength of the elastic properties of the medium. (It corresponds to the minimum pressure which can fracture, or plastically deform ,the ambient medium in expanding the cavity walls). At the same time, Pmax is t'ie Pea^ pressure which can be maintained in the cavity surrounded by crushed rock.
In the case of Coulomb friction (arr = 2amm) we have
4 R 3 rr " u cpcp'
3-"Kp 1/3 P = a* [—. 1 . ,.-. max V - (16)
max
In the case of plastic flow (» - a = - crj. rr cpcp s 4 T,3
Pmax=-CTrT + |-slo^-V^-^ ' (17) max
where a ^ is determined with the overburden pressure taken into account by formula (14). The maximum cavity volume calculated from formulas (15) - (17) is given in Table 3, which also shows the values of the ratio of the maximum cavity volume to the displaced volume, which characterizes the decrease in density of the medium in the fracture zone (or plastic deformation).
It can be seen from the table that the use of the Coulomb condition (a^ = 2amm) for a description of the flow of fractured salt contradicts the experimental data. For example, in the case of the third explosion the maximum cavity volume is found to be considerably smaller than the final volume.
-201-

Table 3
Comparison of Maximum and Final Volumes of Cavity
Displaced Volume, V Final Explosion 103m3 Volume, Vf
103m3
CTrr - 2 CT!p cp CTrr"CTcpcp" "as V
max I03m3
a V
max 103m3
a
Salmon 90 20 Gnome 65 23 Soviet 20 10
22 23 4.5
0.25 0.35 0.25
50 31 10
0.55 0.48 0.50
The results obtained on the assumption that beyond the tensile breaking strength salt behaves as an ideal plastic material appear to be more probable. A comparison of the cavity volumes (maximum and final) shows that cavity compression increases with increasing depth of burial. The conditions responsible for initiating the motion of the medium toward the center and the duration of this process cab not be determined from the available experimental data. It can only be assumed that compression occurs sufficiently slowly, so that a redistribution of stresses caused by overburden pressure will occur in time.
References
1.
2.
3.
4.
5.
6.
Rodionov, V.N., I.A. Sizov, and V.M. Tsvetkov. Investigation of cavity development during a confined explosion. IN: Explosion engineering (Vzryvnoye delo), no. 64/21, 1968, Izd-vo "Nedra," Moskva, 5-24
Werth, G. and P. Randolph. Journal of Geophysical Research, v. 71, no. 14, 1966, 3405-3413
Rogers, L.A. Project Salmon. Journal of Geophysical Research, v. 71, no. 4, 1966, 3415-3426
Weart , W.D. Bulletin of the Seismologlcal Society of America, v. 52, no. 4, 1962, 987
Rodionov, V.N., A.N. Romashov, and A.P. Sukhotin. IN: Doklady, v. 123, no. 4, 1958
AN SSSR.
Stavnogin, A.P. Proceeding of the Central Scientific Research Institute of Information and Technical and Economic Investigation of Coal Mining (Trudy tsentral'nogo nauchno-issledovatel'skogo instituta infrormatsli i technichesko-yekonomicheskogo issledovaniya ugol'noy promyshlennosti, no. 5(17), 1968
-202-
NEWSPAPER AND FBIS ITEMS
A NEW INSTRUMENT FOR EARTHQUAKE PREDICTION [E ]
FBIS - SOV, v. Ill, no. 24, 4 February 1971, p. Dl
\
It is reported that an acoustic apparatus has been developed which can predict the occurrence of earthquakes with focal depths h s 25 km several hours prior their occurrence. M. Antsy erov reported at a conference held in Leningrad in February 1971, that the apparatus records noise accompanying accumulation of dynamic stresses prior to an earthquake. A sharp increase in the frequency and intensity of such noise recorded by high-sensitivity geophones is claimed to indicate that the earthquake will occur in a few hours. Tests performed in the Pamir and Altay mountains have shown that earthquakes with intensity VI could be predicted 24 hours in advance. Lower-in tensity earthquakes were predicted five-to-six hours in advance.
A NEW NETWORK O? SEISMOGRAPHIC STATIONS FOR EARTHQUAKE PREDICTION [E ]
Pravda, 7 July 1970, p. 6
A resolution adopted by the government of Tadzhlkistan calls for the construction of the country's largest geophysical test range. Including a network of seismographic stations, in the Gissar and Vakhsh valleys. Members of the Institute of Earthquakeproof Construction and Seismology, in close cooperation with scientists from the Institute of Physics of the Earth of the Academy of Sciences USSR, have been able to discover several important earthquake precursors. It has been established that the seismic regime of an area changes sharply, that there is a rapid deformation of the earth's crust, and that magnetic field intensity changes before the occurrence of an earthquake. Tiltmeters have been installed not far from the Nurek Hydro- electric Power Station. The first stage of investigations have verified that in principle, they can provide warning of approaching danger. The construction of a geophysical test range will make it possible to conduct investigations of earthquake prediction on a modem, more purposeful technological basis. It is believed that within several years, scientists at the test range will be able to accumulate sufficient data to establish relationships between geo- physical fields and manifestation of selsmicity. This will mean that the prediction of earthquakes for a very large region will become a reality.
-203-
A NEW SEISMIC SYSTEM FOR SEISMIC EXPLORATION
Izvestiya, 4 March 1971, p. 6
It is claimed that the SSTs - 3a digital seismic system developed jointly by Soviet and French specialists for seismic exploration is better than any other currently existing systems. It is compact (1/2 the size of comparable Western >models), cheap, and easy to use. Limited production of the SSTs - 3a seismic system will begin in the near future.
OE]
A NEW SEISMOGRAPHIC STATION It]
Turkmenskaya iskra, 21 April 1971, p. 4
It is reported that construction of the building housing the new Kara-Kala seismographic station in Turkmen SSR has been completed and that the seismic-instruments have been assembled.
AUTOMATIC SEISMOGRAPH PE]
Pravda, 1 February 1970, p. 1
An unattended seismograph has been installed in the village of Krasnaya Polyana on the Black Sea coast. The seismograph can operate for one and a half months without replacement of the power supply and microfilm. Malfunctions which occur during operation ox the seismograph are corrected automatically. The seismograph was developed and tested jointly by members of the Institute of Physics of the Earth and by a team of specialists from the Central Seismographic Station Sochi,
CRUSTAL STUDIES IN TIEN SHAN [E]
Pravda, 9 April 1970, p. 3
It is reported that specialists from the Kazakh Geophysical Trust used converted waves to investigate the crustai structure in the area of the city of Alma Ata. Small charges were fLed a few dozen kilometers from the center of the city. It was established that the northern section of Tien Shan mountains is dissected by a subcrustal fault. Smaller faults dissect the crust in this area into crustai blocks. The results of the investigations will be utilized in preparing a crustai model for the region investigated to be used in connection with earthquake prediction.
-204-
SEISMOGRAPH ON ICE CE]
Izvestiya, 3 January 1971, p. 3
According to Leningrad scientists, a seismograph installed on ice can detect formation of icebergs and sea storms. Such a seismograph was used not only to detect a storm in the Indlin Ocean, but also to trace the storm generated winds.
SEISMOLOGICAL CENTER [E]
Pravda, 25 November 1970, p. 4
A new seismological research center being set up in the foothills of Zailiyskiy Alatau Mountains will conduct investigations of seismicity and earthquake prediction. Boreholes for installation of seismic detectors have been drilled to depths of 1500 - 3'J00 m.
SEISMOLOGICAL EXPEDITION CE]
Pravda, 24 June 1971, p, 6
It is reported that a seismological expedition from the Institute of the Earth s crust of the Siberian Branch of the USSR Academy of Sciences is presently conducting field investigations in the Oymyakonskiy region, at the site of the strongest earthquake ever recorded in the southeastern part of the Soviet Union. Four temporary field stations are operating in this area.
-205-

DEGREES
Name - Abdullayev.. S. Degree Awarded - Candidate of Sciences Title of Dissertation - Investigation of propagation of elastic waves In
Inhomogeneous media (Knizhnaya Letopls", no. 12, 1970, 122)
Name - Beznodnly, Y. M. Date of Dissertation Defense - 27 April 1971 Degree Sought - Candidate of physical-mathematical sciences Title oi Dissertation - Structure and dynamics of the Earth's crust of the
near Tashkent seismic region from seismological data (Vechemiya Moskva, 20 April 1971)
Name - Goncharov, V. L. Degree Awarded - Candidate of technical sciences Title of Dissertation - Digital filtering of seismic signals (Knizhnaya letopls', no. 4, 1971, 259)
Name - Kabychenko, N. V. Date of Dissertation Defense - 4 May 1971 Degree Sought - Candidate of technical sciences Title of Dissertation - The development of multichannel, radio-telemetering
seismic instruments for DSS (Vechemiya Moskva, 26 April 1971)
Name - Kondoiskaya, N.V. Date of Dissertation Defense - 16 December 1970 Degree Sought - Doctor of physical-mathematical sciences Title of Dissertation - Investigation of the basic parameters of earthquake
hypocenters (methods and results of interpretation of seismic data) (Vechemiya Moskva, 8 December 1970)
Name - Levshln, A. L. Date of Dissertation Defense - 2 December 1970 Degree Sought - Doctor of physical-mathematical sciences Title of Dissertation - Theory and interpretation of seismic surface waves (Vechemiya Moskva, 23 November 1970)
-207- PRECED,NG PA6E ^ K

Name - Malamud, A.S. Date of Dissertation Defense - 1 December 1970 Degree Sought - Candidate of physical-mathematical sciences Title of Dissertation - The dependence of duration of seismic motion on
the energy of earthquakes (Vecherniya Moskva, 20 November 1970)
Name - Ospanov, A. B. Degree Awarded - Candidate of geologlcal-mineralogical sciences Title of Dissertation - Deep structure of the Uspensk tectonic zone and of
adjacent areas from DSS data (Knizhnäya Letopis', no. 6, 1970, 217)
Name - Semenov, A. N. Date of Dissertation Defense - 6 April 1971 Degree Sought - Candidate of physical-mathematical sciences Title of Dissertation - Temporal-spatial distribution of compressional
wave versus shear wave ratios in connection with earthquake prediction (Vecherniya Moskva, 26 March 1971)
Name - Slavina, L. B. Date of Dissertation Defense - 3 November 1970 Degree Sought - Candidate of physical-mathematical sciences Title of Dissertation - Characteristics of travel times of P generated by
earthquakes in the Pacific Ocean seismic belt and recorded by Soviet stations
(Vecherniya Moskva, 23 October 1970)
-208-

APPENDIX 1
LIST OF REFERENCES USED IN THIS ISSUE OF THE GEOSCIENCES BULLErN. SERIES A
f
PERIODICALS PAGES IN THIS BULLETIN
Title Vol. No. Year Pages
AN SSSR. Dcklacy 1£J 6. 1970 1340-1343 69-74
191 3 1970 574-576 188-191
192 5 1970 1033-1036 61-66
194 1 1970 80-82 179-183
194 1 1970 815-817 46-49
194 1 1970 987-900 82
195 4 1970 811-813 151-152
AN SSSR. Izvestlya. Flzika zemll — 6 1970 84-87 25
— 6 1970 88-91 31
— 8 1970 88-89 38
— 9 1970 72-75 45
— 9 1970 76-83 21-22
— 1 1971 13-20 169-178
— 2 1971 33-39 159-167
— 5 1971 102-113 40-43
AN SSSR. Slblrskoye otdeleniye. Flziko-tekhnlchesklye problemy razrabotkl poleznykh Iskopaye- mykh 1970 99-102 137-142
AN SSS R. I zve s tlya. Siblrs koye otdeleniye. Serlya tekhnl- chesklkh nauk 1970 102-105 127-131
-209-

PAGES IN THIS BULLETIN
Title Vol. No. Year Pages
AN SSSR. Vestnik — 10 1970 117-119 11-12
Atomnaya energiya 30 1 1971 31-36 183-202
Fizlka goreniya i vzryva 5 3 1969 444-446 113 5 4 1969 510-512 132-135 5 4 1969 513-516 125
Fizika tverdogo tela 12 7 1970 2175-2178 153-156 13 3 1971 893-895 149-152
Geologlya i geofizika — 9 1969 94-102 79 — 10 1969 99-103 67-68
Geophysica — 10 1968 1-9 80 — 10 1968 11-23 77-78 — 10 1968 35-43 187 — 10 1968 55-68 83 — 10 1968 125-127 81
Izgradnja 23 4 1969 37-45 37
Otbor i peredacha informatsii — 19 1969 29-32 30-31
Qtkrytiya, izobreteniya. promyshlennyye obraztsy. tovarnyye znaki — 7 1971 142 24
Razvedochnaya geofizika — 39 1970 46-53 78
Sovetskaya geologiya — 2 1971 165-172 1-10
Zhumal prikladnoy mekhaniki i technicheskoy fiziki — 2 1970 134-139 115-124
— 6 1970 107-110 143-158 — 1 1971 171-176 95-104 — 2 1971 101-105 87-94 — 2 1971 110-114 105-112
IRREGULAR PUBLICATIONS
PAGES TN THIS BULLETIN
Title
Atlas of the Antarctic (Atlas
Vol. No. Year Pages
Antarktiki), Leningrad, Izd-vo "Gidrometeoizdat" 2
-210- 1969 195-205 81
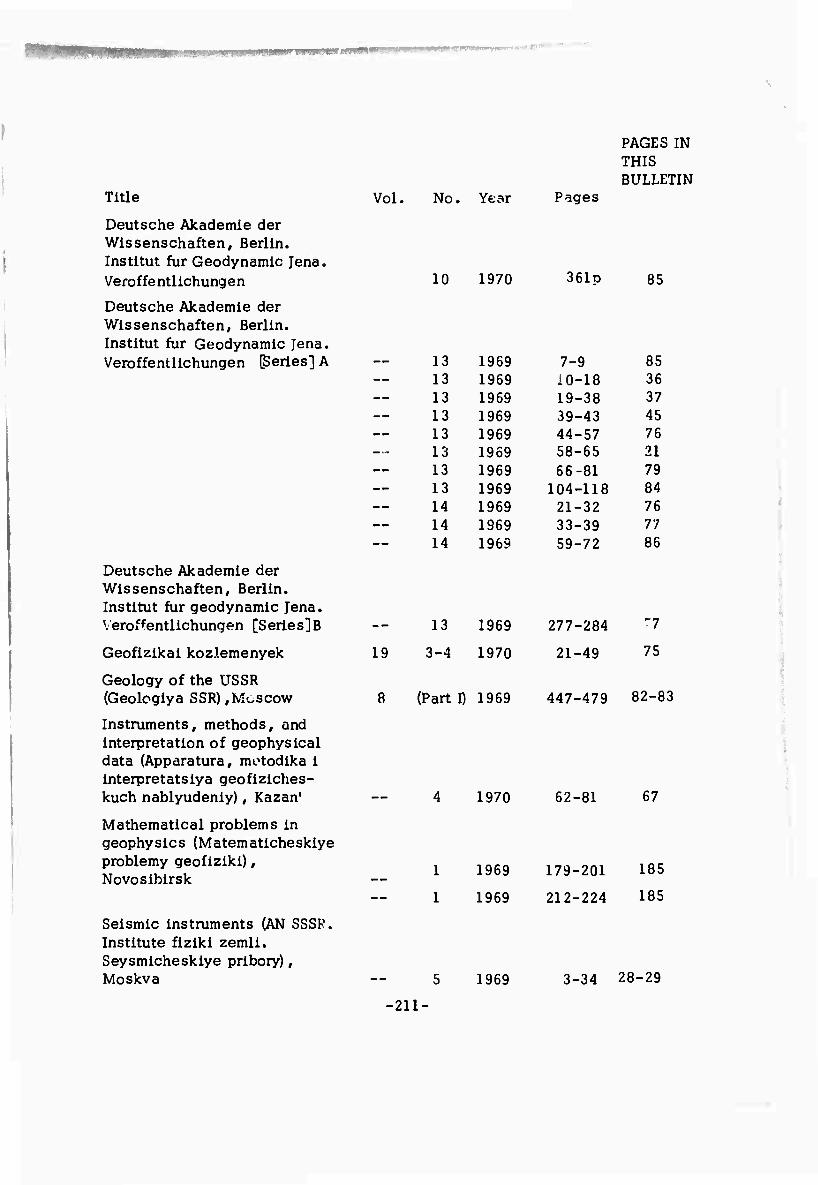
Title
Deutsche Akademie der Wissenschaften, Berlin. Institut fur Geodynamic Jena. Veröffentlichungen
Deutsche Akademie der Wissenschaften, Berlin. Institut für Geodynamic Jena. Veröffentlichungen [Series] A
Vol.
Deutsche Akademie der Wissenschaften, Berlin. Institut fur geodynamic Jena. Veröffentlichungen [Series]B
Geoflzikai kozlemenyek
Geology of the USSR (Geologiya SSR),Moscow
Instruments, methods, and interpretation of geophysical data (Apparatura, motodika i interpretatsiya geofiziches- kuch nablyudenly), Kazan'
19
No. Year
10 1970
1970
Seismic instruments (AN SSSF. Institute fiziki zemll. Seysmichesklye pribory), Moskva
Pages
361D
PAGES IN THIS BULLETIN
85
13 1969 7-9 85 13 1969 10-18 36 13 1969 19-38 37 13 1969 39-43 45 13 1969 44-57 76 1 *i 1969 58-65 21 13 1969 68-81 79 13 1969 104-118 84 14 1969 21-32 76 14 1969 33-39 77 14 1969 59-72 86
13 1969 277-284 "7
3-4 1970 21-49 75
(Part I) 1969 447-479 82-f
62-81 67
Mathematical problems in geophysics (Matematichesklye problemy geofiziki), Novosibirsk 1 1969 179-201 185
— 1 1969 212-224 185
1969 3-34 28-29
-211-
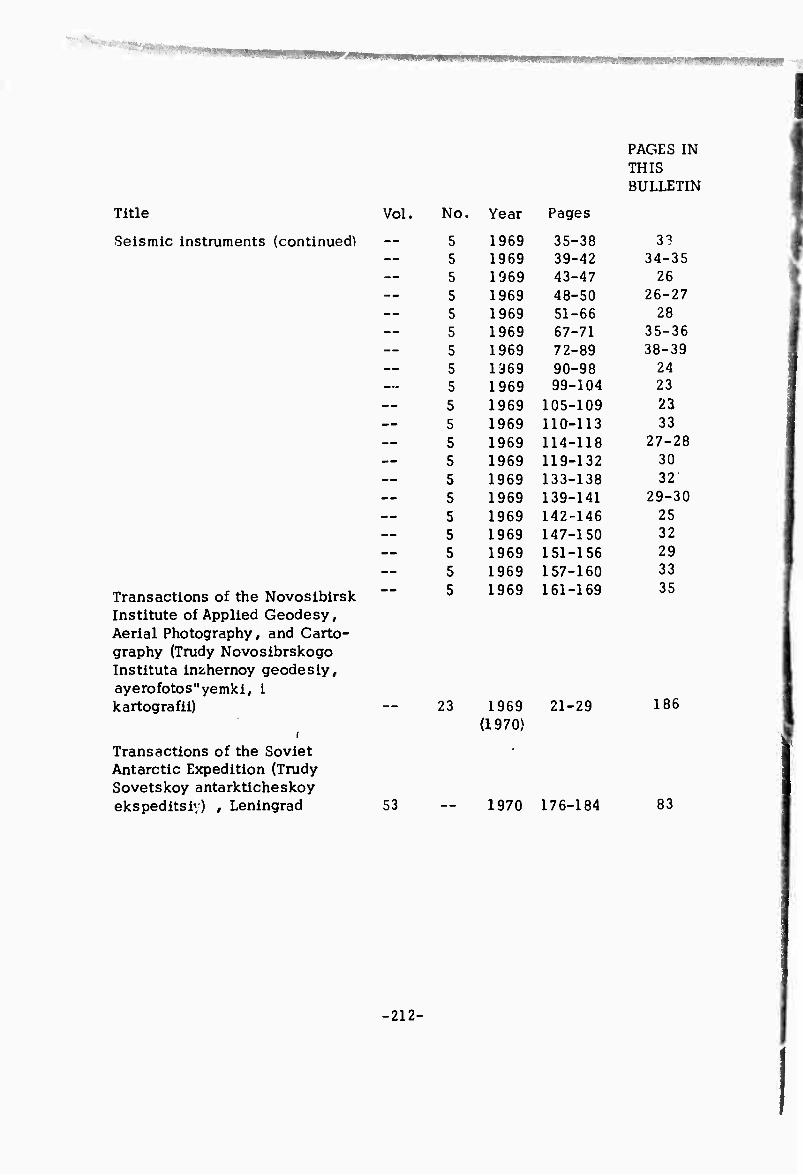
Title Vol.
Seismic instruments (continued)
Transactions of the Novosibirsk Institute of Applied Geodesy, Aerial Photography, and Carto- graphy (Trudy Novoslbrskogo Instituta inzhernoy geodesly, ayerofotos"yemki, i kartografil)
r Transactions of the Soviet Antarctic Expedition (Trudy Sovetskoy antarkticheskoy ekspeditsiy) , Leningrad
PAGES IN THIS BULLETIN
Mo. Year Pages
5 1969 35-38 33 5 1969 39-42 34-35 5 1969 43-47 26 5 1969 48-50 26-27 5 1969 51-66 28 5 1969 67-71 35-36 5 1969 72-89 38-39 5 1369 90-98 24 5 1969 99-104 23 5 1969 105-109 23 5 1969 110-113 33 5 1969 114-118 27-28 5 1969 119-132 30 5 1969 133-138 32 5 1969 139-141 29-30 5 1969 142-146 25 5 1969 147-150 32 5 1969 151-156 29 5 1969 157-160 33 5 1969 161-169 35
23 1969 21-29 (1970)
186
53 1970 176-184 83
-212-
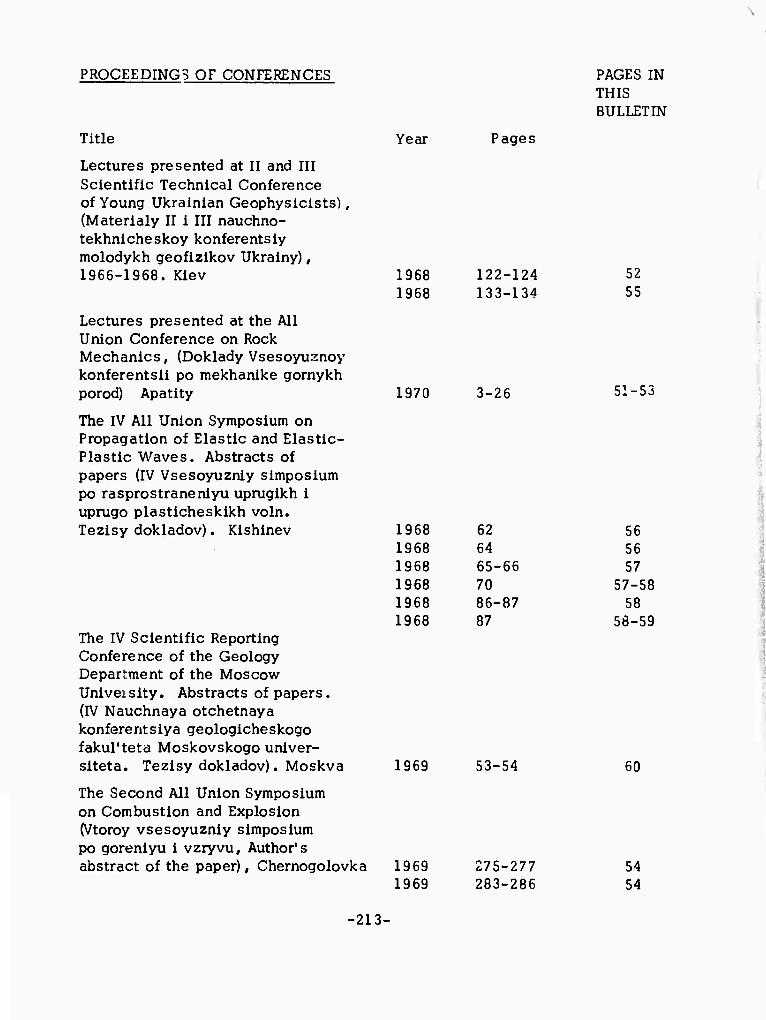
►• ***&
PROCEEDINGS OF CONFERENCES PAGES IN THIS BULLETIN
Title Year Pages
Lectures presented at II and III Scientific Technical Conference of Young Ukrainian Geophysicists), (Materialy II i III nauchno- tekhnicheskoy konferentsiy molodykh geofizikov Ukrainy), 1966-1968. Kiev 1968 122-124 52
1968 133-134 55
Lectures presented at the All Union Conference on Rock Mechanics, (Doklady Vsesoyuznoy konferentsii po mekhanike gornykh porod) Apatity 1970 3-26 51-53
The IV All Union Symposium on Propagation of Elastic and Elastic- Plastic Waves. Abstracts of papers (IV Vsesoyuznly Simposium po rasprostraneniyu uprugikh i uprugo plasticheskikh voln. Tezlsy dokladov). Kishinev 1968 62 56
1968 64 56 1968 65-66 57 1968 70 57-58 1968 86-87 58 1968 87 58-59
The IV Scientific Reporting Conference of the Geology Department of the Moscow Unlveisity. Abstracts of papers. (IV Nauchnaya otchetnaya konferentsiy a geologicheskogo fakul'teta Moskovskogo unlver- slteta. Tezisy dokladov). Moskva 1969 53-54 60
The Second All Union Symposium on Combustion and Explosion (Vtoroy vsesoyuzniy Simposium po goreniyu i vzryvu. Author's abstract of the paper), Chernogolovka 1969 275-277 54
1969 283-286 54
-213-

NEWSPAPER AND FBIS ITEMS PAGES IN THIS BULLETIN
Title Vol. No. Date Pages
FBIS-SOV Ill 24 2/4/71 Dl 203
Izvestiya — — 3/4/71
1/3/71
6
3
204
205
Pravda
— —
2/1/70 4/9/70 7/7/70
11/25/70 6/24/71
1 3 6 4 6
204 204 205 205 205
Turkmenskaya iskra 4/21/71 204
-214-