d ed k& d, /e h^dz/ > s >kwd ed kz' e/ d/ke
TRANSCRIPT

UNITED NATIONS INDUSTRIAL DEVELOPMENT ORGANIZATION
ASSESSMENT OF THE SOCIO-ECONOMIC EFFECTS OF COVID-19 AND CONTAINMENT MEASURES ON PHILIPPINE ENTERPRISES
JULY 2020
RESPONDING TO THE CRISISBuilding a better future
INCLUSIVE AND SUSTAINABLEINDUSTRIAL DEVELOPMENT

ASSESSMENT OF THE SOCIO-ECONOMIC EFFECTS OF COVID-19 AND
CONTAINMENT MEASURES ON
PHILIPPINE ENTERPRISES
JULY 2020
In partnership with:

1 | P a g e
Table of Contents
LIST OF FIGURES ................................................................................................................................................................... 2
LIST OF ACRONYMS ............................................................................................................................................................... 3
EXECUTIVE SUMMARY ........................................................................................................................................................... 4
1.0 INTRODUCTION......................................................................................................................................................... 6
1.1 COVID-19 AND CONTAINMENT MEASURES IN THE PHILIPPINES ................................................................................... 6
1.2 UNIDO RESPONSE TO COVID-19 .......................................................................................................................... 7
1.3 ASSESSMENT OF PHILIPPINE ENTERPRISES TOWARD INDUSTRY POLICY ADVICE .............................................................. 8
1.3.1 DESIGN AND METHODOLOGY .............................................................................................................................. 9
1.3.2 SCOPE AND ANALYSIS ....................................................................................................................................... 10
2.0 KEY INSIGHTS AND RECOMMENDATIONS .................................................................................................................... 11
2.1 SUPPLY- AND VALUE-CHAINS ................................................................................................................................ 12
2.2 HUMAN RESOURCES ............................................................................................................................................ 13
2.3 BUSINESS CONTINUITY MANAGEMENT .................................................................................................................. 14
2.4 SUPPORT AND INVESTMENTS FOR MSME RECOVERY............................................................................................... 15
2.5 INDUSTRY INNOVATION AND DIVERSIFICATION ........................................................................................................ 17
3.0 RESPONDENT DEMOGRAPHICS.................................................................................................................................. 19
4.0 MAJOR FINDINGS ................................................................................................................................................... 21
5.0 ACKNOWLEDGMENTS .............................................................................................................................................. 33
ANNEXES ........................................................................................................................................................................... 34
ANNEX A – Detailed List of Sectors Allowed During ECQ and GCQ as per DTI Memorandum Circular 20-22 .......... 35
ANNEX B – Assessment Tool, List of Questions .......................................................................................................... 41
ANNEX C – Respondent Demographics: Data and Charts ......................................................................................... 51
ANNEX D – Immediate Impact of COVOD – 19 Containment Measures: Data and Charts ...................................... 60
ANNEX E – Support for MSME Recovery: Data and Charts ....................................................................................... 79
ANNEX F – Responses to Questions with Multiple Answers ...................................................................................... 99

2 | P a g e
LIST OF FIGURES
Chart Title Page
Respondent Firms According to Firm Size (Annex C: Figure 1) 19
Comparison Between 2018 Population of Philippine Enterprises and Respondent Firms According to
Firm Size (Annex C: Figure 2)
20
Respondent Firms According to Sector (Annex C: Figure 3) 20
Respondent Firms According to Client Orientation (Annex C: Figure 7) 20
Respondent Firms According to Operational Status (Annex D: Figure 34) 21
Respondent Firms, Operational Status vs Firm Size (Annex D: Figure 35) 21
Respondent Firms According to Permission to Operate (Annex D: Figure 38) 21
Respondent Firms, Permission to Operate vs Firm Size (Annex D: Figure 39) 21
Challenges Faced by Non-operating Firms Permitted to Operate (Annex D: Figure 42) 22
Challenges Faced by Operating Firms (Annex D: Figure 49) 23
Changes Adopted by Operating Firms (Annex D: Figure 53) 23
Reduction in Operating Hours (March/April vs February 2020) (Annex D: Figure 77) 24
Reduction in Revenue and Production Volume (March/April vs February 2020) (Annex D: Figure 81) 24
Reduction in Employment (March/April vs February 2020) (Annex D: Figure 88) 24
Means Considered to Address Shortage of Inputs (Annex D: Figure 57) 25
Challenges in Distribution, Shipping, and Logistics (Annex D: Figure 61) 26
Means Considered to Address Issues on Distribution, Shipping, and Logistics (Annex D: Figure 65) 26
Challenges in Lack of Manpower (Annex D: Figure 69) 26
Means Considered to Address Lack of Manpower (Annex D: Figure 73) 26
Biggest Challenges for Firms During Recovery (Annex E: Figure 99) 27
Nature of Cashflow Challenges (Annex E: Figure 104) 27
Means Considered to address Cashflow Challenges (Annex E: Figure 107) 27
Non-operating Firms Permitted to Operate, BCP vs Firm Size (Annex D: Figure 46) 28
Reasons for Not Having BCPs (Annex E: Figure 125) 28
Challenges in Implementing a BCP (Annex E: Figure 121) 28
Amount Required by Firms for Recovery (Annex E: Figure 111) 29
Loan Applications in the Past 2 Years (Annex E: Figure 114) 29
Required Support for the Recovery of Firms – Market and Business Environment (Annex E: Figure
129)
29
Required Support for the Recovery of Firms – Human Resources and Compensation (Annex E: Figure
133)
30
Required Support for the Recovery of Firms – Financial Aspects (Annex E: Figure 137) 30
Perception of the “New Normal” (Annex E: Figure 94) 31
Options Considered for the Diversification of Operations (Annex E: Figure 157) 31
Standards and Technology Solutions Firms have Shown Interest In (Annex E: Figure 141) 32

3 | P a g e
LIST OF ACRONYMS
ADFIAP Association of Development Financing Institutions in Asia and the Pacific
AIM Asian Institute of Management
BCP Business Continuity Plan
BPO Business Process Outsourcing
BSMED Bureau of Small and Medium Enterprise Development
CAR Cordillera Administrative Region
CIG Competitiveness and Innovation Group
DBP Development Bank of the Philippines
DOST Department of Science and Technology
DTI Department of Trade and Industry
ECQ Enhanced Community Quarantine
GCQ General Community Quarantine
GVC Global Value Chains
IATF Inter-agency Taskforce
IFI International Financial Institution
ILO International Labor Organization
ISID Inclusive and Sustainable Industrial Development
ISSI Institute for Small-scale Industries
ITDI Industrial Technology and Development Institute
LGU Local Government Unit
MSME Micro-, Small, and Medium Enterprises
NCR National Capital Region
NEDA National Economic and Development Authority
OTOP One Town One Product
PCCI Philippine Chamber of Commerce and Industry
ROG Regional Operations Group
SDG Sustainable Development Goals
SME Small and Medium-sized Enterprises
SSD Strict Social Distancing
UNIDO United Nations Industrial Development Organization
UP University of the Philippines

4 | P a g e
EXECUTIVE SUMMARY
The COVID – 19 pandemic has left very few nations unscathed. In the Philippines, while concerted efforts around
urgent health concerns were intensified, the response measures, including an enhanced community quarantine (ECQ),
had caused disruptions across various economic and social sectors, endangering employment and livelihood, and
causing urgent issues around food security and safety, nutrition, and income-generation. MSMEs, contributing to 36%
of total value-added in 2018, and employed 63% of the workforce, remain to be one of the highly-vulnerable groups
to economic shocks, needing the most support not only during emergency periods but also during the recovery phase.
The United Nations Industrial Development Organization (UNIDO), in collaboration with the Department of Trade
and Industry, and other partners from government, private sector, the academe, and other development partners,
embarked on the “Assessment of the Socio-economic Effects of COVID-19 and Containment Measures on Philippine
Enterprises” with the intent to (1) determine the impacts / effects of the COVID-19 containment measures and
responses to the operations and financial positions of Philippine enterprises; and (2) identify gaps and areas of
improvement that can guide and inform the design of technical assistance, stimulus packages, and other financing
opportunities for MSME recovery, beyond addressing the usual cash flow issues, but also to build back better and
increase resilience against possible future social or economic shocks.
Among various major findings, the assessment specifically revealed that during the implementation of
containment measures, respondent firms, mostly microenterprises from the manufacturing sector, encountered
difficulties in coordinating their supply chains, resulting to half of operating firms experiencing 40% reduction in
operating hours, around 50% loss of employment, and 60% reduction in both revenues and production volume. Lack
of available transportation for employees and fear in going to work contributed to the issues around insufficient
workforce to maintain operations, with only a handful of firms able to successfully implement work-from-home
arrangements. Most firms also experienced difficulties in coordinating their supply / value chains leading to shortages
in raw material supply and impediments in distribution, shipping, and logistics. These were felt more by the
microenterprises and the domestic-oriented firms. Furthermore, challenges were compounded by majority of firms
not having clear and responsive plans for business continuity, especially during extraordinary situations.
UNIDO has provided recommendations toward updating policies and strengthening programmes in relation to
resilient supply / value chains, ensuring safe mobility of human resources during emergency situations, and promotion
of standards for business continuity management and technology adoption for safety in workplaces. Equally
important in moving forward to recovery are the recommendations around support and investments for MSMEs. It
must be recognized that while many firms will require various forms of assistance toward successful recovery, support
packages under the existing allocation for SME financing will not remain responsive in addressing financial gaps

5 | P a g e
related to cashflow issues and efforts to build back better through smart investments, exacerbated further by the
prevailing low lending confidence. Among other recommended measures, the effective structuring of loan packages
that are inclusive, accessible by the most-challenged such as the microenterprises, youth- / gender-responsive, and
focused on rescuing existing firms, incorporating more – robust sustainability aspects, will be crucial. Policies and
programmes that foster innovation and diversification toward the “new normal” will also be needed. This will be
accompanied by parallel efforts to strengthen quality, safety, and digital infrastructures; build and support an
innovation ecosystem in a digitalized environment; promote technology development and adoption; and shift
development paradigm towards green investments, green jobs, and clean technologies.

6 | P a g e
1.0 INTRODUCTION
1.1 COVID-19 AND CONTAINMENT MEASURES IN THE PHILIPPINES
The COVID-19 outbreak has placed a tremendous strain on societies and economies around the world. In the
Philippines, healthcare systems that were unprepared to face a health crisis at this scale and magnitude were put
under pressure, facing shortages of facilities, manpower, medical equipment and supplies of personal protective
equipment (PPE), and challenges with the management of excessive medical wastes. The emergency has also resulted
to response measures that have caused disruptions across economic and social sectors, causing urgent issues around
food security and safety, nutrition, and income-generation; and endangering employment and livelihood. The long-
term socio-economic impacts are expected to be immense and far-reaching.
On 13 March 2020, due to the increasing incidence of confirmed positive COVID-19 cases, the Philippine
government placed the National Capital Region (NCR) under STRICT SOCIAL DISTANCING (SSD), for 30 days effective
15 March 20201. It later placed the entire island of Luzon under ENHANCED COMMUNITY QUARANTINE (ECQ),
covering Regions I to V including the Cordillera Administrative Region (CAR). This “lockdown”, together with similar
efforts initiated by government officials in other locations outside of Luzon, while with the intention of controlling the
spread of the COVID-19 virus, created a major impact on socio-economic activities affecting income-generation,
employment, and the supply of goods and services estimated to potential reach, according to the National Economic
and Development Authority (NEDA), a maximum value of PhP 1.36T and about 1.8M of lost employment 2, assuming
adverse conditions will persist until June 2020.
A Memorandum Order from the Executive Secretary was released on 16 March 2020, providing further guidance
as to the parameters of the ECQ. Banks, money transfer services, and utilities The Inter-agency Task Force for the
Management of Emerging Infectious Disease (IATF) later released Resolution No.14 on 20 March 2020, providing
additional clarification, among others, as to the activities supporting business operations of establishments that were
permitted to operate due to the criticality of the goods and services they produce. These include, but are not limited
to the guidelines identifying establishments that were permitted to operate during the ECQ, as well as directives to
support the unimpeded movement of cargo and essential personnel.
The Luzon ECQ was extended to 30 April 2020 as per IATF Resolution No. 20 dated 06 April 2020. On 27 April
2020, as per IATF Resolution No. 20, some parts of Luzon remained under ECQ, effective for the period 01 to 15 May
2020, while others were downgraded to GENERAL COMMUNITY QUARANTINE (GCQ) status. Those in Luzon still
1 IATF Resolution No. 12. 13 March 2020 2 National Economic and Development Authority (NEDA). 19 March 2020. Addressing the Social and Economic Impact of COVID-19 Pandemic

7 | P a g e
under ECQ include NCR, R-III, R-IVA, Baguio, Benguet, and Pangasinan. Outside Luzon, Iloilo, Cebu, Bacolod City, and
Davao City also remained under ECQ. DTI Memorandum Circular 20-22 (ANNEX A) was issued on 05 May 2020 and
to provide further guidance on business establishments or activities allowed to operate in areas declared under ECQ
and GCQ.
In March 2020, the government announced a PhP 27 B fiscal measure, part of which involves micro-, small and
medium enterprises (MSME), supporting microfinance loans and loan restructuring to promote resilience, especially
for the tourism and agricultural sectors. During the ECQ In April 2020, the government announced an aid plan3
amounting to PHP 1.17 T (about 6.3% of GDP), PHP 1 B (0.09%) of which was used as MSME loan assistance, PHP 35
B (2.96%) was for wage subsidy, assisting small businesses that were non-operational due to expanded community
isolation, while the rest for emergency support to vulnerable groups and individuals (26.06%), fiscal and monetary
actions (70.90%), and implementation of an economic recovery plan. A portion of the funds was also used to
investigate the extent of damage to industries from the epidemic, particularly the effect on MSMEs.
Part of this aid plan includes a total of PhP 310 B funds obtained from various multilateral and bilateral sources,
part of which was used to support MSMEs' deferrals of tax payments, deferrals of loan repayments, and documentary
stamp tax exemption of credit extensions or restructuring of loan repayments. A PhP 150 M grant was received from
the Asian Development Bank to augment resources to fight COVID-19 while access to a PhP 5 B World Bank (WB) fast-
track loan facility for the purchase of medical supplies and testing kits was also facilitated.
1.2 UNIDO RESPONSE TO COVID-19
In light of the global economic downturn caused by the
spread of the COVID-19 virus, UNIDO is working with its
Member States, the UN system, development partners,
international financial institutions (IFIs), the business sector,
and others to support the national productive and
manufacturing sectors along with related value chains, in
reducing the negative economic impacts of the pandemic in
a sustainable and inclusive manner. As UNIDO is not an
organization mandated to provide humanitarian or
emergency response, it is focusing on socio-economic
3 United Nations Conference on Trade and Development (UNCTAD). 12 June 2020. Philippines Country Response

8 | P a g e
recovery approaches, aligned with the United Nations “Framework for the immediate socio-economic response to
COVID-19”.
In the Philippines, UNIDO aims is to cooperate with government, private sector, development partners, and the
donor community, in providing feasible immediate assistance while the crisis is still ongoing, followed by support
towards recovery in the medium- to long-term. The UNIDO COVID-19 Response in the Philippines is aligned with the
government’s plans and programs in the “We Recover as One” document, and covers the following areas:
I. Strengthening healthcare, safety systems and capacities to respond to COVID 19 through productive
activities
II. Support to recovery of the economy through micro-, small, and m-sized enterprises (MSME) growth and
resilience
III. Socio-economic impact assessment and industrial policy advice
In order to facilitate these efforts in the Philippines, UNIDO has convened a multi-stakeholder working group
composed of representatives from various government agencies, private sector industry players, and other
development partners. UNIDO is also leading the Small and Medium Enterprises (SME) Subgroup of the United
Nations COVID-19 Working Group on Socio-Economic Response.
1.3 ASSESSMENT OF PHILIPPINE ENTERPRISES TOWARD INDUSTRY POLICY ADVICE
Enterprises in the Philippines are the major drivers of the economy. Among these, MSMEs comprise about 99.5%.
While they make up the overwhelming majority of firms in the country, contributing, in 2018, to 36% of total value-
added and employing 63% of the workforce4, MSMEs are the most vulnerable to economic shocks such as the one
brought about by the COVID-19 containment measures. The Secretary of the Philippines’ Department of Trade and
Industry asserts that the successful recovery of MSMEs will be crucial to kick-starting the economy.
In cooperation with government, private-sector, and other development partners, UNIDO conducted the
assessment of the effects of COVID-19 and containment measures to Philippine enterprises through an online tool
composed of questions designed to gather information for the better understanding of the specific concerns and
challenges faced by enterprises during the ECQ as well as the expected difficulties in recovery. With initial
consultations with the Bureau of Small and Medium Enterprise Development (DTI-BSMED) and the Competitiveness
and Innovation Group (DTI-CIG) of the Department of Trade and Industry, this assessment was made consistent with
government action plans being developed, particularly under the IATF Anticipatory and Forward Planning Working
Group. Insights and learnings from this assessment can aid government and development partners in the crafting of
4 Philippine Statistics Authority (PSA). 2018
9 | P a g e
appropriate and high-impact technical and financial assistance including policy advice, helping to address both
immediate and long-term needs of enterprises.
1.3.1 DESIGN AND METHODOLOGY
The main objectives of the assessment include: (1) Determine the impacts / effects of the COVID-19
containment measures (e.g. quarantine, social distancing, etc.) and responses to the operations and financial
positions of Philippine enterprises; and (2) Identify gaps and areas of improvement that will guide the design of
technical assistance, stimulus packages, financing opportunities for the recovery, beyond addressing the usual
cash flow issues, but to build back better.
The online assessment tool is composed of a series of inquiries grouped into three categories as follows:
All questions were of the multiple-choice type with provisions to input responses that are not indicated among
the choices. Depending on the nature of the inquiry, some questions allowed for single responses only while
others provided space for multiple responses up to a certain maximum.
In order to avoid duplication, maximize the type of information being gathered, and to add value to
nationwide efforts toward addressing COVID-19 impacts, the design of the questions was informed by other
COVID-19-related assessments such as the IATF socio-economic survey, the Consumer and Business Survey
conducted by the National Economic and Development Authority (NEDA), and the UNIDO regional enterprise
survey implemented in various ASEAN countries. Inputs on the design were also received from UNIDO partners
including DTI-BSMED under the Regional Operations Group (DTI-ROG) of the Department of Trade and Industry,
the Industrial Technology and Development Institute (DOST-ITDI) of the Department of Science and Technology,
the Rizalino S. Navarro Policy Center of the Asian Institute of Management (AIM), the Institute for Small-scale
Industries of the University of the Philippines (UP-ISSI), the Philippine Chamber of Commerce and Industry (PCCI),
the Development Bank of the Philippines (DBP), and the Association of Development Financing Institutions in
Asia and the Pacific (ADFIAP) and the International Labor Organization (ILO).
Categories Information Gathered
Business profile Demographics and general characteristics of business operations
Immediate impact Situation and experiences in coping with the current COVID-19
pandemic and related containment measures
Recovery Perception of the “new normal”, required technical and financial
assistance, future plans, and strategies to build back better

10 | P a g e
The online assessment tool was disseminated to target respondents using the Google Forms platform and was
conducted from 28 April to 16 May 2020 when ECQ was still in place for Luzon and various other containment
measures also in place in other locations.
1.3.2 SCOPE AND ANALYSIS
The nationwide respondent pool includes micro-, small, medium, and large enterprises operating in the
Philippines that were reached through the assistance of UNIDO partners. Companies and firms that participated
in UNIDO projects such as promotion of biogas technology and food cold chain were also invited to participate in
the assessment. Other respondents may also have been reached through existing enterprise networks and
associations.
Analyses of the data were conducted by UNIDO with further guidance, comments, and suggestions provided
by partners DTI-BSMED, AIM, UP-ISSI, PCCI, and ADFIAP. Reported results recognize that the perceptions,
experiences and expectation of respondents can change quite rapidly during an ongoing crisis situation.
The total number of respondents who participated in the online assessment is 235, allowing at most to draw
insights and trends from the responses in relative terms. Data was disaggregated to reflect information among
firms with similar classifications, highlighting when possible the higher proportion of responses that may be
unique to different firm sizes, sectors, value-chain players, years of operation, owners’ profiles, etc.

11 | P a g e
2.0 KEY INSIGHTS AND RECOMMENDATIONS
The containment measures implemented by the Philippine government to address the growing number of
confirmed positive cases of COVID-19 in the country had expected serious economic setbacks that industries,
particularly MSMEs, were not totally ready to absorb and adapt to. While the country had, to some extent,
successfully developed resilience and adaptability to the usual climate-related events that occur on a somewhat
regular frequency, paralysis of economic activities due to health concerns, at this scale, was unprecedented in the
nation’s history and caught many unprepared.
In order to improve preparedness and build back better, increasing resilience of MSMEs to face a pandemic of a
similar nature that may re-occur in the future, appropriate industry-related policies and mechanisms, instituted both
by government and the private sector, must be put in place, properly informed by evidence-based findings gathered
at the firm level. Results will reinforce other findings generated by government and other groups by adding focus on
specific firm-level concerns upon which policies, programmes and other interventions can be uniquely-tailored to
meet the needs of different segments and sectors.
Here is a summary of the insights gathered from the assessment conducted and some recommendations the
country may consider in moving forward:
In general, around 60% of respondent firms were not in operation during the survey period brought about by
the COVID-19 containment measures. A higher proportion of microenterprises and domestic-oriented firms were in
this situation. Most of these microenterprises were manufacturers of finished goods, firms that have been in
operation for 5 years or less, youth- and women-owned. Domestic-oriented firms, on the other hand, were mostly
from the trade sector, operating for 5 years or less, and owned by individuals more than 35 years up to 50 years old.
Around 55% of non-operating firms reported loss in employment at varying degrees, 30% experiencing 100% loss.
About 50% of firms that were not in operation were not able to successfully continue and sustain activities
during the ECQ, despite being permitted to operate, because of various challenges they encountered. A
considerably higher proportion of these were from the manufacturing sector. For the roughly 40% of firms that were
able to operate, about 50% of them experienced a 40% reduction in operating hours, resulting in around 50% loss
of employment and 60% reduction in both revenues and production volume. Lack of available transportation for
employees and fear in going to work contributed to the issues around insufficient workforce to maintain operations,
with only a handful of firms able to successfully implement work-from-home arrangements. Most firms also
experienced difficulties in coordinating their supply / value chains causing shortages in raw material supply and
impediments in distribution, shipping, and logistics leading to reductions in operations. These, in turn, resulted in

12 | P a g e
revenue and production losses, and in many instances, loss in employment as well. These were felt more by the
microenterprises and the domestic-oriented firms. Furthermore, challenges were compounded by majority of firms
not having clear and responsive plans for business continuity, especially during extraordinary situations.
The discussions that follow are grouped into several sections that are focused on specific critical areas identified
through the assessment as particularly-challenging for Philippine enterprises, brought about by various gaps and
obstacles made pronounced during the quarantine period. Policies and programmes suggested in the discussions
should take into account the specific circumstances of those firms that may be more challenged than the others such
as the microenterprises and domestic-oriented firms.
2.1 SUPPLY- AND VALUE-CHAINS
During the implementation of containment measures, despite being permitted to operate and with
government policies supporting the operation of enterprises that produced essential goods and services, Philippine
enterprises still experienced difficulties in coordinating their supply chains.
In general, the lack of input materials and services5 experienced by firms during the ECQ were caused by the
operational shutdown of suppliers and service providers crucial to the firms’ operations. This was particularly felt by
the microenterprises in the manufacturing sector that attempted to seek out alternative sources of raw-material
supplies and services6. Issues around distribution, shipping, and logistics brought about by travel restrictions and
checkpoints7 created serious challenges for the firms, particularly in the trade sector, while the lack of customers had
mostly affected the firms in the service sector. Difficulties and delays around Customs clearances and no uptake at
the distribution points8, among others, were also identified. All these had led to cash flow issues9, loss employment,
and reduction in revenues10 commonly-experienced by all types of firms, but more pronounced for microenterprises
having less flexibility and resilience to economic shocks.
Taking a more coherent supply- / value-chain approach to policies, especially quarantine regulations, and
ensuring effective execution at the ground level will greatly benefit MSMEs and industries in general, especially during
crisis situations. While certain enterprises were permitted to operate due to the importance of the goods and services
they produce, it will also be crucial to ensure their entire supply- / value-chain is in operation as well. Forward looking,
policies and programmes that promote the development of local raw material supply, minimizing the reliance on
imports will also be helpful. This is particularly important for local manufacturing and domestic-oriented firms that
heavily rely on in-country dynamics. Actively seeking out other raw material suppliers that meet quality standards
5 Major Finding 1, (Page 21) 6 Major Finding 4, (Page 25) 7 ibid. 6 8 ibid. 6 9 ibid. 5 10 Major Finding 3, (Page 23)

13 | P a g e
globally should be encouraged. In parallel, the efficient flow of raw materials and finished goods will likewise be
paramount in maximizing the limited income-generating activities during containment. Policies related to the
movement of goods, procedures at checkpoints, and other restrictions need to be effectively communicated to
implementers and stakeholders, responsive, and well-executed especially at the ground level where they will matter
the most.
2.2 HUMAN RESOURCES
The lack of manpower, brought about by unavailable transportation for employees and fear to come to work,
was also one of the main concerns during the containment period raised by firms.
Issues around manpower undermined the firms’ capacity to execute activities at the firm level, leading to
reduction in working / operating time and losses in both production volume and revenues11. SMEs, large-firms and
export-oriented enterprises were the most concerned about the challenges around human-resource capacities12,
most-likely due to the complexity of their operations that required more “hands-on-deck”. In order to adapt to the
situation, firms, particularly the medium-sized and large enterprises allowed for a work-from-home arrangement13
for their employees, barring difficulties in execution by employees, which was also reported by some firms. The
manufacturing sector was not able to capitalize on this approach given the nature of their operations, resorting
instead to reductions in production. While a vast majority of firms experienced losses in employment14,
microenterprises were the most challenged. Despite this, majority of firms reported no losses in women employment.
There was also clear indication that a vast majority of firms, microenterprises in particular, plan to re-hire employees
once operations restart. Overall, assessment revealed that roughly around a 40% reduction in operating hours for
fully- and partially-operating firms resulted in the loss of 50% of employment, and 60% reduction in revenue and
production volume15.
Even with a fully-enabled supply- / value-chain in place, it will still be important for human resources to be
effectively mobilized, helping to ensure minimized losses in revenues and production. Appropriate regulations can
be developed to support the mobility of human resources during crisis situations, subject to specific restrictions. A
well-executed public-information campaign will foster confidence and allay fear among employees regarding the plans
and actions taken by both government and the private sector. Effective policies that support continuing operations
of firms during crises will also help prevent or minimize employment loss. These are crucial especially for daily wage
earners who rely on the operation of the firms they work for. Looking ahead, firm-level quality and workplace safety
11 Major Finding 3, (Page 23) 12 Major Finding 4, (Page 25) 13 Major Finding 2, (Page 22) 14 ibid. 11 15 ibid. 11

14 | P a g e
measures, as well as well-crafted and responsive business continuity plans (BCP) will be essential to boost confidence
and promote employee safety, allowing for continuing of operations.
Based on the needs identified by firms, trainings on adapting to the new normal, marketing and sales training
including e-commerce, food safety and food-related skills, and digital transformation, among others, may be
prioritized as capacity-building activities. These will help in re-entry planning, and importance of documenting lessons
learned in dealing with the pandemic situation.
2.3 BUSINESS CONTINUITY MANAGEMENT
Majority of firms that were not able to operate, despite being permitted to, did not have business continuity
plans which may have affected their ability to ensure availability of raw materials, efficient transport of goods and
human resources, and the implementation of workplace safety measures during crisis situations.
Not all of the enterprises in the country had developed business continuity plans, more so the microenterprises
that may have the belief that small operations such as theirs need not plan for business continuity16. There were
various reasons why a firm did not have a BCP, which included not knowing what a BCP is, believing that
microenterprises need not have one, and lack of capacity to craft one to begin with, pointing to lack of awareness and
organizational capacity. Firms that indicated their BCPs were not updated since it was prepared revealed the
tendency for enterprises to merely have a written BCP as part of a training activity or as a requirement in fulfilling
contractual obligations, without subsequent testing, monitoring, and updating. For firms that had BCPs, they
struggled with BCPs being inadequate and unresponsive to the situation17. This may have been brought about by the
tendency to focus on previous business disruption experiences, particularly those with high likelihood of occurring,
resulting to narrow disaster scenario planning.
While having a BCP does not, in totality, ensure a firm will be able to operate business as usual during a crisis,
there were indications that having one can potentially minimize the negative impact brought about by unprecedented
situations such as a health-related “lockdown”. It will be helpful to continue to strengthen the programmes and
knowledge-sharing on the importance of business continuity management for all types of firms, promoting “just-in-
case” strategies and approaches, and supporting efforts to prepare a BCP through capacity building and access to
global-best standards. Learnings from this pandemic will certainly be able to add value in the updating / crafting of
BCPs, taking into account this new threat and making BCPs more responsive in the future. BCPs can also be tied to
investment plans and become part of the indicators against which success measurements will be conducted.
16 Major Finding 6, (Page 28) 17 ibid. 16

15 | P a g e
2.4 SUPPORT AND INVESTMENTS FOR MSME RECOVERY
Philippine enterprises will require various forms of assistance toward successful recovery after being rendered
paralyzed and unable to fully continue economic activities due to the COVID – 19 Containment Measures. Support
packages under the existing allocation for SME financing are not expected to remain responsive to the specific
needs to address financial gaps, liquidity, and efforts to build back better through smart investments, brought about
by the extraordinary situation firms are facing and exacerbated by the prevailing low lending confidence.
Most firms had identified cash flow as one of the biggest challenges they expect to face during recovery18. A
significant portion of these firms, most of which were microenterprises and youth-owned, had also indicated that
they will be looking to take out loans from various sources including government financial institutions, commercial
and rural banks, government agency programmes, etc., in order to help address their cashflow issues. In addition, a
greater proportion of firms who has had loan applications in the past 2 years were willing to resort to taking out loans
to address their recovery concerns19. However, a higher proportion of microenterprises, female owners, and owners
50 years old and below had not applied for a loan in the past 2 years. This appeared to be further indications of
concerns around inclusivity and accessibility of loan facilities for certain groups.
Many of the firms pointed out that loans they were planning to take out will be used as working capital for
recovery, as funds to comply with tax and other government-related obligations, and payments for existing loans20.
Firms, mostly microenterprises, also estimated that they will be needing about PhP 2 million for their recovery while
a few others projected an amount more than PhP 2 million up to as much as PhP 20 million21. Apart from these
potential loan applications, firms were also requesting for further assistance in terms of reduction of tax rates, deferral
of taxes, and waiving of government-imposed penalties22.
Firms were also concerned about how they will address the continuing threat to health and safety of their
workers once operations re-start. In this regard, firms had expressed their request for easier access to COVID-19
tests23 as part of the health and safety programmes and protocols they will be instituting. The lack of domestic
demand and customers was also a major challenge identified by firms that may impede recovery. For this, firms were
requesting for support to access new markets. Other requests include relaxation of deadlines and regulations,
reduced cost for utilities and reduced rental fees.
Taking into account the challenges firms identified as the ones they will be facing during recovery and the means
by which these challenges may be addressed, it appears that most firms were just looking for the minimum amount
18 Major Finding 5, (Page 26) 19 Major Finding 7, (Page 28) 20 ibid. 18 21 ibid. 19 22 ibid. 18 23 Major Finding 8, (Page 29)

16 | P a g e
of resources to meet their short-term recovery needs. It is expected that the majority of the enterprises’ balance
sheets will remain weak and most of the MSMEs will continue to face credit constraints, implying that working capital
will remain scarce and there will be delays in investments. While it is understandable for firms to prioritize short-
term investments such as those that are intended to address needs in relation to cash flow and balance-sheet
requirements, a more long-term approach to build back better needs to be promoted if industries are to survive the
next crisis and if the country is to arrest any further step-back in terms of the country’s progress toward sustainable
development.
Encouraging firms to think long-term and plan for resilience can be done through better structuring of loan
packages that incorporate more-robust sustainability aspects (e.g. business continuity management, energy/resource
efficiency, renewable energy, quality and productivity, etc.) beyond cash flow concerns. A clearer indication of the
appropriate institutions and offices as sources of financial support and streamlined delineation of roles in catering to
the needs of specific markets / business segments that also includes account management to remedial and project
supervision and management, will also be helpful. Loan packages also need to be designed to be inclusive, accessible
by the most-challenged such as the microenterprises, youth- / gender-responsive, and better meet the needs of the
“missing middle”, promoting sound MSME investments. Focus needs to be on rescuing existing firms, helping them
become more sustainable and adapt better to the “new normal”. In conjunction, it will also be important to provide
loan restructuring opportunities and device alternative loan payment arrangements such as waiver of interest,
penalties, etc. to ease the financial burden of MSMEs. Introducing fiscal and tax relief measures or tax breaks can also
assist MSMEs in their liquidity concerns.
In addition to these fiscal and monetary measures to be introduced by government, MSMEs should also be
encouraged by the national government to participate more in the local procurement programs of the national
government agencies and local government units (LGUs) as a way to boost local production and product innovation
at the community level. Regional approaches that capitalize on specific geographic-driven competencies and
resources should be taken into consideration. For instance, revitalizing the One-Town, One-Product (OTOP) Program
as a part of the whole of government approach in the national recovery efforts can be key starting point. The OTOP
can promote local entrepreneurship that creates jobs and generates additional income for local communities, bringing
in the increased participation of private sector and LGUs in the economic recovery program. Through OTOP, local
chief executives of every city and municipality can take the lead in identifying, developing and promoting a specific
product or service based on local community’s competitive advantage. MSMEs can be supported, through best
technologies and best practices to manufacture, offer, and market distinctive products or services using indigenous
raw materials and local skills and talents, promoting innovation, productivity, and competitiveness. Encouraging
consumers to support products produced by local MSMEs will be important as well.

17 | P a g e
2.5 INDUSTRY INNOVATION AND DIVERSIFICATION
Expectations with regard to the “new normal” raised both opportunities and challenges for firms in terms of
new investments to support resilience-building and diversification.
In general, firms showed interest in diversifying their business operations24 in some way that will help them adapt
to the “new normal”. Some firms were considering new business models while others were contemplating on new
products and processes. In fact, a higher proportion of microenterprises had already attempted executing new
business models, focused on using online channels25. Others were specifically requesting for assistance to access new
markets. Most firms believed that there will be changes in marketing activities, with particular emphasis on e-
commerce, some in changes around operations and processes (inventory, distribution, etc.), yet others in the crafting
and implementation of new business regulations26. Diversification and adjusting to the “new normal” will certainly
require thinking out of the box and the adoption of standards and technologies. Most firms recognized that they may
be needing assistance in transitioning to the use of advanced digital and disruptive technologies, standards and
technologies around e-commerce, quality and safety standards for products and processes, occupational health,
energy efficiency and renewable energy, among others27.
Regardless of how the “new normal” and its components were perceived, the assessment showed that firms
were actively thinking of approaches and opportunities on how they will adapt to the “new normal”. Industry
innovations and diversification will be important to support the creation of new domestic and global markets,
lessening as well the reliance on imported goods and raw materials. Quality, safety, and digital infrastructures as well
as the innovation ecosystem must be strengthened through effective policies and programmes, incentives for
technology development and adoption, and investment promotion, ensuring access for MSMEs and socio-economic
inclusion for many. MSMEs can also be supported through technical assistance grants and subsidized programs for
access to technologies, markets, etc. as they move toward the “new normal”. Financial tools and technologies, and
other similar packages can boost productivity and financial sustainability in a digitalized environment.
One positive impact of the COVID-19 containment measures in the country was the decrease in greenhouse gas
emissions during the quarantine period, encouraging the prioritization of climate-related issues in green recovery
efforts. With these, there appears to be a momentum to shift our development paradigm towards green investments
and green jobs. As such, stimulus and investment programs should direct investments to key industries and sectors
that would boost infrastructure expansions in the transport, healthcare, education and energy sectors. This could also
cover investments in specific areas such as: efficient food cold chains, electro-mobility, and environmentally-sound
24 Major Finding 10, (Page 31) 25 Major Finding 4, (Page 25) 26 Major Finding 9, (Page 30) 27 ibid. 24

18 | P a g e
waste management. The recovery program should accelerate government investments in clean energy and
incentivize local companies to improve energy efficiency.

19 | P a g e
3.0 RESPONDENT DEMOGRAPHICS
This section presents the topline results and key takeaways in relation to respondent demographics, including
some information regarding the basic characteristics of the firms’ business operations. Whenever relevant,
relationships among disaggregated classifications are provided. Specific relevant data and corresponding charts are
shown as needed. Information regarding COVID-19 confirmed cases in key locations under ECQ during the survey
period are also discussed. The complete detailed data, charts, and discussions can be found in Annex C.
Key Takeaways:
1. A considerable majority of the respondent firms (69%) were microenterprises. About half of these firms were in the manufacturing sector, a predominant number of which were producing finished goods mostly for the domestic market. This segment also accounted for a bigger proportion of firms that were youth-led and women-owned who had been in operations for 3 years or less. A vast majority of these firms were wholly Filipino-owned, with firm owners able to complete at least a tertiary-level education.
2. The next biggest group was the small enterprises, accounting for a fifth of the respondents. This group was
represented by a bigger proportion of firms engaged in manufacturing, when weighed against the other firm sizes. While a great majority was producing finished goods for the export market, a higher proportion compared to microenterprises in manufacturing was also turning out intermediate products. About half of the small firms that participated in the assessment had owners with ages 50 years and above, while a considerable majority was owned by men. Almost 9 out of 10 of these firms were already in operation for more than 10 years. Mostly wholly Filipino-owned, a great majority of owners had completed a tertiary-level education, with a considerable proportion of them proceeding to attain post-graduate degrees.
3. Grouped together, medium-sized and large enterprises comprised about a tenth of the responding firms.
While half of these firms were in the manufacturing sector, similar to the group of microenterprises, a bigger proportion was also from the service sector compared to the other sectors. Same as with small firms, a great majority of medium / large enterprises was also into finished goods, almost entirely for export, while a higher proportion compared to microenterprises in manufacturing was producing intermediate products. A considerable majority of medium / large firms was owned by individuals 50 years and older, while similar to small firms, a considerable majority was also owned by men, although at a relatively higher degree. Also, mostly Filipino-owned with a vast majority being in operation for more than 10 years, a bigger proportion of these firms had owners who successfully completed post-graduate programs.
4. While the relative sizes of the percentages of respondent firms according to asset-size classification were, to
some extent, consistent with the real proportions of Philippine enterprises nationwide, the proportion of microenterprises that participated in the assessment was considerably lower than the actual microenterprises in the country based on 2018 MSME data. In contrast, the proportions of small, medium-sized, and large enterprises that participated were higher compared to national data.
Microenterprises68.51%
Small Enterprises20.43%
Medium and Large Enterprises
11.06%
Respondent Firms According to Firm Size (Annex C: Figure 1)

20 | P a g e
5. A majority of the respondent firms was from the manufacturing sector and, in particular, the food and beverage subsector. The proportion of respondents representing the manufacturing sector, a vast majority of which were producing finished goods, was higher compared to actual population in the country. The firms from the trade and service sectors were also well-represented, although at lower percentages compared to actual country proportions.
6. There was an equal mixture of participating
firms in the assessment that were export-oriented and domestic-oriented. According to UNIDO definition, export-oriented firms include those that considerably participate in the global value chain (GVC) and exporters outside of GVC that had at least 10% sales to foreign entities and multi-national companies. Domestic-oriented firms, on the other hand, had sales to domestic markets that were 90% or higher.
7. Firms in the trade sector tend to be domestic-oriented while those in the service sector were more export-
oriented. Domestic-oriented firms tend to be those that were in operation for 3 years or less while export-oriented firms were more of those that had already been in operation for more than 10 years. More firms in the manufacturing sector had been in operation for more than 10 years.
8. Firms located in the National Capital Region (NCR) and Region IVA (CALABARZON) comprise half of the
respondent firms. These regions were part of the Luzon-wide enhanced community quarantine that was implemented from 15 March through the survey period. These were also the locations that had the highest number of COVID – 19 positive cases in Luzon.
Microenterprises, 88.45%
Microenterprises, 68.51%
Small Enterprises, 10.58%
Small Enterprises, 20.43%Medium and Large Enterprises,
0.97%
Medium and Large Enterprises, 11.06%
0% 10% 20% 30% 40% 50% 60% 70% 80% 90% 100%
Act
ual
20
18
Ph
ilip
pin
eEn
terp
rise
sR
esp
on
den
ts
Comparison Between 2018 Population of Philippine Enterprises and Respondent Firms According to Firm Size (Annex C: Figure 2)
Services, 26.81%
Trade, 17.45%
Manufacturing -Finished Goods,
51.91%
Manufacturing -Intermediate Goods, 3.83%
Total Manufacturing,
55.74%
Respondent Firms According to Sector (Annex C: Figure 3)
Export-oriented
Firms, 51.91%
Domestic-oriented
Firms, 48.09%
Respondent Firms According to Client Orientation (Annex C: Figure 7)

21 | P a g e
4.0 MAJOR FINDINGS
This section presents the topline results and key takeaways in relation to immediate effect of COVID-19
containment measures to Philippine enterprises and the support needed for subsequent recovery. Whenever
relevant, relationships among disaggregated classifications are provided. Specific relevant data and corresponding
charts are shown as needed. The complete detailed data, charts, and discussions can be found in Annex D (Immediate
Impact of COVID – 19 Containment Measures) and Annex E (Support for MSME Recovery).
Key Takeaways: 1. Majority (57%) of respondent firms were not in operation during the survey period. A higher proportion of
microenterprises compared to total firms was not able to operate, while a higher proportion of medium and large firms was at least able to operate partially or in full. A higher proportion of domestic-oriented firms was also not in operation.
• Majority (53%) of firms that were not in operation were permitted to operate but were not able to, brought about by various challenges. Microenterprises and firms in the manufacturing sector appeared to be more challenged in this regard, reflecting higher proportions compared to total sample.
• The operational challenges identified by a higher proportion of firms that were not able to operate despite being permitted to included: (1) cash flow issues; (2) no available input materials / services; and (3) lack of customers. While cash flow seemed to be top-of-mind, concerns around transportation for employees and logistics issues were also raised. The lack of input materials and services figured in prominently as well, particularly for manufacturing firms and domestic-oriented firms, causing them to stop operations. Lack of customers was the main concern for firms in the service sector.
Fully Operational,
6.81%
Partially Operational,
36.60%
Microfirms, 46.38%
Small Firms, 7.23%
Medium and Large Firms, …
Non-operational,
56.60%
Respondent Firms According to Operational Status (Annex D: Figure 34)
56.60%67.70%
35.42%26.92%
6.81%
4.97%
6.25% 19.23%
36.60%27.33%
58.33% 53.85%
0%
20%
40%
60%
80%
100%
Total Firms (235) Microfirms (161) Small Firms (48) Medium and LargeFirms (26)
Respondent Firms, Operational Status vs Firm Size (Annex D: Figure 35)
Non-Operational Fully Operational Partially Operational
Operational, 43.40%
Not allowed to operate, 26.81%
Faced with challenges
leading to non-operation,
29.79%
Non-operational, 56.60%
Respondent Firms According to Permission to Operate (Annex D: Figure 38)
47.37% 44.04%
58.82%71.43%
52.63% 55.96%
41.18%28.57%
0%
20%
40%
60%
80%
100%
Non-operating Firms(133)
Microfirms (109) Small Firms (17) Medium and LargeFirms (7)
Respondent Firms, Permission to Operate vs Firm Size (Annex D: Figure 39)
Not allowed to operate Allowed to operate
22 | P a g e
Note: * voluntary responses
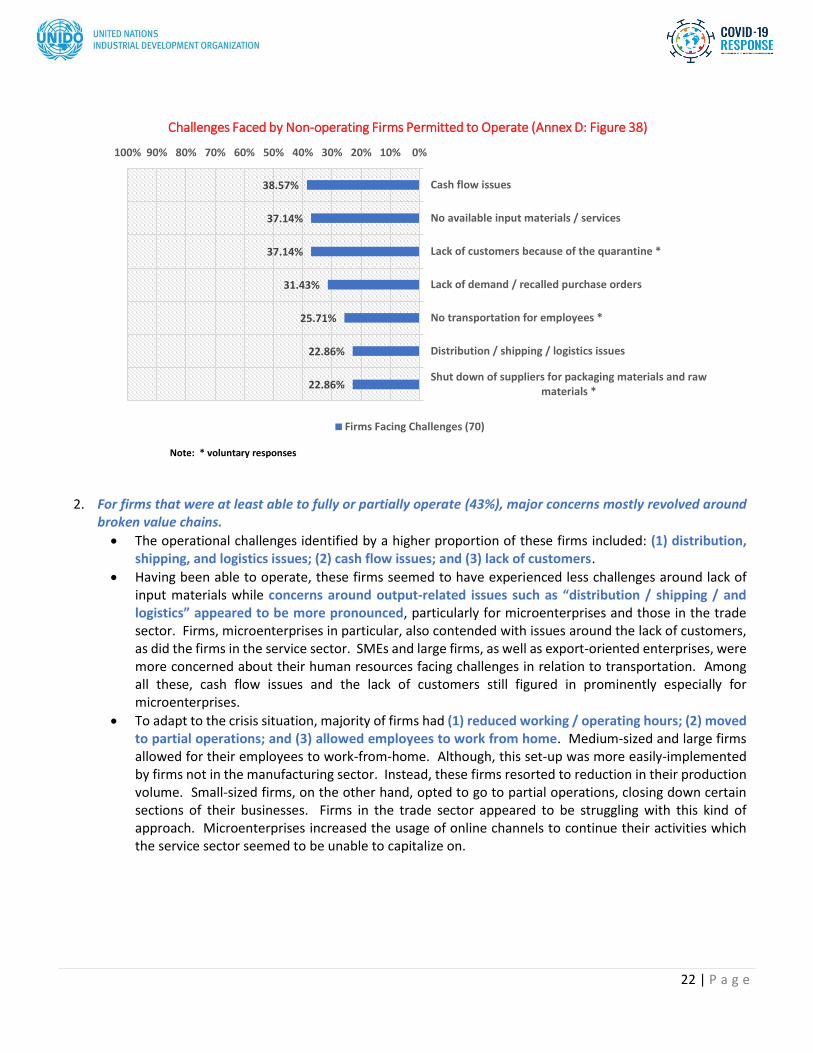
2. For firms that were at least able to fully or partially operate (43%), major concerns mostly revolved around broken value chains.
• The operational challenges identified by a higher proportion of these firms included: (1) distribution, shipping, and logistics issues; (2) cash flow issues; and (3) lack of customers.
• Having been able to operate, these firms seemed to have experienced less challenges around lack of input materials while concerns around output-related issues such as “distribution / shipping / and logistics” appeared to be more pronounced, particularly for microenterprises and those in the trade sector. Firms, microenterprises in particular, also contended with issues around the lack of customers, as did the firms in the service sector. SMEs and large firms, as well as export-oriented enterprises, were more concerned about their human resources facing challenges in relation to transportation. Among all these, cash flow issues and the lack of customers still figured in prominently especially for microenterprises.
• To adapt to the crisis situation, majority of firms had (1) reduced working / operating hours; (2) moved to partial operations; and (3) allowed employees to work from home. Medium-sized and large firms allowed for their employees to work-from-home. Although, this set-up was more easily-implemented by firms not in the manufacturing sector. Instead, these firms resorted to reduction in their production volume. Small-sized firms, on the other hand, opted to go to partial operations, closing down certain sections of their businesses. Firms in the trade sector appeared to be struggling with this kind of approach. Microenterprises increased the usage of online channels to continue their activities which the service sector seemed to be unable to capitalize on.
38.57%
37.14%
37.14%
31.43%
25.71%
22.86%
22.86%
0%10%20%30%40%50%60%70%80%90%100%
Cash flow issues
No available input materials / services
Lack of customers because of the quarantine *
Lack of demand / recalled purchase orders
No transportation for employees *
Distribution / shipping / logistics issues
Shut down of suppliers for packaging materials and rawmaterials *
Challenges Faced by Non-operating Firms Permitted to Operate (Annex D: Figure 38)
Firms Facing Challenges (70)

23 | P a g e
Note: * voluntary responses
Note: * voluntary responses
3. Roughly, 40% reduction in operating hours for fully- and partially-operating firms resulted in loss of 50% of
employment, and 60% reduction in revenue and production volume.
• Compared to February 2020, about half of the firms (operating and non-operating) reduced operating hours in March/April by at least 40%.
• With this period, 65% also reported a reduction of at least 60% in both revenue and production volume. About a third reported reductions of at least 70%. Majority of firms that experienced cash flow challenges reported a decrease in revenue of at least 40%.
• Compared to February 2020, majority of firms resorted to reduction in employment in March/April at varying degrees, with about a third of the non-operating firms reducing employment by 100%.
34.31%
31.37%
28.43%
25.49%
22.55%
22.55%
21.57%
0%10%20%30%40%50%60%70%80%90%100%
Distribution / shipping / logistics issues
Cash flow issues
Lack of customers because of the quarantine *
Lack of manpower
Lack of demand / recalled purchase orders
No available input materials / services
No transportation for employees *
Challenges Faced by Operating Firms (Annex D: Figure 49)
Partially- and fully-operating firms (102)
58.82%
50.98%
39.22%
28.43%
11.76%
10.78%
9.80%
0%10%20%30%40%50%60%70%80%90%100%
Reduced working / operating hours
Work-from-home arrangement
Went into partial operation (some sections are closed)
ONLINE *
reduced production capacity due to limited workers thatcan report to work *
we only manufacture when the customer resquested *
Diversified the operations to new products/processes
Changes Adopted by Operating Firms (Annex D: Figure 53)
Fully- and partially-operating Firms (102)

24 | P a g e
Majority of firms reported no losses in women employment while 100% of lost employment that were all women was encountered by 10% of firms.
• About three-quarters of firms who had reduced their employment expressed the desire to re-hire previous employees. Around 80% of microenterprises expressed the same intention.
0.00%
17.65% 29.41% 20.59% 32.35%
0% 10% 20% 30% 40% 50% 60% 70% 80% 90% 100%
All
Op
erat
ing
Firm
s (1
02)
Reduction in Operating Hours (March/April vs February 2020) (Annex D: Figure 77)
100% reduction reduction of 70% up to less than 100% reduction of 40% up to less than 70% reduction more than 0% up to 40% no reduction
6.86%
9.80%
36.27%
36.27%
22.55%
20.59%
9.80%
11.76%
24.51%
21.57%
0% 10% 20% 30% 40% 50% 60% 70% 80% 90% 100%
Rev
enu
eP
rod
uct
ion
Reduction in Revenue and Production Volume (March/April vs February 2020) (Annex D: Figure 81)
100% reduction reduction of 70% up to less than 100% reduction of 40% up to less than 70% reduction more than 0% up to 40% no reduction
2.94%
30.83%
20.59%
13.53%
19.61%
3.76%
12.75%
8.27%
44.12%
43.61%
0% 10% 20% 30% 40% 50% 60% 70% 80% 90% 100%
Op
erat
ing
Firm
s (1
02)
No
n-o
per
atin
g Fi
rms
(13
3)
Reduction in Employment (March/April vs February 2020) (Annex D: Figure 88)
100% reduction reduction of 70% up to less than 100% reduction of 40% up to less than 70%
reduction more than 0% up to less than 40% no reduction

25 | P a g e
4. Whether firms were able to operate during the enhanced community quarantine (ECQ), and to what extent and efficiency, depended on the availability of human resources, and how well the activities within the supply chain had been coordinated.
• For firms that experienced shortage of inputs during the ECQ, the means they considered to address their concerns included: (1) seeking alternative sources; (2) reduction of production; and (3) online transactions. A considerable majority had considered seeking alternative sources of raw materials and services over the other possible actions.
• The nature of concerns around distribution, shipping, and logistics, as indicated by a higher proportion of firms, included: (1) travel restrictions / checkpoints; (2) insufficient service available; and (3) no uptake at markets / distribution points. A considerable majority identified travel restrictions and checkpoints as the main cause of their challenges around distribution, shipping, and logistics. This may have potentially caused about at least 70% reduction in sales revenue for around 40% of operating firms.
• The means being considered by a higher proportion of firms to address concerns around distribution, shipping, and logistics included (1) alternative service providers; (2) wait for the lifting of quarantine; and (3) alternative markets. While a higher proportion of medium-sized, large firms, and firms in the trade sector were considering seeking out alternative service providers, microenterprises, manufacturing firms, and firms in the service sector opted more to wait for lifting of quarantine and restrictions. Domestic-oriented firms, in particular, were more interested in looking for alternative markets compared to others.
• A higher proportion of firms indicated (1) lack of available transportation; (2) fear to come to work; and (3) difficulty of social distancing at the workplace as the nature of their challenges around the lack of manpower. A considerable majority mentioned lack of available transportation as their main challenge in relation to the lack of manpower.
• Encountering challenges around the lack of manpower, a higher proportion of firms indicated (1) accept decrease in sales; (2) delays in delivery; and (3) additional measures to workplace safety as some of the options they had considered to address their concerns around manpower. Firms, in particular the medium-sized and large enterprises, had considered providing staff housing apart from additional measures to workplace safety.
Note: * voluntary responses
70.50%
29.50%
28.06%
25.90%
23.02%
14.39%
14.39%
0%10%20%30%40%50%60%70%80%90%100%
Seeking alternative sources
Reduction of production
Sell online/online transactions *
Outsourcing orders
Delaying goods delivery
Seeking new production channels
Close the business *
Means Considered to Address Shortage of Inputs (Annex D: Figure 57)
Firms Facing Challenges (139)

26 | P a g e
Note: * voluntary responses
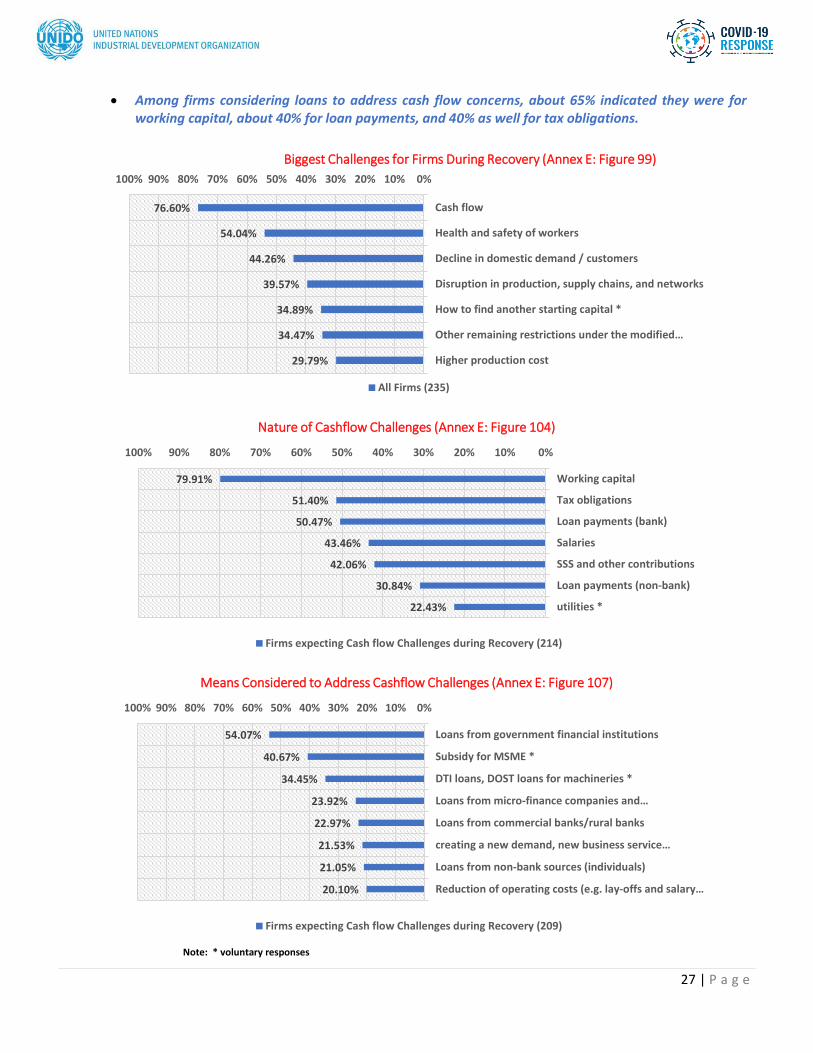
5. Some of the biggest challenges a higher proportion of firms were expecting to face when economic activities
resume after the ECQ included (1) cash flow; (2) health and safety of workers; and (3) decline in domestic demand / customers.
• A considerable majority of firms responded that cash flow will be one of the biggest challenges they will be facing. Responses on health and safety of workers were consistent with the concerns around the lack of manpower that firms experienced during ECQ. Similarly, the comments regarding decline in domestic demand and customers seemed to be continuing concern expected beyond the ECQ related to distribution, shipping, logistics, and supply chains in general.
• In relation to cash flow concerns, a higher proportion of firms identified them as being: (1) working capital; (2) tax obligations; and (3) loan payments to banks.
• Given these challenges, a higher proportion of firms indicated that they were considering (1) loans from government financial institutions; (2) subsidy for MSME; and (3) DTI loans, DOST loans for machineries to address their cash flow concerns. Majority of firms that were expecting cash flow concerns, SMEs and large firms in particular, had indicated that they were interested to taking out loans from government financial institutions. A higher proportion of microenterprises were looking forward to receive subsidies.
79.71%
31.16%
26.81%
22.46%
21.01%
14.49%
0%20%40%60%80%100%
Travel Restrictions / checkpoints
Insufficient service available from usualservice-providers
No uptake at market / distribution points(closed)
Additional regulatory requirements
Curfew hours and Variations of LocalRegulations that affects harvest, and logistics *
Slow clearance at the Customs and the cargoyard
Challenges in Distribution, Shipping, and Logistics (Annex D: Figure 61)
Firms Facing Challenges (138)
43.44%
34.43%
27.05%
26.23%
10.66%
10.66%
0%20%40%60%80%100%
Alternative service providers
Wait for the ECQ to be lifted *
Alternative markets
Stop production once raw materials andpackaging are consumed *
Waiting for provincial boundary checkpointrestrictions to be lifted *
BOC should waive storage charges as theyare the ones who delayed the process.*
Means Considered to Address Issues on Distribution, Shipping and Logistics Annex D: Figure 65 )
Firms Facing Challenges (122)
69.90%
44.66%
24.27%
22.33%
19.42%
17.48%
16.50%
0%20%40%60%80%100%
Lack of available transportation
Fear to come to work
Difficulty to maintain social distancing at theworkplace
Company cannot sustain the monthly salary ofemployees *
Only skeletal force is allowed
Critical employees are attending to personalmatters, caring for children / family members
Employees are unable to execute work-from-home arrangements
Challenges on Lack of Manpower (Annex D: Figure 69)
Firms Facing Challenges (103)
40.86%
32.26%
27.96%
18.28%
16.13%
15.05%
8.60%
0%20%40%60%80%100%
Decrease in Sales *
Delays in delivery
Additional measures on workplace safety toprevent infection *
Use of advanced equipment or software toreduce the amount of work
Staff housing *
Outsourcing of orders
Wage increases
Means Considered to Address Lack of Manpower (Annex D: Figure 73)
Firms Facing Challenges (93)
27 | P a g e
• Among firms considering loans to address cash flow concerns, about 65% indicated they were for working capital, about 40% for loan payments, and 40% as well for tax obligations.
Note: * voluntary responses
76.60%
54.04%
44.26%
39.57%
34.89%
34.47%
29.79%
0%10%20%30%40%50%60%70%80%90%100%
Cash flow
Health and safety of workers
Decline in domestic demand / customers
Disruption in production, supply chains, and networks
How to find another starting capital *
Other remaining restrictions under the modified…
Higher production cost
Biggest Challenges for Firms During Recovery (Annex E: Figure 99)
All Firms (235)
79.91%
51.40%
50.47%
43.46%
42.06%
30.84%
22.43%
0%10%20%30%40%50%60%70%80%90%100%
Working capital
Tax obligations
Loan payments (bank)
Salaries
SSS and other contributions
Loan payments (non-bank)
utilities *
Nature of Cashflow Challenges (Annex E: Figure 104)
Firms expecting Cash flow Challenges during Recovery (214)
54.07%
40.67%
34.45%
23.92%
22.97%
21.53%
21.05%
20.10%
0%10%20%30%40%50%60%70%80%90%100%
Loans from government financial institutions
Subsidy for MSME *
DTI loans, DOST loans for machineries *
Loans from micro-finance companies and…
Loans from commercial banks/rural banks
creating a new demand, new business service…
Loans from non-bank sources (individuals)
Reduction of operating costs (e.g. lay-offs and salary…
Means Considered to Address Cashflow Challenges (Annex E: Figure 107)
Firms expecting Cash flow Challenges during Recovery (209)

28 | P a g e
6. About a third of respondent firms had BCPs.
• A large proportion of firms that were not able to operate, despite being permitted to, did not have existing business continuity plans (BCP). This is consistent with the challenges these firms had faced in relation to “lack of input materials / services”, transportation for employees, and “distribution, shipping, and logistics”. Two-thirds of respondent firms did not have BCPs.
• For firms with no existing BCPs, a higher proportion expressed the following: (1) not aware what a BCP is; (2) I am a micro-small business; and (3) there was no capacity to develop one.
• For firms with existing BCPs, a higher proportion indicated that they had experienced challenges in implementation. Majority of firms indicated that the BCPs they had was inadequate and lacking, while others mentioned that the BCPs did not respond well to the emergency and that restrictions during ECQ had limited activities.
Note: * voluntary responses
7. About 75% of firms figured that they would need at most PhP 2M to help in their business recovery.
• About 60% shared that they have not had loan applications in the past 2 years. A higher proportion of microenterprises, firms owned by women, and firm owners 50 years old and below had reported that they had not applied for loans in the past 2 years.
22.86% 24.59%14.29%
0.00%
77.14% 75.41%85.71%
100.00%
0%
10%
20%
30%
40%
50%
60%
70%
80%
90%
100%
Non-operating FirmsPermitted to Operate
(70)
Microfirms (61) Small Firms (7) Medium and LargeFirms (2)
Non-operating Firms Permitted to Operate, BCP vs Firm Size (Annex D: FIgure 46)
with BCP w/o BCP
35.44%
25.95%
21.52%
19.62%
17.09%
0%20%40%60%80%100%
Not aware what a businesscontinuity plan is
I am a Microsmall business *
Waiting for new normal *
There was no capacity todevelop one
It was not a priority.
Reasons for Not Having BCPs (Annex E: Figure 125)
Firms without BCPs (158)
50.65%
35.06%
35.06%
14.29%
0%20%40%60%80%100%
It was inadequate andlacking.
It did not respond well tothe current emergency.
The restrictions limitsactivities *
Not updated since it wasprepared
Challenges in Implementing a BCP (Annex E: Figure 121)
Firms with BCPs (77)

29 | P a g e
• A higher proportion of firms that have had loan applications in the past 2 years indicated that they were considering taking out loans to address cash flow concerns.
8. Firms indicated that they will be needing the support in the areas of (1) market and business environment; (2)
human resources and compensation; and (3) financial aspects to assist them in their business recovery.
• For assistance in the area of market and business environment, a higher proportion of firms indicated the following: (1) additional capital to re-start; (2) access to new markets; and (3) relaxation of deadlines and regulations.
• For human resources and compensation, a higher proportion of firms indicated the following: (1) lower costs for utilities; (2) easy access to the COVID-19 tests for employees; and (3) reduced rental fees.
• To support their recovery along the lines of financial aspects, firms also identified (1) access to financial assistance / loans; (2) reduction of tax rates / deferral of taxes; and (3) government not to charge penalties.
• A vast majority was looking to access financial assistance and loans while other significant responses included lower costs for utilities and access to new markets, among others.
Note: * voluntary responses
75.74%
12.77%
6.38%
3.40%
1.70%
0%20%40%60%80%100%
< PHP 2M
PHP 2M to 5M
PHP 5M to 10M
> PHP 20M
PHP 10M to 20M
Amount Required by Firms for Recovery (Annex E: Figure 111)
All Firms (235) Microfirms (161)
Small Firms (48) Medium and Large Firms (26)
32.34%
57.02%
10.64%
0%20%40%60%80%100%
Yes
No
Prefer not to disclose
Loan Applications in the Past 2 Years (Annex E: Figure 114)
All Firms (235) Microfirms (161) Small Firms (48) Medium and Large Firms (26)
60.85%
54.04%
48.09%
42.13%
40.00%
40.00%
32.77%
31.06%
0%10%20%30%40%50%60%70%80%90%100%
Additional capital to restart *
Access to new markets
Relaxation of deadlines and regulations (permits,…
Safe and efficient mobility for manpower and goods
Support within the supply / value chain (big brother…
Sales and marketing fund *
Price control
Cash assistance from government for Micro and…
Required Support for Recovery of Firms - Market and Business Environment (Annex E: Figure 129)
All Firms (235)

30 | P a g e
Note: * voluntary responses
9. A higher proportion of firms believed that as far as the “new normal” was concerned, there will be changes
in marketing activities (e-commerce); there will be changes in operations and processes (inventory, distribution, etc.); there will be new business regulations; and changes in product lines and services.
• Younger firm owners and women owners appeared to be more inclined to think that there will be changes in marketing activities in the “new normal” while a higher proportion of older firm owners and men were thinking that changes in operations and processes will characterize the “new normal”.
• A vast majority of firms (85%) had indicated their willingness to diversify in light of this “new normal”. A higher proportion had considered looking at (1) adding new product / service lines beyond existing capacity; (2) adjusting business models; and (3) re-purposing part of existing facility to produce other products.
58.30%
50.21%
35.32%
28.94%
28.51%
25.11%
23.83%
23.40%
0%10%20%30%40%50%60%70%80%90%100%
Lower costs for utilities (e.g. electricity, gas, etc.)
Easy access to the COVID-19 tests for the employees
Reduced rental fees
Incentives to enterprises that do not lay off staff
Tax Holiday for 5 years to micro enterprises *
Flexible work arrangements and labor policies
Trainings and capacity development
3-year equivalent capital fund for human resource…
Required Support for Recovery of Firms - Human Resources and Compensation (Annex E: Figure 133)
All Firms (235)
70.64%
54.89%
45.11%
39.57%
35.74%
31.06%
10.21%
0%10%20%30%40%50%60%70%80%90%100%
Access to financial assistance / loans
Reduction of tax rates / deferral of taxes
Government not to charge penalties and perhaps taxcondonation *
lower interest rates from banks. new mode like p.o.financing *
Extension of loan maturities
Tax Holiday for 5 years to micro enterprises *
government subsidy *
Required Support for Recovery of Firms - Financial Aspects (Annex E: Figure 137)
All Firms (235)

31 | P a g e
Note: * voluntary responses
10. Looking forward and preparing for the “new normal”, a higher proportion of firms indicated their interest
to look into the ff standards and technology solutions to help them adapt better to future crises: (1) advanced digital and disruptive technologies; (2) e-commerce; and (3) quality and safety standards for products and services. These responses appeared to be consistent with how firms perceived the “new normal” characterized with new marketing approaches and new products and processes. A higher proportion of firm owners with ages 50 years and below were more interested in e-commerce and quality/safety standards, while those above 50 years of age were more interested in process improvements and renewable energy / energy efficiency.
64.26%
54.47%
47.66%
47.23%
41.28%
35.32%
29.36%
0%10%20%30%40%50%60%70%80%90%100%
There will be changes in marketing activities (e-commerce).
There will be changes in operations and processes(inventory, distribution, etc.).
There will be new business regulations.
There will be changes in product lines and services.
There will be change in sales strategies from beingconventional or traditional form of sale, to a re-…
New areas we need to cover to reach our target marketin select community *
There will be changes in manufacturing processes(digitalization, new technologies, etc.).
Perception of the "New Normal" (Annex E: Figure 94)
All Firms (235)
71.08%
51.96%
35.78%
34.80%
0%10%20%30%40%50%60%70%80%90%100%
Adding new product/service lines beyond the existingcapacity
Adjust business model
Re-purpose part of the existing facility to produceother products
Switching to new businesses to survive
Options Considered for Diversification of Operations (Annex E: Figure 157)
All Firms (235)

32 | P a g e
51.49%
45.96%
43.83%
40.85%
31.91%
31.49%
25.96%
24.68%
0%10%20%30%40%50%60%70%80%90%100%
Advanced digital and disruptive technologies in aid of…
E-commerce
Quality and safety standards for products, production, and…
Occupational safety and employee health & wellfare programs
E-mobility
Process improvements / re-engineering
Energy efficiency and renewable energy
online delivery of government documents., business insurance *
Standards and Technology Solutions Firms Have Shown Interest In (Annex E: Figure 141)
All Firms (235)

33 | P a g e
5.0 ACKNOWLEDGMENTS
This report was prepared by the United Nations Industrial Development Organization (UNIDO) Country Office in
the Philippines, under the supervision of Ms. Tonilyn P. Lim, UNIDO Country Representative, with technical
contributions from Ms. Katrina Baris, Ms. Grace Batario, Ms. Jezreel Eufemio, Mr. Jimmie Kang, and Mr. Teddy
Monroy. Guidance in completing the report was provided by Mr. Nobuya Haraguchi, Mr. Alejandro Lavopa, Mr. Keno
Haverkamp and the team from the Department of Policy Research and Statistics in UNIDO Vienna.
This report has benefited from the valuable comments of development partners from the Bureau of Small and
Medium Enterprise Bureau of the Department of Trade and Industry (DTI – BSMED), the Institute of Small-scale
Industries of the University of the Philippines (UP – ISSI), the Rizalino S. Navarro Policy Center of the Asian Institute of
Management (AIM), the Association of Development Financing Institutions in Asia and the Pacific (ADFIAP), and the
Philippine Chamber of Commerce and Industry (PCCI).
Special appreciation is accorded to the Regional Operations Group (DTI – ROG) and the Competitiveness and
Innovation Group (DTI – CIG) of the Department of Trade and Industry for the support and guidance.
Cover design is attributed to Ms. Jezreel Eufemio.

34 | P a g e
ANNEXES
ANNEX A Detailed List of Sectors Allowed During ECQ and GCQ as per DTI Memorandum Circular 20-22
35
ANNEX B List of Questions Used in the Assessment 41 ANNEX C Respondent Demographics: Data and Charts 51 ANNEX D Immediate Impact of COVID – 19 Containment Measures: Data and Charts 60 ANNEX E Support for MSME Recovery: Data and Charts 79 ANNEX F Responses to Questions with Multiple Answers 99

35 | P a g e
ANNEX A – Detailed List of Sectors Allowed During ECQ and GCQ as per DTI Memorandum Circular 20-22
SUBJECT: Business Establishments or Activities Allowed to Operate in Areas Declared Under Enhanced
Community Quarantine (ECQ) and General Community Quarantine (GCQ) Pursuant to the Omnibus
Guidelines on Community Quarantine as Confirmed and Adopted by the President Under Executive
Order No. 112 S. 2020
Section 3. Category I – IV Business Establishments or Activities. Annexed to this circular is the list of business
establishments or activities under Category I – IV, both for allowed a not allowed, according to the categorization
provided under the Omnibus Guidelines, as confirmed and adopted by Executive Order No. 112 S. 2020
No presumption shall arise as to the exclusivity or inclusivity of the enumeration of business establishments or
activities annexed in this circular. The Department may update the annexed list to add or limit the coverage of
business activities and establishments under them as the need arises.
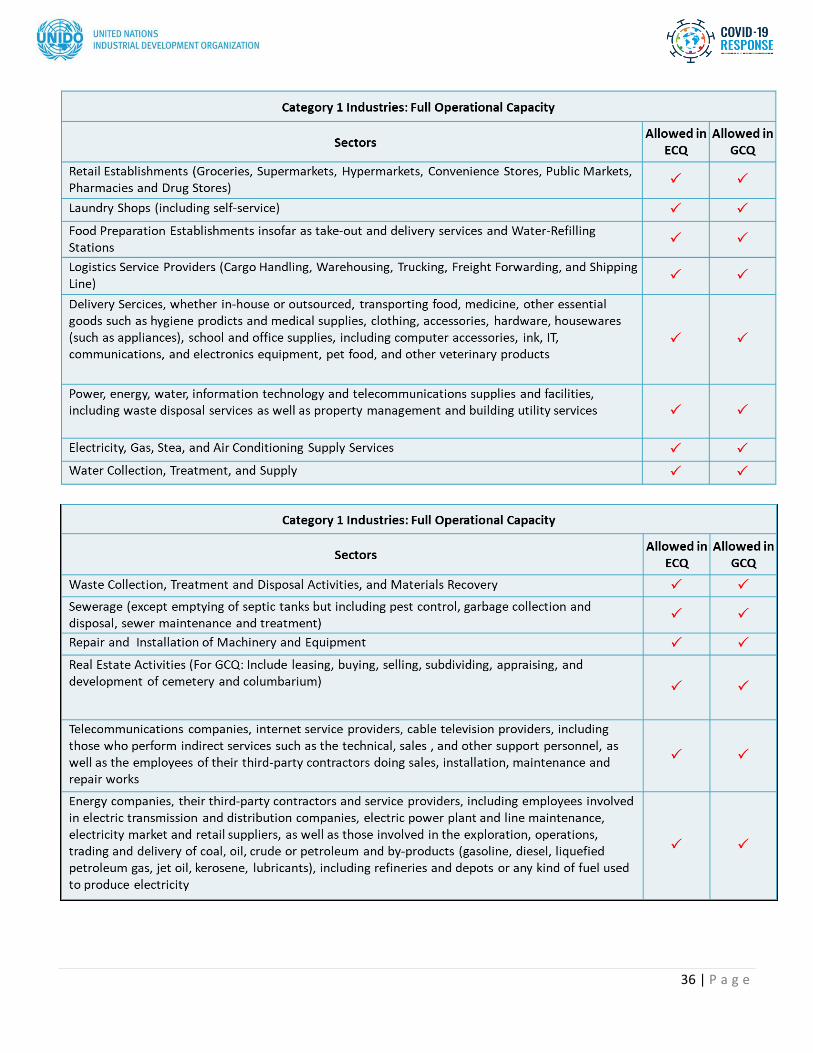
36 | P a g e

37 | P a g e

38 | P a g e

39 | P a g e

40 | P a g e

41 | P a g e
ANNEX B – Assessment Tool, List of Questions
Assessment of the Socio-economic Effects of COVID-19 and
Containment Measures on Philippine Enterprises
Dear Respondent,
The United Nations Industrial Development Organization (UNIDO) seeks your cooperation in filling out this
questionnaire to reflect your situation and experiences in coping with the current COVID-19 pandemic and related
containment measures. By understanding the specific concerns and challenges faced enterprises, development
partners like UNIDO can better provide technical and financial assistance and policy advice to help address both
immediate and long-term needs of enterprises.
UNIDO is the specialized agency of the United Nations mandated to promote inclusive and sustainable industrial
development (ISID). In the Philippines, the UNIDO Country Programming Framework focuses on three components:
(1) supporting inclusive, sustainable, innovation-led industrialization, (2) fostering green and resilient industrial
communities, and (3) cultivating effective partnerships for ISID.
The information you provide will be kept confidential and aggregated data and conclusions will be used for
planning purposes only.
We look forward to receiving your responses to the survey, latest by 09 May 2020.
For any assistance on matters pertaining to this survey, you can reach as at [email protected] with
copy to [email protected].
Thank you and continue to stay safe.
Sincerely,
Tonilyn P. Lim
UNIDO Country Representative
Philippines
www.unido.org
www.facebook.com/UNIDO Philippine Office
twitter.com/UNIDO_Phils

42 | P a g e
Instructions:
1. Please choose the best answer for each question. Kindly note that some questions will allow for multiple responses up to a prescribed maximum.
2. If the choice “OTHERS” is selected, you will be requested to provide specifics. 3. There needs to be a response to every question. The “not applicable” option is provided in some questions
to ensure a response.
* required fields
Business Profile
Questions
Company name (OPTIONAL): ____________________
1. What is the age of the business owner? Below 25 years 25 to 35 years 35 to 50 years Above 50 years
2. What is the owner’s highest educational attainment? Primary education Secondary education Tertiary education Post-graduate Others. Please specify: __________ * if chosen
3. What is the owner’s gender? Male Female LGBTQi+ Prefer not to disclose
4. How long has your business been operating? Less than 3 years 3 to 5 years 5 to 10 years more than 10 years
5. What is the ownership structure of your business? 100% Filipino-owned Joint venture with foreign partners
6. Under which classification is your business identified? Microenterprise (below 10 employees; asset size up to PhP 3,000,000) Small Enterprise (10 to 99 employees; asset size PhP 3,000,001 to PhP 15,000,000) Medium Enterprise (100 to 199 employees; asset size from PhP 15,000,001 to PhP 100,000,000) Large Enterprise (200 employees and above; asset size above PhP 100,000,000)
7. How many total employees did you have at the end of 2019? __________ What % of them is women? __________
8. How many full-time employees did you have at the end of 2019? __________ What % of them is women? __________
9. What type of business are you running? Manufacturing

43 | P a g e
Services Trade (wholesale and retail) Agro-processing (agriculture, forestry, and fishing)
10. What does your business predominantly produce/handle? (Select all applicable choices.) Finished goods for consumers Finished goods for industrial business Intermediate inputs for agriculture Intermediate inputs for manufacturing Intermediate inputs for services Services Others. Please specify: __________ * if chosen
11. Identify to which value-chain industry you best belong. (Select all applicable choices.) Food and beverage Tobacco products Textiles Wearing Apparel Leather and related products Wood, cork, rattan, bamboo, and the like Paper and paper products Printing and recorded media Coke and refined petroleum products Chemicals and chemical products Pharmaceutical products and preparations Rubber and plastic products Non-metallic mineral products Basic metals Fabricated metal products Computer, electronics, and optical products Electrical equipment Machinery and Equipment Motor vehicles, trailers, and semi-trailers Other transport equipment Furniture Others. Please specify: __________ * if chosen
12. For purchases of raw materials and intermediate goods in 2019, each of these categories accounted for what percentages? (please insert value as percent of total cost for every option; total should sum up to 100%)
percentage 0 10 20 30 40 50 60 70 80 90 100
Foreign suppliers
Multinational corporations/foreign-owned suppliers located in the county
Domestic suppliers
TOTAL 100%
13. In which regions can your domestic suppliers be found? (Select all applicable choices.) National Capital Region (NCR) Region I – Ilocos Region CAR – Cordillera Administrative Region Region II – Cagayan Valley

44 | P a g e
Region III – Central Luzon Region IVA – CALABARZON Region IVB – MIMAROPA Region V – Bicol Region Region VI – Western Visayas Region VII – Central Visayas Region VIII – Eastern Visayas Region IX – Zamboanga Peninsula Region X – Northern Mindanao Region XI – Davao Region Region XII – SOCCSKSARGEN Region XIII – Caraga Region BARMM – Bangsamoro Autonomous Region of Muslim Mindanao
14. For sales / turnover in 2019, each of these categories accounted for what percentages? (please insert value as percent of total sales for every option; total should sum up to 100%)
percentage 0 10 20 30 40
50 60 70 80 90 100
Foreign customers
Multinational corporations/foreign-owned customers located in the county
Domestic customers
TOTAL 100%
15. In which regions can your domestic customers be found? (Select all applicable choices.) National Capital Region (NCR) Region I – Ilocos Region CAR – Cordillera Administrative Region Region II – Cagayan Valley Region III – Central Luzon Region IVA – CALABARZON Region IVB – MIMAROPA Region V – Bicol Region Region VI – Western Visayas Region VII – Central Visayas Region VIII – Eastern Visayas Region IX – Zamboanga Peninsula Region X – Northern Mindanao Region XI – Davao Region Region XII – SOCCSKSARGEN Region XIII – Caraga Region BARMM – Bangsamoro Autonomous Region of Muslim Mindanao
16. In which regions does your business have offices or production plants? (Select all applicable choices.) National Capital Region (NCR) Region I – Ilocos Region CAR – Cordillera Administrative Region Region II – Cagayan Valley Region III – Central Luzon Region IVA – CALABARZON Region IVB – MIMAROPA

45 | P a g e
Region V – Bicol Region Region VI – Western Visayas Region VII – Central Visayas Region VIII – Eastern Visayas Region IX – Zamboanga Peninsula Region X – Northern Mindanao Region XI – Davao Region Region XII – SOCCSKSARGEN Region XIII – Caraga Region BARMM – Bangsamoro Autonomous Region of Muslim Mindanao
17. OPTIONAL: In case, you are interested to participate in programmes related to this survey, please provide us with contact details where we can reach you. Name of contact person: _______________ Email address: ________________________
A. Immediate Impact
Questions
1. What is the status of your business due to the country’s containment measures (e.g. quarantine, social distancing, etc.) Business is open. Business is partially open (skeletal force). Business is closed.
2. What changes have you adopted in your operations? (Select all applicable choices.) Reduced working / operating hours. Please specify % reduction: _____ * if chosen Work-from-home arrangement Lay-off Went into partial operation (some sections are closed) No operation Diversified the operations to new products/processes Others. Please specify: __________ * if chosen
3. What were the challenges encountered that led to the changes in your operations? (Select top 3 choices.) Not allowed to operate (containment measures) Lack of manpower Lack of demand / recalled purchase orders No available input materials / services Distribution / shipping / logistics issues Cash flow issues Others. Please specify: __________ * if chosen
4. If lack of manpower was a challenge, what was the nature of the issues? (Select all applicable choices.) Not applicable Lack of available transportation Only skeletal force is allowed Difficulty to maintain social distancing at the workplace Insufficient personal protective equipment (PPEs) Fear to come to work

46 | P a g e
Employees are unable to execute work-from-home arrangements Critical employees are sick Critical employees are attending to personal matters, caring for children / family members Others. Please specify: __________ * if chosen
5. If lack of manpower was a challenge, what are the main means you are considering to deal with the shortage of workers? (Select top 2 choices.) Not applicable Wage increases Use of advanced equipment or software to reduce the amount of work Outsourcing of orders Delays in delivery Additional measures on workplace safety to prevent infection. Please specify:
_____________________ * if chosen Others. Please specify: __________ * if chosen
6. If sourcing input materials was a challenge, what are the main means you are currently considering to deal with the shortage of inputs such as intermediate goods and raw materials? (Select top 3 choices.) Not applicable Seeking alternative sources Reduction of production Outsourcing orders Increasing the procurement channels Seeking new production channels Delaying goods delivery Others. Please specify: __________ * if chosen
7. If distribution / shipping / logistics was a challenge, what was the nature of the issues regarding them? (Select all applicable choices.) Not applicable Travel restrictions / checkpoints Additional regulatory requirements No uptake at market / distribution points (closed) Insufficient service available from usual service-providers Slow clearance at the Customs and the cargo yard Others. Please specify: __________ * if chosen
8. If distribution / shipping / logistics was a challenge, what are the main means you are currently considering to deal with these issues? (Select all applicable choices.) Not applicable Alternative service providers Alternative markets Others. Please specify: __________ * if chosen
9. What has been the impact of the COVID-19 pandemic on your company's sales revenue in March/April 2020 compared to February 2020? (Select the % change from the drop-down menu.) Drop down menu: from -100% to 0% to +100% (intervals of 10)
Please provide any other additional information to explain your response: __________
10. What has been the impact of the COVID-19 pandemic on your company's production in March/April 2020 compared to February 2020? (Select the % change from the drop-down menu.) Drop down menu: from -100% to 0% to +100% (intervals of 10)
Please provide any other additional information to explain your response: __________

47 | P a g e
11. If containment measures are prolonged for another month, how do you expect your company's sales revenues to change in May 2020 compared to February 2020? (Select the % change from the drop-down menu.) Drop down menu: from -100% to 0% to +100% (intervals of 10)
Please provide any other additional information to explain your response: __________
12. What has been the impact of the COVID-19 pandemic on your company's total employment in March/April 2020 compared to February 2020? ? (Select the % change from the drop-down menu.) Drop down menu: from -100% to 0% to +100% (intervals of 10)
Please provide any other additional information to explain your response: __________
13. What percentage of those laid-off were women? up to 10% 11% to 25% 26% to 50% more than 50% not applicable
14. Are you considering re-hiring the laid-off staff when your business operations fully restart? Yes No Not applicable
15. What factors will affect your decision to re-hire laid-off workers when operations resume? (Select top 3 choices.) Not applicable Uncertainty in market conditions (demand) Uncertainly in supply chain (inputs) Working capital constraints Uncertainty about the status of the pandemic Product and process innovations/automation, therefore unsure of skills requirement Others. Please specify: __________ * if chosen
16. If containment measures are prolonged, how do you expect your company's employment to change in May 2020 compared to February 2020? Increase in number. Please specify: _____% vs February 2020 Decrease in number. Please specify: _____% vs February 2020 No change
Please provide any other additional information to explain your response: __________ * if chosen
B. Recovery
Questions
17. What changes are you expecting to see in the business environment when the ongoing crisis/pandemic ends? (Select all applicable choices.) Things will go back to as it was before the crisis. There will be changes in product lines and services. There will be changes in raw material and energy inputs. There will be changes in operations and processes (inventory, distribution, etc.). There will be changes in manufacturing processes (digitalization, new technologies, etc.).

48 | P a g e
There will be changes in marketing activities (e-commerce). There will be new business regulations. Others. Please specify: __________ * if chosen
18. What will be your biggest challenges in maintaining / re-starting business operations? (Select top 5 choices.) Decline in domestic demand / customers Decline in foreign demand / customers Disruption in production, supply chains, and networks Cash flow (e.g. working capital, salaries, loan payments, tax obligations, etc.) Higher production cost Intensified market competition Health and safety of workers Lack of manpower Other remaining restrictions under the modified community quarantine Others. Please specify: __________ * if chosen
19. If cash flow is expected to be an issue, what are the expected challenges in your cash flow? (Select all applicable choices.) Working capital Fixed cost. Please specify: __________ * if chosen Loan payments (bank) Loan payments (non-bank) Salaries Tax obligations SSS and other contributions Others. Please specify: __________ * if chosen Not applicable
20. If cash flow is expected to be an issue, what means will you consider pursuing to address cash flow shortage? (Select all applicable choices.) Loans from government financial institutions Loans from private development banks Loans from commercial banks / rural banks Loans by internet finance Loans from micro-finance companies (microfinance Institutions, credit cooperatives, private finance
companies and pawn shops) Loans from non-bank sources (individuals) Negotiating with lenders to avoid withdrawing loans Equity financing (adding new shareholders or capital increase of former shareholders) Loan restructuring / loan refinancing Use of credit cards to defer payment Reduction of operating costs (e.g. lay-offs and salary reductions) Paying by goods/products (barter trade) Others. Please specify: __________ * if chosen Not applicable
21. How much do you think you will require to fully restart your business operations? Less than PhP 2 million PhP 2 million to PhP 5 million PhP 5 million to PhP 10 million PhP 10 million to PhP 20 million
49 | P a g e
above PhP 20 million
22. Has the business applied for a loan in the past 2 years? Yes No Prefer not to disclose
23. Do you have an existing Business Continuity Plan that is responsive to pandemics/health crises? Yes No
24. If reply in question # 23 is “Yes”, what were the challenges in implementing the business continuity plan? (Select all applicable choices.) Not applicable It did not respond well to the current emergency. It was inadequate and lacking. Not updated since it was prepared Others. Please specify: __________ * if chosen
25. If reply in question # 23 is “No”, what were the challenges in developing a business continuity plan? (Select all applicable choices.) Not applicable Not aware what a business continuity plan is It was deemed unnecessary by top management. It was not a priority. There was no capacity to develop one. Others. Please specify: __________ * if chosen
26. What kind of support do you think your business will need to ensure a successful recovery to full operation? (Select all applicable choices.) Market and Business Environment Support within the supply / value chain (enhanced big brother-small brother agreements) Safe and efficient mobility for manpower and goods Access to new markets Price control Relaxation of deadlines and regulations (permits, standards, etc.) Optimization of exporting tax rebate services Provide fast-track "force majeure" certification to avoid contract breaches Subsidies for digitalization and automation Others. Please specify: _______________ * if chosen
Human Resources and Compensation Easy access to the COVID-19 tests for the employees Trainings and capacity development. Please specify:
________________________________________ * if chosen Compensation for businesses if closed due to employees becoming a covid-19 patient Reduced rental fees Lower costs for utilities (e.g. electricity, gas, etc.) Reduction of social insurance premiums Incentives to enterprises that do not lay off staff Direct subsidies based on past tax payments Flexible work arrangements and labor policies Others. Please specify: __________ * if chosen
Financial Aspects

50 | P a g e
Access to financial assistance / loans Reduction of tax rates / deferral of taxes Extension of loan maturities Flexible credit provisions / reduction of financing costs Others. Please specify: __________ * if chosen
27. What types of standards and technology solutions will you be most interested in, to build your resilience to address the impacts of future shocks and emergencies? (Select top 5 choices.) Advanced digital and disruptive technologies in aid of production, commerce, safety, and supply
chain management Energy efficiency and renewable energy Cold storage and other tools for inventory management Process improvements / re-engineering E-mobility Quality and safety standards for products, production, and services Occupational safety and employee health & wellfare programs Resource efficiency and cleaner production Pollution control technologies Waste management E-commerce Online delivery of HR functions for alternative arrangements Others. Please specify: __________ * if chosen
28. Will you be interested to explore diversification of operations, new products and services, and other business models? Yes No
29. If the response to question # 30 is ‘Yes”, which of the following options will you be pursuing? (Select all applicable choices.) Not applicable Adjust business model Re-purpose part of the existing facility to produce other products Adding new product/service lines beyond the existing capacity Switching to new businesses to survive Others. Please specify: __________ * if chosen
30. How are you starting to prepare for restarting your business operations? (Select all applicable choices.) Talking with banks Inquiring about government support programs Coordinating with suppliers Discussions with customers Planning to permanently close shop Others. Please specify: __________ * if chosen

51 | P a g e
ANNEX C – Respondent Demographics: Data and Charts
List of Figures for Annex C Chart Title Page
Figure 1 Respondent Firms According to Firm Size 52
Figure 2 Comparison Between 2018 Population of Philippine Enterprises and Respondent
Firms According to Firm Size
52
Figure 3 Respondent Firms According to Sector 52
Figure 4 Comparison Between 2018 Population of Philippine Enterprises and Respondent
Firms According to Sector
52
Figure 5 Respondent Firms, Sector vs Firm Size 53
Figure 6 Manufacturing Firms, Goods Produced vs Firm Size 53
Figure 7 Respondent Firms According to Client Orientation 53
Figure 8 Respondent Firms, Client Orientation vs Firm Size 54
Figure 9 Respondent Firms, Client Orientation vs Sector 54
Figure 10 Respondent Firms According to Years of Operation 54
Figure 11 Respondent Firms, Years of Operation vs Firm Size 54
Figure 12 Respondent Firms, Years of Operation vs Sector 55
Figure 13 Respondent Firms, Years of Operation vs Client Orientation 55
Figure 14 Respondent Firms According to Firm Owners’ Age 55
Figure 15 Respondent Firms According to Firm Owners’ Gender 55
Figure 16 Respondent Firms, Age of Firm Owner vs Firm Size 55
Figure 17 Respondent Firms, Gender of Firm Owner vs Firm Size 55
Figure 18 Respondent Firms, Age of Firm Owner vs Sector 56
Figure 19 Respondent Firms, Gender of Firm Owner vs Sector 56
Figure 20 Respondent Firms, Age of Firm Owner vs Client Orientation 56
Figure 21 Respondent Firms, Gender of Firm Owner vs Client Orientation 56
Figure 22 Respondent Firms According to Firm Owners’ Highest Educational Attainment 50
Figure 23 Respondent Firms, Highest Educational Attainment of Firm Owner vs Firm Size 57
Figure 24 Respondent Firms, Highest Educational Attainment of Firm Owner vs Gender 57
Figure 25 Respondent Firms, Highest Educational Attainment of Firm Owner vs Sector 57
Figure 26 Respondent Firms According to Ownership Structure 57
Figure 27 Respondent Firms According to Location of Operations 57
Figure 28 Regional Representation of Respondent Firms 58
Figure 29 Respondent Firms and Number of Employees 58
Figure 30 Subsectors of Respondent Firms 59
Figure 31 COVID – 19 Positive Cases in Regions in Luzon (population of 10M and above) 59
Figure 32 COVID – 19 Positive Cases in Regions in Luzon (population of less than 10M) 59
Figure 33 COVID – 19 Positive Cases in Regions with Major Cities (Metro Manila, Cebu
City, and Davao City)
59

52 | P a g e
SNAPSHOT OF RESPONDENTS C.1 RESPONDENT FIRMS ACCORDING TO FIRM SIZE - The classification of enterprises according to size is based on asset
size as assessed by the Bangko Sentral ng Pilipinas (BSP) and adopted by the DTI. Comparing the respondent asset size with the population asset size of enterprises in the Philippines as of 2018, the proportion of respondents representing microenterprises was lower compared to actual population in the country (69% vs 88%), while the proportions of SMEs and large firms were higher (S – 20% vs 11%; M – 7% vs 0.5%; L – 4% vs 0.5%). As the focus of the assessment is on MSMEs and since the number of respondent large enterprises is very low (using threshold of <20 firms), the medium and large enterprise segments were merged into one category, in this assessment.
C.2 RESPONDENT FIRMS ACCORDING TO SECTOR - The classification of enterprises according to sector was based on the
four categories adopted by NEDA in the PDP 2017-2022, including: manufacturing, trade, services and agro-processing. Comparing the respondent sector size with the population sector size of enterprises in the Philippines as of 2018, the proportion of respondents representing the manufacturing sector is higher compared to actual population in the country (50% vs 12%), same with agro-processing (6% vs 0.9%), while lower for trade and services (T – 17% vs 46%, S – 27% vs 41%). Due to the very low number of respondents in the agro-processing sector (using threshold of <20 firms), and since almost all of them belong to the food and beverage or food processing sub-sectors, this segment was merged with manufacturing in this assessment. The enterprises in the manufacturing sector was further classified according to position in the value chain based on whether they produce intermediate or finished goods.
Microenterprises68.51%
Small Enterprises
20.43%
Medium and Large
Enterprises11.06%
Figure 1: Respondent Firms According to Firm Size (n = 235)
Microenterprises, 88.45%
Microenterprises, 68.51%
Small Enterprises, 10.58%
Small Enterprises, 20.43%Medium and Large Enterprises, 0.97%
Medium and Large Enterprises, 11.06%
0% 10% 20% 30% 40% 50% 60% 70% 80% 90% 100%
Act
ual
20
18P
hili
pp
ine
Ente
rpri
ses
Res
po
nd
ents
Figure 2: Comparison Between 2018 Population of Philippine Enterprises and Respondent Firms According to Firm Size
Services, 26.81%
Trade, 17.45%
Manufacturing -Finished Goods,
51.91%
Manufacturing -Intermediate Goods, 3.83%
Total Manufacturing,
55.74%
Figure 3: Respondent Firms According to Sector (n = 235)
Manufacturing, 12.66%
Manufacturing, 55.74%
Trade, 46.09%
Trade, 17.45%
Service, 41.25%
Service, 26.81%
0% 20% 40% 60% 80% 100%
Act
ual
20
18P
hili
pp
ine
Ente
rpri
ses
Re
spo
nd
en
ts
Figure 4: Comparison Between 2018 Population of Philippine Enterprises and Respondent Firms According to Sector

53 | P a g e
C.3 A higher proportion of small firms was manufacturing in nature (65% vs 56%) compared to total sample size. In contrast, a higher proportion of medium and large firms was engaged in services (35% vs 27%). A slightly higher proportion of microenterprises in the manufacturing sector was producing finished goods (97% vs 93%). A higher proportion of SMEs and large firms in the manufacturing sector (14% vs 5%) was producing intermediate goods compared to microenterprises.
C.4 RESPONDENT FIRMS ACCORDING TO CLIENT ORIENTATION - About half of the respondent firms were engaged in transactions with foreign entities / MNCs either as exporters or GVC players, as per UNIDO recommended definitions below. These were classified as export-oriented firms. Firms with less than 10% of their transactions made with foreign entities / MNCs were classified as domestic-oriented.
UNIDO DEFINITION
Export-oriented - Firms that sell at least 10% of their sales to foreign customers, regardless of the volume of their imports from foreign sources 1. Global Value Chain (GVC) Players: • Firms that produce intermediate inputs and sells a large share (30% and above) to foreign customers or domestically-located MNCsTraders who import and export goods • Firms that are two-way traders: a large share of their purchases are imported (above 33%) and a large share of their sales are exported (30% and above) 2. Exporters outside GVCs: firms which are not defined as GVC firms but sells at least 10% of their sales / services to foreign customers
Domestic-oriented - Firms that sell most of their sales (above 90%) to the domestic market
C.5 A higher proportion of microenterprises was domestic-oriented (60% vs 48%) while small, medium, and large
firms were more export-oriented (73%/88% vs 52%). Firms in the trade sector were more domestic-oriented (59% vs 48%) while firms in the service sector were more export-oriented (59% vs 52%).
55.74% 53.42%64.58%
53.85%
17.45% 19.88%
12.50%
11.54%
26.81% 26.71% 22.92%34.62%
0%
10%
20%
30%
40%
50%
60%
70%
80%
90%
100%
All Firms (235) Microfirms (161) Small Firms (48) Medium andLarge (26)
Figure 5: Respondent Firms, Sector vs Firm Size
Manufacturing Trade Services
93.13% 96.51%87.10% 85.71%
6.87% 3.49%12.90% 14.29%
0%
10%
20%
30%
40%
50%
60%
70%
80%
90%
100%
ManufacturingFirms (131)
Microfirms (86) Small Firms (31) Medium andLarge Firms (14)
Figure 6: Manufacturing Firms, Goods Produced vs Firm Size
Manufacturing - Finished Goods Manufacturing - Intermediate Goods
Export-oriented
Firms, 51.91%
Domestic-oriented
Firms, 48.09%
Figure 7: Respondent Firms According to Client Orientation

54 | P a g e
C.6 RESPONDENT FIRMS ACCORDING TO YEARS OF OPERATION - In terms of years of operation, almost a third of respondents had been operating for more than ten years, while a fourth were still within three years of operation. A higher proportion of microenterprises had been in operation for less than 5 years (33% vs 25%), while a greatly higher proportion of small, medium and large enterprises had been in operation for more than 10 years (58%/85% vs 32%).
C.7 A higher proportion of firms in the trade sector (39% vs 25%) and domestic-oriented firms (36% vs 25%) had been in operation for 3 years and less, compared to total sample size, while the opposite was true for firms in the service sector (17% vs 25%). On the other hand, a higher proportion of export-oriented firms had been in operation for more than 10 years (41% vs 32%), at the same time that a lower proportion had been in operation for 3 years or less (15% vs 25%).
51.91%
39.75%
72.92%
88.46%
48.09%
60.25%
27.08%
11.54%
0%
10%
20%
30%
40%
50%
60%
70%
80%
90%
100%
All Firms (235) Microfirms (161) Small Firms (48) Medium andLarge Firms (26)
Figure 8: Respondent Firms, Client Orientation vs Firm Size
export-oriented domestic-oriented
51.91% 51.91%41.46%
58.73%
48.09% 48.09%58.54%
41.27%
0%
10%
20%
30%
40%
50%
60%
70%
80%
90%
100%
All Firms (235) Manufacturing(131)
Trade (41) Services (63)
Figure 9: Respondent Firms, Client Orientation vs Sector
export-oriented domestic-oriented
3 years and less, 25.11%
More than 3 years to 5 years,
21.70%More than 5 years to 10 years,
20.85%
More than 10 years, 32.34%
Figure 10: Respondent Firms According to Years of Operation
25.11%32.92%
10.42%
3.85%
21.70%
27.95%
12.50%
0.00%
20.85%
22.98%
18.75%
11.54%
32.34%
16.15%
58.33%
84.62%
0%
10%
20%
30%
40%
50%
60%
70%
80%
90%
100%
All Firms (235) Microfirms (161) Small Firms (48) Medium and LargeFirms (26)
Figure 11: Respondent Firms, Years of Operation vs Firm Size
3 years and Less More than 3 years to 5 years
More than 5 years to 10 years More than 10 years
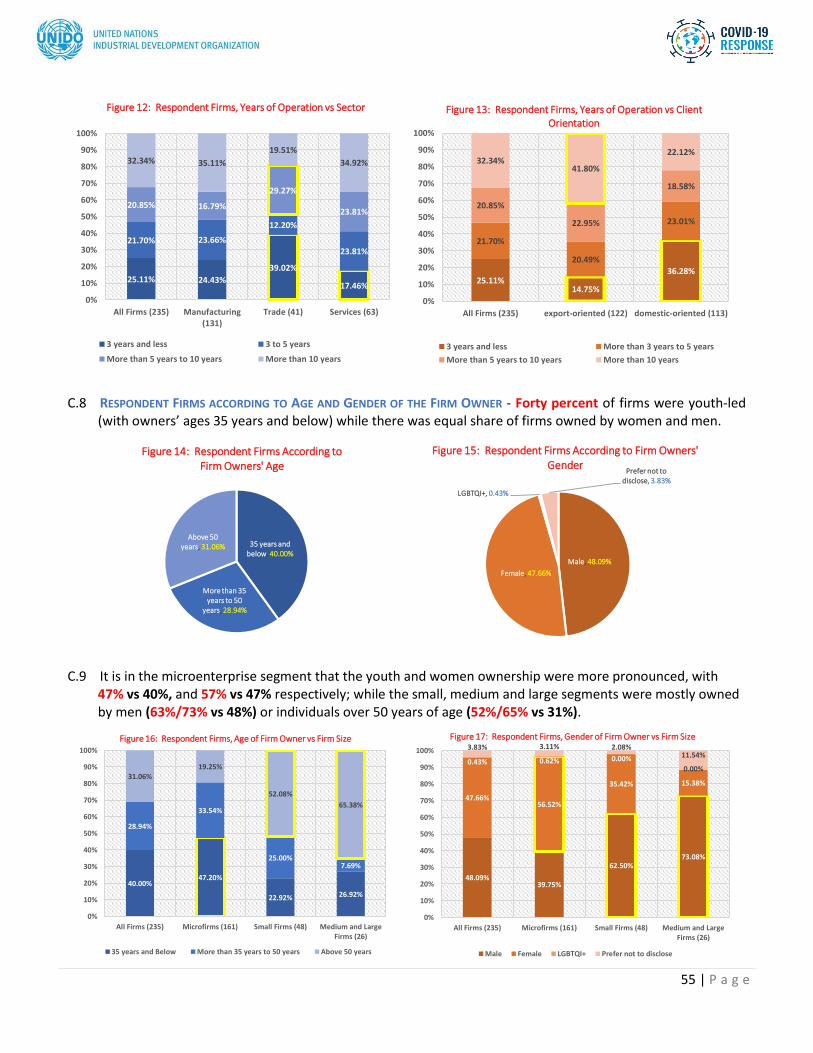
55 | P a g e
C.8 RESPONDENT FIRMS ACCORDING TO AGE AND GENDER OF THE FIRM OWNER - Forty percent of firms were youth-led
(with owners’ ages 35 years and below) while there was equal share of firms owned by women and men.
C.9 It is in the microenterprise segment that the youth and women ownership were more pronounced, with 47% vs 40%, and 57% vs 47% respectively; while the small, medium and large segments were mostly owned by men (63%/73% vs 48%) or individuals over 50 years of age (52%/65% vs 31%).
25.11% 24.43%
39.02%
17.46%
21.70% 23.66%
12.20%
23.81%
20.85% 16.79%
29.27%
23.81%
32.34% 35.11%
19.51%
34.92%
0%
10%
20%
30%
40%
50%
60%
70%
80%
90%
100%
All Firms (235) Manufacturing(131)
Trade (41) Services (63)
Figure 12: Respondent Firms, Years of Operation vs Sector
3 years and less 3 to 5 years
More than 5 years to 10 years More than 10 years
25.11%14.75%
36.28%
21.70%
20.49%
23.01%
20.85%
22.95%
18.58%
32.34%41.80%
22.12%
0%
10%
20%
30%
40%
50%
60%
70%
80%
90%
100%
All Firms (235) export-oriented (122) domestic-oriented (113)
Figure 13: Respondent Firms, Years of Operation vs Client Orientation
3 years and less More than 3 years to 5 years
More than 5 years to 10 years More than 10 years
35 years and below, 40.00%
More than 35 years to 50
years, 28.94%
Above 50 years, 31.06%
Figure 14: Respondent Firms According to Firm Owners' Age
Male, 48.09%
Female, 47.66%
LGBTQI+, 0.43%
Prefer not to disclose, 3.83%
Figure 15: Respondent Firms According to Firm Owners' Gender
40.00%47.20%
22.92% 26.92%
28.94%
33.54%
25.00%7.69%
31.06%19.25%
52.08%
65.38%
0%
10%
20%
30%
40%
50%
60%
70%
80%
90%
100%
All Firms (235) Microfirms (161) Small Firms (48) Medium and LargeFirms (26)
Figure 16: Respondent Firms, Age of Firm Owner vs Firm Size
35 years and Below More than 35 years to 50 years Above 50 years
48.09%39.75%
62.50%73.08%
47.66%56.52%
35.42% 15.38%
0.43% 0.62% 0.00%
0.00%
3.83% 3.11% 2.08%11.54%
0%
10%
20%
30%
40%
50%
60%
70%
80%
90%
100%
All Firms (235) Microfirms (161) Small Firms (48) Medium and LargeFirms (26)
Figure 17: Respondent Firms, Gender of Firm Owner vs Firm Size
Male Female LGBTQI+ Prefer not to disclose

56 | P a g e
C.10 A higher proportion of firms in the trade sector was youth-owned (44% vs 37%) and whose owners were male (51% vs 46%) compared to those in the manufacturing sector while a higher proportion of manufacturing firms compared to trade was owned by individuals older than 50 years (34% vs 24%) and women (51% vs 46%).
C.11 A higher proportion of firms that were export-oriented was owned by individuals older than 50 years (39%
vs 31%) compared to total sample size while a higher proportion of domestic-oriented firms was owned by individuals more than 35 to 50 years old (37% vs 28%).
C.12 RESPONDENT FIRMS ACCORDING TO HIGHEST EDUCATIONAL ATTAINMENT OF FIRM OWNERS - Majority of firms (64%)
had owners who completed at least a tertiary education. While there was no clear discrimination across firm sizes, a higher proportion of male owners had completed a tertiary education (86% vs 79%), compared to female owners, while firms in the service sector had a higher proportion that was owned by individuals who were vocational graduates (60% vs 12%), compared to total sample. At the same time. A higher proportion of firms in the trade sector had owners who completed a tertiary-level education (73% vs 63%).
40.00% 37.40%43.90% 42.86%
28.94%28.24%
31.71% 28.57%
31.06% 34.35%24.39% 28.57%
0%
10%
20%
30%
40%
50%
60%
70%
80%
90%
100%
All Firms (235) Manufacturing(131)
Trade (41) Services (63)
Figure 18: Respondent Firms, Age of Firm Owner vs Sector
35 years and Below More than 35 years to 50 years Above 50 years
48.09% 45.80% 51.22% 50.79%
47.66% 51.15%46.34%
41.27%
0.43% 0.00% 0.00%1.59%
3.83% 3.05% 2.44% 6.35%
0%
10%
20%
30%
40%
50%
60%
70%
80%
90%
100%
All Firms (235) Manufacturing(131)
Trade (41) Services (63)
Figure 19: Respondent Firms, Gender of Firm Owner vs Sector
Male Female LGBTQI+ Prefer not to disclose
40.00% 39.34% 40.71%
28.94%21.31%
37.17%
31.06%39.34%
22.12%
0%
10%
20%
30%
40%
50%
60%
70%
80%
90%
100%
All Firms (235) export-oriented (122) domestic-oriented (113)
Figure 20: Respondent Firms, Age of Firm Owner vs Client Orientation
35 years and Below More than 35 years to 50 years Above 50 years
48.09% 49.18% 46.90%
47.66% 45.90% 49.56%
0.43% 0.82% 0.00%
3.83%4.10% 3.54%
0%
10%
20%
30%
40%
50%
60%
70%
80%
90%
100%
All Firms (235) export-oriented (122) domestic-oriented (113)
Figure 21: Respondent Firms, Gender of Firm Owner vs Client Orientation
Male Female LGBTQI+ Prefer not to disclose

57 | P a g e
C.13 RESPONDENT FIRMS OWNERSHIP STRUCTURE AND LOCATION OF OPERATIONS - Respondents were predominantly
wholly Filipino-owned enterprises, with 4% having joint ventures with foreign entities. Eighty percent was from Luzon, where quarantine and social distancing measures were implemented from 15 to 31 May 2020, covering the survey period from 28 April to 16 May 2020. Most firms were located in the National Capital Region (NCR). A significant number came from Region IVA (CALABARZON) and Region III (Central Luzon).
Post-graduate, 17.87%
Tertiary education,
62.98%
vocational graduate,
1.70%
Secondary education,
7.23%
Primary education,
1.28%
Unknown, 8.94%
Figure 22: Respondent Firms According to Firm Owners' Hughest Educational Attainment (n = 235)
17.87% 14.29%22.92%
30.77%
62.98% 68.94%60.42%
30.77%
1.70%2.48%
0.00%
0.00%
7.23%8.07%
6.25%
3.85%
1.28%1.86%
0.00%
0.00%
8.94%4.35%
10.42%
34.62%
0%
10%
20%
30%
40%
50%
60%
70%
80%
90%
100%
All Firms (235) Microfirms (161) Small Firms (48) Medium and LrgeFirms (26)
Figure 23: Respondent Firms, Highest Educational Attainment of Firm Owner vs Firm Size
Post-graduate Tertiary education vocational graduate
Secondary education Primary education Unknown
17.87% 22.12%13.39%
0.00%
22.22%
62.98%63.72%
66.07%100.00%
11.11%
1.70% 0.00%3.57% 0.00%
0.00%
7.23% 4.42% 10.71% 0.00%
0.00%
1.28% 2.65% 0.00% 0.00%
0.00%
8.94% 7.08% 6.25%0.00%
66.67%
0%
10%
20%
30%
40%
50%
60%
70%
80%
90%
100%
All Firms (235) Male (113) Female (112) LGBTQI+ (1) Prefer not todisclose (9)
Figure 24: Respondent Firms, Highest Educational Attainment of Firm Owner vs Gender
Post-graduate Tertiary education vocational graduate
Secondary education Primary education Unknown
17.87% 16.03%9.76%
26.98%
62.98% 61.83% 73.17%
19.05%
12.34% 1.53%4.88%
39.68%
7.23%9.92% 2.44% 4.76%
1.28% 0.76% 0.00% 3.17%8.94% 9.92% 9.76% 6.35%
0%
10%
20%
30%
40%
50%
60%
70%
80%
90%
100%
All Firms (235) Manufacturing (131) Trade (41) Services (63)
Figure 25: Respondent Firms, Highest Educational Attainment of Firm Owner vs Sector
Post-graduate Tertiary education vocational graduate
Secondary education Primary education Unknown
100% Filipino-owned, 95.74%
Joint venture with foreign
partners, 4.26%
Figure 26: Respondent Firms According to Ownership Structure
Region IVA, 27.66%
National Capital Region (NCR),
25.96%
Multiple (NCR + others), 12.34%
Region III, 11.06%Region II, 5.53%
Multiple (non-NCR), 2.13%
Rest of Luzon, 2.98%
Rest of Visayas, 6.38%
Rest of Mindanao, 5.96%
Others, 15.32%
Figure 27: Respondent Firms According to Locations of Operations

58 | P a g e
C.14 RESPONDENT FIRMS AND NUMBER OF EMPLOYEES - In general, firms had number of employees not consistent
with the official definition for enterprises of varying sizes. When classifying their business operations according to firm size, respondents tend to use the definition according to asset size rather than number of employees. About 10% of microenterprises had employees more than expected while around 10% of large firms had employees less than expected. About 70% of medium-sized firms had number of employees inconsistent with what is expected, some more while some were less.
C.15 RESPONDENT FIRMS SUBSECTORS - Majority of manufacturing firms (58%) was from the food and beverage subsector. Other subsectors include textile, leather, wood, furniture, fabricated metal products, electric appliances, machinery, paper, rubber, plastics products, chemicals, and chemical products, among others.
38.30%
27.66%
11.06%
5.53%
4.26%
2.98%
20.46%
14.85%
11.61%
3.07%
5.85%
7.07%
0.00%10.00%20.00%30.00%40.00%50.00%60.00%70.00%
National Capital Region (NCR)
Region IVA
Region III
Region II
Region XI
Region VII
Figure 28: Regional Representation of Respondent Firms
Respondents Actual 2018 Philippine Enterprises
91.93%
91.67%
29.41%
88.89%
0% 10% 20% 30% 40% 50% 60% 70% 80% 90% 100%
All Firms
Microfirms
Small Firms
Medium Firms
Large Firms
Figure 29: Respondent Firms and Number of Employees
Employees (0 - 9) Employees (10 -99) Employees (100 - 199) Employees (200 up)

59 | P a g e
C.16 COVID-19 POSITIVE CASES - The National Capital Region (NCR) hosts the highest number of confirmed COVID-
19 positive cases in the country during the survey period, way ahead of the rest. During most part of the survey period, although drastically much lower in number compared to NCR, Regions 1 led the number of confirmed cases among regions in Luzon with population below 10M.
Food and Beverage, 57.25%
Textile, Leather, Leather Products and Wearing
Apparel, 14.50%
Art, home decorations, Furniture, Wood, cork, rattan,
bamboo and the like, 3.05%
Fabricated metal products, Electric appliances,
Machinery and Equipment, 3.82%
Paper, paper products, rubber, and plastic
products, 8.40%
Chemical and Chemical Products, 6.87%
Agricultural and Environmental Products,
3.82%
Household Products, 2.29%
Others, 21.37%
Figure 30: Subsectors of Respondent Firms
0
1000
2000
3000
4000
5000
6000
7000
8000
9000
Figure 31: COVID-19 Positive Cases in Regions in Luzon (population of 10M and above)
NCR Region 4A Region 3
0
10
20
30
40
50
60
70
80
Figure 32: COVID-19 Positive Cases in Regions in Luzon (population of less than 10M)
Region 1 Region 2 Region 4B Region 5
0
1000
2000
3000
4000
5000
6000
7000
8000
9000
Figure 33: COVID-19 Positive Cases inRegions w/ Major Cities (Metro Manila, Cebu City, and Davao City)
NCR Region 7 Region 11

60 | P a g e
ANNEX D – Immediate Impact of COVOD – 19 Containment Measures: Data and Charts
List of Figures for Annex D Chart Title Page
Figure 34 Respondent Firms According to Operational Status 62
Figure 35 Respondent Firms, Operational Status vs Firm Size 62
Figure 36 Respondent Firms, Operational Status vs Sector 62
Figure 37 Respondent Firms, Operational Status vs Client Orientation 62
Figure 38 Respondent Firms According to Permission to Operate 63
Figure 39 Respondent Firms, Permission to Operate vs Firm Size 63
Figure 40 Respondent Firms, Permission to Operate vs Sector 63
Figure 41 Respondent Firms, Permission to Operate vs Client Orientation 63
Figure 42 Challenges Faced by Non-operating Firms Permitted to Operate 64
Figure 43 Challenges Faced by Non-operating Firms Permitted to Operate According to
Firm Size
64
Figure 44 Challenges Faced by Non-operating Firms Permitted to Operate According to
Sector
64
Figure 45 Challenges Faced by Non-operating Firms Permitted to Operate According to
Client Orientation
64
Figure 46 Non-operating Firms Permitted to Operate, BCP vs Firm Size 65
Figure 47 Non-operating Firms Permitted to Operate, BCP vs Sector 65
Figure 48 Non-operating Firms Permitted to Operate, BCP vs Client Orientation 65
Figure 49 Challenges Faced by Operating Firms 66
Figure 50 Challenges Faced by Operating Firms According to Firm Size 66
Figure 51 Challenges Faced by Operating Firms According to Sector 66
Figure 52 Challenges Faced by Operating Firms According to Client Orientation 66
Figure 53 Changes Adopted by Operating Firms 67
Figure 54 Changes Adopted by Operating Firms According to Firm Size 67
Figure 55 Changes Adopted by Operating Firms According to Sector 67
Figure 56 Changes Adopted by Operating Firms According to Client Orientation 67
Figure 57 Means Considered to Address Shortage of Inputs 68
Figure 58 Means Considered to Address Shortage of Inputs According to Firm Size 68
Figure 59 Means Considered to Address Shortage of Inputs According to Sector 68
Figure 60 Means Considered to Address Shortage of Inputs According to Client
Orientation
68
Figure 61 Challenges in Distribution, Shipping, and Logistics 69
Figure 62 Challenges in Distribution, Shipping, and Logistics According to Firm Size 69
Figure 63 Challenges in Distribution, Shipping, and Logistics According to Sector 69
Figure 64 Challenges in Distribution, Shipping, and Logistics According to Client
Orientation
69
Figure 65 Means Considered to Address Issues on Distribution, Shipping and Logistics 70

61 | P a g e
Figure 66 Means Considered to Address Issues on Distribution, Shipping, and Logistics
According to Firm Size
70
Figure 67 Means Considered to Address Issues on Distribution, Shipping and Logistics
According to Sector
70
Figure 68 Means Considered to Address Issues on Distribution, Shipping, and Logistics
According to Client Orientation
70
Figure 69 Challenges on Lack of Manpower 71
Figure 70 Challenges on Lack of Manpower According to Firm Size 71
Figure 71 Challenges on Lack of Manpower According to Sector 72
Figure 72 Challenges on Lack of Manpower According to Client Orientation 72
Figure 73 Means Considered to Address Lack of Manpower 72
Figure 74 Means Considered to Address Lack of Manpower According to Firm Size 72
Figure 75 Means Considered to Address Lack of Manpower According to Sector 73
Figure 76 Means Considered to Address Lack of Manpower According Client Orientation 73
Figure 77 Reduction in Operating Hours (March/April vs February 2020) 73
Figure 78 Reduction in Operating Hours vs Firm Size 73
Figure 79 Reduction in Operating Hours vs Sector 74
Figure 80 Reduction in Operating Hours vs Client Orientation 74
Figure 81 Reduction in Revenue and Production Volume (March/April vs February 2020) 74
Figure 82 Reduction in Revenue vs Firm Size 75
Figure 83 Reduction in Production Volume vs Firm Size 75
Figure 84 Reduction in Revenue vs Sector 75
Figure 85 Reduction in Production Volume vs Sector 75
Figure 86 Reduction in Revenue vs Client Orientation 75
Figure 87 Reduction in Production Volume vs Client Orientation 75
Figure 88 Reduction in Employment (March/April vs February 2020) 76
Figure 89 Reduction in Employment of Operating Firms vs Firm Size 76
Figure 90 Reduction in Employment of Non-operating Firms vs Firm Size 76
Figure 91 Reduction in Employment of Operating Firms vs Sector 77
Figure 92 Reduction in Employment of Non-operating Firms vs Sector 77
Figure 93 Women Employment 77

62 | P a g e
OPERATIONAL STATUS OF FIRMS D.1 OPERATIONAL STATUS - More than half (57%) of the respondents were non-operational during the survey period,
either due to IATF-recommended restrictions or because of other challenges. Further, among those who were able to operate, a meager 16% were fully operational, with the rest only opening parts of the business. Compared to the entire sample size, a higher proportion of microenterprises (68% vs 57%) was non-operational. In general SMEs and large firms were in a better position with small firms being more able to partially operate (58% vs 37%) and large ones being more able to be fully-/partially-operational (fully - 19% vs 7%; partially - 54% vs 37%). There did not seem to be a clear distinction across sectors in relation to firm’s operational status, although there was a moderately higher proportion of firms in the service sector (62% vs 57%) that was non-operational. From a value-chain perspective, a moderately higher proportion of domestic-oriented firms (64% vs 56%) was not in operation while a higher proportion of export-oriented firms (50% vs 43%) was either fully or partially operational.
D.2 NON-OPERATING FIRMS - Among the non-operating firms, about half of them (53%) were permitted as per IATF guidelines, however due to various challenges were not able to do so. Among non-operating firms, a considerably lower proportion of firms in the service sector (26% vs 53%), SMEs (41% vs 53%) and large firms (29% vs 53%), were not able to operate not because they were not permitted, but because they had experienced challenges that led to the non-operation. In contrast, a considerably higher proportion of firms in the manufacturing sector (67% vs 53%) were not able to operate despite the permission. These indicated
Fully Operational,
6.81%
Partially Operational,
36.60%
Microfirms, 46.38%
Small Firms, 7.23%
Medium and Large
Firms, 2.98%
Non-operational,
56.60%
Figure 34: Respondent Firms According to Operational Status
56.60%67.70%
35.42%26.92%
6.81%
4.97%
6.25% 19.23%
36.60%27.33%
58.33% 53.85%
0%
10%
20%
30%
40%
50%
60%
70%
80%
90%
100%
Total Firms (235) Microfirms (161) Small Firms (48) Medium and LargeFirms (26)
Figure 35: Respondent Firms, Operational Status vs Firm Size
Non-Operational Fully Operational Partially Operational
56.60% 53.44%61.90% 58.54%
6.81%6.11%
7.94%7.32%
36.60% 40.46%30.16% 34.15%
0%
10%
20%
30%
40%
50%
60%
70%
80%
90%
100%
Total Firms (235) Manufacturing (131) Services (63) Trade (41)
Figure 36: Respondent Firms, Operational Status vs Sector
Non-Operational Fully Operational Partially Operational
56.60%50.00%
63.72%
6.81%9.84%
3.54%
36.60% 40.16%32.74%
0%
10%
20%
30%
40%
50%
60%
70%
80%
90%
100%
Total Firms (235) Export-oriented (122) Domestic-oriented (113)
Figure 37: Respondent Firms, Operational Status vs Client Orientation
Non-Operational Operational Partially Operational

63 | P a g e
a somewhat lower capability for microenterprises and firms in the manufacturing sector to address the challenges they experienced during ECQ. There did not seem to be a clear distinction between export- and domestic-oriented firms in relation to proportions that experienced challenges leading to non-operation.
CHALLENGES FACED BY FIRMS DURING THE ECQ D.3 Despite being permitted to operate, the challenges faced by non-operating firms, based on % of respondents,
include:
• Cash flow issues (38.57%)
• No available input materials / services (37.14%)
• Lack of customers (37.14%) A great majority of the responses (87%) were provided by microenterprises. Challenges on cash flow indicated a significant reduction in revenue and / or production volume for the affected firms. This, in turn, may be due to various reasons consistent with the other responses around input-related concerns such as lack of input materials, demand, and available manpower. Enterprises facing these challenges, despite being permitted to operate and whose operations were supported by guidelines ensuring unimpeded movement of cargo during the quarantine, point to policy gaps and / or other systemic problems related to broken value chains and business continuity management that may also be sector-specific. Challenges around the availability of transportation for employees was also mentioned.
Operational, 43.40%
Not allowed to operate, 26.81%
Faced with challenges
leading to non-operation,
29.79%
Non-operational, 56.60%
Figure 38: Respondent Firms According to Permission to Operate
47.37% 44.04%
58.82%
71.43%
52.63% 55.96%
41.18%
28.57%
0%
10%
20%
30%
40%
50%
60%
70%
80%
90%
100%
Non-operating Firms(133)
Microfirms (109) Small Firms (17) Medium and LargeFirms (7)
Figure 39: Respondent Firms, Permission to Operate vs Firm Size
Not allowed to operate Allowed to operate
47.37%
32.86%
74.36%
45.83%
52.63%
67.14%
25.64%
54.17%
0%
10%
20%
30%
40%
50%
60%
70%
80%
90%
100%
Non-operating Firms(133)
Manufacturing (70) Services (39) Trade (24)
Figure 40: Respondent Firms, Permission to Operate vs Sector
Not allowed to operate Allowed to operate
47.37% 50.82%44.44%
52.63% 49.18%55.56%
0%
10%
20%
30%
40%
50%
60%
70%
80%
90%
100%
All Non-operating Firms(133)
Export-oriented (61) Domestic-oriented (72)
Figure 41: Respondent Firms, Permission to Operate vs Client Orientation
Not allowed to operate. Allowed to operate

64 | P a g e
A higher proportion of manufacturing firms (47% vs 37%) identified “no available input material / services” as a challenge compared to relevant total sample size, while a higher proportion of firms in the service sector was concerned with lack of customers (50% vs 37%) and lack of demand (50% vs 31%). Domestic-oriented firms (55% vs 37%) were also struggling with availability of input materials.
D.4 More than 75% of firms who faced challenges that led to their non-operation, despite being permitted as per
IATF guidelines, did not have existing business continuity plans. This may have been a crucial factor that that made these firms less prepared and unable to continue operations, experiencing input-related issues around input materials, demand, and available manpower. Data appeared to show that SMEs and domestic-oriented firms are more challenged in this regard, reflecting higher proportions compared to total sample. A higher proportion of firms from the trade sector had reported having BCPs compared to relevant sample (30% vs 21%), while a lower proportion of SMEs and large firms (14% vs 23%) have reported the same.
38.57%
37.14%
37.14%
31.43%
25.71%
22.86%
22.86%
0%20%40%60%80%100%
Cash flow issues
No available input materials / services
Lack of customers because of thequarantine *
Lack of demand / recalled purchase orders
No transportation for employees *
Distribution / shipping / logistics issues
Shut down of suppliers for packagingmaterials and raw materials *
Figure 42: Challenges Faced by Non-operating Firms Permitted to Operate
Firms Facing Challenges (70)
38.57%
37.14%
37.14%
31.43%
25.71%
22.86%
22.86%
0%20%40%60%80%100%
Cash flow issues
No available input materials / services
Lack of customers because of thequarantine *
Lack of demand / recalled purchase orders
No transportation for employees *
Distribution / shipping / logistics issues
Shut down of suppliers for packagingmaterials and raw materials *
Figure 43: Challenges Faced by Non-operating Firms Permitted to Operate According to Firm Size
Firms Facing Challenges (70) Microfirms (61)
Small Firms (7) Medium and Large Firms (2)
38.57%
37.14%
37.14%
31.43%
25.71%
22.86%
22.86%
0%20%40%60%80%100%
Cash flow issues
No available input materials / services
Lack of customers because of thequarantine *
Lack of demand / recalled purchaseorders
No transportation for employees *
Distribution / shipping / logistics issues
Shut down of suppliers for packagingmaterials and raw materials *
Figure 44: Challenges Faced by Non-operating Firms Permitted to Operate According to Sector
Firms Facing Challenges (70) Manufacturing (47) Trade (13) Services (10)
38.57%
37.14%
37.14%
31.43%
25.71%
22.86%
22.86%
0%20%40%60%80%100%
Cash flow issues
No available input materials / services
Lack of customers because of thequarantine *
Lack of demand / recalled purchase orders
No transportation for employees *
Distribution / shipping / logistics issues
Shut down of suppliers for packagingmaterials and raw materials *
Figure 45: Challenges Faced by Non-operating Firms Permitted to Operate According to Client Orientation
Firms Facing Challenges (70) Export-oriented (30) Domestic-oriented (40)
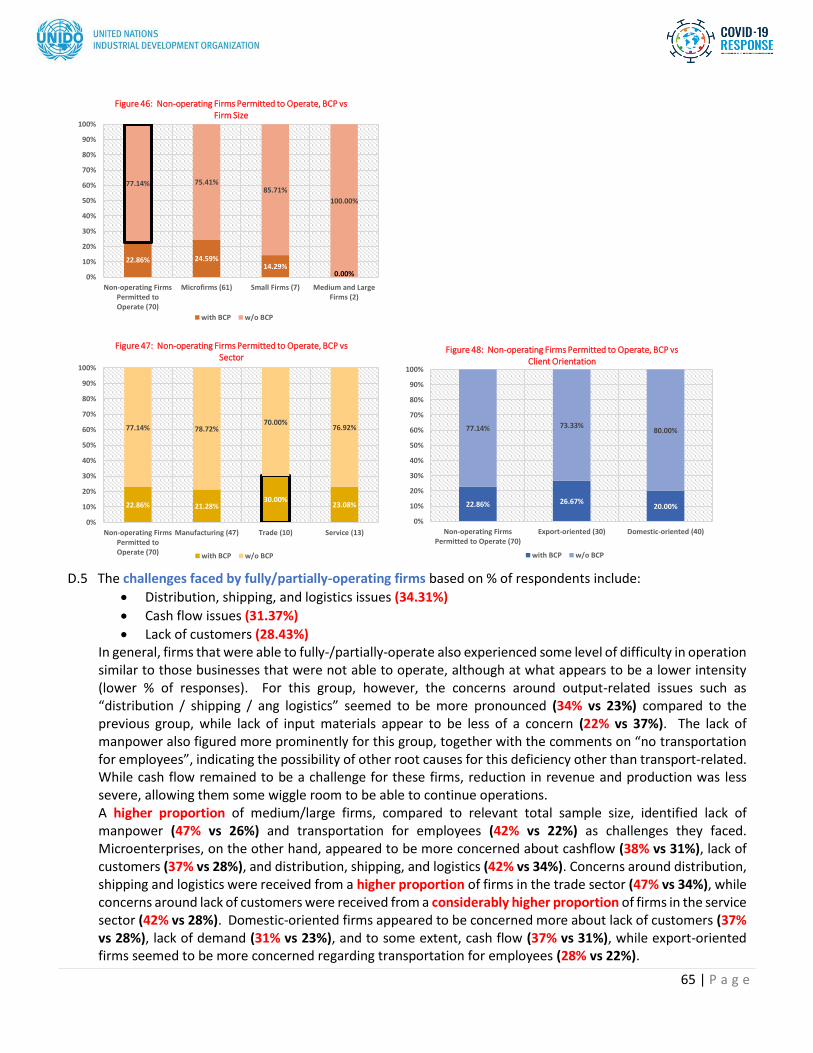
65 | P a g e
D.5 The challenges faced by fully/partially-operating firms based on % of respondents include:
• Distribution, shipping, and logistics issues (34.31%)
• Cash flow issues (31.37%)
• Lack of customers (28.43%) In general, firms that were able to fully-/partially-operate also experienced some level of difficulty in operation similar to those businesses that were not able to operate, although at what appears to be a lower intensity (lower % of responses). For this group, however, the concerns around output-related issues such as “distribution / shipping / ang logistics” seemed to be more pronounced (34% vs 23%) compared to the previous group, while lack of input materials appear to be less of a concern (22% vs 37%). The lack of manpower also figured more prominently for this group, together with the comments on “no transportation for employees”, indicating the possibility of other root causes for this deficiency other than transport-related. While cash flow remained to be a challenge for these firms, reduction in revenue and production was less severe, allowing them some wiggle room to be able to continue operations. A higher proportion of medium/large firms, compared to relevant total sample size, identified lack of manpower (47% vs 26%) and transportation for employees (42% vs 22%) as challenges they faced. Microenterprises, on the other hand, appeared to be more concerned about cashflow (38% vs 31%), lack of customers (37% vs 28%), and distribution, shipping, and logistics (42% vs 34%). Concerns around distribution, shipping and logistics were received from a higher proportion of firms in the trade sector (47% vs 34%), while concerns around lack of customers were received from a considerably higher proportion of firms in the service sector (42% vs 28%). Domestic-oriented firms appeared to be concerned more about lack of customers (37% vs 28%), lack of demand (31% vs 23%), and to some extent, cash flow (37% vs 31%), while export-oriented firms seemed to be more concerned regarding transportation for employees (28% vs 22%).
22.86% 24.59%14.29%
0.00%
77.14% 75.41%85.71%
100.00%
0%
10%
20%
30%
40%
50%
60%
70%
80%
90%
100%
Non-operating FirmsPermitted toOperate (70)
Microfirms (61) Small Firms (7) Medium and LargeFirms (2)
Figure 46: Non-operating Firms Permitted to Operate, BCP vs Firm Size
with BCP w/o BCP
22.86% 21.28%30.00%
23.08%
77.14% 78.72%70.00%
76.92%
0%
10%
20%
30%
40%
50%
60%
70%
80%
90%
100%
Non-operating FirmsPermitted toOperate (70)
Manufacturing (47) Trade (10) Service (13)
Figure 47: Non-operating Firms Permitted to Operate, BCP vs Sector
with BCP w/o BCP
22.86% 26.67%20.00%
77.14% 73.33%80.00%
0%
10%
20%
30%
40%
50%
60%
70%
80%
90%
100%
Non-operating FirmsPermitted to Operate (70)
Export-oriented (30) Domestic-oriented (40)
Figure 48: Non-operating Firms Permitted to Operate, BCP vs Client Orientation
with BCP w/o BCP

66 | P a g e
D.6 CHANGES ADOPTED – Among fully- and partially-operating firms, the top responses provided in relation to the
actions taken to immediately address the challenges faced during ECQ, based on % of respondents, include:
• Reduced working / operating hours (58.82%)
• Work-from-home arrangement (50.98%)
• Went into partial operation – some sections are closed (39.22%) Facing the difficulties brought about by the COVID-19 quarantine measures, firms that were allowed to operate implemented various actions to, at the minimum, successfully continue business operations to the extent possible. Most firms opted to reduce operating hours to make room for the limited movement allowed for employees, raw materials, and goods. A good number of firms also implemented some forms of work-from-home arrangements while other closed down certain sections of their operations. Still others resorted to online activities, among other approaches. Compared to total relevant sample size, a considerably higher proportion of medium and large firms allowed their employees to work from home (73% vs 51%) and reducing their production capacity (21% vs 12%), small firms went into partial operations (65% vs 39%), while microenterprises stepped up their activities using online channels (44% vs 28%). These distinct choices appeared to be unique to different firm sizes, most likely dictated by the type and complexity of their operations. Medium and large firms, granting their higher
34.31%
31.37%
28.43%
25.49%
22.55%
22.55%
21.57%
0%20%40%60%80%100%
Distribution / shipping / logistics issues
Cash flow issues
Lack of customers because of the quarantine*
Lack of manpower
Lack of demand / recalled purchase orders
No available input materials / services
No transportation for employees *
Figure 49: Challenges Faced by Operating Firms
Partially- and fully-operating firms (102)
34.31%
31.37%
28.43%
25.49%
22.55%
22.55%
21.57%
0%20%40%60%80%100%
Distribution / shipping / logistics issues
Cash flow issues
Lack of customers because of the quarantine*
Lack of manpower
Lack of demand / recalled purchase orders
No available input materials / services
No transportation for employees *
Figure 50: Challenges Faced by Operating Firms According to Firm
Size
Partially- and fully-operating firms (102) Microfirms(52) Small Firms (31) Medium and Large Firms (19)
34.31%
31.37%
28.43%
25.49%
22.55%
22.55%
21.57%
0%20%40%60%80%100%
Distribution / shipping / logistics issues
Cash flow issues
Lack of customers because of the quarantine*
Lack of manpower
Lack of demand / recalled purchase orders
No available input materials / services
No transportation for employees *
Figure 51: Challenges Faced by Operating Firms According to Sector
Partially- and fully-operating firms (102) Manufacturing (61) Trade (17) Services (24)
34.31%
31.37%
28.43%
25.49%
22.55%
22.55%
21.57%
0%20%40%60%80%100%
Distribution / shipping / logistics issues
Cash flow issues
Lack of customers because of the quarantine*
Lack of manpower
Lack of demand / recalled purchase orders
No available input materials / services
No transportation for employees *
Figure 52: Challenges Faced by Operating Firms According to Client Orientation
Operating Firms (102) Export-oriented (61) Domestic-oriented (41)

67 | P a g e
capacity, also took advantage of the situation to diversify operations into new products and processes (16% vs 10%). A higher proportion of firms in the trade and service sectors was able to execute work-from-home arrangements for their employees compared to manufacturing firms (65%/58% vs 44%). Instead, a slightly higher proportion of manufacturing firms resorted to reducing production (18% vs 12%) and manufacturing upon request (16% vs 11%), compared to total relevant sample size. Firms in the service sector also seemed to have more difficulty in taking advantage of online activities (13% vs M – 33% and T – 35%) compared to other sectors. On the other hand, firms in the trade sector appeared to be challenged in implementing partial operations (24% vs 40%), compared total relevant sample size. Although they were quite more advanced in diversifying operations instead (18% vs 10%). Export-oriented firms were also considerably more successful in executing work-from-home arrangements compared to domestic-oriented firms (64% vs 32%).
D.6 SHORTAGE OF INPUTS - This was identified as an issue for about 40% of non-operating firms allowed to operate
and around 25% of firms in full or partial operation. Firms had considered the ff options to address these challenges, based on % of responses:
• Seeking alternative sources (70.50%)
• Reduction of production (29.50%)
• Sell online / online transactions (28.06%) Compared to the other available options, a great majority of firms that experienced shortage of inputs had considered seeking alternative sources. This may indicate an opportunity to strengthen industry sectors
58.82%
50.98%
39.22%
28.43%
11.76%
10.78%
9.80%
0%20%40%60%80%100%
Reduced working / operating hours
Work-from-home arrangement
Went into partial operation (some sectionsare closed)
ONLINE *
reduced production capacity due to limitedworkers that can report to work *
we only manufacture when the customerresquested *
Diversified the operations to newproducts/processes
Figure 53: Changes Adopted by Operating Firms
Fully- and partially-operating Firms (102)
58.82%
50.98%
39.22%
28.43%
11.76%
10.78%
9.80%
0%20%40%60%80%100%
Reduced working / operating hours
Work-from-home arrangement
Went into partial operation (some sections areclosed)
ONLINE *
reduced production capacity due to limitedworkers that can report to work *
we only manufacture when the customerresquested *
Diversified the operations to newproducts/processes
Figure 54: Changes Adopted by Operating Firms According to Firm Size
Fully- and partially-operating Firms (102) Microfirms (52) Small Firms (31) Medium and Large Firms (19)
58.82%
50.98%
39.22%
28.43%
11.76%
10.78%
9.80%
0%20%40%60%80%100%
Reduced working / operating hours
Work-from-home arrangement
Went into partial operation (some sectionsare closed)
ONLINE *
reduced production capacity due to limitedworkers that can report to work *
we only manufacture when the customerresquested *
Diversified the operations to newproducts/processes
Figure 55: Changes Adopted by Operating Firms According to Sector
Fully- and partially-operating Firms (102) Manufacturing (61) Trade (17) Services (24)
58.82%
50.98%
39.22%
28.43%
11.76%
10.78%
9.80%
0%20%40%60%80%100%
Reduced working / operating hours
Work-from-home arrangement
Went into partial operation (some sections areclosed)
ONLINE *
reduced production capacity due to limitedworkers that can report to work *
we only manufacture when the customerresquested *
Diversified the operations to newproducts/processes
Figure 56: Changes Adopted by Operating Firms According to Client Orientation
Fully- and partially-operating Firms (102) Export-oriented Domestic-oriented
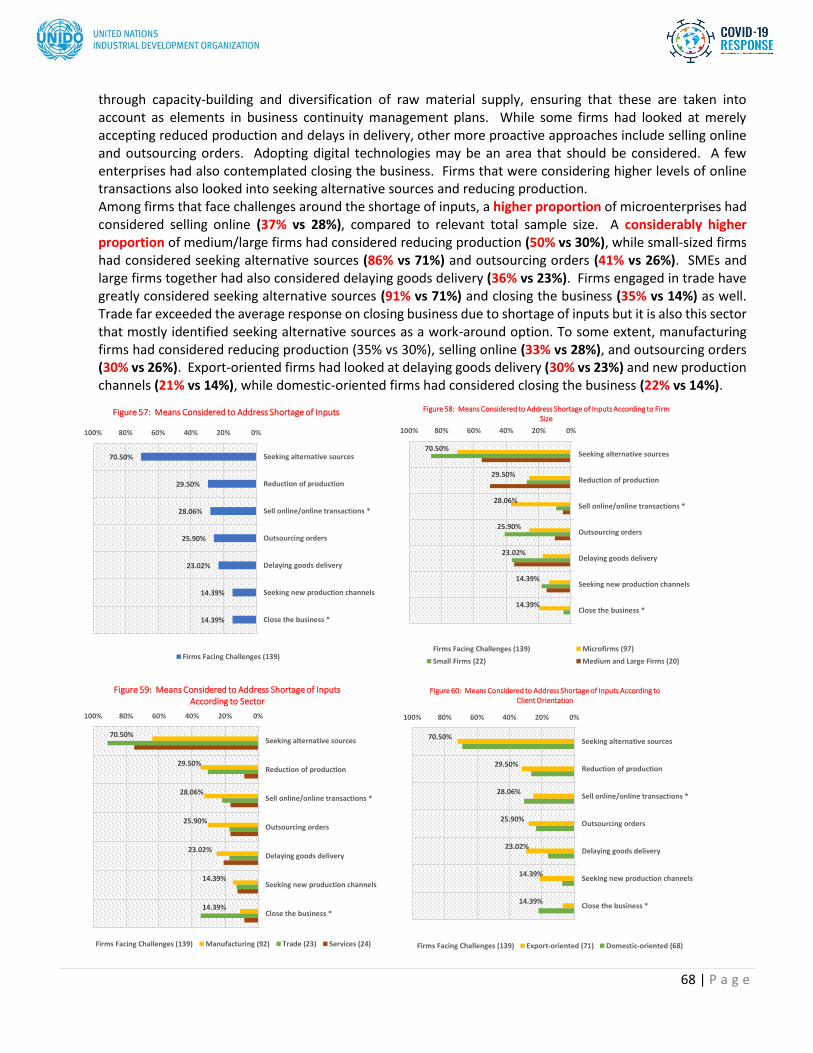
68 | P a g e
through capacity-building and diversification of raw material supply, ensuring that these are taken into account as elements in business continuity management plans. While some firms had looked at merely accepting reduced production and delays in delivery, other more proactive approaches include selling online and outsourcing orders. Adopting digital technologies may be an area that should be considered. A few enterprises had also contemplated closing the business. Firms that were considering higher levels of online transactions also looked into seeking alternative sources and reducing production. Among firms that face challenges around the shortage of inputs, a higher proportion of microenterprises had considered selling online (37% vs 28%), compared to relevant total sample size. A considerably higher proportion of medium/large firms had considered reducing production (50% vs 30%), while small-sized firms had considered seeking alternative sources (86% vs 71%) and outsourcing orders (41% vs 26%). SMEs and large firms together had also considered delaying goods delivery (36% vs 23%). Firms engaged in trade have greatly considered seeking alternative sources (91% vs 71%) and closing the business (35% vs 14%) as well. Trade far exceeded the average response on closing business due to shortage of inputs but it is also this sector that mostly identified seeking alternative sources as a work-around option. To some extent, manufacturing firms had considered reducing production (35% vs 30%), selling online (33% vs 28%), and outsourcing orders (30% vs 26%). Export-oriented firms had looked at delaying goods delivery (30% vs 23%) and new production channels (21% vs 14%), while domestic-oriented firms had considered closing the business (22% vs 14%).
70.50%
29.50%
28.06%
25.90%
23.02%
14.39%
14.39%
0%20%40%60%80%100%
Seeking alternative sources
Reduction of production
Sell online/online transactions *
Outsourcing orders
Delaying goods delivery
Seeking new production channels
Close the business *
Figure 57: Means Considered to Address Shortage of Inputs
Firms Facing Challenges (139)
70.50%
29.50%
28.06%
25.90%
23.02%
14.39%
14.39%
0%20%40%60%80%100%
Seeking alternative sources
Reduction of production
Sell online/online transactions *
Outsourcing orders
Delaying goods delivery
Seeking new production channels
Close the business *
Figure 58: Means Considered to Address Shortage of Inputs According to Firm Size
Firms Facing Challenges (139) Microfirms (97)
Small Firms (22) Medium and Large Firms (20)
70.50%
29.50%
28.06%
25.90%
23.02%
14.39%
14.39%
0%20%40%60%80%100%
Seeking alternative sources
Reduction of production
Sell online/online transactions *
Outsourcing orders
Delaying goods delivery
Seeking new production channels
Close the business *
Figure 59: Means Considered to Address Shortage of Inputs According to Sector
Firms Facing Challenges (139) Manufacturing (92) Trade (23) Services (24)
70.50%
29.50%
28.06%
25.90%
23.02%
14.39%
14.39%
0%20%40%60%80%100%
Seeking alternative sources
Reduction of production
Sell online/online transactions *
Outsourcing orders
Delaying goods delivery
Seeking new production channels
Close the business *
Figure 60: Means Considered to Address Shortage of Inputs According to Client Orientation
Firms Facing Challenges (139) Export-oriented (71) Domestic-oriented (68)
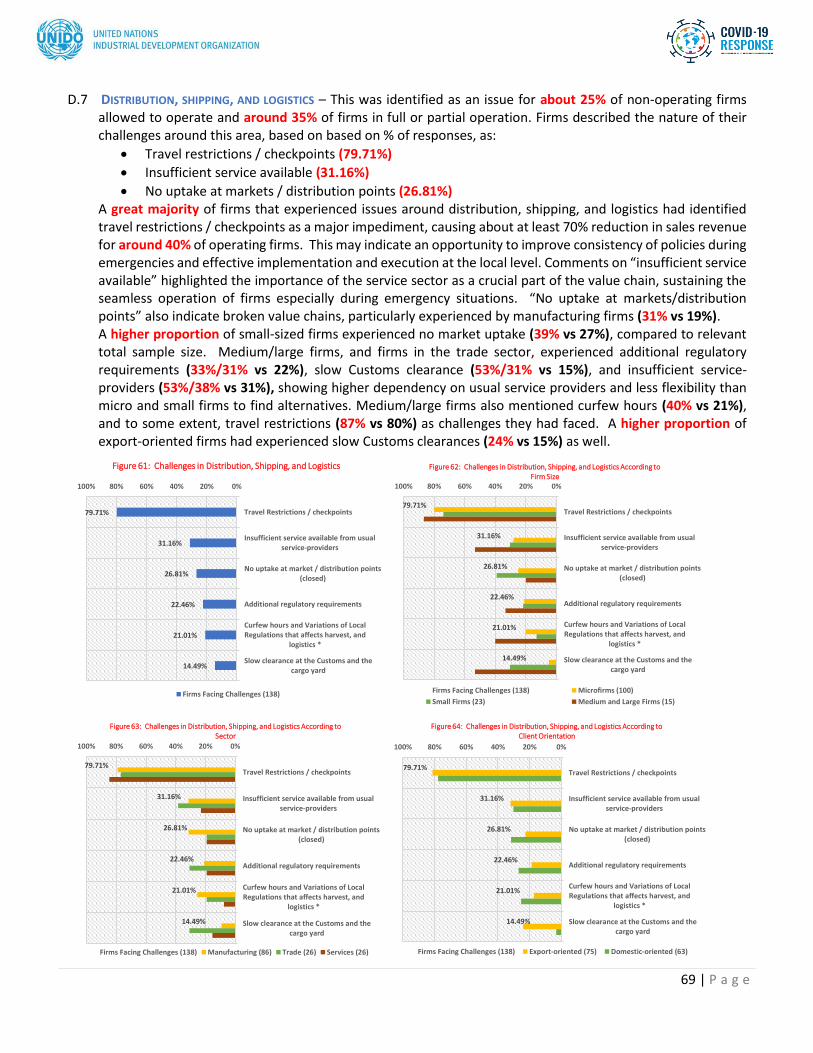
69 | P a g e
D.7 DISTRIBUTION, SHIPPING, AND LOGISTICS – This was identified as an issue for about 25% of non-operating firms allowed to operate and around 35% of firms in full or partial operation. Firms described the nature of their challenges around this area, based on based on % of responses, as:
• Travel restrictions / checkpoints (79.71%)
• Insufficient service available (31.16%)
• No uptake at markets / distribution points (26.81%) A great majority of firms that experienced issues around distribution, shipping, and logistics had identified travel restrictions / checkpoints as a major impediment, causing about at least 70% reduction in sales revenue for around 40% of operating firms. This may indicate an opportunity to improve consistency of policies during emergencies and effective implementation and execution at the local level. Comments on “insufficient service available” highlighted the importance of the service sector as a crucial part of the value chain, sustaining the seamless operation of firms especially during emergency situations. “No uptake at markets/distribution points” also indicate broken value chains, particularly experienced by manufacturing firms (31% vs 19%). A higher proportion of small-sized firms experienced no market uptake (39% vs 27%), compared to relevant total sample size. Medium/large firms, and firms in the trade sector, experienced additional regulatory requirements (33%/31% vs 22%), slow Customs clearance (53%/31% vs 15%), and insufficient service-providers (53%/38% vs 31%), showing higher dependency on usual service providers and less flexibility than micro and small firms to find alternatives. Medium/large firms also mentioned curfew hours (40% vs 21%), and to some extent, travel restrictions (87% vs 80%) as challenges they had faced. A higher proportion of export-oriented firms had experienced slow Customs clearances (24% vs 15%) as well.
79.71%
31.16%
26.81%
22.46%
21.01%
14.49%
0%20%40%60%80%100%
Travel Restrictions / checkpoints
Insufficient service available from usualservice-providers
No uptake at market / distribution points(closed)
Additional regulatory requirements
Curfew hours and Variations of LocalRegulations that affects harvest, and
logistics *
Slow clearance at the Customs and thecargo yard
Figure 61: Challenges in Distribution, Shipping, and Logistics
Firms Facing Challenges (138)
79.71%
31.16%
26.81%
22.46%
21.01%
14.49%
0%20%40%60%80%100%
Travel Restrictions / checkpoints
Insufficient service available from usualservice-providers
No uptake at market / distribution points(closed)
Additional regulatory requirements
Curfew hours and Variations of LocalRegulations that affects harvest, and
logistics *
Slow clearance at the Customs and thecargo yard
Figure 62: Challenges in Distribution, Shipping, and Logistics According to Firm Size
Firms Facing Challenges (138) Microfirms (100)
Small Firms (23) Medium and Large Firms (15)
79.71%
31.16%
26.81%
22.46%
21.01%
14.49%
0%20%40%60%80%100%
Travel Restrictions / checkpoints
Insufficient service available from usualservice-providers
No uptake at market / distribution points(closed)
Additional regulatory requirements
Curfew hours and Variations of LocalRegulations that affects harvest, and
logistics *
Slow clearance at the Customs and thecargo yard
Figure 63: Challenges in Distribution, Shipping, and Logistics According to Sector
Firms Facing Challenges (138) Manufacturing (86) Trade (26) Services (26)
79.71%
31.16%
26.81%
22.46%
21.01%
14.49%
0%20%40%60%80%100%
Travel Restrictions / checkpoints
Insufficient service available from usualservice-providers
No uptake at market / distribution points(closed)
Additional regulatory requirements
Curfew hours and Variations of LocalRegulations that affects harvest, and
logistics *
Slow clearance at the Customs and thecargo yard
Figure 64: Challenges in Distribution, Shipping, and Logistics According to Client Orientation
Firms Facing Challenges (138) Export-oriented (75) Domestic-oriented (63)

70 | P a g e
D.8 Top responses with regard to the means being considered by firms to address distribution, shipping, and logistics challenges, based on % of responses, include:
• Alternative service providers (43.44%)
• Wait for the lifting of quarantine (34.43%)
• Alternative markets (27.05%) Based on the responses, it looks like firms who experienced the lack of available services had considered seeking out alternative service providers and alternative markets while those that encountered travel restrictions and difficulties at checkpoints may be resigned to stop production once raw materials run out or wait for the time when quarantines will be lifted. These seemed to indicate some opportunities to strengthen elements of business continuity management as well as updating policies to promote the creation of new and alternative markets. Among firms facing distribution, shipping, and logistics challenges, a higher proportion of medium/large firms and firms in the trade sector, compared to relevant total sample size, had considered alternative service providers (50%/63% vs 43%) and requesting BOC to waive storage charges (35%/19% vs 11%). In contrast, a higher proportion of microenterprises and manufacturing firms had opted to just wait for the ECQ to be lifted (42%/45% vs 34%) with firms in the service sector waiting for the lifting of checkpoint restrictions, in particular (23% vs 11%). Domestic-oriented firms had mostly opted to also wait for the ECQ to be lifted (44% vs 34%), stopping operations when raw materials run out (33% vs 26%), with some still considering looking for alternative markets (38% vs 27%).
43.44%
34.43%
27.05%
26.23%
10.66%
10.66%
0%20%40%60%80%100%
Alternative service providers
Wait for the ECQ to be lifted *
Alternative markets
Stop production once raw materials andpackaging are consumed *
Waiting for provincial boundary checkpointrestrictions to be lifted *
BOC should waive storage charges as theyare the ones who delayed the process.*
Figure 65: Means Considered to Address Issues on Distribution, Shipping and Logistics
Firms Facing Challenges (122)
43.44%
34.43%
27.05%
26.23%
10.66%
10.66%
0%20%40%60%80%100%
Alternative service providers
Wait for the ECQ to be lifted *
Alternative markets
Stop production once raw materials andpackaging are consumed *
Waiting for provincial boundary checkpointrestrictions to be lifted *
BOC should waive these charges as they arethe ones who delayed the process. *
Figure 66: Means Considered to Address Issues on Distribution, Shipping, and Logistics According to Firm Size
Firms Facing Challenges (122) Microfirms (88) Small Firms (20) Medium and Large Firms (14)
43.44%
34.43%
27.05%
26.23%
10.66%
10.66%
0%20%40%60%80%100%
Alternative service providers
Wait for the ECQ to be lifted *
Alternative markets
Stop production once raw materials andpackaging are consumed *
Waiting for provincial boundary checkpointrestrictions to be lifted *
BOC should waive these charges as they arethe ones who delayed the process. *
Figure 67 Means Considered to Address Issues on Distribution, Shipping, and Logistics According to Sector
Firms Facing Challenges (122) Manufacturing (67) Trade (16) Services (39)
43.44%
34.43%
27.05%
26.23%
10.66%
10.66%
0%20%40%60%80%100%
Alternative service providers
Wait for the ECQ to be lifted *
Alternative markets
Stop production once raw materials andpackaging are consumed *
Waiting for provincial boundary checkpointrestrictions to be lifted *
BOC should waive these charges as they arethe ones who delayed the process. *
Figure 68: Means Considered to Address Issues on Distribution, Shipping and Logistics According to Client Orientation
Firms Facing Challenges (122) Export-oriented (67) Domestic-oriented (55)

71 | P a g e
D.9 LACK OF MANPOWER - This was identified as an issue for about 20% of non-operating firms allowed to operate and around 25% of firms in full or partial operation. Based on frequency of response, these were reported to have been due to:
• Lack of available transportation (69.90%)
• Fear to come to work (44.66%)
• Difficulty of social distancing at the workplace (24.27%) A majority of firms that experienced manpower concerns had attributed them to the lack of available transportation. While this is due to the containment measures adopted by government to restrict movement through mass transit, firms can be better prepared to execute alternative modalities and promoting affirmative action to ensure availability of their work force. Closely linked to this is the aspect on fear and uncertainty on the part of the employees in relation to the transmission of COVID-19. Both the public and private sectors can better manage this through adequate, appropriate, and efficient dissemination of science-based information regarding the health crisis as well clear action steps, at the national, local, and firm levels for confidence-building. Plans around the arrangement for employees to work remotely is important and these should be supported by appropriate digital infrastructure. Among firms that experience challenges in manpower, a higher proportion of small-sized and medium/large firms, compared to relevant total sample size, indicated lack of available transportation (78%/84% vs 70%), fear to come to work (53% vs 45%), and only skeletal force is allowed (44%/37% vs 19%) as the nature of their challenges. In general, the small and medium enterprises had more share of respondents than average who experienced issues around lack of manpower. In addition, small-sized firms also mentioned concerns around salaries (35% vs 22%) and critical employees attending to personal matters (26% vs 17%), while medium/large firms added the concern around not being able to execute work-from-home arrangements (26% vs 17%). Firms in the trade and service sectors also mentioned experiencing lack of transportation (79%/91% vs 70%), fear to come to work (64%/57% vs 45%), and difficulty in maintaining social distancing at the workplace (36% vs 24%). Work-from-home arrangements was a challenge for firms in the service sector (26% vs 17%), while domestic-oriented firms seemed to be struggling with concerns around salaries (30% vs 22%) as well.
69.90%
44.66%
24.27%
22.33%
19.42%
17.48%
16.50%
0%20%40%60%80%100%
Lack of available transportation
Fear to come to work
Difficulty to maintain social distancing at theworkplace
Company cannot sustain the monthly salaryof employees *
Only skeletal force is allowed
Critical employees are attending to personalmatters, caring for children / family
members
Employees are unable to execute work-from-home arrangements
Figure 69: Challenges on Lack of Manpower
Firms Facing Challenges (103)
69.90%
44.66%
24.27%
22.33%
19.42%
17.48%
16.50%
0%20%40%60%80%100%
Lack of available transportation
Fear to come to work
Difficulty to maintain social distancing at theworkplace
Company cannot sustain the monthly salaryof employees *
Only skeletal force is allowed
Critical employees are attending to personalmatters, caring for children / family…
Employees are unable to execute work-from-home arrangements
Figure 70: Challenges on Lack of Manpoer According to Firm Size
Firms Facing Challenges (103) Microfirms (61)
Small Firms (23) Medium and Large (19)

72 | P a g e
D.10 Attempting to address the challenges around lack of manpower, respondents provided the ff. responses
describing the actions they were considering, based on frequency of response:
• Accept decrease in sales (40.86%)
• Delays in delivery (32.26%)
• Additional measures to workplace safety (27.96%) The data appeared to indicate that most firms that have experienced issues around manpower believe that they no longer have a strong handle on this specific situation and have resigned to accepting sales cuts and delays in deliveries that will affect their operations. A few were still willing to look at ways they can work around the situation by implementing additional safety measures for employees, outsourcing of orders, and wage increases. Some firms have stepped up their staff housing provisions. Among firms that experienced manpower challenges, a higher proportion of medium/large firms and firms from the service sector, compared to relevant total sample size, proactively considered providing staff housing (32%/25% vs 16%) and additional workplace safety measures (68%/50% vs 28%). Taking a more passive approach, microenterprises and firms from the trade sector opted to just accept the decrease in sales (55% vs 41%) while small-sized firms accepted delays in delivery (50% vs 32%). Firms in the service sector did consider using advanced equipment to reduce the amount of work (40% vs 18%) while those from the trade sector considered outsourcing order (27% vs 15%). A higher proportion of medium/large firms (68% vs 28%), firms in the service sector (50% vs 28%), and export-oriented firms (40% vs 28%) considered looking at increasing workplace safety.
69.90%
44.66%
24.27%
22.33%
19.42%
17.48%
16.50%
0%20%40%60%80%100%
Lack of available transportation
Fear to come to work
Difficulty to maintain social distancing atthe workplace
Company cannot sustain the monthlysalary of employees *
Only skeletal force is allowed
Critical employees are attending topersonal matters, caring for children /
family members
Employees are unable to execute work-from-home arrangements
Figure 71: Challenges on Lack of Manpower According to Sector
Firms Facing Challenges (103) Manufacturing (66) Trade (14) Services (23)
69.90%
44.66%
24.27%
22.33%
19.42%
17.48%
16.50%
0%20%40%60%80%100%
Lack of available transportation
Fear to come to work
Difficulty to maintain social distancing atthe workplace
Company cannot sustain the monthlysalary of employees *
Only skeletal force is allowed
Critical employees are attending topersonal matters, caring for children /
family members
Employees are unable to execute work-from-home arrangements
Figure 72: Challenges on Lack of Manpower According to Client Orientation
Firms Facin g Challenges (103) Export-oriented (63) Domestic-oriented (40)
40.86%
32.26%
27.96%
18.28%
16.13%
15.05%
8.60%
0%20%40%60%80%100%
Decrease in Sales *
Delays in delivery
Additional measures on workplace safety toprevent infection *
Use of advanced equipment or software toreduce the amount of work
Staff housing *
Outsourcing of orders
Wage increases
Figure 73: Means Considered to Address Lack of Manpower
Firms Facing Challenges (93)
40.86%
32.26%
27.96%
18.28%
16.13%
15.05%
8.60%
0%20%40%60%80%100%
Decrease in Sales *
Delays in delivery
Additional measures on workplace safetyto prevent infection *
Use of advanced equipment or software toreduce the amount of work
Staff housing *
Outsourcing of orders
Wage increases
Figure 74: Means Considered to Address Lack of Manpower According to Firm Size
Firms Facing Challenges (93) Microfirms (56) Small Firms (18) Medium and Large Firms (19)

73 | P a g e
EFFECTS ON BUSINES OPERATIONS D.11 Compared to February 2020, about 70% of all fully- and partially-operating firms reduced their operating
hours in March/April to a certain degree, some more severe than others. A third of the operating firms did not reduce their operating hours while about half had reduced operating hours by at least 40%. Data also indicated that a slightly higher proportion of manufacturing firms (23% vs 18%) and export-oriented firms (22% vs 18%) reduced operations by at least 70% compared to relevant total sample size. More severe reductions in operating time was observed in medium/large firms, manufacturing and service sector firms. This can be further correlated with information regarding loss in employment and reduction in revenue and production volume.
40.86%
32.26%
27.96%
18.28%
16.13%
15.05%
8.60%
0%20%40%60%80%100%
Decrease in Sales *
Delays in delivery
Additional measures on workplace safety toprevent infection *
Use of advanced equipment or software toreduce the amount of work
Staff housing *
Outsourcing of orders
Wage increases
Figure 75: Means Considered to Address Lack of Manpower Accoprding t0 Sector
Firms Facing Challenges (93) Manufacturing (62) Trade (11) Services (20)
40.86%
32.26%
27.96%
18.28%
16.13%
15.05%
8.60%
0%20%40%60%80%100%
Decrease in Sales *
Delays in delivery
Additional measures on workplace safety toprevent infection. *
Use of advanced equipment or software toreduce the amount of work
Staff housing *
Outsourcing of orders
Wage increases
Figure 76: Means Considered to Address Lack of Manpower According Client Orientation
Firms Facin g Challenges (93) Export-oriented (55) Domestic-oriented (38)
0.00%
17.65% 29.41% 20.59% 32.35%
0% 10% 20% 30% 40% 50% 60% 70% 80% 90% 100%
All
Op
erat
ing
Firm
s (1
02)
Figure 77: Reduction in Operating Hours (March/April vs February 2020)
100% reduction reduction of 70% up to less than 100% reduction of 40% up to less than 70% reduction more than 0% up to 40% no reduction
0.00% 0.00% 0.00% 0.00%
17.65% 15.38% 16.13%26.32%
29.41% 30.77%38.71%
10.53%
20.59%17.31%
12.90%42.11%
32.35% 36.54% 32.26%21.05%
0%
10%
20%
30%
40%
50%
60%
70%
80%
90%
100%
Operating Firms (102) Microfirms (52) Small Firms (31) Medium and LargeFirms (19)
Figure 78: Reduction in Operating Hours vs Firm Size
100% reduction reduction of 70% up to less than 100%reduction of 40% up to less than 70% reduction more than 0% up to 40%no reduction

74 | P a g e
D.12 Three-quarters of firms experienced reduced revenues in March/April compared to February 2020 while
four-fifths experienced reduced production. Around 65% reported at least 60% reduction in both revenue and production with about a third experiencing 70 % up to less than 100% reduction in both areas. Looking at those firms that indicated having cash flow challenges, a slightly higher proportion of them reported reduction in revenue of at least 40% (61% vs 58%), and a lower proportion reporting reduction of lower than 40% (22% vs 39%), compared to firms that did not mention cash flow issues.
D.13 Among operating firms, a higher proportion of medium and large firms was able to keep their reduction in
revenue (70% vs 57%) and reduction in production volume (70% vs 55%) up to 70%, compared to relevant sample. In this regard, the manufacturing sector has suffered the most, with only 50% able to achieve the same feats. Export-oriented firms performed relatively better (60% vs 54%).
0.00% 0.00% 0.00% 0.00%
17.65%22.95%
5.88% 12.50%
29.41%24.59%
29.41%
41.67%
20.59% 22.95%
17.65%
16.67%
32.35% 29.51%
47.06%
29.17%
0%
10%
20%
30%
40%
50%
60%
70%
80%
90%
100%
Operating Firms (102) Manufacturing (61) Trade (17) Services (24)
Figure 79: Reduction in Operating Hours vs Sector
100% reduction reduction of 70% up to less than 100%reduction of 40% up to less than 70% reduction more than 0% up to 40%no reduction
0.00% 0.00% 0.00%
17.65%21.31%
12.20%
29.41% 27.87%31.71%
20.59%21.31%
19.51%
32.35% 29.51% 36.59%
0%
10%
20%
30%
40%
50%
60%
70%
80%
90%
100%
Operating Firms (102) export-oriented (61) domestic-oriented (41)
Figure 80: Reduction in Operating Hours vs Client Orientation
100% reduction reduction of 70% up to less than 100%reduction of 40% up to less than 70% reduction more than 0% up to 40%no reduction
6.86%
9.80%
36.27%
36.27%
22.55%
20.59%
9.80%
11.76%
24.51%
21.57%
0% 10% 20% 30% 40% 50% 60% 70% 80% 90% 100%
Rev
en
ue
Pro
du
ctio
n
Figure 81: Reduction in Revenue and Production Volume (March/April vs February 2020)
100% reduction reduction of 70% up to less than 100% reduction of 40% up to less than 70%
reduction more than 0% up to 40% no reduction

75 | P a g e
6.86% 5.77% 9.68% 5.26%
36.27% 34.62%
45.16%
26.32%
22.55% 25.00%
16.13%
26.32%
9.80% 7.69%6.45%
21.05%
24.51% 26.92% 22.58% 21.05%
0%
10%
20%
30%
40%
50%
60%
70%
80%
90%
100%
Operating Firms(102)
Microfirms (52) Small Firms (31) Medium and LargeFirms (19)
Figure 82: Reduction in Revenue vs Firm Size
100% reduction reduction of 70% up to less than 100%
reduction of 40% up to less than 70% reduction more than 0% up to 40%
no reduction
9.80% 7.69%12.90% 10.53%
36.27% 36.54%
45.16%
21.05%
20.59%19.23%
16.13%
31.58%
11.76%7.69%
12.90%
21.05%
21.57%28.85%
12.90% 15.79%
0%
10%
20%
30%
40%
50%
60%
70%
80%
90%
100%
Operating Firms(102)
Microfirms (52) Small Firms (31) Medium and LargeFirms (19)
Figure 83: Reduction in Production Volume vs Firm Size
100% reduction reduction of 70% up to less than 100%
reduction of 40% up to less than 70% reduction more than 0% up to 40%
no reduction
6.86% 6.56% 5.88% 8.33%
36.27%42.62%
29.41% 25.00%
22.55%19.67%
29.41%25.00%
9.80% 8.20% 17.65%
8.33%
24.51% 22.95%17.65%
33.33%
0%
10%
20%
30%
40%
50%
60%
70%
80%
90%
100%
Operating Firms(102)
Manufacturing (61) Trade (17) Services (24)
Figure 84: Reduction in Revenue vs Sector
100% reduction reduction of 70% up to less than 100%
reduction of 40% up to less than 70% reduction more than 0% up to 40%
no reduction
9.80% 11.48%5.88% 8.33%
36.27%39.34%
29.41%33.33%
20.59%19.67%
35.29%12.50%
11.76%11.48%
5.88%
16.67%
21.57% 18.03%23.53%
29.17%
0%
10%
20%
30%
40%
50%
60%
70%
80%
90%
100%
Operating Firms(102)
Manufacturing (61) Trade (17) Services (24)
Figure 85: Reduction in Production Volume vs Sector
100% reduction reduction of 70% up to less than 100%
reduction of 40% up to less than 70% reduction more than 0% up to 40%
no reduction
6.86% 4.92%9.76%
36.27% 36.07%36.59%
22.55% 22.95%21.95%
9.80% 13.11% 4.88%
24.51% 22.95% 26.83%
0%
10%
20%
30%
40%
50%
60%
70%
80%
90%
100%
Operating Firms (102) export-oriented (61) domestic-oriented (41)
Figure 86: Reduction in Revenue vs Client Orientation
100% reduction reduction of 70% up to less than 100%
reduction of 40% up to less than 70% reduction more than 0% up to less than 40%
No Reduction
9.80% 8.20% 12.20%
36.27% 32.79%41.46%
20.59%26.23%
12.20%
11.76% 14.75% 7.32%
21.57%18.03%
26.83%
0%
10%
20%
30%
40%
50%
60%
70%
80%
90%
100%
Operating Firms (102) export-oriented (61) domestic-oriented (41)
Figure 87: Reduction in Production Volume vs Client Orientation
100% reduction reduction of 70% up to less than 100%
reduction of 40% up to less than 70% reduction more than 0% up to less than 40%
No Reduction

76 | P a g e
D.14 About 55% of all firms experienced a reduction in employment in March/April compared to February 2020. Nearly half of non-operating firms reported a reduction in employment of at least 40% with nearly a third reporting 100% reduction. About a quarter of those that are fully/partially-operating experienced a reduction of more than 70%. This opens up possible opportunities to look at adopting advanced digital and disruptive technologies to support and complement the workforce particularly for labor-intensive firms. In rough terms, it looks like a 40% reduction in operating hours for fully- and partially-operating firms resulted in loss of 50% of employment, and 60% reduction in revenue and production volume.
D.15 Among operating firms, a considerably higher proportion of medium and large firms and firms in the trade
sector were able to keep employment reduction to only 70% compared to relevant sample (95% vs 78%). Only about 70% of microenterprises and firms in the manufacturing sector that were operating was able to achieve the same feat. For non-operating firms, a higher proportion of SMEs and large firms (70% to 80% vs 55%) was able to keep employment reduction to only 70% compared to relevant sample. Only about 50% of non-operating microenterprises and around 40% of non-operating firms in trade was able to do the same.
2.94%
30.83%
20.59%
13.53%
19.61%
3.76%
12.75%
8.27%
44.12%
43.61%
0% 10% 20% 30% 40% 50% 60% 70% 80% 90% 100%
Op
erat
ing
Firm
s(1
02)
No
n-o
per
atin
g Fi
rms
(133
)
Figure 88: Reduction in Employment (March/April vs February 2020)
100% reduction reduction of 70% up to less than 100% reduction of 40% up to less than 70%
reduction more than 0% up to less than 40% no reduction
2.94% 0.00%9.68%
0.00%
20.59% 28.85%16.13%
5.26%
19.61%17.31%
16.13%
31.58%
12.75% 7.69% 12.90% 26.32%
44.12% 46.15% 45.16%36.84%
0%
10%
20%
30%
40%
50%
60%
70%
80%
90%
100%
Operating Firms(102)
Microfirms (52) Small Firms (31) Medium and LargeFirms (19)
Figure 89: Reduction in Employment of Operating Firms vs Firm Size
100% reduction reduction of 70% up to less than 100%
reduction of 40% up to less than 70% reduction more than 0% up to 40%
no reduction
30.83% 33.94%23.53%
0.00%
13.53%14.68%
0.00%
28.57%
3.76%1.83%
17.65%0.00%
8.27% 5.50% 23.53%
14.29%
43.61% 44.04%35.29%
57.14%
0%
10%
20%
30%
40%
50%
60%
70%
80%
90%
100%
Non-operating Firms(133)
Microfirms (109) Small Firms (17) Medium and Large(7)
Figure 90: Reduction in Employment of Non-operating Firms vs Firm Size
100% reduction reduction of 70% up to less than 100%
reduction of 40% up to less than 70% reduction more than 0% up to 40%
no reduction

77 | P a g e
D.16 Overall, about 65% of respondent firms reported no losses in women employment in March/April compared
to February 2020 while about 10% reported that losses in employment were all women employees. Microenterprises reflected the highest proportion of firms at 12% with employment losses being all women. Among firms reporting no loss in women employment, around 40% did experience losses in total employment. About 7% reported 100% women employees by the end of 2019 while roughly 10% confirmed full-time status of all women employees. At the other end, 9% shared that they do not have women employees and around 15% do not have full-time women employees.
Figure 93: Women Employment
2.94% 1.64% 0.00%8.33%
20.59% 26.23%
5.88%
16.67%
19.61%19.67%
29.41%
12.50%
12.75%14.75%
5.88%12.50%
44.12%37.70%
58.82%50.00%
0%
10%
20%
30%
40%
50%
60%
70%
80%
90%
100%
Operating Firms(102)
Manufacturing Trade Services
Figure 91: Reduction in Employment of Operating Firms vs Sector
100% reduction reduction of 70% up to less than 100%
reduction of 40% up to less than 70% reduction more than 0% up to 40%
no reduction
30.83%24.29%
50.00%
30.77%
13.53%14.29%
12.50%
12.82%
3.76%7.14%
0.00%
0.00%
8.27% 10.00%
8.33%
5.13%
43.61% 44.29%
29.17%
51.28%
0%
10%
20%
30%
40%
50%
60%
70%
80%
90%
100%
Non-operating Firms(133)
Manufacturing (70) Trade (24) Services (39)
Figure 92: Reduction in Employment of Non-operating Firms vs Sector
100% reduction reduction of 70% up to less than 100%
reduction of 40% up to less than 70% reduction more than 0% up to 40%
no reduction

78 | P a g e
D.17 Among firms that experienced reduction in employment, about 75% expressed their intention to rehire staff, with around 80% of microenterprises stating the same. Factors firms were considering in decision-making include (1) skills that will be required; (2) working capital contraints; (3) uncertainty in the new normal; (4) humanitarian reasons

79 | P a g e
ANNEX E – Support for MSME Recovery: Data and Charts
List of Figures for Annex E Chart Title Page
Figure 94 Perception of New Normal 82
Figure 95 Perception of New Normal According to Firm Size 82
Figure 96 Perception of New Normal According to Sector 82
Figure 97 Perception of New Normal According to Age 82
Figure 98 Perception of New Normal According to Gender 83
Figure 99 Biggest Challenges in Maintaining/Restarting 83
Figure 100 Biggest Challenges in Maintaining/Restarting According to Firm Size 83
Figure 101 Biggest Challenges in Maintaining/Restarting According to Sector 84
Figure 102 Biggest Challenges in Maintaining/Restarting According to Client Orientation 84
Figure 103 Nature of Cash flow Challenges during Recovery 84
Figure 104 Nature of Cash flow Challenges during Recovery According to Firm Size 84
Figure 105 Nature of Cash flow Challenges during Recovery According to Sector 85
Figure 106 Nature of Cash flow Challenges during Recovery According to Client Orientation 85
Figure 107 Means to Address Cashflow Challenges 85
Figure 108 Means to Address Cashflow Challenges According to Firm Size 85
Figure 109 Means to Address Cashflow Challenges According to Sector 86
Figure 110 Means to Address Cashflow Challenges According to Client Orientation 86
Figure 111 Amount Needed to Maintain/ Restart According to Firm Size 86
Figure 112 Amount Needed to Maintain/ Restart According to Sector 86
Figure 113 Amount Needed to Maintain/ Restart According to Client Orientation 86
Figure 114 Loan Application for Past 2 Years According to Firm Size 87
Figure 115 Loan Application for Past 2 Years According to Sector 87
Figure 116 Loan Application for Past 2 Years According to Age 87
Figure 117 Loan Application for Past 2 Years According to Gender 87
Figure 118 Loan Application for Past 2 Years According to Educational Attainment 87
Figure 119 Loan Application for Past 2 Years According to Years of Operation 87
Figure 120 Proportion of Respondents with BCPs 88
Figure 121 Challenges in Implementing BCPS 88
Figure 122 Challenges in Implementing BCPS According to Firm Size 88
Figure 123 Challenges in Implementing BCPS According to Sector 89
Figure 124 Challenges in Implementing BCPS According to Client Orientation 89
Figure 125 Challenges in Preparing BCP According 89
Figure 126 Challenges in Preparing BCP According to Firm Size 89
Figure 127 Challenges in Preparing BCP According to Sector 90
Figure 128 Challenges in Preparing BCP According to Client Orientation 90
Figure 129 Support Needed in Relation to Market and Business Environment According 91

80 | P a g e
Figure 130 Support Needed in Relation to Market and Business Environment According to
Firm Size
91
Figure 131 Support Needed in Relation to Market and Business Environment According to
Sector
91
Figure 132 Support Needed in Relation to Market and Business Environment According to
Client Orientation
91
Figure 133 Support Needed in Relation to Human Resources and Compensation 92
Figure 134 Support Needed in Relation to Human Resources and Compensation According
to Firm Size
92
Figure 135 Support Needed in Relation to Human Resources and Compensation According
to Sector
92
Figure 136 Support Needed in Relation to Human Resources and Compensation According
to Client Orientation
92
Figure 137 Support Needed in Relation to Financial Aspects 93
Figure 138 Support Needed in Relation to Financial Aspects According to Firm Size 93
Figure 139 Support Needed in Relation to Financial Aspects According to Sector 93
Figure 140 Support Needed in Relation to Financial Aspects According to Client Orientation 93
Figure 141 Interest in Adopting Relevant Standards and Technology Solutions 94
Figure 142 Interest in Adopting Relevant Standards and Technology Solutions According to
Firm Size
94
Figure 143 Interest in Adopting Relevant Standards and Technology Solutions According to
Sector
94
Figure 144 Interest in Adopting Relevant Standards and Technology Solutions According to
Client Orientation
94
Figure 145 Interest in Adopting Relevant Standards and Technology Solutions According to
Gender
95
Figure 146 Interest in Adopting Relevant Standards and Technology Solutions According to
Educational Attainment
95
Figure 147 Interest in Adopting Relevant Standards and Technology Solutions According to
Years of Operation
95
Figure 148 Interest in Adopting Relevant Standards and Technology Solutions According to
Age
95
Figure 149 Interest in Adopting Relevant Standards and Technology Solutions According vs.
Amount Needed to Maintain/ Restart Business
95
Figure 150 Willingness to Diversify Operations According to Firm Size 96
Figure 151 Willingness to Diversify Operations According to Sector 96
Figure 152 Willingness to Diversify Operations According to Client Orientation 96
Figure 153 Willingness to Diversify Operations According to Age 96
Figure 154 Willingness to Diversify Operations According to Years of Operation 96
Figure 155 Willingness to Diversify Operations According to Gender 96

81 | P a g e
Figure 156 Willingness to Diversify Operations According to Educational Attainment 97
Figure 157 Efforts to Diversify 97
Figure 158 Efforts to Diversify According to Firm Size 97
Figure 159 Efforts to Diversify According to Sector 98
Figure 160 Efforts to Diversify According to Client Orientation 98

82 | P a g e
PERCEPTION OF THE NEW NORMAL E.1 The top responses on the “new normal” as perceived by respondents, based on % of responses, included:
• There will be changes in marketing activities (e-commerce) (64.26%).
• There will be changes in operations and processes (inventory, distribution, etc.) (54.47%).
• There will be new business regulations (47.66%). Among the respondents, more micro- and small enterprises as well as firms with female owners believed that new marketing activities (e-commerce) will be part of the new normal. From a sectorial perspective, more firms engaged in trade had provided this comment. More traders, large firms, and firms with male owners believed that there will be changes in operations and processes in the new normal. To some degree, more small firms also carried this same belief. While there was no clear discrimination in responses among various age groups, trend seemed to indicate that more firms with owners above the age of 50 believed that there will be new business regulations while those younger were prone to comment more on the aspect of new marketing approaches (e-commerce).
64.26%
54.47%
47.66%
47.23%
41.28%
35.32%
29.36%
0%20%40%60%80%100%
There will be changes in marketingactivities (e-commerce).
There will be changes in operations andprocesses (inventory, distribution, etc.).
There will be new business regulations.
There will be changes in product lines andservices.
There will be change in sales strategiesfrom being conventional or traditional…
New areas we need to cover to reach ourtarget market in select community *
There will be changes in manufacturingprocesses (digitalization, new…
Figure 94: Perception of New Normal
All Firms (235)
64.26%
54.47%
47.66%
47.23%
41.28%
35.32%
29.36%
0%10%20%30%40%50%60%70%80%90%100%
There will be changes in marketing activities(e-commerce).
There will be changes in operations andprocesses (inventory, distribution, etc.).
There will be new business regulations.
There will be changes in product lines andservices.
There will be change in sales strategies frombeing conventional or traditional form of…
New areas we need to cover to reach ourtarget market in select community *
There will be changes in manufacturingprocesses (digitalization, new…
Figure 95: Perception of New Normal According to Firm Size
All Firms (235) Microfirms (161)
Small Firms (48) Medium and Large Firms 926)
64.26%
54.47%
47.66%
47.23%
41.28%
35.32%
29.36%
0%20%40%60%80%100%
There will be changes in marketingactivities (e-commerce).
There will be changes in operations andprocesses (inventory, distribution, etc.).
There will be new business regulations.
There will be changes in product lines andservices.
There will be change in sales strategiesfrom being conventional or traditional…
New areas we need to cover to reach ourtarget market in select community *
There will be changes in manufacturingprocesses (digitalization, new…
Figure 96: Perception of New Normal According to Sector
All Firms (235) Manufacturing (131) Trade (41) Services (63)
64.26%
54.47%
0.476596
47.23%
41.28%
35.32%
29.36%
0%20%40%60%80%100%
There will be changes in marketing activities(e-commerce).
There will be changes in operations andprocesses (inventory, distribution, etc.).
There will be new business regulations.
There will be changes in product lines andservices.
There will be change in sales strategies frombeing conventional or traditional form of…
New areas we need to cover to reach ourtarget market in select community
There will be changes in manufacturingprocesses (digitalization, new technologies,…
Figure 97: Perceptioon of New Normal According to Age
All (235) 35 years and Below (94)
More than 35 years to 50 years (68) Above 50 years (73)

83 | P a g e
Biggest Challenges During Recovery
E.2 Top choices with regard to the biggest challenges firms were expecting to face in maintaining / re-starting
business operations, based on % of responses, included:
• Cash flow (76.60%)
• Health and safety of workers (54.04%)
• Decline in domestic demand / customers (44.26%)
A great majority of firms expressed that the biggest concern toward recovery was cash flow. This may have been brought about by the experiences firms had during the quarantine period where both non-operating and operating firms encountered cash flow issues. Closely related to this were the comments on “decline in domestic demand and customers” and “higher production cost”. It seemed like access to new markets and diversification may be worth pursuing during the recovery stage. The comment on “disruption in production, supply chains and networks” may also have been influenced by issues along the lines of broken supply chains experienced during the quarantine period. Concerns about the health and safety of workers indicated that firms recognized the value of the work force moving forward to recovery. A higher proportion of small-sized and medium/large firms indicated that some of the biggest challenges they will be facing during recovery, compared to the total sample size, were the health and safety of worker (66% vs 54%) and decline in domestic demands (54%/50% vs 45%). Medium/large firms also recognized that higher production costs (46% vs 30%) as well as disruptions in production and supply chains (62% vs 40%) may likewise be impediments. Firms from the trade sector mentioned supply chain concerns (51% vs 40%) while those from the service sector indicated health and safety of workers (65% vs 54%) and the remaining quarantine restrictions that may still persist (48% vs 34%).
64.26%
54.47%
47.66%
47.23%
47.23%
35.32%
29.36%
0%20%40%60%80%100%
There will be changes in marketing activities (e-…
There will be changes in operations and…
There will be new business regulations.
There will be changes in product lines and…
There will be changes in product lines and…
New areas we need to cover to reach our target…
There will be changes in manufacturing…
Figure 98: Perception of New Normal According to Gender
All (235) Male (113) Female (112) LGBTQI+ (1) Prefer not to disclose (9)
76.60%
54.04%
44.26%
39.57%
34.89%
34.47%
29.79%
0%20%40%60%80%100%
Cash flow
Health and safety of workers
Decline in domestic demand /customers
Disruption in production, supply chains,and networks
How to find another starting capital *
Other remaining restrictions under themodified community quarantine
Higher production cost
Figure 99: Biggest Challenges in Maintaining/Restarting
All Firms (235)
76.60%
54.04%
44.26%
39.57%
34.89%
34.47%
29.79%
0%20%40%60%80%100%
Cash flow (e.g. working capital, salaries, loanpayments, tax obligations, etc.)
Health and safety of workers
Decline in domestic demand / customers
Disruption in production, supply chains, andnetworks
How to find another starting capital *
Other remaining restrictions under the modifiedcommunity quarantine
Higher production cost
Figure 100: Biggest Challenges in Maintaining/Restarting According to Firm Size
All Firms (235) Microfirms (161) Small Firms (48) Medium and Large Firms (26)

84 | P a g e
E.3 Firms considered the following as the nature of their cash flow concerns, based on % of responses:
• Working capital (79.91%)
• Tax obligations (51.40%)
• Loan payments (bank) (50.47%)
Compared to the other responses, a great majority of firms considered working capital as the nature of their cash flow concerns during recovery. Looks like this will be used to support purchases related to raw materials and supplies on top of the other expenses incurred during operation. Among these other expenses, tax obligations loan payments, SSS and other contributions seem to be urgent concerns as well. Relaxation of these commitments may be useful to help these firms recover better. It also appeared that there were quite a number of existing loans that require paying-off, indicating to some extent the firms’ level of credit-worthiness. While not top-of-mind, salaries also came up as one of the significant choices for cash flow concerns, once again indicating the recognition of the important role the work force will play during recovery. A higher proportion of small-sized firms and medium/large firms, compared to relevant total sample size, indicated that salaries (61%/68% vs 43%) will be one of their cashflow concerns. Firms in the trade sector also mentioned tax obligations (68% vs 51%) while small firms indicated SSS and other contributions (57% vs 42%).
76.60%
54.04%
44.26%
39.57%
34.89%
34.47%
29.79%
0%20%40%60%80%100%
Cash flow (e.g. working capital, salaries,loan payments, tax obligations, etc.)
Health and safety of workers
Decline in domestic demand / customers
Disruption in production, supply chains,and networks;Health and safety of…
How to find another starting capital *
Other remaining restrictions under themodified community quarantine
Higher production cost
Figure 101: Biggest Challenges in Maintaining/Restarting According to Sector
All Firms (235) Manufacturing (131) Trade (41) Services (63)
76.60%
54.04%
44.26%
39.57%
34.89%
34.47%
29.79%
0%20%40%60%80%100%
Cash flow (e.g. working capital, salaries,loan payments, tax obligations, etc.)
Health and safety of workers
Decline in domestic demand / customers
Disruption in production, supply chains,and networks
How to find another starting capital *
Other remaining restrictions under themodified community quarantine
Higher production cost
Figure 102: Biggest Challenges in Maintaining/Restarting According to Client Orientation
All Firms (235) Export-oriented (122) Domestic-oriented (113)
79.91%
51.40%
50.47%
43.46%
42.06%
30.84%
22.43%
0%20%40%60%80%100%
Working capital
Tax obligations
Loan payments (bank)
Salaries
SSS and other contributions
Loan payments (non-bank)
utilities *
Figure 103: Nature of Cash flow Challenges during Recovery
Firms expecting Cash flow Challenges during Recovery (214)
79.91%
51.40%
50.47%
43.46%
42.06%
30.84%
22.43%
0%20%40%60%80%100%
Working capital
Tax obligations
Loan payments (bank)
Salaries
SSS and other contributions
Loan payments (non-bank)
utilities *
Figure 104: Nature of Cash flow Challenges during Recovery According to Firm Size
Firms Expecting Cashflow Concerns (214) Microfirms (151)
Small Firms (44) Medium and Large Firms (19)

85 | P a g e
E.4 Top options being considered by firms to address cash flow concerns, based on % of responses, included:
• Loans from government financial institutions (54.07%)
• Subsidy for MSME (40.57%)
• DTI loans, DOST loans for machineries (34.45%)
About half of the firms expecting cash flow concerns during recovery were considering taking loans from government financial institutions. Some firms were also looking to approach other facilities for loans such as micro-finance companies, commercial and rural banks, government agencies (DTI and DOST), and non-bank sources. Among firms that indicated that they were considering taking out loans to address cash flow concerns, about 65% of firms indicated they were for working capital, about 40% for loan payments, and 40% as well for tax obligations. This can possibly create the opportunity for financing institutions to promote resilience and building back better by injecting sustainability elements as requirements to determine whether a project is bankable. Firms can also be assisted in developing these project proposals including BCPs that will fit into their plans in relation to diversification, market access, standards and technology solutions. A good portion of firms were considering asking for subsidies particularly for MSMEs. Compared to relevant total sample size, a higher proportion of small-sized firms and medium/large firms were considering taking loans from commercial banks (38%/45% vs 23%) and reducing operating costs (31%/50% vs 20%). Microenterprises and manufacturing firms were interested in looking at accessing support through subsidies (51% vs 41%). Firms from the trade sector, in particular, were considering creating new demand (33% vs 22%) and taking loans from government financing institutions (61% vs 54%), micro-financing institutions (42% vs 24%), and commercial banks (36% vs 23%).
79.91%
51.40%
50.47%
43.46%
42.06%
30.84%
22.43%
0%20%40%60%80%100%
Working capital
Tax obligations
Loan payments (bank)
Salaries
SSS and other contributions
Loan payments (non-bank)
utilities *
Figure 105: Firms expecting Cash flow Challenges during Recovery According to Sector
Firms Expecting Cashflow Concerns (214) Manufacturing (128) Trade (38) Services (63)
79.91%
51.40%
50.47%
43.46%
42.06%
30.84%
22.43%
0%20%40%60%80%100%
Working capital
Tax obligations
Loan payments (bank)
Salaries
SSS and other contributions
Loan payments (non-bank)
utilities *
Figure 106: Firms expecting Cash flow Challenges during Recovery According to Client Orientation
Firms Expecting Cashflow Concerns (214) Export-oriented (107) Domestic-oriented (107)
54.07%
40.67%
34.45%
23.92%
22.97%
21.53%
21.05%
20.10%
0%10%20%30%40%50%60%70%80%90%100%
Loans from government financialinstitutions
Subsidy for MSME *
DTI loans, DOST loans for machineries *
Loans from micro-finance companies andinstitutions (microfinance Institutions,…
Loans from commercial banks/rural banks
creating a new demand, new businessservice adaptive to the new normal *
Loans from non-bank sources (individuals)
Reduction of operating costs (e.g. lay-offsand salary reductions)
Figure 107: Means to Address Cashflow Challenges
Firms expecting Cash flow Challenges during Recovery (209)
54.07%
40.67%
34.45%
23.92%
22.97%
21.53%
21.05%
20.10%
0%20%40%60%80%100%
Loans from government financial institutions
Subsidy for MSME *
DTI loans, DOST loans for machineries *
Loans from micro-finance companies andinstitutions (microfinance Institutions,…
Loans from commercial banks/rural banks
creating a new demand, new businessservice which is adaptive to the new…
Loans from non-bank sources (individuals)
Reduction of operating costs (e.g. lay-offsand salary reductions)
Figure 108: Means to Address Cashflow Challenges According to Firm Size
Firms Expecting Cashflow Concerns (209) Microfirms (147)
Small Firms (42) Medium and Large Firms (20)

86 | P a g e
E.5 Three-fourths of respondents indicated that they will require at the most PhP 2M to help in maintaining /
re-starting their businesses. This information will be crucial in providing guidance to both public and private financial institutions as to how to best package financial assistance that will suit the needs of the recovering firms.
E.6 About 60% of respondents have indicated that they had loan applications made in the past 2 years. Around
10% preferred not to disclose information. Also, a higher proportion of firms that have had loan applications
54.07%
40.67%
34.45%
23.92%
22.97%
21.53%
21.05%
20.10%
0%20%40%60%80%100%
Loans from government financial institutions
Subsidy for MSME *
DTI loans, DOST loans for machineries *
Loans from micro-finance companies andinstitutions (microfinance Institutions, credit…
Loans from commercial banks/rural banks
creating a new demand, new business servicewhich is adaptive to the new normal *
Loans from non-bank sources (individuals)
Reduction of operating costs (e.g. lay-offs andsalary reductions)
Figure 109: Means to Address Cashflow Challenges According to Sector
Firms Expecting Cashflow Concerns (209) Manufacturing (120) Trade(36) Services (53)
54.07%
40.67%
34.45%
23.92%
22.97%
21.53%
21.05%
20.10%
0%20%40%60%80%100%
Loans from government financial institutions
Subsidy for MSME
DTI loans, DOST loans for machineries
Loans from micro-finance companies andinstitutions (microfinance Institutions,…
Loans from commercial banks/rural banks
creating a new demand, new businessservice which is adaptive to the new normal
Loans from non-bank sources (individuals)
Reduction of operating costs (e.g. lay-offsand salary reductions)
Figure 110: Means to Address Cashflow Challenges According to Client Orientation
Firms Expecting Cashflow Concerns (209) Export-oriented (104)Domestic-oriented (105)
75.74%
12.77%
6.38%
3.40%
1.70%
0%20%40%60%80%100%
< PHP 2M
PHP 2M to 5M
PHP 5M to 10M
> PHP 20M
PHP 10M to 20M
Figure 111: Amount Needed to Maintain/ Restart According to Firm Size
All Firms (235) Microfirms (161)
Small Firms (48) Medium and Large Firms (26)
75.74%
12.77%
6.38%
3.40%
1.70%
0%20%40%60%80%100%
< PHP 2M
PHP 2M to 5M
PHP 5M to 10M
> PHP 20M
PHP 10M to 20M
Figure 112: Amount Needed to Maintain/ Restart According to Sector
All Firms (235) Manufacturing (131) Trade (41) Services (63)
75.74%
12.77%
6.38%
3.40%
1.70%
0%20%40%60%80%100%
< PHP 2M
PHP 2M to 5M
PHP 5M to 10M
> PHP 20M
PHP 10M to 20M
Figure 113: Amount Needed to Maintain/ Restart According to Client Orientation
All Firms (235) export-oriented (122) domestic-oriented (113)

87 | P a g e
in the past 2 years indicated that they were considering taking out loans (93% vs 70%), compared to those firms that have not applied for a loan in the past 2 years. A higher proportion of microenterprises (67% vs 57%), female owners (63% vs 57%), and owners 50 years old and below (63% vs 57%) had not applied for a loan in the past 2 years compared to total sample size. None of firm owners who were graduates of vocational and who were not able to complete secondary education applied for a loan in the past 2 years. In general, a higher proportion of firms operating for more than 5 years have had loan applications in the past 2 years (41% vs 32%) compared to total sample size, while a lower proportion of firms operating for at most 3 years have had loan applications (20% vs 32%).
32.34%
57.02%
10.64%
0%20%40%60%80%100%
Yes
No
Prefer not to disclose
Figure 114: Loan Application for Past 2 Years According to Firm Size
All Firms (235) Microfirms (161) Small Firms (48) Medium and Large Firms (26)
32.34%
57.02%
10.64%
0%20%40%60%80%100%
Yes
No
Prefer not to disclose
Figure 115: Loan Application for Past 2 Years According to Sector
All Firms (235) Manufacturing (131) Trade (41) Services (63)
32.34%
57.02%
10.64%
0%20%40%60%80%100%
Yes
No
Prefer not to disclose
Figure 116: Loan Application for Past 2 Years According to Age
All(235) 35 years and below (94) More than 35 years up to 50 years (68) Above 50 years (73)
32.34%
57.02%
10.64%
0%20%40%60%80%100%
Yes
No
Prefer not to disclose
Figure 117: Loan Application for Past 2 Years According to Gender
All (235) Female (112) LGBTQI+ (1) Male (113) Prefer not to disclose (9)
32.34%
57.02%
10.64%
0%20%40%60%80%100%
Yes
No
Prefer not to disclose
Figure 118: Loan Application for Past 2 Years According to Educational Attainment
All (235) Primary (3) Secondary (7) Tertiary (158)
Post Graduate (42) Vocational (4) Unknown (21)
32.34%
57.02%
10.64%
0%20%40%60%80%100%
Yes
No
Prefer not to disclose
Figure 119 Loan Application for Past 2 Years According to Years of Operation
Total Firms (235) 3 years and below (59)
More than 3 years up to 5 years (51) More than 5 years up to 10 years (49)
More than 10 years 976)

88 | P a g e
E.7 A third of firms had existing BCPs.
E.8 Responses provided by firms with BCPs in relation to the challenges in implementing one, based on % of
responses, included:
• It was inadequate and lacking. (50.65%)
• It did not respond well to the current emergency. (35.06%)
• The restrictions limit activities. (35.06%)
About half of the firms with BCPs indicated that their plans were inadequate and lacking, while a third expressed that their plans did not respond well to the emergency. These can be indications that perhaps health emergencies were not expected due to its low probability particularly in the Philippines where more climate and tectonic-related calamities are more frequent. A third also said quarantine restrictions made their BCPs harder to implement. A higher proportion of small-sized firms and firms in the trade sector, compared to relevant total sample size, indicated that their existing BCPs were inadequate and lacking (59%/82% vs 51%), with small firms further stating that BCPs were not updated (23% vs 14%). Firms from the service sector mentioned that the quarantine restrictions were very limiting to allow effective implementation of the BCPs (67% vs 35%).
Firms w/ BCPs,
32.77%Firms w/o
BCPs, 67.23%
Figure 120: Proportion of Respondents with BCPs (N=235)
50.65%
35.06%
35.06%
14.29%
0%20%40%60%80%100%
It was inadequate and lacking.
It did not respond well to the currentemergency.
The restrictions limits activities *
Not updated since it was prepared
Figure 121: Challenges in Implementing BCPS
Firms with BCPs (77)
50.65%
35.06%
35.06%
14.29%
0%20%40%60%80%100%
It was inadequate and lacking.
It did not respond well to the currentemergency.
The restrictions limits activities. *
Not updated since it was prepared
Figure 122: Challenges in Implementing BCPS According to Firm Size
Firms with BCPs (77) Microfirms (44)
Small Firms (22) Medium and Large Firms (11)

89 | P a g e
E.9 Responses provided by firms without BCPs in relation to the challenges in preparing one, based on % of
responses, included:
• Not aware what a BCP is (35.44%)
• I am a micro-small business. (25.95%)
• There was no capacity to develop one. (19.62%)
A third of firms without BCPs indicated that they were not aware what it was while around a quarter believed that the operations of microenterprises are less complex and thus, do not require BCPs. Around 20% said they had no capacity to prepare BCPs. Policies and programmes may need to be updated to promote the preparation of BCPs according to acceptable global standards. Compared to relevant total sample size, a higher proportion of small-sized firms and medium/large firms in indicated that their preparing a BCP was not a priority (35%/33% vs 17%), with medium/large firms also stating that there was no capacity to prepare a BCP (33% vs 20%). Firms from the trade sector mentioned that they were not aware what BCPs were (43% vs 35%).
50.65%
35.06%
35.06%
14.29%
0%20%40%60%80%100%
It was inadequate and lacking.
It did not respond well to the currentemergency.
The restrictions limits activities. *
Not updated since it was prepared
Figure 123: Challenges in Implementing BCPS According to Sector
Firms with BCPs (77) Manufacturing (45) Trade (11) Services (21)
50.65%
35.06%
35.06%
14.29%
0%20%40%60%80%100%
It was inadequate and lacking.
It did not respond well to the currentemergency.
The restrictions limits activities.
Not updated since it was prepared
Figure 124: Challenges in Implementing BCPS According to Client Orientation
All Firms (77) Export-oriented (46) domestic-oriented (31)
35.44%
25.95%
21.52%
19.62%
17.09%
0%20%40%60%80%100%
Not aware what a business continuity planis
I am a Microsmall business *
Waiting for new normal *
There was no capacity to develop one
It was not a priority.
Figure 125: Challenges in Preparing BCP
Firms without BCPs (158)
35.44%
25.95%
21.52%
19.62%
17.09%
0%20%40%60%80%100%
Not aware what a business continuity plan is
I am a Microsmall business *
Waiting for the new normal *
There was no capacity to develop one
It was not a priority.
Figure 126: Challenges in Preparing BCP According to Firm Size
Firms w/o BCPs (158) Microfirms (117) Small Firms (26) Medium and Large Firms (15)

90 | P a g e
E.10 When asked regarding the support that will be needed in relation to Market and Business Environment,
firms identified the following top choices based on % of responses:
• Additional capital to re-start (60.85%)
• Access to new markets (54.04%)
• Relaxation of deadlines and regulations (48.09%)
Although “additional capital to restart” was a response more related to Financial Aspects, firms still voluntarily mentioned it in this section, indicating it to be top-of-mind for most recovering firms. Among those responses directly related to Market and Business Environment, about half of firms were looking to receive support in the area of accessing new markets and in the relaxation of deadlines and regulations. Accessing new markets was mentioned particularly by operating firms during the quarantine period that experienced output-related challenges in distribution, shipping, and logistics. This was also closely related to opportunities around diversification and creating new industry platers. On the other hand, relaxation of deadlines and regulations is linked with cash flow concerns raised by most firms as a challenge they were expecting to face during recovery. Both the comments on “safe and efficient mobility for manpower and goods” as well as “support within the supply value chain” were connected aspirations in relation to strengthening value chain cooperation. Among all respondent firms, a higher proportion of medium/large firms and firms from the Trade sector identified relaxation of deadlines and regulations (69%/61% vs 48%) and safe and efficient mobility for manpower and goods (54%/51% vs 42%). Microenterprises, in particular, indicated the need for additional capital (71% vs 61%) and to some extent, access to new markets (60% vs 54%). Similarly, small-sized firms also mentioned the need for relaxing regulations (63% vs 48%) while domestic-oriented firms would like to request for additional capital (68% vs 60%). A higher proportion of medium/large firms were looking forward to request for support within their supply chains (54% vs 40%).
35.44%
25.95%
21.52%
19.62%
17.09%
0%20%40%60%80%100%
Not aware what a business continuity plan is
I am a Microsmall business *
Waiting for the new normal *
There was no capacity to develop one
It was not a priority.
Figure 127: Challenges in Preparing BCP According to Sector
Firms w/o BCPs (158) Manufacturing (86) Trade (30) Services (42)
35.44%
25.95%
21.52%
19.62%
17.09%
0%20%40%60%80%100%
Not aware what a business continuity plan is
I am a Microsmall business *
Waiting for the new normal *
There was no capacity to develop one
It was not a priority.
Figure 128: Challenges in Preparing BCP According to Client Orientation
Firms w/o BCPs (158) Export-oriented (76) Domestic-oriented (82)

91 | P a g e
E.11 When asked regarding the support that will be needed in relation to Human Resources and Compensation,
firms identified the following top choices based on % of responses:
• Lower costs for utilities (58.30%)
• Easy access to the COVID-19 tests for employees (50.21%)
• Reduced rental fees (35.32%)
Almost 60% of firms were interested to secure support along the lines of lower cost for utilities while half of them was interested to avail of easy access to the COVID-19 tests for employees. There was also interest to facilitate the work of employees through policies on working remotely and training and capacity-development opportunities. Among the respondent firms, a higher proportion of small-sized firms and firms in the Trade sector were looking forward to lower utility costs (73%/71% vs 58%), with the Trade sector firms further requesting for reduced rental fees (71% vs 35%). Microenterprises, in particular, would like to see policies for flexible
60.85%
54.04%
48.09%
42.13%
40.00%
40.00%
32.77%
31.06%
0%20%40%60%80%100%
Additional capital to restart *
Access to new markets
Relaxation of deadlines and regulations(permits, standards, etc.)
Safe and efficient mobility for manpowerand goods
Support within the supply / value chain(big brother agreements)
Sales and marketing fund *
Price control
Cash assistance from government forMicro and Small Enterprises *
Figure 129: Support Needed in Relation to Market and Business Environment
All Firms (235)
60.85%
54.04%
48.09%
42.13%
40.00%
40.00%
32.77%
31.06%
0%20%40%60%80%100%
Additional capital to restart *
Access to new markets
Relaxation of deadlines and regulations(permits, standards, etc.)
Safe and efficient mobility for manpowerand goods
Support within the supply / value chain(enhanced big brother-small brother…
Sales and marketing fund *
Price control
Cash assistance from government forMicro and Small Enterprises *
Figure 130: Support Needed in Relation to Market and Business Environment According to Firm Size
All Firms (235) Microfirms (161) Small Firms (48) Medium and Large Firms (26)
60.85%
54.04%
48.09%
42.13%
40.00%
40.00%
32.77%
31.06%
0%20%40%60%80%100%
Additional capital to restart *
Access to new markets
Relaxation of deadlines and regulations(permits, standards, etc.)
Safe and efficient mobility for manpowerand goods
Support within the supply / value chain(enhanced big brother-small brother…
Sales and marketing fund *
Price control
Cash assistance from government forMicro and Small Enterprises *
Figure 131: Support Needed in Relation to Market and Business Environment According to Sector
All Firms (235) Manufacturing (131) Trade (41) Services (63)
60.85%
54.04%
48.09%
42.13%
40.00%
40.00%
32.77%
31.06%
0%20%40%60%80%100%
Additional capital to restart *
Access to new markets
Relaxation of deadlines andregulations (permits, standards, etc.)
Safe and efficient mobility formanpower and goods
Support within the supply / value chain(enhanced big brother-small brother…
Sales and marketing fund *
Price control
Cash assistance from government forMicro and Small Enterprises *
Figure 132: Support Needed in Relation to Market and Business Environment According to Client Orientation
All Firms (235) Export-oriented (122)terprises Domestic-oriented (113)

92 | P a g e
work arrangements (50% vs 25%), access to COVID-19 test kits for employees (73% vs 50%), and incentives for non-reduction of employment (46% vs 29%).
E.12 Firms that expressed the need for training and capacity development had indicated the following training
needs.
• Adopting to the new normal
• Marketing and sales training including e-commerce
• Food safety and food-related skills
• Digital transformation
E.13 When asked regarding the support that will be needed in relation to Financial Aspects, firms identified the
following top choices based on % of responses:
• Access to financial assistance / loans (70.64%)
• Reduction of tax rates / deferral of taxes (54.89%)
• Government not to charge penalties (45.11%)
Taking cue from responses received from firms in various sections of this assessment expressing the need to augment cash flow and working capital, it was understandable that a majority of firms expressed their
58.30%
50.21%
35.32%
28.94%
28.51%
25.11%
23.83%
23.40%
0%20%40%60%80%100%
Lower costs for utilities (e.g. electricity,gas, etc.)
Easy access to the COVID-19 tests for theemployees
Reduced rental fees
Incentives to enterprises that do not layoff staff
Tax Holiday for 5 years to microenterprises *
Flexible work arrangements and laborpolicies
Trainings and capacity development
3-year equivalent capital fund for humanresource expenses in the next 3-years *
Figure 133: Support Needed in Relation to Human Resources and Compensation
All Firms (235)
58.30%
50.21%
35.32%
28.94%
28.51%
25.11%
23.83%
23.40%
0%20%40%60%80%100%
Lower costs for utilities (e.g. electricity, gas,etc.)
Easy access to the COVID-19 tests for theemployees
Reduced rental fees
Incentives to enterprises that do not lay offstaff
Tax Holiday for 5 years to micro enterprises*
Flexible work arrangements and laborpolicies
Trainings and capacity development
3-year equivalent capital fund for humanresource expenses in the next 3-years. *
Figure 134: Support Needed in Relation to Human Resources and Compensation According to Firm Size
All Firms (235) Microfirms (161) Small Firms (48) Medium and Large Firms (26)
58.30%
50.21%
35.32%
28.94%
28.51%
25.11%
23.83%
23.40%
0%20%40%60%80%100%
Lower costs for utilities (e.g. electricity,gas, etc.)
Easy access to the COVID-19 tests for theemployees
Reduced rental fees
Incentives to enterprises that do not layoff staff
Tax Holiday for 5 years to microenterprises *
Flexible work arrangements and laborpolicies
Trainings and capacity development
3-year equivalent capital fund for humanresource expenses in the next 3-years. *
Figure 135: Support Needed in Relation to Human Resources and Compensation According to Sector
All Firms (235) Manufacturing (131) Trade (41) Services (63)
58.30%
50.21%
35.32%
28.94%
28.51%
25.11%
23.83%
23.40%
0%20%40%60%80%100%
Lower costs for utilities (e.g. electricity,gas, etc.)
Easy access to the COVID-19 tests for theemployees
Reduced rental fees
Incentives to enterprises that do not layoff staff
Tax Holiday for 5 years to microenterprises *
Flexible work arrangements and laborpolicies
Trainings and capacity development
3-year equivalent capital fund for humanresource expenses in the next 3-years.*
Figure 136: Support Needed in Relation to Human Resources and Compensation According to Client Orientation
All Firms (235) Export-oriented (122)terprises Domestic-oriented (113)

93 | P a g e
intention to seek out access to financial assistance and loans. Related also to cash flow was the desire for reduction of tax rate, tax deferrals, and reduced charges for penalties, lower interest rates, and extension of loan maturities. These were areas where both government and the private sector can work together to arrive at a workable agreement. Compared to total sample size, a higher proportion of medium/large firms and firms from the Trade sector had indicated the need for reduction of tax rates / deferral of taxes (69%/66% vs 55%).
Looking Forward: Building Back Better
E.14 Looking forward, firms have expressed their interest to look at the possibility for adopting relevant Standards
and Technology Solutions. Based on % of responses, they included:
• Advanced digital and disruptive technologies (51.49%)
• E-commerce (45.96%)
• Quality and safety standards for products and services (43.83%)
More than half of the firms identified advanced digital and disruptive technologies as an area they will be willing to look more into. Most were also interested technologies around supporting e-commerce, quality infrastructure including safety standards, and occupational safety and health. All these were consistent with their perception of the “new normal” characterized with changes in marketing activities and in operations
70.64%
54.89%
45.11%
39.57%
35.74%
31.06%
10.21%
0%20%40%60%80%100%
Access to financial assistance / loans
Reduction of tax rates / deferral of taxes
Government not to charge penalties andperhaps tax condonation *
lower interest rates from banks. newmode like p.o. financing *
Extension of loan maturities
Tax Holiday for 5 years to microenterprises *
government subsidy *
Figure 137: Support Needed in Relation to Financial Aspects
All Firms (235)
70.64%
54.89%
45.11%
39.57%
35.74%
31.06%
10.21%
0%20%40%60%80%100%
Access to financial assistance / loans
Reduction of tax rates / deferral of taxes
Government not to charge penalties, latepayment charges and perhaps tax…
lower interest rates from banks. new modelike p.o. *
Extension of loan maturities
Tax Holiday for 5 years to micro enterprises *
government subsidy *
Figure 138: Support Needed in Relation to Financial Aspects According to Firm Size
All Firms (235) Microfirms (161) Small Firms (48) Medium and Large Firms (26)
70.64%
54.89%
45.11%
39.57%
35.74%
31.06%
10.21%
0%20%40%60%80%100%
Access to financial assistance / loans
Reduction of tax rates / deferral of taxes
Government not to charge penalties, latepayment charges and perhaps tax…
lower interest rates from banks. newmode like p.o. financing *
Extension of loan maturities
Tax Holiday for 5 years to microenterprises *
government subsidy *
Figure 139: Support Needed in Relation to Financial Aspects According to Sector
All Firms (235) Manufacturing (131) Trade (41) Services (63)
70.64%
54.89%
45.11%
39.57%
35.74%
31.06%
10.21%
0%20%40%60%80%100%
Access to financial assistance / loans
Reduction of tax rates / deferral of taxes
Government not to charge penalties, latepayment charges and perhaps tax…
lower interest rates from banks. new modelike p.o. financing *
Extension of loan maturities
Tax Holiday for 5 years to micro enterprises*
government subsidy *
Figure 140: Support Needed in Relation to Financial Aspects According to Client Orientation
All Firms (235) Export-oriented (122) Domestic-oriented (113)

94 | P a g e
and processes, product lines, and services. There also seemed to be heightened interest for better health and safety protocols. A higher proportion of medium/large firms compared to total sample size were interested to look into quality and safety standards (58% vs 44%), occupational safety (50% vs 41%), process improvements (54% vs 32%), and energy efficiency / renewable energy (46% vs 26%). Small-sized firms, on the other hand, seemed to be more interested in advanced digital and disruptive technology (60% vs 52%), apart from process improvements (44% vs 32%). Firms from the Trade sector were more interested to look into e-mobility (44% vs 32%) and disruptive technologies (66% vs 52%), while those from the Service sector were more interested in occupational safety (52% vs 41%). Data also indicated that a higher proportion of male firm owners were interested to look into advanced digital / disruptive technologies (58% vs 45%) and process improvements / re-engineering (40% vs 23%) compared to female firm owners. In contrast, female firm owners better preferred standards and technologies related to e-commerce (55% vs 38%) compared to their male counterparts. A higher proportion of firm owners who completed post-graduate and tertiary education preferred to look into advanced digital / disruptive technologies (60%/55% vs 26%/24%), compared to those who completed vocational and secondary education. A higher proportion of firms that have operated for more than 3 years up to 5 years have indicated their interest on e-commerce (63% vs 46%) compared to total sample size, while firms that have operated for more than 10 years were more inclined to look into quality and safety standards (51% vs 44%) compared to total sample size. It also appeared that those 50 years old and below had more interest in e-commerce (50% vs 37%) and quality / safety standards (44%/47% vs 37%), compared to the older group who had more interest in process improvements / re-engineering (23%/34% vs 40%) and energy efficiency / renewable energy technologies (17%/28% vs 36%).
51.49%
45.96%
43.83%
40.85%
31.91%
31.49%
25.96%
24.68%
0%20%40%60%80%100%
Advanced digital and disruptive…
E-commerce
Quality and safety standards for…
Occupational safety and employee…
E-mobility
Process improvements / re-engineering
Energy efficiency and renewable energy
online delivery of government…
Figure 141: Interest in Adopting Relevant Standards and Technology Solutions
All Firms (235)
51.49%
45.96%
43.83%
40.85%
31.91%
31.49%
25.96%
24.68%
0%20%40%60%80%100%
Advanced digital and disruptive…
E-commerce
Quality and safety standards for…
Occupational safety and employee…
E-mobility
Process improvements / re-engineering
Energy efficiency and renewable energy
online delivery of government…
Figure 143: Interest in Adopting Relevant Standards and Technology Solutions According to Firm Size
All Firms (235) Microfirms (161)Small Firms (48) Medium and Large Firms (26)
51.49%
45.96%
43.83%
40.85%
31.91%
31.49%
25.96%
24.68%
0%20%40%60%80%100%
Advanced digital and disruptive…
E-commerce
Quality and safety standards for…
Occupational safety and employee…
E-mobility
Process improvements / re-engineering
Energy efficiency and renewable energy
online delivery of government…
Figure 144: Interest in Adopting Relevant Standards and Technology Solutions According to Sector
All Firms (235) Manufacturing (131) Trade (41) Services (63)
51.49%
45.96%
43.83%
40.85%
31.91%
31.49%
25.96%
24.68%
0%20%40%60%80%100%
Advanced digital and disruptive…
E-commerce
Quality and safety standards for…
Occupational safety and employee…
E-mobility
Process improvements / re-engineering
Energy efficiency and renewable energy
online delivery of government…
Figure 145: Interest in Adopting Relevant Standards and Technology Solutions According to Client Orientation
All Firms (235) Export-oriented (122) Domestic-oriented (113)

95 | P a g e
E.15 While majority of firms was expecting to require less than PhP 2M to support business recovery, some of
the firms had indicated a higher amount that may be used as investment for the standards and technology solutions they were interested to look into. For firms aiming for bigger investments, interests lied in the areas of advanced digital and disruptive technologies, process improvements / re-engineering, and energy efficiency / renewable energy.
51.49%
45.96%
43.83%
40.85%
31.91%
31.49%
25.96%
24.68%
0%20%40%60%80%100%
Advanced digital and disruptivetechnologies in aid of production,…
E-commerce
Quality and safety standards for products,production, and services
Occupational safety and employee health& wellfare programs
E-mobility
Process improvements / re-engineering
Energy efficiency and renewable energy
online delivery of government documents.,business insurance *
Figure 145: Interest in Adopting Relevant Standards and Technology Solutions According to Gender
All(235) Female(112) Male(113) Prefer not to disclose(9) LGBTQI+(1)
51.49%
45.96%
43.83%
40.85%
31.91%
31.49%
25.96%
24.68%
0%20%40%60%80%100%
Advanced digital and disruptive technologiesin aid of production, commerce, safety, and…
E-commerce
Quality and safety standards for products,production, and services
Occupational safety and employee health &wellfare programs
E-mobility
Process improvements / re-engineering
Energy efficiency and renewable energy
online delivery of government documents.,business insurance *
Figure 146: Interest in Adopting Relevant Standards and Technology Solutions According to Educational Aattainment
All Firms (235) Post graduate (42) Tertiary (148)
Vocational (4) Secondary (17) Primary (3)
51.49%
45.96%
43.83%
40.85%
31.91%
31.49%
25.96%
24.68%
0%20%40%60%80%100%
Advanced digital and disruptivetechnologies in aid of production,…
E-commerce
Quality and safety standards for products,production, and services
Occupational safety and employee health &wellfare programs
E-mobility
Process improvements / re-engineering
Energy efficiency and renewable energy
online delivery of government documents.,business insurance *
Figure 147: Interest in Adopting Relevant Standards and Technology Solutions According to Years of Operation
All(235) 3 years and below (59)
More than 3 years up to 5 years(51) More than 5 years up to 10 years(49)
More than 10 years(76)
51.49%
45.96%
43.83%
40.85%
31.91%
31.49%
25.96%
24.68%
0%20%40%60%80%100%
Advanced digital and disruptive…
E-commerce
Quality and safety standards for…
Occupational safety and employee…
E-mobility
Process improvements / re-…
Energy efficiency and renewable…
online delivery of government…
Figure 148: Interest in Adopting Relevant Standards and Technology Solutions According to Age
All Firms (235) 35 years and below (94)
More than 35 years up to 50 years (68) Above 50 years (73)
51.49%
45.96%
43.83%
40.85%
31.91%
31.49%
25.96%
0%10%20%30%40%50%60%70%80%90%100%
Advanced digital and disruptive technologies in aid…
E-commerce
Quality and safety standards for products,…
Occupational safety and employee health & wellfare…
E-mobility
Process improvements / re-engineering
Energy efficiency and renewable energy
Figure 149: Interest in Adopting Relevant Standards and Technology Solutions According vs. Amount Needed to Maintain/ Restart Business
All Firms (235) Less than PhP 2 million (178)PhP 2 million to PhP 5 million (30) PhP 5 million to PhP 10 million (15)PhP 10 million to PhP 20 million (4) Above PhP 20 million (8)

96 | P a g e
E.16 In general, almost 85% of all firms indicated their willingness to diversify operations. This high level of
openness to diversification can be seen across all firm types except for firms owned by individuals who have completed primary education only. This hesitation may have been brought about by the belief of having low capacity to venture into new investments. There were also some indications that microenterprises appeared to be more open to the idea (89% vs 81%) compared to larger-sized firms; firm owners above 50 years of age were less willing (83% vs 88%) compared to their younger cohorts; firms already in operation for more than 10 years were also less willing (82% vs 90 - 92%) compared to newer firms; while firms owned by women were more willing (90% vs 84%) compared to their male counterparts. Three quarters of firms who were willing to diversify operations also plan to re-hire their employees.
86.81% 89.44%81.25% 80.77%
11.91% 9.32%18.75% 15.38%
1.28% 1.24% 0.00% 3.85%
0%
10%
20%
30%
40%
50%
60%
70%
80%
90%
100%
All Firms (235) Microfirms (161) Small Firms (48) Medium and LargeFirms (26)
Figure 150: Willingness to Diversify Operations According to Firm Size
Yes No No reply
86.81% 86.26%92.68%
84.13%
11.91% 12.21% 4.88%15.87%
1.28% 1.53% 2.44% 0.00%
0%
10%
20%
30%
40%
50%
60%
70%
80%
90%
100%
All Firms (235) Manufacturing (131) Trade (41) Services (63)
Figure 151: Willingness to Diversify Operations According to Sector
Yes No No reply
86.81% 86.89% 86.73%
11.91% 10.66% 13.27%1.28% 2.46%
0.00%
0%
10%
20%
30%
40%
50%
60%
70%
80%
90%
100%
Total (235) export-oriented (122) domestic-oriented (113)
Figrue 152: Willingness to Diversify Operations According to Client Orientation
Yes No No reply
86.81% 88.30% 88.24%
83.56%
11.91% 8.51%11.76%
16.44%
1.28%3.19%
0.00% 0.00%
75%
80%
85%
90%
95%
100%
All Firms (135) 35 years and below(94)
more than 35 yearsup to 50 years (68)
Above 50 years (73)
Figure 153: Willingness to Diversify Operations According to Age
Yes No No reply
86.81% 89.83% 92.16%85.71% 81.58%
11.91% 6.78%7.84%
12.24% 18.42%
1.28% 3.39% 0.00% 2.04% 0.00%
0%
10%
20%
30%
40%
50%
60%
70%
80%
90%
100%
All Firms (235) 3 years and less(59)
more than 3years to 5 years
(51)
more than 5years to 10 years
(49)
more than 10years (76)
Figure 154: Willingness to Diversify Operations According to Years of Operaton
Yes No No reply
86.81% 84.07%90.18%
100.00%
77.78%
11.91% 15.04% 8.04%0.00%
22.22%
1.28% 0.88% 1.79% 0.00% 0.00%
0%
10%
20%
30%
40%
50%
60%
70%
80%
90%
100%
All Firms (235) Male (113) Female (112) LGBTQI+ (1) Prefer not todisclose (9)
Figure 155: Willingness to Diversify Operations According to Gender
Yes No No reply

97 | P a g e
E.17 The options being considered by firms in their efforts to diversify, based on % of responses, included:
• Adding new product / service lines beyond existing capacity (71.08%)
• Adjust business model (51.96%)
• Re-purpose part of existing facility to produce other products (35.78%)
A great majority of firms was willing to consider adding new product and service lines beyond existing capacity while over 50% is also willing to look at adjusting their business models. Compared to relevant total sample size, a higher proportion of medium/large firms (50% vs 36%), and to some extent, export-oriented firms (43% vs 36%) and manufacturing firms (43% vs 36%), indicated willingness to diversify by re-purposing part of their existing facilities. Domestic-oriented firms were willing to adjust business models (60% vs 52%) while firms from the Trade sector were willing to switch to new businesses (55% vs 35%).
86.81%80.95% 85.81%
100.00%94.12%
66.67%
100.00%
11.91% 19.05% 12.16%0.00% 5.88%
33.33%
0.00%1.28% 0.00% 2.03% 0.00% 0.00% 0.00% 0.00%
0%
10%
20%
30%
40%
50%
60%
70%
80%
90%
100%
All Firms (235) Post-graduate(42)
Tertiaryeducation (148)
vocationalgraduate (4)
Secondaryeducation (17)
Primaryeducation (3)
Unknown (21)
Figure 156: Willingness to Diversify Operations According to Educational Attainment
Yes No No reply
71.08%
51.96%
35.78%
34.80%
0%10%20%30%40%50%60%70%80%90%100%
Adding new product/service lines beyond theexisting capacity
Adjust business model
Re-purpose part of the existing facility toproduce other products
Switching to new businesses to survive
Figure 157: Efforts to Diversify
All Firms (235)
71.08%
51.96%
35.78%
34.80%
0%20%40%60%80%100%
Adding new product/service lines beyond theexisting capacity
Adjust business model
Re-purpose part of the existing facility toproduce other products
Switching to new businesses to survive
Figure 158: Efforts to Diversify According to Firm Size
Firms Interested to Diversify (204) Microfirms (144) Small Firms (38) Medium and Large Firms (22)

98 | P a g e
71.08%
51.96%
35.78%
34.80%
0%20%40%60%80%100%
Adding new product/service lines beyondthe existing capacity
Adjust business model
Re-purpose part of the existing facility toproduce other products
Switching to new businesses to survive
Figure 159: Efforts to Diversify According to Sector
All Firms (204) Manufacturing (113) Trade (38) Services (53)
71.08%
51.96%
35.78%
34.80%
0%20%40%60%80%100%
Adding new product/service lines beyond theexisting capacity
Adjust business model
Re-purpose part of the existing facility toproduce other products
Switching to new businesses to survive
Figure 160: Efforts to Diversify According to Client Orientation
All Firms (204) Export-oriented (106) Domestic-oriented (98)

99 | P a g e
ANNEX F – Responses to Questions with Multiple Answers
Note: * refers to responses that were not originally included in the selection, but were voluntarily provided by the
respondents by selecting “OTHERS” whenever such as option is available.
What were the challenges encountered that led to the changes in your operations? (Select top 3 choices.)
1. Lack of manpower 2. Lack of demand / recalled purchase orders 3. No available input materials / services 4. Distribution / shipping / logistics issues 5. Cash flow issues 6. Fear of transmitting Covid from employees to us * 7. Trade events were cancelled, cpnsidered * 8. Government enforced moratorium * 9. employees and clients going to our office cant pass through checkpoints * 10. No transportation for employees * 11. Shut down of suppliers for packaging materials and raw materials * 12. unavailability of packaging materials * 13. decreased operation capacity of suppliers * 14. Lack of customers because of the quarantine *
What changes have you adopted in your operations?
1. Work-from-home arrangement 2. Reduced working / operating hours 3. Went into partial operation (some sections are closed) 4. Diversified the operations to new products/processes 5. Lay-off 6. Operate in full capacity based on volume of customer demand. * 7. reduced production capacity due to limited workers that can report to work * 8. Self-Quarantine and Staff Housing for ALL workers not already living in the community * 9. ONLINE * 10. Complied with DTI's order on rent moratorium * 11. we only manufacture when the customer requested *
If sourcing input materials was a challenge, what are the main means you are currently considering to deal with the shortage of inputs such as intermediate goods and raw materials? (Select top 3 choices.)
1. Seeking alternative sources 2. Reduction of production 3. Outsourcing orders 4. Increasing the procurement channels 5. Seeking new production channels 6. Delaying goods delivery 7. Sell online * 8. Direct supplier accreditation and direct purchase from farmers * 9. using stocks we still have before the quarantine but we're about to run out on some items * 10. Was able to purchase enough stocks before quarantine * 11. Close the business and start a business on agricultural production. * 12. Totally stop my business *

100 | P a g e
If distribution / shipping / logistics was a challenge, what was the nature of the issues regarding them? (Select all that apply.)
1. Travel Restrictions / checkpoints 2. Additional regulatory requirements 3. No uptake at market / distribution points (closed) 4. Insufficient service available from usual service-providers 5. Slow clearance at the Customs and the cargo yard 6. Curfew hours and Variations of Local Regulations that affects harvest, and logistics * 7. Company's reliance on public available transportation units * 8. Provincial boundary lockdown * 9. no transportation available * 10. Non essential items are temporarily prohibited to be sold * 11. Logistics offices were closed * 12. suppliers are not delivering the packaging to our forwarder * 13. I was able to get iatf id *
If distribution / shipping / logistics was a challenge, what are the main means you are currently considering to deal with these issues? (Select all that apply.)
1. Alternative markets 2. Alternative service providers 3. Purchase of Company-owned transportation units * 4. Once raw materials and packaging are consumed, production shall stop since suppliers are shutdown. * 5. Waiting for provincial boundary checkpoint restrictions to be lifted to resume deliveries of products * 6. Wait for the ECQ to be lifted * 7. Easy to pass thru checkpoints bec of iatf id * 8. distribution center to which we will deliver goods is close also * 9. services * 10. Delays in BOC due to slow processing of documents, causing additional Arrastre and storage charges (for
both sea freight and air freight orders) * 11. BOC should waive these charges as they are the ones who delayed the process. *
If lack of manpower was a challenge, what was the nature of the issues? (Select all that apply.)
1. Lack of available transportation 2. Only skeletal force is allowed 3. Difficulty to maintain social distancing at the workplace 4. Insufficient personal protective equipment (PPEs) 5. Fear to come to work 6. Employees are unable to execute work-from-home arrangements 7. Critical employees are attending to personal matters, caring for children / family members 8. non-essential items * 9. Lack of demand * 10. Cancellation of scheduled trade events * 11. Company cannot sustain the monthly salary of employees * 12. I made my own products * 13. Absences related to required their physical presence within their residence to get their ayuda *
If lack of manpower was a challenge, what are the main means you are considering to deal with the shortage of workers? (Select top 2 choices.)
1. Wage increases 2. Use of advanced equipment or software to reduce the amount of work 3. Outsourcing of orders

101 | P a g e
4. Delays in delivery 5. reduced work hours & less days open for business * 6. Additional measures on workplace safety to prevent infection. * 7. Staff housing * 8. Lack of Demand/ Decrease in Sales * 9. employees are not able to commute to work * 10. I made.my own products *
What changes are you expecting to see in the business environment when the ongoing crisis/pandemic ends? (Select all that apply.)
1. There will be changes in marketing activities (e-commerce). 2. There will be changes in operations and processes (inventory, distribution, etc.). 3. There will be new business regulations. 4. There will be changes in product lines and services. 5. There will be changes in manufacturing processes (digitalization, new technologies, etc.). 6. There will be change in sales strategies from being conventional or traditional form of sale, to a re-
invigorated one. * 7. New areas we need to cover to reach our target market in select community *
What will be your biggest challenges in maintaining / re-starting business operations? (Select top 3 choices.)
1. Decline in domestic demand / customers 2. Decline in foreign demand / customers 3. Disruption in production, supply chains, and networks 4. Cash flow (e.g. working capital, salaries, loan payments, tax obligations, etc.) 5. Higher production cost 6. Intensified market competition 7. Health and safety of workers 8. Lack of manpower 9. Other remaining restrictions under the modified community quarantine 10. How to find another starting capital * 11. creating a new business operating system for staff and aligned to clients demand. * 12. access to transportation of our employees *
If cash flow is expected to be an issue, what are the expected challenges in your cash flow? (Select all that apply.)
1. Working capital 2. Fixed cost 3. Loan payments (bank) 4. Loan payments (non-bank) 5. Salaries 6. Tax obligations 7. SSS and other contributions 8. to finance a new setup for our employees who may WFH, like computers, internet etc. * 9. Real Estate Tax * 10. Utilities * 11. Capital to restart business. * 12. rent of commercial space, salaries *
If cash flow is expected to be an issue, what means will you consider pursuing to address cash flow shortage? (Select all that apply.)
1. Loans from government financial institutions 2. Loans from private development banks 3. Loans from commercial banks/rural banks

102 | P a g e
4. Loans by internet finance 5. Loans from micro-finance companies and institutions (microfinance Institutions, credit cooperatives,
private finance companies and pawn shops) 6. Loans from non-bank sources (individuals) 7. Negotiating with lenders to avoid withdrawing loans 8. Equity financing (adding new shareholders or capital increase of former shareholders) 9. Loan restructuring / loan refinancing 10. Use of credit cards to defer payment 11. Reduction of operating costs (e.g. lay-offs and salary reductions) 12. Paying by goods/products (barter trade) 13. Negotiating with service supplier (like rental) for lease repayment in tranche * 14. DTI loans, DOST loans for machineries * 15. Subsidy for MSME * 16. Maintain govt spending for training and consulting requirements. * 17. There is a DBM memo requiring govt agencies to re-align training and consulting budgets for COVID
response. * 18. Sale of real properties * 19. creating a new demand, new business service which is adaptive to the new normal * 20. Live within the means by reducing work day *
Do you have an existing Business Continuity Plan that is responsive to pandemics/health crises? If reply is “Yes”, what were the challenges in implementing the business continuity plan? (Select all that apply.)
1. It did not respond well to the current emergency. 2. It was inadequate and lacking. 3. Not updated since it was prepared 4. The Company's Business Continuity Plan (BCP) was not yet perfected when COVID-19 arrived * 5. We have BCP but not prepared for Pandemic * 6. The restrictions limits activities. * 7. somehow, we managed to adapt to the situation pretty fast to the point that we were assisting other
customers how to manage it. * 8. we have an imported item-modular tents that are useful in times of calamities or emergencies * 9. We applied cloud based accounting and inventory system the challenge is teaching my employees re the
new system *
If reply is “No”, what were the challenges in developing a business continuity plan? (Select all that apply.)
1. Not aware what a business continuity plan is 2. It was deemed unnecessary by top management. 3. It was not a priority. 4. There was no capacity to develop one 5. dont know how it works * 6. I am a Microsmall business * 7. What we have is not adequate to address this type of Risks due to complexity of the problem. * 8. We still need to analyze what will be the situation once we return to operation because our clients are all
temporarily close too. * 9. will develop a BCP program in relation to pandemics/health issue * 10. I'll rather call it alternative approach to consulting which is off site. *
What kind of support do you think your business will need to ensure a successful recovery to full operation? (Select all applicable choices.) Market and Business Environment
1. Support within the supply / value chain (enhanced big brother-small brother agreements)

103 | P a g e
2. Safe and efficient mobility for manpower and goods 3. Access to new markets 4. Price control 5. Relaxation of deadlines and regulations (permits, standards, etc.) 6. Optimization of exporting tax rebate services 7. Provide fast-track "force majeure" certification to avoid contract breaches 8. Subsidies for digitalization and automation 9. Sales and marketing fund * 10. lessen red tape and documentary requirements * 11. Additional capital to restart * 12. Clear Govt intervention in implementing rules and guidelines wherein a two way communication is present
before they implement the new policy and guidelines * 13. Cash assistance from government for Micro and Small Enterprises instead of loans because these
enterprises need it most to be able to restart their businesses again. *
What kind of support do you think your business will need to ensure a successful recovery to full operation? (Select all applicable choices.) Human Resources and Compensation
1. Easy access to the COVID-19 tests for the employees 2. Trainings and capacity development 3. Compensation for businesses if closed due to employees becoming a covid-19 patient 4. Reduced rental fees 5. Lower costs for utilities (e.g. electricity, gas, etc.) 6. Reduction of social insurance premiums 7. Incentives to enterprises that do not lay off staff 8. Direct subsidies based on past tax payments 9. Flexible work arrangements and labor policies 10. 3-year equivalent capital fund for human resource expenses in the next 3-years. * 11. Grants for companies who operates their business in full capacity while stictly implementing guidelines to
prevent disease transmission * 12. health benefits for employees and senior company owners like subsidized vitamins, Ascorbic acid, * 13. Tax Holiday for 5 years to micro enterprises *
What kind of support do you think your business will need to ensure a successful recovery to full operation? (Select all applicable choices.) Financial Aspects
1. Access to financial assistance / loans 2. Reduction of tax rates / deferral of taxes 3. Extension of loan maturities 4. Flexible credit provisions / reduction of financing costs 5. Government not to charge penalties, late payment charges and perhaps tax condonation. * 6. lower interest rates from banks. new mode like p.o. financing * 7. government subsidy * 8. Tax Holiday for 5 years to micro enterprises * 9. Tax Holiday for 2-3 years for small/medium Tourism enterprises * 10. “Meron sanang soft loan s mga govt financial institutions” *
What types of standards and technology solutions will you be most interested in, to build your resilience to address the impacts of future shocks and emergencies? (Select top 5 choices.)
1. Advanced digital and disruptive technologies in aid of production, commerce, safety, and supply chain management

104 | P a g e
2. Energy efficiency and renewable energy 3. Cold storage and other tools for inventory management 4. Process improvements / re-engineering 5. E-mobility 6. Quality and safety standards for products, production, and services 7. Occupational safety and employee health & wellfare programs 8. Resource efficiency and cleaner production 9. Pollution control technologies 10. Waste management 11. E-commerce 12. Online delivery of HR functions for alternative arrangements * 13. online delivery of government documents., business insurance *
Will you be interested to explore diversification of operations, new products and services, and other business models? If the response is ‘Yes”, which of the following options will you be pursuing? (Select all applicable choices.)
1. Adjust business model 2. Re-purpose part of the existing facility to produce other products 3. Adding new product/service lines beyond the existing capacity 4. Switching to new businesses to survive 5. optimize existing tech to help in minimizing people to people contact. * 6. Activate all other Company business segments. * 7. INTERESTED TO CONNECT TO AN INVESTOR. *

UNIDO COUNTRY OFFICE, PHILIPPINES
14th Floor, North TowerRockwell Business Center SheridanCorner United and Sheridan Streets
Mandaluyong City, 1554 Metro, ManilaPHILIPPINES
Email: [email protected]
Website: www.unido.org

UNITED NATIONS INDUSTRIAL DEVELOPMENT ORGANIZATION