d original contribution - aigil.radiology.wisc.edu
TRANSCRIPT

Ultrasound in Med. & Biol., Vol. 43, No. 9, pp. 1953–1962, 2017� 2017 World Federation for Ultrasound in Medicine & Biology
Printed in the USA. All rights reserved0301-5629/$ - see front matter
/j.ultrasmedbio.2017.04.021
http://dx.doi.org/10.1016d Original Contribution
DELINEATION OF POST-PROCEDURE ABLATION REGIONS WITH ELECTRODEDISPLACEMENT ELASTOGRAPHY WITH A COMPARISON TO ACOUSTIC
RADIATION FORCE IMPULSE IMAGING
WENJUN YANG,* TOMY VARGHESE,* TIMOTHY ZIEMLEWICZ,y MARCI ALEXANDER,y MEGHAN LUBNER,y
JAMES LOUIS HINSHAW,y SHANE WELLS,y and FRED T. LEE, JR.y
*Department of Medical Physics, University of Wisconsin School of Medicine and Public Health, University ofWisconsin—Madison, Madison, Wisconsin, USA; and yDepartment of Radiology, University of Wisconsin School of Medicine
and Public Health, University of Wisconsin—Madison, Madison, Wisconsin, USA
(Received 2 November 2016; revised 12 April 2017; in final form 20 April 2017)
Acal PhHealthUSA. E
Abstract—We compared a quasi-static ultrasound elastography technique, referred to as electrode displacementelastography (EDE), with acoustic radiation force impulse imaging (ARFI) for monitoring microwave ablation(MWA) procedures on patients diagnosed with liver neoplasms. Forty-nine patients recruited to this study under-went EDE and ARFI with a Siemens Acuson S2000 system after an MWA procedure. On the basis of visualizationresults from two observers, the ablated region in ARFI images was recognizable on 20 patients on average inconjunction with B-mode imaging, whereas delineable ablation boundaries could be generated on 4 patients onaverage. With EDE, the ablated region was delineable on 40 patients on average, with less imaging depth depen-dence. Study of tissue-mimicking phantoms revealed that the ablation region dimensions measured on EDE andARFI images were within 8%, whereas the image contrast and contrast-to-noise ratio with EDE was two to threetimes higher than that obtained with ARFI. This study indicated that EDE provided improved monitoring resultsfor minimally invasive MWA in clinical procedures for liver cancer and metastases. (E-mail: [email protected]) � 2017 World Federation for Ultrasound in Medicine & Biology.
Key Words: Microwave ablation, Electrode displacement elastography, Acoustic radiation force impulse imaging,Liver cancer.
INTRODUCTION
Microwave ablation (MWA) is a minimally invasivetreatment modality used for thermal necrosis of liver tu-mors (Murakami et al. 1995). MWA can be performedwith multiple antennas simultaneously to cover largertreated volumes, with additional benefits such as animproved heating rate while avoiding the risk of skinburns caused by the grounding pad in radiofrequencyablation (RFA) procedures (Harari et al. 2016; Liangand Wang 2007; Lubner et al. 2013; Qian et al. 2012;Wells et al. 2015; Ziemlewicz et al. 2016). Promisingtreatment outcomes were reported for solitary tumorsless than 2 cm in diameter (Lencioni and Crocetti 2012;Shiina et al. 2012), and more recent studies indicate
ddress correspondence to: Wenjun Yang, Department of Medi-ysics, University of Wisconsin School of Medicine and Public, University of Wisconsin—Madison, Madison, WI 53706,-mail: [email protected]
1953
Downloaded for Anonymous User (n/a) at University of Wisconsin MaFor personal use only. No other uses without permission. C
that MWA is successful in treating tumors larger than3 cm (Thamtorawat et al. 2016; Ziemlewicz et al. 2015,2016). The key factor contributing to a successfulMWA procedure is the generation of a sufficientablation margin covering the entire targeted volume(Liang and Wang 2007; Maluccio and Covey 2012).Thus, effective monitoring of the location anddimensions of the ablated region is crucial. The mostwidely used clinical monitoring approach for liverablation procedures is contrast-enhanced computed to-mography (CT) because of the relatively fast imagingspeed and ablation equipment compatibility comparedwith magnetic resonance imaging (MRI). However, CTscans expose both the patient and the clinician to ionizingradiation, require use of intra-venous contrast and gener-ally result in longer treatment durations and higher cost.
Ultrasound, the most cost-efficient and portable im-aging modality, is often used to guide the insertion of theMWA antenna into the tumor (Lubner et al. 2013; Wellset al. 2015; Ziemlewicz et al. 2016). The ablated tumor
dison from ClinicalKey.com by Elsevier on December 29, 2020.opyright ©2020. Elsevier Inc. All rights reserved.

1954 Ultrasound in Medicine and Biology Volume 43, Number 9, 2017
region can be visualized on conventional ultrasound B-mode images from the hyper-echoic region generatedfrom the outgassing of the water vapor bubble cloud dur-ing the procedure. However, a delineable ablation zoneboundary is not always achievable, particularly on thedistal side of the ablation zone, because of the increasedattenuation caused by the bubble cloud during the abla-tion procedure and the similar echogenicity between theablated region and surrounding liver tissue after the pro-cedure (Bharat et al. 2008b; Rubert et al. 2010; Vargheseet al. 2002; Yang et al. 2016).
Shear modulus, which denotes the local stiffness oftissue, varies significantly between the ablated region andsurrounding normal tissue (Sarvazyan et al. 1998). Ther-mal ablation causes tissue protein denaturation, inducingan increase in the shear modulus or stiffness in the ablatedregion (Varghese et al. 2003a, 2004). These changesappear as regions that incur less strain on deformationthan surrounding untreated tissue (Varghese et al. 2002,2003a, 2004). With strain and modulus imaging,ablated regions exhibit high contrast with respect to thenormal, untreated background liver tissue. Becausestrain and modulus imaging can be performed during(Varghese et al. 2004) or immediately after the ablationprocedure (Jiang et al. 2010; Rubert et al. 2010),complete monitoring of ablation, from guidance topreliminary follow-up, is possible using ultrasound(Zhou et al. 2014). Ultrasound elastography for ablationmonitoring was initially developed using methods basedon external compression (Ophir et al. 1991; Van Vledderet al. 2010) or physiologic deformation (Varghese and Shi2004; Varghese et al. 2003b).
To overcome the limitation of external compressionapparatus in clinical application, we introduced an ultra-sound elastography technique referred to as electrodedisplacement elastography (EDE), which was designedspecifically for RFA or MWA monitoring (Bharat andVarghese 2006; Bharat et al. 2008a, 2008b; Jiang et al.2010; Rubert et al. 2010; Varghese et al. 2002; Yanget al. 2016). EDE uses minute manual perturbations ofthe ablation needle (Jiang et al. 2010; Rubert et al.2010) by clinicians to introduce tissue deformationsinternally at the ablation site. We have reported itsfeasibility in both ex vivo (Bharat et al. 2005, 2008a;Pareek et al. 2006) and in vivo (Jiang et al. 2010; Rubertet al. 2010) experiments using porcine models and inhuman patients (Yang et al. 2016).
In this study, we compare the MWAmonitoring per-formance of EDE with that of a commercially imple-mented ultrasound elastography technique, referred toas acoustic radiation force impulse (ARFI) imaging(Nightingale et al. 2001). ARFI produces stiffness imagesof local tissue by applying ultrasound push beams withacoustic intensities and durations significantly higher
Downloaded for Anonymous User (n/a) at University of Wisconsin MaFor personal use only. No other uses without permission. C
than those in diagnostic imaging to deform the local tis-sue, and then using beams with diagnostic intensity toanalyze the local tissue displacement along the directionof the push beams. With the advantage of local compres-sion using the push beams and decreased inter-operatorvariability, ARFI has been used for breast cancer detec-tion (Nightingale et al. 2001) and RFA monitoring(Fahey et al. 2008). However, to the best of our knowl-edge, there are no existing literature reports on MWAmonitoring using ARFI on liver neoplasms in a signifi-cant number of clinical cases.
We previously reported that the ablated region isclose to an ellipsoidal shape in EDE images withenhanced signal- and contrast-to-noise ratios (SNRe andCNRe) compared with conventional B-mode images(Yang et al. 2016). In this study, we compared the delin-eation performance of EDE and ARFI on both tissue-mimicking (TM) phantoms and a clinical applicationfor monitoring MWA ablation procedures. Phantom in-clusion dimensions, image contrast and CNRe werecompared for the phantom study, followed by a binaryevaluation of the delineation of the ablated region for49 patients with liver cancer in a clinical study.
METHODS
Tissue-mimicking phantomTwo TM phantoms previously constructed using an
oil-in-gelatin matrix with a stiffer partially ablated inclu-sion (mimicking a partially ablated tumor) (Ingle andVarghese 2014) were scanned using both ARFI andEDE. The centers of the inclusions in the two phantomswere located at depths of 3.5 and 5.5 cm, respectively.The Young’s modulus contrast of the stiff ellipsoidal in-clusion (mimicking the ablated region), irregularlyshaped target (mimicking tumor) and background was1.9:1.2:1, measured using a Supersonic Imagine (Super-sonic, Aix-en-Provence, France) system. The threedistinct regions can be distinguished on B-mode imagesby the different and distinct backscatter levels that wereincorporated into the TM phantom manufacture, as illus-trated in Figure 1(a,d). A stainless-steel needle wasbonded to the inclusion to mimic the MWA antenna.
In Figure 1(b,e and c,f) are EDE and ARFI images ofthe TM phantom, respectively. Image contrast andcontrast-to-noise ratio (CNRe) were used to quantify thevisibility of the inclusion on EDE and ARFI images.Two rectangular regions of interest (ROIs) with dimen-sions of 10 3 10 mm were placed inside and above theinclusion to calculate the image contrast and CNRe usingthe equation
Image contrast5
����Ib2IoIo1Ib
���� (1)
dison from ClinicalKey.com by Elsevier on December 29, 2020.opyright ©2020. Elsevier Inc. All rights reserved.
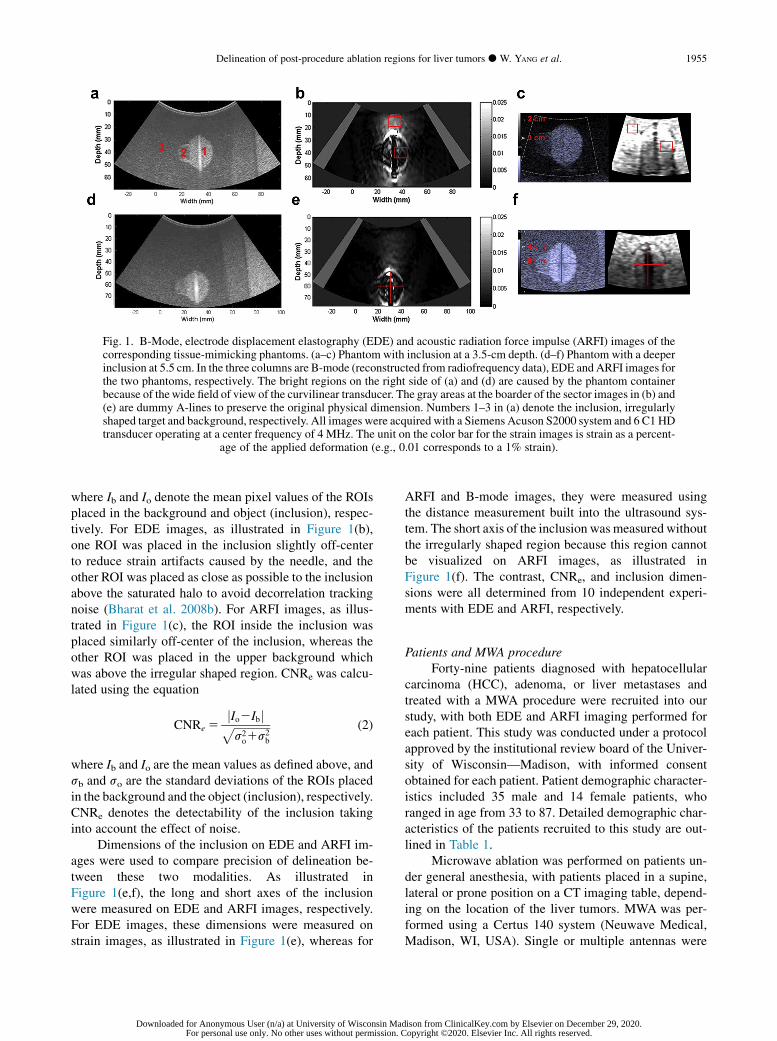
Fig. 1. B-Mode, electrode displacement elastography (EDE) and acoustic radiation force impulse (ARFI) images of thecorresponding tissue-mimicking phantoms. (a–c) Phantom with inclusion at a 3.5-cm depth. (d–f) Phantom with a deeperinclusion at 5.5 cm. In the three columns are B-mode (reconstructed from radiofrequency data), EDE and ARFI images forthe two phantoms, respectively. The bright regions on the right side of (a) and (d) are caused by the phantom containerbecause of thewide field of view of the curvilinear transducer. The gray areas at the boarder of the sector images in (b) and(e) are dummy A-lines to preserve the original physical dimension. Numbers 1–3 in (a) denote the inclusion, irregularlyshaped target and background, respectively. All images were acquired with a Siemens Acuson S2000 system and 6 C1 HDtransducer operating at a center frequency of 4 MHz. The unit on the color bar for the strain images is strain as a percent-
age of the applied deformation (e.g., 0.01 corresponds to a 1% strain).
Delineation of post-procedure ablation regions for liver tumors d W. YANG et al. 1955
where Ib and Io denote the mean pixel values of the ROIsplaced in the background and object (inclusion), respec-tively. For EDE images, as illustrated in Figure 1(b),one ROI was placed in the inclusion slightly off-centerto reduce strain artifacts caused by the needle, and theother ROI was placed as close as possible to the inclusionabove the saturated halo to avoid decorrelation trackingnoise (Bharat et al. 2008b). For ARFI images, as illus-trated in Figure 1(c), the ROI inside the inclusion wasplaced similarly off-center of the inclusion, whereas theother ROI was placed in the upper background whichwas above the irregular shaped region. CNRe was calcu-lated using the equation
CNRe 5jIo2Ibjffiffiffiffiffiffiffiffiffiffiffiffiffis2o1s2
b
p (2)
where Ib and Io are the mean values as defined above, andsb and so are the standard deviations of the ROIs placedin the background and the object (inclusion), respectively.CNRe denotes the detectability of the inclusion takinginto account the effect of noise.
Dimensions of the inclusion on EDE and ARFI im-ages were used to compare precision of delineation be-tween these two modalities. As illustrated inFigure 1(e,f), the long and short axes of the inclusionwere measured on EDE and ARFI images, respectively.For EDE images, these dimensions were measured onstrain images, as illustrated in Figure 1(e), whereas for
Downloaded for Anonymous User (n/a) at University of Wisconsin MaFor personal use only. No other uses without permission. C
ARFI and B-mode images, they were measured usingthe distance measurement built into the ultrasound sys-tem. The short axis of the inclusion was measured withoutthe irregularly shaped region because this region cannotbe visualized on ARFI images, as illustrated inFigure 1(f). The contrast, CNRe, and inclusion dimen-sions were all determined from 10 independent experi-ments with EDE and ARFI, respectively.
Patients and MWA procedureForty-nine patients diagnosed with hepatocellular
carcinoma (HCC), adenoma, or liver metastases andtreated with a MWA procedure were recruited into ourstudy, with both EDE and ARFI imaging performed foreach patient. This study was conducted under a protocolapproved by the institutional review board of the Univer-sity of Wisconsin—Madison, with informed consentobtained for each patient. Patient demographic character-istics included 35 male and 14 female patients, whoranged in age from 33 to 87. Detailed demographic char-acteristics of the patients recruited to this study are out-lined in Table 1.
Microwave ablation was performed on patients un-der general anesthesia, with patients placed in a supine,lateral or prone position on a CT imaging table, depend-ing on the location of the liver tumors. MWA was per-formed using a Certus 140 system (Neuwave Medical,Madison, WI, USA). Single or multiple antennas were
dison from ClinicalKey.com by Elsevier on December 29, 2020.opyright ©2020. Elsevier Inc. All rights reserved.

Table 1. Patient demographics
Age (y)Range 33–87Mean 6 SD 62.0 6 11.9
Gender (M/F) 35/14Tumor type (HCC/adenoma/metastases) 37/2/10Tumor size (mean 6 SD) 2.3 6 0.9Cirrhosis (yes/no) 33/16Fatty liver (yes/no) 1/49Prior treatment (yes/no) 12/37
HCC 5 hepatocellular carcinoma; SD 5 standard deviation.
1956 Ultrasound in Medicine and Biology Volume 43, Number 9, 2017
inserted based on the tumor dimensions and location, un-der ultrasound B-mode imaging guidance. Typical abla-tion power and duration were 65 W and 5 min,respectively.
EDE and ARFI data acquisitionBoth ARFI and EDE studies were performed using a
Siemens Acuson S2000 system (Siemens Medical Solu-tions, Mountain View, CA, USA) with a 6 C1 HD curvi-linear transducer. For the phantom study, EDE and ARFIimages were acquired at imaging depths of 6 and 7 cm,with a focus set at 3.5 or 5.5 cm, respectively, for thetwo phantoms, using a center frequency of 4 MHz.ARFI images were obtained using Virtual Touch soft-ware, and images were generated in real time. EDE strainimages were obtained from a continuous loop of in-phase/quadrature data acquired during manual perturba-tion of the ablation antenna, with an amplitude of1–2 mm. EDE strain images were computed betweentwo in-phase/quadrature frames within the loop using a2-D cross-correlation algorithm (Chen et al. 2009). Thesetwo frames of in-phase/quadrature data were selectedmanually by observing the movement of the ablation re-gion in the B-mode images. The cross-correlation kerneldimension was selected as 0.45 3 1.41 mm to generatestrain images with high SNR (Varghese 2009; Vargheseand Ophir 1997). Because the A-lines with curvilineartransducers are sparser toward the bottom of the image,the tracking and processing kernel width expandsaccordingly with depth (Yang et al. 2016).
For the clinical study, EDE and ARFI images weresequentially acquired immediately after the MWA pro-cedure. Imaging depth was selected to span the entire ab-lated region, with the focus selected to lie slightly belowthe ablation zone to reduce shadowing from gas bubblesgenerated during the ablation procedure. ARFI and EDEimage acquisition protocols were similar to that used forthe phantom study, and manual perturbation of the abla-tion needle was performed by a physician. The displace-ment of the MWA antenna was performed manually bythe clinician in a sinusoidal manner along the axis ofthe antenna. Out-of-plane displacement of the antenna
Downloaded for Anonymous User (n/a) at University of Wisconsin MaFor personal use only. No other uses without permission. C
was minimized. For patients for whom multiple antennaswere placed, only the central antenna was perturbed toobtain the EDE strain image. For patients with multipletumors, only the first treated tumor was analyzed in thisstudy to avoid artifacts caused by repositioning of the an-tennas. The 2-D cross-correlation kernel dimension usedfor the clinical study was 1.35 3 3.29 mm, which waslarger than that used for the phantom study to includemore echo signal to improve deformation tracking causedby the increased attenuation present in clinical data sets(Varghese 2009; Varghese and Ophir 1997; Yang et al.2016). The monitoring ability of EDE and ARFI wasassessed based on whether a visible boundary could bedelineated to differentiate the ablated zone from thesurrounding untreated tissue. In some ARFI images, thelocation of ablated region could be reasonablyrecognized with reference to the B-mode images, eventhough they were depicted without a clear boundary.For these cases, the monitoring ability of ARFI isdefined as recognizable, which is inferior to thedefinition of delineable. Image analysis and reporting ofthe success rate for monitoring MWA using EDE andARFI were performed by two observers based on thecriteria described above. The observers include agraduate student (observer 1) with more than 4 y ofexperience in the processing, visualization and analysisof strain images, and a physician (observer 2) withmore than 10 y of experience with MWA procedures.
RESULTS
In Figure 1(b,c and e,f) are the EDE and ARFI im-ages of the TM phantoms. The inclusion in the EDE im-ages of the TM phantom was identified from thebackground by a saturated bright halo surrounding alow-strain or darker region. In the ARFI images, the in-clusions can be reasonably differentiated from the back-ground by a dark boundary with a relatively increasednoise level. The irregularly shaped target marked by thenumber 2, as illustrated in Figure 1(a), could be identifiedin EDE images (Fig. 1b,e), whereas it is not visible inARFI images (Fig. 1c,f).
Ten independent EDE and ARFI images were ac-quired for both TM phantoms. The image contrast andCNRe of the phantom with the inclusion at 3.5 cm were3.45 6 0.68 and 2.82 6 0.81, respectively, and thesame quantities measured on ARFI images for the samephantom were 1.036 0.13 and 0.626 0.32, respectively.The image contrast and CNRe for this phantom was twoto three times higher with EDE than with ARFI imagesas illustrated in Figure 2 (phantom 1). For the phantomwith the deeper inclusion at 5.5 cm, image contrast andCNRe in EDE images were 3.91 6 1.63 and2.45 6 1.02, respectively; in ARFI images, these two
dison from ClinicalKey.com by Elsevier on December 29, 2020.opyright ©2020. Elsevier Inc. All rights reserved.

Fig. 2. Image contrast and CNRe comparison obtained on electrode displacement elastography (EDE) and acoustic ra-diation force impulse (ARFI) images of tissue-mimicking phantoms. (a) Image contrast comparison of EDE and ARFIperformed on the phantom with inclusion at a 3.5-cm depth (phantom 1) and at a 5.5-cm depth (phantom 2) (b) Compar-ison of CNRe on the same two phantoms. The height of the bars represents the mean value of 10 independent experiments,
and the error bar denotes the standard deviation of the measurements.
Delineation of post-procedure ablation regions for liver tumors d W. YANG et al. 1957
quantities were 1.00 6 0.05 and 0.18 6 0.11, respec-tively. The detectability of the inclusion with EDE wasabout 4 to 10 times higher than that with ARFI in the sec-ond phantom with a deeper inclusion, as illustrated inFigure 2 (phantom 2).
The precision of delineation in terms of inclusion di-mensions for 10 independent realizations for both EDEand ARFI images is illustrated in Figure 3. The longaxis (height) of the inclusion of phantom 1 was25.67 6 0.49, 26.21 6 0.92 and 27.86 6 0.92 mmmeasured with B mode, EDE and ARFI images, respec-tively, and the short axis (width) of this inclusionmeasured with these imaging modalities was18.33 6 0.26, 19.85 6 0.20 and 19.83 6 0.70 mm. Forphantom 2, the long axis of the inclusion measuredwith B mode, EDE and ARFI was 25.86 6 0.26,
Fig. 3. Dimensions of phantom inclusion comparison among Bacoustic radiation force impulse (ARFI) images. (a) Long- and s(phantom 1) measured in B-mode, EDE and ARFI images. (b)sion at 5.5 cm (phantom 2). The height of the bars represents th
and the error bars denote th
Downloaded for Anonymous User (n/a) at University of Wisconsin MaFor personal use only. No other uses without permission. C
26.41 6 0.40 and 27.38 6 0.39 mm, respectively, andthe short axis measured with these three modalities was19.43 6 0.28, 20.70 6 0.79 and 21.55 6 0.35 mm,respectively. Differences in the inclusion dimensionsmeasured with these three modalities were within 8%(2.2/25.67 z 8%).
For the clinical study, results from observer 1 indi-cate that the liver neoplasm targeted with the MWA pro-cedure was successfully delineated with EDE for 45 ofthe 49 patients. The ablated region could be delineatedon two ARFI images, both presenting with tumors atdepths of around 4 cm. The ablation zone with EDEwas delineated by the dark region surrounded by a brighthalo as illustrated in the TM phantom study. The bound-ary of the ablated region was relatively blurred in theARFI images, as illustrated in Figure 4(a,d). Ablation
-mode, electrode displacement elastography (EDE) andhort-axis lengths of the phantom with inclusion at 3.5 cmSame comparison conducted for the phantom with inclu-e mean value of the 10 independent imaging experimentse standard deviation.
dison from ClinicalKey.com by Elsevier on December 29, 2020.opyright ©2020. Elsevier Inc. All rights reserved.

Fig. 4. Comparison of electrode displacement elastography (EDE) and acoustic radiation force impulse (ARFI) imagesimmediately after microwave ablation. (a,c) B-Mode and ARFI images of the ablated region. (b,d) EDE images generated
from radiofrequency data. The ablated region is somewhat delineable in the ARFI images (a,c).
1958 Ultrasound in Medicine and Biology Volume 43, Number 9, 2017
zones were delineated using ARFI images from observer2 for 6 of 49 patients, with 4 of the tumors at a depth lowerthan 5 cm, 1 tumor located between 5 and 10 cm and 1tumor at a depth .10 cm. The number of ablation zonesdelineated using EDE images from observer 2 was 34.
For most of the 49 patients, the ablated region wasnot clearly delineable with a visible boundary as illus-trated in Figure 5(a,d) for ARFI imaging. However,with reference to B-mode images, the location of the ab-lated region could be recognized in 13 patients with ARFIimages from observer 1, as illustrated in Figure 5(d). Thedelineation success rate of EDE and ARFI is summarizedin Table 2. It was found that the success rate decreasedfrom 40% to 11.1% as the imaging depth increasedfrom shallow, that is, 5 cm to deeper than 10 cm. Partiallyvisualized ablation regions were identified on 27 patientsby observer 2. The imaging depth dependence wassimilar to that of observer 1, dropping from 80% to22.2% when the imaging depth increased from ,5 cmto .10 cm, as outlined in Table 3.
The total success rates for boundary delineation withEDE in the 49 patients were 91.8% and 69.4%, whereasthose with ARFI were 4.1% and 12.2%, respectively,for observers 1 and 2. EDE exhibited less imaging depth
Downloaded for Anonymous User (n/a) at University of Wisconsin MaFor personal use only. No other uses without permission. C
dependence with a relatively stable success rate for eachdepth range. The success rate with ARFI improved to26.5% and 55.1%, respectively for the two observers,for partial visualization of the ablated region in conjunc-tion with B-mode imaging. However, as tumor depthincreased, the entire ablated region, especially towardthe bottom of the tumor, was blurred. The numbers of de-lineable and partially visualized ablation regions for thetwo observers are illustrated in Figure 6.
DISCUSSION AND CONCLUSIONS
We have compared the performance of EDE andARFI for monitoring minimally invasive MWA treat-ments for liver neoplasms in human patients along witha TM phantom study. ARFI imaging reported in this pa-per is based on the commercial software available onthe Siemens Acuson S2000 system.
The TM phantom study revealed that both ARFI andEDE reasonably delineate a stiffer inclusion embedded ina homogeneous background. The dimensions of the in-clusion in the EDE and ARFI images were in a similarrange within 8% difference, although the long and shortaxes appeared slightly larger on ARFI images. The
dison from ClinicalKey.com by Elsevier on December 29, 2020.opyright ©2020. Elsevier Inc. All rights reserved.
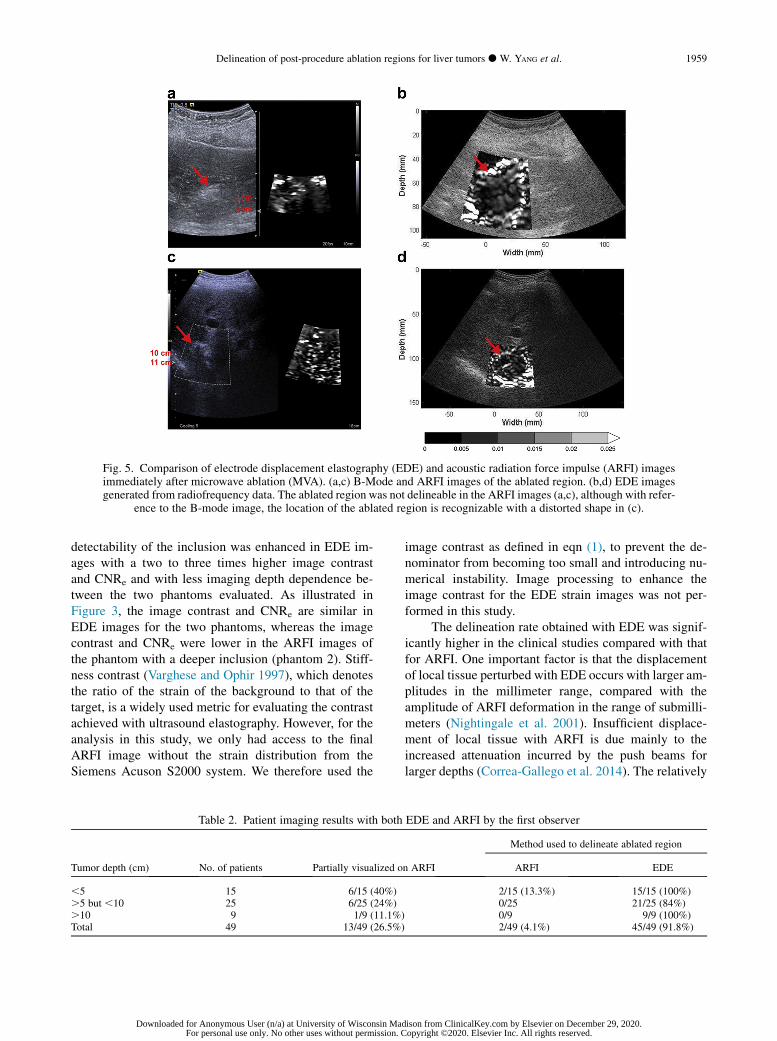
Fig. 5. Comparison of electrode displacement elastography (EDE) and acoustic radiation force impulse (ARFI) imagesimmediately after microwave ablation (MVA). (a,c) B-Mode and ARFI images of the ablated region. (b,d) EDE imagesgenerated from radiofrequency data. The ablated region was not delineable in the ARFI images (a,c), although with refer-
ence to the B-mode image, the location of the ablated region is recognizable with a distorted shape in (c).
Delineation of post-procedure ablation regions for liver tumors d W. YANG et al. 1959
detectability of the inclusion was enhanced in EDE im-ages with a two to three times higher image contrastand CNRe and with less imaging depth dependence be-tween the two phantoms evaluated. As illustrated inFigure 3, the image contrast and CNRe are similar inEDE images for the two phantoms, whereas the imagecontrast and CNRe were lower in the ARFI images ofthe phantom with a deeper inclusion (phantom 2). Stiff-ness contrast (Varghese and Ophir 1997), which denotesthe ratio of the strain of the background to that of thetarget, is a widely used metric for evaluating the contrastachieved with ultrasound elastography. However, for theanalysis in this study, we only had access to the finalARFI image without the strain distribution from theSiemens Acuson S2000 system. We therefore used the
Table 2. Patient imaging results with both
Tumor depth (cm) No. of patients Partially visualized o
,5 15 6/15 (40%).5 but ,10 25 6/25 (24%).10 9 1/9 (11.1%)Total 49 13/49 (26.5%)
Downloaded for Anonymous User (n/a) at University of Wisconsin MaFor personal use only. No other uses without permission. C
image contrast as defined in eqn (1), to prevent the de-nominator from becoming too small and introducing nu-merical instability. Image processing to enhance theimage contrast for the EDE strain images was not per-formed in this study.
The delineation rate obtained with EDE was signif-icantly higher in the clinical studies compared with thatfor ARFI. One important factor is that the displacementof local tissue perturbed with EDE occurs with larger am-plitudes in the millimeter range, compared with theamplitude of ARFI deformation in the range of submilli-meters (Nightingale et al. 2001). Insufficient displace-ment of local tissue with ARFI is due mainly to theincreased attenuation incurred by the push beams forlarger depths (Correa-Gallego et al. 2014). The relatively
EDE and ARFI by the first observer
n ARFI
Method used to delineate ablated region
ARFI EDE
2/15 (13.3%) 15/15 (100%)0/25 21/25 (84%)0/9 9/9 (100%)2/49 (4.1%) 45/49 (91.8%)
dison from ClinicalKey.com by Elsevier on December 29, 2020.opyright ©2020. Elsevier Inc. All rights reserved.
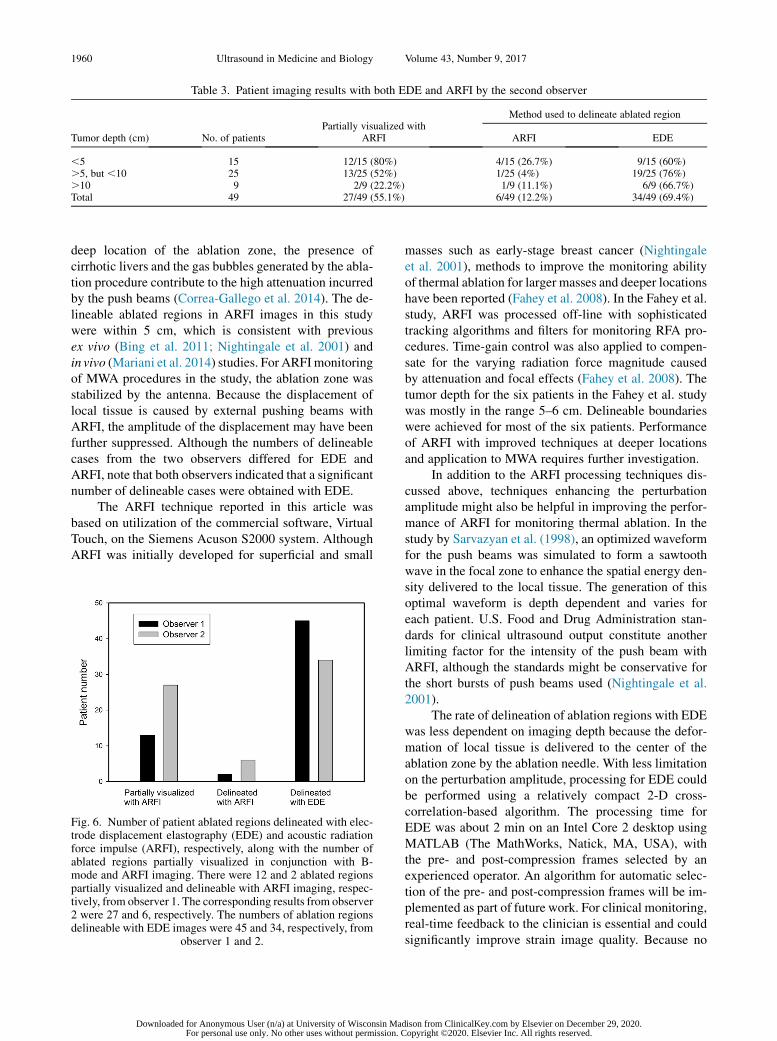
Table 3. Patient imaging results with both EDE and ARFI by the second observer
Tumor depth (cm) No. of patientsPartially visualized with
ARFI
Method used to delineate ablated region
ARFI EDE
,5 15 12/15 (80%) 4/15 (26.7%) 9/15 (60%).5, but ,10 25 13/25 (52%) 1/25 (4%) 19/25 (76%).10 9 2/9 (22.2%) 1/9 (11.1%) 6/9 (66.7%)Total 49 27/49 (55.1%) 6/49 (12.2%) 34/49 (69.4%)
1960 Ultrasound in Medicine and Biology Volume 43, Number 9, 2017
deep location of the ablation zone, the presence ofcirrhotic livers and the gas bubbles generated by the abla-tion procedure contribute to the high attenuation incurredby the push beams (Correa-Gallego et al. 2014). The de-lineable ablated regions in ARFI images in this studywere within 5 cm, which is consistent with previousex vivo (Bing et al. 2011; Nightingale et al. 2001) andin vivo (Mariani et al. 2014) studies. For ARFImonitoringof MWA procedures in the study, the ablation zone wasstabilized by the antenna. Because the displacement oflocal tissue is caused by external pushing beams withARFI, the amplitude of the displacement may have beenfurther suppressed. Although the numbers of delineablecases from the two observers differed for EDE andARFI, note that both observers indicated that a significantnumber of delineable cases were obtained with EDE.
The ARFI technique reported in this article wasbased on utilization of the commercial software, VirtualTouch, on the Siemens Acuson S2000 system. AlthoughARFI was initially developed for superficial and small
Fig. 6. Number of patient ablated regions delineated with elec-trode displacement elastography (EDE) and acoustic radiationforce impulse (ARFI), respectively, along with the number ofablated regions partially visualized in conjunction with B-mode and ARFI imaging. There were 12 and 2 ablated regionspartially visualized and delineable with ARFI imaging, respec-tively, from observer 1. The corresponding results from observer2 were 27 and 6, respectively. The numbers of ablation regionsdelineable with EDE images were 45 and 34, respectively, from
observer 1 and 2.
Downloaded for Anonymous User (n/a) at University of Wisconsin MaFor personal use only. No other uses without permission. C
masses such as early-stage breast cancer (Nightingaleet al. 2001), methods to improve the monitoring abilityof thermal ablation for larger masses and deeper locationshave been reported (Fahey et al. 2008). In the Fahey et al.study, ARFI was processed off-line with sophisticatedtracking algorithms and filters for monitoring RFA pro-cedures. Time-gain control was also applied to compen-sate for the varying radiation force magnitude causedby attenuation and focal effects (Fahey et al. 2008). Thetumor depth for the six patients in the Fahey et al. studywas mostly in the range 5–6 cm. Delineable boundarieswere achieved for most of the six patients. Performanceof ARFI with improved techniques at deeper locationsand application to MWA requires further investigation.
In addition to the ARFI processing techniques dis-cussed above, techniques enhancing the perturbationamplitude might also be helpful in improving the perfor-mance of ARFI for monitoring thermal ablation. In thestudy by Sarvazyan et al. (1998), an optimized waveformfor the push beams was simulated to form a sawtoothwave in the focal zone to enhance the spatial energy den-sity delivered to the local tissue. The generation of thisoptimal waveform is depth dependent and varies foreach patient. U.S. Food and Drug Administration stan-dards for clinical ultrasound output constitute anotherlimiting factor for the intensity of the push beam withARFI, although the standards might be conservative forthe short bursts of push beams used (Nightingale et al.2001).
The rate of delineation of ablation regions with EDEwas less dependent on imaging depth because the defor-mation of local tissue is delivered to the center of theablation zone by the ablation needle. With less limitationon the perturbation amplitude, processing for EDE couldbe performed using a relatively compact 2-D cross-correlation-based algorithm. The processing time forEDE was about 2 min on an Intel Core 2 desktop usingMATLAB (The MathWorks, Natick, MA, USA), withthe pre- and post-compression frames selected by anexperienced operator. An algorithm for automatic selec-tion of the pre- and post-compression frames will be im-plemented as part of future work. For clinical monitoring,real-time feedback to the clinician is essential and couldsignificantly improve strain image quality. Because no
dison from ClinicalKey.com by Elsevier on December 29, 2020.opyright ©2020. Elsevier Inc. All rights reserved.
Delineation of post-procedure ablation regions for liver tumors d W. YANG et al. 1961
specific parameter optimizations are needed for differentpatients with EDE, the computational time could besignificantly improved with faster software implementa-tion on commercial systems for real-time imaging.
Based on the TM phantom and patient studies re-ported here, EDE and ARFI were compared with respectto their imaging performance in monitoring MWA.Because of the limited number of delineable ablation re-gions in ARFI images, the patient study was designed as abinary evaluation. A quantitative analysis of EDE and B-mode image assessments was performed in our previousstudy (Yang et al. 2016). The performance of the com-mercial ARFI software, Virtual Touch imaging, couldbe improved with more advanced processing techniquesor advanced push beam profile design, as discussedabove. However, the overall ability of ARFI in moni-toring MWA is limited by the relatively small perturba-tion amplitudes produced with radiation force, theincreased attenuation in cirrhotic livers and the largerdepth range needed for ablation procedures. EDE, withits advantage of not being significantly dependent on tu-mor depth, stable perturbation amplitudes at all depthsand relatively straightforward real-time implementationfor commercial systems, could be an alternative tech-nique for monitoring minimally invasive MWA duringablation procedures.
Acknowledgments—This study was funded by National Institutes ofHealth Grant 2 R01 CA112192. We are grateful to SiemensMedical So-lutions USA, Inc., for providing the S2000 Axius Direct UltrasoundResearch Interface (URI) and Software licenses. We also sincerelyappreciate the support of every clinician and sonographer involved inthis study.
REFERENCES
Bharat S, Varghese T. Contrast-transfer improvement for electrodedisplacement elastography. Phys Med Biol 2006;51:6403–6418.
Bharat S, Techavipoo U, Kiss MZ, Liu W, Varghese T. Monitoring stiff-ness changes in lesions after radiofrequency ablation at differenttemperatures and durations of ablation. Ultrasound Med Biol2005;31:415–422.
Bharat S, Fisher TG, Varghese T, Hall TJ, Jiang J, Madsen EL,Zagzebski JA, Lee FT Jr. Three-dimensional electrode displacementelastography using the Siemens C7 F2 fourSight four-dimensionalultrasound transducer. Ultrasound Med Biol 2008a;34:1307–1316.
Bharat S, Varghese T, Madsen EL, Zagzebski JA. Radio-frequency abla-tion electrode displacement elastography: A phantom study. MedPhys 2008b;35:2432–2442.
Bing KF, Rouze NC, Palmeri ML, Rotemberg VM, Nightingale KR.Combined ultrasonic thermal ablation with interleaved ARFI imagemonitoring using a single diagnostic curvilinear array: A feasibilitystudy. Ultrason Imaging 2011;33:217–232.
Chen L, Treece GM, Lindop JE, Gee AH, Prager RW. A quality-guideddisplacement tracking algorithm for ultrasonic elasticity imaging.Med Image Anal 2009;13:286–296.
Correa-Gallego C, Karkar AM, Monette S, Ezell PC, Jarnagin WR,KinghamTP. Intraoperative ultrasound and tissue elastographymea-surements do not predict the size of hepatic microwave ablations.Acad Radiol 2014;21:72–78.
Fahey BJ, Nelson RC, Hsu SJ, BradwayDP, Dumont DM, Trahey GE. Invivo guidance and assessment of liver radio-frequency ablation with
Downloaded for Anonymous User (n/a) at University of Wisconsin MaFor personal use only. No other uses without permission. C
acoustic radiation force elastography. UltrasoundMed Biol 2008;34:1590–1603.
Harari CM, Magagna M, Bedoya M, Lee FT Jr, Lubner MG,Hinshaw JL, Ziemlewicz T, Brace CL. Microwave ablation:Comparison of simultaneous and sequential activation of mul-tiple antennas in liver model systems. Radiology 2016;278:95–103.
Ingle A, Varghese T. Three-dimensional sheaf of ultrasound planesreconstruction (SOUPR) of ablated volumes. IEEE Trans Med Im-aging 2014;33:1677–1688.
Jiang J, Brace C, Andreano A, DeWall RJ, Rubert N, Fisher TG,Varghese T, Lee F Jr, Hall TJ. Ultrasound-based relative elasticmodulus imaging for visualizing thermal ablation zones in a porcinemodel. Phys Med Biol 2010;55:2281–2306.
Lencioni R, Crocetti L. Local-regional treatment of hepatocellular car-cinoma. Radiology 2012;262:43–58.
Liang P, Wang Y. Microwave ablation of hepatocellular carcinoma.Oncology 2007;72(Suppl 1):124–131.
Lubner MG, Brace CL, Ziemlewicz TJ, Hinshaw JL, Lee FT Jr. Micro-wave ablation of hepatic malignancy. Semin Interv Radiol 2013;30:56–66.
Maluccio M, Covey A. Recent progress in understanding, diagnosing,and treating hepatocellular carcinoma. CA Cancer J Clin 2012;62:394–399.
Mariani A, Kwiecinski W, Pernot Balvay D, Tanter M, Clement O,Cuenod CA, Zinzindohoue F. Real time shear waves elastographymonitoring of thermal ablation: In vivo evaluation in pig livers.J Surg Res 2014;188:37–43.
Murakami R, Yoshimatsu S, Yamashita Y, Matsukawa T, Takahashi M,Sagara K. Treatment of hepatocellular carcinoma: Value of percuta-neous microwave coagulation. AJR Am J Roentgenol 1995;164:1159–1164.
Nightingale KR, PalmeriML,Nightingale RW, TraheyGE. On the feasi-bility of remote palpation using acoustic radiation force. J AcoustSoc Am 2001;110:625–634.
Ophir J, Cespedes I, Ponnekanti H, Yazdi Y, Li X. Elastography: A quan-titative method for imaging the elasticity of biological tissues. Ultra-sonic imaging 1991;13:111–134.
Pareek G, Wilkinson ER, Bharat S, Varghese T, Laeseke PF, Lee FT Jr,Warner TF, Zagzebski JA, Nakada SY. Elastographic measurementsof in-vivo radiofrequency ablation lesions of the kidney. J Endourol2006;20:959–964.
Qian GJ, Wang N, Shen Q, Sheng YH, Zhao JQ, Kuang M, Liu GJ,Wu MC. Efficacy of microwave versus radiofrequency ablation fortreatment of small hepatocellular carcinoma: Experimental and clin-ical studies. Eur Radiol 2012;22:1983–1990.
Rubert N, Bharat S, DeWall RJ, Andreano A, Brace C, Jiang J,Sampson L, Varghese T. Electrode displacement strain imaging ofthermally-ablated liver tissue in an in vivo animal model. MedPhys 2010;37:1075–1082.
Sarvazyan AP, Rudenko OV, Swanson SD, Fowlkes JB,Emelianov SY. Shear wave elasticity imaging: A new ultrasonictechnology of medical diagnostics. Ultrasound Med Biol 1998;24:1419–1435.
Shiina S, Tateishi R, Arano T, Uchino K, Enooku K, Nakagawa H,Asaoka Y, Sato T, Masuzaki R, Kondo Y, Goto T, Yoshida H,Omata M, Koike K. Radiofrequency ablation for hepatocellular car-cinoma: 10-Year outcome and prognostic factors. Am J Gastroen-terol 2012;107:569–577. quiz 578.
Thamtorawat S, Hicks RM, Yu J, Siripongsakun S, Lin WC, Raman SS,McWilliams JP, Douek M, Bahrami S, Lu DS. Preliminary outcomeof microwave ablation of hepatocellular carcinoma: Breaking the 3-cm barrier? J Vasc Interv Radiol 2016;27:623–630.
Van Vledder MG, Boctor EM, Assumpcao LR, Rivaz H, Foroughi P,Hager GD, Hamper UM, Pawlik TM, Choti MA. Intra-operative ul-trasound elasticity imaging for monitoring of hepatic tumour ther-mal ablation. HPB (Oxford) 2010;12:717–723.
Varghese T. Quasi-static ultrasound elastography. Ultrasound Clin 2009;4:323–338.
Varghese T, Ophir J. A theoretical framework for performance charac-terization of elastography: The strain filter. IEEE Trans UltrasonFerroelectr Freq Control 1997;44:164–172.
dison from ClinicalKey.com by Elsevier on December 29, 2020.opyright ©2020. Elsevier Inc. All rights reserved.

1962 Ultrasound in Medicine and Biology Volume 43, Number 9, 2017
Varghese T, Shi H. Elastographic imaging of thermal lesions in liverin-vivo using diaphragmatic stimuli. Ultrason Imaging 2004;26:18–28.
Varghese T, Zagzebski JA, Lee FT Jr. Elastographic imaging of thermallesions in the liver in vivo following radiofrequency ablation: Pre-liminary results. Ultrasound Med Biol 2002;28:1467–1473.
Varghese T, Techavipoo U, Liu W, Zagzebski JA, Chen Q, Frank G,Lee FT Jr. Elastographic measurement of the area and volumeof thermal lesions resulting from radiofrequency ablation:Pathologic correlation. AJR Am J Roentgenol 2003a;181:701–707.
Varghese T, Zagzebski JA, Rahko P, Breburda CS. Ultrasonic imaging ofmyocardial strain using cardiac elastography. Ultrason Imaging2003b;25:1–16.
Varghese T, Techavipoo U, Zagzebski JA, Lee FT Jr. Impact of gas bub-bles generated during interstitial ablation on elastographic depictionof in vitro thermal lesions. J UltrasoundMed 2004;23:535–544. quiz545–546.
Downloaded for Anonymous User (n/a) at University of Wisconsin MaFor personal use only. No other uses without permission. C
Wells SA, Hinshaw JL, Lubner MG, Ziemlewicz TJ, Brace CL,Lee FT Jr. Liver ablation: Best practice. Radiol Clin North Am2015;53:933–971.
Yang W, Ziemlewicz TJ, Varghese T, Alexander ML, Rubert N,Ingle AN, Lubner MG, Hinshaw JL,Wells SA, Lee FT. Post-proced-ure evaluation of microwave ablations of hepatocellular carcinomasusing electrode displacement elastography. Ultrasound Med Biol2016;42:2893–2902.
Zhou Z, Wu W, Wu S, Xia J, Wang CY, Yang C, Lin CC, Tsui PH.A survey of ultrasound elastography approaches to percutaneousablation monitoring. Proc Inst Mech Eng H 2014;228:1069–1082.
Ziemlewicz TJ, Hinshaw JL, Lubner MG, Brace CL, Alexander ML,Agarwal P, Lee FT Jr. Percutaneous microwave ablation of hepato-cellular carcinoma with a gas-cooled system: Initial clinical resultswith 107 tumors. J Vasc Interv Radiol 2015;26:62–68.
Ziemlewicz TJ, Wells SA, Lubner MG, Brace CL, Lee FT Jr,Hinshaw JL. Hepatic tumor ablation. Surg Clin North Am 2016;96:315–339.
dison from ClinicalKey.com by Elsevier on December 29, 2020.opyright ©2020. Elsevier Inc. All rights reserved.