d-r12i 491 thermal diffusion in carbon/carbon … · comparison of emtl and tprl diffusivity...
TRANSCRIPT

D-R12i 491 THERMAL DIFFUSION IN CARBON/CARBON COMPOSITES(U) PURDUE 1/11UNIV LAFAYETTE IND THERMOPHYSICAL PROPERTIES RESEARCHCENTER R E TAYLOR ET AL. JUN 82 TPRL-256
UNCLASSIFIED AFOSR-TR-82-0959 F49628-8i-K-S83 1 F/G 1/4 , NL
EIIIIEIIIIEIIIIIIIIIIIIIIIIIIIIIIIhIlllhhlllllllIIIIIIIIIIIIhI
i" I_ _

11Le1131 1.
I III1 o° , ILII1 1.25 11.14 f 1.6II 111= 1W1
MICROCOPY RESOLUTION TEST CHARTNATIONAL SUMAU OF STANDARS - 1663 - A

=THERM OPHYSICAL PROPERTIES=
I'll LRESEARCH LABORATORY -
AFOSR-TR. 82-0959TPRL 256
THERMAL DIFFUSION IN CARBON/ CARBON COMPOSITES
Special Report for AFOSR Grant F 49620-81-K-0011
by
R.E. Taylor, J. Jortner and H. Groot, DT1C
June, 1982 I -2
Approved for public rele&Se
3School of Mechanical Engineering
Purdue University, West Lafayette, Indiana
hto 8 2 ? 1j releas e
82 11 12 046Iln------------

SECURIT'i CLASSIFICATION OF THIS PAGE (When Date Entered)
READ INSTRUCTIONSREPORT DOCUMENTATION PAGE BEFORE COMPLETING FORMREPORT NUMBER 2. GOVT ACCESSI9N No, 3. RECIPIENT'S CATALOG NUMBER
.- T R 8 - 0 N O.a .NU
4. TITLE (end Subtitle) 5. TYQF Or REPORT & PERIOD COVERED
Thermal Diffusion in Carbon/Carbon Composites 15 Feb. 1981 - 30 Jan. 19826. PERFORMING ORG. REPORT NUMBER
___TPRL 256
7. AUTHOR(e) 6. CONTRACT OR GRANT NUMBER(&)R.E. Taylor, J. Jortner, and H. Groat F 49620-81-K-0011
9. PERFORMING ORGANIZATION NAME AND ADDRESS 10. PROGRAM ELEMENT. PROJECT. TASK
AREA & WORK UNIT NUMBERSThermophysical Properties Research Laboratory ( i I F FPurdue University a3 06/West Lafayette. TN 1.7Qn7
II. CONTROLLING OFFICE NAME AND ADDRESS 12. REPORT DATE
Air Force Office of Scientific Research/WA June, 1982Bolling AFB, DC 20332 13. NUMBER OF PAGES
62
14. MONITORING AGENCY NAME & ADDRESS(If different from Controiling Office) IS. SECURITY CLASS. (of this report)
UnclassifiedISa. DECL ASSI FI CATION/ DOWNGRAOIN G
SCHEDULE
16. DISTRIBUTION STATEMENT (of thle Report)
17. DISTRIBUTION STATEMENT (of the abstract entered in Block 20, it different from Report)
IS. SUPPLEMENTARY NOTES
19. KEY WORDS (Continue on reverse side it neceeery nd Identify by block number)
Carbon/Carbon CompositesThermal DiffusivityThermal ConductivityTransient Heat Flow N(.. .
SABSTRACT (Continue on reverse aide it necessary end identify by block number)
"-Transient heat flow through carbon/carbon materials was studied. It was foundthat special steps must be taken to Weasure thermal diffusivity along theprincipal axes, especially at them4?itures below about 500.C. However, theuse of off-axis samples permited the unanbigious determination of diffusivityvalues, not only in the off-axis directions, but also along the principalaxes. Diffusivity results for the matrix and for the fiber bundles were alsoobtained directly and indirectly and the results were in reasonable agreement.It was shown that there is a surface laver in carbon/carbonnntpmrLllin .
FORM
DD wJAN7 1473 UNCLASSIFIEDSECURITY CLASSIFICATION OF THIS PAGE (*%en De Enteredj ),
;,1- ,€

20. ABSTRACT (continued)
-. ) which inter-constituent thermal gradients are significant and
beyond which they are negligible. Carbon/carbon materials maybe treated as homogeneous through regions which are much thicker
than the heterogeneity dimension but in surface layers subjectedto large heat fluxes, the heterogeneity must be considered.
Accessionl ForINTIS GRA&IDTIC TABUnannounced F]Justificatio
By -Distribut ion/
Availability Codes
IAvail and/orDist iSpecial
Or'i
@ .
II~~~~~~~~~~N .ili i C iO iil i i ii . .
TPRL 256
THERMAL DIFFUSION IN CARBON/CARBON COMPOSITES
Special Report for Air Force Office of Scientific Research
by
R.E. Taylor, J. Jortner and H. Groot
TI-1
June, 1982
AIR FO E OTCE E o SCI T1FIC SKAR (A.mC)OTICE OF T.-.,::?,L TO DTIC .
This technila-.. ,p',rt ha s bsen rn-,:ie'-.r and isapproved r:, :- , 1 s -,e IA" AFR 193-12.Distrit.;tion 1:1 ,.,alimited.
ATT hnW J. KEDlsoChief, Tohnical Information Division

4
TABLE OF CONTENTS
Page
I. INTRODUCTION .. . . . .. . . . . . . 1
II. SAMPLE DESCRIPTION . . . . . . . . . 4
III. RESULTS . . . . . . . . . . . . . 7
IV. DISCUSSION . . . .. . . . . . .21
V. REFERENCES . . . . . . .. . .30
VI. APPENDICES:
I. On the Use of Off-Axis Testing to Characterize the ThermalDiffusivities of Orthogonally Reinforced Carbon-CarbonComposites . . . . . . . . . . . 31
II. Analysis of Transient Temperature Response of a Carbon-CarbonComposite During Continuous Heating at One Surface . . . 49
LIST OF TABLES
1. Parameters Affecting Thermal Diffusivity Experiments . . . . 3
2. Bulk Density Values . . . . . . . . . . . 6
3. Measured Unit Cell Dimensions (mm) and Calculated Yarn BundleFractions for On-Yarn Diffusivity Specimens from O.D. Region ofBillet F-11 . . . . . . . . . . .. . 8
4. Energy Materials Testing Laboratory Diffusivity Samples . . . 9
5. Thermal Diffusivity Results . . . . . . . . 10
6. Thermal Diffusivity Results (Axial-2) . . . . . . . 14
7. Diffusivity Values as a Function of Position . . . . . . 16
8. Diffusivity Values for a Fiber Bundle Experiment . . . . . 17
9. Diffusivity Results (EMTL) . . . . . . . . . . 18
10. "Steady State" Thermal Diffusivity Results . . . . . 22
11. Calculated and Measured 45* Off-Axis Diffusivity Values . . . 24

TABLE OF CONTENTS (continued)
LIST OF FIGURES Page
1. Nomenclature for 3D Cylindrical Unit Cell and Sketch
Showing Five Directions in which Diffusivity was measured . . . . 5
2. Thermal Diffusivity Results ...... ................... .. 11
3. Normalized Rear Face Temperature Rise for Axial-CircumferentialSample at 5520 ......................... 13
4. Location of Point-Source Temperature Sensing Probe(Axial-2 Sample) .......... ........................ .15
5. Comparison of EMTL and TPRL Diffusivity Results for AxialSamples ............ ........................... .19
6. Comparison of EMTL and TPRL Difusivity Results for Radial4 Samples .......... .. ............................. 20
7. "Steady-State" Diffusivity Values ..... ............... .. 23
8. "Steady-State" Diffusivity Values Versus Fiber Fraction inDirection of Measurement ......... .................... 25
9. Thermal Diffusivity of the Matrix as a Function of Temperature . 26
10. Thermal Diffusivity of the Fiber Bundles as a Function ofTemperature ........... .......................... .27
4,
I
I!

4
THERMAL DIFFUSION IN CARBON/CARBON COMPOSITES
I. INTRODUCTION
Thermal conductivity is the property used to relate heat fluxes to
steady state temperature gradients. The application of standard thermal
conductivity test methods to heterogeneous composites presents no parti-
cular difficulties, beyond the usual ones associated with this relatively
difficult property determination.
The heat-balance equation for transient conditions may be written as
V. XVT + internal sources and sinks = Cp , (1)
where X is the thermal conductivity, C is the specific heat at constantp
pressure, and p the density. If there are no internal sources and sinks,
V. WVT = Cpdt (2)
For homogeneous materials whose thermal conductivity is nearly independent
of temperature, we may treat X as a constant. Then V• XVT be .omes XV2T and
equation (2) can be written as
,V2T = Cp , (3)
or V2T p -P l idT (4)X~ adt'
where a = X/C p is the thermal diffusivity.
For one-dimensional heat flow
d2T dT4a -- . (5)
dx2 dt
For heterogeneous materials, X is not independent of position and X
should not be moved from behind the Dell operator [Eq. (2) to Eq. (3)]. In
principle, then, the concept of diffusivity is inapplicable to heterogeneous
materials. However, in practice, materials are never homogeneous as point
defects, dislocations, grain boundaries, voids, etc., are present even in
so-called homogeneous materials. Yet diffusivity techniques have been suc-
4cessfully applied to these materials for more than a century. Deliberate
- -

2
attempts to extend diffusivity techniques to obviously heterogeneous materi-
als have been made for many years. These efforts have been intensified
since 1960's due to the development of the flash method for measuring dif-
fusivity because of the relatively simple sample geometry, rapidity of
measurements, and ease of handling materials with a large range of diffusiv-
ity values over large temperature intervals with a single apparatus.
The flash method, in which the front face of a small disc-shaped sample
is subjected to a short laser burst and the resulting rear face temperature
rise is recorded, is used in over 80% of the present thermal diffusivity
measurements throughout the world. A highly developed apparatus exists at
TPRL and we have been involved in an extensive program to evaluate the tech-
nique and broaden its uses. The apparatus consists of a Korad K2 laser, a
high vacuum system including a bell jar window for viewing the sample, a
tantalum tube heater surrounding a sample holding assembly, a spring-loaded
thermocouple and IR detector, appropriate biasing circuits, amplifiers, A-D
converters, crystal clocks, and a minicomputer-based digital data acquisition
system capable of accurately taking data in the 40 microsecond and loiger
time domain. The computer controls the experiment, collects the data, calcu-
lates the results, and compares the raw data with the theoretical model.
The flash method has now been applied very successfully to composites
consisting of a second phase more-or-less randomly dispersed in a continuous
matrix [1,2] and also to composite materials composed of homogeneous layers
sandwiched together [3,4].
A third class of composite materials is composed of fiber reinforcements
imbedded in a more-or-less homogeneous matrix. Such composites are becoming
increasingly important in new technological applications. One major sub-group
of this class of coxrosites are known as carbon/carbon materials. Carbon/carbon
materials consist of arrays of graphite fibers lined up in one direction im-
bedded in a matrix consisting of arrays of graphite fibers lined up in
more-or-less perpendicular directions with the spaces filled with graphite.
A variety of geometries have been fabricated including 1-D, 2-D, 3-D and
multidimensional arrays depending on the orientation of the fibers. These
composites are being used in an increasing number of applications [5], at

' + + " L • " . ... .. . . ... .. . .. •
3
least some of which involve transient heating conditions. It is therefore
of interest to examine the response of such heterogeneous composites to trans-
ient heat fluxes.
The graphite fibers have high thermal conductivity/diffusivity values
while the matrix materials have relatively low values compared to those of
the fibers. Thus the fibers oriented in the direction of heat flow act as
preferred paths for heat transfer. When such composites are subjected to
an instantaneous heat pulse on one surface, the temperature wave is not
planar. The results of thermal diffusivity methods and the applicability of
the concept of diffusivity for such materials legitimately can be questioned.
A preliminary study [6] on a coarse-weave 3-D carbon/carbon composite has
shown that the normalized rear face temperature response curve following a
laser pulse did not follow the theoretical pattern for homogeneous materials.
However, the response curve for a fine-weave 3-D carbon/carbon material fol-
lowed the theoretical curve very closely [7].
A detailed experimental study of thermal diffusion along the principal
axes in an AVCO radially-pierced fabricT carbon/carbon material (HEPN-1)
has been performed recently [8]. This work was supplemented by computer-
aided analysis of thermal diffusion in HEPN-l by J. Jortner (included as an
appendix in Reference 8.) HEPN-l can be considered to be a 2-D carbon/carbon
material. From tbe combined results of the study on HEPN-I and the previous
research [6,7], the important parameters governing the results of a particular
4 diffusivity experiment can be delineated. These parameters are listed in
Table 1.
TABLE 1
Parameters Affecting Thermal Diffusivity Experiments
1. Magnitude of diffusivity of fibers and of matrix.
2. Fiber fraction ratio in direction of heat flow.
3. Thickness of sample in relation to fiber bundle spacing.
4. Rear face temperature sampling area and location.

'4
Furthermore, from these experiments, it has been shown that:
(1) It is possible to measure diffusivity values which correspond to
thermal conductivity values by using a sufficiently thick sample
and large viewing area. The sample thickness required becomes
less as the temperature is increased.
(2) It is possible to measure in-situ diffusivity values of fibers and
of matrix by using point source temperature sensors and thin samples.
(3) It is possible to determine the effects of imperfections such as
delaminations on the thermal diffusivity. These effects are
manifest by matrix values lower than those for regions where the
defects are not present (point source detector methods) and by an
increase in diffusivity values for artifacts measured in gaseous
environments as opposed to vacuum.
The present study was undertaken to further examine the use of the
flash diffusivity technique for coarse-weave carbon/carbons. This study
consisted of measuring the diffusivity of a variety of samples machined
from on billet of 3-D carbon/carbon including measurements along the princi-
pal axes and at 450 to the principal axes, intercomparing the resultss and
examining the expected rear face temperature rise curves based on finite
element techniques.
II. SAMPLE DESCRIPTION
A piece of carbon/carbon from billet F-11, from the 7-inch Mantech
program [9] was used as the sample material. The piece was from Ring No.
17 near the outside diameter in the forward part of the billet [10]. The
dimensions were 5.8cm in the axial direction, 1.8 cm in the radial direction
and 2.3 cm in the circumferential direction. Thermal diffusivity samples
were machined in the axial, (z) radial (r) and circumferential (e) directions.
In addition, samples were machined at 450 between the radial and axial
directions (rz) and at 450 between the axial and circumferential directions
(ze). The nomenclature and directions tested as shown in Figure 1 (also
included in Appendix I). The sample dimensions, masses and bulk density
values are listed in Table 2. Measured unit cell dimensions and calculated

rr
BRAIA DIETOSTSE
YARN4 BUDL
MATRX HOP ORCIz
YANBNL
Figue 1 Noencatue fo 3- Cyindica Uni Cel ad SetcShowingIA Fie iecin nWihDfuivt/a esrd
S- ----- DLE

6
TABLE 2
BULK DENSITY VALUES
SAMPLE THICK WIDTH WIDTH MASS DENSITY(NO.) (IN.) (IN.) (IN.) (GMS) (GMS CM- 3 )
Axial 0.3008 0.4728 0.5000 2.2308 1.914
Radial 0.2628 0.4990 0.5004 2.0430 1.900
Circumferential 0.2998 0.4906 0.5009 2.3017 1.907
Axial- *Circumferential 0.3010 0.4993* 1.8672 1.934
Axial- 0.2990 0.5000 -- 1.8590 1.932Radial
Diameter

7
L yarn bundle fractions for the principal axi are given in Table 3 (Table 1 of
Appendix I). Thus the actual yarn bundle fractions in the axial, radial and
circumferential directions for these samples are 0.195, 0.067 and 0.277, res-
pectively.
Energy Materials Testing Laboratory measured the thermal diffusivity of
axial and radial samples from the forward and aft sections of Rings 17 and 18
from billet F-11. These samples are listed in Table 4.
III. RESULTS
Thermal diffusivity results were obtained on the samples listed in Table
2 over the temperature range from about 100 to 1000*C. For each data set,
diffusivity values were calculated at 10, 20, 25, 30, 33 '/3, 40, 50, 60,
66 2/3, 70, 75, 80 and 90% of the rear face temperature rise. The rear face
temperature rise was one to two degrees Celsius. For homogeneous materials
* the diffusivity values calculated at these various percentage rises would all
fall within a ±2% band. However, for materials with preferred heat diffusion
paths, the diffusivity values calculated at various percent rises decrease
with increasing percent rise. The magnitude of this increase is determined
by the parameters listed in Table 1. In order to indicate the magnitude of
* the change in diffusivity values with increasing percent rise, diffusivity
values calculated at 20, 50 and 80 percent rise times are given in Table 5.
These results are plotted in Figure 2. From Table 5 and Figure 2, the following
observations are made:
1. The diffusivity values for the circumferential, axial-circumferential
and axial-radial samples are relatively independent of percent rise
at all temperatures.
2. The diffusivity values for the axial sample, especially those calcu-
lated from 50 to 80%, become relatively independent of percent rise
above 2000C.
3. The diffusivity values for the radial sample decrease rapidly with
increasing percentage rise, especially at the lower temperatures and
between 20 and 50%.

8
TABLE 3
Measured Unit Cell Dimensions (mm) and Calculated Yarn
Bundle Fractions for On-Yarn Diffusivity Specimensfrom O.D. Region of Billet F-Il
Radial Axial CircSample Sample Sample
rz .41
r 0 .81 -
z - .84r
z E - 1.67 -
Cr - - 1.07
C - - .97z
6 - 2.18 2.29r
6z 1.63 - 1.63
6e 3.05 3.30
V. .067 .195 .277
1. Dimensions listed are averages of several measurements madeon polishe4 surface of the specimen with a calibrated-eyepiecemicroscope at 20X magnification.
2. Yarn bundle fractions calculated using relations of this type:
Vr - Tz r0
Sz 60

4.
z
0
0 -00 ,0
H
-
1-4
4 0~ 4 ,-40%4
~~rI 0-I H~
'4-44'4-1
L n II H 1-4 2-
t -A 000
4- 0c

10
TABLE 5
THERMAL DIFFUSIVITY RESULTS
DIFFUSIVITY VALUE AT
T§MP. 20% 50% 80%SAMPLE (C)
Axial 126 0.690 0.560 0.545277 0.503 0.386 0.366475 0.375 0.284 0.269640 0.333 0.249 0.234804 0.289 0.211 0.199960 0.191 0.177 0.187
Radial 121 0.530 0.437 0.368308 0.344 0.274 0.229468 0.261 0.211 0.183
- 647 0.216 0.174 0.154831 0.178 0.146 0.134997 0.159 0.135 0.1231150 0.146 0.126 0.118
Circumferential 102 0.869 0.830 0.818213 0.680 0.624 0.602424 0.438 0.407 0.395641 0.339 0.320 0.313822 0.287 0.272 0.269
1012 0.263 0.242 0.2411198 0.233 0.225 0.230
Axial-Circumferential 103 0.627 0.627 0.612
233 0.449 0.450 0.449367 0.345 0.340 0.330552 0.268 0.261 0.261691 0.232 0.229 0.228
Axial-Radial 97 0.526 0.502 0.507165 0.362 0.350 0.330321 0.264 0.258 0.251495 0.215 0.202 0.199656 0.170 0.168 0.175730 0.166 0.160 0.163

Joe 0
CI00 0.0
00
-1 0
U) 0
0
it4 4 1' 0 W-4
z z4
IA'~0
0
0
ci ci i ci 0Ail~iniii -IVti30

12
In fact, the rear face temperature rise curves for the off-axis
samples followed the theoretical models very well. This is illustrated in
Figure 3 which shows the comparison between the theoretical model and the
actual experimental data for the axial-circumferential sample at 552*C.
Thus unambiguous diffusivity values are obtained for the off-axis samples
and, as will be shown later, this will permit the development of a technique
to obtain unambiguous on-axis diffusivity values.
In order to further explore the diffusivity values in the axial
direction, a second sample was machined. This sample, here after identified
as Axial 2 was 0.5 inches thick compared to only 0.3 inches thick for the
axial sample. The diffusivity values measured on Axial 2 are given in Table
6. Since these results are similar to those obtained for the other axial
sample, they are not shown in Figure 2. In addition to the diffusivity
values obtained using an IR detector, diffusivity values were measured on
Axial-2 using a point source thermocouple. The thermocouple locations in
relation to fiber bundle positions are illustrated in Figure 4. The diffusi-
vity values calculated at 20, 50 and 80% rise times at these positions are
given in Table 7. Positions 1, 2 and 6 were partially on axial fiber
bundles, while 3, 4 and 5 were mainly on transverse fibers. In particular
the diffusivity values for positions 2 and 6 were higher than those for the
other positions, especially at lower percent rise times. At the longer rise
times, all the diffusivity values are much closer together. In fact the
spread in diffusivity values is 250% at 20% rise and only 35% at 80% rise.
The longer rise time values agree well with the value extrapolated to 23*C
from the higher-temperature IR detector data (Tables 2 and 6).
In one experiment, the thermocouple was well-centered on an axial fiber
bundle. The results are given in Table 8. The experimental rise curve data
closely followed the theoretical model and the diffusivity values were all
in the range from 2.71 to 2.83 cm2 sec-1 from 20 to 80% rise. These values
correspond to the in-situ fiber bundle at 23*C.
The diffusivity values reported by EMTL for their axial and radial samples
are given in Table 9. These values were calculated at 50% rise times. The
EMTL results for the axial samples are compared to the present results in
Figure 5 and for the radial samples in Figure 6. For both types of samples,
the present results parallel the EMTL results but are substantially larger.

13
.OD
cc I$.4 $4LL
ft' Ix J
A ~LU
zw ,'
H1.
~Lf
Cl) E-4
z
X H C) J
0 1 CDva )n coj01-CD -)
0 CmI I l
m W) 0~ () CD~ M CV) W LL .JOu0~~ ~ ~ ~ ~ ~ f 0 -0 M -- O
sum~~~~~~~~ <z~zsmJ X:tsjpsf~~

14
TABLE 6
THERMAL DIFFUSIVITY RESULTS
(Axial 2)
TEMP. DIFFUSIVITY RESULTS AT(C) 20% 50% 80
94 0.637 0.614 0.607220 0.519 0.437 0.416306 0.415 0.345 0.321414 0.326 0.296 0.293520 0.314 0.276 0.271
4
4
4
4p
_4,

o 15
Figure 4. Location of Point-Source Temperature Sensing Probe(Axial-2 Sample).

16
TABLE 7
DIFFUSIVITY VALUES AS A FUNCTION OF POSITION
(Axial-2 Sample, 23C)
POSITION CALCULATED DIFFUSIVITY AT(NO.) 20% 50% 80%
1 1.418 1.042 0.9252 2.252 1.678 1.1533 1.210 1.005 0.9584 0.879 0.775 0.7825 1.017 0.892 0.8286 2.104 1.401 0.978

17
TABLE 8
THERMAL DIFFUSIVITY VALUES FOR A FIBER BUNDLE EXPERIMENT
THERINRL DIFFUSVITY
23C
VRLUE 7JIECSEC)
BRSELINE: 0.94888 8. 820688HRLFHAX: 3. 46995 1.828033MRAX HUm: 5. 99998 8. 0731580
RLPHR PERCENT VALUE TIME(EC)
2. 69307 18. 8 i. 44599 G. 80976L
2. 74091 28. 0 1. 95198 8. 812177
2. 75494 25. 0 2. 20498 0. 8133332. 74287 38. 0 2. 45797 0. 014619
2. 72871 33.73 2. 62663 8. 0155352. 71593 40.8 2. 96296 0. 8173512. 74435 58. 8 3. 46995 0. 0208332. 71226 68. 0 3. 97594 0. 0236962. 74445 66. 7 4. 31327 0. 0261362.79052 783.0 4.48193 0. 0272392. 82674 75. 0 4. 73493 B. 8294992. 78088 B. 9 4. 9B792 0. 8332312. 92117 98. 8 5. 49391 0. 842628
FINITE PULSE TIME CORRECTION
2. 809395 25. 02. 776838 58. 02. 94823- 75. 0

L18
TABLE 9
DIFFUSIVITY RESULTS (EMTL)
EMTL SAMPLE SAMPLE TEMP. DIFFUSIVITY(NO.) (NO.) (C) (cm 2 sec -1)
F-11-F-5-OT-R-18-D-1 R-1 25 0.51549 0.47599 0.392154 0.320253 0.244355 0.191456 0.161553 0.137703 0.120854 0.104
1000 0.094
F-11-F-5-OB-R-18-D-2 R-2 24 0.53450 0.460
102 0.359151 0.308255 0.230351 0.183451 0.153555 0.132704 0.110851 0.097995 0.088
F-11-F-5-OT-A-18-D-1 Ax-i 25 0.65355 0.593
104 0.513157 0.441256 0.327353 0.255451 0.210555 0.178698 0.153848 0.136988 0.127
F-11-F-5-OB-A-18-D-2 Ax-2 23 0.78650 0.68299 0.531
152 0.444249 0.346349 0.273451 0.223550 0.196647 0.180749 0.160886 0.143992 0.136

19
5 0.
44
LL'44
-H
/3 0SC
(3g,3 AIAe.4ioIU8H
- - - - -- - - - -

20
a!,
Vm
gI .4
0 04.
*14
F-rC)
C31 C30 C2(33S/,W3LU AiA'nA aIW8H

21
IV. DISCUSSION
It has been shown that the diffusivity values calculated at the higher
percentage rise times (longer experimental times) approach or equal the
diffusivity values corresponding to conductivity (steady state) experiments.
Using this as the basis "best" diffusivity values for the five sets of
experiments are listed at selected temperatures in Table 10. These values
are plotted in Figure 7. Using Eq~htion (g) of Appendix I, namely
knn = 1/2(ki + kj), values for the 450 off-axis directions were calculated
from the on-axis values of Table 10. These calculated values are compared
to the experimental values for the two curves measured-namely axial-circum-
ferential and axial-radial in Table 11. In general, the agreement was
within 10%. When we consider the fact that the off-axis samples were not
machined according to the recommended geometry (Figure 8, Appendix I), all
the yarn bundles in the back face viewing area were not directly heated at
the front face and this should lead to lower experimental values for the
off-axis samples. From Table 11, it is noted that the experimental values
are-in fact lower than the calculated values with only one exception
(axial-radial at 100C).
"Steady-State" diffusivity values for 100, 200, 500 and 1000"C are
plotted as a function of fiber fraction in the direction of heat flow in
Figure 8. The solid lines represent the fiber fractions given in Table 3,
(Case I) and the diffusivity values of Table 10 and Figure 7. The dashed
lines in Figure 8 represent the situation in which the average fiber fraction
value of 6.7% for the radial samples is replaced by 3.5% (Case II).
Deshpande, and Bogaard, and Taylor [11] have shown that the fiber fraction in
the IR detector viewing area may be substantially different than that for
the over all sample average, especially for radial samples. Since the actual
viewing area of our IR detector is not known accurately, we wished to examine
the effects caused by the uncertainty of the actual fiber fraction in the
viewing area. The diffusivity values obtained by extrapolating the solid
lines [Case I] and dashed lines [Case II] to 0 and 100% are plotted as a
function of temperature in Figures 9 and 10, respectively. These values aorres-
pond to those for the matrix (Figure 9) and for the fiber bundle (Figure 10).

-22
I.
TABLE 10
+"STEADY STATE" THERMAL DIFFUSIVITY'RESULTS
- SAMPLE DESIGNATION- - -------
TEMP. AXIAL- AXIAL-(0C) AXIAL RADIAL CIRCUMFERENTIAL CIRCUMFERENTIAL RADIAL
100 0.570 0.352 0.803 0.607 0.478200 0.408 0.266 0.621 0.479 0.313300 0.333 0.216 0.483 0.381 0.262400 0.284 0.182 0.401 0.314 0.222500 0.252 0.158 0.350 0.275 0.195600 0.228 0.143 0.315 0.248 0.174700 0.210 0.131 0.291 0.226 0.157800 0.196 0.122 0.270 0.211 0.147900 0.185 0.115 0.255 0.200 0.136
1000 0.175 0.109 0.242 0.192 0.126
2cm2 sec

23
. . . ..........
C22
14
ii-H
4.4
W iK2C) - ".-
3 CD C3
-'V C?C;czC3p
(33/WO IA~ni/7 o-LIN~

24
TABLE 11
CALCULATED AND MEASURED 450 OFF-AXIS DIFFUSIVITY VALUES
TEMP AXIAL-CIRCUMFERENTIAL AXIAL-RADIAL RADIAL-C IRCUMFERENT(0C) MEASURED CALCULATED MEASURED CALCULATED CALCULATED
100 0.607 0.687 0.478 0.461 0.578
200 0.479 0.515 0.313 0.337 0.444300 0.381 0.408 0.262 0.275 0.350400 0.314 0.343 0.222 0.233 0.292500 0.275 0.301 0.195 0.205 0.254600 0.248 0.272 0.174 0.186 0.229700 0.226 0.251 0.157 0.171 0.211800 0.211 0.233 0.147 0.159 0.196900 0.200 0.220 0.136 0.150 0.185
1000 0.192 0.209 0.126 0.142 0.176
I __

25
0 C3
0 0
r4J
_ 0
I- 41
*-A
-H 4J
C:)
4J C
>C 0 rCC w (J~S~N3)AIII~flLII 1U~~HJ
0 .c

26
_____ ___ ~~C)cu
$4
44
0
CDU
0
-- A
~10 0
r4
co
ar ,- 4
V.4
F- -r/ LLJ.3
C3 .
/E CD -AF- i
o 9/W AiIAsA o lW-H

27
Go
0
w 0r
14
a0
4-a
cu
w0 3AiIA~~~snAA i IHW ]H

28
It was found possible to remove most of the axial fiber bundles from
Sample Axial 2 and to replace them with matrix. Temperature rise curves
measured in the resulting sample tended to follow the theoretical model fairly
closely and a diffusivity value of 0.32 cm 2 sec-1 was obtained at 110*C in
air. This is close to the Case II value, but is not in good agreement with the
Case I results (Figure 9). Attempts were also made to determine the effects of
slight displacement of the radial sample at 100*C. The results for those
displacements were 0.398, 0.429, 0.390 at the 50% rise times measured in air.
This variation is too small to permit a large error in the fiber-fraction
assigned to the IR viewing area. However, two interesting observations were
made during these tests; namely that the diffusivity values were noticeably
lower and less dependent on percent rise time than the values recorded initially
(Table 5 and Figure 2), and the diffusivity values were noticeably lower when
measured in vacuum. The diffusivity values measured in air and calculated at
80 and 90% rise times were less than 10% below the 50% rise time values when
measured in air. The radial sample had been sent to J. Jortner for microscopic
examination and this procedure included sample polishing. If we substitute
the "Steady-State" diffusivity values measured on the polished sample, we
would still be on the dashed line (Case II Figure 8) at least for the 100°C
data. Thus it is possible that the diffusivity values measured on the matrix-
only sample agrees with the diffusivity values obtained by extrapolating to
0% fiber-fraction.
Reasonable agreement was obtained between the diffusivity value measured
for a fiber bundle (Table 8) and the diffusivity value extrapolated to 100%
fiber-fraction for either the Case I or Case II situation (Figure 10).
The flash technique has been shown to be a powerful tool for studying
transient heat flow in carbon/carbon materials. As a result of the present
work, the following conclusions can be drawn:
1. Thermal diffusivity values measured on 45° off-axis samples yield
unique values which define unambiguously the "steady-state" diffusi-
vity values along the principal axes.
2. Diffusivity values measured along the principal axis, especially
below 500*C in the axial and radial directions, depend upon sample
thickness, detector viewing area, and percent rise time chosen to
make the calculations. Nevertheless, it is possible to obtain
diffusivity values equivalent to the steady state case.

29
4
3. It is possible to determine the diffusivity of the matrix and
of the fiber bundles both by direct measurements and by extra-
polating diffusivity values measured on samples containing vari-
ous known fiber fractions in the direction of measurement to 0
and 100%, respectively.
4. It is possible to determine the diffusivity values for the matrix
and fiber bundles as a function of temperature using the extrapo-
lation method given in 3.
5. There is a surface layer in carbon/carbon in which inter-constitu-
ent temperature gradients are significant and beyond which they
are negligible. The material may be treated as homogeneous for
the purposes of heat conduction through parts which are much
thicker than the heterogeneity dimension. However, within a
surface layer subjected to large heat fluxes, the analysis must
consider the heterogeneity.
Additional diffusivity work on carbon/carbon materials is warranted. Speci-
fically such work should take into account certain deficiencies in the present
study. These deficiencies include:
(1) Insufficient sample material for machining samples along all
principal axes and all 45* off-axis directions
(2) Viewing area of IR detector and relation to fiber-bundle locations
should be controlled
(3) Off-axis samples should be configured as shown in Figure 8 of
Appendix I.
(4) Effects of handling samples, especially polishing, and the effects
of gaseous environment should be investigated.

30
REFERENCES
1. Lee, H.J. and Taylor, R.E., "Determination of Thermophysical Propertiesof Layered Composites by Flash Method," Thermal Conductivity 14, Editedby P.G. Klemens and T.K. Chu (New York: Plenum Press), 423-34, 1976.
2. Lee, T.Y.R. and Taylor, R.E., "Thermal Diffusivity of Dispersed Materials,"J. heat Transfer, 100(4), 720-4, 1978.
3. Lee, T.Y.R., Donaldson, A.B., and Taylor, R.E., "Thermal Diffusivity ofLayered Composites," Thermal Conductivity 15, Edited by V.V. Mirkovich(New York: Plenum Press), 135-48, 1978.
4. Taylor, R.E., "Heat-Pulse Thermal Diffusivity Measurements," HighTemperatures - High Pressures, 11 43-58, 1978.
5. Fitzer, E. and Heym, M., "High -Temperature Mechanical Properties of Carbonand Graphite (A Review)," High Temperatures - High Pressures, 10, 29-66,1978.
6. Taylor, R.E. and Groot, H., "The Thermophysical Properties of a CoarseWoven Carbon-Carbon Rocket Nozzle Material," TPRL 206R, February 1980.
7. Taylor, R.E., Groot, H., and Showmaker, R.L., "Thermophysical Propertiesof Fine Weave Carbon/Carbon Composites," presented at 16th AIAA Thermo-physics Conference.
8. Taylor, R.E. and Groot, H., "Thermophysical Properties of a Carbon/CarbonComposite," TPRL 244, May 1981.
9. Ellis, R.A., "7-Inch Billet Program Progress Report," RNTS Meeting, 1979,CPIA Publication 310, January 1980.
10. Energy Materials Testing Laboratory, "Interim Report on Mechanical andThermal Properties of Billet F-11 Seven Inch Mantech Billet Program Vol.II: Thermal Properties," MCIC No. 109500, March 1980.
11. Deshpande, M.S., Bogaard, R.H., and Taylor, R.E., "Variances In The Measure-ment of Thermal Diffusivity on Course Weave C-C Composites and the DependenceUpon Fiber-Fraction," International Journal of Thermophysics, 2 (4), 357-70,1981.

31
ON THE USE OF OFF-AXIS TESTING TO CHARACTERIZE THE THERMAL
DIFFUSIVITIES OF ORTHOGONALLY REINFORCED CARBON-CARBON COMPOSITES*
Julius Jortner
Science Applications, Inc.
Irvine, CA 92715
February 1982
Introduction and Summary
For coarse weave composites, significant errors can occur in interpreting
diffusivity tests because of temperature differences among the variously
oriented yarn bundles in the test specimen (eg, Reference 1). One
manifestation of these errors is that the diffusivities calculated from
the backface temperature traces in flash-method tests are significantly
affected by the temperature rise-fraction used to reduce the data.
Previous efforts to measure the thermal diffusivities of 3D carbon-carbon
composites have used samples oriented to measure the principal conductivi-
ties - that is, in the directions parallel to each of the three orthogonal
sets of yarn bundles in the composite. This article describes some tests
on a representative coarse weave composite in whtch data also were obtained
in directions at appreciable angles to the yarns. The diffusivities inferred
from these off-axis tests show less dependence on rise fraction, and appear,
therefore, to be more reliable indicators of bulk composite behavior than the
on-axis data. This finding leads to a recommendation that off-axis testing
* Acknowledgements
The interest and support of R.E. Taylor (Purdue University) are gratefullyacknowledged. The research was sponsored by Air Force Office of ScientificResearch under Contract F49620-81-C-0011 via a subcontract from PurdueUniversity. Discussions with F.I. Clayton and W.C. Loomis, of SAI, were ofbeneficial influence on the work presented.
.1

32
be included routinely in the characterization of 3D composites. However,
because of the limited number of tests conducted in the effort described,
further testing appears necessary to firmly establish the validity of
the recommendation. In particular, the dependence of the off-axis data
on specimen dimensions and proportions needs exploration.
Experimental Results
A piece of carbon-carbon billet F-11, from the 7-Inch Mantech program (Refer-
ence 2), was supplied to TPRL for the purpose of exploring the thermal dif-
fusivity in a coarse-weave material. A schematic of the unit cell of a 3D
cylindrical composite is shown in Figure 1. The piece, about 22 cubic centi-
meters in volume, was taken from the outer region of the billet where the
yarn bundle fractions in each of the three principal directions are approxi-
mately (Table 1):
Vr - .067
va = .195
= .277
Samples were excised at TPRL to measure diffusivity in each of five directions:
the three "on-axis" directions, along the radial, axial, and circ yarn
bundles; and in two "off-axis" directions, 45-degrees between the axial and
radial directions, and 45-degrees between the axial and circ directions.
These 'directions are illustrated in the lower half of Figure 1. The purpose
of the 45-degrees off-ax,s tests was to provide data which would check the
self-consistency of the diffusivity results, as the off-axis data is, in
principle (Reference 3), predictable from the on-axis data.
The tests were by the flash-laser method, described in Reference 1, and the
data were reduced at TPRL from the backface rise times corresponding to rise-
fractions of 20, 50, and 80 percent. These results are listed in Table 2.
The data have been plotted in Figures 2, 3, and 4 for rise-fractions of 20, 50,
and 80 percent, respectively.
2

33
RADIALYARN BUNDLEB HOOP OR CIRC
MATRIX YARN BUNDLE
r
A ,XIAL YARNI b
BUNDLE
BILLET It A. NOMENCLATURE
rB. DIRECTIONS TESTED
e rz
450-
450
450
ze
Figure 1. Nomenclature for 3D cylindrical Unit Cell and SketchShowing Five Directions in which Diffusivity was Measured.
3

Table 1
Measured Unit Cell Dimensions (mm) and Calculated YarnBundle Volume Fractions for On-Yarn Diffusivity Specimens
from O.D. Region of Billet F-11
Radi al Axi al Ci rcSample Sample Sample
rz .41
r. .81
Zr - .84
ze 1.67 -
Cr - 1.07
Cz .97
Ar - 2.18 2.29
AZ 1.63 - 1.63
3.05 3.30
Vi .067 .195 .277
1) Dimensions listed are averages of several measurements madeon polished surface of the specimen with a calibrated-eyepiecemicroscope at 20X magnification.
2) Yarn bundle volume fractions calculated using relations of thistype:
gr r ro
4

35
TABLE 2
THERMAL DIFFUSIVITY RESULTS (cm2/sec)
DIFFUSIVITY VALUE AT RISE
TEMP. FRACTIONSAMPLE (90 20Z 50Z 80Z EFFECT, %
Axial 124 0.627 0.542 0.508 23.4126 0.690 0.560 0.545 26.6277 0.503 0.386 0.366 37.4475 0.375 0.284 0.269 39.4640 0.333 0.249 0.234 42.3804 0.289 0.211 0.199 45.2960 0.191 0.177 0.187 2.1
Radial 121 0.530 0.437 0.368 44.0308 0.344 0.274 0.229 50.2468 0.261 0.211 0.183 42.6647 0.216 0.174 0.154 40.3831 0.178 0.146 0.134 32.8997 0.159 0.135 0.123 29.3
1150 0.146 0.126 0.118 23.7
Circumferential 102 0.869 0.830 0.818 6.2213 0.680 0.624 0.602 13.0424 0.438 0.407 0.395 10.9641 0.339 0.320 0.313 8.3822 0.287 0.272 0.269 6.7
1012 0.263 0.242 0.241 9.1
1198 0.233 0.225 0.230 1.3
Axial-Circumferential 103 0.627 0.627 0.612 2.5
233 0.449 0.450 0.449 0.0367 0.345 0.340 0.330 4.5552 0.268 0.261 0.261 2.6691 0.232 0.229 0.228 1.8
Axial-Radial 97 0.526 0.502 0.507 3.7165 0.362 0.350 0.330 9.7321 0.264 0.258 0.251 5.2495 0.215 0.202 0.199 8.0656 0.170 0.168 0.175 -2.9730 0.166 0.160 0.163 1.8
Rise fraction effect is defined as 0120 - *80 x 100 percent,
080where a20 and o80 are the diffusivity values at 20-and 80-
percent rise fraction respectively.
i5

Billet F-11, OD Region
20 % Re 0 CircA Circ - AX (%45)
0 Axial
1.0- A AX -Rod ("45)03 Radial
U
0.-
rZ r
0O0 I0500 1000
TEMPERATURE ,C
Figure 2. Thermal Diffusivities Inferred from 20%Rise-Fraction Data.
6

37
50 % Rise
*1.0-Billet F- 1 Ol ego
E 0 Circ
>: ~A Circ -AX(-~450)0 Axial
ze A Ax-Rod (-.450)A [3 Radial
-j
z 9
0.0 050K
TEMPERATURE OCFigure 3. Thermal Diffusivities Inferred from 50% Rise-Fraction
Data.
7

38
80 % Rise
Billet F-II, OD Region
vjE 0 Circu A Circ-AX(,-45*)
•e AhlolA AX- Rod (e, 450)
cn 0 Radial
,.0.5- \
_j 19-ee
r
0 500 1000
TEMPERATURE, C
Figure 4. Thermal Diffusivities Inferred from 80Z Rise-FractionData.
i,8

39
A
Analytical Relationships Between On-Axis and Off-Axis Conductivities
By definition, heat flux by conduction is related to thermal gradients by:
[-Q] [ EK] [I] (a)
The matrix equation can be stated more fully as:
Qi ~ Kii Kij Kik '{ , - Kji Kjj Kjk (b)-Qk Kk, Kkj Kkkj LT'k
For an orthotropic material, wden i, J, and k are the principal axes of thematerial (eg, r, z, and e, in a cylindrical 3D composite):
f- lr cTrS-Qz 0 KZ 0 I(c
"Qo 0 Ko T'OO
The principal conductivities, kr, kz, and ko , can be derived from on-axis
tests diffusivity tests using the relationship:
[K] cp [cc] (d)
To derive the conductivity in an off-axis direction, n, from the principalconductivities, the rotation of the themal conductivity tensor of equation
(c) gives (Reference 3):
Knn - 12n1 K1 + L2njKj + t2nk Kk (e)
For the simple case where n is in the plane normal to the k axis and 4k is
the angle between the n and the i axes:
Knn (K1 - Kj) cos2 k + Kj ()
9

40
If *k is chosen as 45 degrees:
Knn (Ki + Kj) (g)
Thus, we see that the conductivities measured in the off-axis tests should
be bounded by the on-axis conductivities, and, when the angle is 45 degrees,
the off-axis conductivity is the simple arithmetic average of the conducti-
vities along the two neighboring principal axes.
Also, it turns out that three independent off-axis tests could be used to
derive the full thermal conductivity tensor. For example, three equations,
of the form of equation (g), can be solved simultaneously to yield:
Kr - Krz + Kre - Koz
Kz - Krz - Krq + Koz (h)
Ke = -Krz + Kre + Kez
where Kz is the conductivity in the direction 45 degrees between the r and
z yarns, and Kre and Koz are similarly defined.
Discussion of Results
The measurements in the directions of the yarns rank themselves in the expected
order.' That is, the diffusivity increases with increased yarn volume fraction.Figure 5, a cross-plot of the information in Figure 3, shows that the rise in
diffusivity with fiber volume fraction is approximately linear. A linear re-
lationship between thermal conductivity and yarn volume fraction:
Ki - AVj + B
has been found to give good correlation with a wide range of data for 3D carbon-carbon composites (Reference 4).
10I

41
2.0Rioe Fraction--20%
a50%
//
1.5/
4A1.E /~//
4 (n. 0
~/200 0Cr
'00to,
YARN Ti0, BUDL V U FAI VC,00
0 O.5 1.0
YARN BUNDLE VOLUME FRACTION.Vi
Figure 5. Trends of Diffusivity Vs. Volume Fractionof the Yarn Bundles in the Direction ofMeasurement.
11

42
Inspection of Table 2 shows that the effect of rise fraction on measured
( diffusivity Is greatest In the radial and axial directions and least In the
45-degrees (off-axis) specimens. The reason probably is that the texture of
the 45-degree surfaces Is more "unform" than the textures of the on-axis
specimens. That is, more of the 45-degree surface represents yarn bundle
sections (Figure 6); thus, the mean distance between high conductivity areas
is smallest on the 45-degree surfaces, implying that the temperature gradients
within these surfaces are smaller than within the on-axis surfaces.
This effect might be quantified in terms of the area fraction of yarn bundles
at the front and backfaces of the specimen. Figure 7 shows how the rise-
fraction effect (listed in the last column of Table 2) varies with yarn bundle
area fraction. The trend line has been drawn with the aid of the two extreme
points (at area fractions of zero and unity) that represent "homogeneous
composites" for which the rise-fraction effect should be close to zero.
The trend suggests that using three off-axis specimens, instead of three
on-axis specimens, would provide more reliable estimates of bulk composite
di ffusivities.
As pointed out in the preceding section, complete characterization of the
conductivity tensor of an orthogonally reinforced composite requires only
three independently-oriented measurements. From these, the conductivity in
any direction may be calculated. Thus the 45-degree measurements are, in
principle, redundant. For a'coarsely-textured composite, however, the 45-
degree -measurements (assuming they are more reliable than the on-axis measure-
ments, as implied in the preceding paragraph) can serve as a check on the
consistency of the data, via equation (g).
Comparing the off-axis results to the on-axis results, we see that data from
the shorter rise-fractions (Figures 2 and 3) obviously are not self-consistent
because the 45-degree diffusivities, are outside the ranges defined by the
two relevant on-axis diffusivities. For the 80-percent rise fraction, the
45-degree results are between the relevant on-axis results, but somewhat
12

L X 43
C-)
0 00N
S0
4)
% % 0
'44 4
w 0 C
2
* %O
fz4

44
Points Represent Data forBillet F-i 5000C- 6500C
50 0 CircA Circ-AX(45
Owl Axial
" 00 A AX-Rod (--450)/ \t3 Radial
wI
z 30
0
wI.120
10 I, I
0.0 0.5 1.0
AREA FRACTION OF BACKFACE OCCUPIED BYYARN BUNDLE ENDS
Figure 7. Effect of Yarn-Bundle Area Fraction onMagnitude of Rise-Fraction Effect.
14

45
lower than the mean value expected if the data were self-consistent and if the
samples were properly cut at 45-degrees.
It should be noted that some data scatter will result from slight variations
in unit-cell dimensions and yarn bundle volume fractions from specimen to
specimen; for example, Table 1 shows variations of about 5% in unit cell di-
mensions Sr and So for the specimens used here. Thus, perfect consistency
is not to be expected for this variable material.
The relatively low values of the 45-degree off-axis diffusivities may be due,
in part, to improper selection of the specimen proportions. Because the
yarn bundles are the primary carriers of heat in the composite, it would be
better to proportion the specimen as illustrated in Figure 8 so that all the
yarns in the back face viewing area would be directly heated at the front
face. Inspection of Figure 6 shows that such was not the case in the tests
performed here. Because some of the yarns in the actual viewing area were
heated only by conduction within the composite, it is likely that the resulting
value of diffusivity is lower than would be obtained in a wider specimen.
Conclusions and Recommendations
The results described above support the conclusion that diffusivities derived
from off-axis tests are less subject to errors, arising from temperature grad-
ients within a coarse-textured composite specimen, than diffusivities derived
from on-axis tests.
As off-axis tests can be used to characterize completely the conductivities of
a 30 composite, we recommend that:
1) Off-axis tests be used, instead.of on-axis tests;-to characterize---
the conductivities of coarse-textured 3D composites.
2) The off-axis specimens be proportioned as shown in Figure 8.
15

46
1d
45- DEGREEOFF-AXISSPECIMEN
* L.---4
CRITERION: d Z d + 2t
e v
d = diameter of area exposedto laser
d - diameter of area ofV temperature measurement
Figure 8. Recommended Off-Axis Specimen Geometry
16

47
3) The actual angles at which the specimens are cut should bI measured
and equation (e) be used to infer the full conductivity tensor,
instead of the simpler equation (g) which was used here for illus-
trative purposes.
Before the. preceding recommendations are adopted, it would be prudent to do
some more exploratory testing with emphasis on the effects of specimen geome-
try (Figure 8) on off-axis data.
References
1. R.E. Taylor and H. Groot, Thermophysical Properties of a Carbon-CarbonComposite, Special Report for AFOSR Grant 77-3280, Purdue UniversityReport TPRL 244, May 1981.
2. R.A. Ellis, 7-Inch Billet Program Progress Report, RNTS Meeting, 1979,CPIA Publication 310, January 1980.
3. H.S. Carslaw and J.C. Jaeger, Conduction of Heat in Solids, 2nd Edition,see Chapter 1.20, Oxford, 1959.
4. F.I. Clayton and D.A. Ettman, Material Property Characterization Resultsfor 7-Inch Carbon-Carbon Billet Program, 1980 JANNAF Propulsion Meeting,Monterey, March 1980.
17

48
Nomenclature
A, B temperature-dependent constants
c specific heat
ijk orthogonal coordinates
Iin cosine of the angle between the I and n vectors
Ki thermal conductivity in the i-direction, a principal axisof the material
Kij thermal conductivity constant relating heat now in the1-direction to a temperature gradient in the J-direction
Qi heat flux in the i-direction
r,G,z radial, circumferential, and axial directions in a cylindricallyreinforced billet.
T'i temperature gradient in the i-direction,
vti volume fraction of yarn bundles parallel to the i-direction
xi distance along the i-direction
0(1, (ij thermal diffusivities, analogous to Ki and K1j
k angle of rotation of coordinate system about the k axis
mass density
18

49
I.
ANALYSIS OF TRANSIENT TEMPERATURE RESPONSE OF A CARBON-CARBON COMPOSITE
( DURING CONTINUOUS HEATING AT ONE SURFACE*
Julius Jortner
Science Applications, Inc.
Irvine, California 92715
February 1982
INTRODUCTION
The study reported earlier (Reference 1), on transient temperature responses
of carbon-carbon composites during flash-diffusivity tests, has been continued
to explore the effects of the composite's heteroqeneity durinq situations
in which the heatinq is continuous, as in a rocket motor firinq.
In the previous study it was found that temperature qradients in thermal dif-
fusivity specimens of carbon-carbon material can affect the diffusivity value
derived from a flash test, and that increasinq the axial lenqth of the speci-
men decreases the errors that might occur from this cause. Althouqh the
average behavior of relatively larqe pieces of carbon-carbon was shown equi-
valent to the behavior of a homogeneous material havinq the same averaqe
diffusivity, concern was expressed that the interconstituent temperature
gradients close to a heated surface may be significant to localized thermal
processes such as ablation. This concern motivates the calculations reported
here. That is, we ask how siqnificant are the temperature qradients in a
carbon-carsnn composite that is heated continuously at one surface as in the
case of a rocket motor throat insert.
*Acknowledqements
The heat transfer calculations were perfomed by T.C. Duncan, usinq the"TASC" computer code, developed at SAI and described in Reference 1. Theinterest and support of R. E. Taylor (Purdue University) are qratefullyacknowledged. The research was sponsored by Air Force Office of ScientificResearch under Contract F49620-81-C-O011 via a subcontract from PurdueUn i ve rs i ty.
i1

50
CASE ANALYZED
The same "TASC" computer program, described and used in the previous study
(Reference 1), was applied to the same sort of axisymmetric idealization of
the composite (Figure 1), using the same properties for the two constituents
(Table 1). The case analyzed is schematically described in Fiqure 2; the
mesh used in the analysis is shown in Figure 3.
The model represents a single yarn bundle and its proportionate share of sur-
rounding material. The center-to-center spacing of the yarns in the composite
is 0.24 cm and the diameter of the yarn bundles is 0.12 cm. The yarn bundle
has a high conductivity along its length (the "axial" direction) and a low
conductivity transverse to the length. The surrounding material has an inter-
mediate (rather low) conductivity and is assumed isotropic. The composite
is heated at the front face (at the top of the sketch in Fiqure 2) by radia-
tion from a 3000*K source; the radiation exchange is assumed to occur with
a view factor of unity and both the source and the composite have emmissivi-
ties of one. The composite is 2.5 cm thick (approximately one inch) and the
back face radiates to a 300*K environment also with an emissivity of one.
Initially. at time equals zero, the composite is at a uniform temperature of300*K. Heating begins when the front face is suddenly exposed to the 30000K
source.
The use of radiative, rather than convective, heat input was merely a matter
of convenience in using the TASC code. Although convection is probably
the dominant mode in a rocket motor, we-felt that the major aspects of inter-
constituent temperature differences could be illustrated with the case
analyzed. The numerical value of the coldwall heat flux (that is, the heat
flux to the front surface at the start of heatinq) is 2.27 x 10⁷ W/m2, which
is of the order of the heating rate in a rocket nozzle.
As before (Reference 1), it should be noted that the properties and the
dimensions used to describe the composite are intended to be illustrative of
the qeneral nature of such materials and not necessarily specific to any
2

51
3D SPCIMENAX ISYMMETRIC3D PECMENIDEAL I ZAT IONOF UNIT VOLUME
Figure 1. Relation of Volume Analyzed to 3D Composite

52
Table 1. Material Properties Assumed Analysis
Material I Material II(Axial (SurroundingYarn) Materi al)
Specific Gravity 1.9 1.9
Specific Heat, cal/gmOC 0.4 0.4
Axial Conductivity, W/cauC 2.35 0.3
Radial Conductivity, W/cm°C 0.22 0.3
Circumferential Conductivity 0.22 0.3SI/cm°C
4
I1

53
/1/1/ 30000 K SOURCE|BLACKBODY
MATERIAL I flRADIATIONMATERIAL I i
SDER ' FRONT FACESIDE "D ,
INSLED 0I
, * I
2.5 cm
0.1 cm D_ BACK FACE0.12 cm Dia.- RADIATES
0.24 cm Dia. -- TO 3006K SINK
Figure 2. Continuous Heating Case
r_

Ii $4
FRONT FACE
0.10 mI-I
o 0
B3ACK FACE js 0.02 cm
Figure 3. Mesh Used in TASC calculations. circles show NodalPoints f or which Date is Plotted in Figure 4.

55
particular carbon-carbon composite. In keeping with the illustrative purpose,
and to avoid unnecessary effort in this context, the materials properties
were taken to be independent of temperature.
RESULTS
The results are summarized in Table 2 and Figures 4, 5, 6, and 7.
Figure 4 shows the temperature histories of four points in the model,
corresponding to the centers of elements marked with small circles in
Figure 3. In other words, these points represent
a) the front face near the centerline of a yarn bundle
b) the front face near the outermost region of the surrounding material
c) the back face near the yarn bundle centerline
d) the back face near the outermost region of the surroundinq material
We see that a significant temperature gradient exists between constituents
at the front face, throughout the period analyzed, vdereas the gradient
at the backface appears negligible (on the scale of the plot).
The remaining illustrations are intended to show how deep a region near the
front face is significantly affected by interconstituent temperature
gradients.
Figure 5 shows the calculated temperature gradients along the specimen length,
near the yarn bundle centerline and near the outer edge of the surrounding
material, at various times during heating. It appears that the depth to which
a *significant" gradient exists is about 0.15 cm at all times plotted.
Figures 6 and 7 are provided to show the interconstituent temperature differences
directly.
7

56
* z %0 0 4 0 0 04 0 ; 0 ; S
qgT -4'. d0
CD ~m 004 %a ~ w0 ff. 0D n CDM0 0 ~ i n 0 0 q e n 0- 0 . c c 1 - 0 0
P% Go 00 mm4 Y q a o
CCo1 ' P.: 00 gO at6 *at C4
U CD * 0w- 1'i~ Li4 000 V1 qtIA '4 le u-4 q - C " 4CD V4 -
f- V- CDC th
V9 i 1-n .m %n U cnI SO,-'
L 1 m 0 0 CD CD CD CD ** 0
L4 '.4 (Ft N,4 C om -- 00aCD CC; c w N C)0 P. D D mm nC
941,
CL CD P%~6 fe %n04'P ffa. mm gw

57
3000L
0 2000
w
BAK AC(OTE
000
0a 10 20TIME ,sec
Figure 4. Temperature History of Yarn Bundle Center(Inner Node) and Surrounding Material (Outer Node)

58
3000 1 OUTER NODE
I-I
,i 4 NODE
2O0
1000/ TIME tsec
I I II000
"
100 1.02.
! 3 1--
-I
01.0 2.0
DEPTH, cm
Figure 5. Temperature as a Function of Depth (Distancefrom Front Face) at Various Times.

I9
S
2
4 0
10-20.
-30
hir
igue6 eprtr ifrnc ewe ue n neNoehsaFntoifDet tVrosTms

60
300
W
0 200 DPHCz
IL
00
WCL010C
0 OL
Figure 7. Temperature Difference Between outer and Inner
N~odes as a Functionl of Time at Various Depths.
01
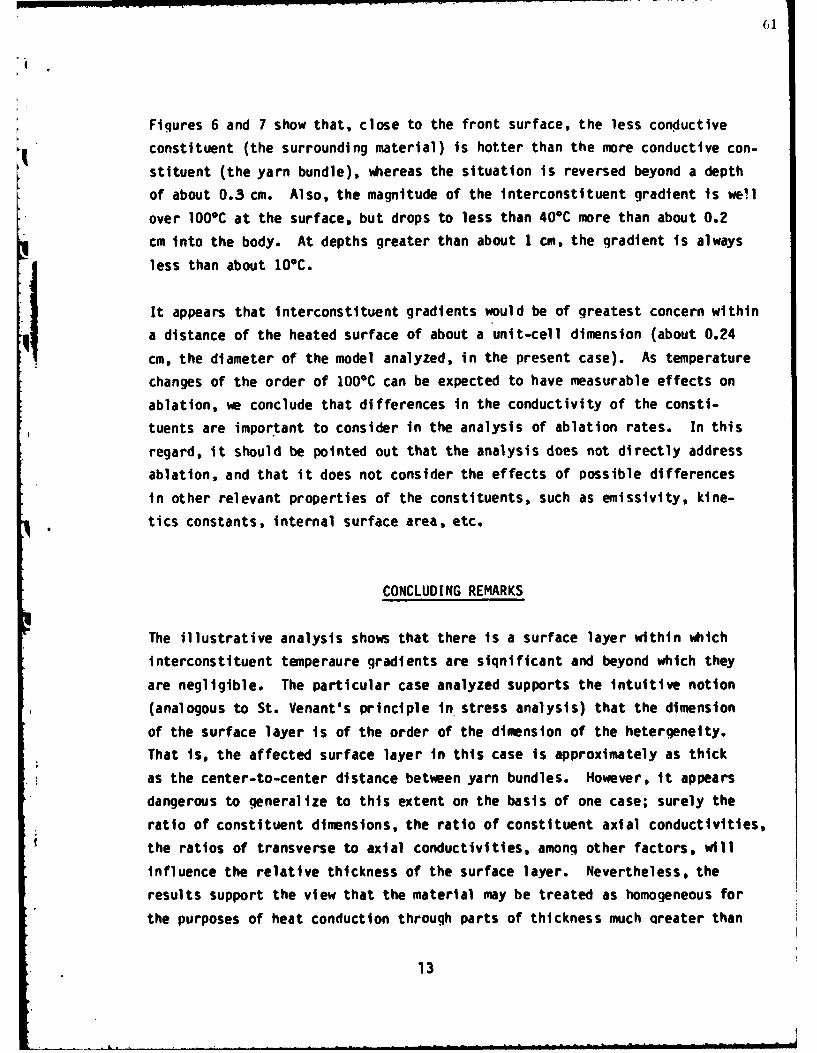
Figures 6 and 7 show that, close to the front surface, the less conductive
constituent (the surrounding material) is hotter than the more conductive con-
stituent (the yarn bundle), whereas the situation is reversed beyond a depth
of about 0.3 cm. Also, the magnitude of the interconstituent gradient is well
over 100*C at the surface, but drops to less than 400C more than about 0.2
cm into the body. At depths greater than about I cm, the gradient is always
less than about 1OC.
It appears that interconstituent gradients would be of greatest concern within
a distance of the heated surface of about a unit-cell dimension (about 0.24
cm, the diameter of the model analyzed, in the present case). As temperature
changes of the order of 1000C can be expected to have measurable effects on
ablation, we conclude that differences in the conductivity of the consti-
tuents are important to consider in the analysis of ablation rates. In this
regard, it should be pointed out that the analysis does not directly address
ablation, and that it does not consider the effects of possible differences
in other relevant properties of the constituents, such as emissivity, kine-
tics constants, internal surface area, etc.
CONCLUDING REMARKS
The illustrative analysis shows that there is a surface layer within which
interconstituent temperaure gradients are siqnificant and beyond which they
are negligible. The particular case analyzed supports the intuitive notion
(analogous to St. Venant's principle in stress analysis) that the dimension
of the surface layer is of the order of the dimension of the hetergeneity.
That is, the affected surface layer in this case is approximately as thick
as the center-to-center distance between yarn bundles. However, it appears
dangerous to generalize to this extent on the basis of one case; surely the
ratio of constituent dimensions, the ratio of constituent axial conductivities,
the ratios of transverse to axial conductivities, among other factors, will
influence the relative thickness of the surface layer. Nevertheless, the
results support the view that the material may be treated as homogeneous for
the purposes of heat conduction through parts of thickness much qreater than
13

0 2
the heteroqeneity dimension, but that consideration of heteroqenelty is
necessary for analysis of events within a layer close to any surface at which
heat is transfered at high rates.
References
1. Julius Jortner, Analysis of Transient Temperature Responses in a Carbon-Carbon Composite During Flash-Method Thermal Diffusivity Tests, in SpecialEdition (Carbon-Carbon Composite Materials) of Current Awareness Bulletin,Issue No. 12, published by Metals and Ceramics Information Center,Battelle Columbus Labs, August 31, 1981. (Also published as an Appendixin Reference 2).
2. R. E. Taylor and H. Groot, Themophysical Properties of a Carbon-CarbonComposite, Special Report for AFOSR Grant 77-3280, Purdue UniversityReport TPRL 244, May 1981.
14