d116–d121 doi:10.1093/nar/gkl1011 genometrafac: a whole
TRANSCRIPT
GenomeTrafac: a whole genome resource for thedetection of transcription factor binding site clustersassociated with conventional and microRNA encodinggenes conserved between mouse and human geneorthologsAnil G. Jegga1,2, Jing Chen1,3, Sivakumar Gowrisankar1,3, Mrunal A. Deshmukh1,
RangaChandra Gudivada1,3, Sue Kong1, Vivek Kaimal1,3 and Bruce J. Aronow1,2,3,*
1Division of Biomedical Informatics, Cincinnati Children’s Hospital Medical Center, 2Department of Pediatrics, Collegeof Medicine and 3Department of Biomedical Engineering, University of Cincinnati, Cincinnati,OH 45229, USA
Received August 16, 2006; Revised and Accepted November 1, 2006
ABSTRACT
Transcriptional cis-regulatory control regions fre-quently are found within non-coding DNA segmentsconserved across multi-species gene orthologs.Adopting a systematic gene-centric pipeline approach,we report here the development of a web-accessibledatabase resource—GenomeTraFac (http://genometrafac.cchmc.org)—that allows genome-wide detectionand characterization of compositionally similar cis-clusters that occur in gene orthologs between anytwo genomes for both microRNA genes as well asconventional RNA-encoding genes. Each orthologgene pair can be scanned to visualize overallconserved sequence regions, and within these, therelative density of conserved cis-element motifclusters form graph peak structures. The results ofthese analyses can be mined en masse to identifymost frequently represented cis-motifs in a list ofgenes. The system also provides a method for rapidevaluation and visualization of gene model-consis-tency between orthologs, and facilitates considerationof the potential impact of sequence variation inconserved non-coding regions to impact complex cis-element structures. Using the mouse and humangenomes via the NCBI Reference Sequence databaseand the Sanger Institute miRBase, the system demon-strated the ability to identify validated transcriptionfactor targets within promoter and distal genomicregulatory regions of both conventional andmicroRNA genes.
INTRODUCTION
Comparing evolutionarily conserved non-coding genomicsequences of divergent yet evolutionarily related specieshas proven to be an effective method for deciphering generegulatory information because functional sequences tend toevolve at a slower rate than non-functional sequences(1–3). Prior efforts [see Ureta-Vidal et al. (1) and recent sur-vey by GuhaThakurta (4)] at genome-wide human–mousecomparison have been successful in identifying potentialgene regulatory regions (5), but a global human miRNA-centric approach with mineable pre-computed cis-regulatoryregion information for all known human–mouse orthologmiRNAs, to our knowledge, has not been accomplished.
Although microRNAs are implicated in both tissue differ-entiation and maintenance of tissue identity, the mechanismsunderlying their regulation are not known fully. The precisemechanisms of miRNA-mediated gene regulation, the tissue-specific expression of specific miRNAs and the cascade ofmolecular events that lead to the biogenesis of miRNAs arebeginning to emerge. Most miRNA genes are located faraway from any annotated genes, implying independent tran-scription from their own promoters (6). For instance, the pro-moters of the miRNAs miR-1, miR-133, miR-124, miR-223and miR-17 are reported to be regulated by specific transcrip-tion factors (TFs) (7–11). In this context a database of readilyquery-able promoter regions of miRNAs for conserved puta-tive binding sites will accelerate our understanding of themicroRNA functions and decipher the mini-circuitries com-prised of miRNAs and TFs.
GenomeTrafac is built by serializing a version of TraFaC(12). At present, we have curated and processed over260 miRNA genes obtained from miRBase (13) that haveclear orthologs, along with >12 000 conventional genes
*To whom correspondence should be addressed at Cincinnati Children’s Hospital Medical Center, 3333 Burnet Avenue–MLC 7024, Cincinnati, OH 45229-3039,USA. Tel: +1 513 636 4865; Fax: +1 513 636 2056; Email: [email protected]
� 2006 The Author(s).This is an Open Access article distributed under the terms of the Creative Commons Attribution Non-Commercial License (http://creativecommons.org/licenses/by-nc/2.0/uk/) which permits unrestricted non-commercial use, distribution, and reproduction in any medium, provided the original work is properly cited.
D116–D121 Nucleic Acids Research, 2007, Vol. 35, Database issue Published online 18 December 2006doi:10.1093/nar/gkl1011
obtained from the NCBI’s Reference Sequence database (14)with human–mouse orthologs. GenomeTrafac also allows forthe creation of gene groups based on GO functional associa-tions, pathways, diseases or mammalian phenotypes.GenomeTrafac thus serves as both an analysis tool for anyindividual gene or miRNA for which there is an ortholog,as well as to serve as a pre-processed data source for theanalysis of a list of genes or miRNAs using a tool such asCisMols (15) capable of evaluating shared cis-elements acrossa list of genes derived from a microarray transcriptionalprofiling experiment.
Computational methods capable of identifying authenticcis-regulatory sequences and predicting their cell-type,developmental stage, or signal transduction-specific activa-tion functions has long been sought as a means to accelerateor overcome the intensive laboratory procedures requiredto identify and characterize genomic cis-regulatory regions(1,4,16,17). In order to facilitate a variety of search functions,we reasoned that as an initial step, access to pre-computedconserved cis-regulatory regions for most well-annotatedconventional and miRNA genes would not only facilitatethe exploration of novel gene cis-regulatory regions, but alsohelp guide strategies for the creation of transgenics and theconstruction of altered genes with minimal impact on poten-tial regulatory regions. For example the design of target con-structs necessary to create knock-in mice requires that thelocP insertion sites do not disrupt cis-elements necessaryfor proper regulation, alteration of which could lead to unin-tended consequences.
Beyond the massive increase in curated content, search andmanagement additions, we have also added a variety of cis-ele-ment feature tracks, ability to export data directly into theUCSC Genome browser, and a powerful new searchcapability called ConCisE (Conserved cis-Element) Scannerthat allows all ortholog gene pairs in GenomeTrafac to be quer-ied for potential targets of known TF(s) with defined cis-regu-latory target specificity. Cis-regulatory modules that containvarious combinations of cis-elements can be composed andused to query the database for potential additional targets.
DATA SOURCES AND DATA PROCESSING
Over 12 000 conventional ortholog genes and 260 miRNAgenes were obtained from Homologene, NCBI and MGI(Mouse Genome Informatics)’s curated table of human–mouse orthologs (18) (ftp://ftp.ncbi.nih.gov/pub/HomoloGene/)and miRBase (13), respectively. Only genes with a ReferenceSequence (RefSeq) entry, specifically those with accessionnumbers starting with ‘NM’ were used. We selected theNCBI’s RefSeq data set since it provides a comprehensive,integrated, non-redundant set of sequences and also pro-vides a stable reference for gene identification and character-ization (14).
For microRNA genes, we extracted the human–mouseortholog pairs using human miRNA symbols as the commonidentity (241 of a total 462 human miRNAs were referencedby a mouse miRNA). An additional 28 mouse orthologs wereidentified based on sequence similarity by matching humanmiRNAs against the mouse genome using the BLATalgorithm (19). Two of the 241 symbol-based orthologous
miRNAs (MIRN500 and MIRN448) and three of thesequence similarity-based human–mouse miRNA pairs(MIRN432, MIRN515-1 and MIRN593) did not show flank-ing region sequence conservation. These were marked in redfont in the GenomeTrafac system as problematic (Supple-mentary Data 2). Corresponding genomic sequences forboth the conventional genes and microRNA genes wereextracted from the UCSC Golden path database (19) with40 kb of flanking (upstream and downstream) nucleotidebase pairs (see Supplementary Data 1 for an explanation ofselection procedure for flanking region). For genes with mul-tiple isoforms, we considered the longest isoform that encom-passed the largest interval on the genome. In case ofpseudogenes or genes with more than one chromosome map-ping, we compared alignments of the transcript against thegenome and distinguished ‘true’ genes from pseudogenesbased on either their lack of introns, exons, or conservedintronic or flanking sequence. The exon annotations fromthe Table Browser of UCSC Golden path were used. How-ever, exonic coordinates were mapped in context with down-loaded genomic sequences so as to be able to subsequentlyindicate exon positions. The outstanding BlastZ algorithm(20), was used to align each of the orthologous genomicsequence pairs. The command-line version of MatInspector(version 7.4) (21) was used to identify the potential bindingsites in each of the genomic sequences. The analysis parame-ters for identification of TF-binding sites were set as 0.7 forthe core similarity and ‘optimal’ for the matrix similarityusing the MatInspector vertebrate binding sites (PositionWeight Matrix) library [Genomatix Matrix Family LibraryVersion 5.0 (January 2005)]. TraFaC server [http://trafac.cchmc.org; (12)] was then used as previously described tofind the conserved cis-elements within the BlastZ alignedregions of the ortholog genes by integrating the sequence,alignment and binding sites data for each gene/miRNA pair.
The ConCisE scanner functions are written in JAVA usingJAVA Servlet Pages, standard taglibs and JAVA Servlets (forthe GUI front end), and Oracle text and stored procedures—against an Oracle 9i database).
NEW FEATURES
Improved querying
The GenomeTrafac database can be now queried using EntrezGene IDs or probeset IDs (Affymetrix, Illumina) also apartfrom accession nos or gene/miRNA symbols. Additionally,we have added additional annotation tables to the databaseand it is now possible to retrieve a list of genes using a GOterm, disease term [OMIM (22) or GAD (23)], pathway term(Kegg, Biocarta, Biocyc or Reactome), mammalianphenotype (24), or gene family http://www.gene.ucl.ac.uk/nomenclature/genefamily.html. The GO-term-gene associa-tions and gene-pathway associations were derived fromNCBI’s Gene Entrez (ftp://ftp.ncbi.nlm.nih.gov/gene/DATA/).
Enhanced visualization
The original TraFaC server, an integrated web-based softwaretool for comparing a pair of orthologous genomic sequencesand generating graphical outputs, the Regulogram and
Nucleic Acids Research, 2007, Vol. 35, Database issue D117
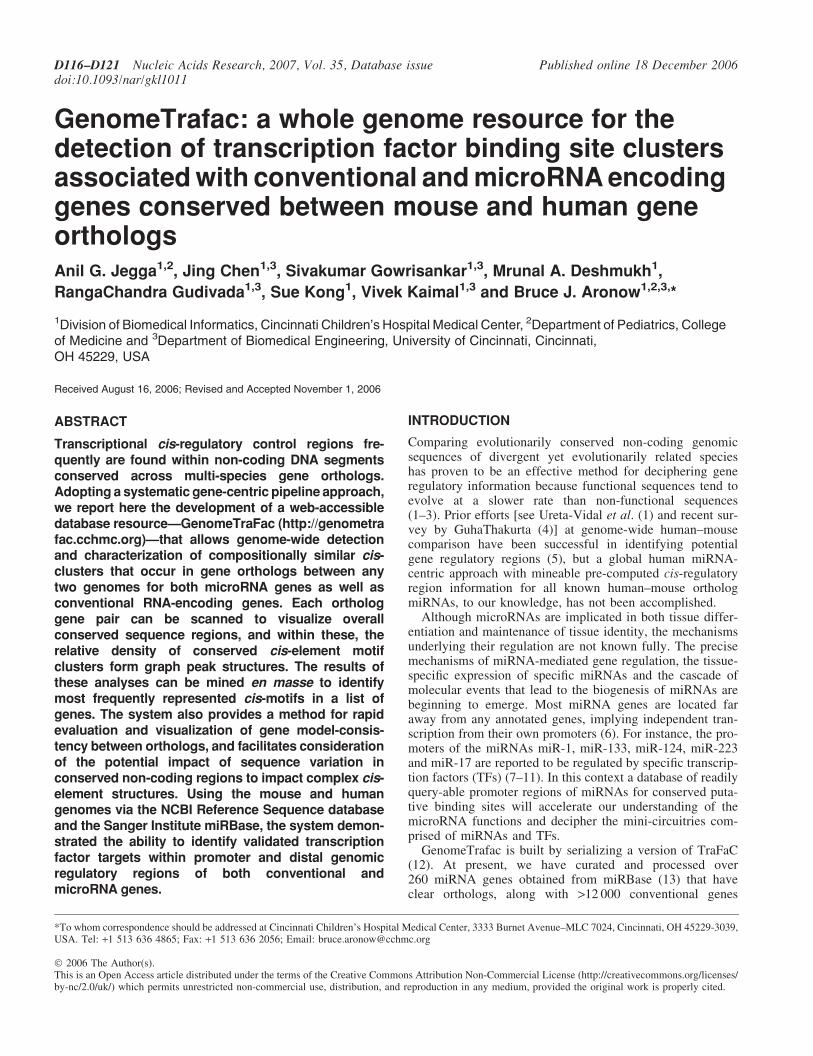
Trafacgram, was described earlier (12) (Figure 1A and D).The new features added include the ability to plot the fre-quency and density of binding sites for each species sepa-rately, the display of repeat elements (as green blocks inparallel to the two sequences compared) (Figure 1A). Anothernew function is to be able to filter the ‘Hits’ (shared bindingsites within a 200 bp window) in order to identify and displayonly those for which the order of occurrence is also conservedbetween both orthologs. Conservation of order provides anadditional stringent filter for which cis-elements that passhave a higher likelihood of being functional. This filter canbe invoked from both the Regulogram and Trafacgramimages. A separate graph of the parallel elements is able tobe requested in the Regulogram view, and their peak is
thus able to be used as a decision basis for exploring a par-ticular cluster. To do this, the Trafacgram is requested fromthe high-scoring peak, overall cis-elements are shown, fromwhich a request for the parallel cis-elements can then bemade. An important concern is to evaluate binding site defi-nitions and the confidence in its potential to be functional. Formost of the sites, the consensus sequence can give a roughidea whether it can be functional or not. To allow for this,we have also now shown for each of the shared conservedpredicted cis-elements the actual sequence and its positionin the genomic sequence as a table below each of the Trafac-grams. Links are also provided to the UCSC genomic brow-ser. Another feature allows the sequences of any segmentsof interest to be downloaded.
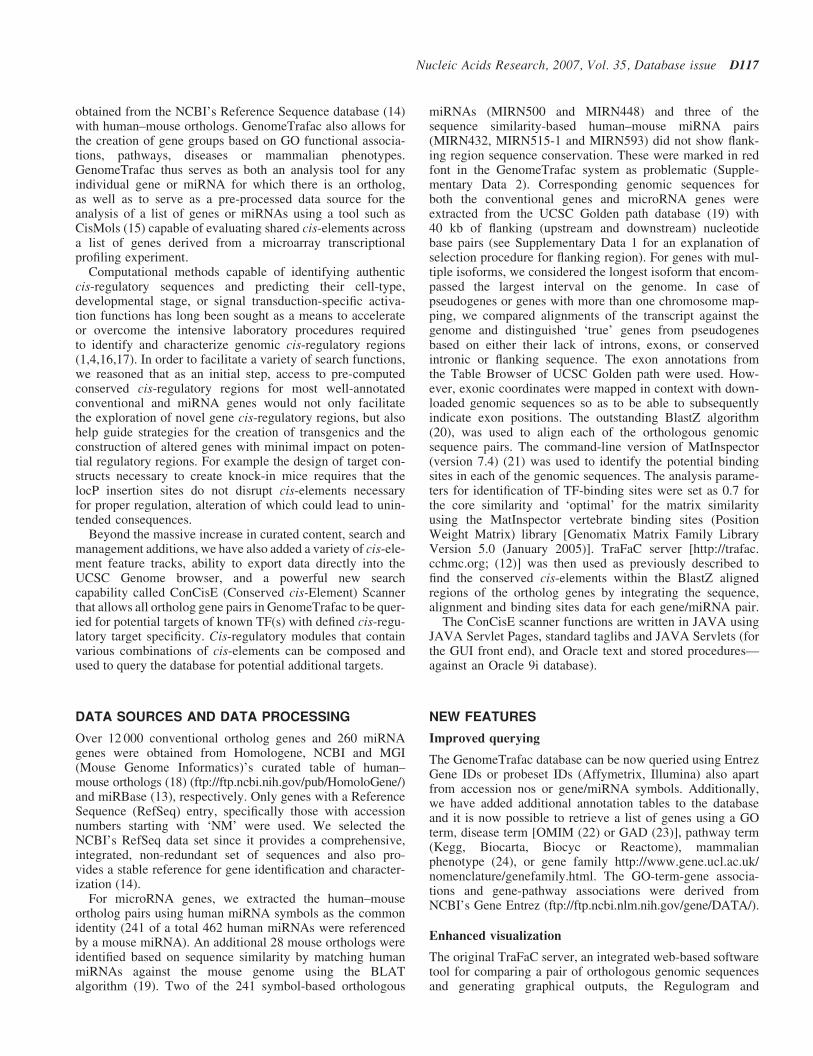
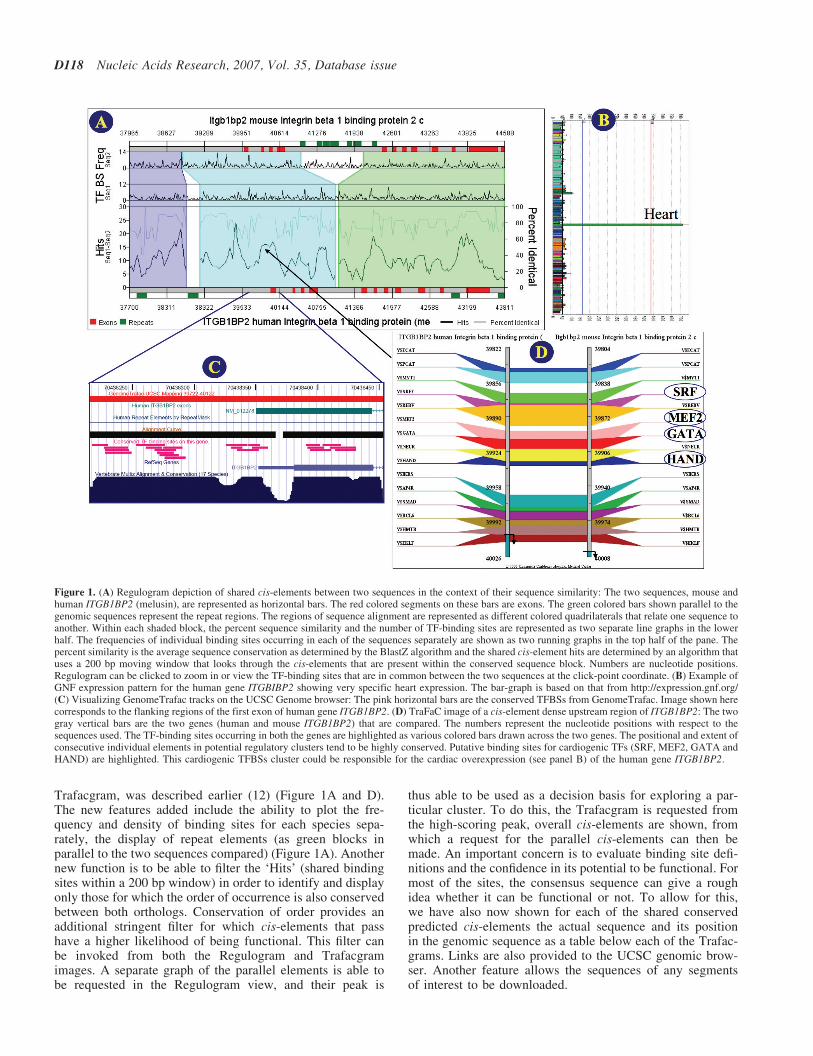
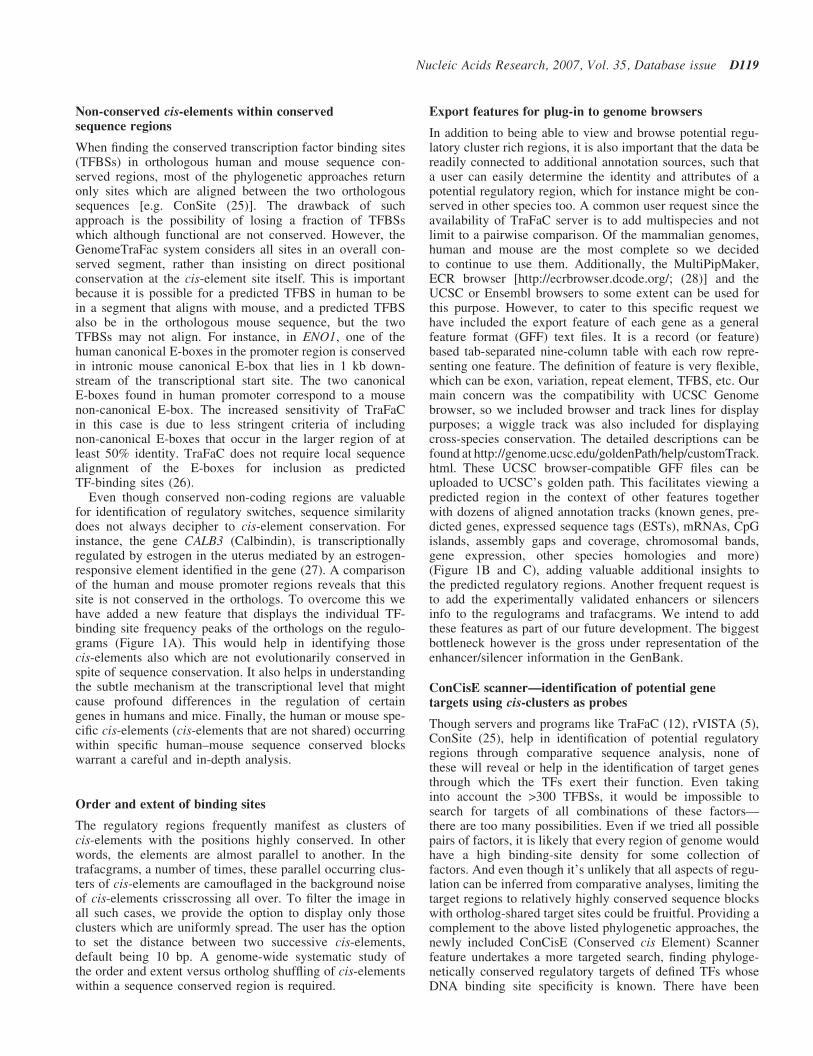
Figure 1. (A) Regulogram depiction of shared cis-elements between two sequences in the context of their sequence similarity: The two sequences, mouse andhuman ITGB1BP2 (melusin), are represented as horizontal bars. The red colored segments on these bars are exons. The green colored bars shown parallel to thegenomic sequences represent the repeat regions. The regions of sequence alignment are represented as different colored quadrilaterals that relate one sequence toanother. Within each shaded block, the percent sequence similarity and the number of TF-binding sites are represented as two separate line graphs in the lowerhalf. The frequencies of individual binding sites occurring in each of the sequences separately are shown as two running graphs in the top half of the pane. Thepercent similarity is the average sequence conservation as determined by the BlastZ algorithm and the shared cis-element hits are determined by an algorithm thatuses a 200 bp moving window that looks through the cis-elements that are present within the conserved sequence block. Numbers are nucleotide positions.Regulogram can be clicked to zoom in or view the TF-binding sites that are in common between the two sequences at the click-point coordinate. (B) Example ofGNF expression pattern for the human gene ITGBIBP2 showing very specific heart expression. The bar-graph is based on that from http://expression.gnf.org/(C) Visualizing GenomeTrafac tracks on the UCSC Genome browser: The pink horizontal bars are the conserved TFBSs from GenomeTrafac. Image shown herecorresponds to the flanking regions of the first exon of human gene ITGB1BP2. (D) TraFaC image of a cis-element dense upstream region of ITGB1BP2: The twogray vertical bars are the two genes (human and mouse ITGB1BP2) that are compared. The numbers represent the nucleotide positions with respect to thesequences used. The TF-binding sites occurring in both the genes are highlighted as various colored bars drawn across the two genes. The positional and extent ofconsecutive individual elements in potential regulatory clusters tend to be highly conserved. Putative binding sites for cardiogenic TFs (SRF, MEF2, GATA andHAND) are highlighted. This cardiogenic TFBSs cluster could be responsible for the cardiac overexpression (see panel B) of the human gene ITGB1BP2.
D118 Nucleic Acids Research, 2007, Vol. 35, Database issue
Non-conserved cis-elements within conservedsequence regions
When finding the conserved transcription factor binding sites(TFBSs) in orthologous human and mouse sequence con-served regions, most of the phylogenetic approaches returnonly sites which are aligned between the two orthologoussequences [e.g. ConSite (25)]. The drawback of suchapproach is the possibility of losing a fraction of TFBSswhich although functional are not conserved. However, theGenomeTraFac system considers all sites in an overall con-served segment, rather than insisting on direct positionalconservation at the cis-element site itself. This is importantbecause it is possible for a predicted TFBS in human to bein a segment that aligns with mouse, and a predicted TFBSalso be in the orthologous mouse sequence, but the twoTFBSs may not align. For instance, in ENO1, one of thehuman canonical E-boxes in the promoter region is conservedin intronic mouse canonical E-box that lies in 1 kb down-stream of the transcriptional start site. The two canonicalE-boxes found in human promoter correspond to a mousenon-canonical E-box. The increased sensitivity of TraFaCin this case is due to less stringent criteria of includingnon-canonical E-boxes that occur in the larger region of atleast 50% identity. TraFaC does not require local sequencealignment of the E-boxes for inclusion as predictedTF-binding sites (26).
Even though conserved non-coding regions are valuablefor identification of regulatory switches, sequence similaritydoes not always decipher to cis-element conservation. Forinstance, the gene CALB3 (Calbindin), is transcriptionallyregulated by estrogen in the uterus mediated by an estrogen-responsive element identified in the gene (27). A comparisonof the human and mouse promoter regions reveals that thissite is not conserved in the orthologs. To overcome this wehave added a new feature that displays the individual TF-binding site frequency peaks of the orthologs on the regulo-grams (Figure 1A). This would help in identifying thosecis-elements also which are not evolutionarily conserved inspite of sequence conservation. It also helps in understandingthe subtle mechanism at the transcriptional level that mightcause profound differences in the regulation of certaingenes in humans and mice. Finally, the human or mouse spe-cific cis-elements (cis-elements that are not shared) occurringwithin specific human–mouse sequence conserved blockswarrant a careful and in-depth analysis.
Order and extent of binding sites
The regulatory regions frequently manifest as clusters ofcis-elements with the positions highly conserved. In otherwords, the elements are almost parallel to another. In thetrafacgrams, a number of times, these parallel occurring clus-ters of cis-elements are camouflaged in the background noiseof cis-elements crisscrossing all over. To filter the image inall such cases, we provide the option to display only thoseclusters which are uniformly spread. The user has the optionto set the distance between two successive cis-elements,default being 10 bp. A genome-wide systematic study ofthe order and extent versus ortholog shuffling of cis-elementswithin a sequence conserved region is required.
Export features for plug-in to genome browsers
In addition to being able to view and browse potential regu-latory cluster rich regions, it is also important that the data bereadily connected to additional annotation sources, such thata user can easily determine the identity and attributes of apotential regulatory region, which for instance might be con-served in other species too. A common user request since theavailability of TraFaC server is to add multispecies and notlimit to a pairwise comparison. Of the mammalian genomes,human and mouse are the most complete so we decidedto continue to use them. Additionally, the MultiPipMaker,ECR browser [http://ecrbrowser.dcode.org/; (28)] and theUCSC or Ensembl browsers to some extent can be used forthis purpose. However, to cater to this specific request wehave included the export feature of each gene as a generalfeature format (GFF) text files. It is a record (or feature)based tab-separated nine-column table with each row repre-senting one feature. The definition of feature is very flexible,which can be exon, variation, repeat element, TFBS, etc. Ourmain concern was the compatibility with UCSC Genomebrowser, so we included browser and track lines for displaypurposes; a wiggle track was also included for displayingcross-species conservation. The detailed descriptions can befound at http://genome.ucsc.edu/goldenPath/help/customTrack.html. These UCSC browser-compatible GFF files can beuploaded to UCSC’s golden path. This facilitates viewing apredicted region in the context of other features togetherwith dozens of aligned annotation tracks (known genes, pre-dicted genes, expressed sequence tags (ESTs), mRNAs, CpGislands, assembly gaps and coverage, chromosomal bands,gene expression, other species homologies and more)(Figure 1B and C), adding valuable additional insights tothe predicted regulatory regions. Another frequent request isto add the experimentally validated enhancers or silencersinfo to the regulograms and trafacgrams. We intend to addthese features as part of our future development. The biggestbottleneck however is the gross under representation of theenhancer/silencer information in the GenBank.
ConCisE scanner—identification of potential genetargets using cis-clusters as probes
Though servers and programs like TraFaC (12), rVISTA (5),ConSite (25), help in identification of potential regulatoryregions through comparative sequence analysis, none ofthese will reveal or help in the identification of target genesthrough which the TFs exert their function. Even takinginto account the >300 TFBSs, it would be impossible tosearch for targets of all combinations of these factors—there are too many possibilities. Even if we tried all possiblepairs of factors, it is likely that every region of genome wouldhave a high binding-site density for some collection offactors. And even though it’s unlikely that all aspects of regu-lation can be inferred from comparative analyses, limiting thetarget regions to relatively highly conserved sequence blockswith ortholog-shared target sites could be fruitful. Providing acomplement to the above listed phylogenetic approaches, thenewly included ConCisE (Conserved cis Element) Scannerfeature undertakes a more targeted search, finding phyloge-netically conserved regulatory targets of defined TFs whoseDNA binding site specificity is known. There have been
Nucleic Acids Research, 2007, Vol. 35, Database issue D119
reports of this approach for the genomes of Caenorhabditiselegans and Caenorhabditis briggsae (29) and Drosophilaspecies (30). While the former, CisOrtho (29), is based onphylogenetic approach, the latter, Target Explorer (30), isnot. The SynoR (31) also uses a similar approach for highereukaryotes. The principal advantages SynoR has over ourapproach are the multi-species comparison and the annota-tions of the potential target genes. However, current versionof SynoR doesn’t support the Boolean ‘OR’ when searchingfor putative gene targets using TFBSs. The main advantage ofour approach over SynoR is that the target genes are not onlyidentified but also apart from the queried sites, other elementsoccurring in the cluster are also displayed. This helps inidentifying potential novel interacting TFs.
Even though context-dependent methods such as combinedpromoter sequence analysis with TF perturbation experiment(32) data, or chromatin immunoprecipitation ‘ChIP-chip’experiments (33) can greatly improve likelihood of functionalvalidation of target gene regulatory regions and cis-elementclusters, context-independent approaches identifying allTF-binding sites and combinations of sites in the genomeon the basis of sequence analysis only [e.g. ConCisE Scannerand SynoR (31)] should continue to be highly valuable forextending and exploring knowledge gained in specificcontexts (34).
CONCLUSION
Comparative genomics has greatly accelerated our ability toidentify fundamental functional elements of genome struc-tures. The development of new experimental and computa-tional methods have also proven capable of enabling deepwhole-genome annotation of sequences (35), including notonly identification but also classification of functional regula-tory elements. At the next stage of development, large-scalesystematic comparative genomics approaches may be com-bined with extensive expression and other information toimprove our ability to recognize transcriptional controlsresponsible for regulatory network behaviors. Towards this,our human–mouse miRNA and gene cis-regulatory databasecan be a particularly valuable resource for finding regulatoryarchitecture providing experimental dissections specificallytarget factors within the regulatory networks. GenomeTrafacwill be updated with new human–mouse gene/miRNA pairsregularly providing that corresponding reference sequencesare available or the annotations are improved. Finally, eventhough experimental validation is the ultimate litmus testfor any computationally predicted cis-regulatory modules,methods or resources that help to focus likely effects anddefined mechanisms should provide vital direction.
AVAILABILITY
The GenomeTrafac database can be accessed freely at http://genometrafac.cchmc.org.
SUPPLEMENTARY DATA
Supplementary Data are available at http://genometrafac.cchmc.org/genome-trafac/supplementary.
ACKNOWLEDGEMENTS
This work was supported by grants NCI UO1 CA84291-07(Mouse Models of Human Cancer Consortium), NIEHSES-00-005 (Comparative Mouse Genome Centers Consor-tium) and NIEHS P30-ES06096 (Center for EnvironmentalGenetics). Funding to pay the Open Access publicationcharges for this article was provided by CCHMC, Cincinnati,OH, USA.
Conflict of interest statement. None declared.
REFERENCES
1. Ureta-Vidal,A., Ettwiller,L. and Birney,E. (2003) Comparativegenomics: genome-wide analysis in metazoan eukaryotes. Nature Rev.Genet., 4, 251–262.
2. Cooper,G.M. and Sidow,A. (2003) Genomic regulatory regions:insights from comparative sequence analysis. Curr. Opin. Genet. Dev.,13, 604–610.
3. Miller,W., Makova,K.D., Nekrutenko,A. and Hardison,R.C. (2004)Comparative genomics. Annu. Rev. Genomics Hum. Genet.,5, 15–56.
4. GuhaThakurta,D. (2006) Computational identification oftranscriptional regulatory elements in DNA sequence. Nucleic AcidsRes., 34, 3585–3598.
5. Loots,G.G., Ovcharenko,I., Pachter,L., Dubchak,I. and Rubin,E.M.(2002) rVista for comparative sequence-based discovery of functionaltranscription factor binding sites. Genome Res., 12, 832–839.
6. Ohler,U., Yekta,S., Lim,L.P., Bartel,D.P. and Burge,C.B. (2004)Patterns of flanking sequence conservation and a characteristicupstream motif for microRNA gene identification. RNA, 10,1309–1322.
7. Zhao,Y., Samal,E. and Srivastava,D. (2005) Serum response factorregulates a muscle-specific microRNA that targets Hand2 duringcardiogenesis. Nature, 436, 214–220.
8. O’Donnell,K.A., Wentzel,E.A., Zeller,K.I., Dang,C.V. andMendell,J.T. (2005) c-Myc-regulated microRNAs modulate E2F1expression. Nature, 435, 839–843.
9. Fazi,F., Rosa,A., Fatica,A., Gelmetti,V., De Marchis,M.L., Nervi,C.and Bozzoni,I. (2005) A minicircuitry comprised of microRNA-223and transcription factors NFI-A and C/EBPalpha regulates humangranulopoiesis. Cell, 123, 819–831.
10. Chen,J.F., Mandel,E.M., Thomson,J.M., Wu,Q., Callis,T.E.,Hammond,S.M., Conlon,F.L. and Wang,D.Z. (2006) The role ofmicroRNA-1 and microRNA-133 in skeletal muscle proliferation anddifferentiation. Nature Genet., 38, 228–233.
11. Conaco,C., Otto,S., Han,J.J. and Mandel,G. (2006) Reciprocal actionsof REST and a microRNA promote neuronal identity. Proc. Natl Acad.Sci. USA, 103, 2422–2427.
12. Jegga,A.G., Sherwood,S.P., Carman,J.W., Pinski,A.T., Phillips,J.L.,Pestian,J.P. and Aronow,B.J. (2002) Detection and visualization ofcompositionally similar cis-regulatory element clusters in orthologousand coordinately controlled genes. Genome Res., 12, 1408–1417.
13. Griffiths-Jones,S., Grocock,R.J., van Dongen,S., Bateman,A. andEnright,A.J. (2006) miRBase: microRNA sequences, targets and genenomenclature. Nucleic Acids Res., 34, D140–D144.
14. Pruitt,K.D., Tatusova,T. and Maglott,D.R. (2003) NCBI ReferenceSequence project: update and current status. Nucleic Acids Res.,31, 34–37.
15. Jegga,A.G., Gupta,A., Gowrisankar,S., Deshmukh,M.A., Connolly,S.,Finley,K. and Aronow,B.J. (2005) CisMols Analyzer: identification ofcompositionally similar cis-element clusters in ortholog conservedregions of coordinately expressed genes. Nucleic Acids Res.,33, W408–W411.
16. Wasserman,W.W. and Sandelin,A. (2004) Applied bioinformatics forthe identification of regulatory elements. Nature Rev. Genet.,5, 276–287.
17. Michelson,A.M. (2002) Deciphering genetic regulatory codes: achallenge for functional genomics. Proc. Natl Acad. Sci. USA,99, 546–548.
D120 Nucleic Acids Research, 2007, Vol. 35, Database issue
18. Eppig,J.T., Bult,C.J., Kadin,J.A., Richardson,J.E., Blake,J.A.,Anagnostopoulos,A., Baldarelli,R.M., Baya,M., Beal,J.S., Bello,S.M.et al. (2005) The Mouse Genome Database (MGD): from genes tomice—a community resource for mouse biology. Nucleic Acids Res.,33, D471–D475.
19. Karolchik,D., Baertsch,R., Diekhans,M., Furey,T.S., Hinrichs,A.,Lu,Y.T., Roskin,K.M., Schwartz,M., Sugnet,C.W., Thomas,D.J. et al.(2003) The UCSC Genome Browser Database. Nucleic Acids Res.,31, 51–54.
20. Schwartz,S., Kent,W.J., Smit,A., Zhang,Z., Baertsch,R., Hardison,R.C.,Haussler,D. and Miller,W. (2003) Human–mouse alignments withBLASTZ. Genome Res., 13, 103–107.
21. Quandt,K., Frech,K., Karas,H., Wingender,E. and Werner,T. (1995)MatInd and MatInspector: new fast and versatile tools for detection ofconsensus matches in nucleotide sequence data. Nucleic Acids Res.,23, 4878–4884.
22. Hamosh,A., Scott,A.F., Amberger,J.S., Bocchini,C.A. andMcKusick,V.A. (2005) Online Mendelian Inheritance in Man (OMIM),a knowledgebase of human genes and genetic disorders. Nucleic AcidsRes., 33, D514–D517.
23. Becker,K.G., Barnes,K.C., Bright,T.J. and Wang,S.A. (2004) Thegenetic association database. Nature Genet., 36, 431–432.
24. Smith,C.L., Goldsmith,C.A. and Eppig,J.T. (2005) The MammalianPhenotype Ontology as a tool for annotating, analyzing and comparingphenotypic information. Genome Biol., 6, R7.
25. Lenhard,B., Sandelin,A., Mendoza,L., Engstrom,P., Jareborg,N. andWasserman,W.W. (2003) Identification of conserved regulatoryelements by comparative genome analysis. J. Biol., 2, 13.
26. Kim,J.W., Zeller,K.I., Wang,Y., Jegga,A.G., Aronow,B.J.,O’Donnell,K.A. and Dang,C.V. (2004) Evaluation of myc E-boxphylogenetic footprints in glycolytic genes by chromatinimmunoprecipitation assays. Mol. Cell. Biol., 24, 5923–5936.
27. Darwish,H., Krisinger,J., Furlow,J.D., Smith,C., Murdoch,F.E. andDeLuca,H.F. (1991) An estrogen-responsive element mediates thetranscriptional regulation of calbindin D-9K gene in rat uterus.J. Biol. Chem., 266, 551–558.
28. Ovcharenko,I., Nobrega,M.A., Loots,G.G. and Stubbs,L. (2004)ECR Browser: a tool for visualizing and accessing data fromcomparisons of multiple vertebrate genomes. Nucleic Acids Res.,32, W280–W286.
29. Bigelow,H.R., Wenick,A.S., Wong,A. and Hobert,O. (2004) CisOrtho:a program pipeline for genome-wide identification of transcriptionfactor target genes using phylogenetic footprinting. BMCBioinformatics, 5, 27.
30. Sosinsky,A., Bonin,C.P., Mann,R.S. and Honig,B. (2003) TargetExplorer: An automated tool for the identification of new target genesfor a specified set of transcription factors. Nucleic Acids Res.,31, 3589–3592.
31. Ovcharenko,I. and Nobrega,M.A. (2005) Identifying synonymousregulatory elements in vertebrate genomes. Nucleic Acids Res.,33, W403–W407.
32. Lee,T.I., Rinaldi,N.J., Robert,F., Odom,D.T., Bar-Joseph,Z.,Gerber,G.K., Hannett,N.M., Harbison,C.T., Thompson,C.M., Simon,I.et al. (2002) Transcriptional regulatory networks in Saccharomycescerevisiae. Science, 298, 799–804.
33. Ren,B., Robert,F., Wyrick,J.J., Aparicio,O., Jennings,E.G., Simon,I.,Zeitlinger,J., Schreiber,J., Hannett,N., Kanin,E. et al. (2000)Genome-wide location and function of DNA binding proteins. Science,290, 2306–2309.
34. Li,H. and Wang,W. (2003) Dissecting the transcription networks of acell using computational genomics. Curr. Opin. Genet. Dev.,13, 611–616.
35. ENCODE Project Consortium. (2004) The ENCODE (ENCyclopediaof DNA Elements) Project. Science, 306, 636–640.
Nucleic Acids Research, 2007, Vol. 35, Database issue D121