d.2.7 overland wave propagation · d.2.7 overland wave propagation ... guidelines and...
TRANSCRIPT
Guidelines and Specifications for Flood Hazard Mapping Partners [February 2007]
D.2.7 Overland Wave Propagation
This subsection provides guidance for estimating wave heights and wave crest elevations on flooded land areas. FEMA’s WHAFIS model is described.
D.2.7.1 Overview
The fundamental analysis of overland wave effects for an FIS is provided by the WHAFIS 3.0 program, a DOS-based program that uses representative transects to compute wave crest elevations in a given study area. Transects must be specified by the Mapping Partner, who must also identify topographic, vegetative, and cultural features along each transect landward of the shoreline. WHAFIS uses this and other input information to calculate wave heights, wave crest elevations, flood insurance risk zone designations, and flood zone boundaries along the transects (FEMA, 1988). The Mapping Partner can specify an incident wave height, or WHAFIS can compute an incident wave height at the seaward end of each transect. Please note that the WHAFIS-calculated incident wave height is based on the fetch provided by the Mapping Partner and does not take into account refraction, diffraction, or bottom dissipation effects. The Mapping Partner should perform separate wave transformation calculations if these effects will cause the incident wave height to depart markedly from the value generated by WHAFIS. The Mapping Partner should consult FEMA’s approved wave model list at http://www.fema.gov/plan/prevent/fhm/en_coast.shtm if additional wave studies are required.
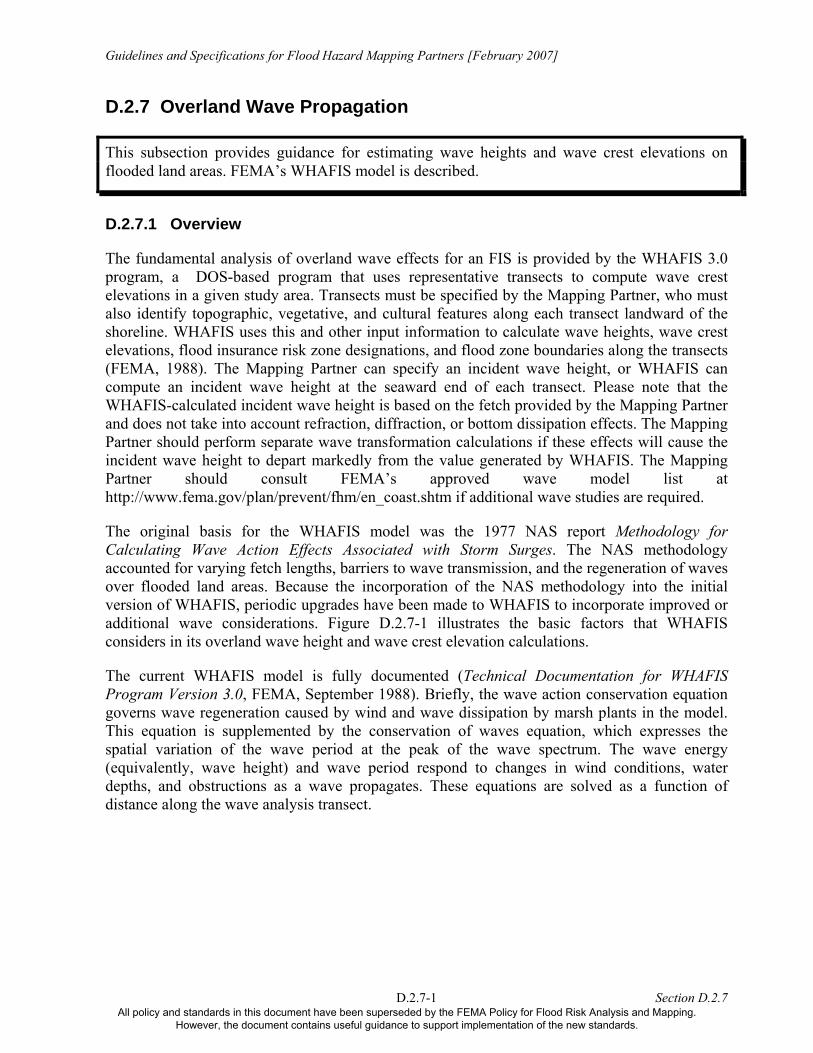
The original basis for the WHAFIS model was the 1977 NAS report Methodology for Calculating Wave Action Effects Associated with Storm Surges. The NAS methodology accounted for varying fetch lengths, barriers to wave transmission, and the regeneration of waves over flooded land areas. Because the incorporation of the NAS methodology into the initial version of WHAFIS, periodic upgrades have been made to WHAFIS to incorporate improved or additional wave considerations. Figure D.2.7-1 illustrates the basic factors that WHAFIS considers in its overland wave height and wave crest elevation calculations.
The current WHAFIS model is fully documented (Technical Documentation for WHAFIS Program Version 3.0, FEMA, September 1988). Briefly, the wave action conservation equation governs wave regeneration caused by wind and wave dissipation by marsh plants in the model. This equation is supplemented by the conservation of waves equation, which expresses the spatial variation of the wave period at the peak of the wave spectrum. The wave energy (equivalently, wave height) and wave period respond to changes in wind conditions, water depths, and obstructions as a wave propagates. These equations are solved as a function of distance along the wave analysis transect.
D.2.7-1 Section D.2.7 All policy and standards in this document have been superseded by the FEMA Policy for Flood Risk Analysis and Mapping.
However, the document contains useful guidance to support implementation of the new standards.
Guidelines and Specifications for Flood Hazard Mapping Partners [February 2007]
Figu
re D
.2.7
-1. W
ave
Hei
ght a
nd W
ave
Cre
st V
aria
tions
Alo
ng a
WH
AFI
S Tr
anse
ct
D.2.7-2 Section D.2.7 All policy and standards in this document have been superseded by the FEMA Policy for Flood Risk Analysis and Mapping.
However, the document contains useful guidance to support implementation of the new standards.
Guidelines and Specifications for Flood Hazard Mapping Partners [February 2007]
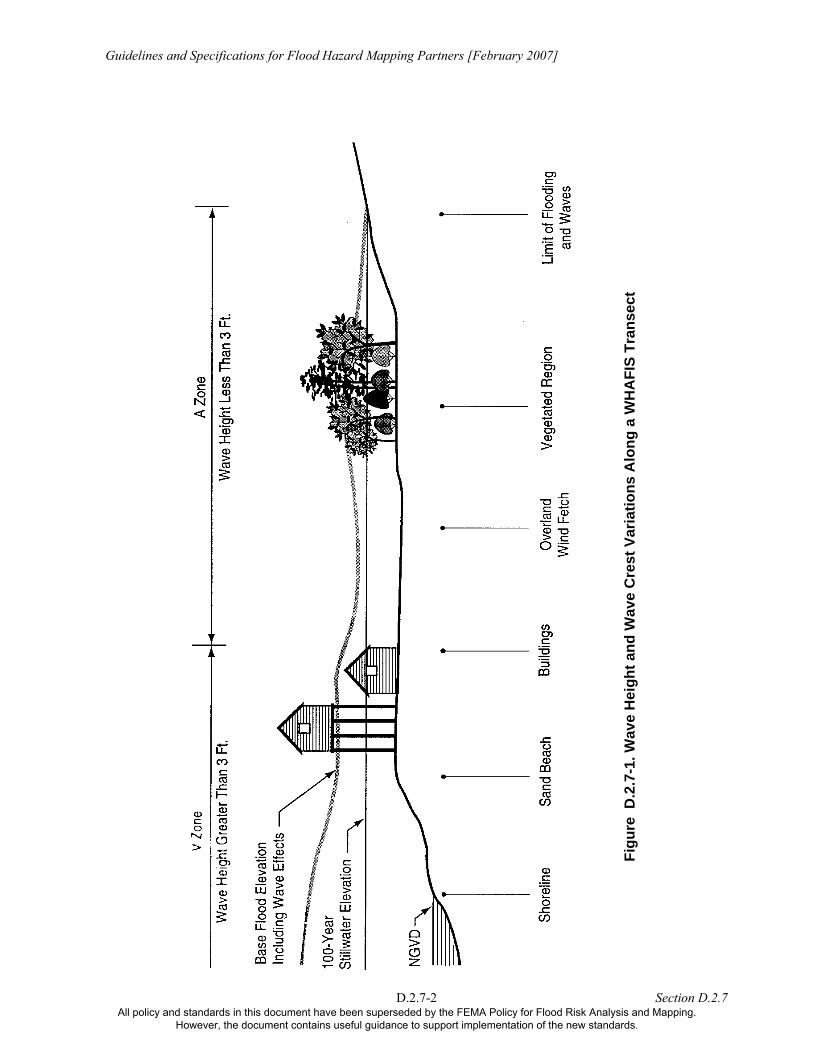
A fundamental element in this wave treatment rem5
ains unchanged from the NAS methodology: the controlling wave height (approximately, the average height of the highest 1 percent of waves
r can import digital elevation data; perform storm-induced erosion treatments, wave height analyses, and wave runup
during storm conditions) is limited to 78 percent of the local stillwater level depth. Also, the model assumes that 70 percent of the controlling wave height lies above the SWEL, resulting in the wave crest elevation being 0.55 times the local stillwater depth above the SWEL, or 1.55 times the local stillwater depth above the ground elevation (see Figure D.2.7-2).
The WHAFIS program is available as a stand-alone program, or as a part of FEMA’s Coastal Hazard Analysis Modeling Program (CHAMP). CHAMP is a Windows-interfaced Visual Basic program that allows the user to enter data, perform coastal engineering analyses, view and tabulate results, and chart summary information for each representative transect along a coastline, within a user-friendly graphical interface. With CHAMP, the use
analyses; plot summary graphics of the results; and create summary tables and reports in a single environment.
• WHAFIS 3.0 is available at http://www.fema.gov/plan/prevent/fhm/dl_wfis3.shtm.
• CHAMP 1.2 is available at http://www.fema.gov/plan/prevent/fhm/dl_champ.shtm.
Figure D.2.7-2 WHAFIS relationships between local stillwater depth, ds, maximum breaking wave height, Hb, and wave crest elevation.
5 For NFIP purposes, the controlling wave height is taken to be 1.6 times the significant wave height.
Hb = 0.78ds0.70 Hb = 0.55ds
SWEL
ds
D.2.7-3 Section D.2.7 All policy and standards in this document have been superseded by the FEMA Policy for Flood Risk Analysis and Mapping.
However, the document contains useful guidance to support implementation of the new standards.
Guidelines and Specifications for Flood Hazard Mapping Partners [February 2007]
D.2.7.2 WHAFIS Transect Considerations
The WHAFIS model considers the study area by representative transects. For accurate WHAFIS results, transects must be representative of major topographic, vegetative, and cultural features. Highly variable upland areas will require more closely spaced transects than areas where features
be also desirable along uniform upland areas, to reduce potential problems associated with the interpolation of flood insurance risk zones and
located along any shoreline across which damaging waves may propagate during the base flood. This certainly includes all open-coast shorelines and other shorelines along
d) during the base flood. In most instances, this results in transects approximately perpendicular to the shoreline. However, in cases where the shoreline
and’s open-coast shoreline across a bay or sound and onto the mainland. If there is a large and/or unusually shaped embayment behind the island, it may be
e back side of the island are subject to waves during a severe storm (high winds and waves may approach the island from different directions). This situation may require
are uniform. Closer spacing of transects may
BFEs between transects. However, Mapping Partners should be advised that spacing transects too closely may result in irregular gutters and an increased workload, without a significant increase in map quality. There are no set rules for transect spacing, but transects will usually be spaced from a few hundred feet apart (where upland characteristics are highly variable) to a few thousand feet apart (where uplands are uniform and development is sparse).
Transects should be
large sheltered bodies of water subject to storm surge flooding (bays, sounds, and estuaries). However, damaging waves are not likely to accompany storm surge flooding along portions of small tributaries leading into large coastal bodies of water, particularly where those tributaries are narrow and winding and fetches are short. WHAFIS transects will not be required in these instances.
Transects should be oriented in the direction that waves propagate across the 0.0-ft NGVD29 or NAVD88 shoreline (from water to lan
curves or has a highly variable shape (near tidal inlets or bay mouths, or on islands, or at the ends of peninsulas and spits), waves may approach at angles that deviate significantly from the perpendicular, and some transects may be required that are not shore-perpendicular. Another consequence of curved or irregular shorelines can be crossing transects. In general, specification of crossing transects should be minimized, but some crossings may be necessary to preserve the range of possible wave approach directions in the study area.
Some situations may arise where barrier islands are flooded during a severe storm, and transects can be drawn from the isl
necessary to place additional transects just along the mainland shore. These transects may not be parallel to the transects originating at the island’s open coast, and they may cross the longer, open-coast transects. The Mapping Partner may consider using multiple sets of transects (one set limited to the island, and one crossing the mainland shoreline) before the final transect selection is made.
The Mapping Partner shall also consider multiple flooding sources when specifying transects. For example, different transects may be required along different sides of a barrier island, if both the open coast and th
multiple specifications for water level and wave height, and multiple overland wave height analyses, with the flood map based on the more severe water level and wave conditions on land. Ultimately, transect specification requires a balance between representing coastal flood and
D.2.7-4 Section D.2.7 All policy and standards in this document have been superseded by the FEMA Policy for Flood Risk Analysis and Mapping.
However, the document contains useful guidance to support implementation of the new standards.
Guidelines and Specifications for Flood Hazard Mapping Partners [February 2007]
severe wave conditions in developed upland areas (or other upland areas of interest) and study resources. In some cases, multiple analyses may be required and conducted; in other cases, a single analysis based on the dominant flood source and associated wave conditions may be
D.2.7.3 WHAFIS Input Considerations
Anothe for each tra y the peak (1 e height tes an approp is to confirm water d
On e ve conditi , which body o e Mapping Partner may have to conduct several analyses, using different combinations of water levels and associated wave conditions, to determ ould keep in depth-l
The Ma and area wi tical flood s st likely w generat e the isla of transec lyses. At any would control
Past pr island, identifiinland addressdiffered at the end stations. The interpolated elevations were compared to the ground elevations and Partner elevatio
Mappin wave m on of WH
performed.
r important consideration is the specification of input water level and wave conditionsnsect. On open coast Atlantic and Gulf shorelines, the typical procedure is to specif-percent-annual-chance) SWEL (including wave setup) and the peak significant wav
(or the initial period of dominant waves) at the transect start. WHAFIS then compuriate depth-limited wave height at the transect start. The only check necessary that incident waves are likely to exceed that height and that a wave condition limited byepth occurs.
sh ltered shorelines, the procedure is not as simple. The peak water level and peak waons may not occur at the same time. For example, winds blowing across the longest fetchgenerate the highest wave heights at a particular shoreline, may also act to empty a waterr set down the water level. In such cases, th
ine the most severe upland flood conditions to be mapped. The Mapping Partner sh mind that on some sheltered shorelines the peak wave height may be smaller than theimited height at the shoreline.
pping Partner should also be aware that mapping flood hazards on an island or an uplth multiple shorelines and flood sources may actually involve the mapping of a statisurface, not a hydraulic surface representing a single flood event. This scenario is mohere a barrier island is separated from the mainland by a bay or sound large enough to
e large waves against the back side of the island, and where flooding and waves can striknd from two directions. A complete analysis of this scenario require the specificationts, water levels and wave conditions at both shorelines, and multiple WHAFIS ana point on the island, the highest water surface and wave heights from the analyses the flood mapping.
actice in such cases has sometimes involved running a single set of transects across thestarting at the side with the highest SWEL and most severe waves. The user then
ed an area of transition between the different SWELs, with the higher SWEL extending to the highest point of the ground profile, after erosion considerations have beened. WHAFIS performed a linear interpolation within a transect segment where SWELs
adjusted, if necessary, to be above the ground elevations. Using this method, the Mapping may have to input the SWEL a second time to identify areas of constant elevation andn transition.
g Partners should note that the increasing use of modern hydrodynamic, storm surge, andodels to provide input water level and wave conditions may complicate the specificati
AFIS incident conditions at the shoreline and base flood SWELs along transects. Mapping
D.2.7-5 Section D.2.7 All policy and standards in this document have been superseded by the FEMA Policy for Flood Risk Analysis and Mapping.
However, the document contains useful guidance to support implementation of the new standards.
Guidelines and Specifications for Flood Hazard Mapping Partners [February 2007]
partnermodels
nce water level and wave conditions are determined and ground elevations along transects are
n be represented by an equivalent “stand” of equally spaced circular cylinders (NAS, 1977), and one for marsh vegetation that is flexible and oscillates with wave
r type, the Mapping Partner shall exercise considerable
Buildings: Buildings shall be specified on the transect as rows perpendicular to the
e required input value for each row of buildings is the ratio of open space to total space. This is simply the sum of distances between buildings in a row, divided by the
buildings along the shoreline to determine whether they will be obstructions during the alls,
ructural elements extending below the BFE should be considered as obstructions. It is useful to contact local officials to obtain construction
uction in height. The mapping partner should code these buildings using the BU card (see Subsection D.2.7.3.1) and indicate 100-percent open space. This procedure
he buildings were considered in the analysis, but recognizes that the presence of the open-
s shall consult with the FEMA Study Representative before using outputs from these to specify WHAFIS inputs.
Oinput, natural and cultural features along the transects shall be specified.
• Vegetation: WHAFIS has two separate routines for vegetation: one for rigid vegetation that ca
action (FEMA, 1984). For eithecare in selecting representative parameters and in ruling out the possibility that the vegetation will be intentionally removed or that effects would be markedly reduced during a storm through erosion, uprooting, or breakage. Details on coding vegetation are contained in Subsection D.2.7.3.2.
• Coastal Structures: The location, height, and extent of elongated manmade structures (seawalls, revetments, dikes, and levees, for instance) should be identified and shown as part of the ground profile, after each structure’s stability under forces of the base flood is confirmed as discussed in Subsection D.2.10.
• transect. Because buildings are not always situated in perfect rows, the Mapping Partner shall exercise judgment to determine which buildings can be represented by a single row. Th
total length of that row. The Mapping Partner shall examine the first several rows of
base flood – only large, fully-engineered buildings with solid, nonbreakaway shearwdeep beams, or other horizontal st
information and the lowest floor elevations of structures before coding buildings as obstructions. If buildings are elevated above the base flood wave crest on pilings, columns, or other open foundations, waves will propagate under the structures with minimal red
acknowledges the presence of the pile-elevated buildings and allows others to see that t
foundation buildings will not lead to wave height reductions or flood insurance risk zone changes.
• Post-Storm Situations: Mapping Partners may encounter situations where many or all of the buildings and development in a study area have been destroyed during a storm. Mapping Partners must decide whether to run WHAFIS using existing (close to bare earth) conditions or with the assumption that most of the buildings and development will be replaced in a short period of time. Unless directed otherwise by the FEMA Study Representative, Mapping Partners shall code WHAFIS transects to the conditions that exist at the time of the study, and not in anticipation of future buildings and development
D.2.7-6 Section D.2.7 All policy and standards in this document have been superseded by the FEMA Policy for Flood Risk Analysis and Mapping.
However, the document contains useful guidance to support implementation of the new standards.
Guidelines and Specifications for Flood Hazard Mapping Partners [February 2007]
in the study area. The Mapping Partner has no assurance of the exact nature or location of future buildings and development, so including them in WHAFIS is not appropriate.
WHAFIS allows the user to account for wave regeneration over flooded areas, using either the overwater fetch (OF) or inland fetch (IF) transect codes. WHAFIS uses an 80-mph sustained windspeed for OF calculations during the base flood, and a 60-mph sustained windspeed for IF
epresenting a continuous open fetch or a single obstruction. Fetches are flooded areas with no obstruction,
nclude dunes, manmade barriers, buildings, and vegetation. The Mapping e ground elevation changes abruptly and in
e transition area of changing SWELs. The Mapping Partner shall subdivide obstructions into s ents sec el the wave dissipation more accurately. Rigid vegetation shall have two to three seaward segments, extending 10 to 50 feet, and the first two or three rows of buildings shall have a segment for each row. Marsh vegetation will be s ded within FIS, so is not necessary.
enter the necessary data using 11 line types, including the title line.
tch and the initial SWELs.
F and de g and the elevation of inland and overwater fetches, respectively.
• Obstructions are categorized either as buildings (BU line), rigid vegetation (VE line), marsh veg (VH abarriers (DU line), or areas where the ground elevation is greater than the base SWEL (AS line).
• The End of Transect (ET) line requires no data but indicates the end of the input data.
Each line has an alphanumeri 10 numeric fields describing the p
T ensure proper ng, th ct either a hes or obst s, wit tion segment. The first two column ch lin the type of fetch or obstruction. The remaining 78 olumns consist of one field of six columns followed by nine fields of eight columns. The
Mapping Partner shall right-justify the numbers in any data field only if no decimal point is used. Decimal points are permitted but not required. The endpoint of one fetch or obstruction is the
calculations.
D.2.7.3.1 Input Coding for WHAFIS After all the necessary input data have been identified on the transect, the Mapping Partner performing the study shall divide the transect into contiguous segments, each r
while obstructions iPartner shall subdivide the fetches at points where ththmaller segm at the tran t's seaward edge to mod
ubdivi WHA segmented input from the Mapping Partner
The Mapping Partner shall he 10 remaining lines, each describing a certain type of fetch or obstruction, are listed as T
follows:
• The Initial Elevation (IE) line describes the initial overwater fe
• The I OF lines fine the endpoint stationin
etation nd MG lines), dunes or other natural or manmade elongated
c field describing the type of input for that line, followed by arameters.
e Mapping Partner shall enter all segments of each transeh one input line used for each fetch or obstruc
o modelis fetc ruction
s of ea e identifyc
D.2.7-7 Section D.2.7 All policy and standards in this document have been superseded by the FEMA Policy for Flood Risk Analysis and Mapping.
However, the document contains useful guidance to support implementation of the new standards.
Guidelines and Specifications for Flood Hazard Mapping Partners [February 2007]
beginning of the next. The first two numeric fields of each line are used to read in the stationing easured in feet from the beginning of transect) and elevation (in feet) of the endpoint. The last
fy the end of the run. If multiple transects are being run, the Title line for the next transect will follow the blank line. All units are in feet unless otherwise specified.
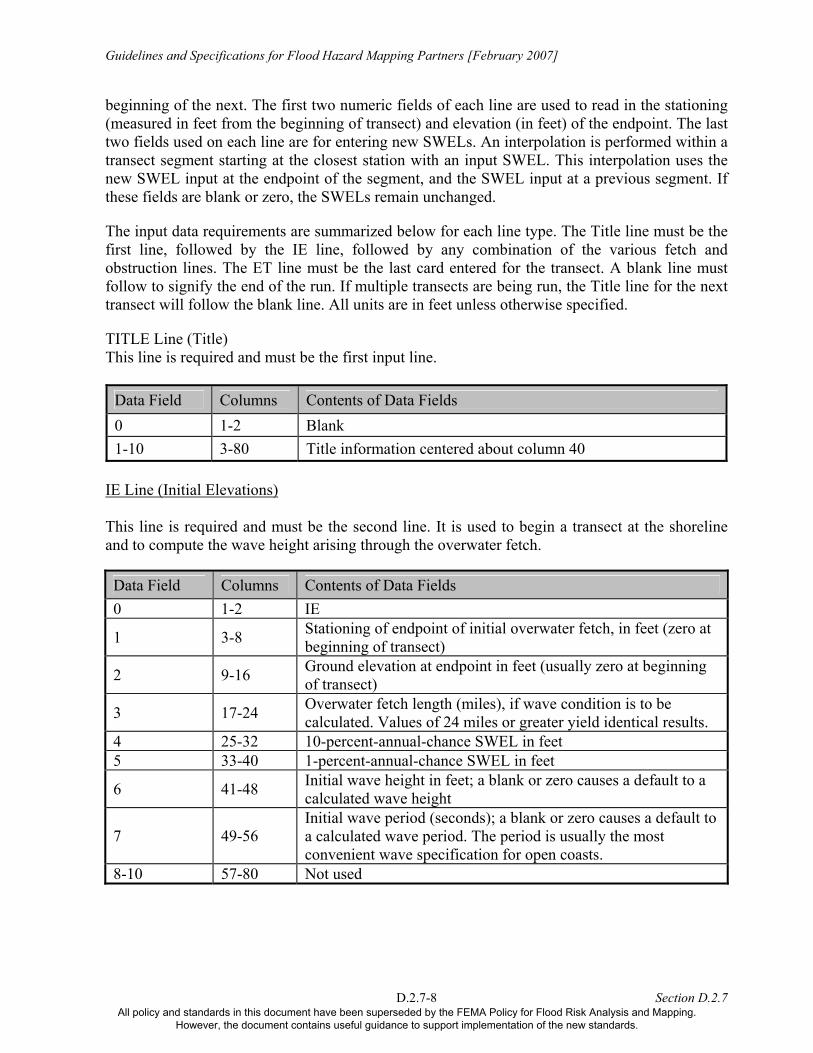
T TitleThis line is required and must be the first input line.
(mtwo fields used on each line are for entering new SWELs. An interpolation is performed within a transect segment starting at the closest station with an input SWEL. This interpolation uses the new SWEL input at the endpoint of the segment, and the SWEL input at a previous segment. If these fields are blank or zero, the SWELs remain unchanged.
The input data requirements are summarized below for each line type. The Title line must be the first line, followed by the IE line, followed by any combination of the various fetch and obstruction lines. The ET line must be the last card entered for the transect. A blank line must follow to signi
ITLE Line ( )
Data Field Columns Contents of Data Fields 0 1-2 Blank 1-10 3-80 Title information centered about column 40
IE Line (Initial Elevations)
his line is required and must be the second line. It is used to begin a transect at the shoreline ve height arising through the overwater fetch.
Tand to compute the wa
Data Field Columns Contents of Data Fields 0 1-2 IE
1 3-8 Stationing of endpoint of initial overwater fetch, in feet (zero at beginning of transect)
2 9-16 Ground elevation at endpoint in feet (usually zero at beginning of transect)
3 17-24 Overwater fetch length (miles), if wave condition is to be calculated. Values of 24 miles or greater yield identical results.
4 25-32 10-percent-annual-chance SWEL in feet 5 33-40 1-percent-annual-chance SWEL in feet
6 41-48 Initial wave height in feet; a blank or zero causes a default to a calculated wave height
7 49-56 Initial wava calculate
e period (seconds); a blank or zero causes a default to d wave period. The period is usually the most
convenient wave specification for open coasts. 8-10 57-80 Not used
D.2.7-8 Section D.2.7 All policy and standards in this document have been superseded by the FEMA Policy for Flood Risk Analysis and Mapping.
However, the document contains useful guidance to support implementation of the new standards.
Guidelines and Specifications for Flood Hazard Mapping Partners [February 2007]
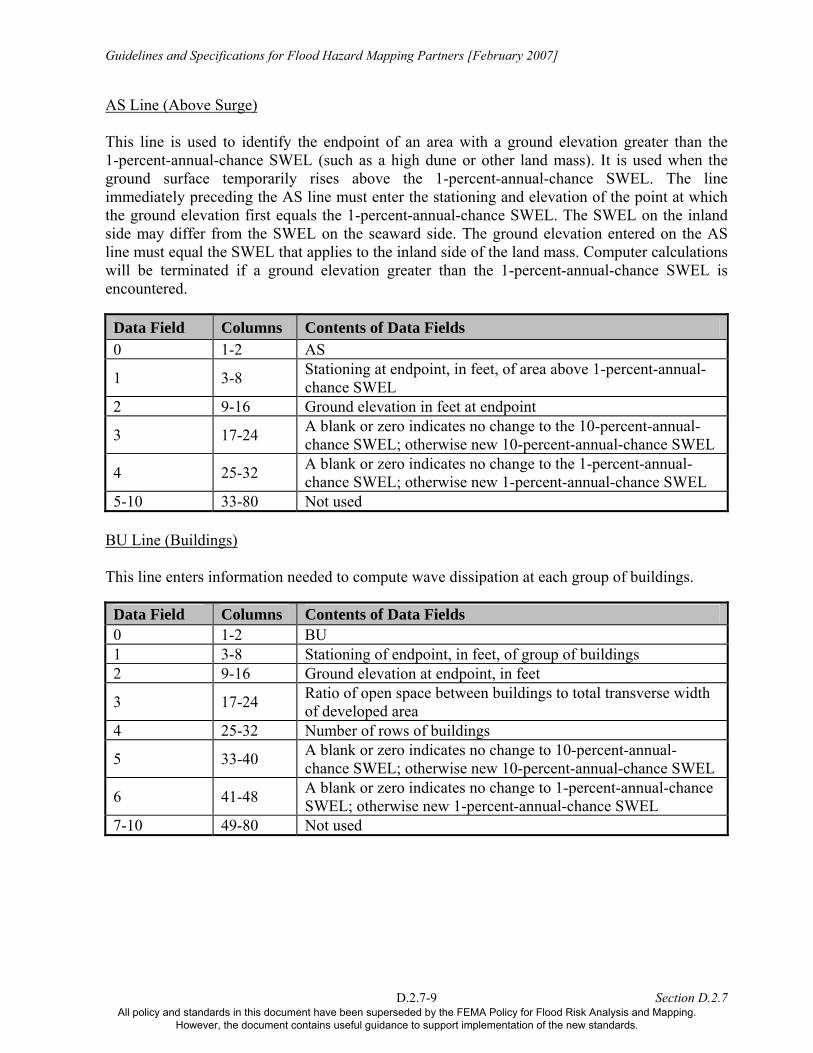
AS Line (Above Surge)
It is used when the ground surface temporarily rises above the 1-percent-annual-chance SWEL. The line i rec S ing and elevation of the point at which the ground elevation first equals the 1-percent-annual-chance SWEL. The SWEL on the inland side may differ fr he SWE ion entered on the AS line must equal th L that Computer calculations will be terminate groun L is encountered.
This line is used to identify the endpoint of an area with a ground elevation greater than the 1-percent-annual-chance SWEL (such as a high dune or other land mass).
mmediately p eding the A line must enter the station
om t L on the seaward side. The ground elevat. e SWE
d if a applies to the inland side of the land massd elevation greater than the 1-percent-annual-chance SWE
Data Field Columns Contents of Data Fields 0 1-2 AS
1 3-8 Stationing at endpoint, in feet, of area above 1-percent-annual-EL chance SW
2 9-16 Ground elevation in feet at endpoint
3 17-24 A blank or zero indicates no change to the 10-percent-annual-chance SWEL; otherwise new 10-percent-annual-chance SWEL
4 25-32 A blank or zero indicates no change to the 1-percent-annual-chance SWEL; otherwise new 1-percent-annual-chance SWEL
5-10 33-80 Not used B ldinU Line (Bui gs) This line enters information needed to compute wave dissipation at each group of buildings.
Data Field Columns Contents of Data Fields 0 1-2 BU 1 3-8 Stationing of endpoint, in feet, of group of buildings 2 9-16 Ground elevation at endpoint, in feet
3 17-24 Ratio of oof develop
pen space between buildings to total transverse width ed area
4 25-32 Number of rows of buildings
5 33-40 A blank or zero indicates no change to 10-percent-annual-chance SWEL; otherwise new 10-percent-annual-chance SWEL
6 41-48 A blank or zero indicates no change to 1-percent-annual-chance SWEL; otherwise new 1-percent-annual-chance SWEL
7-10 49-80 Not used
D.2.7-9 Section D.2.7 All policy and standards in this document have been superseded by the FEMA Policy for Flood Risk Analysis and Mapping.
However, the document contains useful guidance to support implementation of the new standards.
Guidelines and Specifications for Flood Hazard Mapping Partners [February 2007]
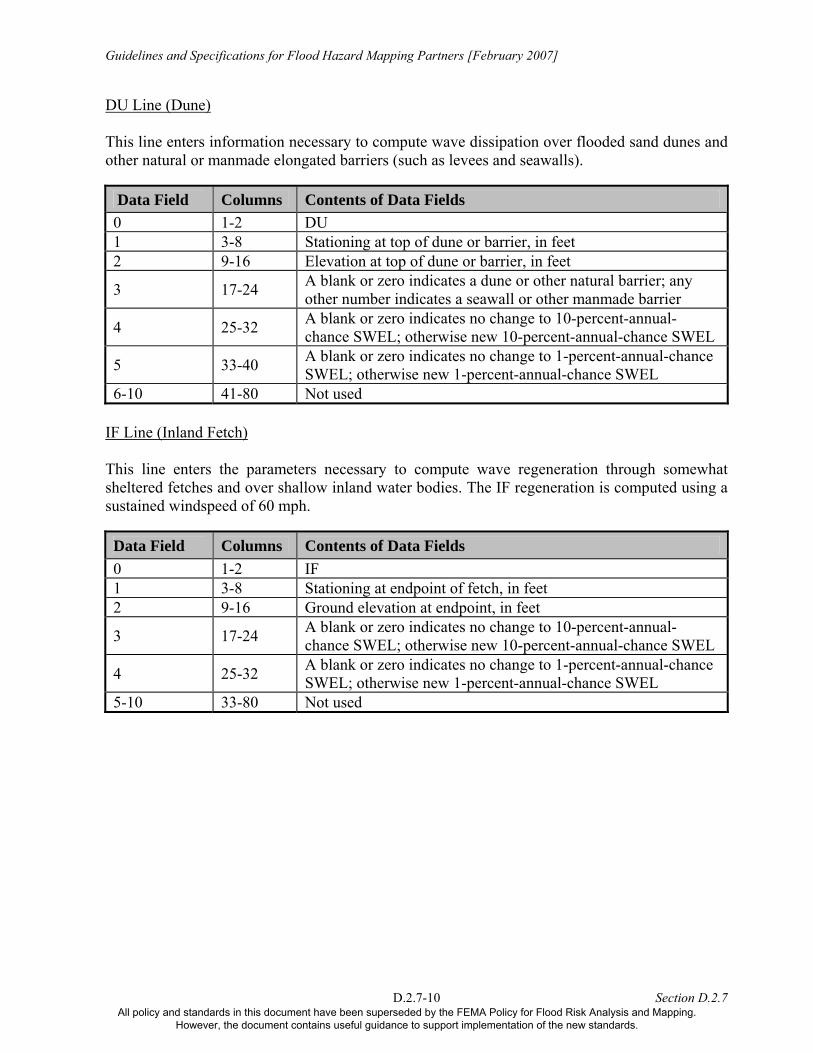
DU Line (Dune) This line enters information necessary to compute wave dissipation over flooded sand dunes and other natural or manmade elongated barriers (such as levees and seawalls).
Data Field Columns Contents of Data Fields 0 1-2 DU 1 3-8 Stationing at top of dune or barrier, in feet 2 9-16 ation at top of dune or barrier, in feet Elev
3 17-24 er natural barrier; any her manmade barrier
A blank or zero indicates a dune or othother number indicates a seawall or ot
4 25-32 A blank or zero indicates no change to 10-percent-annual-chance SWEL; otherwise new 10-percent-annual-chance SWEL
5 33-40 A blank or zero indicates no change to 1-percent-annual-chance SWEL; otherwise new 1-percent-annual-chance SWEL
6-10 41-80 Not used IF Line (Inland Fetch) This line enters the parameters necessary to compute wave regeneration through somewhat sheltered fetches and over shallow inland water bodies. The IF regeneration is computed using a sustained windspeed of 60 mph.
Data Field Columns Contents of Data Fields 0 1-2 IF 1 3-8 Stationing at endpoint of fetch, in feet 2 9-16 Ground elevation at endpoint, in feet
3 17-24 A blank or zero indicates no change to 10-percent-annual-ance SWEL chance SWEL; otherwise new 10-percent-annual-ch
4 25-32 A blank or zero indicates no change to 1-percent-annual-chance SWEL; otherwise new 1-percent-annual-chance SWEL
5-10 33-80 Not used
D.2.7-10 Section D.2.7 All policy and standards in this document have been superseded by the FEMA Policy for Flood Risk Analysis and Mapping.
However, the document contains useful guidance to support implementation of the new standards.
Guidelines and Specifications for Flood Hazard Mapping Partners [February 2007]
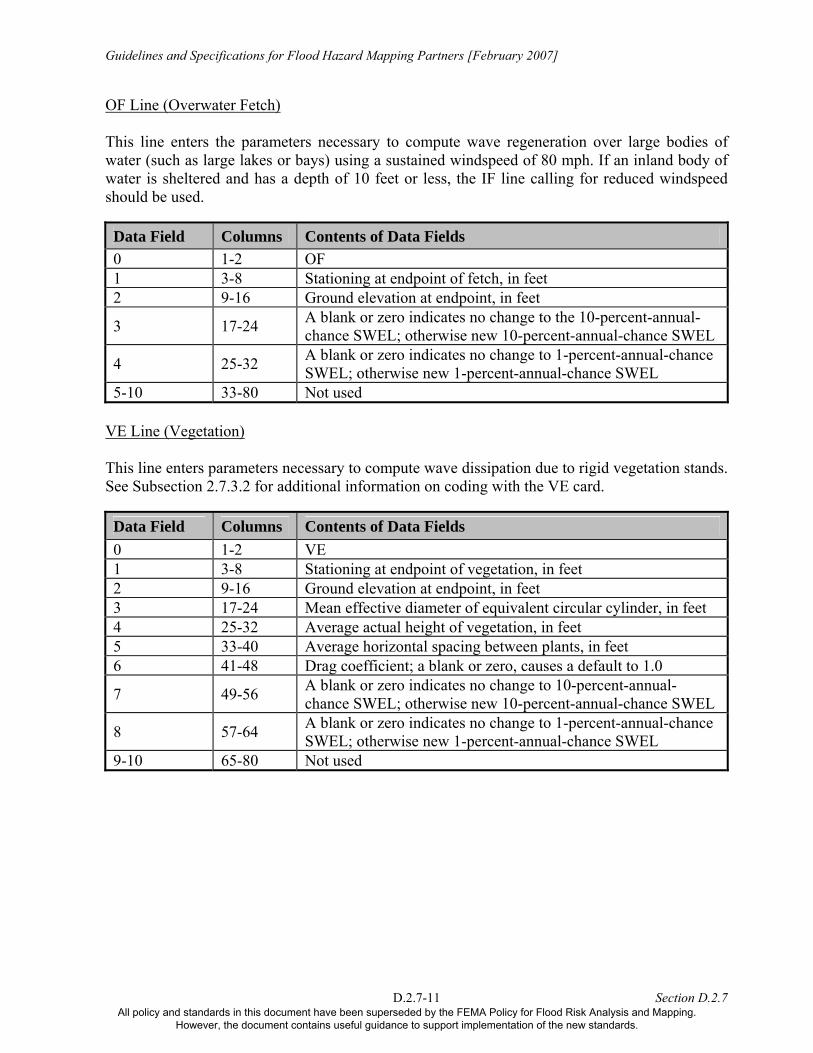
OF Line (Overwater Fetch) This line enters the parameters necessary to compute wave regeneration over large bodies of water (such as large lakes or bays) using a sustained windspeed of 80 mph. If an inland body of water is sheltered and has a depth of 10 feet or less, the IF line calling for reduced windspeed should be used.
Data Field Columns Contents of Data Fields 0 1-2 OF 1 3-8 Stationing at endpoint of fetch, in feet 2 9-16 Ground elevation at endpoint, in feet
3 17-24 A blank or zero indicates no change to the 10-percent-annual-chance SWEL; otherwise new 10-percent-annual-chance SWEL
4 25-32 A blank or zero indicates no change to 1-percent-annual-chance SWEL; otherwise new 1-percent-annual-chance SWEL
5-10 33-80 Not used VE Line (Vegetation) This line enters parameters nec . S Subsection 2. r addi
essary to compute wave dissipation due to rigid vegetation sttional information on coding with the VE card.
andsee 7.3.2 fo
Data Field Columns Contents of Data Fields 0 1-2 VE 1 3-8 Stationing at endpoint of vegetation, in feet 2 9-16 int, in feet Ground elevation at endpo3 17-24 Mean effective diameter of equivalent circular cylinder, in feet 4 25-32 Average actual height of vegetation, in feet 5 33-40 Average horizontal spacing between plants, in feet 6 41-48 Drag coefficient; a blank or zero, causes a default to 1.0
7 49-56 A blank or zero indicates no change to 10-percent-annual-chance SWEL; otherwise new 10-percent-annual-chance SWEL
8 57-64 A blank or zero indicates no change to 1-percent-annual-chance SWEL; otherwise new 1-percent-annual-chance SWEL
9-10 65-80 Not used
D.2.7-11 Section D.2.7 All policy and standards in this document have been superseded by the FEMA Policy for Flood Risk Analysis and Mapping.
However, the document contains useful guidance to support implementation of the new standards.
Guidelines and Specifications for Flood Hazard Mapping Partners [February 2007]
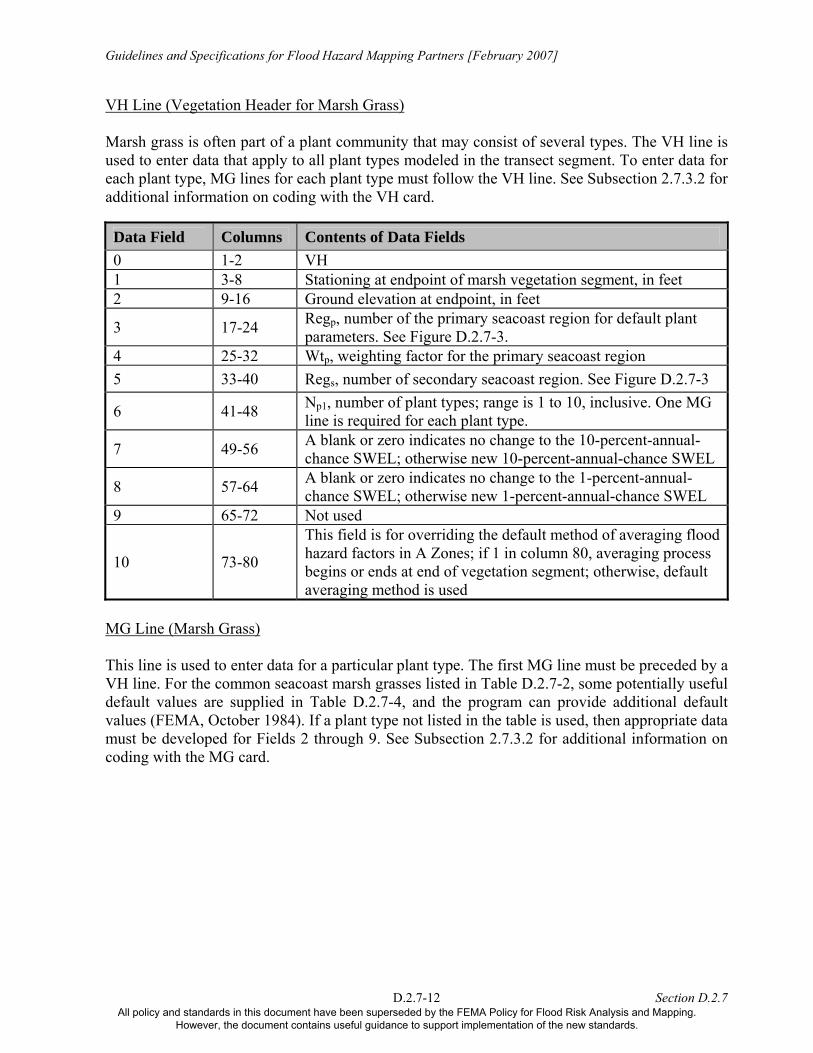
VH Line (Vegetation Header for Marsh Grass) Marsh grass is often part of a plant com several types. The VH line is u to enter data apply to enter data for e plant type, M es for e tion 2.7.3.2 for additional informa n codin
munity that may consist ofsed that all plant types modeled in the transect segment. To
hach G lintion o
ac plant type must follow the VH line. See Subsecg with the VH card.
Data Field Columns Contents of Data Fields 0 1-2 VH 1 3-8 Stationing at endpoint of marsh vegetation segment, in feet 2 9-16 Ground elevation at endpoint, in feet
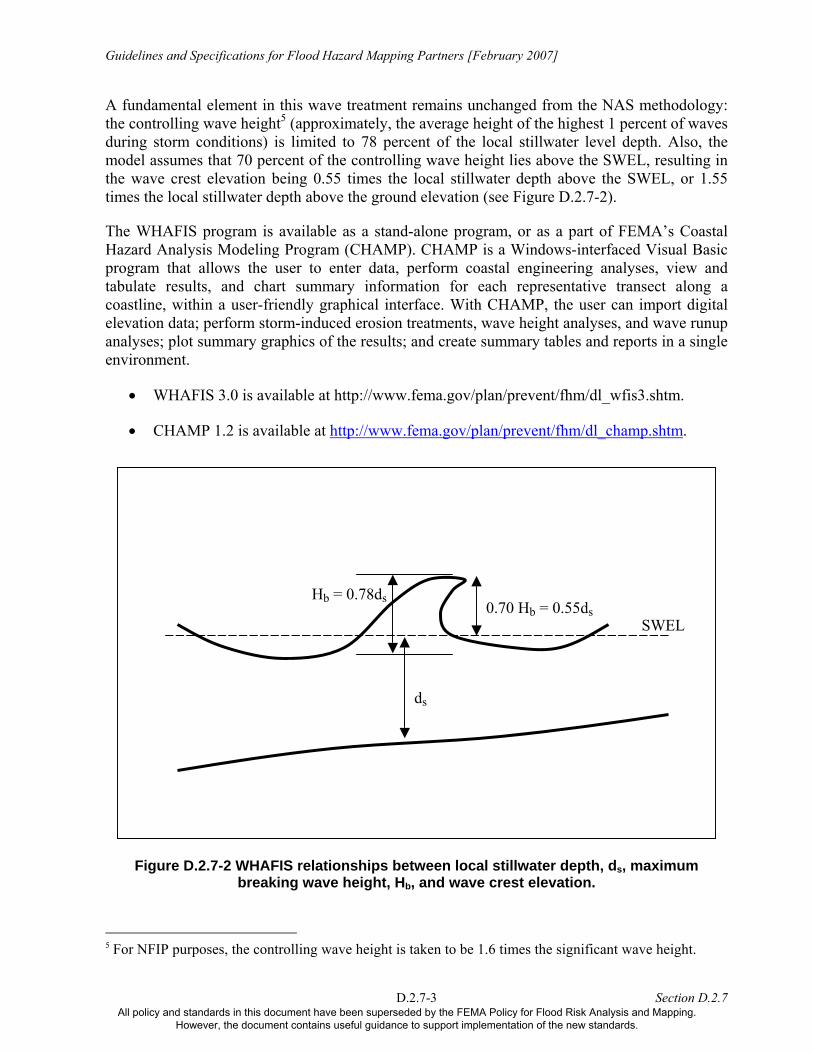
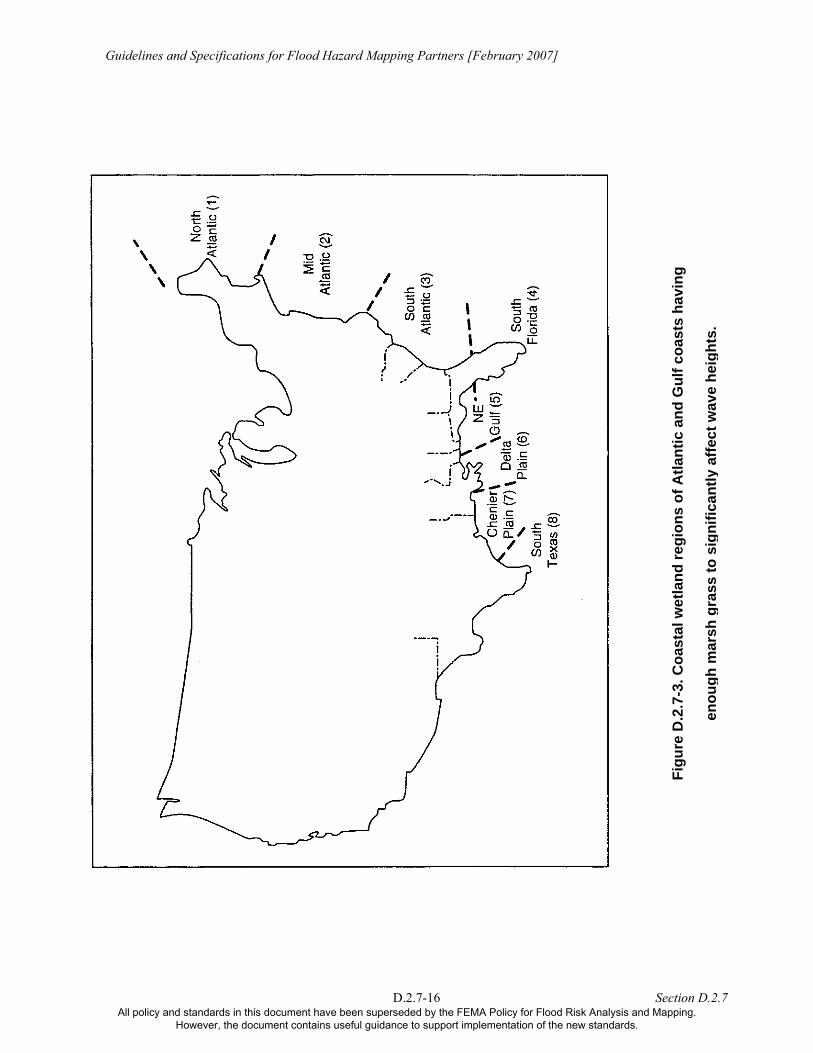
3 17-24 Regp, number of the primary seacoast region for default plant parameters. See Figure D.2.7-3.
4 25-32 Wtp, weighting factor for the primary seacoast region 5 33-40 Regs, number of secondary seacoast region. See Figure D.2.7-3
6 41-48 N , number of plant typesp1line is requ
; range is 1 to 10, inclusive. One MG ired for each plant type.
7 49-56 A blank or zero indicates no change to the 10-percent-annual-chance SWEL; otherwise new 10-percent-annual-chance SWEL
8 57-64 chance SWEL; otherwise new 1-percent-annual-chance SWEL A blank or zero indicates no change to the 1-percent-annual-
9 65-72 Not used
10 73-80
This field is for overriding the default method of averaging flood if 1 in column 80, averaging process
ns or ends at end of vegetation segment; otherwise, default method is used
hazard factors in A Zones;begiaveraging
MG Line (Marsh Grass)
th the MG card.
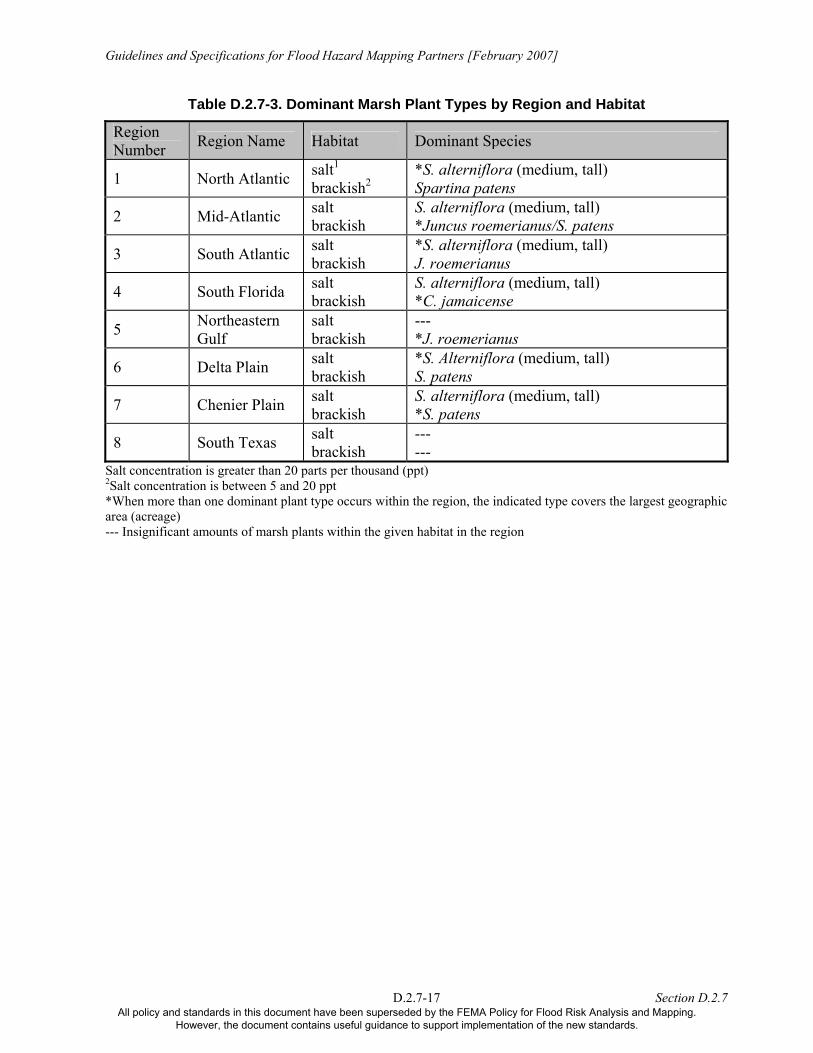
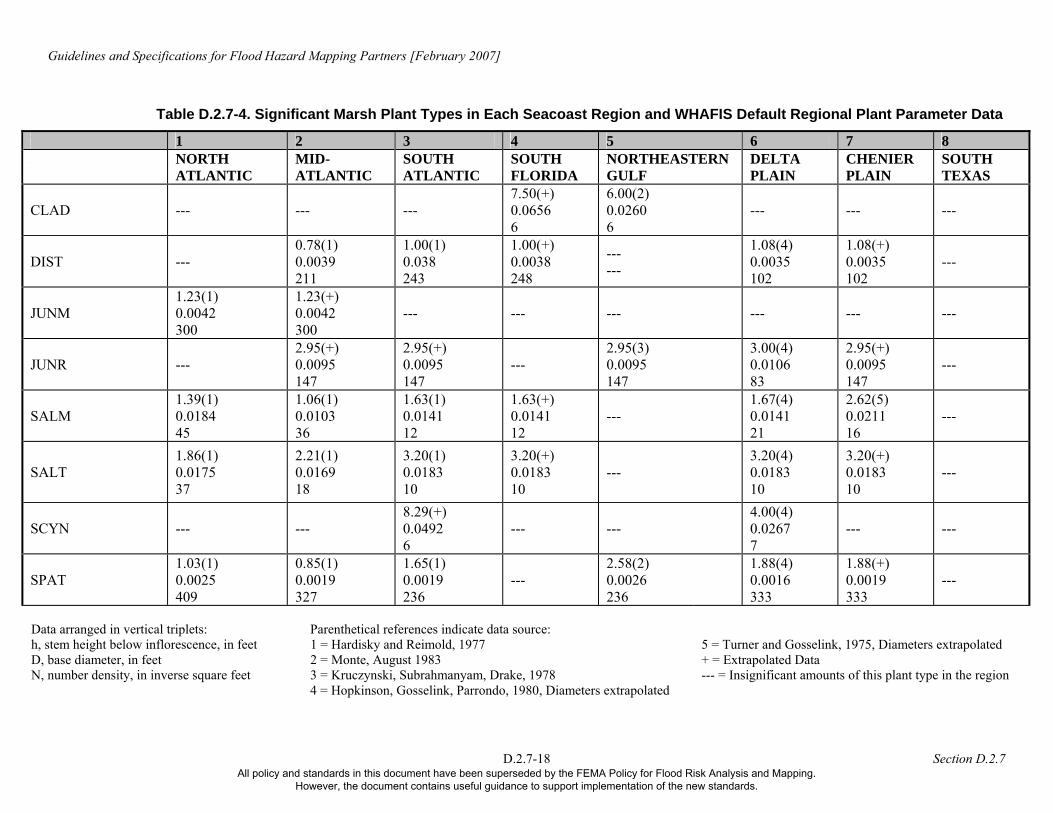
This line is used to enter data for a particular plant type. The first MG line must be preceded by a VH line. For the common seacoast marsh grasses listed in Table D.2.7-2, some potentially useful default values are supplied in Table D.2.7-4, and the program can provide additional default values (FEMA, October 1984). If a plant type not listed in the table is used, then appropriate data must be developed for Fields 2 through 9. See Subsection 2.7.3.2 for additional information on coding wi
D.2.7-12 Section D.2.7 All policy and standards in this document have been superseded by the FEMA Policy for Flood Risk Analysis and Mapping.
However, the document contains useful guidance to support implementation of the new standards.
Guidelines and Specifications for Flood Hazard Mapping Partners [February 2007]
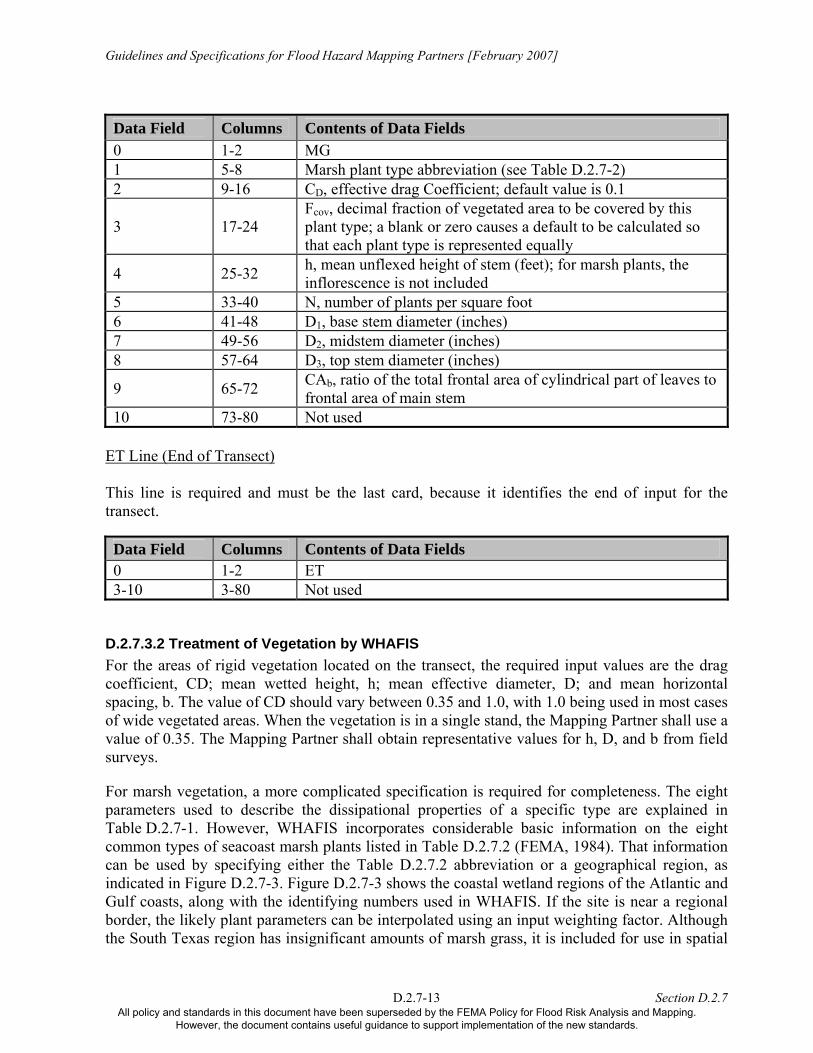
Data Field Columns Contents of Data Fields 0 1-2 MG 1 5-8 Marsh plant type abbreviation (see Table D.2.7-2) 2 9-16 CD, effective drag Coefficient; default value is 0.1
3 17-24 Fcov, decimal fraction of vegetated area to be covered by this plant type; a blank or zero causes a default to be calculated so that each plant type is represented equally
4 25-32 h, mean unflexed height of stem (feet); for marsh plants, the inflorescence is not included
5 33-40 N, number of plants per square foot 6 41-48 D1, base stem diameter (inches) 7 49-56 D2, midstem diameter (inches) 8 57-64 D3, top stem diameter (inches)
9 65-72 CAb, ratio of the total frontal area of cylindrical part of leaves to frontal area of main stem
10 73-80 Not used ET Line (End of Transect) T equired and last card, because it identifies the end of input for the transect.
his line is r must be the
Data Field Columns Contents of Data Fields 0 1-2 ET 3-10 3-80 Not used
D .7.3.2 Treatment of VFor the areas of rigid vegetation located on the transect, the required input values are the drag coefficient, CD; mean l s ing, b. The value of ases of wide vegetated areas. the vegetation is in a single stand, the Mapping Partner shall use a v e of 0.35. The Mapp ld surveys.
For marsh vegetation, a parameters used to desc in Table D.2.7-1. However ht common types of seacoa c e used by specifyi s i ted in Figure D.2.7 and
ulf coasts, along with torder, the likely plant parameters can be interpolated using an input weighting factor. Although
the South Texas region has insignificant amounts of marsh grass, it is included for use in spatial
.2 egetation by WHAFIS
wetted height, h; mean effective diameter, D; and mean horizontaCD should vary between 0.35 and 1.0, with 1.0 being used in most cWhen
pac
alu ing Partner shall obtain representative values for h, D, and b from fie
more complicated specification is required for completeness. The eight ribe the dissipational properties of a specific type are explained
, WHAFIS incorporates considerable basic information on the eigst marsh plants listed in Table D.2.7.2 (FEMA, 1984). That informationng either the Table D.2.7.2 abbreviation or a geographical region, a-3. Figure D.2.7-3 shows the coastal wetland regions of the Atlantiche identifying numbers used in WHAFIS. If the site is near a regional
an bndica
Gb
D.2.7-13 Section D.2.7 All policy and standards in this document have been superseded by the FEMA Policy for Flood Risk Analysis and Mapping.
However, the document contains useful guidance to support implementation of the new standards.
Guidelines and Specifications for Flood Hazard Mapping Partners [February 2007]
interpolation erance and vertical distribution of plants across the profile.
C ge of each marsh plant type, so that some plant types are not found in all regions. Table D.2.7-3 lists the dominant plant type in each region, where the term “ cover the largest amount of area in the marshes. Table D.2.7-4 shows the significant plant types in each region, where the term “significant” refers to t east 10 uare feet) to significantly a tal wetland , plant type, and area or p d. Given this informat AFIS will supply default v eters appropriate to the site (FEMA, 1984).
Following the identification of the marsh plant types present, the area and fraction of coverage, Fcov, for each plant type must be calculated. The total area of marsh vegetation coverage is determined for each transect. The different types of vegetation within this area usually occur in patches. Fcov is defined for each plant type as the ratio of the patch area for that type to the total marsh area. Using the above data, a fairly good determination can be made of the plant types present, but an attempt should be made to confirm these plant types. Local, county, or State officials may provide some assistance, and a site visit can be very useful.
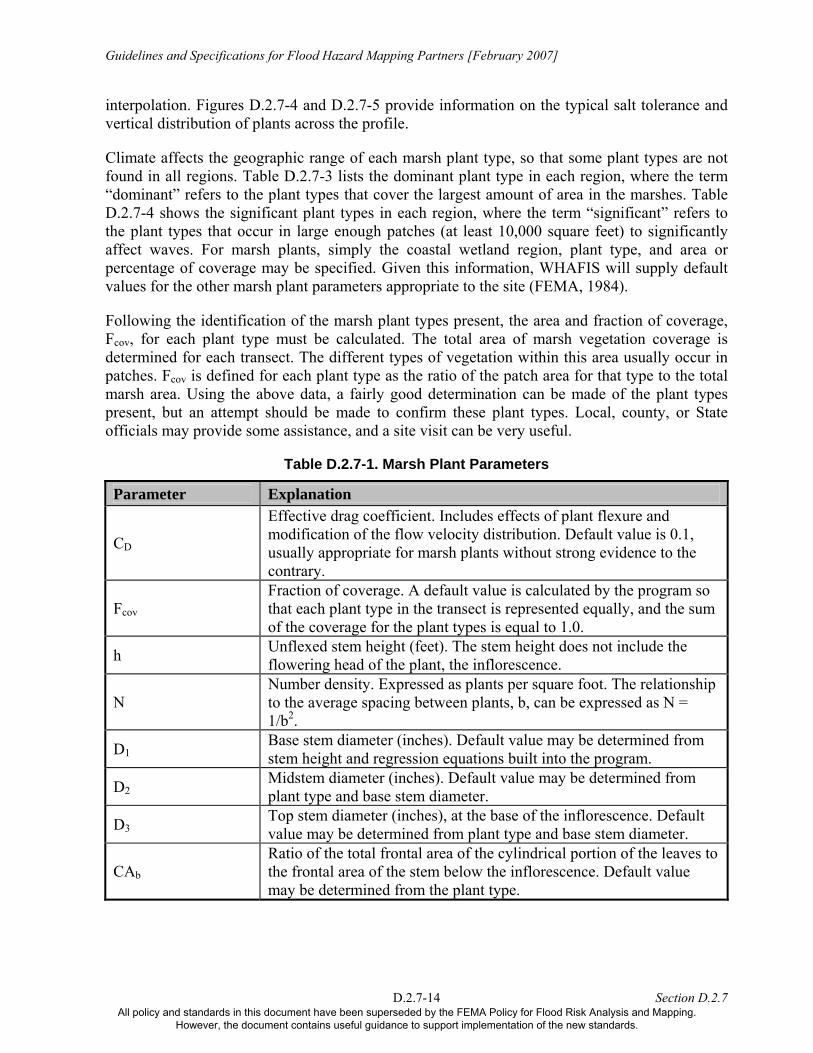
Table D.2.7-1. Marsh Plant Parameters
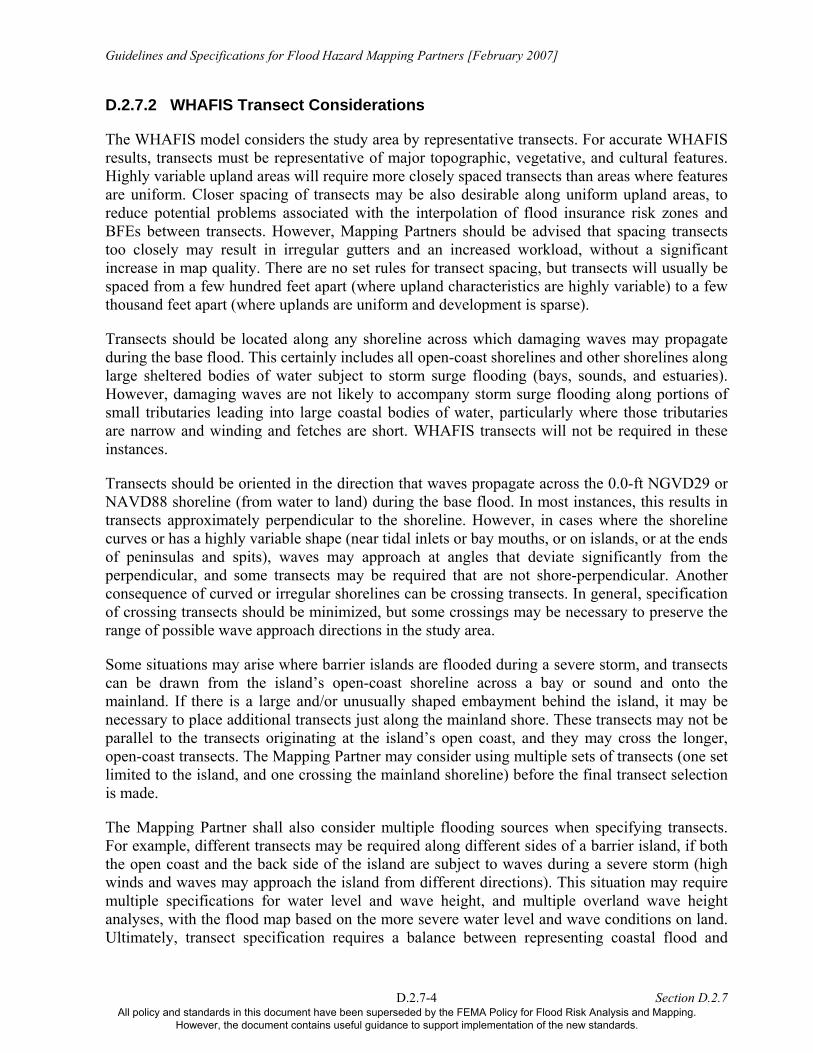
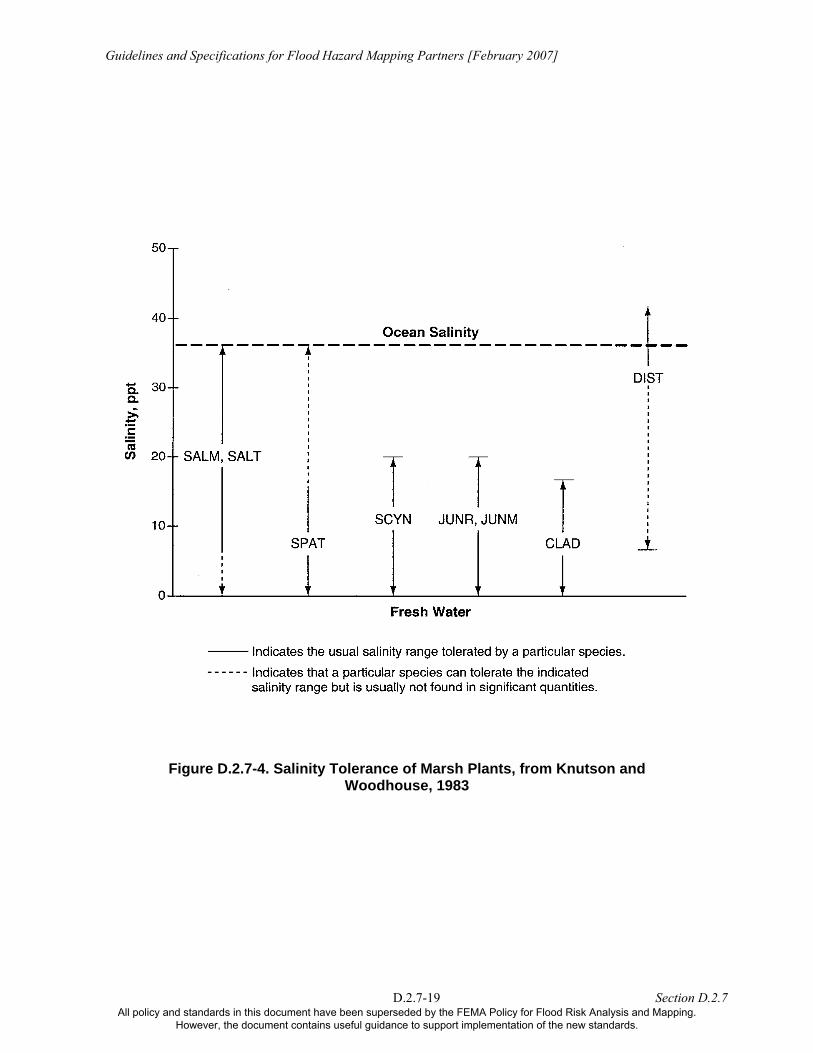
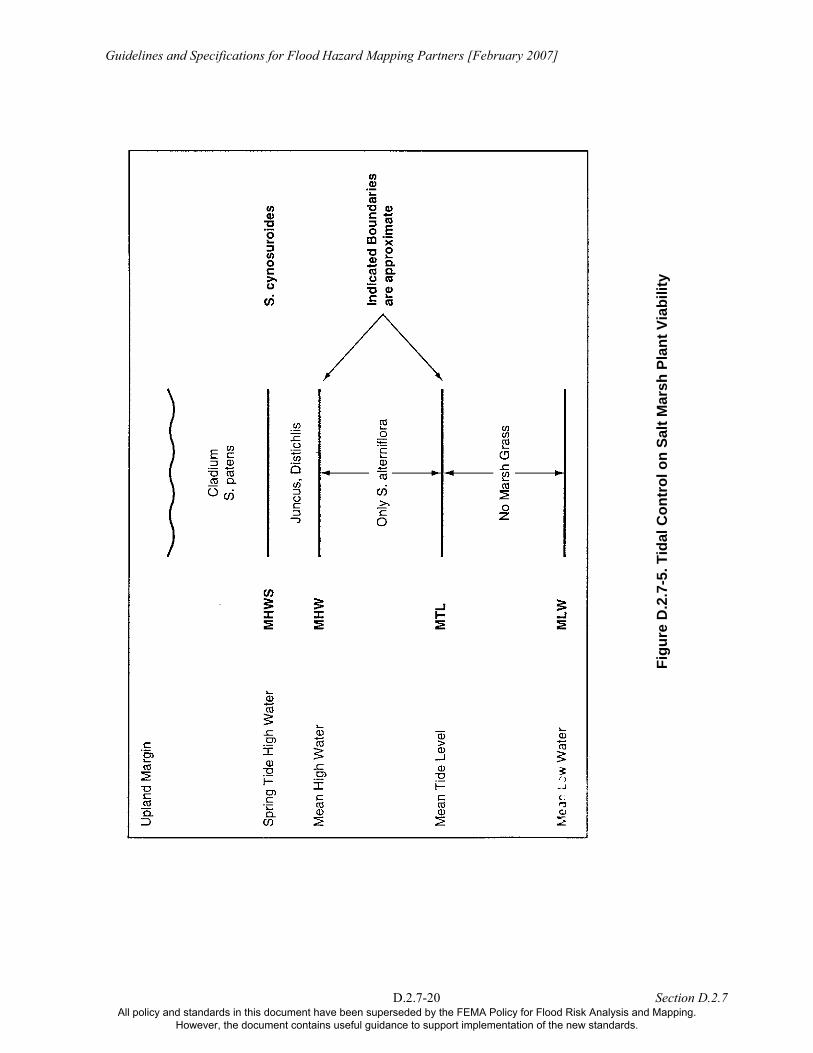
. Figures D.2.7-4 and D.2.7-5 provide information on the typical salt tol
limate affects the geographic ran
dominant” refers to the plant types that
he plant types that occur in large enough patches (at l ,000 sqffect waves. For marsh plants, simply the coas regionercentage of coverage may be specifie ion, WHalues for the other marsh plant param
Parameter Explanation
CD
Effective drag coefficient. Includes effects of plant flexure and modification of the flow velocity distribution. Default value is 0.1, usually appropriate for marsh plants without strong evidence to the contrary.
Fcov
Fraction of coverage. A default value is calculated by the program so that each plant type in the transect is represented equally, and the sum of the coverage for the plant types is equal to 1.0.
h Unflexed stem height (feet). The stem height does not include the flowering head of the plant, the inflorescence.
N Number density. Expressed as plants per square foot. The relationship to the average spacing between plants, b, can be expressed as N = 1/b2.
D1Base stem diameter (inches). Default value may be determined from stem height and regression equations built into the program.
D2Midstem diameter (inches). Default value may be determined from plant type and base stem diameter.
D3Top stem diameter (inches), at the base of the inflorescence. Default value may be determined from plant type and base stem diameter.
CAb
Ratio of the total frontal area of the cylindrical portion of the leaves to the frontal area of the stem below the inflorescence. Default value may be determined from the plant type.
D.2.7-14 Section D.2.7 All policy and standards in this document have been superseded by the FEMA Policy for Flood Risk Analysis and Mapping.
However, the document contains useful guidance to support implementation of the new standards.
Guidelines and Specifications for Flood Hazard Mapping Partners [February 2007]
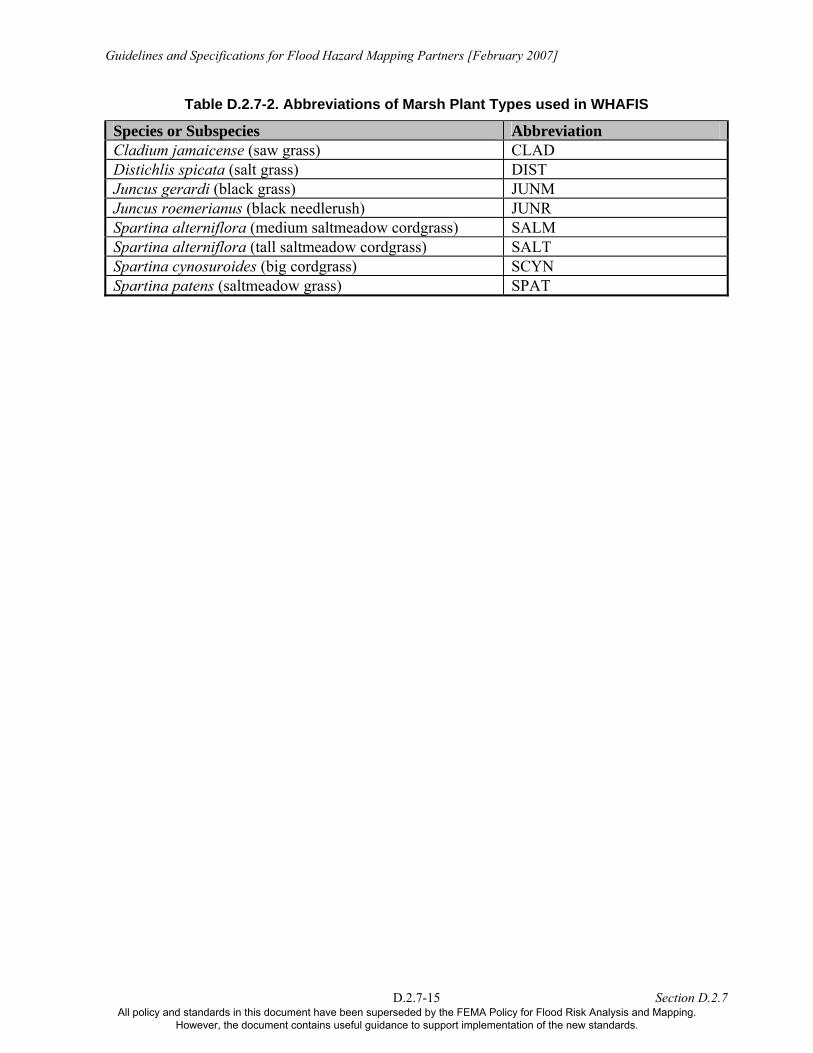
Table D.2.7-2. Abbreviations of Marsh Plant Types used in WHAFIS
Species or Subspecies Abbreviation Cladium jamaicense (saw grass) CLAD Distichlis spicata (salt grass) DIST Juncus gerardi (black grass) JUNM Juncus roemerianus (black needlerush) JUNR Spartina alterniflora (medium saltmeadow cordgrass) SALM Spartina alterniflora (tall saltmeadow cordgrass) SALT Spartina cynosuroides (big cordgrass) SCYN Spartina patens (saltmeadow grass) SPAT
D.2.7-15 Section D.2.7 All policy and standards in this document have been superseded by the FEMA Policy for Flood Risk Analysis and Mapping.
However, the document contains useful guidance to support implementation of the new standards.
Guidelines and Specifications for Flood Hazard Mapping Partners [February 2007]
Figu
re D
.2.7
-3. C
oast
al w
etla
nd re
gion
s of
Atla
ntic
and
Gul
f coa
sts
havi
ng
enou
gh m
arsh
gra
ss to
sig
nific
antly
affe
ct w
ave
heig
hts.
D.2.7-16 Section D.2.7 All policy and standards in this document have been superseded by the FEMA Policy for Flood Risk Analysis and Mapping.
However, the document contains useful guidance to support implementation of the new standards.
Guidelines and Specifications for Flood
D.
Hazard Mapping Partners [February 2007]
17
Table D.2.7-3. Dominant Marsh Plant Ty Region and Habitat
2.7- Section D.2.7
pes by
Region Number Region Name Habitat Dominant Species
1 North salt1 . a lora (med ll) Atlantic brackish2*SSpartina patens
lternif ium, ta
2 Mid-Atlantic brackish (m
*Juncus roemerianus/S. patens salt S. alterniflora edium, tall)
3 South Atlantic salt brac
*S. alterniflora (medium, tall) ro nukish J. emeria s
4 South Florida salt brac
iukish
S. alterniflora*
(me
ed m, tall) C. jamaicens
5 Northeastern Gulf
salt brackish
--- *J. roemerianus
6 Delta Plain salt brackish
*S. Alterniflora (medium, tall) S. patens
7 Chenier Plain salt brackish
S. alterniflora (medium, tall) *S. patens
8 South Texas salt brackish
--- ---
Salt concentratncentrat
ore t
nifican
ion is greater than 20 parts per thousand (ppt) t co ion is between 5 and 20 ppt
d t plant type occurs wi ndicated type covers th c
th gio
2Sal*When marea (acreage) --- Insi
han
t am
one
o
om
s of m
inan thin
ven habi
the region
at i
, the i
n th
e largest geographi
g unt arsh plants wi in the gi t e re n
All policy and standards in this document have been superseded by the FEMA Policy for Flood Risk Analysis and Mapping. However, the document contains useful guidance to support implementation of the new standards.
Hazard Mapping Partners [February 2007]
D.2.7-18 Secti
pes in Each Seacoast Region and WHAFIS Default Regional Plant Parameter Data
on D.2.7
ated
he region
Guidelines and Specifications for Flood
Table D.2.7-4. Significant Marsh Plant Ty
REGION NO.
REGION NAME:
CLAD ---
DIST ---
JUNM
JUNR ---
SALM
SALT
SCYN ---
SPAT
Data arrangeh, stem heightD, base diamN, number densi
1 2 3 4 5 6 7 8 NORTH ATLANTIC
MID- ATLANTIC
SOUTH ATLANTIC
SOUTH FLORIDA
NORTHEASTERN GULF
DELTA PLAIN
CHENIER PLAIN
SOUTH TEXAS
--- --- 7.50(+) 0.0656 6
6.00(2) 0.0260 6
--- --- ---
0.78(1) 0.0039 211
1.00(1) 0.038 243
1.00(+) 0.0038 248
--- ---
1.08(4) 0.0035 102
1.08(+) 0.0035 102
---
1.23(1) 0.0042 300
1.23(+) 0.0042 300
--- --- --- --- --- ---
2.95(+) 0.0095 147
2.95(+) 0.0095 147
--- 2.95(3) 0.0095 147
3.00(4) 0.0106 83
2.95(+) 0.0095 147
---
1.39(1) 0.0184 45
1.06(1) 0.0103 36
1.63(1) 0.0141 12
1.63(+) 0.0141 12
--- 1.67(4) 0.0141 21
2.62(5) 0.0211 16
---
1.86(1) 0.0175 37
2.21(1) 0.0169 18
3.20(1) 0.0183 10
3.20(+) 0.0183 10
--- 3.20(4) 0.0183 10
3.20(+) 0.0183 10
---
--- 8.29(+) 0.0492 6
--- --- 4.00(4) 0.0267 7
--- ---
1.03(1) 0.0025 409
0.85(1) 0.0019 327
1.65(1) 0.0019 236
--- 2.58(2) 0.0026 236
1.88(4) 0.0016 333
1.88(+) 0.0019 333
---
d in vertical triplets: Parenthetical references indicate data source:
below inflorescence, in feet 1 = Hardisky and Reimold, 1977 5 = Turner and Gosselink, 1975, Diameters extrapoleter, in feet 2 = Monte, August 1983 + = Extrapolated Data
ty, in inverse square feet 3 = Kruczynski, Subrahmanyam, Drake, 1978 --- = Insignificant amounts of this plant type in t 4 = Hopkinson, Gosselink, Parrondo, 1980, Diameters extrapolated
All policy and standards in this document have been superseded by the FEMA Policy for Flood Risk Analysis and Mapping. However, the document contains useful guidance to support implementation of the new standards.
Guidelines and Specifications for Flood Hazard Mapping Partners [February 2007]
D.2.7-19 Section D.2.7
Figure D.2.7-4. Salinity Tolerance of Marsh Plants, from Knutson and Woodhouse, 1983
All policy and standards in this document have been superseded by the FEMA Policy for Flood Risk Analysis and Mapping. However, the document contains useful guidance to support implementation of the new standards.
Guidelines and Specifications for Flood Hazard Mapping Partners [February 2007]
D.2.7-20 Section D.2.7
Figu
re D
.2.7
-5. T
idal
Con
trol
on
Salt
Mar
sh P
lant
Via
bilit
y
All policy and standards in this document have been superseded by the FEMA Policy for Flood Risk Analysis and Mapping. However, the document contains useful guidance to support implementation of the new standards.
Guidelines and Specifications for Flood Hazard Mapping Partners [February 2007]
D.2 .4
The ou d flood insurance risk zones along the transect. The output is in six parts, as discussed below.
Part 1 -This is th manual ntout with column headings for eac n ctly ben th
Part 2 -This is wave crest elevations at the endpoint of each fetch and obstruction of the input, and at calculation poi g
Part 3 -This i nd elevation is greater than the 1-percent-annual-chance stillwater (surge) elevation. Only areas identified by AS lines are listed.
Part 4 - Location of Surge Elevations This is a list of the 10- and 1-percent-annual-chance stillwater (surge) elevations and the stat i
Part 5 - Location of V Zones Thi s ns of the V-zone areas relative to these boundaries. The stationing is of as windward or leeward of the boundary.
Part 6 -This is . The loca n t. Betw eInitiativZones, respectively (elevations will not changeWh .
D.2.7.5The r
•
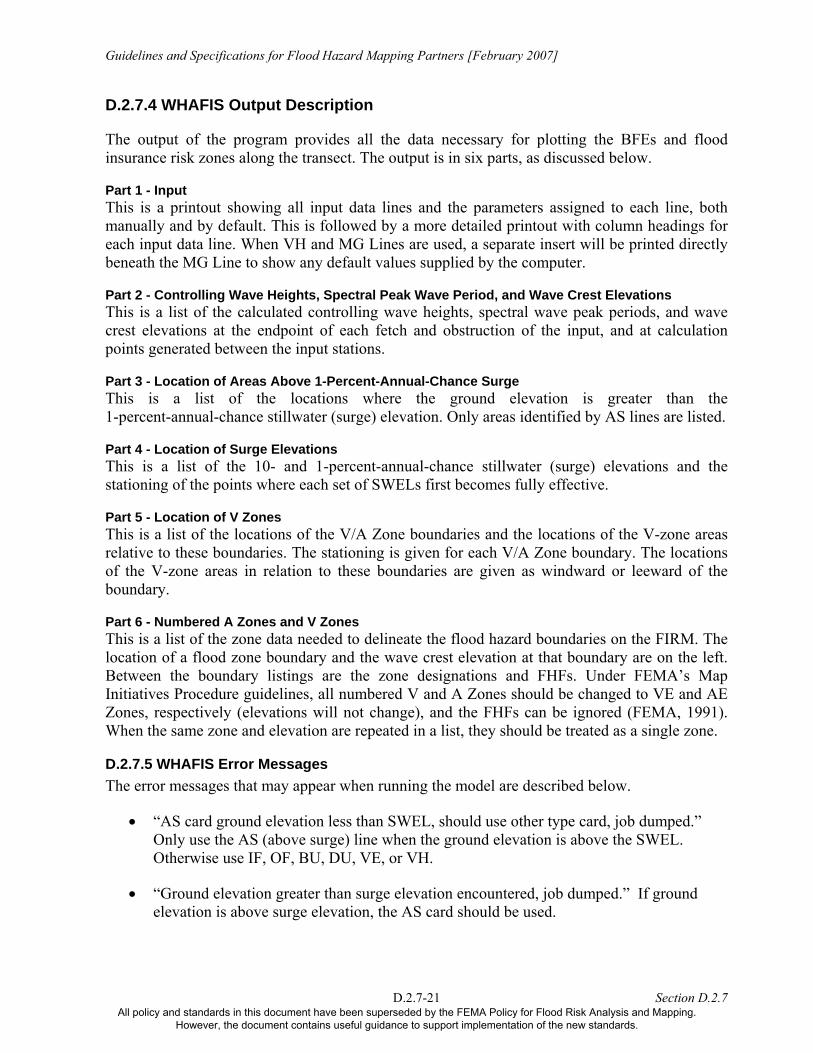
.7 WHAFIS Output Description
tput of the program provides all the data necessary for plotting the BFEs an
Input a printout showing all input data lines and the parameters assigned to each line, boly and by default. This is followed by a more detailed pri
h i put data line. When VH and MG Lines are used, a separate insert will be printed direea the MG Line to show any default values supplied by the computer.
Controlling Wave Heights, Spectral Peak Wave Period, and Wave Crest Elevations a list of the calculated controlling wave heights, spectral wave peak periods, and
nts enerated between the input stations.
Location of Areas Above 1-Percent-Annual-Chance Surge s a list of the locations where the grou
ion ng of the points where each set of SWELs first becomes fully effective.
s i a list of the locations of the V/A Zone boundaries and the locatiogiven for each V/A Zone boundary. The locations
the V-zone areas in relation to these boundaries are given
Numbered A Zones and V Zones a list of the zone data needed to delineate the flood hazard boundaries on the FIRM
tio of a flood zone boundary and the wave crest elevation at that boundary are on the lefe n the boundary listings are the zone designations and FHFs. Under FEMA’s Map
es Procedure guidelines, all numbered V and A Zones should be changed to VE and AE ), and the FHFs can be ignored (FEMA, 1991).
en the same zone and elevation are repeated in a list, they should be treated as a single zone
WHAFIS Error Messages er or messages that may appear when running the model are described below.
“AS card ground elevation less than SWEL, should use other type card, job dumped.” Only use the AS (above surge) line when the ground elevation is above the SWEL. Otherwise use IF, OF, BU, DU, VE, or VH.
• “Ground elevation greater than surge elevation encountered, job dumped.” If ground elevation is above surge elevation, the AS card should be used.
D.2.7-21 Section D.2.7 All policy and standards in this document have been superseded by the FEMA Policy for Flood Risk Analysis and Mapping.
However, the document contains useful guidance to support implementation of the new standards.
Guidelines and Specifications for Flood Hazard Mapping Partners [February 2007]
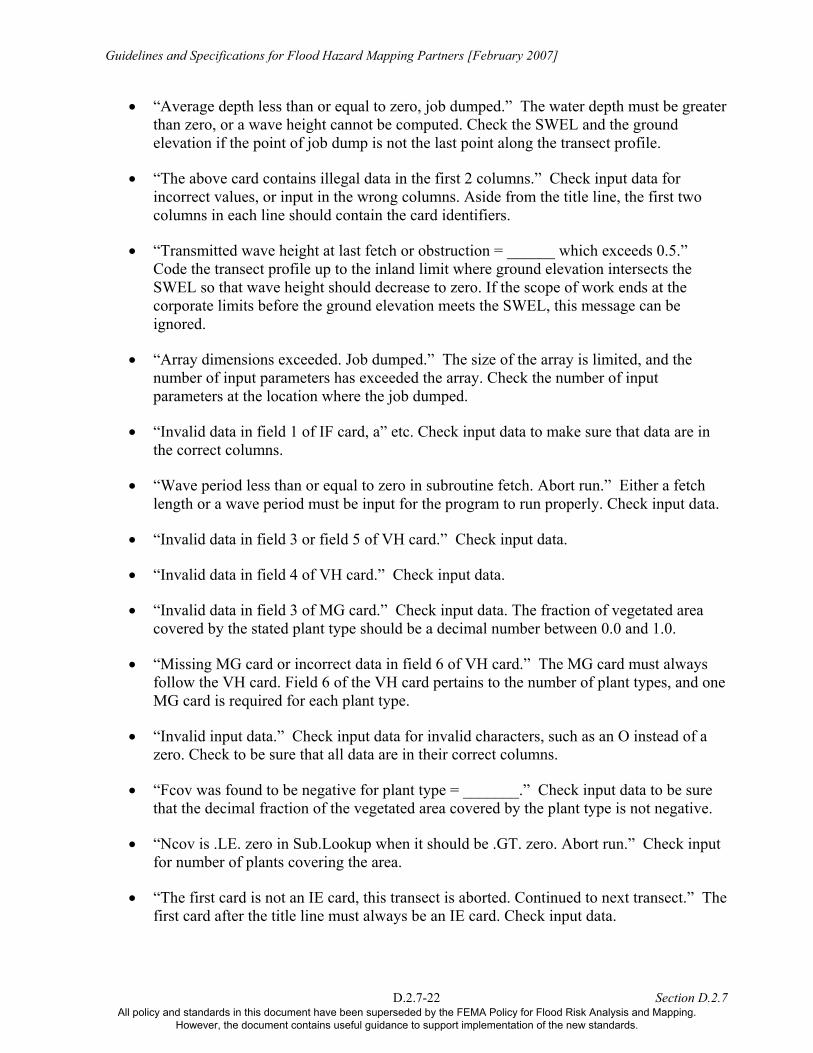
• “Average depth less than or equal to zero, job dumped.” The water depth must be greater than zero, or a wave height cannot be computed. Check the SWEL and the ground
•
• “Transmitted wave height at last fetch or obstruction = ______ which exceeds 0.5.”
• “Array dimensions exceeded. Job dumped.” The size of the array is limited, and the
• n
• “Wave period less than or equal to zero in subroutine fetch. Abort run.” Either a fetch program to run properly. Check input data.
card or incorrect data in field 6 of VH card.” The MG card must always follow the VH card. Field 6 of the VH card pertains to the number of plant types, and one
ck to be sure that all data are in their correct columns.
heck input data to be sure that the decimal fraction of the vegetated area covered by the plant type is not negative.
• “Ncov is .LE. zero in Sub.Lookup when it should be .GT. zero. Abort run.” Check input for number of plants covering the area.
• “The first card is not an IE card, this transect is aborted. Continued to next transect.” The first card after the title line must always be an IE card. Check input data.
elevation if the point of job dump is not the last point along the transect profile.
“The above card contains illegal data in the first 2 columns.” Check input data for incorrect values, or input in the wrong columns. Aside from the title line, the first two columns in each line should contain the card identifiers.
Code the transect profile up to the inland limit where ground elevation intersects the SWEL so that wave height should decrease to zero. If the scope of work ends at the corporate limits before the ground elevation meets the SWEL, this message can be ignored.
number of input parameters has exceeded the array. Check the number of input parameters at the location where the job dumped.
“Invalid data in field 1 of IF card, a” etc. Check input data to make sure that data are ithe correct columns.
length or a wave period must be input for the
• “Invalid data in field 3 or field 5 of VH card.” Check input data.
• “Invalid data in field 4 of VH card.” Check input data.
• “Invalid data in field 3 of MG card.” Check input data. The fraction of vegetated area covered by the stated plant type should be a decimal number between 0.0 and 1.0.
• “Missing MG
MG card is required for each plant type.
• “Invalid input data.” Check input data for invalid characters, such as an O instead of a zero. Che
• “Fcov was found to be negative for plant type = _______.” C
D.2.7-22 Section D.2.7 All policy and standards in this document have been superseded by the FEMA Policy for Flood Risk Analysis and Mapping.
However, the document contains useful guidance to support implementation of the new standards.
Guidelines and Specifications for Flood Hazard Mapping Partners [February 2007]
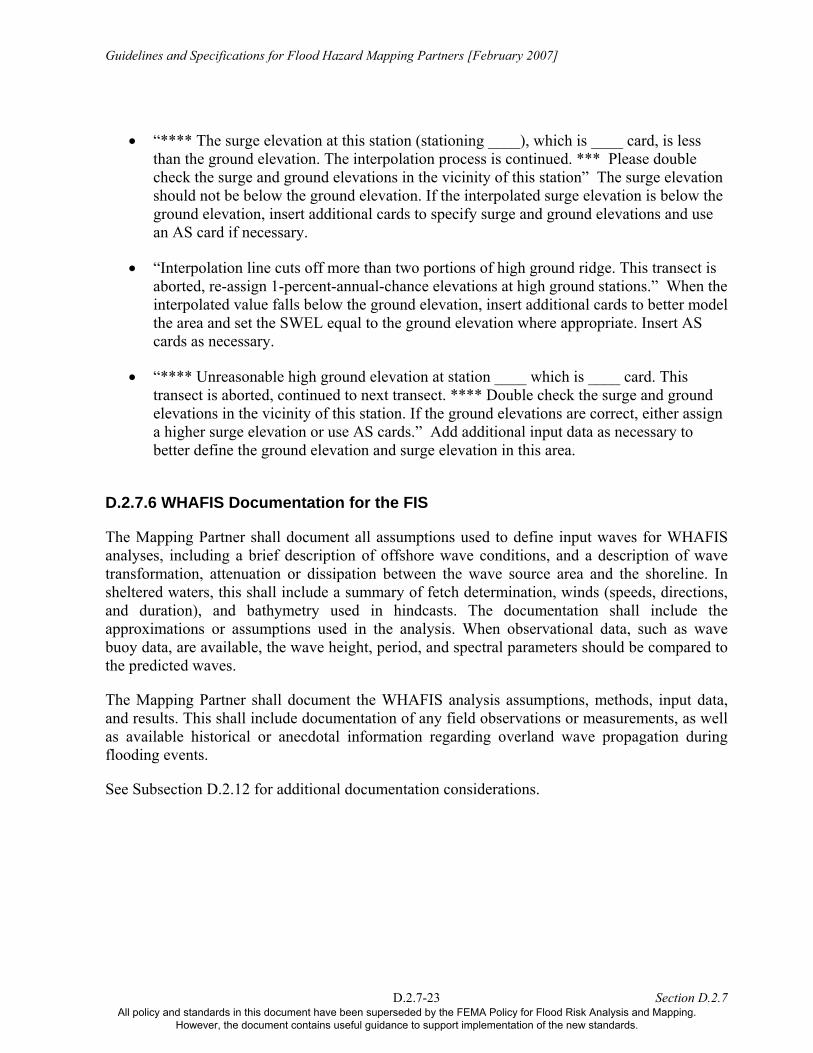
• “**** The surge elevation at this station (stationing ____), which is ____ card, is less than the ground elevation. The interpolation process is continued. *** Please double check the surge and ground elevations in the vicinity of this station” The surge elevation should not be below the ground elevation. If the interpolated surge elevation is below the ground elevation, insert additional cards to specify surge and ground elevations and use an AS card if necessary.
cuts off more than two portions of high ground ridge. This transect is sign 1-percent-annual-chance elevations at high ground stations.” When the
.2.7.6 WHAFIS Documentation for the FIS
The Mapping Partner shall document all assumptions used to define input waves for WHAFIS analyses, including a brief description of offshore wave conditions, and a description of wave transformation, attenuation or dissipation between the wave source area and the shoreline. In sheltered waters, this shall include a summary of fetch determination, winds (speeds, directions, and duration), and bathymetry used in hindcasts. The documentation shall include the approximations or assumptions used in the analysis. When observational data, such as wave buoy data, are available, the wave height, period, and spectral parameters should be compared to the predicted waves.
The Mapping Partner shall document the WHAFIS analysis assumptions, methods, input data, and results. This shall include documentation of any field observations or measurements, as well as available historical or anecdotal information regarding overland wave propagation during flooding events.
See Subsection D.2.12 for additional documentation considerations.
• “Interpolation lineaborted, re-asinterpolated value falls below the ground elevation, insert additional cards to better model the area and set the SWEL equal to the ground elevation where appropriate. Insert AS cards as necessary.
• “**** Unreasonable high ground elevation at station ____ which is ____ card. This transect is aborted, continued to next transect. **** Double check the surge and ground elevations in the vicinity of this station. If the ground elevations are correct, either assign a higher surge elevation or use AS cards.” Add additional input data as necessary to better define the ground elevation and surge elevation in this area.
D
D.2.7-23 Section D.2.7 All policy and standards in this document have been superseded by the FEMA Policy for Flood Risk Analysis and Mapping.
However, the document contains useful guidance to support implementation of the new standards.