d4.2 software adaptation and testing reports · basic command-line qcg-broker client (called...
TRANSCRIPT

MAPPER - 261507 - FP7/2007-2013
Project acronym: MAPPER
Project full title: Multiscale Applications on European e-Infrastructures.
Grant agreement no.: 261507
D4.2 Software Adaptation and Testing
Reports
Due-Date: Month 18Delivery: Month 18Lead Partner: UCLDissemination Level: PublicStatus: Living, first releaseApproved: Q Board, Project Steering
GroupVersion: 0.5
MAPPER – 261507
DOCUMENT INFO
Date and version number Author Comments12.03.2012 v0.1 D. Groen, M. Mamonski, K.
Rycerz, E. Ciepiela
First port from wiki pages.
15.03.2012 v0.2 D. Groen, J. Borgdorff, S.
Zasada, C. Bona-Casas
Added ISR3D and AHE
content, fine-tuned the main
document.17.03.2012 v0.3 D. Groen, C. Bona-Casas Updated ISR3D content.
Modified the writing style.18.03.2012 v0.4 D. Groen Bolstering the main body +
reformatting the
appendices.23.03.2012 v0.5 D. Groen Incorporating feedback from
internal reviewers.
D4.2 Software adaptation-UCL-v0.5 Page 2 of 67

MAPPER – 261507
D4.2 Software adaptation-UCL-v0.5 Page 3 of 67

MAPPER – 261507
TABLE OF CONTENTS
1 Executive summary .............................................................................................................. 6
2 Contributors .......................................................................................................................... 6
3 Main body of the report ....................................................................................................... 7
3.1 Software adaptation report ............................................................................................ 7
3.2 Software testing report ................................................................................................ 16
4 Conclusions ....................................................................................................................... 24
5 Appendix A: Detailed software adaptation report ................................................................ 24
5.1 Application-driven adaptation of QosCosGrid ............................................................. 24
5.2 Application-driven adaptation of GridSpace ................................................................. 28
5.3 Application-driven adaptation of MUSCLE ................................................................... 29
5.4 Application-driven adaptation of AHE .......................................................................... 30
5.5 Cross-tool integration efforts in QosCosGrid ............................................................... 31
5.6 Cross-tool integration efforts in GridSpace .................................................................. 32
5.7 Cross-tool integration efforts in MUSCLE .................................................................... 38
5.8 Cross-tool integration efforts in AHE ........................................................................... 38
6 Appendix B: Detailed software testing report ...................................................................... 39
6.1 ISR3D .......................................................................................................................... 39
6.2 Nanomaterials ............................................................................................................. 41
6.3 QosCosGrid ................................................................................................................. 43
6.4 GridSpace ................................................................................................................... 49
6.5 MUSCLE ..................................................................................................................... 55
6.6 Application Hosting Environment ................................................................................. 60
7 References ......................................................................................................................... 67
LIST OF FIGURES AND TABLES
Figure 1: Contact information exchange between QCG and MUSCLE....................................7
Figure 2: Screenshot of the QCG reservation portal................................................................9
Figure 3: Overview of a distributed coupled application using MUSCLE and the MTO..........11
Figure 4: GridSpace and AHE integration high level architecture..........................................14
Figure 5: Overview of a single-site execution of a MUSCLE application by GridSpace using
PBS and Drb.........................................................................................................................15
Figure 6: Palabos performance measurements on Huygens.................................................17
D4.2 Software adaptation-UCL-v0.5 Page 4 of 67

MAPPER – 261507
Figure 7: Performance measurements of the Smooth Muscle Cell simulations (excluding
tissue growth)........................................................................................................................18
Figure 8: LAMMPS benchmark results on Huygens (atomistic).............................................19
Figure 9: LAMMPS benchmark results on Huygens (course-grained)...................................20
Figure 10: Network transfer timing measurements of MUSCLE across a range of networks.25
Figure 11: Mean time taken to complete a range of tasks with each tool..............................27
Figure 12: Comparison of the percentage of users who were satisfied with a tool and the
percentage who could successfully use that tool. .................................................................27
Table 1: The average submit time of a single job. (a) indicates a test performed after the
restart of the machine, caused by malfunctioning of the LUSTRE filesystem. (b) indicates
executions that did not succeed. ..........................................................................................21
Table 2: The average time of a query about a job status. (b) indicates executions that did not
succeed. ...............................................................................................................................21
Table 3: Summary of statistics collected during usability trials for each tool under
comparison. ..........................................................................................................................26
D4.2 Software adaptation-UCL-v0.5 Page 5 of 67

MAPPER – 261507
1 Executive summaryIn this deliverable, which is part of our effort of adapting existing services (WP4), we report
on our software adaptation work and present a range of tests that we have designed and run.
This deliverable is a living document, which is periodically updated on the MAPPER wiki. The
main document is a summarized and redacted version of the current wiki pages, while we
provide the full Wiki content in Appendix A and B. Up to this point we provide accurate
adaptation and testing reports for the four main software services within MAPPER
(QosCosGrid (QCG), GridSpace, MUSCLE and AHE). Additionally, we present benchmarks
of the two applications (in-stent restenosis and nanomaterials) that we demonstrated during
the first review in Appendix B.
Since the start of MAPPER we have made a wide range of adaptations to integrate the four
main MAPPER services. For example, AHE now supports QCG-based advance reservations
while all of the MAPPER tools can conveniently be composed, launched and deployed from
the GridSpace environment. In the testing reports we describe our approach to testing our
component, provide a range of performance tests, and present usability surveys for the two
tools that are most exposed to the user (AHE and GridSpace). Based on our performance
comparisons, we find that QCG, aside from providing new functionalities, performs
considerably better in many use cases than existing production middleware solutions. The
surveys of AHE and GridSpace confirm that these tools provide measurable added value,
and provide valuable pointers to further improve these tools. Although we provide a few
performance tests of two MAPPER applications in Appendix B, a full performance
assessment of the applications will be provided as part of Task 7.3.
Future versions of this deliverable will likely contain updates of the existing reports, as well
as added reports for major infrastructure components that we are planning to adopt in the
near future.
2 ContributorsThe main contributors of this deliverable are UCL, UvA, PSNC and Cyfronet. UCL is in
charge of the deliverable, and have provided the reports on AHE and the nanomaterials
application. The UvA has composed the report on the in-stent restenosis , and they also
worked on the reports on MUSCLE together with PSNC. PSNC in turn has provided the
D4.2 Software adaptation-UCL-v0.5 Page 6 of 67

MAPPER – 261507
reports on the QosCosGrid environment while Cyfronet has provided the reports on
GridSpace.
3 Main body of the report We present our experiences on software adaptation in section 3.1, and present our software
testing approach and results in section 3.2.
3.1 Software adaptation report
3.1.1 Application-driven adaptation of QosCosGrid
The adaption of the QosCosGrid stack was driven by the loosely-coupled and tightly-coupled
pilot MAPPER scenarios, which are comprehensively described in the Deliverable D5.2. The
first scenario implied the adaptation of QosCosGrid stack to the MUSCLE environment, while
the second one requested from the QCG-Broker to implement the Advance Reservation
management interface. All those efforts are described in the next sections.
3.1.1.1 Adaptation for MUSCLE environment
In most parallel toolkits used within single cluster environments the master process spawns
the worker processes using either SSH or local queuing/batch system native interfaces. This
makes the task of exchanging contact information (e.g. listening host and port) between
master and workers relatively easy as the master process is always initialized before the
slave processes. With a co-allocated application this is an issue as master and workers are
started independently. In the QCG stack we solved this problem by introducing the QCG-
Coordinator service. The service implements two general operations: PutProcessEntry and
GetProcessEntry. The master process provides contact information using the
PutProcessEntry method, while the slave processes acquire this information using the
blocking GetProcessEntry method. This relaxes the requirement that the kernels must be
started in some particular order. The whole process of exchanging contact information is
shown in Figure 1.
D4.2 Software adaptation-UCL-v0.5 Page 7 of 67

MAPPER – 261507
Figure 1: Contact information exchange between QCG and MUSCLE
3.1.1.2 Advance Reservation Interface
Based on the requirements of the Loosely Coupled Multiscale Application (nanomaterials)
and needs of the other MAPPER tools (GridSpace and Application Hosting Environment) the
QosCosGrid stack was extended with the functionality of reserving computing resources by
the users. This functionality has been added to the global service QCG-Broker, which for this
purpose exploits the capabilities offered currently by the QCG-Computing services - a
domain level component which provides remote access to the resources managed by
queuing systems. The advance reservation of resources has been previously successfully
used in the process of co-allocating MAPPER tightly coupled parallel applications across
many, heterogeneous, distributed resources. For tightly coupled applications reservations
are established by the system for the duration of a single job and automatically deleted upon
its completion. For advance reservations created using the newly implemented functionality
reservations are fully controlled by individual users.
Reserved resources can be later used as the containers for jobs submitted by users. QCG-
Broker, in the job submission interface, accepts reservation identifiers in the two forms:
global and local. The second type of identifier may be used when submitting jobs using third-
party services (e.g. UNICORE in case of a tightly coupled application in MAPPER).
The functionality of creating and managing of advance reservations has been added to the
basic command-line QCG-Broker client (called QCG-Client) that offers users an access to
the functionality provided by the QosCosGrid infrastructure. In addition we have developed a
graphical user interface to further support the MAPPER users. We describe this portal in the
next section.
D4.2 Software adaptation-UCL-v0.5 Page 8 of 67

MAPPER – 261507
3.1.1.3 Reservation Portal
The graphical user interface (GUI) is one solution to help a user to work in a complex
computing environment. We developed a web-based graphical client for managing
reservations via QosCosGrid. We chose a web interface because its intuitive to the user and
has neglishible system requirements (users need only a reasonably up-to-date web
browser). The QCG-Broker client, which has already been integrated with Vine Toolkit
(http://vinetoolkit.org),has been extended in order to give users the ability to request new
advance reservations and listing all already granted reservations. A screenshot of the
Reservation Portal is shown in Figure 2.
Figure 2: Screenshot of the QCG reservation portal
3.1.2 Application-driven adaptation of GridSpace
GridSpace was adapted according to multiscale application requirements gathered from the
start of the project and described in D 4.1, D 8.1 and D7.1. As one of the goals of the
MAPPER project is to propose a common Multiscale Modelling Language for description of
multiscale applications structure, it was decided to base our tools on that language. This
included:
• Developing new tools that support MML. The design of the tools was described in D
8.1 and their first prototype can be found in D 8.2. The tools present in a current
prototype include Mapper Memory (MaMe) that registers submodules of multiscale
applications and the relevant scale information etc. MaMe includes also MML
D4.2 Software adaptation-UCL-v0.5 Page 9 of 67
MAPPER – 261507
repository. The other new tool is Multiscale Application Designer (MAD) for
composing submodules into multiscale applications. The tools were developed from
stratch according to application requirements.
• Adapting GridSpace to be compatible with the new MML-based tools. This includes:
• introducing new, infrastructure independent format of GridSpace executable
experiment that can be produced from MML and additional information stored
in MaMe.
• introducing, designing and developing an interpreter-executor model of
execution in Gridspace:
• Interpreter is a software package available in the infrastructure, e.g.:
Multiscale Coupling Library and Environment (MUSCLE) or Large-
Scale Atomic/Molecular Massively Parallel Simulator (LAMMPS)
• Executor is a common entity of hosts, clusters, grid brokers, etc.
capable of running software that is already installed (represented as
Interpreters). Examples are Application Hosting Environement (AHE) or
QCG Broker
More information about inspector executor model can be found in Deliverable 8.2.
3.1.3 Application-driven adaptation of MUSCLE
MUSCLE is generally well accepted by teams that use Java for their submodels. However,
MUSCLE did not support the use of MPI in its submodels, which was required for the Fusion,
ISR3D, and canals applications. Technically, this is caused by the incompatibility between
Java threads, which the submodels use, and MPI. Consequently, whenever someone
needed MPI, they had to have the submodel start an external executable that used MPI. We
adapted MUSCLE such that using MPI is now possible without the need to start executables
from the submodels. Technically, when using MPI, submodels are no longer run using
threads, removing the incompatibility. This change does mean that, if MPI is used, only one
submodel may be run in a MUSCLE instance. This change is now being implemented in the
respective applications, as it requires small changes in the application code.
Another limitation of MUSCLE was that it needed direct TCP/IP connections between the
different submodels. Since high-performance machines generally have restrictive firewall
settings which render direct connections impossible. We solved this problem by developing
the user-space MUSCLE Transport Overlay (MTO) daemon. MTO runs on the interactive
nodes of high-performance machines and relays all communication between MUSCLE
submodels. This way, submodels do not communicate directly, but by help of MTO. Using
the MTO is not the default, so MUSCLE still runs the same way it did before on local clusters
D4.2 Software adaptation-UCL-v0.5 Page 10 of 67

MAPPER – 261507
or computers. We present a usage example of the MTO in Figure 3. Applications do not have
to adapt their code to use MTO, they only need to use the command-line flag
--intercluster which enables the use of MTO.
Figure 3: Overview of a distributed coupled application using MUSCLE and the MTO.
3.1.4 Application-driven adaptation of AHE
The point of the MAPPER infrastructure is to enable the development, deployment and
routine use of multiscale applications, and in that sense, all modifications made to the AHE
within the scope of the MAPPER project are application driven. However, the modifications
and updates that have been made to the AHE within the MAPPER project are covered in two
sections. Below are described the modifications that have been made specifically to support
application scenarios, and in the next section changes which have been made to facilitate
communication between AHE and other tools within the MAPPER infrastructure.
3.1.4.1 Application Deployment
AHE employs the community model user workflow: expert users configure AHE with their
domain knowledge concerning the grid platform being used, as well as details of the
application to be executed. Once this process is complete, the expert user can share the
AHE web service with the user, allowing them to perform their scientific investigations. As
such, the codes which constitute the loosely coupled application scenario developed by
MAPPER in the first year were deployed on target computational resources from UCL, PL-
Grid and PRACE, and then AHE was configured to execute them. This configuration involved
pointing the AHE server used by MAPPER project to submit to the QCG BES services on the
target sites (described in the next section) and updating AHE application registry with details
of the applications to execute.
D4.2 Software adaptation-UCL-v0.5 Page 11 of 67

MAPPER – 261507
Rather than execute an application code directly, AHE wrappers were created which
launched the codes in questions and took care of the pre and post processing stages. AHE
client was extended with application parsers specific to each application wrapper, designed
to automate the staging of input and output data. In addition, AHE client was modified to
allow AHE to stage files that are located on a GridFTP server, as well as data from the user's
local machine.
3.1.4.2 AHE 3.0
In response to the need to create more flexible simulation workflows in AHE, we have been
engaged in reimplementing AHE in Java. AHE 3.0 adds additional features including a
workflow engine, a RESTful web service interface, a Hibernate Object Relational Mapping
framework and additional enhancements to usability and reliability. The RESTful web service
interface of AHE 3.0 allows the AHE server to expose its functionalities via simple operations
on URIs. AHE 3.0 also incorporates a new workflow engine using JBoss’s JBPM workflow
engine. This allows AHE to model persistent user workflows and provides an easier
mechanism to introduce more complex workflows in the future, such as error recovery, or
implement additional functionalities such as SPRUCE urgent computing functionalities into
AHE. With the re-implementation complete, we expect AHE3.0 to be deployed for use by
MAPPER in the second year of the project, leading to greater reliability and better
performance.
3.1.5 Cross-tool integration efforts in QosCosGrid
The main integration effort within the first year of MAPPER in the context of the QosCosGrid
middleware stack was to enable the support for submitting and monitoring jobs via the
UNICORE Atomic Services (UAS, http://www.unicore.eu). The motivation for this integration
is that the UNICORE services are deployed on all PRACE sites, especially the SARA
Huygens system - a machine used for the demonstration during the first MAPPER Review.
QCG-Broker is a grid meta-scheduler and co-allocation service capable of submitting and
managing of multi-scale jobs based on the advance reservation mechanism. To run a singe
job, QCG-Broker communicates with the services providing access to the local
queuing/batch systems. QCG-Broker was already also able to submit jobs via the QCG-
Computing and Globus (v2.0, v4.0) services.
3.1.5.1 The UNICORE Application Programming Interface
To integrate with the UNICORE stack we exploited the Java interface of the Unicore Atomic
Services (UAS) library (version 1.4.1). The API offers interfaces for communication with all
D4.2 Software adaptation-UCL-v0.5 Page 12 of 67

MAPPER – 261507
services being a part of the UNICORE middleware, including: Target System Factory (TSF),
Target Service System (TSS), Storage Management Service (SMS) and Registry Service.
3.1.5.2 Authorization and Authentication
UAS client library exploits "KeyStore" files to store both certificates/private keys and also
Certificate Authority certificates. Because the QCG-Broker system by default stores proxy
certificates delegated by user in the database, the integration with UNICORE implied
implementation of an additional keystore based mechanism. In the provided by QCG-Broker
solution all user certificates are stored in a single KeyStore file protected by randomly
generated passwords.
3.1.5.3 The Job Description
The UNICORE system, similar to the QCG-Computing service, accepts jobs in the
standardized JSDL job description format. The Executable, ApplicationName, Arguments,
Environment elements are set according to the HPC-BasicProfile specification. Other job
artifacts that are not covered by the JSDL standard, such as the identifier for the reservation
or the earliest job start, are transmitted via the native extensions of UNICORE system.
3.1.5.4 Monitoring of Job Statuses
Because the UNICORE Atomic Services does not support notifications of job status changes
(as opposed to the QCG-Computing service) the PULL mechanism has to be exploited.
Thus, in order to monitor UNICORE jobs we used built-in module of QCG-Broker:
"PollingManager". This module polls periodically (with the predefined time interval) about all
unfinished jobs submitted to the target UNICORE system.
3.1.6 Cross-tool integration efforts in GridSpace
3.1.6.1 Introduction
We have adapted GridSpace to the MAPPER application requirements by introducing the
Inspector-Executor model of execution, according to the following approach:
• We have developed a separate GridSpace Executor for each of the tool that gives
access to available resources (QCG-Broker, AHE, SSH).
• We installed a GS interpreter for each software program used by MAPPER
applications (e.g. MUSCLE or LAMMPS). For example, this allows MUSCLE to be run
using QCG or SSH resources.
D4.2 Software adaptation-UCL-v0.5 Page 13 of 67

MAPPER – 261507
3.1.6.2 GridSpace Executor concept
GridSpace facilitates entities called executors for running scripts on remote machines. An
executor is an interface that is used for accessing computational resources such as single
node, job queue, web service etc. Each concrete implementation is programmed in Java so
that it can be easily embedded in GridSpace application. It is also possible to call external
programs when needed. More information on the Executor concept can be found in
Appendix A.
3.1.6.3 Running MUSCLE from GridSpace on QCG resources
GridSpace, along with the Mapper Memory Registry (MaMe) and the Multiscale Application
Designer (MAD), allows the ad-hoc composition of multiscale applications using building
blocks of multiscale modelling language (MML) entities that are registered and made
available for application designers. For example, MML submodules and mappers can be
implemented as MUSCLE kernels. MaMe, MAD and GridSpace are able to generate
MUSCLE applications as a GridSpace experiment. We also created a generic mapping of
GridSpace experiments to corresponding QCG JobProfiles to enable the execution of
MUSCLE applications through QCG.
3.1.6.4 GridSpace Executor for the Application Hosting Environment (AHE)
This implementation, which is under development, uses a modified AHE Client written in
Java for authentication and job execution. This modified client is easily embeddable in other
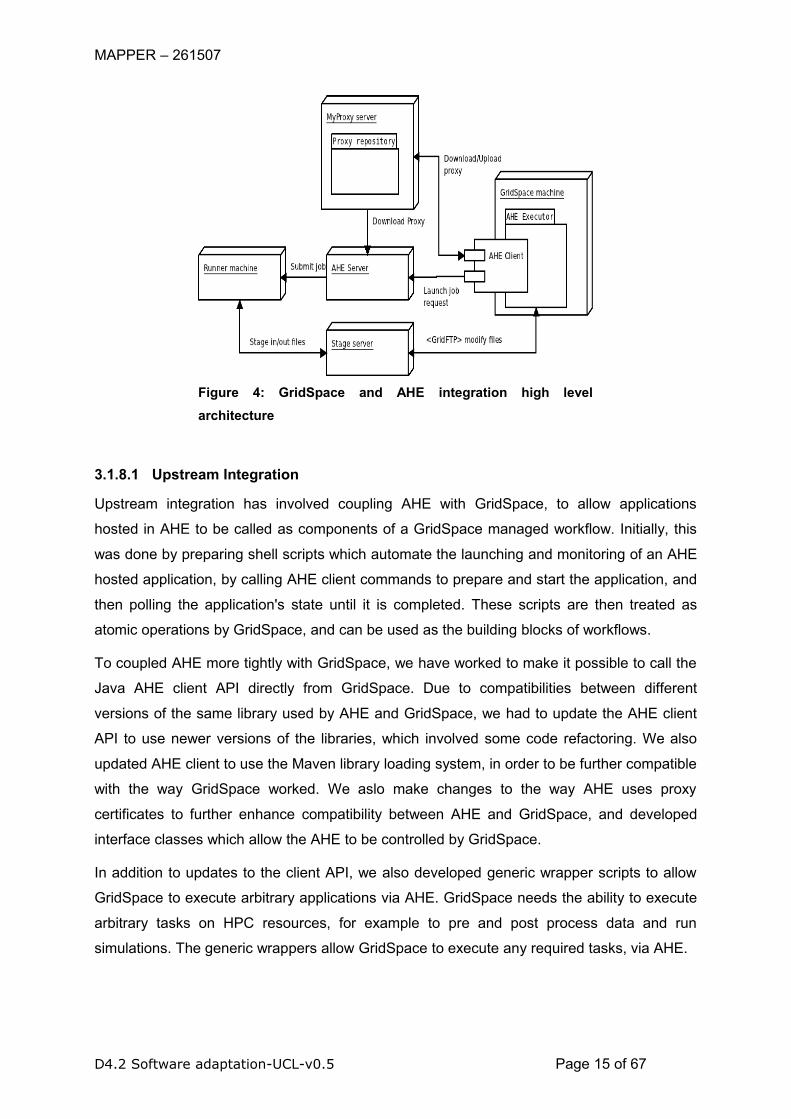
Java applications. The architecture of the GridSpace-AHE integration is shown in Figure 4.
The AHE Executor on the GridSpace server communicates with a MyProxy server through
the AHE Client and with a Stage server through the GridFTP client. The runner machine
stages input from and output to the Stage server.
3.1.7 Cross-tool integration efforts in MUSCLE
As MUSCLE is meant as a low-level tool, to implement multiscale models in, no changes to
MUSCLE have been made to enhance cross-tool integration. However, both QCG-Broker
and Gridspace have been adapted for MUSCLE, which is listed in the respective paragraphs.
3.1.8 Cross-tool integration efforts in AHE
Integration between AHE and other tools in the MAPPER infrastructure happens in two
directions: higher level tools are coupled to AHE to act as clients, and AHE is coupled to
lower level tools, to facilitate submission. These two integration types are classified as
upstream integration and downstream integration respectively, and are discussed in the
sections below.
D4.2 Software adaptation-UCL-v0.5 Page 14 of 67
MAPPER – 261507
Figure 4: GridSpace and AHE integration high level architecture
3.1.8.1 Upstream Integration
Upstream integration has involved coupling AHE with GridSpace, to allow applications
hosted in AHE to be called as components of a GridSpace managed workflow. Initially, this
was done by preparing shell scripts which automate the launching and monitoring of an AHE
hosted application, by calling AHE client commands to prepare and start the application, and
then polling the application's state until it is completed. These scripts are then treated as
atomic operations by GridSpace, and can be used as the building blocks of workflows.
To coupled AHE more tightly with GridSpace, we have worked to make it possible to call the
Java AHE client API directly from GridSpace. Due to compatibilities between different
versions of the same library used by AHE and GridSpace, we had to update the AHE client
API to use newer versions of the libraries, which involved some code refactoring. We also
updated AHE client to use the Maven library loading system, in order to be further compatible
with the way GridSpace worked. We aslo make changes to the way AHE uses proxy
certificates to further enhance compatibility between AHE and GridSpace, and developed
interface classes which allow the AHE to be controlled by GridSpace.
In addition to updates to the client API, we also developed generic wrapper scripts to allow
GridSpace to execute arbitrary applications via AHE. GridSpace needs the ability to execute
arbitrary tasks on HPC resources, for example to pre and post process data and run
simulations. The generic wrappers allow GridSpace to execute any required tasks, via AHE.
D4.2 Software adaptation-UCL-v0.5 Page 15 of 67
MAPPER – 261507
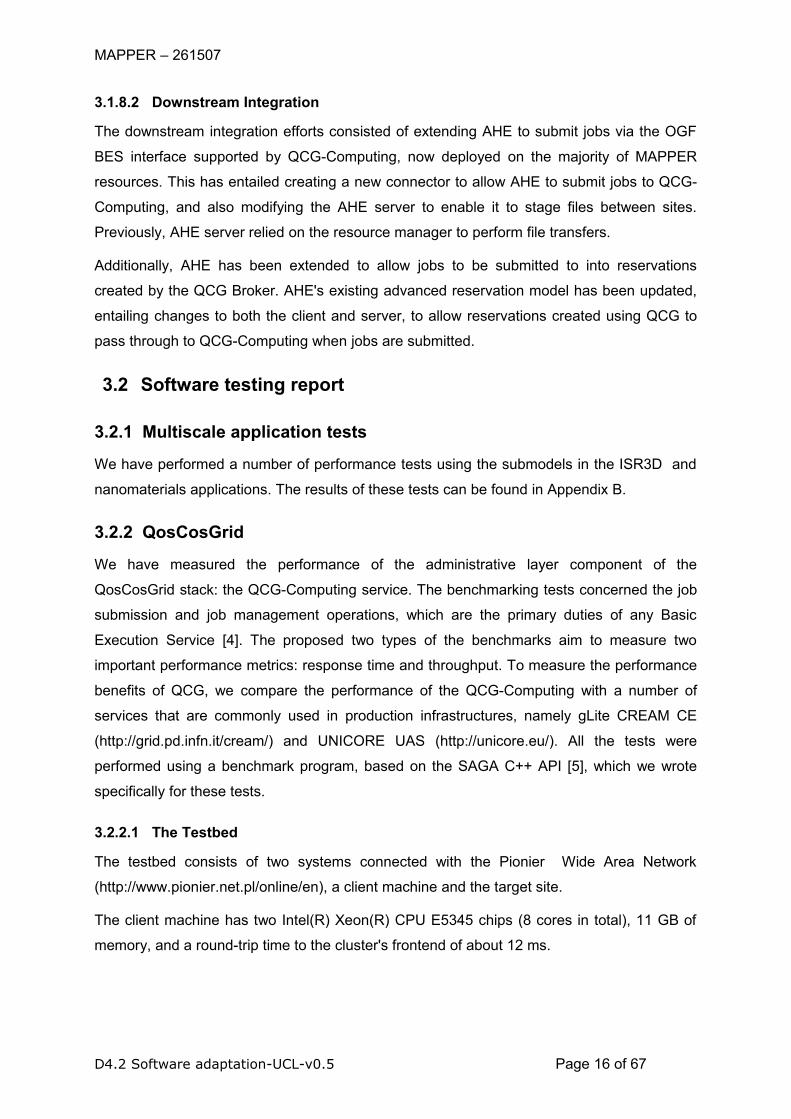
3.1.8.2 Downstream Integration
The downstream integration efforts consisted of extending AHE to submit jobs via the OGF
BES interface supported by QCG-Computing, now deployed on the majority of MAPPER
resources. This has entailed creating a new connector to allow AHE to submit jobs to QCG-
Computing, and also modifying the AHE server to enable it to stage files between sites.
Previously, AHE server relied on the resource manager to perform file transfers.
Additionally, AHE has been extended to allow jobs to be submitted to into reservations
created by the QCG Broker. AHE's existing advanced reservation model has been updated,
entailing changes to both the client and server, to allow reservations created using QCG to
pass through to QCG-Computing when jobs are submitted.
3.2 Software testing report
3.2.1 Multiscale application tests
We have performed a number of performance tests using the submodels in the ISR3D and
nanomaterials applications. The results of these tests can be found in Appendix B.
3.2.2 QosCosGrid
We have measured the performance of the administrative layer component of the
QosCosGrid stack: the QCG-Computing service. The benchmarking tests concerned the job
submission and job management operations, which are the primary duties of any Basic
Execution Service [4]. The proposed two types of the benchmarks aim to measure two
important performance metrics: response time and throughput. To measure the performance
benefits of QCG, we compare the performance of the QCG-Computing with a number of
services that are commonly used in production infrastructures, namely gLite CREAM CE
(http://grid.pd.infn.it/cream/) and UNICORE UAS (http://unicore.eu/). All the tests were
performed using a benchmark program, based on the SAGA C++ API [5], which we wrote
specifically for these tests.
3.2.2.1 The Testbed
The testbed consists of two systems connected with the Pionier Wide Area Network
(http://www.pionier.net.pl/online/en), a client machine and the target site.
The client machine has two Intel(R) Xeon(R) CPU E5345 chips (8 cores in total), 11 GB of
memory, and a round-trip time to the cluster's frontend of about 12 ms.
D4.2 Software adaptation-UCL-v0.5 Page 16 of 67

MAPPER – 261507
The target site was a the Zeus cluster in Krakow, which is part of the Polish NGI, which has
about 800 nodes, ~3.000-4.000 jobs present in the system, has a scheduler poll interval of
3.5 minutes
For the purpose of the tests a subset of 8 nodes (64 cores) where assigned exclusively for
the 10 user accounts used for a job submission. The benchmarked services were deployed
on separate virtual machines, one of which hosts QCG-Computing and UNICORE on one
virtual core and one of which hosts gLite CREAM on three virtual cores.
3.2.2.2 Benchmark 1 - Response Times
For the first benchmark we developed a program that spawns N processes (each process
can use a different certificate - i.e. act as different user) that invoke the function
sustain_thread. Next, it waits until all the running processes have ended.
Each test is characterized by: maximal number of jobs per user, number of users (concurrent
processes), total number of jobs, test duration and the maximum sleep time between every
successive query_state call. We conducted four test sets for each of the three tested
middlewares, with each of the four tests having the following parameters:
• 50 jobs x 10 users = 500 jobs, 30 minutes, SLEEP_COEF = 10 seconds,
• 100 jobs x 10 users = 1000 jobs, 30 minutes, SLEEP_COEF = 10 seconds,
• 200 jobs x 10 users = 2000 jobs, 30 minutes, SLEEP_COEF = 10 seconds,
• 400 jobs x 10 users = 4000 jobs, 30 minutes, SLEEP_COEF = 10 seconds.
3.2.2.3 Results
Test QCG 2.0 UNICORE UAS gLite CREAM 50 1.43 2.41 8.47 50x10 1.43 2.41 8.47100x10 1.49 1.24 a 8.45200x10 1.99 2.20 8.50400x10 1.96 - b 8.24Table 1: The average submit time of a single job. (a) indicates a test performed after the restart of the machine, caused by malfunctioning of the LUSTRE filesystem. (b) indicates executions that did not succeed.
D4.2 Software adaptation-UCL-v0.5 Page 17 of 67

MAPPER – 261507
Test QCG 2.0 UNICORE gLite 50x10 0.38 2.73 0.20 100x10 0.35 1.61 0.36 200x10 0.63 3.73 0.24400x10 0.47 - b 0.21Table 2: The average time of a query about a job status. (b) indicates executions that did not succeed.
3.2.2.4 Benchmark 2 - Throughput
The test is based on the methodology described in the paper [6]. Similar to the approach
described in the paper we aimed to measure the performance from the user perspective. The
test procedure consisted of two phases:
• submitting sequentially, one after another, N jobs into the target system,
• waiting until all jobs have ended.
The test job was a No OPeration (NOP) task, that finishes immediately after starting. We
measured the time between the submission of the first job and the finish of the last job. We
slightly improved on the test methods used in [6] by submitting the jobs using k
processes/users, by using one client API (SAGA) instead of the command-line clients and
by using a unified production environment.
The test sets were parametrized by the number of concurrent threads (k), whether all
threads used single client certificate or not, and the total number of jobs (N). We present the
detailed results of our throughput tests in Appendix B.
3.2.3 GridSpace
3.2.3.1 Tools Usability Tests
During first MAPPER seasonal school, we have performed usability tests of MaMe, MAD and
GridSpace Experiment Workbench tools based on [7] . After making assignments (available
on http://www.mapper-project.eu/web/guest/mad-mame-ew), the school participants were
asked questions about usability of the system they used. The obtained average SUS score
for the tools was 68 points (for 100 possible; standard deviation was 18) . The average was
calculated from answers from 10 participants.
As the tools are still under the development we have also collected specific remarks that may
help to improve their usability. Based on this feedback, we have proceeded to improve the
interface for parameter management of application submodules. We plan to perform similar
tests during the second MAPPER seasonal school planned in month 30.
D4.2 Software adaptation-UCL-v0.5 Page 18 of 67

MAPPER – 261507
3.2.3.2 GridSpace Continuous integration and testing
The GridSpace project uses continuous integration for building and testing applications to
ensure that developers are constantly notified about any unexpected bugs in the codebase.
The Continuum (http://continuum.apache.org) integration server builds the whole application
every 4 hours. Each build consists of compiling, running unit and integration tests (see
Appendix B for details) and assembling an application to a .jar or .war package. The
Continuum server also deploys the latest version of the Experiment Workbench tool to a
development web application server, enabling manual tests. The integration tests facilitate
keeping the whole application working and detecting errors caused by changes in
communication interfaces with external systems (e.g., QCG and AHE). These tests, together
with the standard unit tests, ensure that existing functionality is maintained during
development. To present the quality of our tests we use metrics called code coverage that
gives a degree to which code have been tested. We present several code coverage
measurements in Appendix B.
3.2.3.3 Performance, reliability and conformance tests of Experiment Workbench (EW)
As the EW is still under development we have yet to perform detailed performance, reliability
and conformance tests. However, we use architecture and design patterns according to
practices that will allow for carrying out such tests during the software evaluation and
optimization phase. We have planned the following performance tests:
• Execute benchmark experiments in parallel through a single EW instance to examine
its throughput and to estimate the hardware resource usage by a single benchmark.
• Open a number of user sessions to the same instance of Experiment Workbench to
investigate the minimal resources footprint that is generated by a single user session.
In addition to that, we carry out reliability tests by monitoring the instances of EW under a
real and an artificially generated load to help identify undesired long-term effects such as
resource leaks.
3.2.3.4 Mapper Memory Registry (MaMe)
The MaMe is a standalone server, which uses its persistence layer in order to provide
storage and publishing capabilities for a range of MAPPER use cases (module registry,
XMML repository). For more details on its internal structure, please consult e.g., Section
8.2.2.3 in D8.1 deliverable.
MaMe utilizes the model-view-controller methodology for its internal architecture and, as
such, need these three elements tested. We have approached to the problem threefold: by
D4.2 Software adaptation-UCL-v0.5 Page 19 of 67

MAPPER – 261507
designing and applying a set of unit testing for model and controller layers, by measuring the
performance of REST publishing element and by testing compatibility of the view layer with
the newest web browsers. We present detailed results on this in Appendix B.
3.2.3.5 Multiscale Application Developer (MAD)
MAD is a web application providing convenient and user-friendly set of tools allowing users
to compose MAPPER applications and export them to executable experiments inside
GridSpace Experiment Engine. MAD relies on external components within the MAPPER
infrastructure which are MaMe - the model registry and Experiment Workbench - the
execution engine. MAD relies on a collection of commonly adopted libraries, which makes
integration stable and require a minimal set of integration tests on the MAD side.
Testing of an interactive user interface is not easily automated. Existing web testing
frameworks (e.g. Selenium) do not support recording of drag-and-drop actions. That is why
the structure of the MAD project follows the MVP principles
(http://code.google.com/webtoolkit/articles/mvp-architecture.html) which let unit-test user
interfaces all the way up to the views. Additionally, the core of the application is abstracted
into a set on controllers and presenters independent of the view engine implementation
(currently GWT with supporting libraries).
3.2.4 MUSCLE
We have performed MUSCLE tests in three different environments, locally on one machine,
across a local network, and across a wide area network. MUSCLE has been tested locally on
a single iMac with an Intel i3 3.2 GHz processor running Mac OS X 10.7.3 to measure
communication library overheads. For the local network test we connected it to a dual core
Intel 2160 1.8 GHz processor running Ubuntu Server on the same network, while for the wide
area test we use MTO between Reef (a PL-Grid resource in Poznan, Poland with 16 Intel
Xeon E5530 cores per node) and Huygens (a PRACE machine in Amsterdam, The
Netherlands; with 64 IBM Power6 cores per node).
The following measurements have been performed by sending messages of different sides
from one submodel to another and back, with details in the paragraphs and tables below.
Note that the average time is in fact the round-trip time (RTT), of one message being sent to
the other submodel and that message returned to the first. We approximate the time for
sending a single message by dividing the time for the double communication by two.
MUSCLE runs within a single instance have very high communication speeds and low
latency, and the runs between two local instances also show acceptable performance, with
less than 2 ms RTT and ~100 MB/s throughput. On a local network we measure a slightly
D4.2 Software adaptation-UCL-v0.5 Page 20 of 67

MAPPER – 261507
higher RTT of 4 ms with ~30 MB/s throughput. Over a link between Reef and Huygens we
measure a RTT of 115 ms, which is roughly three times the ping time, and a throughput
between 7 and 13 MB/sec. The limited wide area performance require further investigation,
and may be caused by the connection configuration rather than the MUSCLE communication
software.
Overall, MUSCLE does not seem to introduce much overhead. Largest factors are whether it
is using sockets or within-process communication, and the high latency effect between
distant supercomputers. We present the detailed results of our performance measurements
in Appendix B.
Figure 5: Network transfer timing measurements of MUSCLE across a range of networks
3.2.5 Application Hosting Environment
AHE is designed to simplify user experience, and as such benchmarking of the tool has
involved conducting usability studies to compare AHE to other similar tools.
3.2.5.1 Usability Study Methodology
Here we provide a brief overview of the usability study we have performed for AHE. Further
details can be found in Appendix B. We compare the AHE with both Globus and UNICORE
in a variety of studies, which both are commonly used in production systems. We do this
comparison to assess to what extent AHE provides added value and improved usability over
the existing software in production infrastructures. Our usability study was split into two
D4.2 Software adaptation-UCL-v0.5 Page 21 of 67

MAPPER – 261507
sections. In the first section participants were asked to compare Globus, UNICORE and AHE
by performing three separate tasks:
• Launch an application on a grid resource using the middleware tool being tested. The
application in question (pre-installed on the grid resource) sorted a list of words into
alphabetical order. The user had to upload the input data from their local machine and
then submit the application to the machine.
• Monitor the application launched in step 1 until complete.
• Download the output of the application back to the local machine once it has
completed.
The second section compared the use of X.509 certificates to ACD (Audited Credential
Delegation) authentication. In this section, users were asked to perform the following two
tasks:
• Configure the AHE client with to use an X.509 certificate, and then submit a job using
the graphical client.
• Authenticate to AHE using an ACD username and password, and then submit a job
using the graphical client.
All of the tests ran the application on the same server, based locally in the Centre for
Computational Science at University College London, which was used solely for the usability
test. We invited 39 non-expert participants to the perform the usability study. Due to
problems with the delivery platform, the results from six participants have been excluded,
meaning that the results presented have been gathered from 33 participants.
3.2.5.2 Results
Result Globus
Toolkit
AHE
CLI
UNICORE
GUI
AHE
GUI
AHE with
Cert
AHE with
ACDPercentage of successful
users 45.45 75.76 30.30 96.97 66.67 96.97
Percentage of users
satisfied with tool 27.27 53.54 47.47 79.80 51.52 87.88
Percentage of users who
found tool difficult to use 45.45 25.25 26.26 5.05 27.27 0.00
Table 3: Summary of statistics collected during usability trials for each tool under comparison.
Our usability tests show very clear differences between the different tools tested, based on
the usability metrics defined above. Table 3 presents several key measurements from our
findings. The mean times taken to complete the range of tasks with each tool are given in
Figure 8. Participants able to use AHE to run their applications faster than via Globus or
D4.2 Software adaptation-UCL-v0.5 Page 22 of 67

MAPPER – 261507
UNICORE, and AHE with ACD faster than AHE with X.509 certificates. We also measured
user satisfaction with the tools used. In table 3 we have summarized the percentage of
participants who reported being either Satisfied or Very Satisfied with a tool.
3.2.5.3 Discussion of Results
The results presented in the previous section clearly confirm our hypotheses, that the
application interaction model used by the AHE is more usable than the resource interaction
model implemented in the UNICORE and Globus toolkits, with AHE found to be more usable
for each of our defined usability metrics. We believe the reason for this is due to the fact that
AHE hides much of the complexity of launching applications from users, meaning that (a)
there are less things that can go wrong (hence the lower failure rate) and (b) there are less
things for a user to remember when launching an application (hence the higher satisfaction
with and lower perceived difficulty of AHE tools).
Figure 6: Mean time taken to complete a range of tasks with each tool.
4 Conclusions In this deliverable we have reported on our adaptation and testing experiences of the
MAPPER software. We presented a detailed account of the application-driven adaptations of
QCG middleware, GridSpace, MUSCLE and AHE, and described our cross-tool integration
efforts in a separate section. The QosCosGrid advance reservation feature can now be used
from both AHE and GridSpace, while GridSpace has been modified to more conveniently
support tightly- and loosel-coupled multiscale models. Additionally, GridSpace now also
works together with MUSCLE and AHE. A main priority in the adaptation of MUSCLE was
the development of theMUSCLE Transport Overlay, which enables MUSCLE to flexibly and
reliably connect submodels deployed at different locations. The AHE now supports QCG
D4.2 Software adaptation-UCL-v0.5 Page 23 of 67
Figure 7: Comparison of the percentage of users who were satisfied with a tool and the percentage who could successfully use that tool.

MAPPER – 261507
middleware, and has been adapted to allow a tighter and more robust integration with
GridSpace.
We have shown that the two main MAPPER applications presented during the review
maintain a good efficiency when scaled to up to 1024 cores on the Huygens supercomputer.
Additionally, we find that the scaling improves for larger problem sizes. Additionally, we
presented a wide range of performance and usability tests of the main MAPPER
components. Among other things we have shown that the QCG middleware is more
responsive than its direct competitors, and that the AHE with Audited Credential Delegation
is the easiest way for non-expert users to run their applications on remote resources.
MUSCLE delivers reliable and solid performance on local sites, and reasonable performance
across sites. We conclude that some of the performance limitations of MUSCLE across sites
may be caused by the configuration of the underlying network and are working to resolve
this. GridSpace, which is integrated with a large number of other components, features a
wide range of integration, unit and code coverage tests to ensure its proper functioning when
changes are made to the codebase.
In future versions of this living deliverable we aim to include updated and enhanced reports
for the current components, as well as adaptation and testing reports for MAPPER services
that we are planning to adopt.
5 Appendix A: Detailed software adaptation report
5.1 Application-driven adaptation of QosCosGrid The adaption of the QosCosGrid stack was driven by the two pilot MAPPER scenarios:
• Tightly Coupled Application Scenario,
• Loosely Coupled Application Scenario
comprehensively described in the Deliverable D5.2. The first scenario implied the adaptation
of QosCosGrid stack to the MUSCLE environment, while the second one requested from the
QCG-Broker to implement the Advance Reservation management interface. All those efforts
are described in the next sections.
5.1.1 Adaptation for MUSCLE environment
In most parallel toolkits used within single cluster environments the master process spawns
the worker processes either using SSH or LRMS native interfaces. This make the task of
exchanging contact information (e.g. listening host and port) between master and workers
D4.2 Software adaptation-UCL-v0.5 Page 24 of 67

MAPPER – 261507
relatively easy as the master process is always initialized before the slave processes. With a
co-allocated parallel application this is an issue as master and workers are started
independently. In the QosCosGrid stack we solved this problem with a help of external entity:
the QCG-Coordinator service. The service implements two general operations:
PutProcessEntry and GetProcessEntry. The master process provides contact information
using the PutProcessEntry method, while the slave processes acquire this information using
the GetProcessEntry method which blocks until the information is available. This relaxes the
requirement that the kernels must be started in some particular order.
• PutProcessEntry(in: key, in: data) - puts contact information data for a given session
key,
• GetProcessEntry(in: key, out: data) - gets contact information data for a given session
key.
The GetProcessEntry operation is blocking, i.e. it waits until the process data for a given key
is available. This relaxes the requirement that the kernels must be started in some particular
order. The unique session key is generated by QCG-Broker and distributed to all MUSCLE
kernels. The whole process of exchanging contact information is shown in the below figure.
5.1.2 Advance Reservation Interface
Based on the requirements of the Tightly Coupled Multiscale Application (nanomaterials) and
needs of the other MAPPER tools (GridSpace and Application Hosting Environment) the
QosCosGrid stack was extended with the functionality of reserving computing resources by
the users. This functionality has been added to the global service QCG-Broker, which for this
purpose exploits the capabilities offered currently by the QCG-Computing services - an
domain level components which provide remote access to the resources managed by
queuing systems. The Advance Reservation of resources has been previously successfully
used in the process of co-allocating MAPPER tightly coupled parallel applications into many,
D4.2 Software adaptation-UCL-v0.5 Page 25 of 67

MAPPER – 261507
heterogeneous, distributed resources. The essential features that differs both cases is that
for "Tightly Coupled" applications reservations are established by the system for the duration
of a single job and automatically deleted upon its completion. For advance reservation
created using the newly implemented functionality reservations are fully controlled by
individuall users. Users while reserving computing resources have the possibility to express
their preferences providing:
• machine names to be taken into account when filtering applicable systems,
• characteristics and the amount of resources they want to reserve,
• duration of the reservation and the time window within which the reservation should
be granted.
If the user was authorized for reserving resources, that means it had provided a valid
definition of resource requirements and there had been free resources, the system creates a
reservation and returns a globally unique identifier that uniquely identifies the reservation.
For every reservation one can cancel it or query it status, which is composed of the following
information:
• the description of resource requirements,
• the time when the reservation request was sent,
• the time window of the reservation,
• the reservation state and diagnostic message in case of errors.
Moreover the system returns the list of allocations (reservation on single site) created by the
system with information about:
• the name of the cluster where resources have been reserved,
• the total number of reserved slots (cores),
• the local reservation identifier generated by the local batch system,
• the list of reserved worker nodes.
Reserved resources can be later used as the containers for jobs submitted by users. QCG-
Broker, in the job submission interface, accepts reservation identifiers in the two forms:
global and local. The second type of identifier may be used when submitting jobs using third-
party services (e.g. UNICORE in case of MAPPER Tightly Coupled Application Scenario).
The functionality of creating and managing of advance reservations has been added to the
basic command-line QCG-Broker client (called QCG-Client) that offers users an access to
the any functionality provided by the QosCosGrid infrastructure. In addition, for the
convenience of the MAPPER project's users, a graphical user interface, described in the next
section, was developed.
D4.2 Software adaptation-UCL-v0.5 Page 26 of 67

MAPPER – 261507
5.1.3 Reservation Portal
The use of graphical user interface (GUI) is one solution to help an user to work in a complex
computing environment. In order to facilitate use of the functionality offered by the
QosCosGrid services: the advance reservation of resources, we developed a Web-based
graphical client for managing reservations via QosCosGrid. The Web interface was chosen
for its easiness for user and almost no system requirements (the only user's requirement is a
regular Web Browser). The already integrated with Vine Toolkit (http://vinetoolkit.org) the
QCG-Broker client has been extended in order to give an user the possibilities of requesting
a new advance reservation and listing all already granted reservations. From the Web
application it is also possible to cancel the reservation previously created. The portal was
implemented in the Adobe Flash (Flex) technology, thus minimizing the risk of malformed
application layout related to the lack of full compliance of current web browsers with the
standards. The reservation portlet was embedded into the portal that supports
nanotechnology scientific computing http://nano.man.poznan.pl. The screenshot of the
Reservation Portal is presented in the below figure.
D4.2 Software adaptation-UCL-v0.5 Page 27 of 67
MAPPER – 261507
5.2 Application-driven adaptation of GridSpaceGridSpace was adapted according to multiscale application requirements gathered from the
very beginning of the project and described in D 4.1, D 8.1 and D7.1. As one of the goals of
the MAPPER project is to propose a common Multiscale Modelling Language for description
of multiscale applications structure, it was decided to base our tools on that language. This
included:
• developing new tools that support MML. The design of the tools was described in D
8.1 and their first prototype can be found in D 8.2. The tools present in a current
prototype include Mapper Memory (MaMe) that registers submodules of multiscale
applications and the relevant scale information etc. MaMe includes also MML
repository. The other new tool is Multiscale Application Designer (MAD) for
composing submodules into multiscale applications. The tools were developed from
stratch according to application requirements.
• adapting GridSpace to be compatible with the new MML-based tools. This included:
• introducing new, infrastructure independent format of GridSpace executable
experiment that can be produced from MML and additional information stored
in MaMe.
• introducing, designing and development of interpreter-executor model of
execution in Gridspace:
• Interpreter is a software package available in the infrastructure, e.g.:
Multiscale Coupling Library and Environment (MUSCLE) or Large-
Scale Atomic/Molecular Massively Parallel Simulator (LAMMPS)
• Executor is a common entity of hosts, clusters, grid brokers, etc.
capable of running software that is already installed (represented as
Interpreters). Examples are Application Hosting Environement (AHE) or
QCG Broker
More information about inspector executor model can be found in D 8.2. Next section
describes how we have used inspector-executor model in cross-tool integration.
5.3 Application-driven adaptation of MUSCLEBy teams that use Java for their submodels, MUSCLE was generally well accepted.
However, MUSCLE did not support the use of MPI in its submodels, which was required from
at least the Fusion, ISR3D, and canals applications. Technically, this is caused by the
incompatibility between Java threads, which the submodels use, and MPI. Consequently,
whenever someone needed MPI, they had to have the submodel start an external executable
D4.2 Software adaptation-UCL-v0.5 Page 28 of 67

MAPPER – 261507
that used MPI. By adapting MUSCLE, using MPI is now possible within MUSCLE, without the
need to start executables from submodels. Technically, when using MPI, submodels are not
run in a Thread anymore, removing the incompatibility. This change does mean that only one
submodel may be run in a MUSCLE instance, if it wants to use MPI. This change is now
being implemented in the respective applications, as it requires small changes in their code.
Another limitation of MUSCLE, discovered by trying to do distributed multiscale computing on
high-performance machines, was that it needed direct TCP/IP communication between the
different submodels. Since high-performance machines generally have restrictive firewall
settings, this was not possible in this setting. The problem was solved by implementing the
user-space MUSCLE transport overlay daemon (MTO). MTO runs on the interactive nodes of
high-performance machines and relays all communication between MUSCLE submodels.
This way, submodels do not communicate directly, but by help of MTO. Using the MTO is not
the default, so MUSCLE still runs the same way it did before on local clusters or computers.
The use of MTO is graphically displayed in the following figure.
Applications do not have to adapt their code to use MTO, they only need to use the
command-line flag --intercluster which enables the use of MTO.
5.4 Application-driven adaptation of AHEThe point of the MAPPER infrastructure is to enable the development, deployment and
routine use of multiscale applications, and in that sense, all modifications made to the AHE
within the scope of the MAPPER project are application driven. However, the modifications
and updates that have been made to the AHE within the MAPPER project are covered in two
sections. Below are described the modifications that have been made specifically to support
application scenarios, and in the next section changes which have been made to facilitate
communication between AHE and other tools within the MAPPER infrastructure.
D4.2 Software adaptation-UCL-v0.5 Page 29 of 67
MAPPER – 261507
5.4.1 Application Deployment
AHE employs the community model user workflow: expert users configure AHE with their
domain knowledge concerning the grid platform being used, as well as details of the
application to be executed. Once this process is complete, the expert user can share the
AHE web service with the user, allowing them to perform their scientific investigations. As
such, the codes which constitute the loosely coupled application scenario developed by
MAPPER in the first year were deployed on target computational resources from UCL, PL-
Grid and PRACE, and then AHE was configured to execute them. This configuration involved
pointing the AHE server used by MAPPER project to submit to the QCG BES services on the
target sites (described in the next section) and updating AHE application registry with details
of the applications to execute.
Rather than execute an application code directly, AHE wrappers were created which
launched the codes in questions and took care of the pre and post processing stages. AHE
client was extended with application parsers specific to each application wrapper, designed
to automate the staging of input and output data. In addition, AHE client was modified to
allow AHE to stage files that are located on a GridFTP server, as well as data from the user's
local machine.
5.4.2 AHE 3.0
In response to the need to create more flexible simulation workflows in AHE, we have been
engaged in reimplementing AHE in Java. AHE 3.0 adds additional features including a
workflow engine, a RESTful web service interface, a Hibernate Object Relational Mapping
framework and additional enhancements to usability and reliability. The RESTful web service
interface of AHE 3.0 allows the AHE server to expose its functionalities via simple operations
on URIs. AHE 3.0 also incorporates a new workflow engine using JBoss’s JBPM workflow
engine. This allows AHE to model persistent user workflows and provides an easier
mechanism to introduce more complex workflows in the future, such as error recovery, or
implement additional functionalities such as SPRUCE urgent computing functionalities into
AHE. With the re-implementation complete, we expect AHE3.0 to be deployed for use by
MAPPER in the second year of the project, leading to greater reliability and better
performance.
5.5 Cross-tool integration efforts in QosCosGridThe main integration effort within the first year of MAPPER project in the context of the
QosCosGrid middleware stack was to enable the support for submitting and monitoring jobs
via the UNICORE Atomic Services (UAS)[footnote:[http://unicore.eu/].] The
D4.2 Software adaptation-UCL-v0.5 Page 30 of 67

MAPPER – 261507
motivation for this integration was the fact that the UNICORE services are deployed on all
PRACE sites, especially the SARA Huygens system - a machine used for the demonstration
during the first MAPPER Review.
QCG-Broker is a grid meta-scheduler and co-allocation service capable of submitting and
managing of multi-scale jobs basing on the advance reservation mechanism. In order to run
a singe job, QCG-Broker communicates with the services providing an access to the Local
Resource Management Systems (so called batch systems). Before the MAPPER project
QCG-Broker was capable of submitting jobs via the QCG-Computing and Globus (v2.0, v4.0)
services.
5.5.1 The UNICORE Application Programming Interface
To integrate with the UNICORE stack we exploited the Java interface of the Unicore Atomic
Services (UAS) library (version 1.4.1). The API offers interfaces for communication with all
services being a part of the UNICORE middleware, including: Target System Factory (TSF),
Target Service System (TSS), Storage Management Service (SMS) and Registry Service.
5.5.2 Authorization and Authentication
UAS client library exploits "KeyStore" files to store both certificates/private keys and also
Certificate Authority certificates. Because the QCG-Broker system by default stores proxy
certificates delegated by user in the database, the integration with UNICORE implied
implementation of an additional keystore based mechanism. In the provided by QCG-Broker
solution all user certificates are stored in a single KeyStore file protected by randomly
generated passwords.
5.5.3 The Job Description
The UNICORE system, similar to the QCG-Computing service, accepts jobs in the
standardized JSDL job description format. The Executable, ApplicationName, Arguments,
Environment elements are set according to the HPC-BasicProfile specification. Other job
artifacts, that are not covered by the JSDL standard, such as the identifier for the reservation
or the earliest job start, are transmitted via the native extensions of UNICORE system.
5.5.4 Monitoring of Job Statuses
Because the UNICORE Atomic Services does not support notifications of job status changes
(as opposed to the QCG-Computing service) the PULL mechanism has to be exploited.
Thus, in order to monitor UNICORE jobs we used built-in module of QCG-Broker:
"PollingManager". This module polls periodically (with the predefined time interval) about all
unfinished jobs submitted to the target UNICORE system.
D4.2 Software adaptation-UCL-v0.5 Page 31 of 67

MAPPER – 261507
5.6 Cross-tool integration efforts in GridSpace
5.6.1 Introduction
As described in a previous section, we have adapted GridSpace to MAPPER application
requirements by introducing Inspector - Executor model of execution. The integration of
GridSpace with other MAPPER tools we have used following approach.
• For each of the tool that give access to available resources (QCG, AHE, SSH) we
have developed separated GridSpace Executor
• Each software used by MAPPER applications (e.g. MUSCLE or LAMMPS) was
installed as one of GridSpace interpreters. In particular, MUSCLE can currently be run
using QCG or SSH resources.
GridSpace Executor concept
GridSpace facilitates entities called executors for running scripts on remote machines. An
executor is an interface that is used for accessing computational resources such as single
node, job queue, web service etc. Each concrete implementation is programmed in Java so
that it can be easily embedded in GridSpace application. It is also possible to call external
programs when needed.
Every executor provides at least following operations:
• login - starts session with computational resource using credentials passed by
GridSpace user. Currently the credential may be a pair of login and password or a
proxy certificate recognized by remote resource
• execute - executes passed command with given arguments and script code. It also
handles staging in input files and staging out results.
• logout - closes session with computational resource and terminates all connections
opened by login operation
Each executor is associated with a single File Manager. This file manager is an interface for
handling files and directories on remote computational resource. It provides operations for
copying, reading, creating and deleting entries using concrete protocols (such as SCP,
GridFTP, WebDAV). It is also used for staging in and out. Usually a file manager is created
when an exector establishes a session with remote resource (login operation).
D4.2 Software adaptation-UCL-v0.5 Page 32 of 67

MAPPER – 261507
Executor and FileManager interface
The executor abstraction enables GridSpace to communicate with various types of
computational resources with different kinds of protocols. An example is SSH-based
implementation that uses SSH protocol for authentication and executing scripts. It can be
used to access single sites or nodes. In this case the login operation establishes a SSH
session with chosen machine and executing causes a remote command to be invoked using
this connection. It also facilitates SCP protocol client for managing resources on remote
machine.
5.6.2 GridSpace Executor for QCG
GridSpace communicates with QCG resources using dedicated Executor implementation. It
handles standard executor operations as follows:
• login establishes GridFTP session with designated GridFTP server using GSI
authentication. Credential is proxy certificate passed by user through GridSpace web
interface. The GridFTP session is used by a GridFTP file manager associated with
this executor
• execute operation submits a job profile generated by GridSpace. This profile contains
the command, script code and location of input and output files passed as arguments
to this operation.
• logout closes established GridFTP session
As mentioned before this executor uses GridFTP for managing files and directories on
remote resource. All input files are staged in using this protocol before job is submitted and
are staged out right after the job finishes.
D4.2 Software adaptation-UCL-v0.5 Page 33 of 67

MAPPER – 261507
5.6.2.1 Running MUSCLE from GridSpace on QCG resources
Mapper tools, namely GridSpace along with Mapper Memory Registry (MaMe) and
Multiscale Application Designer (MAD), address Mapper concept to allow for ad-hoc
composition of multiscale applications from building blocks of MML entities that are to be
registered and made available for application designers. In particular, MML submodules and
mappers can be implemented as MUSCLE kernels. MaMe, MAD and GridSpace have to
collaborate with each other in order to be able to generate an arbitrary MUSCLE application
in a form of GridSpace experiment. Generic mapping of an arbitrary GridSpace experiments
to corresponding QCG JobProfiles has also to be ensured in order to enable execution of all
existing and potential future MUSCLE applications through QCG.
The problem is to ensure that all jar files being referred to in cxa generated by MAD (lines:
m.add_classpath “...”, and m.add_libpath “...”) are present on the site where MUSCLE kernel
is to be executed. MUSCLE kernels (respective to MML submodels or mappers) depend on
several bundles that need to be in place on target site in the location specified in cxa. In
order to ensure it, collaboration between MaMe, MAD, EW, QCGBroker and QCGComputing
is indispensable.
In MaMe each MUSCLE kernel has assigned bundle names which is a colon-separated list
of bundle names, and individual bundle name is qualified using slashes. MAD generates cxa
code basing on the information from MAD. Cxa, then, contains the lines as follows:
m.add_classpath
“#{ENV'MUSCLE_KERNEL_REPO'}/mykernel/my.jar:#{ENV'MUSCLE_KERNEL_REPO'}/my
kernel/another.jar:#{ENV'MUSCLE_KERNEL_REPO'}/mykernel/classesdir/”
m.add_libpath ”#{ENV'MUSCLE_KERNEL_REPO'}/mykernel/my.so”
Moreover, kernel instance definition in cxa follows the syntax
“<kernel_name>_<unique_instance_number>” e.g.
cxa.add_kernel('mykernel_001', '...')
In Experiment Workbench users can pick QCGExecutor to execute cxa snippet. As QCG
needs additional information from user on how to distribute kernel instances, user must fill in
a form. User specifies the site to be used and for each site a list of kernel instances to be
dpeloyed there, number of cores to be allocated and optionally reservation id. Users can but
don't have to specify site name and reservation id fields. If site name is not specified it's
QCGBroker's role to find suitable sites satisfying number of cores and availability of kernel
bundles. In this case QCGBroker uses information from internal registry or external
Information System to find suitable sites for given kernels. Kernels are identified by their
D4.2 Software adaptation-UCL-v0.5 Page 34 of 67
MAPPER – 261507
names, the same that are used in MaMe. After that, QCGBroker dispatches execution of
kernels to the QCGComputing installed on found site. On the site QCGComputing executes
MUSCLE. Since cxa refers to MUSCLE_KERNEL_REPO environment variable, this has to
be set in prior to execution of MUSCLE. This variable keeps a path to site-local repository of
kernel bundles e.g. /public/muscle_kernels that is configured in QCGBroker or
QCGComputing.
5.6.3 GridSpace Executor for AHE
This implementation is currently under development. It uses modified AHE Client written in
Java for authentication and executing jobs. The modifications were made so that the client is
easily embeddable in other Java applications.
Following list describes planned functioning of operations of this executor. It is unlikely that
any of it will change in the future as all of the design has already been discussed with AHE
authors.
• login - implementation of this operation is almost finished and is in testing phase.
Allows two ways of authentication:
• proxy certificate - when provided, executor will send it to AHE MyProxy server
through AHE Client and bound to temporary user name and password
generated by the executor. This user name and password are later used to
authenticate when submitting job to AHE runner machine.
• user name and password - when provided (and no proxy is present) executor
attempts use them to authenticate with MyProxy and download valid proxy
certificate (that should have been uploaded before using third party client).
In both cases the executor establishes a GridFTP connection with file stage server that the
runner machine will use for staging in/out.
• execute - not fully implemented. It uses modified AHE Client to create and submit
AHE Job Object to AHE runner machine (such as Mavrino). This job objects points to
special AHE application called gslaunch that is designed to execute scripts on behalf
of GridSpace user. When submitted, the AHE Client is set to await mode that
periodically polls the job runner for its status. Whet it is finished the operation returns.
The AHE Client used by this operation does not stage in or out any inputs or outputs
(this is different from behavior of the standalone client). This is because all resources
needed for job execution are managed by GridSpace directly on the stage server and
therefore are already in place.
D4.2 Software adaptation-UCL-v0.5 Page 35 of 67

MAPPER – 261507
• logout - connection to the stage server is closed. If temporary password and user
name where created by login operation they are cleared.
Above picture shows connection between particular elements in GridSpace- AHE integration.
The AHE Executor working on GridSpace machine communicates with MyProxy server
through AHE Client and with Stage server using GridFTP client. The runner machine stages
in/out input from/to the aforementioned stage server.
Master algorithm is as follows:
• Proper number of nodes is allocated through PBS. This is done as one singe
allocation (by using pbsdsh tool)
• The TaskManager is started.
• On each of the assigned nodes a Task process (Slave) is started (via pbsdsh tool)
that connects to TaskManager using DRb.
• As asked by a Task, TaskManager sends request to start the plumber
• As asked by a Task, TaskManager sends requests to start appropriate group of
kernels
• TaskManager prints the received Task's output to the screen.
Slave algorithm is as follows:
• Task connects to Task Manager using DRb and asks it for a job description
• Task receives a job description (request for staring a plumber or the kernels in a
single group)
D4.2 Software adaptation-UCL-v0.5 Page 36 of 67

MAPPER – 261507
• Task redirects the output and error streams to the Task Manager
In a case of SSH accessible resources the computational nodes share filesystem with the
Experiment Host, so the output files are seen immediately by File Browser which is a
standard part of GS Experiment Workbench. The details can be found in (Rycerz-DMC2011).
5.7 Cross-tool integration efforts in MUSCLEAs MUSCLE is meant as a low-level tool, to implement multiscale models in, no changes to
MUSCLE have been made to enhance cross-tool integration. However, both QCG-Broker
and Gridspace have been adapted for MUSCLE, which is listed in the respective paragraphs.
5.8 Cross-tool integration efforts in AHEIntegration between AHE and other tools in the MAPPER infrastructure happens in two
directions: higher level tools are coupled to AHE to act as clients, and AHE is coupled to
lower level tools, to facilitate submission. These two integration types are classified as
upstream integration and downstream integration respectively, and are discussed in the
sections below.
5.8.1 Upstream Integration
Upstream integration has involved coupling AHE with GridSpace, to allow applications
hosted in AHE to be called as components of a GridSpace managed workflow. Initially, this
was done by preparing shell scripts which automate the launching and monitoring of an AHE
hosted application, by calling AHE client commands to prepare and start the application, and
then polling the application's state until it is completed. These scripts are then treated as
atomic operations by GridSpace, and can be used as the building blocks of workflows.
To coupled AHE more tightly with GridSpace, we have worked to make it possible to call the
Java AHE client API directly from GridSpace. Due to compatibilities between different
versions of the same library used by AHE and GridSpace, we had to update the AHE client
API to use newer versions of the libraries, which involved some code refactoring. We also
updated AHE client to use the Maven library loading system, in order to be further compatible
with the way GridSpace worked. We aslo make changes to the way AHE uses proxy
certificates to further enhance compatibility between AHE and GridSpace, and developed
interface classes which allow the AHE to be controlled by GridSpace.
In addition to updates to the client API, we also developed generic wrapper scripts to allow
GridSpace to execute arbitrary applications via AHE. GridSpace needs the ability to execute
D4.2 Software adaptation-UCL-v0.5 Page 37 of 67

MAPPER – 261507
arbitrary tasks on HPC resources, for example to pre and post process data and run
simulations. The generic wrappers allow GridSpace to execute any required tasks, via AHE.
5.8.2 Downstream Integration
The downstream integration efforts have consisted in extending AHE to submit jobs via the
QCG BES interface, now deployed on the majority of MAPPER resources. This has entailed
creating a new connector to allow AHE to submit jobs to QCG-Computing, and also
modifications had to be made to AHE server to enable it to stage files between sites
(previously, AHE server relied on the resource manager to perform file transfers).
Additionally, AHE has been extended to allow jobs to be submitted to into reservations
created by the QCG Broker. AHE's existing advanced reservation model has been updated,
entailing changes to both the client and server, to allow reservations created using QCG to
passed through to QCG-Computing when jobs are submitted.
6 Appendix B: Detailed software testing report
6.1 ISR3DThis page contains a range of performance benchmarks for the subcodes used in the
In-Stent Restenosis application
6.1.1 Palabos benchmarks
We have benchmarked our Palabos implementation of blood flow dynamics on the Huygens
supercomputer at SARA in Amsterdam. This 65TFLOP/s machine is equipped with around
3456 IBM POWER6 processors. We provide the wall-clock time spent to run atomistic
simulations until they converged as a function of the number of processes in the figure
below. The number of steps is the number of steps it took the code to converge for a given
geometry, being the number of particles an indicator of the size of the geometry (length of
the artery) simulated. In each In stent restenosis simulation for porcine arteries there are
approximately 200 geometry changes, therefore the code needs to converge 200 times.
D4.2 Software adaptation-UCL-v0.5 Page 38 of 67

MAPPER – 261507
Scaling was good, specially for a large number of particles.
6.1.2 SMC benchmarks
We have benchmarked our Agent Based Model for Smooth Muscle Cell (SMC) dynamics in a
local machine as the code is not yet parallel. The machine is an iMac with intel i5 processors
at 3.6 GHz. We observe the wall clock time against the number of agents used. The amount
of time it takes the code to complete an iteration is highly dependent on the amount of cells
that grow in that iteration, therefore the benchmarks shown below do not include any growth.
D4.2 Software adaptation-UCL-v0.5 Page 39 of 67
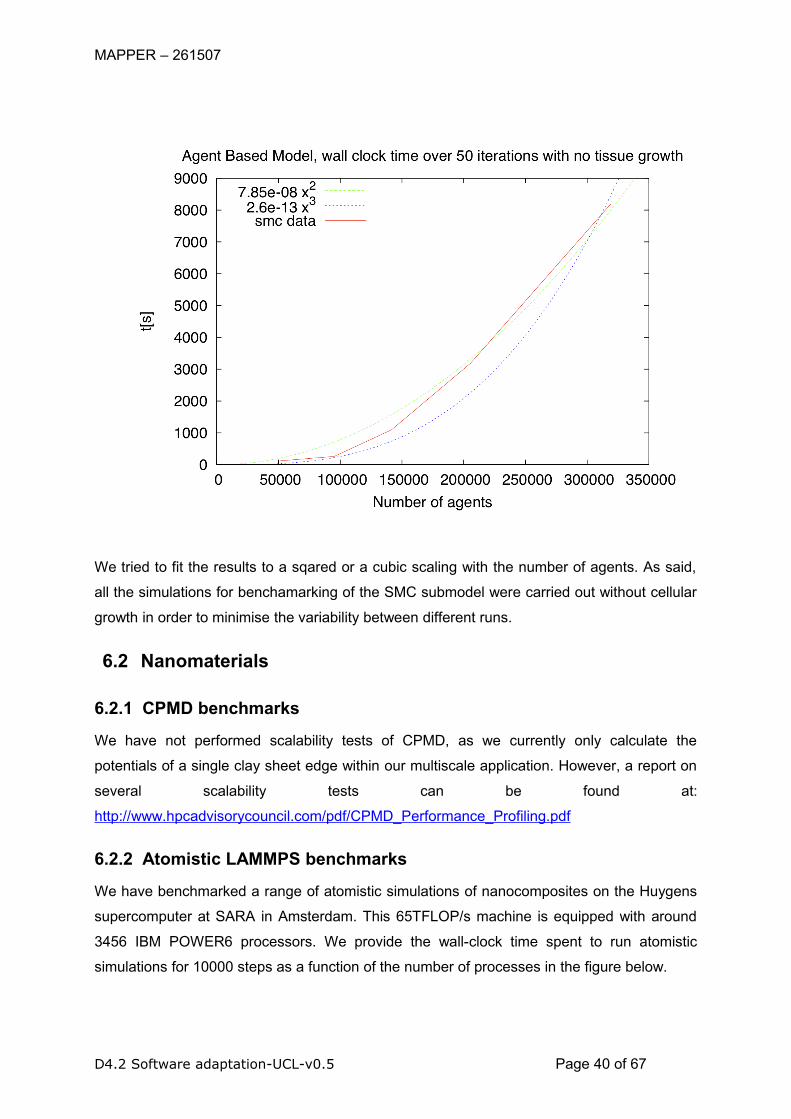
MAPPER – 261507
We tried to fit the results to a sqared or a cubic scaling with the number of agents. As said,
all the simulations for benchamarking of the SMC submodel were carried out without cellular
growth in order to minimise the variability between different runs.
6.2 Nanomaterials
6.2.1 CPMD benchmarks
We have not performed scalability tests of CPMD, as we currently only calculate the
potentials of a single clay sheet edge within our multiscale application. However, a report on
several scalability tests can be found at:
http://www.hpcadvisorycouncil.com/pdf/CPMD_Performance_Profiling.pdf
6.2.2 Atomistic LAMMPS benchmarks
We have benchmarked a range of atomistic simulations of nanocomposites on the Huygens
supercomputer at SARA in Amsterdam. This 65TFLOP/s machine is equipped with around
3456 IBM POWER6 processors. We provide the wall-clock time spent to run atomistic
simulations for 10000 steps as a function of the number of processes in the figure below.
D4.2 Software adaptation-UCL-v0.5 Page 40 of 67

MAPPER – 261507
In our application we use SMT to run 2 processes on a single core. Although this somewhat
worsens the overall scalability in the plot below, it also allows us to save 50% on our
consumption of compute resources. We have enabled SMT in all our tests that use more
than 32 cores. The idealized speedup lines do not take the inefficiency introduced by using
SMT into account.
6.2.3 Course-grained LAMMPS benchmarks
We have benchmarked a range of course-grained simulations of nanocomposites on the
Huygens supercomputer at SARA in Amsterdam. We provide the wall-clock time spent to run
course-grained simulations for 10000 steps as a function of the number of processes in the
figure below.
In our application we use SMT to run 2 processes on a single core. Although this slightly
worsens the overall scalability in the plot below, it also allows us to save 50% on our
consumption of compute resources. We have enabled SMT in all our tests that use more
than 32 cores.
D4.2 Software adaptation-UCL-v0.5 Page 41 of 67

MAPPER – 261507
6.3 QosCosGridWe decided to measure the performance of the administrative layer component of the
QosCosGrid stack: the QCG-Computing service. The benchmarking tests concerned the job
submission and job management operations, which are the primary duties of any Basic
Execution Service. The proposed two types of the benchmarks aim to measure two important
performance metrics: response time and throughput. As nominal values would not provide
qualitative answer to the question: "Is the service performance rewarding?" we decided to
conduct comparison tests where we compared the performance of the QCG-Computing with
similar services: gLite CREAM CE [footnote:[http://grid.pd.infn.it/cream/]]
and UNICORE UAS [footnote:[http://unicore.eu/].] All the tests were performed
using a benchmark program written exclusively for the needs of these tests. The program
was based on the SAGA C++ API SAGA. Especially the two following SAGA adaptors (i.e.
implementations) were exploited:
• glite_cream_job (based on glite-ce-cream-client-api-c) - used to access the gLite
CREAM CE service,
• ogf_hpcbp_job (based on gSOAP) - used to access the OGSA BESBES interfaces of
UNICORE Atomic Services (UAS) and QCG-Computing service.
D4.2 Software adaptation-UCL-v0.5 Page 42 of 67

MAPPER – 261507
The use of the common access layer minimized the risk of obtaining distorted results due to
bottleneck in the client layer. Moreover, for the same reason, we decided to use the same
target resource for all benchmarks and middlewares.
6.3.1 The Testbed
The testbed was composed of two systems, each of them located in separate networks,
connected with Pionier[footnote: [http://www.pionier.net.pl/online/en/]]
Wide Area Network.
6.3.1.1 Client Machine
The client machine was a commodity HPC system. The base paramaters of the test system
were as follows:
• processors: 2 x 4 cores (Intel(R) Xeon(R) CPU E5345),
• physical memory: 11 GB,
• Operating System: Scientific Linux 5.3,
• RTT from the client machine to the cluster's frontend: about 12 ms.
6.3.1.2 Target Resources Provider
The target site was a one of the Polish NGI PL-Grid cluster: Zeus (88. place on TOP500 list
[footnote:www.top500.org/]). This HPC system can be characterized by the following
parameters:
• queueing system: Torque 2.4.12 + Maui 3.3,
• about 800 nodes,
• about 3-4k jobs present in the system,
• scheduler poll interval: 3.5 minutes,
• operating system: Scientific Linux,
For the purpose of the tests a subset of 8 nodes (64 cores) where assigned exclusively for
the 10 user accounts used for a job submission. The benchmarked services were deployed
on separate virtual machines of the following properties:
• Operating System: Scientific Linux 5.5,
• 1 virtual core, 2GB RAM (QCG-Computing and UNICORE)
• 3 virtual cores, 8 GB RAM (gLite CREAM)
D4.2 Software adaptation-UCL-v0.5 Page 43 of 67

MAPPER – 261507
6.3.2 Benchmark 1 - Response Times
For the first benchmark we developed a program that spawns N processes (each process
can use a different certificate - i.e. act as different user) that invoke the function
sustain_thread. Next, it waits until all the running processes have ended.
In general, the idea of the program is to keep in a system jobs_per_thread jobs for
predefined test_duration seconds and polling all the time about the job statuses (the
delays between successive query_state calls drawn from a predefined interval:
SLEEP_COEF).
The following snippet shows a pseudocode of the function `sustain_thread`:
1. start_timer()2. for i = 1 .. jobs_per_thread 2a: submit_job(job[i])3. while (current_time < test_duration) do 3a: for i = 1 .. jobs_per_thread 3a1: if (! is_finished(job[i].last_state)) 3a11: sleep((rand() / RAND_MAX) / SLEEP_COEF) 3a11: query_state(job[i]) 3a2: if (is_finished(job[i].last_state)) 3a21: submit_job(job[i])4. stop_timer()
The function `submit_job(job)`:
1. start_timer()2. job.job = service.create_job()3. job.job.run()4. stop_timer()5. query_state(job)
The function `query_state(job)`:
1. start_timer()2. job.last_state = job.job.get_state()3. stop_timer()
At the end of tests, the average, minimal and maximal times of submitting a job
(submit_job) and querying about a job state (query_state) are printed. Additionally, the
program displays the number of all submitted jobs, the number of successfully finished jobs
D4.2 Software adaptation-UCL-v0.5 Page 44 of 67

MAPPER – 261507
(Done) and the number of the jobs finished with the other status (Canceled, Failed). In the
last case, the number of failures, i.e. exceptions thrown by the SAGA adaptors, is shown.
6.3.2.1 Test Runs
Every test was characterized by: maximal number of jobs per user, number of users
(concurrent processes), total number of jobs, test duration and maximal sleep time between
every successive query_state call. We conducted four test sets, for every of the three
tested middlewares, the paramaters of the tests are listed below:
• 50 jobs x 10 users = 500 jobs, 30 minutes, SLEEP_COEF = 10 seconds,
• 100 jobs x 10 users = 1000 jobs, 30 minutes, SLEEP_COEF = 10 seconds,
• 200 jobs x 10 users = 2000 jobs, 30 minutes, SLEEP_COEF = 10 seconds,
• 400 jobs x 10 users = 4000 jobs, 30 minutes, SLEEP_COEF = 10 seconds.
Results
• The average submit time of a single job
Test QCG 2.0 UNICORE UAS gLite CREAM 50 1.43 2.41 8.47 50x10 1.43 2.41 8.47100x10 1.49 1.24 a 8.45200x10 1.99 2.20 8.50400x10 1.96 - b 8.24
• The average time of a query about a job status.
Test QCG 2.0 UNICORE gLite 50x10 0.38 2.73 0.20 100x10 0.35 1.61 0.36 200x10 0.63 3.73 0.24400x10 0.47 - b 0.21
6.3.3 Benchmark 2 - Throughput
The test is based on the methodology described in the paper BENCH. Similar to the
approach described in the paper we aimed to measure the performance from the user
perspective. The test procedure consisted of two phases:
• submitting sequentially, one after another, N jobs into the target system,
• waiting until all jobs have ended.
The test job was a No OPeration (NOP) task, that finishes immediately after starting. We
measured the time between the submission of the first job and the finish of the last job. Our
improvements in the test methodology, over the aforementioned publication, were:
D4.2 Software adaptation-UCL-v0.5 Page 45 of 67

MAPPER – 261507
• submitting the jobs using k processes/users,
• using one client API (SAGA) instead of the command-line clients,
• single, real production, testbed environment.
6.3.3.1 Test Runs and Results
The test sets were parametrized by the following parameters:
• number of concurrent threads (k),
• whether all threads used single client certificate or not,
• total number of jobs (N).
Altogether we ran 4 test-sets characterized by the following parameters:
• 1 user, 1 thread, 500 jobs,
• 1 user, 10 thread, 500 jobs (50x10),
• 10 users, 10 thread, 500 jobs (50x10),
• 10 users, 10 thread, 1000 jobs (10x100).
The results are presented in the figures below:
D4.2 Software adaptation-UCL-v0.5 Page 46 of 67

MAPPER – 261507
D4.2 Software adaptation-UCL-v0.5 Page 47 of 67

MAPPER – 261507
Unfortunately in the second benmark the bottle-neck was the throughput of the Maui
scheduler and size of the dedicated testbed partition (8 machines), which imposed that only
64 jobs could be scheduled per one scheduling cycle (at least 3.5 minutes).
6.4 GridSpace
6.4.1 Tools Usability Tests
During first MAPPER seasonal school, we have performed usability tests of MaMe, MAD and
GridSpace Experiment Workbench tools based on: John Brooke Usability evaluation in
industry, SUS—a quick and dirty usability scale (CRC Press, Boca Raton, FL), pp 189–194
(1996) . After making assignments (available on http://www.mapper-
project.eu/web/guest/mad-mame-ew), the school participants were asked questions about
usability of the system they used. The obtained average SUS score for the tools was 68
points (for 100 possible; standard deviation was 18) . The average was calculated from
answers from 10 participants.
As the tools are still under the development we have also collected specific remarks that
could potentially help to improve their usability. The request from most of the participants
was to improve interface for parameter management of application submodules. Currently,
we are working the improvements. We also plan to perform similar tests during the second
MAPPER seasonal school planned in M30 of the project.
D4.2 Software adaptation-UCL-v0.5 Page 48 of 67
MAPPER – 261507
6.4.2 GridSpace Continuous integration and testing
The Grid Space project uses continuous integration for building and testing applications. The
Continuum integration server builds whole application every 4 hours. Each build consists of
compiling, running unit and integration tests (see in following sections) and assembling an
application to a package (jar or war). The main goal of this process is to ensure that the
developers are constantly notified about errors in code correctness or functionality so that
they can react appropriately The Continuum server is also responsible for deploying latest
version of Experiment Workbench tool to a development web application server. Thanks to
that the latest development version of the application is automatically available for manual
testing or using.
During the development of GridSpace EW we have written integration and unit tests that
check the correctness and usability of this tool. Both kinds of tests were written in Java using
the Junit library. More detailed description follows.
6.4.2.1 Unit tests
These tests concern single functionality and behavior of piece of Java code (like method).
We ensure maximum isolation of particular tests from other parts of the system using mock
code created with Mockito library. Additionally, we sometimes use unit tests for documenting
a bug found in the code. Such test reproduces programatically the conditions the problem
occurred in and reduces the probability that previously fixed defect will reappear unnoticed.
Because these tests are usually simple and fast to execute they are used to pinpoint the
erroneous code and quickly check functionality being developed.
6.4.2.2 Integration tests
Integration tests first set up a testing environment consisting of a few components and
optionally a connection to external system and invoke some operations on subjects of the
test. The examples are QCG executor component tests which connect to external QCG
server and login to dedicated testing account on the QCG broker. Then the test code invokes
an execute operation and checks whether the operation was successful and the expected
output appeared. This is performed using different configurations of the execution process
and different experiment snippets. Similar tests for integration with AHE are currently being
written together with the main code.
The integration tests facilitate keeping whole application working and detecting errors caused
by changes in communication interfaces with external systems. Much like the unit tests they
also ensure that during the development old functionality is maintained. Howerev, they they
are usually longer and more complex.
D4.2 Software adaptation-UCL-v0.5 Page 49 of 67

MAPPER – 261507
6.4.2.3 Code coverage
To present the quality of our tests we use metrics called code coverage that gives a degree
to which code have been tested. In our case it is evaluated using two criteria:
• number of lines of code invoked during tests to total number of lines of code ( line
coverage)
• number of code branches that get invoked during tests to total number of code
branches (branch coverage)
The following table presents code coverage for each GridSpace Experiment component. All
values are expressed as percentage and where gathered using the Cobertura tool.
Component Name
Component description Line
coverage Branch
coverage #Classes
EW* Experiment workench web
application 8 4 139
core Core utilities and interfaces 45 32 45
executors
definition of interfaces for
integration with external
computational resources
0 0 30
provenance gathering and storing provenance
data49 32 30
experiment basic interfaces and classes for
handling experiment definition47 13 19
ssh-executor
executing experiments using
ordinary SSH connection and
authentication
47 31 22
*-excluding GWT's client packages
When interpreting these results one should keep in mind that the EW component is mainly a
web-based application that provides GUI and uses other components for executing an
experiment. Unit and integration testing is not suitable for such applications and therefore the
code coverage is relatively small in this case.
6.4.2.4 Performance, reliability and conformance tests of Experiment Workbench
As GridSpace2 Experiment Workbench is still in development phase the ultimate
performance, reliability and conformance tests are expected in the future. However, the
architecture and design patterns being applied in the software already follow the good
practices in testing which will allow for carrying out such tests during the software evaluation
and optimization phase.
D4.2 Software adaptation-UCL-v0.5 Page 50 of 67

MAPPER – 261507
Experiment Workbench being a web application inteded to enable pervasive access for the
users using web browsers needs to be examinated in terms of browser compatibility
including all major web browsers according to e.g StatCounter wordwide analysis published
annually. As for 2012 their analysis show that MicroSoft Internet Exporer (29.05%), Google
Chrome (23.22%), Mozilla Firefox (21.76%), Safari (13.49%), Opera (5.2%) are the key
vendors taking almost 92.72% of the market. Experiment Workbnech must be supported by
the most up-to-date version of these browsers and their previous versiosn in order to ensure
both long-term support from these browsers and availability for expected treshod of 75% of
web browser users.
To meet this indicator Experiment Workbench is taking advatage of web frameworks (mostly
Google Web Toolkit) which by design addresses the cross-browser compatibility concern.
Moreover, by applying Model-View-Presenter design pattern the browser-specific layer is
made as thin as possible, thus greater part of the code is web browser-agnostic.
The performance aspect can't be underesimated as it determines scalability of the solution in
terms of resources and costs to be born in order to ensure desired system throughput. The
metrics used to measure the throughput will be:
• A number of benchmark experiments being excuted in parallel through the same
instance of Experiment Workbench with a given amount of hardware resources.
Computational demands of benchmark experiments are irrevelant in this case as they
introduce load on execution backend (grid sites) while capability being examinated is
the throughput of the Experiment Workbench. This will give estimation of hardware
resources usage by a single benchmark experiment run.
• A number of open user sessions to the same instance of Experiment Workbench with
a given amount of hardware resources. This will help investigate the minimal
resources footprint that is generated by a single user session.
Performance tests will be easy to develop owing to the model-view-presenter design pattern
being applied in Experiment Workbench. In conjunction with gwt-syncproxy library they
provide a way for automatic testing of functionallity without a must of running brower-side
user interface.
In addition to that, the reliability tests will be carried out by monitoring the instances of
Experiment Workbench under a real or artificially generated load. This will help identify
longundesired long-term effects e.g. resource leaks.
D4.2 Software adaptation-UCL-v0.5 Page 51 of 67

MAPPER – 261507
6.4.3 Mapper Memory Registry (MaMe)
The Mapper Memory Registry is a standalone server, which uses its persistence layer in
order to provide storage and publishing capabilities for a range of MAPPER use cases
(module registry, XMML repository). For more details on its internal structure, please consult
e.g., Section 8.2.2.3 in D8.1 deliverable.
MaMe utilizes the model-view-controller methodology for its internal architecture and, as
such, need these three elements tested. We have approached to the problem threefold: by
designing and applying a set of unit testing for model and controller layers, by measuring the
performance of REST publishing element and by testing compatibility of the view layer with
the newest web browsers.
Unit testing. The domain model of MaMe (comprising several different entities which are
subject of publishing and sharing inside the registry), its structure, consistency and validity, is
being continuously tested by a set of unit tests. Also, the controller layer, which, apart from
the basic CRUD set of operations, provides more complex capabilities, is being tested with a
separate set of unit tests. Altogether the validity of these two layers are tested by a set of 87
assertions (as of 12.03.2012) and that set grows with any new functionality being added to
MaMe (test-driven development).
MaMe is a standalone server and, as such, does not require any integration testing (or, for
that matter, continuous integration setup). It is, however, advisable, that other tools which
use MaMe through its REST API, deploy such techniques, for integration testing.
Performance testing. As MaMe provides a set of REST APIs, for other elements of Mapper
Toolbox, it is useful to measure the performance of these endpoints. Out from the complete
set of REST operations, we have chosen three representatives, to measure how quickly they
are capable of returning a valid response. All tests are taken on the production deployment of
MaMe from a local computer (this resembles quite accurately the usual user environment,
where tools like MASK or MAD contact MaMe for some metadata).
For the first test, we have chosen the [models_list] operation, as the most demanding -
it takes the whole list of Submodules, Mappers and Filters inside the registry, builds a single
JSON document (around 150 kB) and returns it to the caller. We performed several hundreds
calls and the entire operation takes about 0.83 seconds client-side. This includes connection
establishment and the TCP handshake. On the server-side, the same operation takes 0.58 seconds (the rest 0.25 seconds is taken by request preparation, communication and
demarshalling of the response). However, when the HTTP connection is being reused from
call to call (the usual mode of operation for MaMe clients like MASK and MAD), the
performance rises to 0.64 seconds on the client-side (total wall-clock time). Since this is a
D4.2 Software adaptation-UCL-v0.5 Page 52 of 67

MAPPER – 261507
kind of holistic operation, it is designed to be called quite infrequently (probably once for
every user login to MAD) - and this allows us to decide such a delay is acceptable.
In order to measure less demanding, faster operation, we have performed similar tests for
the [experiments_lis] API endpoint. It returns a smaller JSON document (a little more
than a kilobyte) and it requires MaMe to perform much smaller database lookup. For the
entire operation, the wall-clock time on the client side is 0.046 seconds (out of which 0.013 seconds are spent in the server). In the connection reuse mode, the entire operation takes
0.021 seconds. Clearly, here much higher impact is introduced with the connection and
handshake procedures.
Finaly, to also measure update (write) operations performance, we used the
[add_base/Filter] operation to add many new Filters to the registry. In contrary to two
above methods, this requires basic authentication and relies on the POST HTTP method (not
GET). However, due to very small amount of information being exchanged between the client
and MaMe, the entire procedure takes only 0.037 seconds on average (including the
authentication). This figure we also find acceptable.
Browser conformance testing was performed manually, by using MaMe's web UI from
various Web browsers. At the moment of writing this deliverable, MaMe UI works properly
with Internet Explorer (ver. 9.0 running on Windows 7), Chrome (ver. 17.0 on both Linux and
Windows 7), Opera (ver. 11.50 on Linux and ver. 11.61 on Windows 7) and Firefox (ver. 10.0
on Linux).
6.4.4 Multiscale Application Developer (MAD)
MAD is a web application providing convenient and user-friendly set of tools allowing users
to compose Mapper applications and export them to executable experiments inside
GridSpace Experiment Engine. As a source of information MAD uses the MaMe registry by
means of JSON-enabled set of REST APIs. The modules obtained from the registry are
combined by users into applications by applying simple drag-and-drop routines inside a web
browser. For this to be possible MAD utilizes a few libraries namely Google Web Toolkit as
the integration platform, lib-gwt-svg for SVG graphics support and gwt-dnd for handling drag-
and-drop. Combination of these requires additional effort to support available web browsers.
Currently, as MAD is still being developed, support for latest Firefox and Google Chrome
browsers for both Window and Linux platforms is ensured. In future, tweaks to support other
major browsers (e.g. Internet Explorer, Opera) will be applied.
MAD relies on external components within the Mapper infrastructure which are MaMe - the
model registry and Experiment Workbench - the execution engine. The communication
D4.2 Software adaptation-UCL-v0.5 Page 53 of 67

MAPPER – 261507
between the components is implemented by using well-known standards to minimize errors
and ensure stability. As the MaMe registry uses JSON notation to share its contents Jackson
processor (http://jackson.codehaus.org) and Jersey library (http://jersey.java.net/) were used
to parse and produce responses and requests to the registry. The Experiment Workbench on
the other hand prefers the XML notation to communicate with external components. In this
case one of the JAXB implementations (provided by Sun Java Runtime) was used to ensure
stable communication. Use of the mentioned libraries makes the integration stable and
requires minimal set of integration tests on the MAD side.
Testing of such highly interactive user interface is difficult to be automated. Existing web
testing frameworks (e.g. Selenium) do not support recording of drag-and-drop actions. That
is why the structure of the MAD project follows the MVP principles
(http://code.google.com/webtoolkit/articles/mvp-architecture.html) which let unit-test user
interfaces all the way up to the views. Additionally, the core of the application is abstracted
into a set on controllers and presenters independent of the view engine implementation
(currently GWT with supporting libraries).
6.5 MUSCLEMUSCLE has been tested on an single iMac with an Intel i3 3.2 GHz processor running Mac
OS X 10.7.3 to measure communication library overheads. It is connected to a dual core Intel
2160 1.8 GHz processor running Ubuntu Server on the same network to measure the
influence of using network. In another test, we use MTO between Reef (a PL-Grid resource
in Poznan, Poland; a 16-core Intel Xeon E5530 2.4 GHz node) and Huygens (a PRACE Tier-
1 resource in Amsterdam, The Netherlands; a 64-core IBM Power6 4.7 GHz node).
6.5.1 Results
The following measurements have been performed so far, by sending messages of different
sides from one submodel to another and back, with details in the paragraphs and tables
below. Note that the average time is in fact the round-trip time (RTT), of one message being
sent to the other submodel and that message repeated to the first. By dividing by two, the
time for sending a single message is approximated.
D4.2 Software adaptation-UCL-v0.5 Page 54 of 67

MAPPER – 261507
MUSCLE run in a single instance has extremely high communication speeds and low
latency, with two MUSCLE instances it is still acceptable, with a latency of less than 2
milliseconds RTT and a bandwidth of 100 MB/sec. On a single network latency is slightly
increased at 4 ms RTT and a bandwidth of just 30 MB/sec. The latency comparable but a bit
more unpredictable while using MTO, but stays under 8 ms RTT; the bandwidth stays the
same. Using MTO on a single machine, both latency and bandwidth seem to suffer slightly.
Over a link between Reef (in Poznan, Poland) and Huygens (in Amsterdam, the Netherlands)
the latency is higher here, and more than the distance should account for, at around 115 ms
RTT. This compares to a ping time of 38 ms, or, three messages back and forth for a single
message. The bandwidth fluctuates between 7 and 13 MB/sec. Comparing with the other
results, it would seem that this is a problem with the connection rather than due to
performance of MUSCLE.
Overall, MUSCLE does not seem to introduce much overhead. Largest factors are whether it
is using sockets or within-process communication, and the high latency effect between
distant super-computers.
Below are the precise measurement tables.
6.5.2 MUSCLE on a single machine, with a single instance
Each value is calculated for RTT. Sending 10000 messages in total. For each data size, 30
tests are performed, each sending 10 messages.
D4.2 Software adaptation-UCL-v0.5 Page 55 of 67

MAPPER – 261507
Size (kiB) Total (ms) Avg (ms) StdDev (ms) StdDev (%) Speed (MB/s)0 404 1.349 0.307 22.726 NaN 1 351 1.172 0.227 19.367 1.747 2 308 1.029 0.284 27.628 3.981 4 241 0.805 0.124 15.473 10.181 8 233 0.777 0.122 15.663 21.089 16 252 0.843 0.184 21.814 38.884 32 224 0.749 0.056 7.499 87.457 64 276 0.921 0.127 13.747 142.280 128 439 1.464 0.191 13.079 179.056 256 702 2.343 0.828 35.351 223.794 512 1080 3.603 0.130 3.596 291.020 1024 2059 6.864 0.191 2.785 305.538 2048 4429 14.766 1.704 11.540 284.050 4096 9993 33.313 3.447 10.346 251.815 8192 20816 69.387 3.837 5.530 241.793 16384 41262 137.541 7.623 5.542 243.959 32768 83177 277.259 4.923 1.776 242.044 65536 182713 609.045 24.691 4.054 220.374
6.5.3 MUSCLE on a single machine, with two instances
In this case, communication is performed over local sockets. Values are NOT divided by 2.
Each value is calculated for RTT. Sending 10000 messages in total. For each data size, 30
tests are performed, each sending 10 messages.
Size (kiB) Total (ms) Avg (ms) StdDev (ms) StdDev (%) Speed (MB/s)0 557 1.857 0.250 13.466 NaN 1 521 1.739 0.357 20.511 1.178 2 509 1.699 0.309 18.197 2.412 4 505 1.685 0.653 38.739 4.863 8 528 1.760 1.697 96.429 9.307 16 436 1.457 0.348 23.916 22.497 32 659 2.197 1.936 88.139 29.831 64 715 2.385 0.420 17.622 54.965 128 976 3.253 0.780 23.971 80.575 256 1465 4.887 0.167 3.423 107.291 512 2576 8.588 0.143 1.665 122.097 1024 4806 16.020 0.508 3.170 130.905 2048 10292 34.308 1.899 5.536 122.255 4096 23343 77.812 3.326 4.275 107.807 8192 46679 155.598 3.243 2.084 107.824 16384 95138 317.129 6.000 1.892 105.807 32768 203558 678.529 137.618 20.282 98.903
D4.2 Software adaptation-UCL-v0.5 Page 56 of 67

MAPPER – 261507
65536 406353 1354.511 65.008 4.799 99.089
6.5.4 MUSCLE on two machines on the university network
Values are NOT divided by 2. Each value is calculated for RTT. Sending 10000 messages in
total. For each data size, 30 tests are performed, each sending 10 messages.
Size (kiB) Total (ms) Avg (ms) StdDev(ms) StdDev(%) Speed (MB/s) 0 1227 4.090 0.351 8.593 NaN 1 1227 4.091 0.600 14.673 0.501 2 1132 3.776 0.345 9.127 1.085 4 1051 3.506 0.344 9.815 2.337 8 1025 3.418 0.400 11.716 4.794 16 1097 3.658 0.477 13.035 8.958 32 1267 4.225 0.393 9.301 15.513 64 1909 6.365 1.469 23.087 20.594 128 3291 10.973 2.763 25.176 23.890 256 5093 16.979 2.641 15.556 30.879 512 9724 32.414 3.970 12.248 32.350 1024 19290 64.300 5.404 8.405 32.615 2048 38463 128.213 6.586 5.137 32.714 4096 76489 254.964 19.046 7.470 32.901 8192 151772 505.909 18.913 3.738 33.163 16384 310636 1035.455 34.738 3.355 32.405 32768 628682 2095.609 51.171 2.442 32.024 65536 1387174 4623.915 215.892 4.669 29.027
6.5.5 MUSCLE between Huygens and Reef, using the MTO
Size (kiB) Total (ms) Avg (ms) StdDev(ms) StdDev(%) Speed (MB/s)0 57438 191.461 1.734 0.905 NaN1 34064 113.549 0.254 0.224 0.0182 34061 113.537 0.352 0.310 0.0364 34883 116.280 3.303 2.841 0.0708 34093 113.644 1.328 1.168 0.14416 34859 116.197 3.391 2.919 0.28232 34286 114.290 1.460 1.278 0.57364 35317 117.726 10.996 9.341 1.113128 35618 118.728 3.656 3.080 2.208256 35479 118.264 3.767 3.185 4.433512 36811 122.705 4.570 3.725 8.5461024 47435 158.118 72.290 45.719 13.263
D4.2 Software adaptation-UCL-v0.5 Page 57 of 67
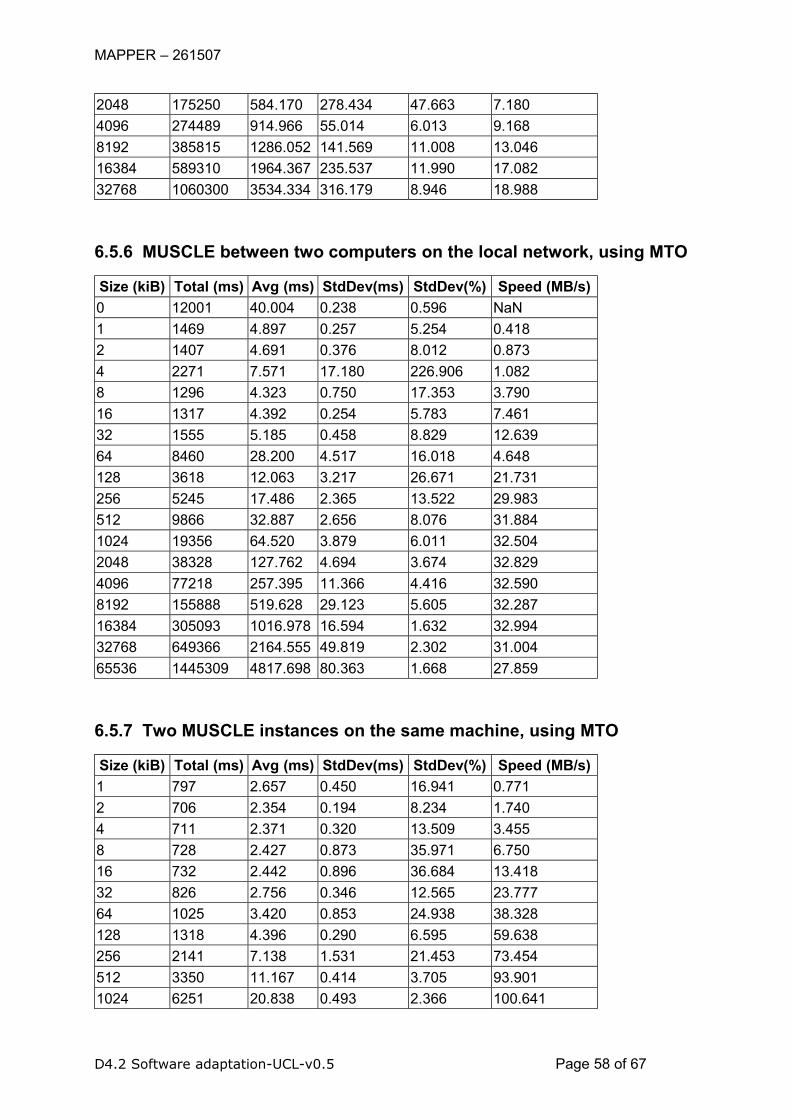
MAPPER – 261507
2048 175250 584.170 278.434 47.663 7.1804096 274489 914.966 55.014 6.013 9.1688192 385815 1286.052 141.569 11.008 13.04616384 589310 1964.367 235.537 11.990 17.08232768 1060300 3534.334 316.179 8.946 18.988
6.5.6 MUSCLE between two computers on the local network, using MTO
Size (kiB) Total (ms) Avg (ms) StdDev(ms) StdDev(%) Speed (MB/s)0 12001 40.004 0.238 0.596 NaN1 1469 4.897 0.257 5.254 0.4182 1407 4.691 0.376 8.012 0.8734 2271 7.571 17.180 226.906 1.0828 1296 4.323 0.750 17.353 3.79016 1317 4.392 0.254 5.783 7.46132 1555 5.185 0.458 8.829 12.63964 8460 28.200 4.517 16.018 4.648128 3618 12.063 3.217 26.671 21.731256 5245 17.486 2.365 13.522 29.983512 9866 32.887 2.656 8.076 31.8841024 19356 64.520 3.879 6.011 32.5042048 38328 127.762 4.694 3.674 32.8294096 77218 257.395 11.366 4.416 32.5908192 155888 519.628 29.123 5.605 32.28716384 305093 1016.978 16.594 1.632 32.99432768 649366 2164.555 49.819 2.302 31.00465536 1445309 4817.698 80.363 1.668 27.859
6.5.7 Two MUSCLE instances on the same machine, using MTO
Size (kiB) Total (ms) Avg (ms) StdDev(ms) StdDev(%) Speed (MB/s)1 797 2.657 0.450 16.941 0.7712 706 2.354 0.194 8.234 1.7404 711 2.371 0.320 13.509 3.4558 728 2.427 0.873 35.971 6.75016 732 2.442 0.896 36.684 13.41832 826 2.756 0.346 12.565 23.77764 1025 3.420 0.853 24.938 38.328128 1318 4.396 0.290 6.595 59.638256 2141 7.138 1.531 21.453 73.454512 3350 11.167 0.414 3.705 93.9011024 6251 20.838 0.493 2.366 100.641
D4.2 Software adaptation-UCL-v0.5 Page 58 of 67

MAPPER – 261507
2048 12789 42.632 1.065 2.497 98.3844096 36765 122.551 92.713 75.653 68.4508192 72287 240.958 85.006 35.278 69.62716384 160505 535.020 219.298 40.989 62.71632768 283970 946.567 412.473 43.576 70.89765536 562114 1873.716 569.141 30.375 71.632
6.6 Application Hosting EnvironmentAHE is designed to simplify user experience, and as such benchmarking of the tool has
involved conducting usability studies to compare AHE to other similar tools.
6.6.1 Usability Study Methodology
Our usability study comprised two sections. Globus and UNICORE are the de facto standard
middleware tools used to access contemporary production grids to which we have access.
By default, Globus is accessed via command line tools to transfer files and submit and
monitor jobs. UNICORE has both command line and graphical clients to launch and monitor
applications, as does AHE. The first part of our study compared the usability of the Globus
command line clients with the usability of the AHE command line client, and the usability of
the UNICORE Grid Programming Environment (GPE) graphical client (which we ourselves
found easier to use than the full UNICORE Rich Client) with the usability of the AHE
graphical client. The version of Globus used was 4.0.5, submitting to pre-WS GRAM; version
6.3.1 of UNICORE was used, with version 6 of the GPE client. AHE version 2.0 was used for
the AHE based tests, with a prerelease version of AHE+ACD used for the security tests.
The remaining part of our usability study set out to evaluate our second hypothesis. We
compared a scenario where a user was given an X.509 certificate and had to configure it for
use with AHE to a scenario where a user invoked ACD to authenticate to AHE. Both sections
of the study can be considered as representing `best case scenarios'. Firstly, all tools were
installed and preconfigured for the user. An actual user of TeraGrid or DEISA would most
likely have to install and configure the tools herself. In the security section of the study, the
user was given an X.509 certificate to employ with AHE. In reality, a user would have to go
through the process of obtaining a certificate from her local Certificate Authority, a time
consuming task that can take between two days and two weeks.
In passing we note that while other middleware tools, and other interfaces to Globus and
UNICORE, certainly do exist, these interfaces are often community specific and not available
to all users. Our tests evaluate the default minimum middleware solutions available to
TeraGrid and DEISA users.
D4.2 Software adaptation-UCL-v0.5 Page 59 of 67
MAPPER – 261507
6.6.2 Participants
Some usability experts maintain that five is a suitable number of subjects with which to
conduct a usability study, since this number of people will typically find 80\% of the problems
in any given interface. However, our study does not seek bugs in a single interface: it asks
participants to compare the features of several middleware tools to find which is most usable.
To do this we need a sufficient number of participants to be sure that our results are
statistically significant. To determine the minimum number of participants required, we
conducted a power analysis, calculating the probability that a statistical test will reject the null
hypothesis or alternatively detect an effect. In order to determine the statistical significance of
our results, we used a one-tailed paired $t$-test. For a reasonable statistical power of 0.8
(i.e. the probability that the test will find a statistically significant difference between the
tools), we therefore determined we would need a minimum of 27 participants, plus a few
more to allow for those who might drop out for various reasons.
We recruited a cohort of 39 participants consisting of UCL undergraduate and postgraduate
students, each of whom received a £10 Amazon Voucher for taking part in the study. These
participants came from a wide range of backgrounds in the humanities, sciences and
engineering, but none had any previous experience in the use of computational grids. This
cohort is therefore analogous to a group of new users of computational grids (e.g. a first year
PhD student) in terms of educational background and experience.
6.6.3 Tasks
As discussed, our usability study was split into two sections. In the first section participants
were asked to compare Globus, UNICORE and AHE by performing three separate tasks:
• Launch an application on a grid resource using the middleware tool being tested. The
application in question (pre-installed on the grid resource) sorted a list of words into
alphabetical order. The user had to upload the input data from their local machine and
then submit the application to the machine.
• Monitor the application launched in step 1 until complete.
• Download the output of the application back to the local machine once it has
completed.
The second section compared the use of X.509 certificates to ACD authentication. In this
section, users were asked to perform the following two tasks:
• Configure the AHE client with to use an X.509 certificate, and then submit a job using
the graphical client.
D4.2 Software adaptation-UCL-v0.5 Page 60 of 67

MAPPER – 261507
• Authenticate to AHE using an ACD username and password, and then submit a job
using the graphical client.
In order to avoid the typical queue waiting problem when using HPC resources, all of the
tests ran the application on the same server, based locally in the Centre for Computational
Science at University College London, which was used solely for the purpose of running the
usability test application.
6.6.4 Data Collection
Prior to beginning the tasks outlined above, each participant was asked a number of question
related to their academic background, general IT experience and previous experience of
using grid middleware tools. After each task, we asked the participants to rate the difficulty of
the task and their satisfaction with their performance of the task, using a Likert scale (i.e. five
options from strongly agree to strongly disagree). In addition, we timed how long it took the
user to complete each task. After using each tool, we asked the participant to evaluate it
using the System Usability Scale (SUS), via ten questions about his impression of the tool
giving a standard measure of usability scored out of 100, which is suitable for making
comparisons between tools. After completing the two sections of the study, each participant
was able to give freeform comments on impressions of the tools used, if desired. While
performing each task, an observer watched each participant and recorded whether or not the
task was completed successfully.
6.6.5 Delivery
To ease the process of data collection and tabulation (and the timings of tasks), we
developed a simple web platform from which to deliver the usability study. The study was
conducted in the Centre for Computational Science at University College London. Each
participant in the study was assigned an ID number, which they used to log on to the delivery
platform. All of the various usability metrics were then recorded against this ID in a database.
Before starting the study, the delivery platform displayed a page explaining to the user the
purpose of the study. The observer also explained to the participant that he was not able to
provide any assistance or answer questions relating to the tasks being performed.
The delivery platform provided web forms on which participants could record the answers to
the questions outlined in the previous section. The delivery platform also described the
operations that the user had to carry out. Prior to performing the task, the user had to click a
Start button, which set a timer running for the task, and a Stop button when it was completed.
When performing a task, the user was given a documentation snapshot, taken from the tool's
documentation, that instructed them how to perform the task (included as electronic
D4.2 Software adaptation-UCL-v0.5 Page 61 of 67

MAPPER – 261507
supplementary information to this paper). As noted, all of the tools were preconfigured on the
machine used by the participant to perform the tasks. Each of the tasks in the two sections
was assigned in a random order, to minimize the risk of bias entering the study.
6.6.6 Results
Result Globus
Toolkit
AHE
CLI
UNICORE
GUI
AHE
GUI
AHE with
Cert
AHE with
ACDPercentage of successful
users 45.45 75.76 30.30 96.97 66.67 96.97
Percentage of users
satisfied with tool 27.27 53.54 47.47 79.80 51.52 87.88
Percentage of users who
found tool difficult to use 45.45 25.25 26.26 5.05 27.27 0.00
Table 1: Summary of statistics collected during usability trials for each tool under comparison.
Our usability tests show very clear differences between the different tools tested, based on
the usability metrics defined above. Table 1 presents key measurements from our findings.
Due to problems with the delivery platform (such as web browser crashes half way through a
set of tests), the results from six participants have been excluded from our results, meaning
that the results presented have been gathered from a cohort of 33 participants.
We applied a 1-tailed, paired t-test to our results to determine the statistical significance of
any differences between the tools being compared. We compared the Globus command line
client with the AHE command line tool, and the UNICORE graphical client with the AHE
graphical client. We also compared the AHE using a digital certificate to the AHE using ACD
authentication. The P-values of these t-tests are shown in table 2, along with mean scores
for the five different metrics. A p < 0.05 shows that the difference between the tools is
statistically significant.
Our first usability metric looked at whether or not a user could successfully complete the set
of tasks with a given tool. Table \ref{tab:results} summarizes the percentage of participants
who were able to complete all tasks for each tool. Although the failure data is measured on
an ordinal scale (Success, Failed etc.), we have converted it to numerical data in order to
more easily compare results. The mean failure rate is shown in table 2, with a lower score
meaning there were less failures when using the tool. Also shown in table 2 are the P-value
scores; the AHE command line was found to be less failure prone than the Globus command
line (t(33) = 1.41,p < 0.05), the AHE GUI was found to be less failure prone than the
D4.2 Software adaptation-UCL-v0.5 Page 62 of 67

MAPPER – 261507
UNICORE GUI (t(33) = 1.07, p< 0.05) and AHE with ACD was found to be less failure prone
than AHE with X.509 certificates (t(33) = 1.03, p < 0.05).
Our second usability metric was a measure of how long it took a user to complete an
application run. Figure 1 plots the mean times taken to complete the range of tasks with each
tool. Again, the differences are statistically significant as shown in table \ref{tab:ttests}, with
participants able to use AHE to run their applications faster than via Globus or UNICORE,
and AHE with ACD faster than AHE with X.509 certificates.
Our third usability metric measured user satisfaction with the tools used. In table 1 we have
summarized the percentage of participants who reported being either Satisfied or Very
Satisfied with a tool. The Likert scale data is again ordinal, but we have converted it to
numerical data in order to compare it, according to commonly practice. The mean
satisfaction level is reported in table \ref{tab:ttests}, a higher score meaning that a user was
more satisfied with the tool. Again, users reported being more satisfied with the AHE than
with other tools, and with ACD than with X.509 certificates, as show by the P-value scores
table.
Our fourth usability metric looked at how difficult a user perceived a tool to be. Again the
percentage of users who found a tool difficult or very difficult is summarized in table 1. The
mean difficulty scores are shown in table 2, with a higher score meaning that the tool was
perceived as being more difficult to use. The AHE GUI client was perceived as being less
difficult to use than the UNICORE GUI client (t(33) = 1.73, p< 0.05), the AHE command line
interface was perceived as being less difficult to use than the Globus command line tools
(t(33) = 2.55, p < 0.05), and AHE with ACD was perceived as being less difficult than AHE
with digital certificates (t(33) = 1.52, p < 0.05).
Our final usability metric measured a participant's overall impression of a tool using the SUS
usability scale. The mean SUS score is shown in table 2, with a higher score meaning the
tool is more usable. Again, we found statistical significance, with AHE GUI being rated as
more usable than the UNICORE GUI, AHE command line being rated higher than Globus,
and AHE with ACD being rated higher than AHE with digital certificates, as summarized in
table 2.
D4.2 Software adaptation-UCL-v0.5 Page 63 of 67

MAPPER – 261507
Table 2: The mean scores and t-test P-values for our five usability metrics, comparing the
AHE and Globus command line clients, the AHE and UNICORE graphical clients, and the
AHE with and without ACD.
Figure 1: Mean time taken to complete a range of tasks with each tool.
D4.2 Software adaptation-UCL-v0.5 Page 64 of 67

MAPPER – 261507
Figure 2: a comparison of the percentage of users who were satisfied with a tool and the
percentage who could successfully use that tool.
6.6.7 Discussion of Results
The results presented in the previous section clearly confirm our hypotheses, that the
application interaction model used by the AHE is more usable than the resource interaction
model implemented in the UNICORE and Globus toolkits, with AHE found to be more usable
for each of our defined usability metrics. We believe the reason for this is due to the fact that
AHE hides much of the complexity of launching applications from users, meaning that (a)
there are less things that can go wrong (hence the lower failure rate) and (b) there are less
things for a user to remember when launching an application (hence the higher satisfaction
with and lower perceived difficulty of AHE tools). The fact that the AHE model encapsulates
input and output data as part of an application's instance (and stages data back and forth on
the user's behalf) means that application launching is faster via AHE.
In the case of ACD security, the familiar username and password were clearly found to be
more usable than X.509 certificates, but it should also be stressed that the scenario modelled
here represented the `best case' scenario, where a user was already given an X.509
certificate with which to configure their client. As previously noted, in the real world a user
would have to go through the laborious process of obtaining an X.509 certificate from their
certificate authority, which renders the ACD solution far more usable still.
The failure rate when using a tool is dependent on all of the subtasks being completed
successfully; if one task failed, it meant that the following tasks could not be successfully
completed (marked `Failed due to previous' by the observer). This is, however, analogous to
real world scenarios where, for example, a user will not be able to download data from a grid
resource if his job is not submitted correctly.
We noted particular problems experienced by participants using the UNICORE middleware,
related to staging files and configuring job input files. However, these problems were not
noted by the participants themselves, due to the jobs appearing to submit properly. Figure 2
D4.2 Software adaptation-UCL-v0.5 Page 65 of 67
MAPPER – 261507
plots the percentage of users reporting satisfaction with a tool alongside the percentage of
users who successfully used that tool. Curiously, more users reported satisfaction with the
UNICORE client than were able to use it successfully, suggesting that many participants did
not realize their jobs had not completed successfully.
The freeform comments made by users of the individual systems also provide some
illuminating insights as to their usability. Regarding the use of ACD security with AHE, one
participant reported "To deal with security issues a user is much more at ease with a simple
username/password system. The use of certificates just complicates the process
unnecessarily". Another participant highlighted the problems involved in learning the
command line parameters required to use the Globus Toolkit, reporting "there were
difficulties in accessing the outside servers i.e. adding gsiftp:// or when to input the whole
path into the command line".
7 References1. JSDL - Fred Brisard, Michel Drescher, Donal Fellows, An Ly, Stephen McGough,
Darren Pulsipher, Andreas Savva: Job Submission Description Language (JSDL)
Specification, Version 1.0, http://www.gridforum.org/documents/GFD.56.pdf, 2005.
2. HPC-BasicProfile - Blair Dillaway, Marty Humphrey, Chris Smith, Marvin Theimer,
Glenn Wasson: HPC Basic Profile, Version 1.0,
http://www.ogf.org/documents/GFD.114.pdf, 2007.
3. K. Rycerz, M. Nowak, P. Pierzchala, M. Bubak, E. Ciepiela and D. Harezlak:
Comparision of Cloud and Local HPC approach for MUSCLE-based Multiscale
Simulations. In Proceedings of The Seventh IEEE International Conference on e-
Science Workshops, Stockholm, Sweden, 5-8 December 2011. IEEE Computer
Society, Washington, DC, USA, 81-88 (2011).
4. I. Foster,A. Grimshaw,P. Lane,W. Lee,M. Morgan,S. Newhouse,S. Pickles,D.
Pulsipher,C. Smith,M. Theimer: OGSA Basic Execution Service, Version 1.0,
http://www.ogf.org/documents/GFD.108.pdf, 2008
5. Goodale, T. and Jha, S. and Kaiser, H. and Kielmann, T. and Kleijer, P. and Von
Laszewski, G. and Lee, C. and Merzky, A. and Rajic, H. and Shalf, J.: SAGA: A
Simple API for Grid Applications. High-level application programming on the Grid.
Computational Methods in Science and Technology
6. Fredrik Hedman, Morris Riedel, Phillip Mucci, Gilbert Netzer, Ali Gholami, M.
Shahbaz Memon, A. Shiraz Memon, Zeeshan Ali Shah: Benchmarking of Integrated
OGSA-BES with the Grid Middleware. Euro-Par Workshops 2008.
D4.2 Software adaptation-UCL-v0.5 Page 66 of 67

MAPPER – 261507
7. John Brooke Usability evaluation in industry, SUS—a quick and dirty usability scale
(CRC Press, Boca Raton, FL), pp 189–194 (1996).
D4.2 Software adaptation-UCL-v0.5 Page 67 of 67