d6.2 oxeram - lca and lcc of tertiary treatment processes · lca shows that the existing phosphorus...
TRANSCRIPT

Berlin, Germany
2013
© Copyright 2013 by the KompetenzZentrum Wasser Berlin gGmbH. All rights including translation into other languages, reserved under the Universal Copyright Convention, the Berne Convention for the Protection of Literacy and Artistic Works, and the International and Pan American Copyright Conventions.
Cicerostr. 24 D-10709 Berlin Germany Tel +49 (0)30 536 53 800 Fax +49 (0)30 536 53 888 www.kompetenz-wasser.de
REPORT Contract: 11245 UEP II Final vers ion , Date: 21.08.2013
Life Cycle Assessment and
Life Cycle Costing of
tertiary treatment schemes
Project acronym: OXERAM 2
by
Christian Remy
Kompetenzzentrum Wasser Berlin
Cicerostr. 24, 10709 Berlin
for
Kompetenzzentrum Wasser Berlin gGmbH
Preparation of this report was financed through funds provided by Berliner
Wasserbetriebe, Veolia Water and Berlin Environmental Relief Programme (ERP)


i
Important Legal Notice Disclaimer: The information in this publication was considered technically sound by the consensus of persons engaged in the development and approval of the document at the time it was developed. KWB disclaims liability to the full extent for any personal injury, property, or other damages of any nature whatsoever, whether special, indirect, consequential, or compensatory, directly or indirectly resulting from the publication, use of application, or reliance on this document. KWB disclaims and makes no guaranty or warranty, expressed or implied, as to the accuracy or completeness of any information published herein. It is expressly pointed out that the information and results given in this publication may be out of date due to subsequent modifications. In addition, KWB disclaims and makes no warranty that the information in this document will fulfill any of your particular purposes or needs. The disclaimer on hand neither seeks to restrict nor to exclude KWB’s liability against all relevant national statutory provisions. Wichtiger rechtlicher Hinweis Haftungsausschluss: Die in dieser Publikation bereitgestellte Information wurde zum Zeitpunkt der Erstellung im Konsens mit den bei Entwicklung und Anfertigung des Dokumentes beteiligten Personen als technisch einwandfrei befunden. KWB schließt vollumfänglich die Haftung für jegliche Personen-, Sach- oder sonstige Schäden aus, ungeachtet ob diese speziell, indirekt, nachfolgend oder kompensatorisch, mittelbar oder unmittelbar sind oder direkt oder indirekt von dieser Publikation, einer Anwendung oder dem Vertrauen in dieses Dokument herrühren. KWB übernimmt keine Garantie und macht keine Zusicherungen ausdrücklicher oder stillschweigender Art bezüglich der Richtigkeit oder Vollständigkeit jeglicher Information hierin. Es wird ausdrücklich darauf hingewiesen, dass die in der Publikation gegebenen Informationen und Ergebnisse aufgrund nachfolgender Änderungen nicht mehr aktuell sein können. Weiterhin lehnt KWB die Haftung ab und übernimmt keine Garantie, dass die in diesem Dokument enthaltenen Informationen der Erfüllung Ihrer besonderen Zwecke oder Ansprüche dienlich sind. Mit der vorliegenden Haftungsausschlussklausel wird weder bezweckt, die Haftung der KWB entgegen den einschlägigen nationalen Rechtsvorschriften einzuschränken noch sie in Fällen auszuschließen, in denen ein Ausschluss nach diesen Rechtsvorschriften nicht möglich ist.

ii
Colophon
Present report was developed in compliance with the requirements of the quality management system DIN EN ISO 9001:2008
Title Life Cycle Assessment and Life Cycle Costing of tertiary treatment schemes
Authors Christian Remy, Kompetenzzentrum Wasser Berlin
Quality Assurance Ulf Miehe, Kompetenzzentrum Wasser Berlin Boris Lesjean, Kompetenzzentrum Wasser Berlin Daniel Mutz, Kompetenzzentrum Wasser Berlin Corinna Bartholomäus, Berliner Wasserbetriebe Rune Strube, Hydrotech
Publication / Dissemination approved by technical committee members: C. Bourdon, Veolia
A. Tazi-Pain, Veolia
C. Bartholomäus, Berliner Wasserbetriebe
R. Gnirß, Berliner Wasserbetriebe
A. Peter-Fröhlich, Berliner Wasserbetriebe
M. Jekel, FG Wasserreinhaltung, TU Berlin
A. Hartmann, Kompetenzzentrum Wasser Berlin gGmbH
Deliverable number D 6.2
Final version Date: 21.08.2013

iii
Abstract (English)
For a future upgrade of the wastewater treatment plant (WWTP) Ruhleben targeting advanced removal of total phosphorus (TP) (< 50-120 µg/L TP) and seasonal disinfection, various technological options for tertiary treatment of secondary effluent are suitable to fulfill these goals. This study applies the holistic methods of Life Cycle Assessment (LCA) and Life Cycle Costing (LCC) to assess and compare those options for tertiary treatment at WWTP Ruhleben in their environmental and economic impacts, including all relevant direct and indirect processes and effects of the WWTP upgrade. Options for tertiary treatment include gravity-driven processess such as dual media filtration (DMF), microsieve filtration (MSF), or high-rate sedimentation (HRS), and membrane-based processes such as ultrafiltration with polymer membranes (Polymer UF) or microfiltration with ceramic membranes (Ceramic MF). For disinfection in the summer period, gravity-driven processes are complemented by downstream UV disinfection, which is only applied in rain weather bypass for membrane processes. Process data for operational parameters and infrastructure design are based on long-term pilot trials at technical scale (DMF, MSF, Polymer UF, Ceramic MF) or process modelling based on supplier information (HRS).
LCA shows that the existing phosphorus load in secondary effluent of WWTP Ruhleben (28 t/a TP) can be reduced substantially by all processes, eliminating 19-25 t/a TP (67-90%) depending on the process. A minor side-benefit for effluent quality is also expected from the further elimination of heavy metals adsorbed to particulate matter in secondary effluent. At the same time, tertiary treatment schemes will increase energy demand and related emissions of greenhouse gases (carbon footprint) of the existing WWTP process by an estimated 12-21% and 7-13%, respectively. Gravity-driven processes with low coagulant dosing (DMF, MSF, HRS) have a considerably lower energy demand and carbon footprint than membrane-based processes with high electricity demand for feed pumps and higher coagulant dose. At the same time, low-energy treatment processes do not reach the exceptional high effluent quality of membrane-based processes. Consequently, a certain trade-off between energy demand/carbon footprint and effluent quality can be quantified. In analogy to the environmental assessment and effluent quality, LCC results show that total annual costs are lowest for HRS (5.1 Mio €/a) and comparable between DMF and MSF (5.7 Mio €/a), followed by Polymer UF (10.2 Mio €/a) and Ceramic MF (12.2 Mio €/a). In comparison to gravity-driven processes, membrane-based processes are characterized by both higher investment costs (factor 1.5 – 3x) and higher operational costs (factor 2 – 2.5x), mainly due to high costs of membranes, machinery, electricity, and coagulants.
Comparing the relative resource efficiency for selected environmental and economic parameters related to the total load of eliminated phosphorus, DMF and MSF are the most efficient of the assessed technologies for tertiary treatment, spending ~ 250 €/kg Pelim and causing 180 kg CO2-eq/kg Pelim (both with UV disinfection as post-treatment). HRS + UV has higher relative costs (270 €/kg Pelim) and higher carbon footprint (235 kg CO2-eq/kg Pelim) due to the lower effluent quality of the process (= less reduction in TP loads). Membrane-based processes have the highest relative costs for P removal (400-475 €/kg Pelim) and the highest carbon footprint (275 kg CO2-eq/kg Pelim): even though their superior effluent quality leads to the highest total reduction in TP loads, the high energy demand and costs of membrane processes yield higher relative spending of resources related to the final goal.

iv
Abstract (German)
Für die zukünftige Erweiterung des Klärwerks Ruhleben zur weitgehenden Entfernung von Gesamtphosphor (< 50-120 µg/L TP) und saisonaler Desinfektion stehen eine Reihe von geeigneten Verfahren zur Nachbehandlung des Kläranlagenablaufs zur Verfügung. Die vorliegende Studie nutzt lebenszyklusbasierte Methoden der Ökobilanz und der Kostenrechnung, um die ökologischen Folgen und ökonomischen Aufwendungen dieser Verfahren abbilden und vergleichen zu können, in dem alle relevanten direkten und indirekten Prozesse und Effekte der Erweiterung abgebildet werden. Die Verfahren umfassen sowohl schwerkraft-getriebene Verfahren wie Zweischichtfilter (ZSF), Mikrosiebfiltration (MSF) oder Kompaktsedimentation (KSE) als auch Membranverfahren wie Ultrafiltration mit Polymermembranen (Polymer UF) oder Mikrofiltration mit keramischen Membranen (Keramik MF). Für die Desinfektion im Sommer werden die schwerkraft-getriebenden Verfahren durch eine nachgeschaltete UV-Desinfektion ergänzt, die für die Membranverfahren nur für den Bypassstrom im Regenwetterfall vorgesehen ist. Prozessdaten für die betrieblichen Parameter und die Auslegung der Infrastruktur basieren auf Langzeitversuchen im technischen Maßstab (ZSF, MSF, Polymer UF, Keramik MF) oder sind aus Herstellerangaben abgeleitet (KSE).
Die Ökobilanz zeigt, dass die momentane P-Fracht im Klarwasser des Klärwerks Ruhleben (28 t/a TP) durch alle Prozesse erheblich reduziert werden kann, indem zusätzlich 19-25 t/a TP (67-90%) abhängig vom Prozess zurückgehalten werden. Ein weiterer ökologischer Vorteil liegt in der erhöhten Abscheidung von Schwermetallen, die an die Feststoffe im Ablauf adsorbiert sind. Gleichzeitig erhöht jedoch die Nach-behandlung den Energieverbrauch des Klärwerks um 12-21% und damit verbunden die Emission von Treibhausgasen um 7-13%. Schwerkraft-getriebene Prozesse mit niedriger Fällmitteldosierung (ZSF, MSF, KSE) zeigen dabei einen deutlich niedrigeren Energieverbrauch und Treibhausgasausstoß als Membranprozesse mit hohem Stromverbrauch für die Pumpen und hoher Dosierung von Fällmitteln. Auf der anderen Seite erreichen diese Niedrigenergieverfahren nicht die sehr gute Ablaufqualität der Membranen, so dass letztlich ein Kompromiß zwischen Ablaufqualität und Energie-verbrauch bzw. Treibhausgasausstoß gefunden werden muss. Analog dazu zeigt die Kostenrechnung, dass die Jahreskosten für KSE (5.1 Mio €/a) am niedrigsten und für ZSF und MSF vergleichbar (5.7 Mio €/a) sind, gefolgt von Polymer UF (10.2 Mio €/a) und Keramik MF (12.2 Mio €/a). Im Vergleich zu den Niedrigenergieverfahren haben Membranprozesse sowohl höhere Investitions- (Faktor 1.5-3x) als auch höhere Betriebskosten (Faktor 2-2.5x) durch hohe Kosten für Membranmodule, Maschinentechnik, Strom und Fällmittel.
Im Vergleich der relativen Resourceneffizienz (Bezug von Umweltparametern und Kosten auf die eliminierte Phosphorfracht) zeigen ZSF und MSF die höchste Effizienz mit Kosten von ~ 250 €/kg Pelim und Treibhausgasemissionen von 180 kg CO2-eq/kg Pelim (beide inkl. UV-Desinfektion). KSE + UV verursacht höhere relative Kosten (270 €/kg Pelim) und einen höheren CO2-Fußabdruck (235 kg CO2-eq/kg Pelim) durch die geringere abgeschiedene P-Fracht. Membranverfahren erzeugen insgesamt die höchsten relativen Kosten (400-475 €/kg Pelim) und den höchsten CO2-Fußabdruck (275 kg CO2-eq/kg Pelim): trotz ihrer sehr guten Ablaufqualität und damit verbunden der höchsten Gesamtreduktion der P-Fracht führen hoher Energieverbrauch und hohe Kosten zu den größten relativen Aufwendungen bezogen auf das Ziel der weitergehenden P-Elimination.

v
Acknowledgements
This study is based on close and trustful collaboration within the OXERAM project team, the project partners, and technology suppliers. This input in terms of metholodogical approach, process data, comments, and validation of results is the prerequisite of a sound and representative assessment of the available technologies. In detail, the following persons are thanked for their valuable contribution to this work:
Oxeram project team (KWB)
Ulf Miehe, Boris Lesjean, Morgane Boulestreau, Margarethe Langer, Johan Stüber, Daniel Mutz
Berliner Wasserbetriebe
Regina Gnirss, Alexander Sperlich (BWB-FE)
Corinna Bartholomäus, Katharina Draht (BWB-GI)
Anton Peter-Fröhlich, Carsten Lüdicke, Steffen Keller (BWB-AE)
Project partners
Rune Strube, Jaane Väänänen (Hydrotech)
Patrick Buchta, Martin Thoma (Inge AG)
Jürgen Barthel (Krüger-Wabag)
Mirco Köhler (VWS)
Phillipe Sauvignet (Veolia DT)
Achim Ried (Wedeco)

vi
Table of Contents
Colophon ......................................................................................................................... ii
Abstract (English) ............................................................................................................ iii
Abstract (German) .......................................................................................................... iv
Acknowledgements .......................................................................................................... v
Chapter 1 Introduction and layout of the study ................................................................ 1
Chapter 2 LCA: Definition of goal and scope ................................................................... 4
2.1 Goal and target group ............................................................................................ 4
2.2 Function and functional unit ................................................................................... 4
2.3 Reference input flows ............................................................................................ 5
2.4 System expansion ................................................................................................. 7
2.5 Description of the investigated scenarios ............................................................... 8
2.5.1 Reference (“status quo”): Pumping or UV in summer ...................................... 8
2.5.2 Dual media filtration + UV ............................................................................... 9
2.5.3 Microsieve + UV .............................................................................................. 9
2.5.4 Polymer Ultrafiltration + UV bypass ............................................................... 10
2.5.5 Ceramic Microfiltration with optional pre-ozonation + UV bypass .................. 11
2.5.6 High rate sedimentation + UV ....................................................................... 11
2.6 System boundaries .............................................................................................. 12
2.7 Data quality ......................................................................................................... 14
2.8 Allocation ............................................................................................................. 15
2.9 Indicators of Life Cycle Impact Assessment ......................................................... 16
2.10 Optional elements of Life Cycle Impact Assessment .......................................... 18
2.11 Interpretation ..................................................................................................... 18
2.12 Critical review .................................................................................................... 19
2.13 Reporting ........................................................................................................... 19
Chapter 3 LCA: Life Cycle Inventory ............................................................................. 20
3.1 Pumping or UV in summer (reference) ................................................................ 20
3.2 Dual media filtration + UV .................................................................................... 20
3.3 Microsieve + UV .................................................................................................. 22
3.4 Polymer ultrafiltration + UV bypass ...................................................................... 24
3.5 Ceramic microfiltration + Ozonation (optional) + UV bypass ................................ 26
3.6 High rate sedimentation + UV .............................................................................. 29
3.7 Infrastructure ....................................................................................................... 30
3.8 Background processes ........................................................................................ 34
3.8.1 Electricity production ..................................................................................... 34

vii
3.8.2 Transport ....................................................................................................... 34
3.8.3 Supply of chemicals ...................................................................................... 35
3.8.4 Supply of materials for infrastructure ............................................................. 37
3.9 Summary of Life Cycle Inventory ......................................................................... 39
3.9.1 Electricity demand ......................................................................................... 39
3.9.2 Chemicals demand ........................................................................................ 40
3.9.3 Effluent loads ................................................................................................ 40
Chapter 4 LCA: Impact assessment .............................................................................. 42
4.1 Environmental impacts of tertiary treatment schemes .......................................... 42
4.1.1 Freshwater eutrophication ............................................................................. 42
4.1.2 Aquatic ecotoxicity ......................................................................................... 43
4.1.3 Cumulative energy demand of non-regenerative fuels ................................... 43
4.1.4 Global warming potential (“carbon footprint”) ................................................. 44
4.1.5 Acidification ................................................................................................... 45
4.1.6 Human toxicity ............................................................................................... 46
4.1.7 Effect of pre-ozonation on environmental profile of ceramic microfiltration..... 47
4.2 Normalisation ....................................................................................................... 48
Chapter 5 LCA: Interpretation and conclusions ............................................................. 51
5.1 Summary of LCA results ...................................................................................... 51
5.2 Sensitivity analysis ............................................................................................... 52
5.3 Consistency and completeness check ................................................................. 53
5.4 Conclusions, limitations and recommendations .................................................... 53
Chapter 6 Life Cycle Costing ......................................................................................... 56
6.1 Methodology ........................................................................................................ 56
6.2 Background data for investment costs ................................................................. 58
6.3 Background data for operating costs .................................................................... 65
6.4 Results of Life Cycle Costing ............................................................................... 67
6.5 Sensitivity analysis ............................................................................................... 71
6.6 Socio-economic impact of tertiary treatment ........................................................ 77
6.7 Summary ............................................................................................................. 81
Chapter 7 Summary of LCA and LCC ........................................................................... 82
7.1 Environmental and economic efficiency of processes for tertiary treatment ......... 83
Bibliography .................................................................................................................. 85
Appendix ....................................................................................................................... 88

viii
List of Figures FIGURE 1: LAYOUT OF REFERENCE SCENARIO ("STATUS QUO"): PUMPING OR UV IN SUMMER ................... 9
FIGURE 2: LAYOUT OF DUAL MEDIA FILTRATION + UV ................................................................................... 9
FIGURE 3: LAYOUT OF MICROSIEVE FILTRATION + UV .................................................................................. 10
FIGURE 4: LAYOUT OF POLYMER ULTRAFILTRATION + UV BYPASS ............................................................... 10
FIGURE 5: LAYOUT OF CERAMIC MICROFILTRATION WITH OPTIONAL PRE-OZONATION + UV BYPASS ....... 11
FIGURE 6: LAYOUT OF HIGH RATE SEDIMENTATION + UV ............................................................................ 12
FIGURE 7: SYSTEM BOUNDARIES OF LIFE CYCLE ASSESSMENT ..................................................................... 12
FIGURE 8: PROCESS DATA OF DUAL MEDIA FILTRATION + UV ...................................................................... 21
FIGURE 9: PROCESS DATA OF MICROSIEVE + UV ........................................................................................... 22
FIGURE 10: PROCESS DATA OF POLYMER UF + UV BYPASS ........................................................................... 24
FIGURE 11: PROCESS DATA OF CERAMIC MF + UV BYPASS ........................................................................... 27
FIGURE 12: PROCESS DATA OF HIGH RATE SEDIMENTATION + UV (MODELLED FROM SUPPLIER
INFORMATION) ..................................................................................................................................... 29
FIGURE 13: EUTROPHICATION POTENTIAL FOR FRESHWATER FOR TERTIARY TREATMENT PROCESSES ...... 42
FIGURE 14: FRESHWATER AQUATIC ECOTOXICITY POTENTIAL FOR TERTIARY TREATMENT PROCESSES ..... 43
FIGURE 15: CONTRIBUTION OF SPECIFIC HEAVY METALS TO FRESHWATER AQUATIC ECOTOXICITY
POTENTIAL IN REFERENCE SCENARIO ................................................................................................... 43
FIGURE 16: CUMULATIVE ENERGY DEMAND OF NON-RENEWABLE RESOURCES FOR TERTIARY TREATMENT
PROCESSES ............................................................................................................................................ 44
FIGURE 17: GLOBAL WARMING POTENTIAL FOR TERTIARY TREATMENT PROCESSES .................................. 45
FIGURE 18: ACIDIFICATION POTENTIAL FOR TERTIARY TREATMENT PROCESSES ......................................... 46
FIGURE 19: HUMAN TOXICITY POTENTIAL FOR TERTIARY TREATMENT PROCESSES..................................... 46
FIGURE 20: CONTRIBUTION OF DIFFERENT EMISSIONS TO HUMAN TOXICITY POTENTIAL OF REFERENCE
SCENARIO (LEFT) AND POLYMER UF (RIGHT) ........................................................................................ 47
FIGURE 21: NORMALISATION OF ENVIRONMENTAL INDICATORS: CONTRIBUTION OF TERTIARY
TREATMENT TO TOTAL ENVIRONMENTAL IMPACTS IN EU 27 (2000) .................................................. 48
FIGURE 22: NORMALISATION OF ENVIRONMENTAL INDICATORS (ZOOM): CONTRIBUTION OF TERTIARY
TREATMENT TO TOTAL ENVIRONMENTAL IMPACTS IN EU 27 (2000) .................................................. 49
FIGURE 23: NORMALISED ENVIRONMENTAL PROFILE OF SCENARIOS FOR TERTIARY TREATMENT ............. 50
FIGURE 24: PRIMARY INVESTMENT FOR TERTIARY TREATMENT SCHEMES AT WWTP RUHLEBEN .............. 69
FIGURE 25: OPERATIONAL COSTS PER M³ SECONDARY EFFLUENT FOR TERTIARY TREATMENT SCHEMES AT
WWTP RUHLEBEN ................................................................................................................................. 70
FIGURE 26: TOTAL ANNUAL COSTS OF TERTIARY TREATMENT SCHEMES AT WWTP RUHLEBEN ................. 71
FIGURE 27: SENSITIVITY OF ANNUAL COSTS TO INTEREST RATE ................................................................... 72
FIGURE 28: SENSITIVITY OF ANNUAL COSTS TO ELECTRICITY PRICE ............................................................. 72
FIGURE 29: SENSITIVITY OF ANNUAL COSTS TO LIFETIME OF CONSTRUCTION ............................................ 73
FIGURE 30: DESIGN VARIATIONS FOR MICROSIEVE FILTRATION .................................................................. 74
FIGURE 31: DESIGN VARIATIONS FOR POLYMER UF ...................................................................................... 75
FIGURE 32: DESIGN VARIATIONS FOR CERAMIC MF WITH AND WITHOUT PRE-OZONATION ...................... 76
FIGURE 33: AVOIDED COSTS OF DISEASES IN RELATION TO NUMBER OF SWIMMING EVENTS ................... 79
FIGURE 34: EXTERNAL COSTS OF AIR POLLUTION ASSOCIATED WITH PROCESSES FOR TERTIARY
TREATMENT .......................................................................................................................................... 80
FIGURE 35: ENVIRONMENTAL AND ECONOMIC EFFICIENCY OF DIFFERENT SCHEMES FOR TERTIARY
TREATMENT .......................................................................................................................................... 84
FIGURE 36: DESIGN OF MICROSIEVE FILTRATION + UV (VON DER WAYDBRINK 2012) ................................. 88
FIGURE 37: DESIGN OF HIGH-RATE SEDIMENTATION + UV (KWB 2013) ....................................................... 88

ix
List of Tables
TABLE 1: REFERENCE FLOW: QUALITY OF SECONDARY EFFLUENT AT WWTP RUHLEBEN (2006-2010) .......... 6
TABLE 2: QUALITY OF SECONDARY EFFLUENT FOR DRY WEATHER VOLUME AND PEAK FLOW VOLUME ...... 7
TABLE 3: LIST OF TERTIARY TREATMENT SCHEMES ......................................................................................... 8
TABLE 4: PHYSICAL SYSTEM BOUNDARIES OF THIS LCA ................................................................................ 13
TABLE 5: DATA QUALITY FOR PROCESS DATA AND BACKGROUND SYSTEM ................................................. 15
TABLE 6: ENVIRONMENTAL INDICATORS FOR IMPACT ASSESSMENT ........................................................... 17
TABLE 7: NORMALISATION DATA FOR EU-27 IN REFERENCE YEAR 2000 ...................................................... 18
TABLE 8: CLEANING STRATEGY AND CHEMICAL DEMAND FOR POLYMER UF .............................................. 25
TABLE 9: CLEANING STRATEGY AND CHEMICAL DEMAND FOR CERAMIC MF .............................................. 27
TABLE 10: MATERIAL FOR INFRASTRUCTURE OF TERTIARY TREATMENT SCHEMES ..................................... 33
TABLE 11: POWER MIX FOR ELECTRICITY PRODUCTION ............................................................................... 34
TABLE 12: LCI DATASETS FOR CHEMICALS PRODUCTION .............................................................................. 36
TABLE 13: HEAVY METAL CONTENT IN COAGULANTS ................................................................................... 36
TABLE 14: LCI DATASETS FOR MATERIALS FOR INFRASTRUCTURE................................................................ 38
TABLE 15: ELECTRICITY DEMAND OF TERTIARY TREATMENT SCHEMES ....................................................... 39
TABLE 16: CHEMICALS DEMAND OF TERTIARY TREATMENT SCHEMES ........................................................ 40
TABLE 17: ANNUAL EFFLUENT LOADS OF TERTIARY TREATMENT SCHEMES ................................................ 41
TABLE 18: VARIATION OF INVENTORY DATA AND RELATED INFLUENCE ON LCA INDICATORS .................... 52
TABLE 19: ECONOMIC LIFETIMES OF INVESTMENT GOODS .......................................................................... 57
TABLE 20: DESIGN DATA OF DUAL MEDIA FILTRATION ................................................................................. 59
TABLE 21: DESIGN DATA OF MICROSIEVE FILTRATION ................................................................................. 59
TABLE 22: DESIGN DATA OF HIGH RATE SEDIMENTATION ............................................................................ 60
TABLE 23: DESIGN DATA OF POLYMER UF ..................................................................................................... 61
TABLE 24: DESIGN DATA OF CERAMIC MF .................................................................................................... 62
TABLE 25: DESIGN DATA OF UV DISINFECTION ............................................................................................. 63
TABLE 26: INVESTMENT COSTS FOR TERTIARY TREATMENT SCHEMES AT WWTP RUHLEBEN ..................... 64
TABLE 27: SPECIFIC COST DATA FOR ELECTRICITY AND CHEMICALS ............................................................. 65
TABLE 28: OPERATING COSTS FOR TERTIARY TREATMENT SCHEMES AT WWTP RUHLEBEN ....................... 68
TABLE 29: PARAMETERS FOR EXPOSURE ASSESSMENT OF SWIMMERS FOR DIFFERENT PATHOGENS ........ 78
TABLE 30: ATMOSPHERIC EMISSIONS ASSOCIATED WITH TERTIARY TREATMENT SCHEMES ....................... 80
TABLE 31: SUMMARY OF LCA AND LCC RESULTS FOR TERTIARY TREATMENT SCHEMES ............................. 83

x
List of Abbreviations
ABS - Acrylonitrile-butadiene-styrene copolymer
BWB - Berliner Wasserbetriebe
BWD - Bathing Water Directive
CEB - Chemically enhanced backwash
CIP - Cleaning in place
COD - Chemical oxygen demand
cfu - colony forming units
EU - European Union
FU - Functional unit
GHG - Greenhouse gases
GRP - Glass-fibre reinforced plastic
HRT - Hydraulic retention time
ISO - International Standardisation Organization
KFAKR- Kapitalwiedergewinnungsfaktor (capital recovery factor)
KWB - Kompetenzzentrum Wasser Berlin
LCA - Life Cycle Assessment
LCC - Life Cycle Costing
LCI - Life Cycle Inventory
LCIA - Life Cycle Impact Assessment
MF - Microfiltration
MJ - Megajoule
MPN - Most probable number
MS - Microsieve
P - Phosphorus
peCOD - Population equivalent (related to COD influent load)
PES - Polyethersulfone
PVC - Polyvinylchloride
SS - Suspended solids
TP - Total phosphorus
UF - Ultrafiltration
UV - Ultraviolet
WFD - Water Framework Directive
WWTP - Wastewater treatment plant

1
Chapter 1
Introduction and layout of the study
Triggered by the EU Water Framework Directive (WFD) (EU 2000), new requirements for improving water quality of rivers and lakes are imposed throughout Europe. In Germany, as in most European countries, many surface waters do not yet meet the “good ecological and chemical status” as defined in the WFD, particularly due to hydromorphological deficiencies and chemical quality. Following a comprehensive assessment of the status quo in water quality and emissions across river basins, new targets for emission reduction into surface waters have been set in river basin management plans to improve the chemical quality of rivers and lakes.
In the Berlin-Brandenburg area in eastern Germany, a concept for reduction of nutrient emissions into surface waters has been elaborated by water authorities, targeting a further reduction of phosphorus emissions as a major cause of eutrophication (SenStadt/MUGV 2011). Phosphorus emissions into Berlin rivers and lakes originate both from upstream emissions arriving from Brandenburg and from point sources within the Berlin area, namely the effluent of wastewater treatment plants (WWTP), rain water runoff, and combined sewer overflows. Thus, a further reduction of phosphorus concentration in WWTP effluents of Berlin will be required to reach the overall goals of the WFD.
For the WWTP Ruhleben treating the wastewater of 1.6 Mio population equivalents (pe), the Berlin water authorities have demanded the future implementation of a tertiary treatment stage for advanced removal of phosphorus. However, the resulting new discharge standard has not been fixed yet, with discharge limits of 120, 80 or even 50 µg/L total phosphorus (TP) (85%ile of grab samples) as possible options depending on the applied technology for tertiary treatment.
In addition, further requirements arise from the discharge of the effluent of WWTP Ruhleben into the river Spree/Havel, affecting the hygienic quality of highly-frequented bathing waters downstream (e.g. Berlin Wannsee). The EU Bathing Water Directive (BWD) defines a minimum hygienic quality to be guaranteed in these bathing waters during the summer season of April-September (EU 2006). For historical reasons (division of Berlin into eastern and western sector), a pressure pipeline of 18 km has been operated during the summer period to discharge the effluent of WWTP Ruhleben (dry weather peak flow) further downstream, thus bypassing the Berlin bathing waters. However, an upgrade of the WWTP with a desinfection step operating during the summer season would enable the discharge of the effluent into the river Spree/Havel throughout the entire year, thus ending the need for costly operation of the pressure pipeline and protecting all bathing sites downstream of the WWTP.
Tertiary treatment for WWTP Ruhleben: research projects
Due to the new requirements, the WWTP Ruhleben will be upgraded with a tertiary treatment stage in the near future to reach the targets of advanced phosphorus removal and seasonal disinfection. As different technological options are principally suitable to fulfill these targets, several research projects have been initiated in the planning phase to validate process performance and stability of the different options in pilot tests. These

2
research projects should provide valid information and process data for a variety of process options to support the planning and legislative regulation of the WWTP upgrade. In detail, the tested configurations for tertiary treatment include the following:
• Coagulation + dual media filtration + UV disinfection
• Coagulation + microsieve filtration + UV disinfection
• Coagulation + membrane ultrafiltration with polymer membranes
• Coagulation + membrane microfiltration with ceramic membranes
While the first option has been tested extensively in the research project “Raumfiltration” of Berliner Wasserbetriebe (BWB), the latter three options have been assessed in the research project “OXERAM2” (2010-2013) led by Kompetenzzentrum Wasser Berlin (KWB). Besides the technical assessment of the three process configurations in long-term pilot trials in technical scale (10-30 m³/h), all available process options are assessed in their environmental and economic impacts to provide sound background information for the planning process. The present report summarizes the results of the environmental and economic assessment within the research project “OXERAM2”.
During the pilot trials, it was found that the effluent quality of all tested processes would at least guarantee the discharge limit of 80 µg/L TP. Hence, no process option for the highest possible level of discharge concentration (< 120 µg/L TP) has been tested, which would leave this option without a representative process configuration in the assessment. Thus, it is decided to complement the processes listed above with a theoretical calculation for the process “coagulation + high rate sedimentation + UV disinfection” based on supplier information. It has to be emphasized that this option has not been tested in pilot trials at WWTP Ruhleben, and the presented results for this process are based on extrapolation of supplier information to the case of WWTP Ruhleben. This fact is indicated throughout the report by tagging the respective diagrams as “model” results.
Life-cycle based environmental and economic assessment
The various processes for tertiary treatment differ in their P removal efficiency, investment and operational costs, and energy and material demand for construction and operation of the processes. From an environmental point of view, additional impacts due to energy and chemical demand for tertiary treatment should be carefully balanced against the environmental benefits in terms of improved effluent quality to end up with a sustainable solution for the overall system. Typically, local environmental benefits of improved surface water quality (less P emissions) come at the cost of additional demand of resources (fossil fuels, ores) and environmental emissions (greenhouse gases, air pollutants) caused by the advanced treatment. From an economic point of view, the available options for tertiary treatment will have distinct differences in terms of total annual costs, which should also be taken into account while planning a tertiary treatment stage to keep the additional financial burden within reasonable limits.
For the holistic environmental and economic assessment of all options for tertiary treatment, life-cycle based tools are a suitable approach for a comprehensive

3
comparison of technical systems. Looking at their entire “life cycle”, all relevant processes upstream and downstream of the system under investigation are included into the assessment, thus providing a thorough picture of the total environmental or economic impacts associated with the system.
For the environmental assessment, this study applies the methodology of Life Cycle Assessment (LCA). This tool enables the systematic quantification of all direct and indirect environmental impacts, following a standardized framework as defined in ISO 14040/44 (ISO 14040 2006; ISO 14044 2006). With an adequate definition of system boundaries and a detailled modelling of all relevant inputs and outputs in a substance flow model (life cycle inventory), the technical system can be described in its most relevant potential environmental impacts over the whole “life cycle”. Results of an LCA are expressed in selected environmental indicators, enabling the comparison of different options in various environmental categories. Building upon long-term pilot trials of the respective technologies, this paper presents the results of an LCA for different options of tertiary treatment at WWTP Ruhleben, describing the basics of the methodological approach, the underlying process data, and finally the LCA results in terms of environmental indicators.
The economic assessment is based on the same inventory data as the LCA in terms of operational expenses (electricity, chemicals, spare parts, and sludge disposal) and infrastructure. Using the approach of Life Cycle Costing, total annual costs are calculated for each process option to reflect all cost categories which are relevant for the operating utility.
Structure of this report
In accordance to the methodologies listed above, this report consists of the following parts:
• Life Cycle Assessment: the first chapters follow the structure of the ISO standard for LCA, giving information on the goal and scope definitions (Chapter
2), the life cycle inventory (Chapter 3), the life cycle impact assessment (Chapter
4), and the interpretation of the results (Chapter 5)
• Life Cycle Costing: the methodological background and results of the economic assessment are described in detail in Chapter 6, including also an estimation of the socio-economic impacts of tertiary treatment
• Summary of LCA and LCC: results of the environmental and economic assessment are summarized and discussed in Chapter 7

4
Chapter 2
LCA: Definition of goal and scope
2.1 Goal and target group
The goal of this LCA study is the comparison of different treatment schemes for advanced removal of phosphorus and disinfection of the secondary effluent of WWTP Ruhleben in their environmental impacts. Within this LCA, the environmental benefits and additional impacts of a tertiary treatment stage at WWTP Ruhleben are quantified for different treatment technologies based on process data of pilot trials at wastewater treatment plants of BWB (annual mean values).
The results of this LCA should support the decision making of Berliner Wasserbetriebe and the Berlin water authorities (Berliner Senat, Senatsverwaltung für Stadtentwicklung und Umwelt) regarding the choice of technology for future implementation of a tertiary treatment stage at the WWTP Ruhleben. Thus, the economic analysis (cf. Chapter 6) is complemented by quantitative information on the environmental impacts and benefits of the treatment schemes to address both economic and ecological impacts of the different technologies.
Therefore, the primary target group for the results of this LCA are the wastewater professionals at Berliner Wasserbetriebe (Departments of R&D (BWB-FE), Planning (BWB-GI and BWB-PB), and Wastewater Operations (BWB-AE)) and the relevant members of the administration at the Berlin Senate. Additionally, the results of this LCA may be as well interesting for other wastewater professionals (operators, water authorities) planning to implement a tertiary treatment stage and scientists working in the field of wastewater treatment and LCA.
2.2 Function and functional unit
The function of the investigated tertiary treatment schemes encompasses two different effects on the quality of the secondary effluent of WWTP Ruhleben:
1. The extended removal of phosphorus from the secondary effluent via chemical coagulation and separation of flocs, enabling the fulfillment of discharge standards of at least 120 µg/L of total phosphorus (85%ile of 2h grab samples) in the final effluent throughout the entire year
2. The disinfection of secondary effluent during the summer period (1. April – 30. September, equaling 50% of the total annual flow) to safely comply to the limits of the EU bathing water directive (EU 2006) for good bathing water quality (< 1000 cfu/100 mL Escherichia coli (90%ile) and < 400 cfu/100 mL of intestinal enterococci (90%ile)) in the WWTP effluent
Due to the limited hydraulic capacity of the existing process at WWTP Ruhleben, the return flow of each of the tertiary treatment schemes (from filter backwash, cleaning etc.) should not exceed 5 Vol-% of the maximum hydraulic capacity of the WWTP as defined by BWB (BWB-GI 2012). Hence, the maximum hydraulic capacity of the tertiary treatment is set to 7.4 m³/s (105% of 7 m³/s) for the layout of the process.

5
To reflect both primary functions properly, the functional unit (FU) of this LCA is defined as follows: “the tertiary treatment of a wastewater volume per population equivalent and
year, related to the original organic load as chemical oxygen demand (COD) of the
WWTP in the influent [peCOD*a]-1”.
The mean annual organic load of WWTP Ruhleben is defined as 1,6 Mio population equivalents (pe), using the mean daily load of 120 g COD/(pe*d) as defined by ATV-A131 (ATV 2000). This functional unit reflects the environmental impacts of tertiary treatment per person and year, related to the number of people whose wastewater is treated at WWTP Ruhleben. Thus, the results of this LCA can be properly compared to other LCA studies describing the environmental impacts of tertiary treatment, other advanced treatment schemes, or wastewater treatment plants in general, relating to the overall treatment capacity in peCOD.
Alternatively, the function of phosphorus removal could also be related directly to the removed amount of phosphorus in tertiary treatment [kg Premoved]
-1, which then takes into account the different effluent qualities of the compared treatment schemes.
2.3 Reference input flows
The reference input flow is defined by the mean effluent quality of the secondary clarifier at WWTP Ruhleben (24h-mixed samples) in the years 2006-2010 (Table 1). Due to the high variation of volume between different years (mainly depending on the specific rainfall intensity), a daily volume of 240,000 m³ is set for the calculation of the mean loads. For both periods of operation in winter period (Oct-Mar) and summer period (Apr-Sep), total influent volume is estimated to equal 50% of total annual flow.
For the composition of the input, the secondary effluent is characterized in terms of suspended solids, chemical oxygen demand (COD) and phosphorus. For information, the residual total phosphorus (TP) in the secondary effluent is split into the fractions of particulate phosphorus (Pparticulate), dissolved ortho-phosphate (PO4-P) and a non-reactive fraction of phosphorus which can only be partially eliminated via chemical coagulation (soluble non-reactive P). Additionally, heavy metals are included in the LCA to properly reflect positive side-effects of tertiary treatment for removal of inorganic pollutants. Organic micro-pollutants (e.g. pharmaceuticals, industrial chemicals) are not included in the assessment due to lack of data both on their fate during tertiary treatment and on environmental impact assessment. In analogy, microbial contamination of secondary effluent is not evaluated in environmental impact assessment due to lack of characterisation factors, but is only used for layout of disinfection processes in relation to target values.
In this study, tertiary treatment processes with high hydraulic flexibility are designed to treat the total effluent of WWTP Ruhleben including hydraulic peak flow events up to 7.4 m³/s during maximum rain weather flow. In contrast, membrane-based filtration processes are designed to treat only the dry weather peak flow (< 4.5 m³/s) to prevent installation of costly equipment without adequate exploitation of its capacity over time. For the membrane schemes, a bypass will be installed for the excess flow > 4.5 m³/s which will not be treated for phosphorus removal, but only with UV disinfection.

6
Table 1: Reference flow: quality of secondary effluent at WWTP Ruhleben (2006-2010)
Concentration1 Annual load Load per
functional unit (FU)
Volume 240,000 m³/d 87,6 Mio m³/a 54.75 m³/(peCOD*a)
Suspended solids 5.3 mg/L 466 t/a 292 g/(peCOD*a)
COD 41 mg/L 3607 t/a 2255 g/(peCOD*a)
Total phosphorus 0.32 mg/L 28.3 t/a 17.7 g/(peCOD*a)
Pparticulate 0.14 mg/L 12.4 t/a 7.8 g/(peCOD*a)
PO4-P 0.11 mg/L 9.8 t/a 6.1 g/(peCOD*a)
Soluble non-react. P 0.07 mg/L 6.1 t/a 3.8 g/(peCOD*a)
Cadmium2 0.4 µg/L 35 kg/a 22 mg/(peCOD*a)
Chromium² 1.9 µg/L 167 kg/a 104 mg/(peCOD*a)
Copper 10.1 µg/L 884 kg/a 553 mg/(peCOD*a)
Nickel 4.6 µg/L 403 kg/a 252 mg/(peCOD*a)
Mercury² 0.1 µg/L 8 kg/a 5 mg/(peCOD*a)
Lead² 6.1 µg/L 535 kg/a 335 mg/(peCOD*a)
Zinc 29.1 µg/L 2550 kg/a 1594 mg/(peCOD*a)
E.coli 106 MPN/
100 mL
Enterococci 105
Source: (BWB-AE 2012)
1 24h-mixed samples
2 measured samples are all below limit of quantification (LOQ), LOQ/2 for mean value calculation
This aspect has to be taken into account by splitting the annual load of the tertiary treatment schemes in a dry weather load (< 4.5 m³/s) and a peak flow load (> 4.5 m³/s) to enable an adequate representation of the bypass situation in membrane schemes (Table 2). From hydraulic profiles of 2006-2010 (BWB-AE 2012), the volume of water exceeding the dry weather peak flow (> 4.5 m³/s) is calculated to 2.4 Mio m³/a or 2.7% of the total annual volume. The quality of this “peak flow volume” is estimated from sampling data of 24h-mixed samples during rain weather days (rainfall > 1mm/d). For very high peak flows (> 5 m³/s, equaling a volume of 1.5 Mio m³/a), a further increase in phosphorus concentration of secondary effluent from 0.35 mg/L TP to 0.44 mg/L TP is estimated due to temporary decrease of phosphorus elimination efficiency following high hydraulic loading of the WWTP (BWB-AE 2012).

7
Table 2: Quality of secondary effluent for dry weather volume and peak flow volume
Dry weather volume
(up to 4.5 m³/s)
Peak flow volume
(> 4.5 up to 7.4 m³/s)
Concentration Annual load Concentration Annual load
Volume 85.2 Mio m³/a 2.4 Mio m³/a
Suspended solids 5.3 mg/L 451.6 t/a 6.2 mg/L 14.8 t/a
COD 41.2 mg/L 3511 t/a 40.4 mg/L 97 t/a
Total phosphorus 0.32 mg/L 27.3 t/a 0.35* mg/L 1.0* t/a
Pparticulate 0.14 mg/L 11.9 t/a 0.17* mg/L 0.5* t/a
PO4-P 0.11 mg/L 9.4 t/a 0.11* mg/L 0.3* t/a
Soluble non-react. P 0.07 mg/L 6.0 t/a 0.07 mg/L 0.2 t/a
Cadmium 0.4 µg/L 34 kg/a 0.4 µg/L 1 kg/a
Chromium 2.9 µg/L 162 kg/a 2.0 µg/L 5 kg/a
Copper 10.1 µg/L 861 kg/a 9.8 µg/L 23 kg/a
Nickel 4.6 µg/L 392 kg/a 4.5 µg/L 11 kg/a
Mercury 0.9 µg/L 7.7 kg/a 0.9 µg/L 0.2 kg/a
Lead 6.1 µg/L 520 kg/a 6.5 µg/L 16 kg/a
Zinc 29 µg/L 2471 kg/a 33 µg/L 79 kg/a
E.coli 106 MPN/ 100 mL
107 MPN/
100 mL
Enterococci 105 106
* for high peak flows (> 5 m³/s, 1.5 Mio m³/a), an increase in P effluent concentration to 0.22 mg/L Pparticulate
and 0.15 mg/L PO4-P is estimated (BWB-AE 2012)
2.4 System expansion
The investigated tertiary treatment schemes in this LCA do not provide additional functions or products which would require an expansion of the system boundaries for the goal of this study. All primary functions of the systems are properly reflected in the impact assessment (advanced removal of phosphorus, reducing the freshwater eutrophication potential) or are comparable between all systems per definition (disinfection to bathing water quality during summer period). Additional benefits of tertiary treatment (improved removal of particulate matter with adsorbed heavy metals) are reflected in the respective environmental indicator (reduction in aquatic ecotoxicity). A possible side-effect of enhanced removal of residual organic micropollutants (e.g. pharmaceuticals, personal care products, industrial chemicals, …) from secondary effluent cannot be quantified in this study due to the lack of primary data on possible efficiencies of tertiary treatment and adequate characterisation factors for respective organic substances in the impact assessment.

8
2.5 Description of the investigated scenarios
This study compares different schemes for tertiary treatment in their environmental impacts. The following chapter describes both the existing practice of secondary effluent discharge (“status quo”) and all assessed schemes for tertiary treatment in their basic process layout (Table 3). While the study compares different technologies for P removal, additional disinfection is provided only by UV treatment, excluding other possible disinfection technologies from the assessment. For all process-related data, detailed documentation is provided in Chapter 3.
Table 3: List of tertiary treatment schemes
Scenario Description Main data source
Pumping or UV in
summer (reference)
Status quo (2012): pumping via pressure pipeline or UV disinfection
Full-scale data 2012
Dual media filter + UV In-line coagulation + dual media filtration + UV disinfection
Pilot trials (BWB 2012)
Microsieve + UV Coagulation + flocculation + microsieve filtration + UV disinfection
Pilot trials (KWB 2013)
Polymer UF + UV In-line coagulation + ultrafiltration + UV disinfection in bypass
Pilot trials (KWB 2013)
Ceramic MF + UV In-line coagulation + microfiltration + UV disinfection in bypass
Pilot trials (KWB 2013)
Ceramic MF + O3 + UV Pre-ozonation + in-line coagulation + microfiltration + UV disinf. in bypass
Pilot trials (KWB 2013)
High rate sedi + UV Coagulation + flocculation + high rate sedimentation + UV disinfection
Model estimate
2.5.1 Reference (“status quo”): Pumping or UV in summer
The existing system is historically grown from the local discharge situation of the WWTP Ruhleben. While the effluent is discharged directly into the river Spree in winter, a pumping station for dry weather capacity (< 4.5 m³/s) is operated in summer which delivers the main amount of the secondary effluent (73.3% of summer flow, 37% of annual flow) via a pressure pipe (18km) into the Teltowkanal in the south of Berlin. Thus, the highly-frequented bathing waters downstream of the WWTP (“untere Havel”) are bypassed in the bathing season to prevent hygienic hazards due to potentially pathogenic microorganisms in the WWTP effluent. Recently, a UV disinfection stage has been implemented at WWTP Ruhleben treating a part of the effluent (1 m³/s, equalling 24% of summer flow or 12% of annual flow) in summer for direct discharge into the river Spree to reduce the hydraulic load of the pipeline.

9
Figure 1: Layout of reference scenario ("status quo"): pumping or UV in summer
2.5.2 Dual media filtration + UV
In this scheme, secondary effluent is lifted from the effluent channel with a pumping station, treated via in-line coagulation (dosing of coagulant in feed pipe), and filtered in a gravity-driven dual media filtration stage (Figure 2). Filter cleaning is done by regular backwash with filtrate, and backwash water containing separated solids is returned to the WWTP influent.
For disinfection, filter effluent is treated in a subsequent UV disinfection stage before discharge into the river during the summer season. In winter, filter effluent is directly discharged into the river.
Figure 2: Layout of dual media filtration + UV
2.5.3 Microsieve + UV
For the microsieve scheme, secondary effluent is lifted from the effluent channel with a pumping station and treated via coagulation and flocculation (Figure 3). Coagulant is dosed in pump station effluent which is then mixed in coagulation tanks (hydraulic retention time (HRT) > 1 min) using a draft tube reactor (TurboMix™) for building of micro-flocs. After coagulation, polymer is dosed into the treated effluent which is again mixed by a mechanical stirrer in a flocculation tank (HRT > 4 min). After flocculation, treated effluent is filtered in microsieve filtration units (10 µm mesh). Microsieves are equipped with automatic backwash units driven by rising hydraulic gradients through filtration media. Backwash water containing separated solids is returned to the WWTP influent.

10
Comparable to dual media filtration, filter effluent is treated in a subsequent UV disinfection stage before discharge into the river during the summer season. In winter, filter effluent is directly discharged into the river.
Figure 3: Layout of microsieve filtration + UV
2.5.4 Polymer Ultrafiltration + UV bypass
In this scheme, secondary effluent is first screened to prevent damage to the subsequent membrane stage. After screening, coagulant is dosed in-line before treated effluent is filtered in ultrafiltration (UF) modules using organic polymer membranes (Figure 4). Besides removal of coagulated solids, membrane filtration provides reliable removal of microorganisms to comply with bathing water standards in the effluent. UF modules are operated with automatic backwash based on a defined maximum pressure loss through the membrane, and backwash water is returned to WWTP influent.
In regular intervalls, chemically enhanced backwash (CEB) is applied by soaking membranes in a chemical solution for 1h to prevent the build-up of organic and inorganic fouling of the membranes. Additionally, membranes are cleaned intensively from time to time in a multi-step cleaning in place (CIP) using various chemicals, heat (40°C) and prolonged soaking time of 24h to restore the original hydraulic capacity of the modules.
Due to the limited hydraulic flexibility of the membrane stage, a bypass is operated during peak flow events for flows > 4.5 m³/s (2.7% of annual flow, cf. chapter 2.3). This bypass is treated with UV disinfection in the summer period to guarantee bathing water quality of the total effluent volume, while it is directly discharged into the river in winter.
Figure 4: Layout of polymer ultrafiltration + UV bypass

11
2.5.5 Ceramic Microfiltration with optional pre-ozonation + UV bypass
For the ceramic microfiltration, secondary effluent is screened to prevent damage for the membrane filtration unit downstream. After screening, in-line coagulation is used to add coagulant before treated effluent is filtered in microfiltration (MF) modules using inorganic ceramic membranes (Figure 5). Due to the ozone-resistant material of the MF modules, an optional pre-ozonation step can be applied in this scheme which can have a positive effect on fouling behaviour of the ceramic membrane downstream. Both scenarios with and without pre-ozonation will be calculated to show the effect of the pre-treatment on the environmental profile of the process.
The ceramic MF modules are cleaned via automatic backwash triggered by a maximum defined pressure loss across the membrane. Backwash water containing filtered solids is returned to the WWTP influent. Comparable to the polymer UF system, the ceramic membranes are regularly cleaned by chemically enhanced backwash (CEB) to prevent organic and inorganic fouling, while full hydraulic capacity is restored from time to time with multi-step cleaning in place (CIP) using various chemicals, heat (40°C) and enhanced soaking time (24h).
Due to the limited hydraulic flexibility of the membrane stage, a bypass is operated during peak flow events for flows > 4.5 m³/s (2.7% of annual flow, cf. chapter 2.3). This bypass is treated with UV disinfection during summer period in analogy to the Polymer ultrafiltration scheme.
Figure 5: Layout of ceramic microfiltration with optional pre-ozonation + UV bypass
2.5.6 High rate sedimentation + UV
In this scenario, WWTP effluent is treated via coagulation and flocculation prior to high rate sedimentation of the flocs in a tank equipped with parallel plates. Residence times in coagulation and flocculation tank are both >4 min. For high upflow velocities up to 50 m/h (= compact design) in the sedimentation tank, micro-sand (Ø 120 µm) is introduced in the flocculation stage to serve as ballast inside the flocs and increase density and settling properties. Microsand is removed via sludge and separated from flocs with a hydro-cyclone before recycling to the flocculation tank. Effluent of the sedimentation tank is then treated via UV disinfection during the summer period.

12
Figure 6: Layout of high rate sedimentation + UV
2.6 System boundaries
Physical system boundaries are defined according to the goal of the study, i.e. the comparison of different schemes for tertiary treatment of WWTP effluent. Consequently, the LCA includes all relevant processes of tertiary treatment and disinfection schemes, starting with the secondary effluent of WWTP Ruhleben up to the discharge into surface waters (“core system”). For these processes, all necessary operational inputs from the economy (“background system”) are included within the system boundaries, i.e. the production of electricity, the production of chemicals or additives as well as their transport from the production facility to the WWTP (Figure 7). Additionally, the expenditures for the infrastructure of tertiary treatment schemes are included into the assessment, covering production, transport and disposal of building materials and the energy demand for excavation. Electricity and materials production and transport cause “indirect” emissions which do not take place at the WWTP site. In contrast, emissions from the core system (i.e. into surface waters) are accounted as “direct” emissions in this LCA.
Secondary
effluent
of WWTP
Ruhleben
Discharge
to surface
waters
Production and
transport of
chemicals
Infrastructure for tertiary
treatment: Production and
disposal of materials,
excavation
To WWTP
influent
Backwash water
Water volume
(hydraulic load)
Filtration +
disinfection
Electricity
productionSystem
boundaries
Core system with
direct emissionsBackground system with
indirect emissions
Figure 7: System boundaries of Life Cycle Assessment

13
Within the core system, the flow of secondary effluent between the process stages is characterized according to the reference flow (cf. chapter 2.3) in terms of volume, suspended solids, chemical oxygen demand, total phosphorus, and heavy metals. Consequently, “direct” emissions via the effluent of tertiary treatment into surface waters are defined with the same chemical parameters.
The backwash water of tertiary treatment units contains the filtered solids (COD, TP, heavy metals) which are returned to the WWTP inlet. As the WWTP process itself is not included in this assessment, the final disposal of the filtered solids via sludge treatment of the WWTP is not taken into account in this LCA. Due to the recycling of the backwash water upstream, secondary effluent of the WWTP will probably be affected both in quality and volume. The qualitative effect on secondary effluent (i.e. its concentration of COD, TP) cannot be estimated without detailed modelling of the bio-chemical WWTP process, and it is consequently neglected in this LCA. In other words, the recycling of backwash water is supposed not to alter the quality of the secondary effluent (= influent to tertiary treatment). However, the volume of backwash water will certainly increase the volume which has to be treated in the tertiary stage, and this hydraulic effect can be described straighforward by adding the volume of backwash water to the influent volume of tertiary treatment. In summary, the hydraulic effect of recycling backwash water is taken into account, while the quality effect of backwash water (COD, TP) and the disposal of the sludge are neglected.
For the background system, production and transport of electricity and chemicals as well as production, transport and disposal of building materials are included in the LCA, characterised by indirect emissions as defined in the respective datasets. Infrastructure of the reference system (existing pumping station and UV system) is not accounted, because these facilities already exist. Expenditures for maintenance of systems are excluded from this LCA except for major spare parts (UV lamps, membranes, filter panels).
Table 4: Physical system boundaries of this LCA
Included in the LCA Not included in the LCA
Core system Emissions into surface waters via effluent discharge
Disposal of sludge
- backwash water
recycling
Hydraulic effect on tertiary treatment
Potential quality effect (COD, TP) on tertiary treatment influent
Background system
Electricity production, chemicals production and transport, production, transport and disposal of building materials for infrastructure, excavation
Infrastructure of reference system, maintenance (except major spare parts)

14
With regard to the geographical and temporal scope of the study, this LCA relates to the WWTP Ruhleben in 2012. Process data of the core system (chemical dosing, electricity demand, cleaning strategies etc.) is directly adjusted to the conditions at WWTP Ruhleben, based on the results of long-term pilot trials with real secondary effluent. Background data for electricity, chemicals and materials is related to average German conditions if possible (e.g. German power mix) or else to European conditions.
Thus, results of this LCA study may not be directly transferable to other WWTPs of BWB (refering to specific quality of secondary effluent and local conditions, e.g. hydraulic profiles) or other WWTPs in Germany and elsewhere. However, major trends and statements of this study can serve as orientation for adding a tertiary treatment step to other WWTPs comparable in effluent quality and size.
2.7 Data quality
The goal of this study is the comparison of different schemes for tertiary treatment specifically related to the WWTP Ruhleben, based on annual mean data. Hence, primary data for the different processes should represent the conditions at this plant both in terms of average process performance and site conditions. Therefore, extensive pilot trials have been conducted for microsieve (18 months) and membrane operation (24 months) (KWB 2013) as well as for dual media filtration (12 months) (BWB 2012) to collect representative primary data for the assessment.
Operational data for the core system in terms of required inputs (electricity, chemicals) and efficiency (effluent quality, backwash water) is based on long-term pilot trials using industrial-scale filtration units and real secondary effluent of WWTP Ruhleben except for dual media filtration, where information is extrapolated from pilot trials at WWTP Münchehofe. Thus, representativity and robustness of these data is estimated to be high, although results of pilot trials have to be scaled up from pilot to full scale in terms of electricity demand and design of infrastructure. Up-scaling of process data has been validated with different experts from supplier companies (Hydrotech 2012, Inge 2012, VWS 2012a) and planning department of Berliner Wasserbetriebe (BWB-GI 2012). For high rate sedimentation, process data is estimated from supplier information (VeoliaDT 2012) and a simple model for prediction of effluent quality based on suspended solid concentration. Here, both representativeness and robustness of the input data are limited and should be communicated accordingly.
For the background system, data is collected for average German or EU conditions depending on the availability in the LCA database (Table 5). Overall, data quality of the study is expected to allow a highly representative comparison of tertiary treatment schemes for the WWTP Ruhleben.
Based on the extensive documentation of the inventory data in this report (cf. Chapter 3) and the use of a common database for the background system, the reproducibility of the results is estimated to be high. Uncertainty of the input data is not quantitatively reflected within the results of this LCA. In general, the prospective nature of this study requires the careful extrapolation of data from results of pilot trials, amended and validated by expert judgements and best estimates. Thus, uncertainty of process data includes both uncertainty of pilot plant data (e.g. seasonal variation, modes of operation, operational problems) and uncertainty of extrapolation and up-scaling. Finally, it was decided to omit quantitative calculation of uncertainty due to the unpredictable impacts on pilot plant data

15
and asymetric quality of the process data. However, aspects of uncertainty will be qualitatively discussed in the interpretation of the results.
Table 5: Data quality for process data and background system
Data source Representativeness
Process data of dual media filtration, microsieve, membranes, and UV
Effluent quality Long-term pilot trials* WWTP Ruhleben
Backwash water Long-term pilot trials* WWTP Ruhleben
Electricity demand Upscaling based on pilot trials* WWTP Ruhleben
Chemicals demand Long-term pilot trials* WWTP Ruhleben
Infrastructure Design based on pilot trials* WWTP Ruhleben
Process data for high rate sedimentation
Effluent quality Modelling limited
Electricity + chemicals Supplier limited
Background system
Electricity production German power mix + database** Germany
Chemicals production Database** + estimates Germany or EU
Transport Database** + estimates EU
Building materials Database** Germany or EU
* KWB 2013 and BWB 2012 ** Ecoinvent 2010
2.8 Allocation
For the core system, primary functions of the systems (= tertiary treatment of WWTP effluent) are comparable between all scenarios for tertiary treatment, encompassing both advanced phosphorus removal and disinfection. Hence, allocation of environmental impacts to either P removal or disinfection is not required within the scope of this study.
However, allocation of environmental impacts to single functions may be required if the results of this study are compared with other studies in this field which serve only one of these functions (e.g. only P removal or only disinfection). Allocation for schemes with UV treatment may be done rather simple by dividing environmental impacts into processes for P removal (coagulation + filtration) and disinfection (UV), although filtration processes have a positive impact on downstream UV treatment (enhanced transmission). For membrane processes, P removal and disinfection is achieved in the same treatment step, so allocation of environmental impacts to only one of these functions is rather difficult.

16
For the background system, allocation procedures (e.g. for chemicals production with several products) are described within the respective datasets.
2.9 Indicators of Life Cycle Impact Assessment
This LCA uses a midpoint-oriented approach for impact assessment, mainly based on the indicator models described in the Dutch LCIA method ReCiPe 2008 (Goedkoop et al. 2009), reporting the impacts on the physical effect level of the respective category of environmental concern. The use of midpoint indicators gives a detailed picture of all relevant fields of environmental impact without further aggregation of the results along the cause-effect chain (“endpoint”). By neglecting the endpoint aggregation, this type of impact assessment allows tracking of the contribution of individual processes and emissions towards specific categories of environmental impact (e.g. carbon footprint). Thus, a detailed analysis of benefits and drawbacks of the different processes can be accomplished, connecting process specifications directly to environmental effects.
In detail, six categories of environmental concern are selected for the impact assessment in this LCA, described by six midpoint indicators (Table 6):
• Cumulative energy demand of non-renewable ressources as a robust screening indicator for the overall energy demand of fossil and nuclear fuels
• Global warming describing the anthropogenic impact on the global climate and representing a major concern of environmental politics
• Acidification of terrestrial ecosystems through atmospheric acid-forming pollutants from industrial processes
• Eutrophication of freshwaters by emissions of phosphorus, representing the primary environmental benefit of the systems under study, i.e. the extended removal of phosphorus
• Human toxicity which relates to all environmental emissions and their direct or indirect negative impact on human health
• Freshwater aquatic ecotoxicity describing additional benefits of tertiary treatment for the aquatic ecosystem due to extended removal of inorganic pollutants (= heavy metals)
Other environmental indicators (e.g. mineral resource depletion, fossil fuel depletion, ozone depletion, emission of particulate matter, emission of ozone forming substances, ionising radiation, land use, and water footprint) are neglected in this LCA, mainly because they are not expected to be relevant for the scope of this study:
• Resource-related indicators are usually used in LCIA if material consumption of limited ressources (minerals, fossil fuels, land use) is supposed to be a major environmental impact of the systems under study. However, construction of wastewater treatment mainly involves ordinary construction materials such as concrete, steel, and plastics, which are not considered as scarce materials. Similarly, land use of WWTP expansion by tertiary treatment is rather a limiting

17
factor in site-specific construction (available area close to the existing WWTP) than a significant environmental impact of urban wastewater treatment.
• Indicators describing environmental impacts caused by very specific groups of pollutants (ozone-depleting substances in stratosphere, photo-oxidants forming tropospheric ozone, particulate matter, ionising radiation) are neglected to keep the number of indicators at a reasonable level. Furthermore, none of these environmental impacts is directly associated to WWTP construction or operation.
• Water footprint is a resource indicator for anthropogenic water use and consumption, accounting for quantity and quality of withdrawn and discharged water from the watershed. However, discharged water quantity is comparable between all scenarios, while water quality issues are already reflected within related indicators of eutrophication and aquatic ecotoxicity. Consequently, water footprint is neglected here to prevent double-counting of environmental effects of tertiary treatment.
Table 6: Environmental indicators for impact assessment
Indicator Unit Remarks Main
contributors Source
Cumulative energy demand
MJ
Non-renewable energy resources (fossil + nuclear)
Hard coal, lignite, natural gas, crude oil,
uranium
VDI 1997
Global warming potential
kg CO2-eq Time horizon: 100a Fossil CO2, N2O, CH4
IPCC 2007
Acidification potential
kg SO2-eq Time horizon: 100a SO2, NOx, NH3 ReCiPe 2008
Eutrophication potential for freshwater
kg P-eq Accounts only P
emissions P ReCiPe 2008
Human toxicity potential
kg DCB-eq Time horizon: 100a Heavy metals, PAH, dioxins,
… ReCiPe 2008
Freshwater aquatic ecotoxicity potential
kg DCB-eq Time horizon: 100a Heavy metals ReCiPe 2008

18
2.10 Optional elements of Life Cycle Impact Assessment
Optional elements of Life Cycle Impact Assessment include normalisation, grouping and weighting of indicator results. While normalisation still yields objective information by relating the respective indicator results to a numerical reference (e.g. the total environmental impacts in Europe per person and year), grouping of indicators and subsequent weighting must include subjective value choices in terms of ranking the importance of certain environmental impacts between each other qualitatively or even quantitatively.To maintain scientific objectivity and produce non-ambiguous and defensible results for decision support, this LCA includes normalisation of environmental indicators and does not include further grouping, ranking or weighting of indicator results.
Normalisation of the environmental indicators is done in relation to the total environmental impacts per person and year in EU-27 in 2007 (Table 7), according to the primary data reported in the ReCiPe method (Goedkoop et al. 2009). For cumulative energy demand, normalisation data is collected from EUROSTAT energy data for EU-27 in 2010 (EUROSTAT 2011/12), dividing the total energy consumption of fossil and nuclear fuels in EU27 countries by the total number of inhabitants.
Table 7: Normalisation data for EU-27 in reference year 2000
Indicator Unit Total impact
in EU27 (2000) Source
Cumulative energy demand MJ/(pe*a) fossil: 112821*
nuclear: 19765*
Eurostat 2012
Global warming potential kg CO2-eq/(pe*a) 11214 ReCiPe 2008
Acidification potential kg SO2-eq/(pe*a) 34.4 ReCiPe 2008
Eutrophication potential for freshwater
g P-eq/(pe*a) 415 ReCiPe 2008
Human toxicity potential kg DCB-eq/(pe*a) 594 ReCiPe 2008
Freshwater aquatic ecotoxicity potential
kg DCB-eq/(pe*a) 10.9 ReCiPe 2008
* EU-27 (2010)
2.11 Interpretation
In principle, the interpretation in this LCA is based on the comparison of the environmental indicator results for the different scenarios, identifying the benefits and additional impacts associated with the respective treatment schemes. In parallel, a

19
detailed contribution analysis helps to identify the relative contribution of each sub-process (e.g. filtration, disinfection) and each type of input (e.g. electricity, chemicals, infrastructure) to the respective environmental indicator. Thus, a direct relation between specific process data (e.g. electricity demand of a certain process) and environmental impact can be established to ensure reasonable results and to identify decisive parameters for the environmental comparison. Finally, the differences in environmental impact between the various treatment schemes can be directly related to their specific characteristics in terms of energy or material demand.
Beside the comparison via contribution analysis, results of all scenarios are then normalised to total environmental impacts in EU27 to show the quantitative contribution of each indicator to its respective impact category. This will facilitate the interpretation of the LCA results and the final decision-making by quantifying the relative contribution of tertiary treatment towards the current extent of each environmental impact in society.
The stability of the results should finally be assessed in sensitivity analysis, taking into account both the uncertainty of the input data and its relative impact on the outcomes of this LCA. Due to the large number of parameters, only qualitative information on sensitivity will be given in this LCA study.
2.12 Critical review
No critical review of the entire LCA framework and inventory data by external experts is foreseen in this study. However, both the LCA framework and the input data have been extensively discussed and validated in several meetings with the project steering committee and relevant experts of Berliner Wasserbetriebe (BWB-FE, BWB-GI) and technology suppliers (Hydrotech, Inge AG). The results of this LCA study have been validated and accepted by all project partners. Overall, this LCA study is critically reviewed internally and thus represents a common view of all project partners.
As some of the process data is site-specific, divergent process data may exist in the scientific or technical literature. However, input data of this LCA is directly adapted to the conditions at WWTP Ruhleben (e.g. quality and composition of secondary effluent, hydraulic profile, …) and may not be directly transferable to other sites.
2.13 Reporting
Reporting of this LCA is primarly done in the present report, containing all relevant information on the LCA framework, input data, and impact assessment. This report is publically available to reach a wide dissemination of the results within the scientific, technical and administrative community and the interested public. All other publications will finally refer to this report for details of the study. Besides this report, results are published in conference presentations, scientific papers, and a public workshop. Results of long-term pilot trials of microsieve and membrane filtration are published in detail in separate reports available on the KWB website (www.kompetenz-wasser.de).

20
Chapter 3
LCA: Life Cycle Inventory
This chapter summarizes all relevant input data for the LCA, constituting the Life Cycle Inventory (LCI) of the study:
- Chapters 3.1 to 3.6 describe the primary process data for all scenarios during process operation
- Chapter 3.7 summarizes material demand for infrastructure for all scenarios
- Chapter 3.8 defines the datasets for the background processes (electricity, chemicals, materials, transport)
- Chapter 3.9 summarizes the demand of electricity and chemicals for all investigated scenarios as well as expected effluent quality to give a comprehensive overview of the most important input parameters for the environmental assessment
3.1 Pumping or UV in summer (reference)
For the reference scenario, full-scale data of Berliner Wasserbetriebe is used for the electricity demand. The operation of the pumping station during the summer period requires a considerable amount of electricity due to the length of the pipe (18 km) and increased fouling, leading to high hydraulic resistance. From full-scale data of 2011-2012, a specific electricity demand of 155 kWh/m³ has been reported by BWB (including 7 kWh/m³ for cooling of frequency converters). Additional demand of energy or materials (e.g. for maintenance of pumping station or pipe) has been neglected in this LCA study.
In the existing UV plant, a partial flow of 1 m³/s of secondary effluent is treated during the summer period with a minimum UV dose of 1000 J/m² before discharge into the river Spree, based on safety requirements of Berlin water authorities for disinfection. Operation of the UV system requires 0.05 kWh/m³ electricity as average input (full-scale data of BWB in 2011 (BWB-GI 2012)), including operation of UV lamps and cooling of electric aggregates. In total, 24% of the effluent during summer period (= 12% of the annual flow) are treated via UV disinfection. Additional demand of energy or materials (e.g. for maintenance of UV system) has been neglected in this study except for regular replacement of UV lamps (648 UV lamps which are replaced after 3a of operation = 13140 operating hours with operation only in summer).
3.2 Dual media filtration + UV
Electricity and chemicals demand
For dual media filtration, secondary effluent is lifted for 6 m (BWB-GI 2012) in a pumping station to deliver sufficient hydraulic head for in-line coagulation, dual media filtration (2 m filter bed) and subsequent UV disinfection (Figure 8). Lifting of wastewater is estimated to require 30 Wh/m³ or 5 Wh/(m³*m), assuming a combined hydraulic and electric efficiency of the pump at η=54.5% as long-term average over the pump lifetime and operating conditions.

21
Dosing of coagulant (0.1 kWh/m³ for dosing pump) is defined at 4 mg/L Fe3+ on average (BWB 2012), delivered as FeCl3. Regular backwash of the dual media filters is planned once in 24h and requires 10 Wh/m³ of influent (= backwask pressure of 5-6 bar). The expected amount of backwash water is 4% of the influent volume according to pilot trials (BWB 2012). Pumping of backwash water to the WWTP influent requires 1 Wh/m³ influent, while automatic cooling (AC) of electric aggregates is roughly estimated to amount to 1 Wh/m³ influent. Finally, UV disinfection after dual media filtration is estimated to require a UV dose of only 700 J/m² due to less suspended solids and increased transmission of filtered water compared to secondary effluent. With a linear extrapolation from the existing UV plant (see 3.1), electricity demand for UV operation and cooling of corresponding electric aggregates is calculated to 35 Wh/m³.
Figure 8: Process data of dual media filtration + UV
Effluent quality
Effluent quality of the dual media filter is estimated according to the results of long-term pilot trials at WWTP Münchehofe (BWB 2012) with a mean effluent level of 60 µg/L TP (24h mixed samples). Transfering these results to the quality of secondary effluent in WWTP Ruhleben, a mean effluent concentration of 55 µg/L TP (range: 50-60 µg/L TP) in the effluent of the dual media filter is assumed. The slightly better effluent quality is due to lower o-PO4-P concentrations in secondary effluent of Ruhleben (~ 110 µg/L) compared to Münchehofe (~ 300-400 µg/L), thus lowering the residual o-PO4-P concentration after filtration. Extrapolated from long-term monitoring at Münchehofe, effluent concentrations of < 1 mg/L suspended solids and 35 mg/L COD have been set as expected effluent quality (annual mean) for this treatment. In terms of effluent standards, dual media filtration is capable of delivering an effluent quality < 80 µg/L TP (85%ile). In combination with UV disinfection, the effluent fulfills the hygienic guideline values for good bathing water quality (EU 2006) in the summer period.
Dual
media
filter
4 mg/L Fe
UV
6 m = 30 Wh/m³ 700 J/m² = 35 Wh/m³
(summer only)
Backwash (24h)
Volume: 4%
0.1 Wh/m³
Filter dimensioning
Dry weather peak flow = 10 m/h
Rain weather peak flow = 15 m/h
Filter area = 1730 m²
Redundancy via short-term
increase of peak flow to 17 m/h
10 Wh/m³
WWTP effluent Ø
6 mg/L SS
41 mg/L COD
0.33 mg/L TP
Filter effluent Ø
< 1 mg/L SS
35 mg/L COD
55 µg/L TP
WWTP
1 Wh/m³
Cooling of power supply: 1 Wh/m³
Electricity demand [Wh] relates
to influent volume flow [m³]

22
Infrastructure
For the layout of dual media filtration, the required filter area is calculated from maximum filter velocities not to be exceeded during dry weather or rain weather peak flow conditions. Using maximum filter velocities of 10 m/h for dry weather peak flow and 15 m/h for rain weather peak flow (BWB 2012), a total filter area of 1730 m² is required for WWTP Ruhleben. Redundancy for dual media filtration is provided by short-term increase of peak flow velocity to 17 m/h (not tested in pilot operation), as dual media filtration is characterized by high hydraulic flexibility. For UV disinfection, a total number of 3357 UV lamps (peak flow of 7.4 m³/s) is linearly extrapolated from the existing UV plant in Ruhleben according to its maximum design flow and minimum UV dose.
3.3 Microsieve + UV
Electricity and chemicals demand
For the microsieve filtration, secondary effluent is lifted 2 m to supply sufficient hydraulic head for coagulation and flocculation tanks (~0.5 m), microsieve (~0.35 m), UV disinfection (~0.5 m) and subsequent discharge (Figure 9). Comparable to dual media filtration, lifting of secondary effluent requires 10 Wh/m³ or 5 Wh/(m³*m) for the pumping station.
Coagulant dosing is located in the pump outlets prior to the coagulation tank. From pilot trials, a coagulant dose of 2 mg/L Al3+ (dosed as polyaluminiumchloride) is calculated as annual mean (KWB 2013). According to optimization during pilot trials, the coagulation tank is designed with a rapid tubular mixing unit (Turbomix™, using 3 Wh/m³ influent) to ensure building of strong micro-flocs by high shear forces during a minimum hydraulic retention time (HRT) of 1 min. For flocculation, 0.6 mg/L cationic polymer is dosed in the effluent of the coagulation tank, forming larger macro-flocs in the flocculation tank (HRT > 4 min, 3 Wh/m³ for mixer).
Figure 9: Process data of microsieve + UV
2 mg/L Al
UV2 m = 10 Wh/m³
700 J/m² = 35 Wh/m³
(summer only)
Backwash (continuous)
Volume: 1.8%
0.1 Wh/m³
Filter dimensioning
32 filtration modules (including 4 modules for redundancy)
Chemical cleaning (HCl + NaOCl): 35d
Rotation: 1 Wh/m³
Filter effluent Ø
2 mg/L SS
35 mg/L COD
63 µg/L TP
WWTP
0.3 Wh/m³0.6 mg/L Polymer
17 Wh/m³
0.1 Wh/m³
Turbomix: 3 Wh/m³
Mixer: 3 Wh/m³Micro
sieve
WWTP effluent Ø
6 mg/L SS
41 mg/L COD
0.33 mg/L TP
Electricity demand [Wh] relates
to influent volume flow [m³]
Cooling of power supply: 1 Wh/m³

23
After flocculation, treated water is filtered in microsieve units (10 µm mesh) to remove suspended solids. The microsieve process is a continuous filtration process with intermittent backwash (design backwash time: 45% at dry weather flow, 70% at peak flow for clean filter panel), triggered automatically via rising hydraulic head through the sieve. Backwash is done by rotation of the sieves (1 Wh/m³ influent for rotation drive) and high-pressure spraying of the sieve surface with filtrate (7.5 bar, 17 Wh/m³ influent for pumps). Backwash volume amounts to 1.8% of influent volume as annual average (KWB 2013), which is delivered to the WWTP influent (0.3 Wh/m³ influent for pumping). In addition, cooling of electric aggregates is estimated to 1 Wh/m³ influent.
In the long term, microsieve filter material is exposed to fouling of surface due to residual organic or inorganic material. Therefore, an in-situ chemical cleaning of the filter panels is planned each 35d to maintain the hydraulic capacity of the filtration process. For chemical cleaning, diluted HCl (15%) and NaOCl (4% as Cl) are used according to the instructions of the manufacturer (100 L of both chemicals per filter module and cleaning).
Finally, effluent of the microsieve plant is treated by UV disinfection. Comparable to effluent of dual media filter, microsieve effluent is estimated to require a minimum UV dose of 700 J/m² for safely reaching the target guideline values for disinfection. In fact, pilot trials of UV disinfection after microsieve filtration confirmed that a UV dose of 730 J/m² is sufficient to safely reach the limits of good bathing water quality in the effluent (KWB 2013). Using a linear extrapolation from the existing UV plant, UV disinfection of microsieve effluent requires 35 Wh/m³ of influent for UV lamps and cooling of electric aggregates.
Effluent quality
Effluent quality of the process is directly extrapolated from long-term pilot trials at WWTP Ruhleben (KWB 2013). Based on the extensive monitoring of microsieve effluent and optimized process layout, an average effluent concentration of 2.5 mg/L suspended solids, 35 mg/L COD, and 63 µg/L TP have been set as expected effluent quality (annual mean) for this treatment process. For the corresponding effluent standard, microsieve filtration is capable to reach < 80 µg/L TP as 85%ile effluent concentration. In summer, additional UV disinfection will further guarantee to reach the hygienic quality for good bathing water (EU 2006) in the WWTP effluent.
Infrastructure
For the layout of the microsieve process, results of pilot trials indicate that 32 filter modules (each with 30 filter discs) are required to treat the rain weather peak flow at WWTP Ruhleben (KWB 2013), including 4 redundant modules as backup (see Figure 36 in Appendix). Layout of coagulation and flocculation tanks is based on minimum hydraulic retention time (HRT > 1 and 4 min, respectively) and redundancy, calculating with 670 m³ and 2700 m³ for both tanks with security buffer. Comparable to dual media filtration, the number of UV lamps is calculated to 3357 UV lamps for the peak flow of 7.4 m³/s.

24
3.4 Polymer ultrafiltration + UV bypass
Electricity and chemicals demand
As described in chapter 2.5.4, the membrane-based processes will only treat the secondary effluent up to the dry weather peak flow of 4.5 m³/s. Excess volume exceeding dry weather peak flow (2.7% of annual volume) bypasses the membrane stage and is only treated via UV disinfection in the summer period.
For the ultrafiltration membrane treatment, secondary effluent is pre-screened by rotary drum screens (300 µm, 1 Wh/m³ influent for rotation and cleaning) to protect the subsequent membrane equipment from coarse particles (Figure 10). After screening, high-pressure pumps deliver the secondary effluent to the membrane modules. Energy demand of the membrane feed pumps is estimated from expected mean transmembrane pressure of the ultrafiltration membrane modules (0.6 bar (KWB 2013)), estimated pressure loss within the piping system (0.7 bar) and static mixer for coagulant dosing (0.1 bar), resulting in a cumulative pressure demand of 1.4 bar to be delivered by the feed pumps. Calculating with a combined hydraulic and electrical efficiency of η=68% (long-term average) for high-pressure pumps operating at relatively constant conditions, feed pumps require 56 Wh/m³ or 4 Wh/(m³*m) for feeding the UF modules.
Ferric coagulant (FeCl3) is dosed in-line after the feed pumps, using a constant dose of 8 mg/L Fe3+ according to results of pilot trials (KWB 2013). After coagulation, treated water is filtered in dead-end hollow-fibre ultrafiltration modules (here: Inge dizzer® XL 1.5 MB 40W from pilot trials) to separate suspended solids. UF modules are frequently cleaned with a hydraulic backwash (3.5 bar), using 14 Wh/m³ influent for backwash pumps and 0.9 Wh/m³ for management of filtrate tank. Operation of electric valves is estimated to require 8 Wh/m³ of influent (BWB-GI 2012).
Figure 10: Process data of polymer UF + UV bypass
UF membrane*
8 mg/L Fe
UV
1.4 bar = 56 Wh/m³
1000 J/m² = 50 Wh/m³
(summer only)
* Valve control: 8 Wh/m³
+ CIP: 4 Wh/m³
0.1 Wh/m³
Filter dimensioning
UF membrane = 75 lmh
Filter area = 230400 m² (5760 modules)
Redundany n+2 racks
Recovery = 95%
Filter effluent Ø
< 0.1 mg/L SS
26 mg/L COD
23 µg/L TP
WWTP
Screen
300 µm
Rotation = 1 Wh/m³ 14 Wh/m³
1 Wh/m³
Bypass = 2.7% of annual volume
Chemical cleaning
CEB (24h): H2SO4
CEB (7d): H2SO4 + NaOH + NaOCl
CIP (30d): H2SO4 + NaOH + citric acid + HCl
CIP (180d): MemX
0.9 Wh/m³
Return flow: 5%WWTP effluent Ø
6 mg/L SS
41 mg/L COD
0.33 mg/L TP
Electricity demand [Wh] relates
to influent volume flow [m³]
Cooling of power supply: 3 Wh/m³

25
The recovery ratio of the membrane stage is expected at 95% (KWB 2013), thus producing a return flow of 5% of influent volume which is pumped back to the WWTP inlet (1 Wh/m³ influent). For cooling of electric aggregates, an amount of 3 Wh/m³ is estimated based on the high total energy demand of the membrane stage.
In addition to hydraulic backwash, membrane modules are regularly cleaned with chemicals to prevent excessive build-up of organic or inorganic fouling. Cleaning strategies have been optimized in pilot trials (KWB 2013), involving daily “chemically enhanced backwash” (CEB) and monthly “cleaning in place” (CIP) (KWB 2013) assuming a conservative cleaning strategy. The required amount of cleaning solution is estimated to 60 L per module and cleaning step (150% of internal water volume in UF module). For daily CEB, membrane modules are soaked in acidic solution (H2SO4, pH < 2) for 1h before flushing with filtrate in regular backwash. CEB is intensified once a week by a caustic step with dosing of NaOCl (200 ppm as Cl) and NaOH (ph > 12). For monthly CIP, modules are soaked overnight (< 12h) in a three-step procedure using acidic (H2SO4, citric acid, HCl) and caustic solution. For higher cleaning effectivity, cleaning solution is intially heated to 40°C and circulated in CIP (4 Wh/m³ influent (BWB-GI 2012)). For full recovery of flux in case of serious fouling, intensive cleaning by a special cleaning agent (MEM-X) is foreseen twice a year.
The bypass of the membrane stage is treated via UV disinfection during summer, using the same minimum UV dose of 1000 J/m² (= 50 Wh/m³) as in the existing UV plant in WWTP Ruhleben.
Table 8: Cleaning strategy and chemical demand for polymer UF
Chemicals
[L/m³ cleaning
solution*]
Frequency
[d]
H2SO4
(37.5%)
NaOH
(32%)
HCl (25%) + citric
acid
(100%)
NaOCl
(13% as Cl)
MEM-X
(4% tenside)
Chemically enhanced backwash
1 4.5
7 4.5 2.3 1.5
Cleaning in place (40°C)
30 4.5 2.3 6.25 + 4
180 4.5 2.3 + 6.25 6.25 + 4 20
* 60 L cleaning solution per module (40 m² membrane area) and cleaning
Effluent quality
Effluent quality of the membrane filtration is constantly very high. From pilot trials, average effluent concentrations of < 0.1 mg/L suspended solids, 26 mg/L COD, and 23 µg/L TP have been set as expected effluent quality (annual mean) for this treatment process (KWB 2013). With regards to legal discharge limits, the polymer UF scheme is capable of delivering an effluent quality of < 50 µg/L TP as 85%-ile. Hygienic quality of membrane effluent is expected to safely meet the requirements of good bathing water quality due to high retention (> 4 log) of bacteria and viruses in ultrafiltration (pore size: 20 nm).

26
Infrastructure
For the layout of the polymer UF stage, a maximum peak flux of 75 L/(m²*h) has been successfully tested in long-term pilot trials for the Inge UF modules. Calculating with 4.5 m³/s (= 16200 m³/h), a minimum membrane surface area of 216000 m² has to be provided. As membrane moduls are installed in racks (1 rack = 80 modules = 3200 m² membrane area) and two racks are usually fed by the same feed pump, a minimum number of 72 racks is required, taking into account an operational redundancy of “n+2” double-racks (= full capacity available with one double-rack in regular maintenance and one double-rack with accidental failure) . Finally, the polymer UF stage consists of 72 racks with 5760 modules and a membrane area of 230400 m² (107% of minimum required area).
For the UV disinfection in the bypass, linear extrapolation from the existing UV plant results in a total number of 2268 UV lamps at 3.5 m³/s peak flow (BWB-GI 2012).
3.5 Ceramic microfiltration + Ozonation (optional) + UV bypass
Electricity and chemicals demand
In analogy to the polymer UF, ceramic microfiltration (MF) is designed to treat the dry weather peak flow (4.5 m³/s) only, with the excess volume bypassing the membrane stage and being treated by UV disinfection in the summer period.
Process layout of the ceramic microfiltration is bascially adapted from polymer UF layout (cf. chapter 3.4). Secondary effluent is pre-screened (300 µm rotary drum screen, 1 Wh/m³ influent) and delivered to membrane modules with high-pressure feed pumps (Figure 11). Required pressure of the feed pumps is estimated to 1.4 bar in average (0.6 bar mean transmembrane pressure, 0.7 bar for pressure loss in pipes, 0.1 bar for static mixer), equaling an electricity demand of 56 Wh/m³ influent (= 4 Wh/(m³*m)).
Ferric coagulant (FeCl3) is dosed in-line after the feed pumps, using an average dose of 8 mg/L Fe3+ according to results of pilot trials (KWB 2013). After coagulation, treated water is filtered in monolithic ceramic microfiltration modules (here: Metawater modules with 25 m² membrane area from pilot trials) to separate suspended solids. Lacking full-scale data of the manufacturer, auxiliary electricity demand for operation of ceramic MF modules is adapted from polymer UF process (chapter 3.4). In detail, electricity demand is estimated to 14 Wh/m³ influent for regular hydraulic backwash, 0.9 Wh/m³ influent for management of filtrate tank, and 8 Wh/m³ influent for valve control.
The recovery ratio of the membrane stage is expected at 95% (KWB 2013), thus producing a return flow of 5% of influent volume which is pumped back to the WWTP inlet (1 Wh/m³ influent). For cooling of electric aggregates, an amount of 3 Wh/m³ is estimated based on the high total energy demand of the membrane stage.

27
Figure 11: Process data of ceramic MF + UV bypass
The cleaning strategy for ceramic MF modules is different from polymer UF (Table 9). Daily CEB is done with acidic solution (H2SO4, pH < 2), which is intensified with NaOCl (200 ppm) once a week to prevent biofouling. For monthly CIP (conservative strategy), a three-step procedure of acidic solution (H2SO4, citric acid, HCl) and high chlorine (NaOCl with 3000 ppm as Cl) is used together with heating (40°C) and circulation (4 Wh/m³ influent). The amount of cleaning solution is estimated to 30 L per module and cleaning step (150% of internal water volume in MF module).
Table 9: Cleaning strategy and chemical demand for ceramic MF
Chemicals
[L/m³ cleaning solution*]
Frequency
[d]
H2SO4
(37.5%)
HCl (25%) +
citric acid
(100%)
NaOCl
(13% as Cl)
Chemically enhanced backwash
1 4.5
7 4.5 1.5
Cleaning in place (40°C) 30 4.5 6.25 + 4 22.5
* 30 L of cleaning solution per module (25 m² surface area) and cleaning
The bypass volume exceeding 4.5 m³/s is treated via UV disinfection, applying a minimum UV dose of 1000 J/m² (= 50 Wh/m³) during the summer period as in the existing UV plant at WWTP Ruhleben.
MF membrane*
8 mg/L Fe
UV
1.4 bar = 56 Wh/m³
0.1 Wh/m³
Filter dimensioning
MF membrane = 90 lmh
Filter area = 184000 m² (7360 modules)
Redundancy n+2 racks
Recovery = 95%
WWTP
Screen
300 µm
Rotation = 1 Wh/m³ 14 Wh/m³
1 Wh/m³
Bypass = 2.7% of annual volume
Chemical cleaning
CEB (24h): H2SO4
CEB (7d): H2SO4 + NaOCl
CIP (30d): NaOCl + citric acid + HCl
* Valve control: 8 Wh/m³
+ CIP: 4 Wh/m³
0.9 Wh/m³
Return flow: 5%WWTP effluent Ø
6 mg/L SS
41 mg/L COD
0.33 mg/L TP
Filter effluent Ø
< 0.1 mg/L SS
26 mg/L COD
23 µg/L TP
Electricity demand [Wh] relates
to influent volume flow [m³]
1000 J/m² = 50 Wh/m³
(summer only)
Cooling of power supply: 3 Wh/m³

28
Effluent quality
Effluent quality of the ceramic MF modules proved to be of the same high quality than effluent of polymer UF modules. From pilot trials, average effluent concentrations of < 0.1 mg/L suspended solids, 26 mg/L COD, and 23 µg/L TP have been set as expected effluent quality (annual mean) for the ceramic MF process (KWB 2013). With regards to legal discharge limits, the ceramic MF scheme is capable of delivering an effluent quality of < 50 µg/L TP as 85%-ile. Hygienic quality of membrane effluent is expected to safely meet the requirements of good bathing water quality due to high retention (> 4 log) of bacteria and viruses in microfiltration (pore size: 100 nm).
Infrastructure
For the layout of the ceramic MF process, a maximum peak flux of 90 L/(m²*h) has been successfully tested in long-term pilot trials (KWB 2013). From the maximum design flow (4.5 m³/s = 16200 m³/h), a minimum membrane area of 180000 m² will be required. Assuming a typical membrane rack of 80 modules (1 rack = 2000 m² membrane area), a total number of 90 single racks is calculated as a minimum. Due to the high robustness of the ceramic MF process and separate operation of the single racks, 2 racks are foreseen as redundancy following the “n+2” approach (cf. chapter 3.4). Finally, the ceramic MF process is designed with a total number of 92 racks and 184000 m² membrane area (102% of minimum required membrane area). For UV disinfection in the bypass, linear extrapolation from the existing UV plant results in a total number of 2268 UV lamps at 3.5 m³/s peak flow with security factor (BWB-GI 2012).
Ozonation
Maximum peak flow of ceramic MF modules may be further increased if pre-ozonation is applied to provide continuous oxidative cleaning of the membrane and reduce membrane fouling. According to results of short-term pilot trials, pre-ozonation of secondary effluent with 7.5 mg/L ozone before coagulation leads to an enhancement in maximum peak flow to 120 L/(m²*h), thus decreasing the required minimum surface area for the ceramic MF process and related investment costs by 25%. However, pre-ozonation requires both additional electricity for ozone generation (13 kWh/kg ozone (Ried et al. 2009)) and liquid oxygen as feed gas (9.54 kg liquid O2 per kg ozone (Ried et al. 2009)), considerably increasing the overall energy demand for the process. Nevertheless, this scenario (ceramic MF with pre-ozonation) is exemplary calculated in this LCA to show the effect of pre-ozonation on the environmental profile. Additional side-benefits of ozonation (e.g. oxidation of organic micro-pollutants) are not directly accounted in this LCA, but will be discussed in chapter 4.1.7. If pre-ozonation is applied, the design of the ceramic MF process requires a total number of 70 racks (redundancy as “n+2”) with 140000 m² membrane area (= 104 % of minimum membrane area). Ozone contact tank with a minimum HRT of 10 min is calculated to 2700 m³.

29
3.6 High rate sedimentation + UV
Electricity and chemicals demand
Prior to the high rate sedimentation process, secondary effluent is lifted by 2 m to provide sufficient hydraulic head for coagulation and flocculation tank, sedimentation tank, and subsequent UV treatment (Figure 12). Assuming 5 Wh/(m³*m) for pumping, lifting requires 10 Wh/m³ influent. Coagulant is dosed in front of the coagulation tank, using an average dose of 5.5 mg/L Fe3+ (dosed as FeCl3) estimated by the supplier (VeoliaDT 2012). Coagulant is mixed in coagulation tank (mixer: 1 Wh/m³ influent, HRT > 2 min) before dosing of polymer (0.3 mg/L) and microsand (VeoliaDT 2012). Formation of strong and heavy macro-flocs with ballasting sand is enforced by high-energy mixing with a rapid tubular mixing unit (Turbomix™, using 3 Wh/m³ influent) in the flocculation tank (HRT > 5 min). From flocculation tank, treated water flows by gravity to the sedimentation tank equipped with parallel plates for high hydraulic capacity (up to 50 m³/(m²/h) during rain weather peak flow). Sedimented flocs with encapsuled microsand are collected at the bottom of the sedimentation tank by a mechanic scraper (1 Wh/m³ influent) before pumping to the hydrocyclone (14 Wh/m³ influent for pumping).
Figure 12: Process data of high rate sedimentation + UV (modelled from supplier information)
Chemical sludge is separated from microsand by a hydrocyclone in the recycling pipeline and returned to the WWTP inlet, while microsand is recycled to the flocculation tank. Overall, 4% of influent water volume is estimated to be returned to the WWTP inlet on average (VeoliaDT 2012), using 1 Wh/m³ influent for pumping of the return flow. Due to incomplete separation of microsand in hydrocyclone, a small proportion of microsand (3 g/m³ influent) is lost in chemical sludge and has to be supplemented continuously (VeoliaDT 2012). In analogy to other treatment processes, cooling of electric aggregates
5.5 mg/L Fe
UV
2 m = 10 Wh/m³
850 J/m² = 42 Wh/m³
Return flow: 4%
0.1 Wh/m³
High rate sedimentation dimensioning
Loading rate @rain weather peak flow = 50 m³/(m²*h)
Microsand (~ 120 µm): 3 g /m³
Hydrocyclone
Filter effluent Ø
< 5 mg/L SS
38 mg/L COD
105 µg/L TP
WWTP
14 Wh/m³
0.3 mg/L Polymer
0.1 Wh/m³
Turbomix: 3 Wh/m³
Mixer: 1 Wh/m³
Scraper: 1 Wh/m³
1 Wh/m³
WWTP effluent Ø
6 mg/L SS
41 mg/L COD
0.33 mg/L TP
Electricity demand [Wh] relates
to influent volume flow [m³]
Cooling of power supply: 1 Wh/m³

30
is estimated to 1 Wh/m³ influent. For the subsequent UV treatment, a minimum UV dose of 850 J/m² is assumed to be sufficient for disinfection due to an expected improvement in UV transmission after coagulation. With a linear extrapolation from the existing UV plant, electricity demand for UV disinfection amounts to 42 Wh/m².
Effluent quality
Expected mean effluent quality of the high rate sedimentation process is predicted using a simple modelling approach based on suspended solids in effluent (Ø 5 mg/L SS, VeoliaDT 2012) and calculated phosphorus content of the solids. From the model calculations, average effluent concentrations of 5 mg/L suspended solids, 38 mg/L COD, and 105 µg/L TP have been set as expected effluent quality (annual mean) for the high rate sedimentation process (KWB 2013). For the corresponding effluent standard, high rate sedimentation is assumed to reach < 120-150 µg/L TP as 85%ile effluent concentration.
Infrastructure
For the layout of the high rate sedimentation process (see Figure 37 in Appendix), supplier information indicates that a maximum hydraulic loading rate of 50 m³/(m²*h) can be expected for designing of the process (VeoliaDT 2012). Using the rain weather peak flow of 7.4 m³/s (= 26640 m³/h), a minimum surface area of 533 m² is calculated. With a security buffer, the total surface of the sedimentation tanks is estimated to 784 m² (VWS 2012a). For sedimentation and flocculation tanks, required volume is calculated from minimum HRT and security buffer to 902 and 2924 m³, respectively (VWS 2012a). For the UV disinfection, the number of UV lamps is calculated to 4076 UV lamps for the peak flow of 7.4 m³/s, using a linear extrapolation from the existing UV stage.
3.7 Infrastructure
Lacking primary data on actual material demand for infrastructure due to the prospective nature of this LCA, inventory data for all processes is compiled from existing planning studies of Berliner Wasserbetriebe (BWB-GI), preliminay design within the OXERAM project, literature data on comparable installations, and qualified assumptions from experts. With moderate uncertainty of the underlying design assumptions, quality of the input data is assumed to be sufficient for the purpose of this study. Due to the long lifetime of wastewater infrastructure, the contribution of material demand to the overall environmental impacts of wastewater treatment are usually small if sewer systems are not within the scope of the LCA (Remy 2010).
In general, material demand for infrastructure is characterized using the following basic materials:
• Concrete
• Metals (reinforcing steel, low-alloyed steel, stainless steel, cast iron, copper)
• Plastics (polyethylene as pipes, polyvinylchloride (PVC-U), glass-fibre reinforced plastic (GRP), acrylonitrile-butadiene-styrene copolymer (ABS), epoxy resin)

31
In addition to these basic materials for construction, the required excavation of soil is accounted based on fuel demand of excavator. For UV lamps and membrane modules, a more detailed material inventory is set up to quantify potential environmental impacts from mercury use and disposal in lamps and energy demand of membrane production. An overview of total material demand for each tertiary treatment scheme is provided below (Table 10).
Dual media filtration
For dual media filtration, material demand is adopted from BWB planning data (BWB-GI 2012) for the amount of concrete and excavation. Reinforcing steel is estimated to 180 kg/m³ concrete. Stainless steel and cast iron for pumps and installations and PE for piping systems is estimated from literature dataset for sand filtration (Larsen et al. 2010).
Microsieve filtration
Material demand for microsieve filtration is calculated based on a preliminary design of the microsieve process (Von der Waydbrink 2012). Demand for concrete and excavation are estimated based on the layout of the tanks: the total required tank volume amounts to 2370 m³ for coagulation and flocculation tanks, 4408 m³ for module tanks, and 1450 m³ for auxiliary tanks (inflow channel, pumping station, filtrate tank). Reinforcing steel is calculated in relation to concrete (180 kg/m³). Steel for mixers and pipes and cast iron for pumps is calculated from preliminary design data. For the filtration modules, a detailed material inventory of the microsieve units (stainless steel, GRP, ABS, PE pipes) is based on supplier information (Hydrotech 2012).
Polymer UF
For polymer UF plant, material demand for tanks, pipes, pumps, foundation and housing is adopted from BWB planning data (BWB-GI 2012) for membrane filtration process (concrete, steel, cast iron). For membrane modules and racks, a detailed material inventory (PVC for membrane housing and pipes, PES for membrane, PP, epoxy resin, stainless steel) based on supplier information is used (Inge 2012).
Ceramic MF
For material demand of ceramic MF plant, no detailed planning data is available. Hence, material demand for tanks, pipes, pumps, foundation and housing are estimated to be comparable to the polymer UF process. For membrane modules and housing, material demand (stainless steel, aluminium oxide for membranes) is estimated from module weight and additional assumptions due to lack of supplier information.
Ozonation
For pre-ozonation, material demand of the ozone contact tank (concrete, reinforcing steel) is estimated from tank size (2700 m³). For auxiliary equipment (ozone generator, tank for liquid oxygen, cooling, piping), a dataset from literature is extrapolated according to the size of the ozonation unit (Larsen et al. 2010).

32
High rate sedimentation
Material demand for high rate sedimenation is adopted from prelimininary planning of KWB validated by the supplier (VWS 2012a). Demand for concrete and excavation are estimated based on the layout of the tanks: the total required tank volume amounts to 3820 m³ for coagulation and flocculation tanks, 7125 m³ for sedimentation tanks, and 1450 m³ for auxiliary tanks (inflow channel, pumping station, filtrate tank). Reinforcing steel is calculated in relation to concrete (180 kg/m³). For additional material demand of the high rate sedimentation process, data has been extrapolated from supplier information of a case study (VeoliaDT 2012).
UV disinfection
For the UV disinfection, material demand has been extrapolated from primary construction data of the existing UV plant in WWTP Ruhleben (BWB-GI 2012). For the calculation, a linear extrapolation according to minimum UV dose and maximum flow is used.
Lifetime of the system components
The lifetime of the buildings, tanks and equipment for tertiary treatment is used to scale the material demand for infrastructure to an annual basis. Thus, the environmental impacts of both infrastructure and operation can be summarized into one cumulative life cycle inventory.
The lifetime of system components are assumed based on the economic lifetime of system components:
• Buildings and tanks, excavation: 30a
• Machinery: 12a
• Membranes: 7a
• Microsieve filter panels: 7.5a
• UV lamps: 3a
This estimation can be regarded as a rather conservative approach, because the real “physical” material lifetime will most probably exceed the economic lifetime of the infrastructure.

33
Table 10: Material for infrastructure of tertiary treatment schemes
Material Pumping
station or UV
High rate
sedim. + UV
Microsieve
+ UV
Dual media
filter + UV
Polymer UF
+ UV bypass
Ceramic MF*
+ UV bypass Ozonation
Concrete [m³] 15000 + 486 12000 + 486 19135 + 486 9385 + 243 9385 + 243 1800
Reinforcing steel [t] 2700 + 50 2160 + 50 3444 + 50 1690 + 25 1690 + 25 324
Low-alloyed steel [t] 365 + 36 431 + 36 36 365 + 18 365 + 18 148
Stainless steel [t] 159 + 28 141 + 28 80 + 28 87 + 13 583 + 13 167
Cast iron [t] 14.3 + 0.7 14.3 + 0.7 14.3 + 0.7 65.2 + 0.4 145 + 0.4
Copper [t] 2.6 2.6 2.6 1.2 1.2 1.5
PE [t] 1.0 + 5.9 4.5 + 5.9 4 + 5.9 142 + 2.8 144 + 2.8 0.2
PVC-U [t] 23 47 0.2
Epoxy resin [t] 23 29.4
GRP [t] 4.8
ABS [t] 25.9
Al2O3 [t] 191 5.8
Excavation [m³] 25000 20000 37500 26750 26750
UV lamps [pc] 648 4076 3357 3357 2268 2268
Data based on calculations of BWB planning (BWB-GI 2012), KWB planning (Von der Waydbrink 2012), supplier information (Hydrotech 2012, Inge 2012, VWS 2012a,
VeoliaDT 2012), and literature data (Larsen et al. 2010) * infrastructure for ceramic MF (tanks, pipes, housing, etc) estimated to be comparable to polymer UF

34
3.8 Background processes
The background processes describe indirect environmental impacts of energy and material demand for operation and construction of processes for tertiary treatment. The respective LCI datasets are extracted from the LCA database ecoinvent v2.2 (Ecoinvent 2010) and are described in detail below.
3.8.1 Electricity production
For production of electricity, the gross production of electricity in Germany 2011 (AGEB 2012) has been calculated as representative power mix. Based on the mean proportion of each fuel in the power mix and the respective power plant technology, an average dataset for electricity production at medium voltage has been generated (Table 11). Losses in distribution network at medium voltage are assumed to 1.8% (Ecoinvent 2010).
Table 11: Power mix for electricity production
Fuel Proportion in power
mix (D 2011)*
Related dataset of Ecoinvent database
(Ecoinvent 2010)
Nuclear 17.7% Electricity, nuclear, at power plant (DE)
Hard coal 18.5% Electricity, hard coal, at power plant (DE)
Lignite 24.6% Electricity, lignite, at power plant (DE)
Natural gas 13.6% Electricity, natural gas, at power plant (DE)
Fuel oil 1.1% Electricity, oil, at power plant (DE)
Hydro 2.9% Electricity, hydropower, at power plant (DE)
Wind 8.0% Electricity, at wind power plant (RER)
Biomass 5.4% Electricity, at cogen with biogas engine, allocation exergy (CH)
Photovoltaic 3.2% Electricity, production mix photovoltaic, at plant (DE)
* AGEB 2012, missing to 100%: electricity from other sources (e.g. waste incineration, impacts
allocated to waste disposal)
3.8.2 Transport
Transport of chemicals and building materials from the location of the final production process (typically the producer´s gate) to the WWTP is modelled with truck transport. The respective dataset from ecovent (“transport, lorry 16-32t, EURO4”) describes average resource demand and emissions from operation (neglecting construction of

35
truck and road infrastructure) depending on weight and transport distance. Transport distances for chemicals and materials have been assumed as follows:
• Chemicals (coagulants, polymer, cleaning chemicals): 600 km
• Building materials (metals, plastics): 300 km (disposal: 50km)
• Concrete: 50 km (disposal: 50km)
3.8.3 Supply of chemicals
Various chemicals are required during operation of tertiary treatment schemes. The highest amounts in terms of quantity are coagulation chemicals (ferric chloride, polyaluminium chloride) and polymer for flocculation. For cleaning of membranes and filter panels, a selection of acids (sulphuric acid, hydrochloric acid, citric acid), caustic NaOH, chlorine chemicals (NaOCl) and detergents (MEM-X) are regularly applied.
LCI datasets are either taken directly from the Ecoinvent database (if a representative dataset is available) or are calculated based on a combination of process data from literature and related datasets for raw materials (Table 12). The following assumptions have been made:
• For FeCl3 production, the existing dataset of ecoinvent is modified according to orignial input data of raw materials (Ecoinvent 2010) to account for the German production mix of gaseous chlorine: the orignial production mix of ecoinvent (80% mercury cell, 20% membrane-based) is updated with more recent production mix of chlorine in Germany (20% mercury, 80% membrane-based) according to information of the European association of chlorine producers (Eurochlor 2010).
• For production of polyaluminiumchloride (1000 kg, 10% as Al), aluminium hydroxide (190 kg Al2O3) is mixed (with hydrochloric acid (220 kg HCl, 30%) and water (15 m³) before conditioning, using 30 kWh electricity and 192 kWh heat.
• For polymer production, it was assumed that 53 kg acrylonitrile are hydrolysed with 18 L of water into 71 kg acrylamide, which is then polymerized into polyacrylamide (no energy demand for polymerization).
• The production of citric acid (1000 kg, pure) is modelled via fermentation of molasses (4750 kg molasse) and subsequent separation and purification of citric acid (960 kg H2SO4, 128 kg HCl, 1000 kg limestone, 3000 kWh electricity, 71.4 GJ heat, and 600 m³ water (Ruhland 2004)).
• For MEM-X, the main active component is assumed to be a tenside (4%), decribed with a basic dataset for fatty alcohol sulphate.
Heavy metals in coagulants
Coagulation chemicals (FeCl3, PACl) contain small amounts of heavy metals originating from raw materials (Fe, Al) of production. These pollutants are added to the secondary effluent in coagulation and will alter the heavy metal content of the chemical sludge. For this LCA, heavy metal content of coagulants is estimated based on literature information (UBA 1997), because no primary data for coagulants are available (Table 13).

36
Table 12: LCI datasets for chemicals production
Chemical Concentration Related dataset of Ecoinvent database
FeCl3 40% Iron (III) chloride, 40% in H2O, at plant (CH), with updated production mix* for gaseous Cl2 (*)
PACl 10% as Al Mixing of Al2O3 and HCl (*)
Polymer 100% Acrylonitrile from Sohio process, at plant (RER) (*)
H2SO4 37.5% Sulphuric acid, liquid, at plant (RER)
HCl 30% Hydrochloric acid, 30% in H2O, at plant (RER)
Citric Acid 100% Fermentation of molasses, separation + purification (*)
NaOH 50% Sodium hydroxide, 50% in H2O, production mix, at plant (RER)
NaOCl 15% as Cl Sodium hypochlorite, 15% in H2O, at plant (RER)
MEM-X 4% (as tenside) Fatty alcohol sulfate, petrochemical, at plant (RER) (*)
Source: Ecoinvent 2010 * see text for more details
Table 13: Heavy metal content in coagulants
Heavy metal FeCl3* PACl* Guideline values
(DWA 2011)
Cd [mg/mol Fe or Al] 0.05 0.01 0.2
Cr [mg/mol Fe or Al] 3.0 0.08 15
Cu [mg/mol Fe or Al] 4.1 0.11 15
Hg [mg/mol Fe or Al] 0.017 0.006 0,15
Ni [mg/mol Fe or Al] 2.0 0.18 20
Pb [mg/mol Fe or Al] 1.0 0.12 15
Zn [mg/mol Fe or Al] 4.1 16.4 50
* mean data of 8 FeCl3 products and 10 PACl products (UBA 1997)

37
3.8.4 Supply of materials for infrastructure
For most material required for infrastructure, adequate LCI datasets are readily available in the Ecoinvent database (Table 14). In addition to the original datasets for material supply, the following assumptions are made:
• Regular plastics are described by raw material production and subsequent “extrusion into pipes” to reflect any additional energy demand for production of specific parts
• Production of UV lamps (4 kg each) is estimated with a composition of 96% glass, 2% steel, 2% copper, and 30 mg of mercury for each lamp. Disposal of UV lamps (including recovery of mercury) is described by a specific LCI dataset.
• In addition to raw materials for membrane modules (PES, PVC), the production of polymer UF membranes needs 90 kWh electricity and 169 kWh fuel oil (Inge 2012).
• Disposal of materials at the end-of-life is only assumed for concrete and plastics, because metals are internally recycled (closed-loop recycling) which is already accounted in production datasets. For plastics disposal, credits from feedstock energy in municipal waste incineration are not accounted in this LCA.

38
Table 14: LCI datasets for materials for infrastructure
Material Related dataset of Ecoinvent database
Concrete concrete, exacting, with de-icing salt contact, at plant (CH)
Reinforcing steel reinforcing steel, at plant (RER)
Low-alloyed steel steel, low-alloyed, at plant (RER)
Stainless steel chromium steel 18/8, at plant (RER)
Cast iron cast iron, at plant (RER)
Copper copper, primary, at refinery (RER)
PE polyethylene, HDPE, granulate, at plant + extrusion, plastic pipes (RER)
PVC-U polyvinylchloride, at regional storage (RER) + extrusion, plastic pipes (RER)
Epoxy resin epoxy resin, liquid, at plant (RER)
GRP glass fibre reinforced plastic, polyamide, injection moulding, at plant (RER)
ABS acrylonitrile-butadiene-styrene copolymer, ABS, at plant (RER)
Al2O3 aluminium oxide, at plant (RER)
Excavation excavation, hydraulic digger (RER)
UV lamps Composed of flat glass, low-alloyed steel, copper, and mercury (*)
Membrane modules Electricity and heat for membrane production (*)
Disposal of concrete disposal, building, reinforced concrete, to sorting plant (CH)
Disposal of PE, ABS, expoxy
disposal, polyethylene, 0.4% water, to municipal incineration (CH)
Disposal of PVC, GRP disposal, polyvinylchloride, 0.2% water, to municipal incineration (CH)
Disposal of UV lamps disposal, fluorescent lamps (GLO)
Source: Ecoinvent 2010 *see text for more details

39
3.9 Summary of Life Cycle Inventory
This chapter lists and compares final inventory data for all scenarios to provide an overview of the most relevant inputs (electricity and chemicals) and emissions (effluent quality) of the investigated scenarios. This data is the calculatory basis of the environmental impact assessment via LCIA indicators.
3.9.1 Electricity demand
On-site electricity demand of tertiary treatment technologies is summarized below in relation to influent water volume (Table 15). The existing system requires 155 Wh/m³ for pumping or 50 Wh/m³ for UV disinfection. Gravity-driven systems for tertiary treatment (dual media filter, microsieve, high rate sedimentation) need 70-77 Wh/m³ including UV disinfection, while high-pressure membrane processes require 88 Wh/m³ (plus UV disinfection in bypass). Pre-ozonation more than doubles the energy demand for membrane filtration to 186 Wh/m³ due to high electricity demand for ozone generation.
Table 15: Electricity demand of tertiary treatment schemes
Electricity
demand
[Wh/m³ influent]
Pumping
station
or UV
High rate
sedim.
+ UV
Micro-
sieve
+ UV
Dual
media
filter
+ UV
Polymer
UF + UV
bypass
Ceramic MF
(+ Ozone) +
UV bypass
Lifting/pumping 1551 10 10 30
Mixing 4 6
Filtration 56 56
Backwash 15 18 10 15 15
Return flow 1 0.3 1 1 1
Auxiliary 13 13
Ozonation (98)
AC for electric 1 1 1 3 3
TOTAL 31 35.3 42 88 88 (186)
UV disinfection 501 422 352 352
UV in bypass 503 503
1 37% of Qa via pumping station, 12% of Qa via UV disinfection
2 operated in summer only for 50% of Qa
3 operated in summer only for bypass volume (1.35% of Qa)

40
3.9.2 Chemicals demand
The total amount of chemicals which are required for operation of tertiary treatment schemes are listed below as annual total amounts (Table 16). As expected, coagulation chemicals contribute the highest share (1800-5600 t/a) depending on dosage and type of coagulant. For microsieve and high rate sedimentation, polymer (27-54 t/a) has to be added to support the development of strong flocs. Membranes require a considerable amount of acids and caustic (mostly H2SO4, some HCl and NaOH) and other specialty chemicals (citric acid, NaOCl, MEM-X) which have to be stored on-site. For ozonation, a high amount of liquid oxygen (> 7000 t/a) is required as input to the ozone generator.
Table 16: Chemicals demand of tertiary treatment schemes
Chemical demand
[t/a]
High rate
sedim.
+ UV
Micro-
sieve
+ UV
Dual
media
filter
+ UV
Polymer
UF + UV
bypass
Ceramic MF
(+ Ozone) +
UV bypass
FeCl3 (40%) 3634 2643 5196 5196
PACl (10% as Al) 1784
Polymer (100%) 27.4 53.5
H2SO4 (37.5%) 751 464
HCl (25%) 16.4 29.6 18.9
Citric acid (100%) 16.8 10.7
NaOH (32%) 74
NaOCl (13% as Cl) 7.6 32.6 93.6
MEM-X 14
Liquid oxygen (7131)
3.9.3 Effluent loads
Effluent loads are calculated for each scheme of tertiary treatment from predicted effluent concentrations (cf. chapter 2.3 and 3.2-3.6) for suspended solids (SS), COD, and total phosphorus (Table 17). This data is derived from long-term pilot trials at WWTP Ruhleben (microsieve, polymer membrane, ceramic membrane) and WWTP Münchehofe (dual media filtration). For high rate sedimentation, effluent quality in TP is

41
predicted from simple modelling of phosphorus content in SS and expected mean concentration of SS in effluent (Ø 5 mg/L).
Heavy metal concentration in effluent of tertiary treatment schemes was not monitored during pilot trials. For an estimation of additional removal of heavy metals via coagulation and filtration, transfer of heavy metals in chemical sludge was estimated as follows:
• Estimation of particulate fraction of heavy metals (XPM) in secondary effluent (Ni: 10%, Cd/Zn: 50%, Cu/Hg/Pb: 75%, Cr: 90%) based on their solubility
• Heavy metal content in coagulant (XCG) (cf. chapter 3.8.3)
• Estimation of dissolved metal fraction (XDS) which is transferred to solid fraction by coagulation (Cd/Ni/Zn: 50%, Cu/Hg/Pb: 70%, Cr: 80%)
• Removal of particulate fraction of heavy metals (XPM+XCG+XDS) in relation to removal of suspended solids (SSout/SSin)
Despite underlying uncertainties of this estimation, it provides a method for a qualified guess concerning the potential additional removal of heavy metals in tertiary treatment.
Table 17: Annual effluent loads of tertiary treatment schemes
Parameter
Pumping
station
or UV
High
rate
sedim.
+ UV
Micro-
sieve
+ UV
Dual
media
filter
+ UV
Polymer
UF + UV
bypass
Ceramic
MF + UV
bypass
Suspended solids
[t/a] 466 438* 219 88 23 23
COD [t/a] 3607 3329* 3066 3066 2312 2312
TP [t/a] 28.2 9.2* 5.5 4.8 2.9 2.9
Cd# [kg/a] 35 15 14 10 10 10
Cr# [kg/a] 167 45 34 15 9 9
Cu# [kg/a] 884 275 218 120 91 91
Hg# [kg/a] 8 2.5 2.0 1.1 0.8 0.8
Ni# [kg/a] 403 238 222 196 188 188
Pb# [kg/a] 535 166 132 72 56 56
Zn# [kg/a] 2550 1125 993 761 704 704
* prediction based on expected mean SS concentration and TP content in SS
# estimated based on solubility and effect of coagulation and SS retention (see text)

42
Chapter 4
LCA: Impact assessment
This chaper describes the results of the Life Cycle Impact Assessment for the different scenarios of tertiary treatment. Results are shown for the individual environmental indicators as well as a normalized comparison off all indicators as an overview. As the combination of ceramic membranes and ozonation proved no major benefits during pilot trials, this scenario is discussed separately in chapter 4.1.7.
4.1 Environmental impacts of tertiary treatment schemes
4.1.1 Freshwater eutrophication
As expected, freshwater eutrophication potential from direct emissions is significantly reduced by tertiary treatment due to a major reduction of TP concentration in the effluent. From the mean TP load in secondary effluent of WWTP Ruhleben (28.2 t TP/a), 67-90% are removed via coagualation and filtration depending on the technology of tertiary treatment (Figure 13). This amounts to a reduction of 18.6 t TP/a for high rate sedimentation (based on modelling of TP effluent concentration), 22.8 t TP/a for microsieve, 23.4 t TP/a for dual media filtration, and 25.4 t TP/a for the membrane-based processes.
Figure 13: Eutrophication potential for freshwater for tertiary treatment processes
Indirect emissions from production of electricity, chemicals or infrastructure are small (< 10%) compared to the direct emissions of the WWTP. Only for membrane processes with high energy and chemicals demand and very low TP effluent concentration, indirect processes contribute > 20% to the eutrophication potential of freshwaters.
0
2
4
6
8
10
12
14
16
18
20
Pumping or UV
in summer
High Rate
Sedimentation +
UV
Microsieve + UV Dual Media
Filter + UV
Polymer UF +
UV bypass
Ceramic MF +
UV bypass
Eu
tro
ph
icat
ion
Po
ten
tia
l of
Fre
shw
ate
r
[g P
-eq
/(p
eC
OD*
a)]
Discharge
Microsand
Cleaning Chemicals
Polymer
Coagulants
Infrastructure
Electricity UV Disinfection
Electricity Filters + Pumps
MODEL

43
4.1.2 Aquatic ecotoxicity
Besides the elimination of phosphours, tertiary treatment processes also improve the effluent quality by further elimination of inorganic pollutants, i.e. heavy metals adsorbed to suspended solids. Consequently, freshwater aquatic ecotoxicity potential of direct emissions is reduced with tertiary treatment by 45-58% (Figure 14). Between scenarios for tertiary treatment, lower effluent concentration of suspended solids increases the positive side-effect of heavy metal removal.
Figure 14: Freshwater aquatic ecotoxicity potential for tertiary treatment processes
A more detailed analysis reveals that metals Ni and Zn contribute most to this indicator with 66-77% and 22-32%, respectively (Figure 15). While the high contribution of Ni is due to its high water solubility and ecotoxicity factor, Zn has only a medium ecotoxicity factor, but considerably high total loads (> 2.5 t Zn/a) in secondary effluent. Indirect emissions play only a minor role in freshwater ecotoxicity (< 5%), underlining the relative importance of direct emissions of the WWTP via effluent discharge in this impact category.
4.1.3 Cumulative energy demand of non-regenerative fuels
Cumulative energy demand is associated with the consumption of fossil and nuclear fuels for the supply of electricity, chemicals production and transport, and infrastructure materials, thus being an indicator for indirect environmental effects from background processes. The reference scenario requires 32 MJ/(pe*a) for summer operation of the
0
5
10
15
20
25
30
35
40
Pumping or UV
in summer
High Rate
Sedimentation +
UV
Microsieve + UV Dual Media
Filter + UV
Polymer UF + UV
bypass
Ceramic MF +
UV bypass
Fre
shw
ate
r A
qu
ati
c E
coto
xici
ty P
ote
nti
al
[g D
CB
-eq
/(p
eC
OD*
a)]
Discharge
Microsand
Cleaning Chemicals
Polymer
Coagulants
Infrastructure
Electricity UV Disinfection
Electricity Filters + Pumps
MODEL
Ni
66%
Zn
32%
Hg
1%
Cd
1%
Pb
0%Cr
0%
Figure 15: Contribution of specific heavy metals to freshwater aquatic ecotoxicity potential in reference scenario
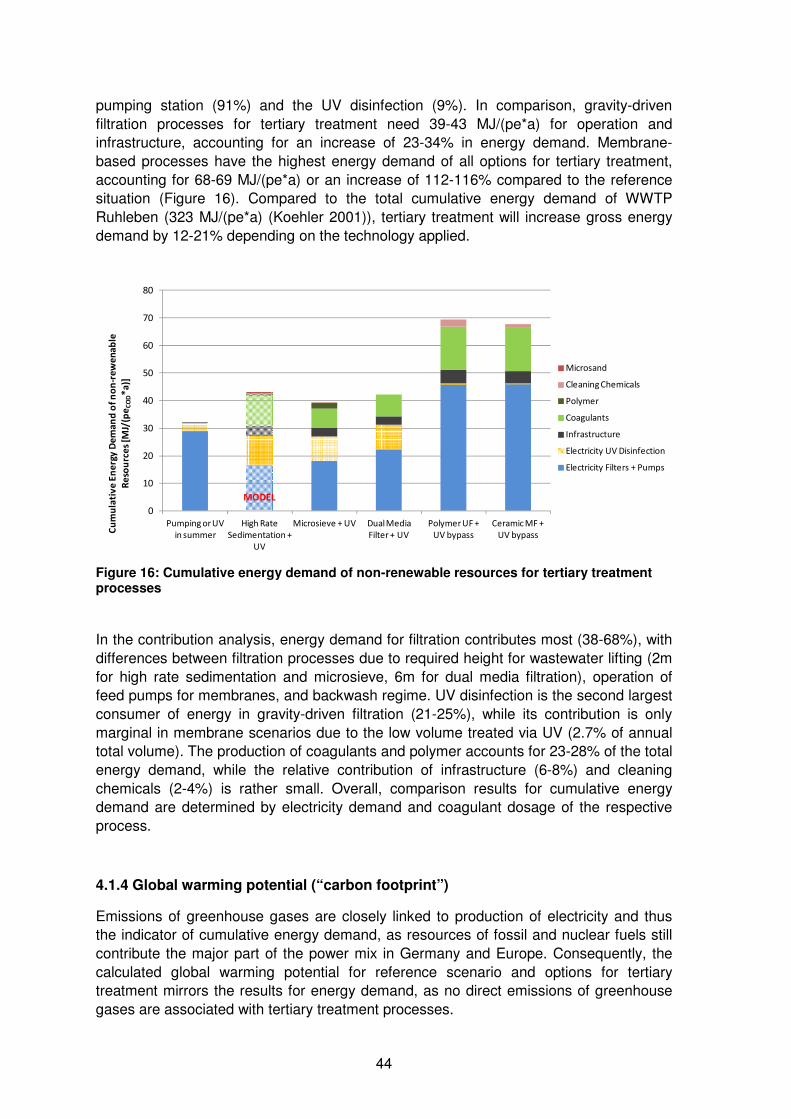
44
pumping station (91%) and the UV disinfection (9%). In comparison, gravity-driven filtration processes for tertiary treatment need 39-43 MJ/(pe*a) for operation and infrastructure, accounting for an increase of 23-34% in energy demand. Membrane-based processes have the highest energy demand of all options for tertiary treatment, accounting for 68-69 MJ/(pe*a) or an increase of 112-116% compared to the reference situation (Figure 16). Compared to the total cumulative energy demand of WWTP Ruhleben (323 MJ/(pe*a) (Koehler 2001)), tertiary treatment will increase gross energy demand by 12-21% depending on the technology applied.
Figure 16: Cumulative energy demand of non-renewable resources for tertiary treatment processes
In the contribution analysis, energy demand for filtration contributes most (38-68%), with differences between filtration processes due to required height for wastewater lifting (2m for high rate sedimentation and microsieve, 6m for dual media filtration), operation of feed pumps for membranes, and backwash regime. UV disinfection is the second largest consumer of energy in gravity-driven filtration (21-25%), while its contribution is only marginal in membrane scenarios due to the low volume treated via UV (2.7% of annual total volume). The production of coagulants and polymer accounts for 23-28% of the total energy demand, while the relative contribution of infrastructure (6-8%) and cleaning chemicals (2-4%) is rather small. Overall, comparison results for cumulative energy demand are determined by electricity demand and coagulant dosage of the respective process.
4.1.4 Global warming potential (“carbon footprint”)
Emissions of greenhouse gases are closely linked to production of electricity and thus the indicator of cumulative energy demand, as resources of fossil and nuclear fuels still contribute the major part of the power mix in Germany and Europe. Consequently, the calculated global warming potential for reference scenario and options for tertiary treatment mirrors the results for energy demand, as no direct emissions of greenhouse gases are associated with tertiary treatment processes.
0
10
20
30
40
50
60
70
80
Pumping or UV
in summer
High Rate
Sedimentation +
UV
Microsieve + UV Dual Media
Filter + UV
Polymer UF +
UV bypass
Ceramic MF +
UV bypass
Cu
mu
lati
ve
En
erg
y D
em
an
d o
f n
on
-re
we
na
ble
Re
sou
rce
s [M
J/(p
eC
OD*
a)]
Microsand
Cleaning Chemicals
Polymer
Coagulants
Infrastructure
Electricity UV Disinfection
Electricity Filters + Pumps
MODEL

45
Major contributors are electricity production for filtration (40-70%) and UV disinfection (21-26% for gravity-driven filtration, 1% for membrane schemes), supply of coagulants and polymer (15-23%), infrastructure (8-11%), and cleaning chemicals (2-4% for membranes) (Figure 17). In total, the carbon footprint of the reference situation amounts to 2.1 kg CO2-eq/(pe*a) and is increased by 20-31% with gravity-driven filtration schemes (2.5-2.8 kg CO2-eq/(pe*a)) or 105-108% with energy-intensive membrane processes (4.3-4.4 kg CO2-eq/(pe*a). In analogy to cumulative energy demand, global warming potential of tertiary treatment processes is mainly defined by electricity demand and coagulant dosage of the different options. Compared to the total global warming potential of WWTP Ruhleben (34 kg CO2-eq/(pe*a) (Koehler 2001)), tertiary treatment will increase greenhouse gas emissions by 7-13% depending on the technology applied.
Figure 17: Global warming potential for tertiary treatment processes
4.1.5 Acidification
Direct emissions of acidifying air pollutants (SO2, NH3, NOx) are not associated with the operation of tertiary treatment processes, so environmental impacts in this impact category only arise from indirect emissions in the production of electricity, chemicals, and infrastructure. Due to specific atmospheric emissions in production processes (mostly SO2 in production of hydrochloric acid), the contribution of chemicals is higher in acidification than in global warming potential if compared to impacts of electricity supply.
In total, acidification potential amounts to 2.5 kg SO2-eq/(pe*a) in the reference scenario, while gravity-driven filtration processes or membrane filtration increase acidification by 104-132% or 309-336%, respectively (Figure 18). This substantial increase (factor of 2-4) is mainly due to the extensive use of coagulants and cleaning chemicals for tertiary treatment, involving the use of chlorine-based products such as FeCl3 or PACl or hydrochloric acid. Minimising the demand for chlorine-based chemicals will reduce the additional emission of acidifying air pollutants caused by implementation of tertiary treatment processes. One option could be the change from chlorine-based coagulants to other salts (e.g. ferric sulphate).
0,0
0,5
1,0
1,5
2,0
2,5
3,0
3,5
4,0
4,5
5,0
Pumping or UV
in summer
High Rate
Sedimentation
+ UV
Microsieve + UV Dual Media
Filter + UV
Polymer UF +
UV bypass
Ceramic MF +
UV bypass
Glo
ba
l Wa
rmin
g P
ote
nti
al
[kg
CO
2-e
q/(
pe
CO
D*
a)]
Microsand
Cleaning Chemicals
Polymer
Coagulants
Infrastructure
Electricity UV Disinfection
Electricity Filters + Pumps
MODEL

46
Figure 18: Acidification potential for tertiary treatment processes
4.1.6 Human toxicity
For the impact category of human toxicity, both direct and indirect emissions have a distinct share of the total indicator results. While direct impacts of effluent discharge are associated with potential toxicity of heavy metals emitted to surface waters, indirect impacts via electricity supply, chemicals and infrastructure are mainly caused by atmospheric emissions in production processes and groundwater emissions from raw materials extraction. Thus, the implementation of tertiary treatment leads to a shift in environmental impacts, reducing direct or “local” emissions of the WWTP at the cost of increasing indirect or “global” emissions from supply of electricity, chemicals and infrastructure (Figure 19).
Figure 19: Human toxicity potential for tertiary treatment processes
0
2
4
6
8
10
12
Pumping or UV in
summer
High Rate
Sedimentation +
UV
Microsieve + UV Dual Media Filter
+ UV
Polymer UF + UV
bypass
Ceramic MF + UV
bypass
Aci
dif
ica
tio
n P
ote
nti
al [
kg
SO
2-e
q/(
pe
CO
D*
a)]
Microsand
Cleaning Chemicals
Polymer
Coagulants
Infrastructure
Electricity UV Disinfection
Electricity Filters + Pumps
MODEL
0
50
100
150
200
250
300
350
Pumping or UV
in summer
High Rate
Sedimentation +
UV
Microsieve + UV Dual Media
Filter + UV
Polymer UF +
UV bypass
Ceramic MF +
UV bypass
Hu
ma
n T
oxi
city
Po
ten
tia
l [g
DC
B-e
q/(
pe
COD*
a)]
Discharge
Microsand
Cleaning Chemicals
Polymer
Coagulants
Infrastructure
Electricity UV Disinfection
Electricity Filters + Pumps
MODEL
Loca
lG
lob
al
Loca
lG
lob
al

47
In total, human toxicity potential is not substantially lower or higher for most options of tertiary treatment (±10%) due to this environmental trade-off. The reduction of potential human toxicity with decreasing local heavy metal loads in WWTP effluent is offset by increasing emissions on a regional or global level in terms of air emissions or groundwater pollution. Only for the option of dual media filtration with high effluent quality (low suspended solids) and medium demand for coagulant, an overall decrease of human toxicity potential by -30% can be observed.
In detail, direct impacts of effluent discharge are dominated by impacts of heavy metals Hg (41%), Pb (25%) and Zn (19%) in the reference scenario (Figure 19). Indirect impacts in scenarios for tertiary treatment are largely related to atmospheric emissions of Hg during production of chlorine-based chemicals (chlorine is partially produced via chlor-alkali process using a mercury cell) and groundwater emissions of As and Mn due to mining of raw materials (Figure 20). Environmental pollution potentially causing human toxicity is thus shifted from local point sources (WWTP) to locations of chlorine production plants and to countries with mining activities (i.e. mining for coal and mineral ores). Again, a shift from chlorine-based coagulants to other salts can mitigate toxic emissions from chlorine production.
Figure 20: Contribution of different emissions to human toxicity potential of reference scenario (left) and Polymer UF (right)
4.1.7 Effect of pre-ozonation on environmental profile of ceramic microfiltration
Despite expected benefits of pre-ozonation on the operation of the ceramic microfiltration process at the start of the project, pilot trials proved only a limited improvement in membrane operation with the implementation of an ozonation stage, mainly ensuring long-term capacity of the process and decreasing the required membrane area by 25%. However, ozonation requires a high amount of additional electricity (+ 98 Wh/m³, thus doubling the electricity demand of ceramic microfiltration) and liquid oxygen (> 7000 t/a), thus having a high impact on the associated indirect environmental effects of energy demand (+ 130%), carbon footprint (+ 120%), acidification (+ 110%), and human toxicity (+ 40%) of the ceramic microfiltration process. Consequently, pre-ozonation cannot be recommended from an environmental point of view, if other side-effects (additional credits for disinfection, oxidation of organic micropollutants) are not targeted explicitly. Finally, it is decided to skip this scenario in the overall comparison, because it is not competitive in environmental or economic terms (cf. chapter 6.5) with the other options.
Hg (surface
water)
41%
Pb (surface
water)
25%
Zn (surface
water)
19%
As
(groundwater)
5%
Mn
(groundwater
3%
Hg (air)
1%
Cd
(surface
water)
1%
Ni (surface
water)
1%
As (surface
water)
1% Rest
3%
Hg (surface
water)
5%
Pb (surface
water)
3% Zn (surface
water)
6%
As
(groundwater
)
10%
Mn
(groundwater
)
5%
Hg (air)
44%
As (surface
water)
4%
Cl2 (air)
3%
CCl4 (air)
4%
Rest
16%

48
4.2 Normalisation
Normalisation of indicator results to the total environmental impact per person in EU 27 (reference year: 2000) yields information on the quantitative contribution of both direct impacts of WWTP effluent and indirect impacts of tertiary treatment to the overall environmental impacts of society. Resulting normalized scores for each indicator can be interpreted as the relative contribution in this impact category. However, normalized results may not be directly compared or numerically offset between indicators, as the relation to the existing situation will influence the comparison based on the current status in each environmental impact category (or in other words: “a small contribution to a big problem may be equally important than a bigger contribution to a smaller problem”).
Comparison between different indicator results
As expected, normalised results show that the contribution of WWTP effluent and tertiary treatment is highest in those environmental impacts which are directly affected by WWTP effluent loads (Figure 21). Direct emissions of phosphorus in surface waters result in a substantial contribution to the remaining eutrophication potential of freshwater (4.4% from secondary effluent, reduced to 0.6-1.5% depending on effluent quality of tertiary treatment). Similarly, direct emissions of heavy metals in surface waters yield a relatively high contribution in aquatic ecotoxicity potential (0.4% for secondary effluent, reduced to 0.1-0.2% depending on effluent quality of tertiary treatment).
Figure 21: Normalisation of environmental indicators: contribution of tertiary treatment to total environmental impacts in EU 27 (2000)
Compared to these direct impacts of WWTP effluent on the environment, indicators which are mainly determined by indirect effects (energy demand, chemicals, or infrastructure) show a small contribution after normalisation. Cumulative energy demand
0,0%
0,5%
1,0%
1,5%
2,0%
2,5%
3,0%
3,5%
4,0%
4,5%
5,0%
Cumulative Energy
Demand
Global Warming
Potential
Acidification
Potential
Human Toxicity
Potential
Aquatic Ecotoxicity
Potential
Eutrophication
Potential for
Freshwater
Sh
are
in t
ota
l en
vir
on
me
nta
l im
pa
ct p
er
inh
ab
ita
nt
in e
ach
imp
act
ca
teg
ory
Pumping or UV in summer
High Rate Sedimentation + UV
Microsieve + UV
Dual Media Filter + UV
Polymer UF + UV Bypass
Ceramic MF + UV bypass
MODEL

49
of tertiary treatment amounts to 0.07-0.13%, global warming potential amounts to 0.02-0.04%, and acidification amounts to 0.01-0.03% of total environmental impacts (Figure 22). For human toxicity which is determined by both direct and indirect effects, the contribution of WWTP effluent and tertiary treatment accounts for 0.04-0.05% of total impacts.
Finally, the comparison of normalized indicator results underlines the primary function of the WWTP, which is to minimize direct effects of WWTP effluent on surface waters. Even though the existing WWTP process already substantially reduces the environmental impacts of wastewater discharge (elimination of >97% P and around 70-95% of heavy metals), remaining loads of phosphorus and nitrogen still contribute distinctly to the related categories of environmental impact. In contrast, indirect effects of wastewater treatment are relatively low, which is represented in the low contribution of tertiary treatment to the impact categories of energy demand and related indicators. However, tertiary treatment schemes vary significantly in their associated indirect impacts, which are mainly associated with differences in electricity and chemicals demand (Figure 22).
Figure 22: Normalisation of environmental indicators (zoom): contribution of tertiary treatment to total environmental impacts in EU 27 (2000)
Comparison between scenarios for tertiary treatment
The direct comparison of the normalized environmental profiles between the different scenarios for tertiary treatment gives a comprehensive summary of the findings described above: with improving effluent quality, direct effects of eutrophication and aquatic ecotoxicity are reduced, while indirect effects of energy demand and related emissions successively increase (Figure 23).
0,00%
0,05%
0,10%
0,15%
0,20%
0,25%
0,30%
0,35%
0,40%
Cumulative Energy
Demand
Global Warming
Potential
Acidification
Potential
Human Toxicity
Potential
Aquatic Ecotoxicity
Potential
Eutrophication
Potential for
Freshwater
Sh
are
in t
ota
l en
vir
on
me
nta
l im
pa
ct p
er
inh
ab
ita
nt
in e
ach
imp
act
ca
teg
ory
Pumping or UV in summer
High Rate Sedimentation + UV
Microsieve + UV
Dual Media Filter + UV
Polymer UF + UV Bypass
Ceramic MF + UV bypass
MODEL

50
Figure 23: Normalised environmental profile of scenarios for tertiary treatment
0,0%
0,2%
0,4%
0,6%
0,8%
1,0%
1,2%
1,4%
1,6%
Pumping or UV in
summer
High Rate
Sedimentation + UV
Microsieve + UV Dual Media Filter +
UV
Polymer UF + UV
Bypass
Ceramic MF + UV
bypass
Sh
are
in t
ota
l en
vir
on
me
nta
l im
pa
ct p
er
inh
ab
ita
nt
in e
ach
imp
act
ca
teg
ory
Cumulative Energy Demand
Global Warming Potential
Acidification Potential
Human Toxicity Potential
Aquatic Ecotoxicity Potential
Eutrophication Potential for Freshwater
4.4%
MODEL

51
Chapter 5
LCA: Interpretation and conclusions
This chapter provides a summary of the results of this LCA and discusses aspects of sensitivity of the results, consistency and completeness of the study, and resulting conclusions, limitations and recommendations for interpretation. In this way, the numerical results of the LCA are reflected against the background and methodological approach of the study and can be judged in their validity and with regards to possible short-comings or open questions.
5.1 Summary of LCA results
From the detailed analysis of the results of Life Cycle Impact Assessment, the following conclusions can be summarized:
• Current phosphorus emissions into surface waters (28.2 t TP/a) can be substantially reduced by tertiary treatment. Depending on the treatment process, the reduction potential amounts to 67-90% or 19-25 t TP/a, thus lowering the potential for eutrophication of receiving surface waters.
• Simultaneously, tertiary treatment reduces the load of suspended solids and adsorbed inorganic pollutants to surface waters. Additional removal of heavy metals (estimated via adsorbed fraction and co-precipitation in coagulation) will reduce potential aquatic ecotoxicity. Toxicity models of this LCA predict a reduction of 45-58% in aquatic ecotoxicity potential, mainly based on additional removal of Ni and Zn.
• Tertiary treatment schemes will increase energy demand and related emissions of greenhouse gases of the existing WWTP process by an estimated 12-21% and 7-13%, respectively. Gravity-driven processes with low coagulant dosing (high rate sedimentation, microsieve, and dual media filtration) have a considerably lower energy demand and GHG emissions than membrane-based processes with high electricity demand for feed pumps and higher coagulant dose. Compared to the existing pumping station and UV plant operated in summer, gravity-driven processes will increase energy demand and GHG emissions by 20-34% and membrane-based processes by 105-116%.
• Emission of acidifying air pollutants will substantially increase with tertiary treatment compared to the reference system, which is mainly due to chemicals demand for coagulation (FeCl3 or PACl) and membrane cleaning.
• For human toxicity, further elimination of heavy metals decreases potential direct effects of effluent discharge on human health. However, indirect emissions of toxic pollutants to atmosphere and groundwater will rise on a regional or global scale due to increasing consumption of chlorine-based chemicals and raw materials (e.g. coal mining). In total, toxicity models in this LCA predict a calculatory offset of positive and negative effects on human toxicity potential with the implementation of tertiary treatment schemes.

52
• Normalisation of environmental indicators reveals the relevance of the primary function of wastewater treatment, which is the minimisation of direct negative impacts on surface waters from nutrient and pollutant emissions. The further reduction of these negative impacts should consequently be targeted for WWTP upgrade, as its effluent still contributes significantly to these environmental impacts. Even though energy demand and related greenhouse gas emissions of tertiary treatment only add a minor share to the total impact of society, these global aspects should be included into the decision, keeping in mind the notable differences between technologies.
5.2 Sensitivity analysis
Due to the prospective nature of the study and its inventory data, many of the input parameters may deviate in full-scale operation from the defined value used in this LCA study. Some of the parameters such as electricity demand are based on extrapolation from other full-scale plants or qualified assumptions, while other input data is based on cumulative results of pilot plants (e.g. dosing of chemicals, effluent quality).
However, as it is somewhat difficult to extrapolate representative mean value for these parameters, it proves even more difficult to estimate a valid range in terms of minimum and maximum values for each dataset and each process without compromising the comparability between treatment processes. Hence, it is decided not to calculate the variation of indicator results for sensitivity analysis, but to report the expected variation of inventory data based on data source and quality (Table 18). Thus, the correlation between input data and LCA results can be indicated to provide an estimate of the influence of data assumptions on the outcomes of this study. In general, maximum sensitivity of the indicator results is expected to be in the range of 10-20% for reasonable variation of input parameters.
Table 18: Variation of inventory data and related influence on LCA indicators
Inventory data Data quality Estimated
variation Indicators affected
Effluent quality Long-term mean of pilot plant effluent
± 10% Eutrophication, aquatic ecotoxicity, human toxicity
Electricity demand Supplier info and process layout
± 20% Energy demand, global warming, acidification
Coagulant + polymer dosage
Long-term mean of pilot trials
± 10% Energy demand, global warming, acidification, human toxicity
Cleaning chemicals Validated cleaning strategy of pilot trials
± 20% Acidification
Infrastructure Detailed layout based on pilot trials
± 20% Human toxicity

53
5.3 Consistency and completeness check
Checking consistency and completeness of the LCA data and related results is a necessary step in the final stage of the LCA to be able to judge the outcomes of the assessment based on methodological framework and available data and identify and communciate possible short-comings of the study.
For the consistency of data compilation in this LCA study, the following aspects can be summarized:
• Consistency of data compilation for the different scenarios is very high between microsieve and membrane-based processes. All data for these options is generated in long-term pilot trials using real secondary effluent of WWTP Ruhleben and equipment of industrial scale. Process layout and related data (electricity demand, infrastructure) is based on site conditions at WWTP Ruhleben.
• Data for dual media filtration is extrapolated from long-term pilot trials at WWTP Münchehofe, thus having reasonably high consistency with primary data of pilot trials at WWTP Ruhleben. However, effluent quality has to be predicted for total phosphorus concentration due to high variation of TP concentration in secondary effluent of WWTP Münchehofe and Ruhleben. Process layout and related data (electricity demand, infrastructure) is based on site conditions at WWTP Ruhleben.
• Process data, effluent quality and infrastructure for high rate sedimentation is estimated based on simple modelling of effluent quality and supplier data for energy demand and coagulant dosing. This approach is not consistent with the data quality of the primary data from pilot trials, which has to be clearly communicated in the presentation of comparative results (“data based on modelling and supplier information”).
Regarding the completeness of the LCA inventory data, all processes include the necessary data according to the scope of this LCA with regard to effluent quality, electricity and chemicals demand, and relevant materials for infrastructure. This completeness is provided by a comprehensive monitoring of effluent quality of pilot plants as well as on-line recording of chemical dosing and cleaning strategy. Only sampling data for heavy metal concentration in pilot plant effluents has not been included in monitoring, as these substances have not been in the focus of tertiary treatment. Thus, heavy metal removal has been estimated based on solubility of metals, adsorbed fraction on solids, and relative removal of suspended solids.
5.4 Conclusions, limitations and recommendations
Conclusions
Different processes for tertiary treatment of secondary effluent of WWTP Ruhleben have been compared in their environmental impacts with Life Cycle Assessment. LCA proves capable of describing the most relevant environmental impacts of WWTP upgrade and show its intrinsic trade-offs between the reduction of local effects (lower emissions of phosphorus and heavy metals in to surface waters) and associated increase in regional

54
or global environmental impacts (demand for non-renewable fuels, greenhouse gas emissions, pollutant emissions to air or groundwater). Although normalisation underlines the importance of the primary function of WWTPs which is the protection of surface waters from nutrient and pollutant emissions, secondary environmental impacts of tertiary treatment associated to additional demand of electricity, chemicals and infrastructure should also be taken into account while choosing the most appropriate process in environmental terms.
Indicator results show that membrane-based processes have considerably higher demand of energy and chemicals than gravity-driven treatment processes, but yield only small additional improvement in effluent quality in terms of reduced phosphorus loads. Hence, the decision for a specific discharge limit influencing the range of suitable processes for tertiary treatment should be carefully weighted against the additional environmental impacts associated with the respective processes to prevent a substantial increase of indirect environmental effects without major improvements in surface water quality. Finally, gravity-driven treatment processes can provide a substantial reduction of current phosphorus loads with a reasonable effort in energy, chemicals, and infrastructure.
Limitations
Regarding the limitations of this LCA in terms of definitions and inventory data, the following aspects have to be mentioned:
• In terms of system boundaries, effects of return flow on the upstream WWTP process and effluent quality of secondary clarifier are neglected here. Possible impacts of recycling the coagulation sludge (less coagulant dosing in mainstream process, better effluent quality) and sludge disposal (sludge dewaternig, energy balance in mono-incineration) are difficult to predict for the full-scale plant. A detailed modelling of the WWTP process and sludge disposal will be required to adequately represent these effects in an LCA. However, due to the low amount of additional sludge from tertiary treatment (1000-2200 t dry matter/a) compared to total sludge production at WWTP Ruhleben (> 41000 t dry matter/a), these effects may be of secondary interest for the operation of the plant.
• Effluent quality is reported for COD, phosphorus, and inorganic pollutants. The effect of organic pollutants (e.g. AOX, trace organic substances) on aquatic and human ecotoxicity is not accounted in this LCA due to lack of monitoring data for tertiary treatment schemes. Similarly, possible negative effects of residual coagulant or polymer after tertiary treatment may not be adequately represented in the toxicity indicators of this LCA.
• Datasets for background processes (e.g. production of coagulants, cleaning chemicals, and materials for infrastructure) are used as available in the database ecoinvent. However, these datasets are partially outdated and may not represent the current state of production processes in Germany.

55
Recommendations
With regard to the methodological approach and underlying data inventory of this LCA, the following recommendations can be formulated for future studies of environmental footprint of tertiary treatment:
• System boundaries may be extended to include effects of return sludge on the WWTP process and downstream sludge disposal. However, this may require a careful estimation of the consequences for the complex processes of biological wastewater treatment, probably requiring a dynamic model of the WWTP and detailed knowledge of the sludge disposal chain (i.e. mono-incineration)
• For validation of positive side effects of heavy metal removal, regular sampling data of heavy metals in influent and effluent of tertiary treatment processes would be beneficial.
• Similarly, organic micropollutants should be monitored before and after tertiary treatment to complete the assessment of aquatic ecotoxicity and human toxicity with regard to improving effluent quality in tertiary treatment.
• Process data of high rate sedimentation (effluent quality, chemical dosing, energy demand, layout for infrastructure) should be validated in long-term pilot trials to reach consistency with high data quality of other processes for tertiary treatment, thus improving the basis for a sound comparison between technologies
• If possible, datasets for production of specific chemicals (coagulants, polymer) should be updated with primary data of suppliers for a higher representativeness with the actual situation in Germany 2013.

56
Chapter 6
Life Cycle Costing
This chapter describes the results of the economic assessment of all investigated scenarios for tertiary treatment, using the holistic approach of Life Cycle Costing (LCC). This assessment includes a comprehensive calculation of all investment and operational costs involved with the implementation of tertiary treatment at WWTP Ruhleben.
After a short description of the underlying methodology for cost calculation (chapter 6.1), engineering layout of processes and resulting investment costs are discussed in chapter 6.2. Operational process data of scenarios for tertiary treatment is listed again as a basis for cost calculation together with background data of unit costs for materials and energy (chapter 6.3). Results of cost calculation are presented for operational costs, primary investment, and annual costs (chapter 6.4) together with a sensitivity analysis (chapter 6.5), prior to a summary of LCC results (chapter 6.6).
6.1 Methodology
Costs are calculated in this study following the method of annuity defined by LAWA (LAWA 2005) for a total project time of 30a. Total costs are finally reported as annual costs, summarizing the annual operational costs with the capital costs per annum, i.e. taking into account the linear depreciation of investment costs over time with a cost depreciation factor based on the interest rate and the economic lifetime (in German: “Kapitalwiedergewinnungsfaktor” = KFAKR).
�������� = �� ������� ������ � + ��������[����� ]
�������� = ���� � ���[����] ∗ ������[1�]�
������ = �∗("#�)%("&�)%#" withn=economiclifetime[a]andi=interestrate[%]
The cost depreciation factor is calculated separately for the specific economic lifetimes of each part of the investment. Annual capital costs of investment are then calculated by summing up each part of the investment multiplied by the respective KFAKR factor. The KFAKR factor is calculated with an interest rate of 3% per year as proposed by LAWA (LAWA 2005) and applied in other current cost studies in this field (Mertsch et al. 2013). The influence of a higher effective interest rate on the calculated annual costs is quantified in sensitivity analysis. Economic lifetimes of the different investments are estimated based on LAWA guidelines for major groups of equipment and supplier information for spare parts (Table 19).
All costs reported in this study are net costs in Euro, thus not including value added tax (VAT). The effects of price development (e.g. rising energy prices) and inflation (i.e. the loss of value for money) are not taken into account in this calculation.

57
Table 19: Economic lifetimes of investment goods
Investment goods Economic
lifetime [a] Source Remarks KFAKR*
Construction 30 LAWA 2005 0.0510
Machinery 12 LAWA 2005 0.1005
Power supply, ICA 10 LAWA 2005 0.1172
Filter panels for microsieve 7.5 Hydrotech 2012 Supplier info 0.1509
Polymer UF membranes 7 Inge 2012 estimated 0.1605
Ceramic MF membranes 15 VWS 2012b estimated 0.0838
UV lamps 3 Wedeco 2012
12000 operating hours (6 months of operation per year)
0.3535
* depreciation factor calculated according to LAWA 2005
Investment costs
In detail, investment cost calculation for tertiary treatment in WWTP Ruhleben includes the following parts:
- Site preparation
- Buildings or housing of processes
- Coagulation tanks, filter basins
- Piping and open channels
- Machinery (pumps, mixers, sieves, drives, valves, etc.)
- Equipment for instrumentation, controls, and automation (ICA)
- Power supply
- Storage tanks for chemicals
- External and internal costs for planning and project development
In this cost calculation, investment costs do not include:
- Acquisition of land area (real estate)
- Taxes
- Administrative tasks other than covered by planning costs
Spare parts for regular replacement (filter panels for microsieve, membrane modules, UV lamps) are included in investment costs once when calculating primary investment. For calculation of operating and annual costs, replacement of spare parts are reported as

58
part of operating costs, taking into account the economic lifetime of spare parts via depreciation (“re-investment”).
Operating costs
Operating costs include the following items:
- Electricity for operating of pumping stations for secondary effluent, tertiary treatment, and return flow pumping
- Chemicals for tertiary treatment (coagulation, flocculation, cleaning)
- Staff
- Maintenance (as a fixed percentage of investment costs per year)
- Regular replacement of spare parts (filter panels of microsieve, membrane modules, UV lamps) as reinvestment
- Sludge disposal in incineration
In this calculation, operating costs do not cover:
- Insurance
- Failure management
- Training of staff
6.2 Background data for investment costs
Investment costs for the different schemes for tertiary treatment are compiled from plannung data of BWB for dual media filtration and polymer UF membrane, preliminary planning of KWB for microsieve, high rate sedimentation, and ozonation, and full-scale cost data of the existing UV disinfection plant in Ruhleben. For external and internal planning (project development, engineering), an additional 18% (15% + 3%) are added to each part of the net investment costs except for spare parts (BWB-GI 2012).
Dual media filtration
For dual media filtration, a detailed planning for WWTP Ruhleben has been developed by BWB in cooperation with an external engineering company (BWB-GI 2012). The resulting cost estimation for investment has been adapted into this study.
Dual media filtration consists of a pumping station for wastewater lifting (6 m), an in-line dosing of coagulant (FeCl3) and subsequent coagulation within the hydraulic head above the filter, and a dual media filtration (2m filter bed) by gravity with regular backwash. A filter area of 1730 m² is projected to maintain a maximum filter velocity of 10 m/h in dry weather peak flow and 15 m/h in rain weather peak flow (Table 20), providing redundancy via short-term increase to 17 m/h at peak flow conditions (not tested).
From the detailed planning, total investment costs without engineering are reported as 16.0 Mio € for construction, 9.2 Mio € for machinery, and 2.7 Mio Euro for power supply and controls, giving a total of 27.9 Mio € (BWB-GI 2012). Including costs for external and internal planning, final investment costs are calculated to 32.9 Mio €.

59
Table 20: Design data of dual media filtration
Parameter Remarks
Maximum capacity [m³/s] 7.4 Definition
Maximum filter velocity at peak flow
[m/h] 10 / 15 Dry weather / rain weather
Redundancy [%] 10% Short-term increase to 17 m/h at peak flow possible
Microsieve
For the microsieve filtration, a detailed design and cost study has been developed and reported within OXERAM (Von der Waydbrink 2012). While the design of the process is based on results of long-term pilot trials (KWB 2013), specific cost data is compiled from BWB (BWB-GI 2012), supplier information for filtration units (Hydrotech 2012), quotation of various suppliers for auxiliary equipment, and qualified estimations.
Microsieve filtration consists of a pumping station for lifting of secondary effluent (2m), in-line dosing of coagulant (PACl) and distribution of water into coagulation tanks (670 m³ for a minimum hydraulic retention time of 1 min at peak flow) equipped with a Turbomix™ mixing device (see Figure 36 in Appendix). Polymer is dosed into the coagulated water prior to downstream flocculation tanks (2700 m³ for a minimum contact time of 4 min at peak flow) equipped with mixers. Flocculated water is then distributed via open channels to microsieve filtration units with automated regular backwash. According to pilot trials, 28 filtration modules are required as a minimum at peak flow design capacity. Using a conservative approach, the final design includes 32 filtration modules, providing a redundancy of 14% additional filter area (Table 21). Coagulation and flocculation lines are designed with n+1 redundant line.
Table 21: Design data of microsieve filtration
Parameter Remarks
Maximum capacity [m³/s] 7.4 Definition
Minimum hydraulic retention time
[min] 1 / 4 Coagulation / flocculation tanks
Minimum no of filtration modules
[-] 28 30 discs per filtration module
Effective no of filtration modules
[-] 32 “n+2” for double modules
Redundancy [%] 14 For filter area, n+1 for coag/floc

60
Total investment costs are estimated to 10.7 Mio € for construction, 8.8 Mio € for machinery (without filter panels), and 2.6 Mio € for power supply and controls. Assuming costs for filter panels to 2.3 Mio € (85 € per panel (Hydrotech 2012)), a total investment of 28.4 Mio € is calculated including costs for internal and external planning.
High rate sedimentation
Investment costs for the high rate sedimenation process are calculated based on supplier information for the process design (VWS 2012a), using specific cost factors in analogy to microsieve filtration.
The high rate sedimentation process consists of a pumping station for lifting of secondary effluent (2 m), dosing of coagulant (FeCl3) and microsand before coagulation tanks (900 m³), and dosing of polymer before flocculation tanks (2920 m³) equipped with Turbomix™ (see Figure 37 in Appendix). Finally, flocs are separated in a high rate sedimentation tank (7125 m³ with maximum hydraulic load of 50 m/h at peak flow conditions) equipped with lamella clarifiers, recycling microsand from the settled sludge after separation with a hydrocyclone in the sludge pipeline (Table 22).
Total investment costs are estimated to 9.7 Mio € for construction, 5.6 Mio € for machinery, and 1.9 Mio € for power supply and controls. Including costs for external and internal planning, final investment costs are calculated to 20.4 Mio €.
Table 22: Design data of high rate sedimentation
Parameter Remarks
Maximum capacity [m³/s] 7.4 Definition
Minimum hydraulic retention time
[min] 1 / 4 Coagulation / flocculation tanks
Maximum hydraulic load of sedimentation tank
[m/h] 50 Conservative approach
Redundancy [-] n+1 (3 lines + 1)
Polymer UF
For the Polymer UF, a detailed planning for WWTP Ruhleben has been developed by BWB in cooperation with an external engineering company (BWB-GI 2012). The resulting cost estimation for investment has been adapted into this study to a great extent, only adjusting the required minimum membrane area according to the results of long-term pilot trials in OXERAM (KWB 2013).
The Polymer UF stage is completely roofed by a lightweight steel-frame hall for weather protection. It consists of an inlet channel with in-line dosing of coagulant (FeCl3), a pre-sieving with 300 µm drum sieves, and a subsequent distribution channel to the

61
membrane moduls. Feed pumps draw the pre-filtered water from the channels and deliver it to the membrane moduls, which are sitting in membrane racks (T-Rack® with 80 modules, two racks fed by a single feed pump). While the concentrate (< 5% of total influent volume) is recycled to the WWTP inlet from a concentrate tank, permeate is discharged to the WWTP outlet. A small volume of the permeate stored in a permeate tank is used for regular backwash of membrane moduls. Results of pilot trials prove the potential to operate the Polymer UF with high recovery (> 95%), so that no second stage of membrane filtration is required for concentrate treatment.
For regular cleaning of membrane moduls, chemical solutions are prepared in a mixing tank before injection into the membrane moduls. Two racks are cleaned simultaneously due to the joint feed pump. Cleaning solutions are neutralized together with concentrate in the concentrate tank prior to recycling to WWTP inlet.
Planned investment costs are adjusted from the original planning by calculating a new minimum number of membrane modules for the primary stage and by excluding the secondary filtration stage. Using a maximum design flow of 75 L/(m²*h) from the pilot trials and a redundancy of “n+2” for the double racks fed by one pump, 5760 moduls are required with a total membrane surface area of 230400 m², resulting in a redundancy of 7% in relation to the maximum flow (Table 23).
Table 23: Design data of Polymer UF
Parameter Remarks
Maximum capacity [m³/s] 4.5 Definition
Maximum design flux [L/(m²*h)] 75 Results of pilot trials
Minium membrane area [m²] 216000 = 5400 modules with 40 m² each
Minimum no of racks [-] 68 80 modules per rack
Effective no of racks [-] 72 “n+2” for double racks
Effective membrane area [m²] 230400 = 5760 modules with 40 m² each
Redundancy [%] 7 For membrane area
From the detailed planning of BWB, total investment costs are reported as 14.5 Mio € for construction, 27.3 Mio € for machinery (without second stage and concentrate treatment, including membrane modules), and 7.6 Mio Euro for power supply and controls, giving a total of 49.4 Mio € without planning costs (BWB-GI 2012). According to the updated design of the membranes (Table 23), costs for machinery are adjusted to 22.6 Mio €. plus an additional 6.9 Mio € for the membrane modules (30 €/m² membrane surface area (Inge 2012)). Finally, total investment costs are calculated to 59.7 Mio € including costs for external and internal planning.

62
Ceramic MF and ozonation
For the ceramic MF stage, preliminary planning and cost calculation for investment is based on the design of the Polymer UF stage, only taking into account the higher costs of the ceramic membrane modules. All other equipment (inlet and outlet channels, pre-sieving, pumps, housing) and related costs are adopted from the detailed design of the Polymer UF system, even though some parts (backwash pumps, piping, cleaning tanks etc.) may be different due to specific operation of the ceramic membranes.
Minimum membrane area is calculated from results of long-term pilot trials in OXERAM (KWB 2013). Using a maximum design flux of 90 L/(m²*h) and modules with 25 m² membrane surface area, an effective number of 92 racks with 7360 modules have been selected for the ceramic MF stage (Table 24). Due to higher hydraulic flexibility and more robust design of ceramic membranes, a redundancy of 102% (or n+2 for single racks) is expected to be sufficient.
Total investment costs are estimated to 14.5 Mio € for construction, 22.9 Mio € for machinery, and 7.6 Mio € for power supply and controls. Assuming membrane costs of 36.8 Mio € (250 €/m² membrane surface area for a large number of modules (VWS 2012b)), a total investment of 89.9 Mio € is calculated including costs for internal and external planning.
Table 24: Design data of Ceramic MF
Parameter Remarks
Maximum capacity [m³/s] 4.5 Definition
Maximum design flux [L/(m²*h)] 90 Results of pilot trials
Minium membrane area [m²] 180000 = 7200 modules with 25 m² each
Minimum no of racks [-] 90 4x20 modules per rack
Effective no of racks [-] 92 “n+2” for single racks
Effective membrane area [m²] 184000 = 7360 modules with 25 m² each
Redundancy [%] 2 For membrane area
Combining pre-ozonation with ceramic MF, the maximum design flux can be increased to 120 L/(m²*h), decreasing membrane costs to 28 Mio € for 5600 modules. For this alternative, total investment costs are calculated to 81.1 Mio € for the ceramic MF stage.
For the pre-ozonation, investment costs are estimated to 2.3 Mio € for construction of housing, storage tanks for liquid oxygen, and contact tank (2700 m³), 2.6 Mio € for machinery (ozone generators with maximum capacity of 150 kg O3/h including dosing (Ried et al. 2009)), and 1.5 Mio € for power supply and controls. Total investment costs for ozonation are calculated to 7.5 Mio € including external and internal planning.

63
UV disinfection
For UV disinfection, investment costs are extrapolated from real costs of the existing UV plant at WWTP Ruhleben (1 m³/s, 1000 J/m²), which have been reported as 0.4 Mio € for construction, 1.2 Mio € for machinery (including UV lamps), and 0.1 Mio € for power supply (BWB-GI 2012). Extrapolation is calculated linearly for UV lamps/equipment and power supply from maximum hydraulic capacity and minimum UV dose (Table 25), whereas construction costs for housing of UV plant are extrapolated with a constant factor of 3 and 1.5 for maximum and bypass capacity, respectively.
For dual media filtration and microsieve, total investment costs of UV disinfection are estimated to 1.3 Mio € for construction, 5.2 Mio € for machinery (excluding UV lamps), and 0.1 Mio € for power supply and controls. Including costs for external and internal planning and UV lamps (0.86 Mio € for 3357 UV lamps with specific costs of 255 € per UV lamp (BWB-GI 2012)), final investment costs are calculated to 8.6 Mio €.
For high rate sedimentation, total investment costs of UV disinfection are estimated to 1.3 Mio € for construction, 6.3 Mio € for machinery (excluding UV lamps), and 0.1 Mio € for power supply and controls. Including costs for external and internal planning and UV lamps (1.04 Mio € for 4076 UV lamps), final investment costs are calculated to 10 Mio €.
For bypass treatment of membrane processes, total investment costs of UV disinfection are estimated to 0.7 Mio € for construction, 3.5 Mio € for machinery (excluding UV lamps), and 0.1 Mio € for power supply and controls. Including costs for external and internal planning and UV lamps (0.58 Mio € for 2268 UV), final investment costs are calculated to 5.5 Mio €.
Table 25: Design data of UV disinfection
Parameter Dual media filtration
and microsieve
High rate
sedimentation
Polymer UF and
ceramic MF
Maximum capacity [m³/s] 7.4 7.4 3.5
Minimum UV dose [J/m²] 700 850 1000
Summary
Total investment costs for all options for tertiary treatment are summarized below (Table 26). Uncertainty for calculation of investment costs are estimated to 30% for KWB planning (high rate sedimentation, microsieve, UV, ozonation) and 10% for BWB planning (dual media filtration, membranes) due to higher level of detail and design experience for existing planning studies of BWB and resulting lower uncertainties.

64
Table 26: Investment costs for tertiary treatment schemes at WWTP Ruhleben
Net costs
[Mio €]
High rate sedi-
mentation + UV
Microsieve
+ UV
Dual media
filter + UV
Polymer UF + UV
bypass
Ceramic MF
+ UV bypass
Ceramic MF + Ozone + UV
bypass
High-
rate
sed.
UV Micro-
sieve UV
Dual
media
filter
UV Polymer
UF
UV
bypass
Cera-
mic MF
UV
bypass
Ceramic
MF Ozone
UV
bypass
Construction 9.7 1.3 10.7 1.3 16.0 1.3 14.5 0.7 14.5 0.7 14.5 2.3 0.7
Machinery 5.6 6.3 8.8 5.1 9.2 5.1 22.6 3.5 22.9 3.5 22.9 2.6 3.5
Power supply/ICA
1.9 0.1 2.6 0.1 2.7 0.1 7.6 0.1 7.6 0.1 7.6 1.5 0.1
Sum 17.2 7.7 22.1 6.5 27.9 6.5 44.7 4.3 45.0 4.3 45.0 6.4 4.3
Planning costs1 4.5 5.1 6.2 8.8 8.9 10.0
Spare parts2 1.0 2.3 0.9 0.9 6.9 0.6 36.8 0.6 28.0 0.6
Total
investment3 30.4 37.0 41.5 65.2 95.4 94.1
Variation4 21.3 – 39.6 25.9 – 48.1 34.0 – 49.0 54.6 – 75.8 80.2 – 110.5 76.7 – 111.5
1 18% of investment costs for external and internal planning
2 membranes, UV lamps, filter panels (initial fitting-out considered as primary investment)
3 divergences due to rounding
4 uncertainties estimated to 30% for KWB planning (high rate sedimentation, microsieve, UV, ozonation) and 10% for BWB planning (dual media filtration, membranes)

65
6.3 Background data for operating costs
Background data for operation of tertiary treatment schemes is compiled from results of long-term pilot trials in research projects OXERAM and BWB-Raumfiltration. For high rate sedimentation, operational data is based on supplier information.
Specific costs for electricity and chemicals are compiled from BWB planning and other project partners (Table 27). Maintenance costs are calculated in relation to investment costs, assuming annual costs of 0.5% for construction, 2.5% for machinery, and 1.0% for power supply and ICA equipment. For calculation of staff costs, net costs of 52, 72, and 92 €/h are estimated per full job position based on level of education for technicians, foremen, and engineers, respectively (1530 h/a) (BWB-GI 2012).
Costs for sludge disposal are estimated to 97 €/t dry solids (BWB-GI 2012). Mass of dry solids for disposal is calculated from difference of dry solids load in secondary effluent and after filtration, taking into account precipitated solids from coagulation (2.5 g dry solids/g Fe and 4 g dry solids/g Al (ATV 2000)) and floccuation (1 g dry solids/g polymer).
Table 27: Specific cost data for electricity and chemicals
Material Costs Concentration Source
Electricity [€/kwh] 0.132 BWB-GI 2012
FeCl3 [€/ton] 175 40% as FeCl3 BWB-GI 2012
PACl [€/ton] 140 13% as Al BWB 2012
Polymer [€/ton] 3500 100% BWB-GI 2012
NaOH [€/ton] 200 32% BWB-GI 2012
H2SO4 [€/ton] 240 37.5% BWB-GI 2012
Citric acid [€/ton] 2020 100% BWB-GI 2012
HCl [€/ton] 230 25% BWB-GI 2012
NaOCl [€/ton] 980 12% as Cl BWB-GI 2012
MEM-X [€/ton] 9280 100% VWS 2012b
Liquid oxygen [€/ton] 110 100% BWB-GI 2012
Microsand [€/ton] 150 VWS 2012b
Drinking water [€/m³] 2.5 BWB-GI 2012

66
Dual media filtration
Demand for electricity (42 Wh/m³) and coagulation chemicals (4 g Fe/m³) for dual media filtration is calculated as described above (cf. chapter 3.2). For loss of filter material (3% per year), a lump sum of 90K € is estimated. Staff requirements for operation are assumed to 3 positions for technicians, 0.25 for foreman, and 0.5 for engineers for process control and optimisation. Sludge volume for disposal amounts to 1367 t dry solids per year.
Microsieve
Demand for electricity (35 Wh/m³), coagulation chemicals (2 g Al/m³, 0.6 g polymer/m³) and cleaning chemicals for microsieve filtration is calculated as described above (cf. chapter 3.3). For dilution of polymer, a total volume of 26753 m³ drinking water is required per year (0.5 m³/kg polymer). Staff requirements for operation are assumed to 3 positions for technicians, 0.25 for foreman, and 0.5 for engineers in analogy to dual media filtration. Sludge volume for disposal amounts to 1061 t dry solids per year. Costs for regular replacement of filter panels are calculated as re-investment (linear depreciation according to lifetime of 7.5 a).
High rate sedimentation
Demand for electricity (31 Wh/m³), coagulation chemicals (5.5 g Fe/m³, 0.3 g polymer/m³), and microsand (3 g/m³) for high rate sedimentation is calculated as described above (cf. chapter 3.6). For dilution of polymer, a total volume of 13666 m³ drinking water is required per year (0.5 m³/kg polymer). Staff requirements for operation are assumed to 3 positions for technicians, 0.25 for foreman, and 0.5 for engineers in analogy to dual media filtration and microsieve. Sludge volume for disposal amounts to 1581 t dry solids per year, including loss of microsand with return sludge
Polymer UF
Demand for electricity (88 Wh/m³), coagulation chemicals (8 g Fe/m³), and cleaning chemicals for polymer UF is calculated as described above (cf. chapter 3.4). Staff requirements for operation are assumed to 4 positions for technicians, 0.25 for foreman, and 0.5 for engineers for process control and optimisation due to higher complexity and frequent cleaning of membranes. Sludge volume for disposal amounts to 2233 t dry solids per year. Costs for regular replacement of membrane modules are calculated as re-investment (linear depreciation according to lifetime of 7 a).
Ceramic MF + Ozone
Demand for electricity (88 Wh/m³), coagulation chemicals (8 g Fe/m³), and cleaning chemicals for ceramic MF is calculated as described above (cf. chapter 3.5). Staff requirements for operation are assumed to 4 positions for technicians, 0.25 for foreman, and 0.5 for engineers for process control and optimisation due to higher complexity and frequent cleaning of membranes. Sludge volume for disposal amounts to 2233 t dry solids per year. Costs for regular replacement of membrane modules are calculated as re-investment (linear depreciation according to lifetime of 15 a).

67
For ozonation, demand for electricity (98 Wh/m³) and liquid oxygen (6099 t/a) are adopted from LCA (cf. chapter 3.5). For operation, one additional position for a technician is estimated as staff requirement.
UV disinfection
For UV disinfection, demand for electricity (35-50 Wh/m³) is calculated as described above depending on UV dose (cf. chapter 3.2 - 3.6). Staff requirements for operation are assumed to 1 position for a technician (0.5 if only bypass operation in membrane schemes). Costs for regular replacement of UV lamps are calculated as re-investment (linear depreciation according to lifetime of 3 a).
Summary
Total operating costs of all options for tertiary treatment are summarized below (Table 26). Uncertainties for calculation of operating costs are estimated to 10% for all tested variants due to underlying data quality of long-term pilot trials. For high rate sedimentation, conservative estimations for operating conditions support the assumptions of a comparable uncertainty (10%).
6.4 Results of Life Cycle Costing
Comparable to the LCA results, the cost calculation compares the five basic schemes of tertiary treatment in their net costs:
1. High rate sedimentation + UV
2. Microsieve + UV
3. Dual media filtration + UV
4. Polmyer UF + UV in bypass
5. Ceramic MF + UV in bypass
The economic implications of combining ceramic MF and ozonation are discussed separately in sensitivity analysis. For the five scenarios listed above, results of Life Cycle Costing are presented in three different categories:
• primary investment (= sum of total investment for implementation of a tertiary treatment scheme)
• operating costs (= annual costs for operation of tertiary treatment, including depreciated costs for regular replacement of membranes, UV lamps, and filter panels)
• total annual costs (= sum of capital costs per annum for investment without spare parts and operating costs)

68
Table 28: Operating costs for tertiary treatment schemes at WWTP Ruhleben
Net costs
[k€]
High rate sedi-
mentation + UV
Microsieve
+ UV
Dual media
filter + UV
Polymer UF + UV
bypass
Ceramic MF
+ UV bypass
Ceramic MF + Ozone
+ UV bypass
High-
rate sed. UV
Micro-
sieve UV
Dual
media
filter
UV Polymer
UF
UV
bypass
Ceramic
MF
UV
bypass
Ceramic
MF Ozone
UV
bypass
Electricity 373 246 412 202 505 202 1040 8 1040 8 1040 1106 8
Coagulant + polymer 764 670 461 906 906 906
Cleaning chemicals or liquid oxygen
17 398 229 174 671
Staff 337 80 337 80 337 80 416 40 416 40 416 80 40
Sludge disposal 153 103 133 217 217 217
Maintenance1 209 164 301 136 337 136 715 91 721 91 721 90 91
Spare parts2 41 367 345 303 90 303 1109 204 3083 204 2346 204
Total³ 2734 2905 2583 5143 6954 8109
Variation4 2460 – 3007 2615 – 3196 2325 – 2838 4629 – 5658 6259 – 7650 7298 - 8920
1 annual proportion of investment: 0.5% of construction, 2.5% of machinery, 1.0% of power supply/ICA 2 membranes, UV lamps, filter panels (all calculated as re-investment with linear depreciation over economic lifetime) or filter material/microsand 3 divergences due to rounding 4 uncertainties estimated to 10% for all treatment schemes

69
Primary investment
Primary investment for tertiary treatment schemes shows a high variation between the different options, ranging from 30.4 to 95.4 Mio € (Figure 24). Gravity-driven treatment schemes such as high rate sedimentation, microsieve, or dual media filtration have comparably lower investment costs (30-42 Mio €) than membrane-based processes (65-95 Mio €). While construction costs of the latter are comparable e.g. to construction costs for dual media filtration, specific costs for machinery and spare parts are considerably higher for membrane processes due to their technical complexity (pumps, piping, valves) and high costs for membrane modules (especially ceramic membranes). Microsieve filtration has lower investment costs than dual media filtration (-10%), but uncertainty intervalls overlap due to higher potential variations in microsieve design. High rate sedimentation has the lowest investment costs, with compact design and low equipment costs. However, predicted performance and resulting design of high rate sedimentation process still has to be validated for full comparability.
Figure 24: Primary investment for tertiary treatment schemes at WWTP Ruhleben
Operating costs
Operating costs for tertiary treatment range from 2.9 to 7.9 €-cents/m³ of secondary effluent for the different options (Figure 25). Again, gravity-driven treatment schemes have distinctively lower operating costs (2.9-3.3 €-cents/m³) than membrane-based processes (5.9-7.9 €-cents/m³). Membrane processes have a higher demand of coagulants, electricity, spare parts, and maintenance than other schemes, the latter being calculated in proportion to their high investment costs. High energy demand of membrane processes is not the major driver behind this phenomenon, as spare parts and costs for coagulation chemicals (and related disposal costs for sludge) also have a distinct impact on operating costs of membrane schemes. This is especially true for ceramic MF, where the replacement of membrane modules constitutes > 45% of total operating costs despite the long lifetime of ceramic membranes (15a).
0
20.000.000
40.000.000
60.000.000
80.000.000
100.000.000
120.000.000
High rate
sedimentation
+ UV
Microsieve +
UV
Dual media
filter + UV
Polymer UF +
UV bypass
Ceramic MF +
UV bypass
Pri
ma
ry in
ve
stm
en
t [E
uro
]
Electro + ICA
Membranes, panels, UV lamps
Machinery
Construction
MODEL
30.437.0 41.5
65.2
95.4

70
Figure 25: Operational costs per m³ secondary effluent for tertiary treatment schemes at WWTP Ruhleben
Between gravity-driven processes, variation in total operating costs is only marginal, as benefits in one category (e.g. low energy demand of microsieve or high rate sedimentation) is compensated by other categories (e.g. replacement of filter panels in microsieve, coagulant demand for high rate sedimentation). Thus, these processes are comparable in their operating costs within the uncertainty range calculated in this study.
Total annual costs
Summarizing investment and operating costs, total annual costs of tertiary treatment schemes range between 5.1 and 12.1 Mio € per year (Figure 26). Related to the amount of secondary effluent, total annual costs amount to 5.8-13.8 €-cents/m³.
High rate sedimentation is the least expensive process (5.1 Mio €/a, 5.8 €-cents/m³), followed closely by microsieve filtration and dual media filtration, which both have comparable costs at 5.7 Mio €/a (6.5 €-cents/m³). However, the uncertainty range of annual costs for all three gravity-driven processes overlaps widely, so that finally costs may be comparable given the level of precision of this cost study.
For polymer UF, total annual costs amount to 10.2 Mio €/a (11.7 €-cents per m³), which is an increase by 80% compared to dual media filtration and microsieve and 100% compared to high rate sedimentation. High costs for both investment and operation of membrane processes still yield a significant gap between membranes and “low-energy” filtration processes, even though productivity, energy demand, and membrane costs have been improving considerably for polymeric membranes in recent years.
Ceramic membranes are still characterized by prohibitive costs of membrane modules, increasing the total annual costs of ceramic MF to 12.1 Mio €/a (13.9 €-cents/m³) despite their long lifetime (15a) and high productivity (90 l/(m²*h)). This technology requires very high productivity and the consideration of other operational benefits (e.g. robustness) to be competitive with polymer-based membranes for tertiary treatment of secondary effluent.
0,00
0,01
0,02
0,03
0,04
0,05
0,06
0,07
0,08
0,09
0,10
High rate
sedimentation
+ UV
Microsieve +
UV
Dual media
filter + UV
Polymer UF +
UV bypass
Ceramic MF +
UV bypass
Op
era
tio
na
l co
sts
[Eu
ro/m
³] Sludge disposal
Maintenance
Staff
Chemicals
Coagulants +
polymerElectricity
Spare parts
(Reinvest)MODEL
0.031 0.0330.029
0.058
9
0.079

71
Figure 26: Total annual costs of tertiary treatment schemes at WWTP Ruhleben
6.5 Sensitivity analysis
The sensitivity analysis of calculated life cycle costs is divided into two parts:
1. Variation of general assumptions (interest rate, electricity price, lifetimes)
2. Design variations of technologies assessed in OXERAM pilot trials (microsieve, polymer UF, ceramic MF + ozonation)
Variation of interest rate
The interest rate is a decisive parameter of the depreciation of investment costs into capital costs per annum. Based on the LAWA guidelines, an interest rate of 3% has been assumed in this study. However, real interest rates for the operator may vary according to overall economic conditions and other market-dependent aspects. Hence, the influence of a variation in interest rate is calculated for annual costs of tertiary treatment, taking into account a variation from 1% to 7.4%.
Assuming a low interest rate (1%), total annual costs decrease by 7-9% or 0.36-1.12 Mio € per year compared to the original results, depending on the respective schemes (Figure 27). With a higher interest rate (7.4%), total annual costs for tertiary treatment increase by 18-23% or 0.92-2.79 Mio € per year. These calculations underline the importance of the assumed interest rate while calculating life cycle costs for tertiary wastewater treatment, especially for those processes with high investment costs (e.g. ceramic membranes). Higher interest rates tend to favor processes with low primary investment and higher operating costs in the comparison.
0
2000000
4000000
6000000
8000000
10000000
12000000
14000000
High rate
sedimentation
+ UV
Microsieve +
UV
Dual media
filter + UV
Polymer UF +
UV bypass
Ceramic MF +
UV bypass
Tota
l an
nu
al
cost
s [E
uro
/a]
Sludge
disposalMaintenance
Staff
Chemicals
Coagulants +
polymerElectricity
Spare parts
(Reinvest)Capital costs
MODEL
5.7 5.7
10.2
12.1
5.1

72
Figure 27: Sensitivity of annual costs to interest rate
Rising electricity price
A substantial increase in future electricity price seems to be most likely with regard to the rising cost of electricity production, especially in the light of a shift to renewable energy sources such as solar and wind power. The influence of this forseeable development on the total annual costs of tertiary treatment is tested by assuming an increase to 26 €-cents/kWh (+100%) or even 50 €-cents/kWh (+380%) in the long term (Figure 28).
Figure 28: Sensitivity of annual costs to electricity price
0
2000000
4000000
6000000
8000000
10000000
12000000
14000000
16000000
18000000
High rate
sedimentation +
UV
Microsieve + UV Dual media filter
+ UV
Polymer UF + UV
bypass
Ceramic MF + UV
bypass
Tota
l an
nu
al
cost
s [E
uro
/a]
Interest rate: 1%
Interest rate: 3%
Interest rate: 7,4%
0
2000000
4000000
6000000
8000000
10000000
12000000
14000000
16000000
18000000
High rate
sedimentation +
UV
Microsieve + UV Dual media filter
+ UV
Polymer UF + UV
bypass
Ceramic MF + UV
bypass
Tota
l an
nu
al
cost
s [E
uro
/a]
13.2 €-cent/kWh
26 €-cent/kWh
50 €-cent/kWh

73
Doubling of the electricity price leads to an increase in total annual costs of 0.6-1.0 Mio €/a (+ 8-12%) of tertiary treatment, where membrane-based processes have the highest absolute increase due to high demand for electricity (~ 1 Mio €/a). However, the relative increase is highest for the low-energy treatment schemes (+11-12%), because the share of electricity costs is increased the most in relation to other cost categories. This effect is even more pronounced while assuming an electricity price of 50 €-cents/kWh: costs of membrane-based processes increase by 2.9 Mio €/a (+ 24-29%), while low-energy treatment schemes increase in costs by 1.7-2.0 Mio €/a (+ 30-35%). Whereas the absolute increase in total annual costs is naturally associated with high-energy schemes (= membranes), rising electricity prices have the highest relative effect for those schemes with low energy demand due to their high share of electricity costs to the overall life-cycle costs.
Lifetime for construction
This study assumes an economic lifetime of 30a for construction works (LAWA 2005), calculating the depreciation of this investment accordingly. As construction costs contribute a major share to total investment costs, this assumption is varied in sensitivity analysis, taking into account a conservative approach (20a) as well as an extended lifetime (40a).
However, total annual costs show only a marginal effect of lifetimes for all schemes of tertiary treatment (Figure 29). While a conservative lifetime of 20a increases costs by 0.2-0.3 Mio €/a (+ 2-6%), an extended lifetime of 40a decreases annual costs by 0.1-0.2 Mio €/a (- 1-3%). Naturally, this effect is highest for the scheme with the highest costs of construction, which is the dual media filtration.
Figure 29: Sensitivity of annual costs to lifetime of construction
0
2000000
4000000
6000000
8000000
10000000
12000000
14000000
16000000
High rate
sedimentation +
UV
Microsieve + UV Dual media filter
+ UV
Polymer UF + UV
bypass
Ceramic MF + UV
bypass
Tota
l an
nu
al
cost
s [E
uro
/a]
Lifetime for construction: 20a
Lifetime for construction: 30a
Lifetime for construction: 40a

74
Design variations of microsieve
The design of the microsieve filtration scheme has been adapted during the course of the OXERAM project. Improvements in the process of coagulation and flocculation leads to a reduction of hydraulic rentention time in coagulation (4 min � 1 min, yielding smaller coagulation tanks) and to a lower polymer dosing (2 mg/L � 0.6 mg/L). This design optimisation leads to a considerable reduction in total annual costs of 0.8 Mio €/a (-18%) from the start of the project to the final design (Figure 30).
Potential measures for further cost reduction include the change of filter panels from 10 µm mesh to 18 µm mesh with higher hydraulic capacity, thus reducing both the number of required filter modules and the costs for panel replacement by 30%. Together with a reduced energy demand due to less frequent backwash (- 40% in energy demand for microsieve backwash), total annual costs will be reduced by 0.5 Mio €/a (-11%) with 18µm mesh. However, effluent quality will be lower with the larger mesh size, which may be a limiting factor if strict limits for P effluent concentration are in place. New 10µm mesh developed since the project start (not tested) would increase the capacity by 10-15% according to the supplier, reducing total annual costs by 0.2 Mio €/a or 4%.
If sufficient hydraulic head (≥ 2m) would be available at the existing WWTP outlet, no pumping station is required for microsieve filtration, saving on investment costs for the pumps and also on electricity for pump operation. Without a pumping station, annual costs will be reduced by 0.2 Mio €/a (- 5%) compared to the original design.This option further underlines the benefits of low hydraulic head required for microsieve operation, even though there is no hydraulic head available at WWTP Ruhleben.
The average lifetime of the filter panels is assumed to 7.5a in this study based on supplier information. Changing this assumption to 5a (conservative approach with full replacement warranty of supplier), total annual costs increase by 0.15 Mio €/a (+4%). An extended panel lifetime of 9a (average lifetime calculated with 5a full warranty and 20% replacement of panels in the following years) yields a reduction of 0.05 Mio €/a (-1%) in annual costs. Hence, the assumed lifetime of the filter panels is not decisive for the total annual costs in reasonable ranges of expected lifetime.
Figure 30: Design variations for microsieve filtration
0
1000000
2000000
3000000
4000000
5000000
6000000
Microsieve
Start 2010
Microsieve
Final 2013
10µm
Microsieve
Final 2013
18µm
Microsieve
Final 2013
10µm
no pumping
station
Microsieve
Final 2013
10µm
Lifetime 5a
Microsieve
Final 2013
10µm
Lifetime 9a
Tota
l an
nu
al c
ost
s [E
uro
/a]
Sludge disposal
Maintenance
Staff
Chemicals
Coagulants
Energy
Spare parts
(Reinvest)
Capital costs
Final design
OXERAM

75
Design variations of polymer UF
The design of a polymer ultrafiltration stage has been developed previously by BWB in research projects (Gnirss and Dittrich 1998) and engineering studies (BWB-GI 2012). The first design in 1998 postulated substantially higher annual costs than in the present report, mainly due to higher costs for machinery (small scale design of 10,000 m³/d) and higher interest rate (6%), high costs for membrane material (82 €/m²), two-stage layout (80-85% recovery in first stage), and higher energy demand (180 Wh/m³). Finally, total annual costs have been estimated to 21.9 Mio €/a for polymer membranes in 1998 (Figure 31).
The engineering study of 2006 is based on a detailed planning of the process scheme, calculating with a two-stage design (recovery: 90%), low dosing of coagulant (0.7 mg/L Fe), low electricity price (0.1 kWh/kWh), and low assumptions for costs of maintenance (1% of investment in machinery per a) and staff (1 technician). Consequently, capital costs are 30% higher than in the present study, while membrane replacement costs are quite similar. Due to substantially lower operating costs, total annual costs are estimated to 8.6 Mio €/a, which is 9% below the final annual costs calculated in this report. However, extensive pilot trials of different membrane modules in OXERAM revealed that coagulant dosing has to be increased to 8 mg/L Fe for stable operation of the membranes in the long term (KWB 2013).
Starting with a design hypothesis of 60 L/(m²*h) as peak flux and a two-stage process (recovery: 90%) for the polymer UF in 2010, total annual costs could be reduced by 1.7 Mio €/a (-18%) throughout the project with a design flux of 75 L/(m²*h) and high recovery (95%), making a second filtration stage obsolete (Figure 31). While extending the frequency of cleaning in place (CIP) from 30d to 90d has only a marginal effect on total annual costs, a further increase to a design flux of 90 L/(m²*h) would yield a substantial reduction by 0.6 Mio €/a (- 6%). This strategy of “high flux” would require the short-term operation of the membrane stage at 90 L/(m²*h) during dry weather peak flow or rain events (2-4h per day), reducing the flux to 75 L/(m²*h) or below during the rest of the day. Despite its potential for cost optimisation, the “high-flux” strategy was not validated in long-term pilot trials at WWTP Ruhleben (KWB 2013).
Figure 31: Design variations for polymer UF
0
2000000
4000000
6000000
8000000
10000000
12000000
14000000
16000000
18000000
20000000
22000000
24000000
26000000
Polymer UF
BWB 1998
Polymer UF
BWB 2006
Polymer UF
Start 2010
60lmh
CIP 30d
Polymer UF
Final 2013
75lmh
CIP 30d
Polymer UF
Final 2013
75lmh
CIP 90d
Polymer UF
Final 2013
90lmh
CIP 30d
Polymer UF
Final 2013
90lmh
CIP 90d
Tota
l an
nu
al c
ost
s [E
uro
/a]
Sludge disposal
Maintenance
Staff
Chemicals
Coagulants
Energy
Spare parts (Reinvest)
Capital costs
Final design
OXERAM

76
Design variations of ceramic MF and ozonation
The ceramic microfiltration is characterized by high costs for the membrane modules (cf. chapter 6.4), so the design flux is a critical parameter for installed membrane area and resulting costs. If the validated design flux of 90 L/(m²*h) (long-term pilot trials) is increased to 120 L/(m²*h), installed membrane area will be reduced by 25%, thus reducing total annual costs by 0.8 Mio €/a (- 7%) (Figure 32). However, this option could only be validated in pilot trials for a combination of pre-ozonation and ceramic MF, adding substantial costs for investment and operation of the ozonation stage.
Assuming an ozone dose of 7.5 mg/L, annual costs for the “high flux” option will substantially increase by 2.6 Mio €/a (+ 23%) compared to the basic design with 90 lmh. Hence, the addition of an ozonation stage for pre-treatment and optimised operation of the subsequent membrane stage is far from being economically viable, if no other benefits of ozonation (e.g. micropollutant removal) are targeted in tertiary treatment.
A hypothetical option with very high design flux (500 L/(m²*h)) and pre-ozonation provides an estimation of the tipping point at which pre-ozonation becomes economically attractive. From this theoretical calculation, a pre-ozonation would substantially lower the costs for ceramic microfiltration if a design flux of > 300 L/(m²*h) can be reached, which is far away from validated flux in pilot trials with secondary effluent. Compared to polymer UF (9.4 Mio €/a), ceramic membranes in combination with pre-ozonation will not be economically competitive with reasonable design flux. Finally, these calculations show that pre-ozonation does not deliver the expected economic benefits in membrane operation for reasonable operating conditions and design flux. Furthermore, ceramic membranes are still too expensive to be an economically viable alternative to polymer membranes.
Figure 32: Design variations for ceramic MF with and without pre-ozonation
0
2000000
4000000
6000000
8000000
10000000
12000000
14000000
16000000
18000000
Ceramic MF
Final 2013
90 lmh
Ceramic MF
Final 2013
120 lmh
Ceramic MF
Final 2013
90 lmh
7.5 mg/L ozone
Ceramic MF
Final 2013
120 lmh
7.5 mg/L ozone
Ceramic MF
Final 2013
500 lmh
7.5 mg/L ozone
Tota
l an
nu
al c
ost
s [E
uro
/a]
Sludge disposal
Maintenance
Staff
Chemicals
Coagulants
Energy
Spare parts (Reinvest)
Capital costs
Final design
OXERAM
Final design
OXERAM

77
6.6 Socio-economic impact of tertiary treatment
While direct costs of tertiary treatment at WWTP Ruhleben have been precisely described in Life Cycle Costing above, indirect effects of tertiary treatment on socio-economic costs are not included in Life Cycle Costing. However, the following impacts of socio-economic nature may be associated with the implementation of a tertiary treatment process (non-exhaustive list):
• Decrease in phosphorus emissions, leading to less eutrophication (algae blooms) and improved water quality for swimmers, yachtsmen, surfers etc.
• Decrease in pathogen emissions, leading to less health effects for swimmers
• Increase in air pollution due to production of electricity, chemicals, and infrastructure materials
• Mining activities for production of electricity, chemicals, and infrastructure materials, leading to degradation of ecosystems and emissions into water and soil
All of these effects will most likely have an effect on the socio-economic costs of tertiary treatment, both as avoided costs or as additional costs.
Naturally, the quantification of socio-economic effects is affected by a high level of uncertainty, so that the following calculations and their results have to be carefully interpreted. Based on available methodology for quantifying socio-economic impacts and given the high uncertainty of some effects, it is decided to calculate the indirect socio-economic impact of tertiary treatment for two of these effects as an example:
1) The decrease in bathing-related diseases due to improved effluent quality in hygienic parameters (pathogenic microorganisms)
2) The increase in air pollution and associated effects on human health and climate change
Avoided health costs for swimmers due to disinfection of WWTP effluent
Currently, effluent of WWTP Ruhleben is mainly pumped via pipeline to the Teltow canal during the summer period, thus bypassing downstream bathing waters (Berlin Wannsee) and protecting the respective swimmers from pathogenic microorganisms. Since 2011, a small flow (1 m³/s) is treated by UV disinfection and discharged directly into the river Spree. The existing “bypass” leads to the discharge of secondary effluent downstream of the main bathing sites of Berlin, which will potentially affect swimmers in Brandenburg. Implementing a tertiary treatment stage, the entire discharge of WWTP Ruhleben will be disinfected during the summer period, decreasing the risk of bathing-related diseases and associated health costs.
These positive or “avoided” costs of wastewater disinfection are calculated adapting a simple approach outlined in the EU project NEPTUNE (Larsen et al. 2009):
• Concentration of E. coli in WWTP effluent: 106 MPN/100 mL (BWB-AE 2012)
• Dilution factor of WWTP effluent to bathing site: 15 (conservative estimate, no die-off of pathogens until bathing site)

78
• Amount of ingested water per swimming event: 25 mL for adults, 40 mL for children (estimated from Schets et al. 2011)
• Parameters for exposure assessment (choice of pathogens, indicator-per-pathogen ratio, infection-per-pathogens, disease-per-infection) are adapted from risk assessment study (Seis 2012)
• Seaonsal influence on pathogen occurrence in WWTP effluent (e.g. virus predominantely in winter) is included by taking minimum indicator-to-pathogen ratios for viruses, mean for protozoa, and maximum ratio for bacteria
• Probability of mild or severe diseases are estimated for bacterial infections or parasites (50/50) or virus infections (97/3)
• Duration of diseases is estimated as 2 and 5 days for mild and severe diseases, respectively. Sick days are calculated as non-working days. 50% of sick days of children are accounted as non-working days for parental care.
• Mean gross value added per working day in Germany 2010: 167 €/d (BAUA 2011)
Table 29: Parameters for exposure assessment of swimmers for different pathogens
Parameter Campylo-
bacter
Salmo-
nella
Noro-
virus
Rota-
virus Giardia
Indicator to pathogen ratio1
[106 E.coli-1] 10 1000 0.1 0.1 0.2
Infections-per-pathogen ratio2
[-] 0.001 0.0001 0.5 0.1 0.5
Disease per infection
[-] 0.7 0.7 0.8 0.05 0.3
Probability of mild or severe disease3
[%] 50/50 50/50 97/3 97/3 50/50
Duration of mild or severe disease4
[d] 2/5 2/5 2/5 2/5 2/5
Source: Seis 2012
1 maximum for bacteria, mean for protozoa, min for viruses due to seasonal influence
2 probability of infection per ingested pathogen
3 estimated
4 non-working days for adults; for sick days of children, 50% are accounted as non-working days due to
parental care

79
Figure 33: Avoided costs of diseases in relation to number of swimming events
Avoided costs of diseases are directly related to the assumed number of swimming events. Estimating 500000 swimming events per year downstream of WWTP Ruhleben (for both adults and children), avoided costs of diseases are calculated to 1.15 Mio €/a. This calculation is highly sensitive to the assumed dilution factor of the WWTP effluent (estimated 15x) and to the indicator-to-pathogen ratio, which may depend on seasonal influence and specific characteristics of the WWTP catchment area. Major contributions of the different pathogens to the total disease burden are from Salmonella (53%), Norovirus (23%), and Giardia (18%). Calculated costs of avoided diseases are affected by high uncertainty and should be seen as an indication of the magnitude of the effect rather than a robust figure.
External costs of air pollution and climate change due to tertiary treatment
The implementation of tertiary treatment is associated with additional emissions into the atmosphere, as has been shown above in the environmental Life Cycle Assessment (cf. chapter 4.1). Those emissions can be directly harmful to human health (e.g. PM10) or to local ecosystems (e.g. SO2, NOX), or they can lead to indirect effects of global change in ecosystems (e.g. greenhouse gases causing climate change). Previously, the socio-economic costs of these emissions have been estimated for Germany, taking into account different sources of emissions, e.g. traffic or power plants (Maibach et al. 2007).
Accounting all local emissions in this study as emissions of power plants in Germany (simplified approach), the following specific costs can be estimated from the UBA study: 13000 €/t PM10 (urban), 11000 €/t PM10 (non-urban), 3600 €/t NOx, 1200 €/t NMVOC, and 5200 €/t SO2 (Maibach et al. 2007, p.61). For greenhouse gases, the study estimates a mean effect of 70 €/t CO2-eq, with a high uncertainty range of 20-280 €/t CO2-eq. From the inventory of the LCA, cumulative amounts of air pollutants can be derived for each scenario of tertiary treatment (Table 30). Combining this emission data with the specific cost factors, annual external costs of air pollution can be calculated (Figure 34).
0
500000
1000000
1500000
2000000
2500000
0 200000 400000 600000 800000 1000000
Av
oid
ed
co
sts
of
dis
ea
ses
[Eu
ro/
a]
Number of swimming events per year
Sum
Adults
Children

80
Table 30: Atmospheric emissions associated with tertiary treatment schemes
Air pollutant1
[t/a]
Pumping
station
or UV
High rate
sedim.
+ UV
Micro-
sieve
+ UV
Dual
media
filter
+ UV
Polymer
UF + UV
bypass
Ceramic
MF + UV
bypass
PM10 (urban) 0.015 0.19 0.16 0.19 0.21 0.23
PM10 (non-urban) 0.2 1.1 1.7 0.9 1.1 1.8
NOx 2.6 5.7 5.3 5.2 8.4 8.5
SO2 2.3 5.6 4.5 4.8 12.0 10.8
NMVOC 0.24 0.62 0.68 0.53 0.98 0.84
CO2-eq2 3380 4362 4061 4422 7033 6943
1PM10: particulate matter below 10 µm, NMVOC: Non-methane volatile organic carbon
2 global warming potential as defined in chapter 2.9
Figure 34: External costs of air pollution associated with processes for tertiary treatment
External costs of air pollution are estimated at 0.27 Mio €/a for the existing pumping station or UV treatment, whereas dual media filtration, microsieve, and high rate sedimentation increase external costs to 0.35-0.37 Mio €/a. Due to their high energy demand and related greenhouse gas emissions, membrane processes have the higest external costs at 0.6 Mio €/a. The major share of external costs (> 80%) is contributed by effects of climate change. Given the high uncertainty range of impacts of climate change, external costs of tertiary treatment can range from 0.15 – 2.1 Mio €/a.
0
100000
200000
300000
400000
500000
600000
700000
800000
900000
1000000
Pumping or UV
in summer
High rate
sedimentation
+ UV
Microsieve +
UV
Dual media
filter + UV
Polymer UF +
UV bypass
Ceramic MF +
UV bypass
Ext
ern
al c
ost
s o
f a
ir p
oll
uti
on
[E
uro
/a]
CO2-eq (with uncertainty range)
SO2
NMVOC
NOx
PM10 non-urban
PM10 urban
1.3 Mio 1.2 Mio 1.3 Mio 2.1 Mio 2.1 Mio

81
6.7 Summary
Life cycle costing of the different options for tertiary treatment shows a distinct difference between low-energy treatment (high rate sedimentation, microsieve, and dual media filter) and membrane-based processes (polmyer UF or ceramic MF, the latter also combined with pre-ozonation). In general, the following conclusions can be drawn from the cost analysis:
• Primary investment of low-energy treatment schemes (30-42 Mio €) is considerably lower than for membrane-based processes (65-95 Mio €), particularly due to high costs for membranes and related machinery.
• Operating costs of low-energy treatment schemes (~ 3 €-cents/m³) are also lower than those of membrane-based processes (6-8 €-cents/m³): the latter processes are characterized by high costs for electricity, coagulants, and also membrane replacement.
• Consequently, total annual costs are lowest for high rate sedimentation (5.1 Mio €/a) and comparable between microsieve and dual media filtration (5.7 Mio €/a), followed by polymer UF (10.2 Mio €/a) and ceramic MF (12.2 Mio €/a).
• Variation of the interest rate between 1% and 7.4% affects the total annual costs considerably, yielding changes of - 7-9% and + 18-23%, respectively. Different lifetimes for construction (20-40a) have only a marginal influence on the total annual costs (< 6%).
• Doubling of electricity price leads to an 8-12% increase in total annual costs.
• Potential cost optimisation can be reached for the microsieve by increasing mesh size to 18 µm (-11%, at lower effluent quality) or if no pumping station is required (- 5%), whereas lifetime of the panels has only a marginal influence. Comparably, annual costs of polymer UF can be decreased with higher design flux (90 lmh, - 6%), whereas an extended frequency of intensive cleaning in place yields only marginal savings.
• The combination of ozonation and ceramic microfiltration will substantially increase the annual costs despite a higher design flux (120 L/(m²*h)). Pre-ozonation will only be cost-effective if a design flux of > 300 L/(m²*h) could be reached. Even with a hypothetical design flux of 500 L/(m²*h), ceramic MF with pre-ozonation will still not be economically competitive to polymer UF.
These conclusions have been drawn based on the design and operating conditions of the schemes for tertiary treatment at WWTP Ruhleben. Thus, they are not directly transferable to other locations, even though tendencies of the comparison may well be valid for WWTP of comparable sizes.
Indirect socio-economic impacts of tertiary treatment have been roughly estimated for the positive effects of disinfection of WWTP effluent. Avoiding bathing-related diseases from pathogenic microorganisms, disease costs of 1.15 Mio €/a could be saved when assuming 500000 swimming events per year of both adults and children each downstream of the WWTP discharge (15x dilution). Additional air pollution from production of electricity, chemicals, and infrastructure materials is associated with additional costs of 0.35-0.6 Mio €/a depending on the treatment scheme, with a high uncertainty range (0.15-2.1 Mio €/a) due to the widely unknown effects of climate change.

82
Chapter 7
Summary of LCA and LCC
Following the comprehensive evaluation via LCA and LCC, each option for tertiary treatment can now be characterized in its environmental and economic implications. The most important outcomes are summarized below (Table 31):
• Current phosphorus emissions of WWTP Ruhleben into surface waters (28.2 t TP/a) can be substantially reduced by tertiary treatment. Depending on the treatment process, the reduction potential amounts to 67-90% or 19-25 t TP/a, leading to a reduced potential for eutrophication of downstream rivers and lakes. Additionally, coagulation and removal of suspended solids will further reduce residual effluent loads of heavy metals, decreasing the toxicity potential for the aquatic ecosystem.
• Tertiary treatment schemes will increase energy demand and related emissions of greenhouse gases of the existing WWTP process by an estimated 12-21% and 7-13%, respectively. Gravity-driven processes with low coagulant dosing (high rate sedimentation, microsieve, and dual media filtration) have a considerably lower energy demand and GHG emissions than membrane-based processes with high electricity demand for feed pumps and higher coagulant dose. At the same time, low-energy treatment processes do not reach the exceptional high effluent quality of membrane-based processes. Consequently, a certain trade-off between energy demand/GHG emissions and effluent quality can be quantified.
• Compared to the existing pumping station and UV plant operated in summer, gravity-driven processes will increase energy demand and GHG emissions by 20-34% and membrane-based processes by 105-116%.
• The production of electricity, chemicals, and infrastructure for tertiary treatment leads to additional emissions of air pollutants. However, the potential increase in human toxicity is offset by the reduction in heavy metal loads in WWTP effluent.
• In analogy to the environmental assessment and effluent quality, total annual costs are lowest for high rate sedimentation (5.1 Mio €/a) and comparable between microsieve and dual media filtration (5.7 Mio €/a), followed by polymer UF (10.2 Mio €/a) and ceramic MF (12.2 Mio €/a). In comparison to gravity-drive processes, membrane-based processes are characterized by both higher investment costs (factor 1.5 – 3x) and higher operational costs (factor 2 – 2.5x), mainly due to high costs of membranes, machinery, electricity, and coagulants.
• Comparative results of cost calculation proved to be robust against variation in interest rate, lifetime of construction, and electricity prices. However, potential options for further cost optimization have been identified for some processes, but could not be validated in pilot trials. The combination of ozonation and membrane filtration is not economically viable for the presented case of tertiary treatment within reasonable operational parameters.
• Socio-economic impacts of tertiary treatment can be roughly estimated for the increase in air pollution (0.35-0.6 Mio €/a) and for avoided health costs through reduction of bathing-related diseases (~ 1 Mio €/a). Naturally, these estimations of socio-economic effects are affected by a high level of uncertainty.

83
Table 31: Summary of LCA and LCC results for tertiary treatment schemes
High rate
sedim.
+ UV
Micro-
sieve
+ UV
Dual
media
filter
+ UV
Polymer
UF + UV
bypass
Ceramic
MF + UV
bypass
Possible discharge limit (85%ile)
[µg/L TP] 120-150 80 80 50 50
Reduction in phosphorus loads
[t TP/a] -18.6 -22.8 -23.4 -25.4 -25.4
Carbon footprint [t CO2-eq/a] 4362 4062 4422 7033 6943
Investment costs [Mio €] 30.4 37.0 41.5 65.2 95.4
Operating costs [€-ct/m³] 3.1 3.3 2.9 5.9 7.9
Total annual costs [Mio €/a] 5.1 5.7 5.7 10.2 12.2
7.1 Environmental and economic efficiency of processes for tertiary
treatment
The environmental and economic comparison of the different processes for tertiary treatment reveals the immanent trade-off of advanced wastewater treatment: improving the quality of the secondary effluent comes at significant environmental and economic costs through the additional demand for electricity, chemicals, and infrastructure. This study shows that membrane processes with superior effluent quality have the highest demand of energy and chemicals, cause the highest amount of GHG emissions, and imply the highest annual costs. In contrast, gravity-driven processes require less energy and chemicals and are less costly, even though the effluent quality is not as good as for membranes.
Whenever it comes to spending a limited amount of resources (both in environmental and economic terms) for a certain goal, the relative resource efficiency of each option towards the common goal can be a valuable tool for comparing different choices. Consequently, the benefits (= the reduction of TP loads in kg Pelim) of tertiary treatment are related to the spent resources, both in economic terms (€) and environmental impact (kg CO2-eq as representative indicator). Thus, specific resource efficiency can be calculated for each process of tertiary treatment, describing both the economic and environmental efficiency of the respective technology (Figure 35).

84
Figure 35: Environmental and economic efficiency of different schemes for tertiary treatment
From their economic and environmental efficiency, both dual media filtration and microsieve filtration are the most efficient of the assessed technologies for tertiary treatment, spending ~ 250 €/kg Pelim and causing 180 kg CO2-eq/kg Pelim (both with UV disinfection as post-treatment). High rate sedimentation + UV has higher relative costs (270 €/kg Pelim) and higher carbon footprint (235 kg CO2-eq/kg Pelim) due to the lower effluent quality of the process (= less reduction in TP loads). However, these figures are subject to change if no UV disinfection is applied as post-treatment.
Membrane-based processes have the highest relative costs for P removal (400-475 €/kg Pelim) and the highest carbon footprint (275 kg CO2-eq/kg Pelim): even though their superior effluent quality leads to the highest total reduction in TP loads, the high energy demand and costs of membrane processes yield higher relative spending of resources related to the final goal. In other words, the high expenditures for membrane processes in energy and financial terms may not be justified by their higher effluent quality, because this marginally higher reduction in TP emissions is paid by a doubling in costs and energy demand.
Finally, a careful balancing of all related benefits and expenditures has to be the basis for a future decision towards a sustainable choice for an upgrade of WWTP Ruhleben and other plants. For transferring the OXERAM results of environmental and cost assessment for WWTP Ruhleben to other WWTPs, a simple excel-based tool has been developed (T³M = Tertiary Treatment Transfer Model) to provide first estimations of process design and performance, related costs, and carbon footprint of available technologies. The life-cycle based methods applied in this study prove to be valuable tools for generating all relevant information for a sound, justified, and transparent decision-making process, so that the limited resources of both environmental and economic nature are reasonably invested while striving for an improved ecological status of our surface waters in the future.
0
50
100
150
200
250
300
350
400
0 100 200 300 400 500 600
En
vir
on
me
nta
l eff
icie
ncy
[kg
CO
2-e
q/k
g P
eli
m]
Economic efficiency [Euro/kg Pelim]
Ceramic MF + UV bypass
Polymer UF + UV bypass
Dual media filtration + UV
Microsieve + UV
High-rate sedimentation + UV
High chemical demand
Low chemical demand
MODEL

85
Bibliography
AGEB (2012): AG Energiebilanzen: Bruttostromerzeugung in Deutschland 2011 nach Energieträgern, Stand: 14.12.2012 (WG Energy balances: Gross electricity production in Germany 2011 in sources of energy, effective: 14.12.2012).
ATV (2000): A131 Bemessung von einstufigen Belebungsanlagen (A131: Dimensioning of single stage activated sludge plants). Abwassertechnische Vereinigung e.V., Hennef, Germany.
BAUA (2011): Volkswirtschaftliche Kosten der Arbeitsunfähigkeit 2010 (National economic costs of inability to work 2010). Bundesanstalt für Arbeitsschutz und Arbeitsmedizin, Dortmund, Germany.
BWB-AE (2012): personal communication with Carsten Lüdicke and Steffen Keller (BWB-AE).
BWB-GI (2012): personal communication with Corinna Bartholomäus and Katharina Draht (BWB-GI).
BWB (2012): Raumfiltration, research project 2010-2013. Berliner Wasserbetriebe, R&D Department, Berlin, Germany.
DWA (2011): A202: Chemisch-physikalische Verfahren zur Elimination von Phosphor aus Abwasser (Physicochemical processes for elimination of phosphorus from wastewater). Deutsche Vereinigung für Wasserwirtschaft, Abwasser und Abfall e.V, Hennef, Germany.
Ecoinvent (2010): Ecoinvent data v2.2, ecoinvent reports No. 1-26, Swiss Center for Life Cycle Inventories, www.ecoinvent.org. Dübendorf, Switzerland.
EU (2006): Directive 2006/7/EG of the European Parliament and of the Council of 15. Februar 2006 concerning the quality of bathing water. Official Journal (L 64/37), 4.3.2006,
EU (2000): Water Framework Directive: Directive 2000/60/EC of the European Parliament and of the Council establishing a framework for the Community action in the field of water policy. Official Journal (OJ L 327), 22.12.2000,
Eurochlor (2010): Chlorine industry review 2009-2010. Brussels, Belgium. EUROSTAT (2011/12): European Yearbook 2011 and Energy balance sheets 2009-
2010. Publications Office of the European Union, Luxembourg. Gnirss, R. and Dittrich, J. (1998): Weitgehende Reinigung von kommunalem Abwasser:
Entfernung von AOX mittels pulverförmigen Kohlen, Mikrofiltration zur Keim- und P-Entfernung sowie katalytische Denitrifikation. Schlussbericht zum BMBF-Forschungsvorhaben 02 WA 9253/4 (Tertiary treatment of municipal wastewater: elimination of AOX by powdered activated carbon, microfiltration for removal of pathogens and phosphorus, and calatytic denitrification. Final report of BMBF research project 02 WA 9253/4). . Berliner Wasserbetriebe, Berlin, Germany.
Goedkoop, M. J., Heijungs, R., Huijbregts, M. A. J., De Schryver, A., Struijs, J. and Van Zelm, R. (2009): ReCiPe 2008, A life cycle impact assessment method which comprises harmonised category indicators at the midpoint and the endpoint level; First edition Report I: Characterization. http://www.lcia-recipe.net,
Hydrotech (2012): personal communication with Rune Strube and Janne Väänänen (Hydrotech SE).
Inge (2012): personal communication with Patrick Buchta und Martin Thoma (Inge AG). IPCC (2007): Climate Change 2007: Synthesis Report. Contribution of Working Groups I,
II and III to the Fourth Assessment Report of the Intergovernmental Panel on Climate Change IPCC, Geneva, Switzerland.
ISO 14040 (2006): Environmental management - Life Cycle Assessment - Principles and framework. International Standardisation Organisation, Geneva, Switzerland.
ISO 14044 (2006): Environmental management - Life cycle assessment - Requirements and guidelines. International Standardisation Organisation, Geneva, Switzerland.

86
Koehler, A. (2001): Modellierung der Energie- und Stoffstroeme für die Wasserwirtschaft Berlins am Beispiel der Kläranlage Ruhleben (Modelling of energy and material flows of water management in Berlin for wastewater treatment plant Ruhleben). Diplomarbeit, Department of Water Quality Control, Technische Universität, Berlin.
KWB (2013): Oxeram 2: Optimization of flocculation for tertiary filtration processes and evaluation of sustainability of tertiary wastewater treatment, research project 2010-2013. Kompetenzzentrum Wasser Berlin gGmbH (www.kompetenz-wasser.de), Berlin, Germany.
Larsen, H. F., Hansen, P. A. and Boyer-Souchet, F. (2010): EU-NEPTUNE deliverable 4.3 - Decision support guideline based on LCA and cost-efficiency assessment. Technical University of Denmark (DTU), Lingby, Denmark.
Larsen, H. F., Olsen, S. I., Hauschild, M. and Laurent, A. (2009): Methodology for including specific biological effects and pathogen aspects into LCA, NEPTUNE project, EU-FP6 Contract No. 036845, Deliverable 4.2. Technical University of Denmark (DTU) Lyngby, Denmark.
LAWA (2005): Leitlinien zur Durchführung dynamischer Kostenvergleichsrechnungen (KVR-Leitlinien) (Guidelines for dynamic calculation of cost comparison). Länderarbeitsgemeinschaft Wasser, Berlin, Germany.
Maibach, M., Sieber, N., Bertenrath, R., Ewringmann, D., Koch, L., Thöne, M. and Bickel, P. (2007): Praktische Anwendung der Methodenkonvention: Möglichkeiten der Berücksichtigung externer Umweltkosten bei Wirtschaftlichkeitsrechnungen von öffentlichen Investitionen. Forschungsprojekt im Auftrag des UBA, Fkz 203 14 127 (Practical application of methodological convention: Options for inclusion of external environmental costs in calculations of profitability of public investments. Research project funded by UBA, Fkz 203 14 127). Umweltbundesamt, Berlin, Germany.
Mertsch, V., Herbst, H. and Alt, K. (2013): Kosten der Elimination von Spurenstoffen auf kommunalen Kläranlagen (Costs of elimination of trace substances in municipal wastewater treatment plants). RWTH Aachen. Essener Tagung 2013, Aachen.
Remy, C. (2010): Life Cycle Assessment of conventional and source-separation systems for urban wastewater management. Dissertation, Department of Water Quality Control (http://opus.kobv.de/tuberlin/volltexte/2010/2543/), Technical University, Berlin.
Ried, A., Mielcke, J. and Wieland, A. (2009): The Potential Use of Ozone in Municipal Wastewater. Ozone: Science & Engineering 31 (6), 415-421.
Ruhland, A. (2004): Technisch-ökologische und ökonomische Evaluierung alternativer Wasseraufbereitungsverfahren an den Beispielen Arsenelimination und zentrale Trinkwasserenthärtung - Schlussbericht zum BMBF/DVGW Forschungsvorhaben (Techno-ecological and economical evaluation of alternative water treatment methods exemplified by arsenic removal and centralized drinking water softening - Final report of BMBF/DVGW research project). TU Berlin, Department of Water Quality Control, Berlin, Germany.
Schets, F. M., Schijven, J. F. and de Roda Husman, A. M. (2011): Exposure assessment for swimmers in bathing waters and swimming pools. Water Research 45 (7), 2392-400.
Seis, W. (2012): Risk assessment of Braunschweig wastewater reuse scheme. Research project CoDiGreen, Kompetenzzentrum Wasser Berlin, Berlin, Germany.
SenStadt/MUGV (2011): Reduzierung der Nährstoffbelastungen von Dahme, Spree und Havel in Berlin sowie der Unteren Havel in Brandenburg - Gemeinsames Handlungskonzept der Wasserwirtschaftsverwaltungen der Bundesländer Berlin und Brandenburg. Teil 1: Ableitung der länderübergreifenden Bewirtschaftungsziele (Reduction of nutrient loads in Dahme, Spree and Havel in Berlin and lower Havel in Brandenburg - Common plan of actions of water

87
authorities in federal states of Berlin and Brandenburg. Part 1: Deduction of cross-border management targets). Berlin Senate Department for Urban Development and the Environment, Brandenburg Ministry of Environment, Health and Consumer Protection Berlin/Potsdam.
UBA (1997): Umweltverträglichkeit von Chemikalien zur Abwasserbehandlung (Environmental relevance of chemicals for wastewater treatment). UBA-Text 39/97 Umweltbundesamt, Berlin, Germany.
VDI (1997): VDI-Richtlinie 4600: 1997-06: Kumulierter Energieaufwand - Begriffe, Definitionen, Berechnungsmethoden (VDI guideline 4600: 1997-06: Cumulative energy demand - Terms, definitions, calculation methods). VDI Verlag, Düsseldorf, Germany.
VeoliaDT (2012): personal communication on Actiflo(tm) process with Phillipe Sauvignet (Veolia DT).
Von der Waydbrink, G. (2012): Investitionskosten einer Mikrosiebanlage zur weitergehenden Phosphorentfernung (Investment costs of a microsieve filtration unit for advanced phosphorus removal) (Study project). Technical University of Berlin, Berlin, Germany.
VWS (2012a): personal communication on Actiflo(tm) process with Jürgen Barthel (VWS Germany) and Phillippe Sauvignet (Veolia Eau).
VWS (2012b): personal communication with Micro Koehler (VWS Germany). Wedeco (2012): personal communication with Achim Ried (Xylem).

88
Appendix
Figure 36: Design of microsieve filtration + UV (Von der Waydbrink 2012)
Figure 37: Design of high-rate sedimentation + UV (KWB 2013)