dabur india ltd creation • doctor advocacy through medico marketing channel healthcare •...
TRANSCRIPT

DABUR INDIA LTD
INVESTOR PRESENTATIONAUGUST 2016

DABUR OVERVIEW
One of the oldest and
largest FMCG Companies in
the country
World’s largest in Ayurveda and natural healthcare
Total reach of 5.3mn outlets,
one of the highest among
FMCG companies
19 world class manufacturing
facilities catering to needs of diverse markets
Strong overseas
presence with 32%
contribution to consolidated
sales
1.

DABUR & AYURVEDA
Anchored By Heritage
Propelled by Science
Governed by Trust
Ayurveda – A Click Away
LiveVeda.comDoctor
Adcocavy
Creating Ayurvedic ecosystem
2

KEY MANUFACTURING FACILITIES
NepalBangladesh
Sri LankaTurkeyNigeriaEgyptUAE
Baddi, Himachal Pradesh Pantnagar, Uttaranchal Sahibabad,Uttar Pradesh
Jammu, J&K Silvasa,Dadra & NagarHaveli Alwar, Rajasthan
Katni,Madhya Pradesh Narendrapur,West Bengal Pithampur,Madhya Pradesh
Siliguri, West Bengal Newai,Rajasthan Nasik,Maharashtra
3.

STRONG FINANCIAL PROFILE
52.861.5
70.7 78.184.4
FY12 FY13 FY14 FY15 FY16
9.510.9
12.914.7
17.417.9% 17.8% 18.2%
18.9%
20.6%
0.0%
5.0%
10.0%
15.0%
20.0%
25.0%
0
200
400
600
800
1,000
1,200
1,400
1,600
1,800
2,000
FY12 FY13 FY14 FY15 FY16
EBITDA EBITDA margin (%)
6.57.6
9.110.7
12.5
12.2% 12.4% 12.9%13.7%
14.8%
0.0%
2.0%
4.0%
6.0%
8.0%
10.0%
12.0%
14.0%
16.0%
-100
100
300
500
700
900
1,100
1,300
FY12 FY13 FY14 FY15 FY16
PAT PAT margin (%)
In INR Bn
4.

STRONG FINANCIAL PROFILE
*includes Non- Operating income
17.221
26.6
33.5
41.6
FY12 FY13 FY14 FY15 FY16
3.74.4
5.26.1
7.1
FY12 FY13 FY14 FY15 FY16
34.0%38.3%
43.6% 45.2%52.5%
FY12 FY13 FY14 FY15 FY16
5.

DISTRIBUTION FRAMEWORK
Factory
C&F
GT Stockist MT Stockist
Retailer Retailer
Consumer Consumer
Wholesaler
Insti Stockist
Consumer
Factory
C&F
Super Sockist
Sub Sockist
Retailer
Consumer
We reach to 5.3mn Outlets !
6.

DISTRIBUTION EXPANSION
• Rolled out in FY13 to expand direct coverage in rural markets• Direct Village coverage has increased from 14000 villages in FY11 to
44,000 villages in FY15• Focus on increasing efficiency and productivity of the channel
• Aimed at leveraging the potential of Top 130 towns which contribute to 50% of urban consumption
• Segregating the grocery channel teams for wholesale & retail• Initiative is in line with renewed focus on urban markets
• To enhance chemist coverage and provide further impetus to our Health Care portfolio
• Direct Chemist Coverage is currently 213,000 • Strategy is to increase coverage and range for better throughput
7.

BUSINESS STRUCTURE
Dab
urIn
dia
Ltd.
Domestic (68%)
Domestic FMCG (65%)
Others (4%)
International (32%)
Organic International (22%)
Namaste Labs (6%)
Hobi Group (3%)
Note: % figure in brackets indicate % share in Consolidated Sales for FY16* Others include Retail, Commodity exports etc
8.

INDIA BUSINESS
9.
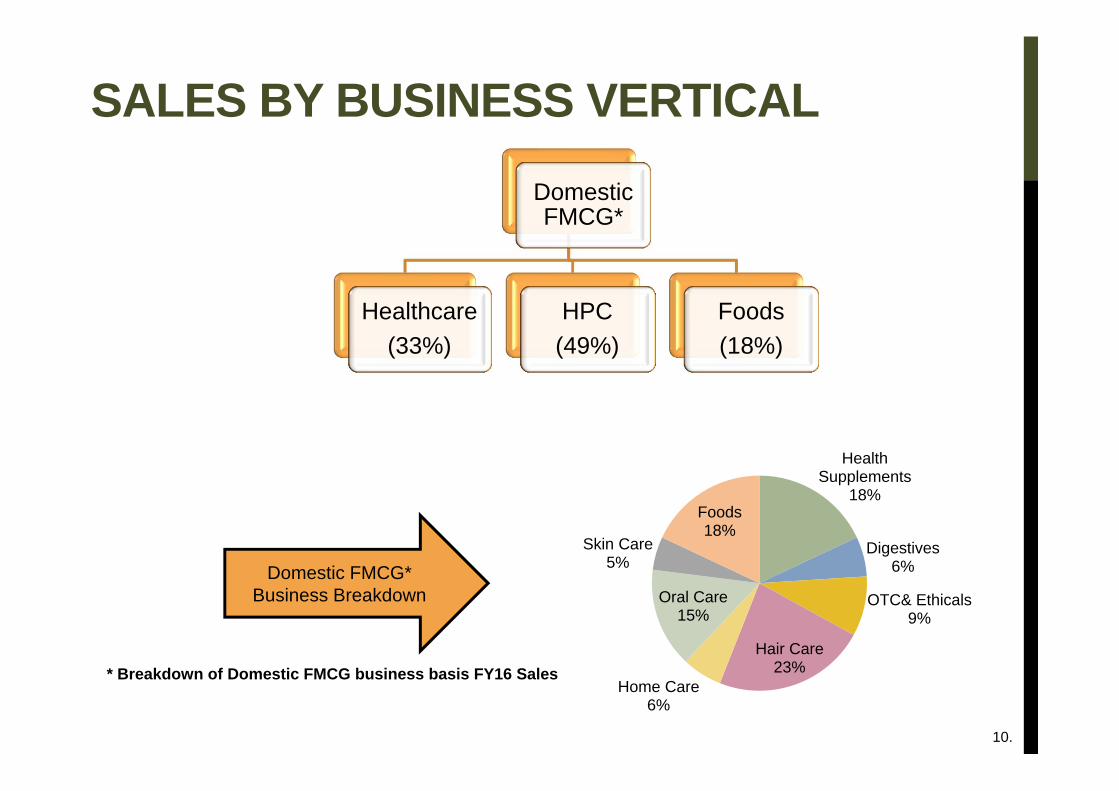
SALES BY BUSINESS VERTICALDomestic FMCG*
Healthcare(33%)
HPC(49%)
Foods(18%)
Domestic FMCG* Business Breakdown
* Breakdown of Domestic FMCG business basis FY16 Sales
10.
Health Supplements
18%
Digestives6%
OTC& Ethicals9%
Hair Care23%
Home Care6%
Oral Care15%
Skin Care5%
Foods18%

BUSINESS STRATEGY
• Leadership in Ayurveda – scientific evidence & research• OTC portfolio to be scaled up through innovation &
awareness creation• Doctor advocacy through Medico Marketing channel
Healthcare
• Ayurvedic / Herbal focus• Premiumization & Differentiation• Strong innovation agenda
Home & Personal Care
• Maintain leadership in Juices & Nectars category• Leveraging the Fruit equity associated with the ‘Real’ brand• Focus on Healthy range of products
Foods
11.

BUILDING CONSUMER CONNECT
12.

FOCUS ON INNOVATIONS
13.

CONTINUE TO BUILD BIGGER BRANDS
16 brands with turnover of INR 1bn+ with 3 brands over 10bn14.

MARKET LEADER IN 6 CATEGORIES
* Position basis Nielsen Market Share data MAT June’16
#Relative Competitive Position
#1 #1 #2 #2 #2 #1 #1 #2 #3 #1 #1
Healthcare Home and Personal Care Foods
15.

INTERNATIONAL BUSINESS
16.

BUSINESS OVERVIEW
Dabur International(FY16)
Organic Business(70%)
Inorganic Business(30%)
• Saudi Arabia, UAEMiddle East
• Egypt, Nigeria, Kenya, South AfricaAfrica
• Turkey, UKEurope• Nepal, Bangladesh, PakistanAsia• USAAmerica
16161 1833823108 24226
27121
FY12 FY13 FY14 FY15 FY16
In INR Mn
Middle East33%
Africa22%
Asia17%
Europe11%
Americas17%
17.
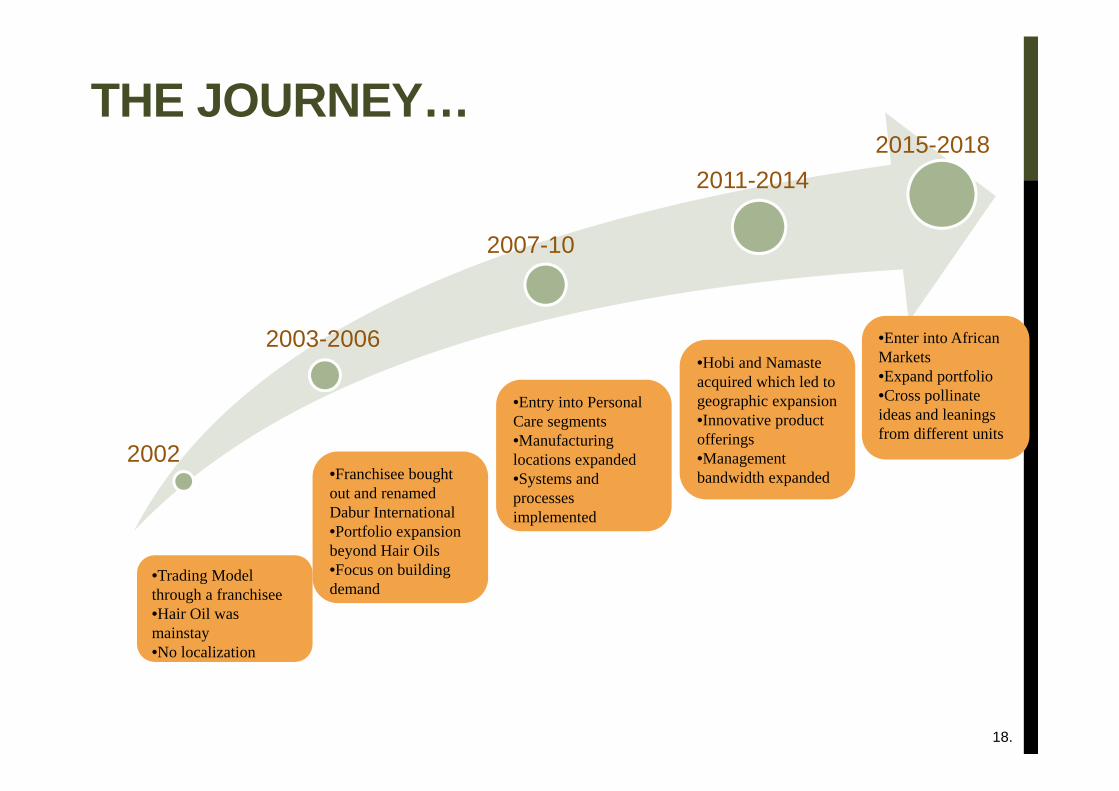
THE JOURNEY…
2002
2003-2006
2007-10
2011-20142015-2018
•Trading Model through a franchisee•Hair Oil was mainstay•No localization
•Franchisee bought out and renamed Dabur International•Portfolio expansion beyond Hair Oils•Focus on building demand
•Entry into Personal Care segments•Manufacturing locations expanded•Systems and processes implemented
•Hobi and Namaste acquired which led to geographic expansion•Innovative product offerings•Management bandwidth expanded
•Enter into African Markets•Expand portfolio•Cross pollinate ideas and leanings from different units
18.

ORGANIC INTERNATIONAL BUSINESS
Hair Oil93%
Oral Care2%
Others5%
The Organic International Business has evolved from being just a Hair Oil business to a diversified personal care entity
Hair Cream13%
Hair Oil39%Oral
Care11%
Others4%
Shampoo14%
Skin Care7%
Styling & Hamamzaith
12%
19.
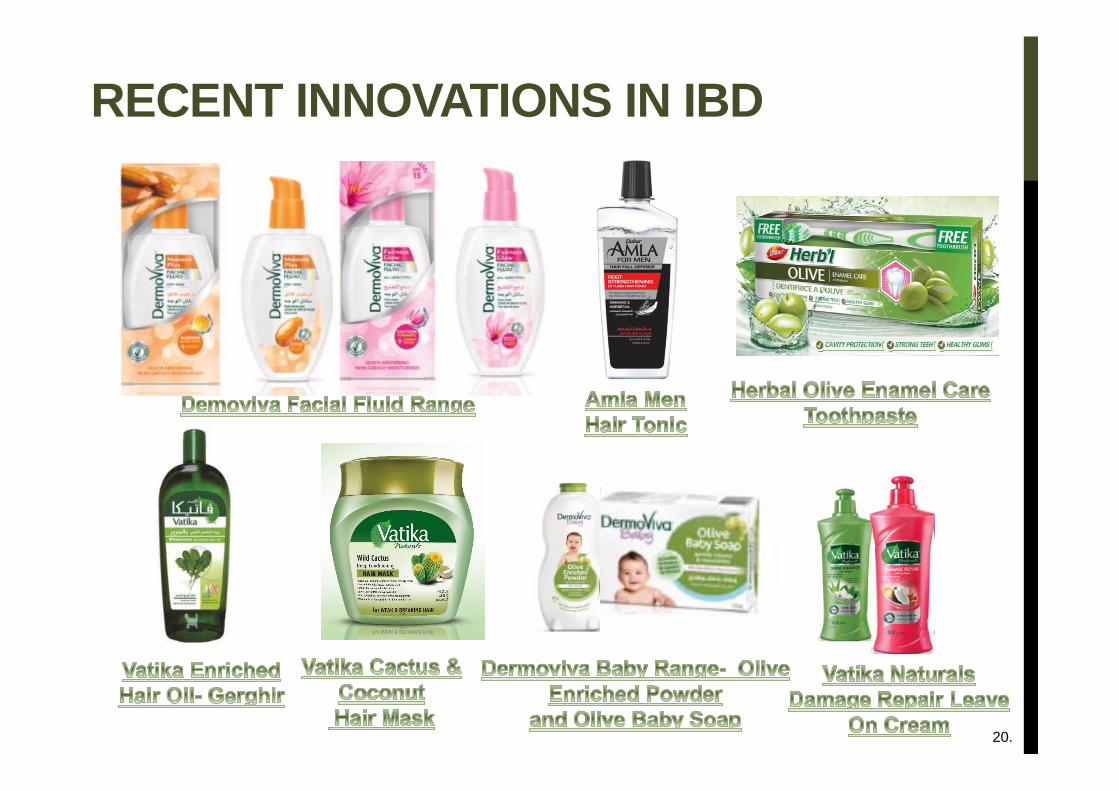
RECENT INNOVATIONS IN IBD
20.

INORGANIC BUSINESS
Key Geographies USA & Africa Key Geography Turkey
Straightening Styling
Shampoo & Conditioner
Hair StylingShampoo
Liquid Soap
Skin & Body Care
21.
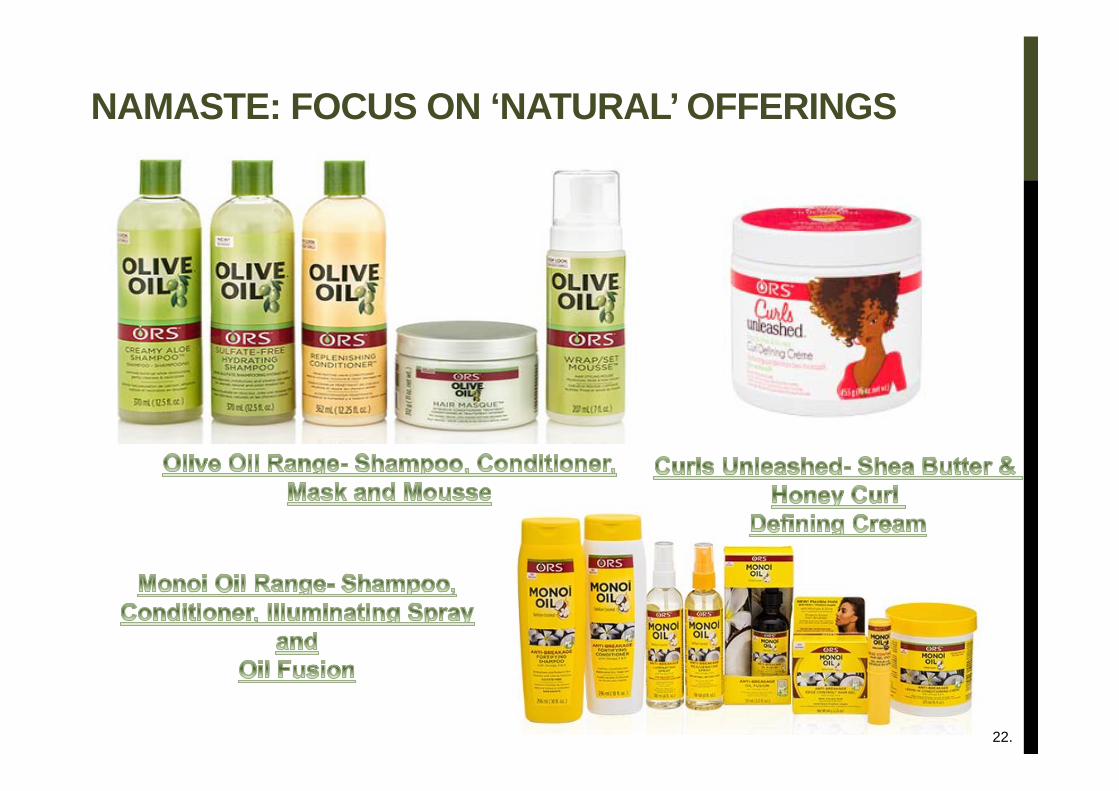
NAMASTE: FOCUS ON ‘NATURAL’ OFFERINGS
22.
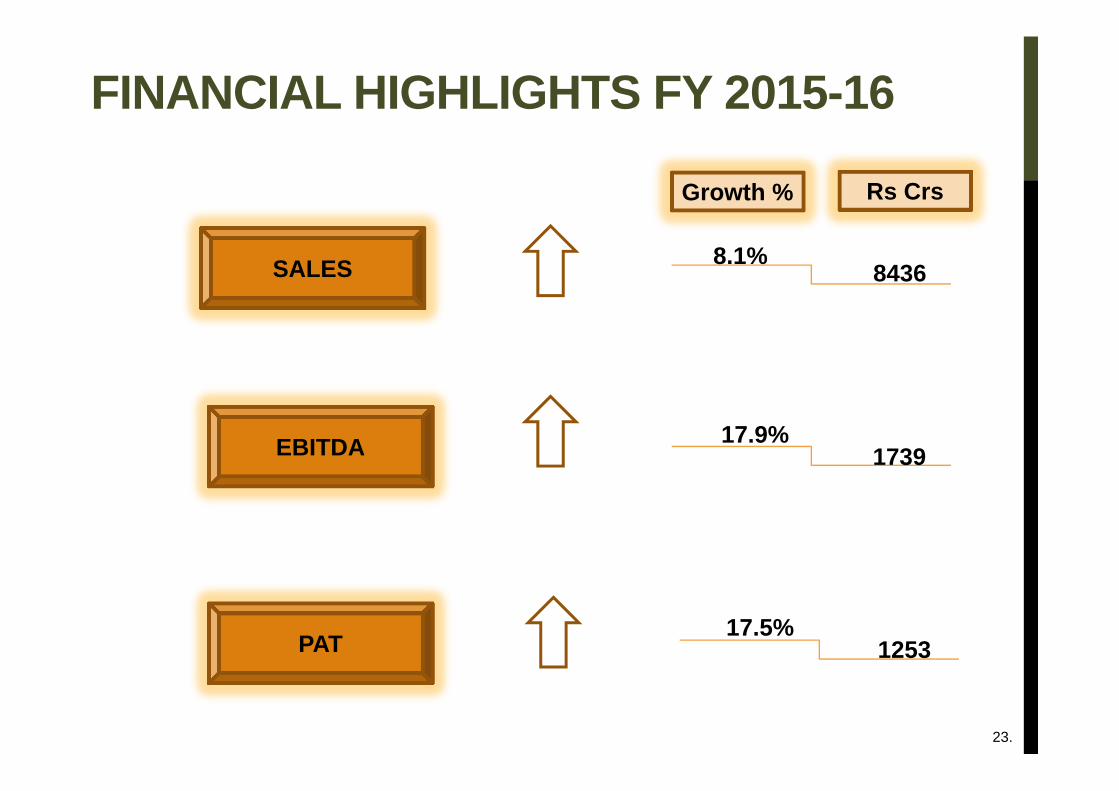
FINANCIAL HIGHLIGHTS FY 2015-16
SALES
EBITDA
PAT
Growth % Rs Crs
8.1%8436
173917.9%
125317.5%
23.

SUSTAINABILITY: A KEY FOCUS
2015 acres under cultivation for rare medicinal herbs in
India
2,110 beneficiary families of our Self –Help Group initiatives
8 States covered under our Agronomical
Initiatives
1,228farmers/beneficiaries of our Agronomical initiatives in India
18,00,000 school kids benefited from
health & oral hygiene programmes
569 women trained at our vocational training centers
24.

SHAREHOLDING AND SHARE PRICE TREND
32% of Dabur’s shares are held by the Public
Promoters68%
FII20%
DII5%
Others7%
25.

SUPERIOR SHAREHOLDER RETURNS
175%150%
175%200%
115%130%
150%175%
200%225%
FY07 FY08 FY09 FY10 FY11 FY12 FY13 FY14 FY15 FY16
^ ^^Bonus issue in FY07 & FY11
INR Bn
82 95 85138 167 185
239313
467 440512
FY07^ FY08 FY09 FY10 FY11^^ FY12 FY13 FY14 FY15 FY 16 Current
26.

CONSOLIDATED P&LDIL (Consolidated) P&L in Rs. million Q1FY17 Q1FY16 YoY (%) FY16Net Sales 19,239 19,017 1.2% 77,616Other Operating Income 45 54 180Material Cost 9,375 9,469 ‐1.0% 37,604% of Sales 48.7% 49.8% 48.4%Employee Costs 2,115 1,890 11.9% 7,941% of Sales 10.99% 9.9% 41.8%Ad Pro 1,965 2,247 ‐12.5% 7,716% of Sales 10.2% 11.8% 40.6%Other Expenses 2,340 2,255 3.8% 9,352% of Sales 12.2% 11.9% 49.2%Operating Profit 3,488.3 3,210.0 8.7% 15,182.9 % of Sales 18.1% 16.9% 19.6%Other Income 610.0 477.3 27.8% 2171.9EBITDA 4,098.3 3,687.3 11.1% 17,354.7 % of Sales 21.3% 19.4% 22.4%Finance Costs 118.2 118.0 0.2% 484.8Depreciation & Amortization 343.2 325.0 5.6% 1331.9Profit Before Tax (PBT) 3636.9 3244.3 12.1% 15538.0Exceptional Item 0.0 0.0 0.0Tax Expenses 701.1 619.8 2999.0PAT(Before extraordinary item) 2935.8 2624.5 11.9% 12539.0% of Sales 15.3% 13.8% 16.2%Extraordinary Item 0.0 0.0 0.0PAT(After extraordinary Items) 2935.8 2624.5 12539.0Minority Interest ‐ Profit/(Loss) 8.4 9.9 ‐15.2% 27.4Share of profit / (loss) of associates & joint venture 0.60 3.75 0.5%PAT (After Minority Int) 2,928 2,618 11.8% 12,511% of Sales 15.2% 13.8% 16.1%
In INR Mn
Note: IND AS implemented w.e.f 1St April,2016 27.

STATEMENT OF ASSETS AND LIABILITIESParticulars As at 31/03/2016
(Audited)As at 31/03/2015
(Audited)Â EQUITY AND LIABILITIES1 Shareholders’ funds(a) Share capital 1759.1 1756.5(b) Reserves and surplus 39841.6 31784.9
Sub-total - Shareholders' funds 41,600.7 33,541.4 2. Minority interest 216.8 181.63. Non-current liabilities
(a) Long-term borrowings 3414.5 2105.7(b) Deferred tax liabilities (net) (c)Long Term Provisions
765.4508.8
587.1462.1
Sub-total - Non-current liabilities 4,688.7 2155.04. Current liabilities
(a) Short-term borrowings 4,497.4 5,229.8 (b) Trade payables 13,301.8 10,958.5 (c )Other current liabilities 3,567.4 5,415.2 (d) Short-term provisions 3,332.0 2,581.4
Sub-total - Current liabilities 24,698.6 24,184.9 TOTAL - EQUITY AND LIABILITIES 71,204.8 61,062.8 B ASSETS
1. Non-current assets(a) Fixed assets 13,732.8 13,060.3 (b) Goodwill on consolidation 6,214.0 6,214.0 (c) Non-current investments 17,873.1 13,874.0 (d) Long-term loans and advances 295.1 207.5 (e) Other non-current assets 181.7 201.3
Sub-total - Non-current assets 38,296.7 33,557.1 2 Current assets
(a) Current investments 7,365.4 4,259.7 (b) Inventories 10,965.0 9,732.7 (c) Trade receivables 8,097.0 7,108.4 (d) Cash and bank balances 2,204.0 2,760.4 (e) Short-term loans and advances 3,265.3 2,788.7 (f) Other current assets 1,011.4 855.8
Sub-total - Current assets 32,908.1 27,505.7 Total -Assets 71,204.8 61,062.8
28.
In INR Mn

Thank You