dacleu siewe vanessa
TRANSCRIPT

UNIVERSITE DE STRASBOURG-UNIVERSITÄT DES SAARLANDES
Discipline : Aspects moléculaires et cellulaires de la biologie- ED414 Science de la vie et de la santé
Présentée par: DACLEU SIEWE Vanessa
MOLECULAR AND STRUCTURAL BASES OF THE SELENOPROTEIN N DYSFUNCTION IN DIVERSE FORMS OF CONGENITAL MUSCULAR DYSTROPHIES
Thèse en cotutelle entre : Architecture et Réactivité de l’ARN UPR 9002 du CNRS
Lehrstuhl fur Strukturbiologie der Universitat des Saarlandes
Co-Directeur de Thèse : Dr. LESCURE Alain
Co-Directeur de Thèse : Prof. Dr. LANCASTER Roy
Localisation : Institut de Biologie Moléculaire et Cellulaire IBMC – 15 rue Rene Descartes, 67084 Strasbourg
Lehrstuhl fur Strukturbiologie der Universität des Saarlandes – Kirrbergerstrasse,
Gebaude 60, 66421 Homburg
Soutenue publiquement le 29 novembre 2017 devant la commission d’examen :
RAPPORTEURS
Dr. Anne Catherine Dock-Bregeon Chercheuse, Station Biologique Roscoff
Prof. Dr. Thorsten Friedrich Enseignant-chercheur, Université de Freiburg
EXAMINATEURS
Dr. Bianca Schrul Junior-professor, Université des Saarlandes
Dr. Marc Ruff Chercheur, IGBMC-Strasbourg

2
Abstract
Selenoproteins are proteins containing a selenocysteine residue (U) in their amino acid sequence.
Twenty-five proteins constitute the human selenoproteome. Among them is Selenoprotein N or
SelenoN; mutations in the SELENON gene can lead to a group of congenital dystrophies now
designated as SELENON-related myopathies. SelenoN is a 72 kDa membrane and glycosylated
protein of the endoplasmic reticulum. It handles in its amino acid sequence a redox motif SCUG
like the one of thioredoxin reductases, and an EF-hand domain which is a calcium binding site.
Recent studies showed the implication of SelenoN in muscle development and maintenance, and
position its function at the crossroad between oxidative stress control and calcium homeostasis.
However, its catalytic function remains elusive. The research project presented in this thesis
concerns the crystallization, characterization and comparison of one bacterial and the zebrafish
SelenoNs. Bioinformatics analyses revealed that the two proteins share 37% degree of identity
and a common domain which corresponds to a thioredoxin fold of unknown function which
includes the redox motif SCUG. From the biophysical characterization, both recombinant proteins
are found to be naturally well-folded and enriched in α-helical domains. The bacterial SelenoN
which handles an additional C-terminal thioredoxin domain is an extended monomer whereas
zebrafish SelenoN is a compact dimer. Biochemical characterization indicated that Ca2+ binding
mediates zSelenoN oligomerization. Initial crystals of the zSelenoN in its deglycosylated form were
obtained. Bacterial SelenoN crystallization yielded crystals belonging to two different space
groups with different cell parameters. An initial partial model covering the C-terminal thioredoxin
domain of the bacterial SelenoN was obtained at 2.3Å. Together, these results lay a foundation for
the structure-function studies of SelenoN. Conditions for recombinant bacterial and zebrafish
SelenoNs expression, purification and crystallization were optimized and strategies for solving the
structure are being proposed.
Keywords : Selenoprotein, SelenoN, X-ray diffraction

3
Résume
Les Selenoprotéines sont des protéines contenant un résidu sélénocystéine (U) dans leur
séquence en acide amines. Vingt-cinq sélénoprotéines constituent le sélénoprotéome humain.
Parmi elles, la sélénoprotéine N ou SelenoN ; des mutations dans le gène SELENON donnent lieu
à un groupe de dystrophies musculaires congénitales appelées myopathies liées à SELENON.
SelenoN est une protéine membranaire glycosylée de 72 kDa localisée dans le réticulum
endoplasmique. Sa séquence en acide aminés contient le motif redox SCUG, similaire à celui des
thioredoxines réductases. Elle contient de même un domaine EF-hand qui est un domaine de
liaison au calcium. Des études ont récemment démontré l’implication de cette protéine dans
l’établissement et la maintenance du muscle squelettique. D’autres études ont montré qu’elle
joue un rôle dans la protection contre le stress oxydatif et l’homéostasie du calcium. Cependant,
le mécanisme catalytique de SelenoN reste inconnu à ce jour. Le projet décrit dans cette thèse
s’intéresse à la caractérisation, la cristallisation et la comparaison des SelenoNs d’une bactérie,
Candidatus poribacteriae, et du poisson zèbre. Les études bio-informatiques ont démontré que
SelenoN bactérienne et du poisson zèbre partagent 37% d’identité et un domaine commun
correspondant à un repliement de type thioredoxine de fonction inconnue, contenant le motif
redox. Les caractérisations biophysiques ont démontré que les deux protéines sont naturellement
bien repliées et riche en hélices α. La protéine bactérienne comportant en C-terminal de sa
séquence en acide aminé un domaine thioredoxine additionnel, présente une forme étendue et
est sous forme monomérique tandis que la protéine du poisson zèbre est un dimère compact. Des
caractérisations biochimiques ont montré que le Ca2+ influence l’oligomérisation ou la
conformation de SelenoN du poisson zèbre. Des cristaux initiaux de la protéine eucaryote sous sa
forme déglycosylée ont pu être obtenus. La cristallisation de la protéine bactérienne a permis
d’obtenir des cristaux appartenant à deux groupes d’espaces, avec des paramètres de cellule
différents. Néanmoins, un model partiel à 2.3 Å couvrant le domaine C-terminal thioredoxine
additionnel de SelenoN bactérienne a été obtenu. L’ensemble de ces résultats permettent de
poser les bases de l’étude structure-fonction de SelenoN. L’expression, la purification et la
cristallisation ont été optimisées et une stratégie pour résoudre la structure 3D de la protéine est
proposée.
Mots cles : Selenoproteine, SelenoN, Crystallisation aux rayons-X

4
Abstrakt
Selenoproteine sind Proteine, die in ihrer Aminosäuresequenz einen Selenocystein Rest (U)
enthalten. Fünfundzwanzig Proteine bilden das menschliche Selenoprotein.
Unter denen ist Selenoprotein N oder SelenoN ; Mutationen im SELENON-Gen können zu einer
Gruppe von kongenitalen Dystrophien führen, die jetzt als SELENON-verwandte Myopathien
bezeichnet werden. SelenoN ist eine 72 kDa-Membran und ein glycosyliertes Protein des
endoplasmatischen Retikulums. Es behandelt in seiner Aminosäuresequenz ein Redoxmotiv SCUG
wie das von Thioredoxinreduktasen und eine EF-Handdomäne, die eine Calciumbindungsstelle ist.
Jüngste Studien zeigten die Bedeutung von SelenoN bei der Muskelentwicklung und -erhaltung
und positionieren seine Funktion an der Schnittstelle zwischen der Kontrolle des oxidativen
Stresses und der Calciumhomöostase. Ihre katalytische Funktion bleibt jedoch schwer. Das in
dieser Arbeit vorgestellte Forschungsprojekt befasst sich mit der Kristallisation, Charakterisierung
und dem Vergleich von einem Bakterium und den SelenoNs des Zebrafisches. Bioinformatische
Analysen zeigten, dass die beiden Proteine einen Identitätsgrad von 37% und eine gemeinsame
Domäne teilen, die einer Thioredoxinfaltung unbekannter Funktion entspricht, die das
Redoxmotiv SCUG umfasst. Aus der biophysikalischen Charakterisierung wurde herausgefunden,
dass beide rekombinanten Proteine natürlich gut gefaltet und α -helikalen Domänen angereichert
sind. Das bakterielle SelenoN, das eine zusätzliche C-terminale Thioredoxin-Domäne handhabt,
ist ein verlängertes Monomer, während der Zebrafisch SelenoN ein kompaktes Dimer ist. Die
biochemische Charakterisierung zeigte, dass die Ca 2+ -Bindung die ZSelenoN-Oligomerisierung
vermittelt. Es wurden anfängliche Kristalle des zSelenoN in seiner deglycosylierten Form erhalten.
Die bakterielle SelenoN-Kristallisation ergab Kristalle, die zu zwei verschiedenen Raumgruppen
mit unterschiedlichen Zellparametern gehörten. Ein anfängliches Teilmodell, das die C-terminale
Thioredoxin-Domäne des bakteriellen SelenoN abdeckt, wurde bei 2,3 Å erhalten. Zusammen
bilden diese Ergebnisse eine Grundlage für die Struktur-Funktions-Studien von SelenoN. Die
Bedingungen für die Expression, Reinigung und Kristallisation von SelenoNs in rekombinanten
Bakterien und Zebrafischen wurden optimiert und Strategien zur Lösung der Struktur
vorgeschlagen.
Schlüsselwörter: Selenoprotein, SelenoN, Röntgenbeugung

5
Acknowlegments
My first thanks go to Dr. Alain Lescure for giving me the opportunity to work on this wonderful and
so exciting project. He has been all along the project a wonderful supervisor by bringing me all the
scientific and mental support that I needed. He always showed a real interest in all my experiments
and a contagious enthusiasm during our communications.
I would also like to thank all the team working on Selenoprotein N in Strasbourg for their support:
Melanie Thamy-Brayes (ma noisette!), Mireille Baltzinger (Madame Pichia pastoris), Luc Thomes
(l’informaticien de la team).
I would like to thank Prof. Dr. C. Roy Lancaster for introducing me to Dr. Lescure and for the
methodological and financial support of this work. The experiments which led to the results of this
work were for the main part performed in the laboratory of Professor Lancaster.
Furthermore, I would like to thank Dr. Yvonne Carius for her intensive care. She always found the
time for scientific discussion and to make me share her experience. Equally gratefull to Birgit
Herrmann for the long discussion about life and her disponibility. Not forgetting the entire
Structural Biology team for welcoming me as a full member, and for making my integration and
working environment pleasant.
I would also like to thank all the people involved in organization of the French-German PhD Track
program especially Dr Jöern Putz who gave me the opportunity to be a pioneer of this program.
Finally, I would like to thank the following persons who were always a support during my studies
and in this thesis writing: my lovely mothers Ndengue Madeleine and Mboue Yvonne, my brothers
Dacleu Antonin, Lowe Landry, my sisters Dr. Dacleu Ndengue Jessica and Dacleu Djiengue Lesly,
my sweetheart Ekuh Jude for his comprehensive support during the writing, and of course all my
lovely nephews.
Thanks for this!

6
Abbreviations
ATP Adenosine Tri Phosphate
AU Absorption Unit
Amp Ampicillin
APS Ammoniumperoxodisulfat
bSelenoN Bacterial Selenoprotein N
BSA Bovine serum albumine
Cam Chloramphenicol
CD Circular dichroism
CHAPS 3-[(3-Cholamidopropyl)-
Diméthylammonio]-1-Propane Sulfonate
C-terminus Protein carboxy-terminal end
DM Decyl-β-maltoside
DDM Dodecyl-β-maltoside
DMSO Dimetyhlsulfoxide
DNA Deoxyribose nucleic acid
EDTA Ethylene diamine tetra acetic
EGTA Ethylene glycol tetraacetic acid

7
ER Endoplasmic reticulum
h hour
Ig Immunoglobulin
IPTG Isopropyl ß-D-Thiogalactopyranoside
kDa Kilodalton
LB Lysogeny Broth
MES 2-(N-morpholino) ethanesulfonic acid
min minute
MOPS 3-(N-morpholino) propanesulfonic acid
Ni-NTA Nickel-Nitrilotriacetic acid
OD Optical dansity
OG Octyl glucoside
PDB Protein data bank
RyR Ryanodine receptor
SAXS Small angle X-ray scattering
SelenoN Selenoprotein N
TM Transmembrane
zSelenoN Zebrafish Selenoprotein N

8
Table of Contents
1 Introduction ......................................................................................................................................... 16
1.1 Selenocysteine, the 21st amino acid of the genetic code ............................................................ 17
1.1.1 The trace element selenium and human health ................................................................. 17
1.1.2 Biological forms of selenium ............................................................................................... 18
1.1.2.1 Chemical forms of selenium used in biomolecules ......................................................... 18
1.1.2.2 Selenocysteine ................................................................................................................. 19
1.1.3 Incorporation of selenocysteine during the translation process ......................................... 20
1.2 Selenoproteins – a structural perspective ................................................................................... 22
1.2.1 The Selenoproteome ........................................................................................................... 22
1.2.2 Structural motif conserved over the selenoproteome -The thioredoxin fold .................... 24
1.2.3 Structural Organization and Function of Sec containing oxidoreductases .......................... 26
1.2.3.1 Thioredoxin reductase ..................................................................................................... 26
1.2.3.2 Glutathione peroxidase ................................................................................................... 28
1.2.3.3 Methionine-R-sulfoxide reductase1 ................................................................................ 28
1.2.4 Structural organization of mammalian ER resident selenoproteins .................................... 29
1.2.4.1 Selenoprotein K (SelenoK) ............................................................................................... 31
1.2.4.2 Selenoprotein S (SelenoS) ............................................................................................... 31
1.2.4.3 Type 2 Iodothyronine Deiodinase 2 (DIO2) ..................................................................... 32
1.2.4.4 Selenoprotein T (SelenoT) ............................................................................................... 33
1.2.4.5 Selenoprotein M (SelenoM) and Selenoprotein F (SelenoF or Sep 15) ........................... 34
1.3 Selenoprotein N ........................................................................................................................... 36
1.3.1 SELENON gene and diseases................................................................................................ 36
1.3.1.1 SELENON Related Myopathies ......................................................................................... 36
1.3.1.2 SELENON and breast cancer ............................................................................................ 36
1.3.2 Selenoprotein N associated functions ................................................................................. 38
1.3.2.1 Function in muscle establishment and maintenance ...................................................... 38
1.3.2.2 Calcium concentration regulation: Ryanodine receptor and SERCA1 activities control .. 38
1.3.2.3 Cell redox homeostasis and cell defense against oxidative damages ............................. 40

9
1.3.3 Description of SelenoN associated domains ....................................................................... 40
1.3.3.1 The eukaryotic SelenoproteinN ....................................................................................... 40
1.3.3.2 Bacterial Selenoprotein N ................................................................................................ 42
1.4 Aim of the thesis and theoretical methodology .......................................................................... 44
2 Materials and Methods ............................................................................................................................ 46
2.1 Materials ...................................................................................................................................... 47
2.1.1 Chemicals ............................................................................................................................. 47
2.1.2 Standards, enzymes, antibodies .......................................................................................... 49
2.1.3 Commercial kits ................................................................................................................... 50
2.1.4 Purification material ............................................................................................................ 50
2.1.5 Equipment and accessories ................................................................................................. 51
2.1.6 Supplie and other material .................................................................................................. 53
2.1.7 Computer program .............................................................................................................. 55
2.1.8 ESRF Beamlines .................................................................................................................... 56
2.1.9 Buffers and stock solutions .................................................................................................. 57
2.1.10 Gels ...................................................................................................................................... 59
2.1.10.1 SDS-PAGE gels .............................................................................................................. 59
2.1.10.2 Clear Native PAGE ........................................................................................................ 60
2.1.11 Media for cell culture .......................................................................................................... 61
2.1.12 Buffers for purification......................................................................................................... 62
2.1.13 Biological material ............................................................................................................... 64
2.1.13.1 Vectors ......................................................................................................................... 64
2.1.13.2 Escherichia coli and HEK cells strains ........................................................................... 66
2.2 Methods ...................................................................................................................................... 67
2.2.1 Biochemical Methods .......................................................................................................... 67
2.2.1.1 Heterologeous expression in different systems............................................................... 67
2.2.1.2 Recombinant protein purification ................................................................................... 73
2.2.2 Biophysical methods ............................................................................................................ 75
2.2.2.1 Small Angle X-ray Scattering (SAXS) in line with Size Exclusion Chromatography (SEC) .. 75
2.2.2.2 Secondary structure studies using circular dichroism spectroscopy ............................... 80
2.2.3 X-ray crystallography ........................................................................................................... 82

10
2.2.3.1 Crystallogenesis ............................................................................................................... 83
2.2.3.2 X-ray diffraction and data analysis ................................................................................... 87
2.2.3.2.3.2.3 Single or Multiple Wavelength Anomalous Dispersion ........................................... 90
3 Results ................................................................................................................................................. 93
3.1 Bioinformatic analysis of bacterial and zebrafish SelenoN amino acid sequences ..................... 94
3.2 Results on zebrafish selenoN ....................................................................................................... 97
3.2.1 Overexpression, purification and biophysical characterization of zebrafish SelenoN ......... 97
3.2.1.1 Overexpression of the zebrafish SelenoN in mammalian cells HEK293 .......................... 97
3.2.1.2 Detergent and additives screening .................................................................................. 99
3.2.1.3 Optimization of the purification protocol...................................................................... 102
3.2.1.4 Effect of bivalent ion ...................................................................................................... 104
3.2.1.5 Biophysical parameters from the SAXS measurement .................................................. 106
3.2.1.6 Ab initio modelling of zSelenoN .................................................................................... 110
3.2.1.7 Secondary structure studies .......................................................................................... 113
3.2.2 Crystallization of zebrafish SelenoN and optimization ...................................................... 115
3.3 Results on Candidatus poribacteriae SelenoN .......................................................................... 118
3.3.1 Overexpression, purification and biophysical characterization of bacterial SelenoN ....... 118
3.3.1.1 Overexpression and purification ................................................................................... 118
3.3.1.2 Biophysical parameters from the Size exclusion chromatography coupled with Small
Angle Light Scattering measurement ............................................................................................ 120
3.3.1.3 Ab initio modelling of bacterial SelenoN ....................................................................... 123
3.3.1.4 Secondary structure studies .......................................................................................... 125
3.3.2 Crystallization of bacterial SelenoN and X-ray diffraction experiments ............................ 127
3.3.2.1 Crystallization of native SelenoN ................................................................................... 127
3.3.2.2 SeMet-SelenoN purification, crystallization and crystals derivatization ....................... 130
3.3.3 Molecular replacement of the bacterial SelenoN ............................................................. 134
4 Discussion .......................................................................................................................................... 136
4.1 Bioinformatic analysis of bacterial and zebrafish amino acid sequences ................................. 137
4.2 Zebrafish SelenoN ...................................................................................................................... 139
4.2.1 Expression/Purification and biophysical characterization of the recombinant zebrafish
SelenoN 139

11
4.2.2 Ca2+ effect on zebrafish SelenoN ....................................................................................... 142
4.2.3 Crystallization and structural studies in solution of the zebrafish SelenoN ...................... 143
4.3 Candidatus poribacteriae SelenoN ............................................................................................ 145
4.3.1 Expression/Purification and biophysical characterization of the recombinant bacterial
SelenoN 145
4.3.2 Structural studies of the recombinant bacterial SelenoN ................................................. 146
4.3.3 The bacterial SelenoN thioredoxine-like fold .................................................................... 147
4.4 Comparison between bacterial and zebrafish SelenoN ............................................................ 149
5 Conclusion and perspectives ............................................................................................................. 151
6 Appendix ............................................................................................................................................ 156
7 References ......................................................................................................................................... 162

12
List of Figures
Figure 1: Different chemical forms of selenium used in biomolecules. ...................................... 19
Figure 2: Comparison of Selenocysteine to similar amino acids Serine and Cysteine ................ 19
Figure 3 Synthesis of Sec-tRNA SerSec in Eukaryotes .................................................................. 21
Figure 4: Eukaryotic Sec-insertion machinery. ............................................................................. 21
Figure 5: The thioredoxin-fold is well represented among the selenoproteome ....................... 25
Figure 6: NADPH dependant reduction reaction of Thioredoxine by thioredoxine reductase .. 27
Figure 7: Structure (A) and Domain organization (B) of mammalian Thioredoxine Reductases.
........................................................................................................................................................ 27
Figure 8: Domain organization of ER selenoproteins ................................................................... 30
Figure 9: 3D Structure and Topology of DIO3 catalytic domain. ................................................. 33
Figure 10: NMR structure of Selenoprotein M (with CxxU motif) and Selenoprotein F (with CxU
motif). ............................................................................................................................................. 35
Figure 11 : Clinical effect of SELENON mutations on children affect by muscular congenital
disorders ........................................................................................................................................ 37
Figure 12: Schematic representation of the topology of the human SelenoN in the
endoplasmic reticulum lumen and of its bioinformatics predicted domains. ............................ 41
Figure 13 : Reaction mechanism for mammalian TrxR ................................................................ 41
Figure 14: Structural organization of an EF hand domain ............................................................ 42
Figure 15: Schematic representation of the bacterial SelenoN and comparison to its human
ortholog .......................................................................................................................................... 43
Figure 16: Flowchart of the methodology to be used for SelenoN structural studies ................ 45
Figure 17: Vectors used for bacterial SelenoN expression in E coli ............................................. 65
Figure 18: pcDNA5 vector used for zebrafish SelenoN expression in HEK 293 Trex cells ........... 65
Figure 19 Flowchart of expression in suspension ......................................................................... 72
Figure 20 Flowchart of expression adherent culture ................................................................... 72
Figure 21: Schematic representation of a SAXS experiment. ...................................................... 76
Figure 22: Workflow used for SAXS data processing. .................................................................. 76
Figure 23 example of Guinier traces of a sample with aggregate Vs no aggregation ................ 77
Figure 24: different Kratky traces that describe different protein shapes .................................. 78
Figure 25: circular discroism spectroscopy principle and Circular dichroism spectra of α helices,
β-sheet and rancom coil ................................................................................................................ 81
Figure 26: Circular Dichroism spectra profiles of a folded vs unfolded protein ......................... 81
Figure 27: Workflow to assess a protein model using x-ray crystallography .............................. 82
Figure 28: Phase diagram representing the protein concentration against any adjustable
parameters ..................................................................................................................................... 84

13
Figure 29: Crystallization by vapor diffusion technique .............................................................. 86
Figure 30: Principle of microseeding technique ........................................................................... 86
Figure 31 : schematic representation of the alignment between zebrafish, human and
bacterial SelenoN proteins. ........................................................................................................... 96
Figure 32 schematic representation of bioinformatics analysis of zebrafish and bacterial
SelenoN amino acid sequences with the program SWISSMODEL online .................................... 96
Figure 33 : Mammalian HEK 293T cells in adherent and in suspension cultures. ....................... 98
Figure 34: zSelenoN solubilization and purification using different detergents. ...................... 101
Figure 35 :Detergent/ additives screening ................................................................................. 101
Figure 36 :Chromatography purification of zebrafish SelenoN ................................................. 103
Figure 37: Effect of bivalent ions on zSelenoN oligomeric status. ............................................. 105
Figure 38 Curves and Structural parameters derived from HPLC-SAXS performed on zebrafish
SelenoN. ....................................................................................................................................... 108
Figure 39 : Ab initio modelling of zSelenoN ................................................................................ 111
Figure 40 :Evaluation of the secondary structure of the recombinant zSelenoN using CD
spectroscopy ................................................................................................................................ 114
Figure 41 :zSelenoN deglycosylation essays ............................................................................... 116
Figure 42: Optimization of zSelenoN crystallization trial. ......................................................... 117
Figure 43 : zebrafish SelenoN crystals obtained after seeding .................................................. 117
Figure 44 :Purification of the Candidatus poribacteriae SelenoN ............................................. 119
Figure 45 Curves and Structural parameters derived from HPLC-SAXS analysis of the bacterial
SelenoN. ....................................................................................................................................... 121
Figure 46 Ab initio modelling of the bacterial SelenoN using two approaches ........................ 123
Figure 47 :Evaluation of the secondary structure of the recombinant bacterial SelenoN using
CD spectroscopy........................................................................................................................... 126
Figure 48: Crystals of bacterial SelenoN were obtained in different conditions. ..................... 128
Figure 49: Purification of the Selenomethionine labelled bacterial SelenoN ........................... 131
Figure 50: Crystal of bacterial SeMet-SelenoN and its x-ray diffraction. .................................. 133
Figure 51: Crystals of Ta6Br12 soaked bacterial selenomethionine-SelenoN............................. 133
Figure 52: Molecular replacement of the bacterial SelenoN. .................................................... 135
Figure 53: Models from SWISSMODEL of the two-main domain found on bacterial and
zebrafish SelenoN. ....................................................................................................................... 138
Figure 54: The C-terminal thioredoxine-like fold of the bacterial SelenoN .............................. 148

14
List of Tables
Table 1 :List of proteins of the human selenoproteome and their function ................................ 23
Table 2: Chemicals ......................................................................................................................... 47
Table 3: Standards ......................................................................................................................... 49
Table 4: Enzymes ........................................................................................................................... 49
Table 5 : Primary and secondary antibodies ................................................................................. 49
Table 6: Crystallisation screens ..................................................................................................... 50
Table 7: Column and matrix used for Chromatography ................................................................ 50
Table 8: Equipment ....................................................................................................................... 51
Table 9: Supplies ............................................................................................................................ 53
Table 10: Computer program ........................................................................................................ 55
Table 11: ESRF beamlines used and their characteristics ............................................................. 56
Table 12: Buffers, Stock solutions and their composition ............................................................ 57
Table 13: Buffers, Stock solutions and their composition ............................................................ 58
Table 14: Media for Escherichia coli culture ................................................................................. 61
Table 15: Media for HEK 293 Trex cells culture ............................................................................ 61
Table 16: Buffers used for bacterial SelenoN purification ............................................................ 62
Table 17 : Buffers used for zebrafish SelenoN purification ........................................................... 63
Table 18 : Vectors and their specifications ................................................................................... 64
Table 19: SAXS SelenoN sample details ........................................................................................ 79
Table 20: Software employed for SelenoN SAXS data reduction analysis and interpretation ..... 79
Table 21 Structural parameters calculated from the HPLC-SAXS of the purification peak 2 of the
zebrafish SelenoN ......................................................................................................................... 109
Table 22: Shape calculation and model-fitting result of zSelenoN ............................................. 112
Table 23: Structural parameters calculated from the SAXS data analysis of the bacterial
SelenoN. ....................................................................................................................................... 122
Table 24: Shape calculation and model-fitting results of bacterial SelenoN .............................. 124
Table 25: Data statistics after autoprocessing by EDNA of different bSelenoN crystals ............ 128
Table 26: Best crystal of bacterial SelenoN data statistics after processing with Mosflm ......... 129
Table 27: Data statistics of Selenomethionine SelenoN crystal soaked in Ta6Br12. .................... 134
Table 28: Comparison of zebrafish and Candidatus poribacteriae SelenoN............................... 150

15

Introduction
16
1 Introduction

Introduction
17
1.1 Selenocysteine, the 21st amino acid of the genetic code
1.1.1 The trace element selenium and human health
Selenium (Se) is an essential trace element that is involved in many areas of vital importance to
human and animal health. It is found in the activity center of several redox enzymes participating
in numerous functions (reviewed in Labunskyy et al. 2014). Studies based on
deficiency/supplementation of Se in area where the soil contains low level of the element
highlighted its importance in various aspects of human and animal health.
A relationship between selenium and immune function was established as it is normally present
in immune tissues and Se supplementation was found to have an immune stimulant effect on
humans (Kiremidjian-Schumacher et al. 2017.). A relationship between Se and the virulence level
of some viruses was established as it was demonstrated that in Se-deficient hosts, harmless
viruses can turn virulent. In fact, a benign strain of coxsachie virus when inoculated in Se-deficient
mice becames virulent due to mutations in the genome, causing the Keshan Disease (Beck 1999).
A relation was also established between HIV and Selenium. Studies showed that Se-deficient HIV
patients are twenty times more likely to die from HIV-related causes (Baum et al. 1997).
Concerning the reproduction function, administration of Se supplement to livestock prevented
early pregnancy loss (Hidiroglou 1979). In male fertility both in humans and animals, Se was
required for testosterone synthesis and the formation and development of reproduction cells
(Behne, Weiler, and Kyriakopoulos 1996).
There are also evidence for the importance of Se for brain function, as In Alzheimer’s patient, Se
level in the brain was measured to be 60% less than in a control panel (Hawkes and Hornbostel
1996). Also, Se deficiency correlates with an altered turnover rate of some neurotransmitters. On
the other hand, it was found that Se supplementation helped to decrease anxiety, depression and
tiredness (Benton and Cook 1990).
Thyroid hormones metabolism was also related to Se as the enzymes that drive the pathway are

Introduction
18
Se containing proteins. Their activity is directly related to Se level and availability (Bianco et al.
2002).
There is evidence of a protective effect of Se against cardiovascular diseases as well as pancreatitis
and cancer. A study made in China where Hepatocellular Carcinoma (HCC) is the highest cause of
cancer mortality, revealed that supplementation with Se led to a decrease of 35% of HCC in
comparison to a control panel (Yu, Zhu, and Li 1997).
1.1.2 Biological forms of selenium
1.1.2.1 Chemical forms of selenium used in biomolecules
There are several biological forms of Se (Figure 1). Some forms are bacterial specific such as the 5-
methylaminomethyl-2-selenouridine, an analogue of uridine where Sulfur atoms are replaced by
Se atoms by the enzyme 2-selenouridine synthase which uses selenophosphate as Se donor. The
molecule is found in the anticodon of some bacterial tRNA including tRNAGlu, tRNAGln, tRNALys
(A J Wittwer et al. 1984; A J Wittwer 1983; A J Wittwer and Ching 1989) and is believed to improve
the fidelity of the translation (Caton-williams and Huang 2008).
Selenoneine is analogue of ergothioneine, a naturally occurring amino acid derivative of histidine.
Selenoneine is mostly found in fish. Notably, it is the major form of organic selenium in tuna
(Yamashita and Yamashita 2010). This specific form of selenium binds to heme-protein such as
hemoglobin and has an antioxidant ability. It was also found to be involved in mercury detoxication
in fish (Yamashita et al. 2011).
Selenomethionine is a naturally occurring amino acid. It is the major form of selenium found in
plants. It is a very important dietary form of selenium which is accessible to animals via protein
plants. Ingested SeMet is either convert into active forms of selenium via the transulfurase
pathway or stored as selenium stock in place of methionine in body proteins (reviewed in Weekley
and Harris 2013).
Monoselenophosphate is synthesized from ATP and selenide by the selenophosphate synthetase
(Lacourciere 1999). It is an intermediate for selenoenzymes (Figure 1) and tRNAs synthesis and act
as Se donor (Caton-williams and Huang 2008).

Introduction
19
1.1.2.2 Selenocysteine
Selenocysteine is an analogue of cysteine in which sulfur atom of the thiol group is replaced by
selenium atom to form a selenol group (Figure 2). Due to the value of its pKa (pKa=5.24), this group
presents the advantage of been ionized at physiologic pH. Thus, this amino acid is a better
nucleophilic group than Cysteine (pKa 8.25) and enables the selenoproteines to have a higher
reactivity (Cunniff et al. 2014). It has been demonstrated that many selenoproteins are involved
in reduction oxidation (redox) reactions (Fomenko and Gladyshev 2003) that drive a wide range
of functions in animal and humans.
Figure 1: Different chemical forms of selenium used in biomolecules.
Selenocysteine (Sec, U). (2) 5-Methylaminomethyl-2-selenouridine. (3) Selenoneine. (4) Selenomethionine (SeMet).
(5) Monoselenophosphate (Reich and Hondal 2016).
Figure 2: Comparison of Selenocysteine to similar amino acids Serine and Cysteine
(www.riken.jp/en/pr/press/2010/20100813/)

Introduction
20
1.1.3 Incorporation of selenocysteine during the translation process
Selenocysteine is known as the 21st amino acid of the genetic code. Its incorporation is a
dedicated process as it is directed by the UGA codon, which is normally the stop codon „opal“.
The reprogramming of an opal codon requires several specific factors, particularly the presence
on the mRNA of a specific secondary structure, named selenocysteine insertion sequence (SECIS).
There is no Sec tRNA Synthetase, the synthesis of the SelenyltRNASec (SectRNASec) occurs as a
tRNA-dependant modification of the SeryltRNASec (SertRNASec).
In eukaryotes, the first step of this synthesis is the aminoacylation of the tRNASec with serine (Ser)
to produce SertRNASec. This first reaction is catalysed by the serine synthase. Following this step,
the SertRNASec is phosphorylated by the O phosphoseryl kinase (PTSK) and gives an intermediate:
the O-phosphoseryltRNASec. Then, the selenocysteine synthase (SecS), also known as SecA in
archea and SelA in bacteria, converts the phosphoseryltRNASec into an activated intermediate
and uses the active selenium (monoselenophosphate) as donor to give the selenocysteyltRNASec.
This monoselenophosphate is a product of the reaction which uses selenite (HSe-) and ATP as
substrates, and is catalyzed by the SPS2 enzyme (Figure 3) (Labunskyy et al. 2014).
The SECIS element, is a RNA secondary structure localized on 3’UTR of selenoproteins
mRNA. This cis-element is essential for the reprogramming of the stop codon into selenocysteine.
It consists in a stem loop which is highly conserved at the structural level. The apical loop is very
important during the process of incorporation of the selenocysteine as it enables the binding of
the specific elongation factors, eEFSec together with the SectRNAsec. The SECIS binding protein 2
(SBP2) binds to a kink-turn motif localized at the bottom of the SECIS stem loop (Figure 4). The
conservation of the SECIS element allowed the identification of many selenoproteins by
bioinformatics approaches, particularly the identification of selenoprotein N (SelenoN) in 1999 by
Lescure and co-workers in Strasbourg.

Introduction
21
Figure 3 Synthesis of Sec-tRNA SerSec in Eukaryotes
phosphoseryl-tRNASec kinase (PSTK) phosphorylates aminoacylated serine to form O-phosphoseryl-tRNA. Sep (O-
phosphoserine) tRNA: SectRNA synthase, abbreviated as SepSecS, then converts O-phosphoseryl-tRNA to Sec-
tRNA, using selenophosphate as the nucleophile to displace the phosphate group. Selenophosphate is produced
by selenophosphate synthetase (SPS2) (Labunskyy et al. 2014).
Figure 4: Eukaryotic Sec-insertion machinery.
The Sec-tRNA is bound by a specialized eukaryotic elongation factor (EFSec), and recruited to the ribosome at a
UGA codon by the use of a special stem-loop structure in the 3’-untranslated region of the mRNA (SECIS element)
and a SECIS binding protein (SBP2) (Labunskyy et al. 2014).

Introduction
22
1.2 Selenoproteins – a structural perspective
1.2.1 The Selenoproteome
Selenoproteins are characterized by at least one Sec residue in their amino acid sequence. There
are twenty-five genes coding for selenoproteins that where identified by different methods in the
human genome (Table 1). These proteins constitute the so-called selenoproteome. Knockout
experiments of the Trsp gene from which tRNASec is synthesized yielded to early embryonic
lethality in mouse and an increased sensitivity of cells to reactive oxygen species (Bösl et al. 1997)
which suggested the essentiality of selenoproteins and their involvement in protection against
reactive oxygen species.
Proteins of this family exhibit diverse tissue distribution from ubiquitous to tissue specific,
subcellular localization as well as functions. Most of these proteins exhibit one single Sec residue
(Table 1), generally localized within the catalytic site and therefore contributing as a major actor
to redox reactions. The protein SelenoP is the only one with ten Sec residues. The function of this
protein is directly related to Se transport in the organism. However, the function of many
selenoproteins is still poorly characterized. The most characterized are the thioredoxin reductases
and glutathione peroxidases, deiodinases and the methionine-R-sulfoxyreductase that are known
to be involved in redox -related reactions.

Introduction
23
Table 1 :List of proteins constituting the human selenoproteome and their related functions
(Modified from Labunskyy et al. 2014)

Introduction
24
1.2.2 Structural motif conserved over the selenoproteome -The thioredoxin fold
When having a close look at the structural organization of well-described proteins of the
selenoproteome, one prominent feature is the presence of a conserved fold in most
selenoproteins: the thioredoxin-fold. Interestingly, the Sec residu is replacing one of the two main
cysteines usually located in a specific motif C-X-X-C which is part of this fold and is important for
the catalytic mechanisms (Figure 5). Thioredoxins belongs to a family of proteins that is involved
in numerous redox reactions as electron donors. The founding member of this family, the
thioredoxin is involved in the maintenance of reduced forms of cysteines in many cytoplasmic
proteins or the formation of disulfide bounds of membrane-surface or secreted proteins within
the endoplasmic reticulum. Oxidized thioredoxin is a substrate of the enzyme thioredoxin
reductase. Structurally, the thioredoxin-fold is organized as a core of beta sheet surrounded by
alpha helices (Figure 10B). The cysteines motif located at positions 32 and 35 between the first
alpha helix and the first beta sheet is essential for the binding with protein partners as well as the
electron transfer from the reduced thioredoxin to the protein partner (Figure 10C). There are
several thioredoxine-like folds presenting different structural organization and characteristic of
each subgroup of the family (Pan and Bardwell 2006).

Introduction
25
Figure 5: The thioredoxin-fold is well represented among the selenoproteome
(A) Distridution of the thioredoxin-fold in selenoproteome. The pink box represents the thioredoxin-fold which
includes the sec (U) residu. (B) Structural organization of the thioredoxin-fold displaying the two important
cysteines. (C)Schematic representation of the reaction involving the reduced thioredoxin and showing the
importance of the two catalytic cysteines 32 and 35 (Pan and Bardwell 2006).
A
B
C

Introduction
26
1.2.3 Structural Organization and Function of Sec containing oxidoreductases
1.2.3.1 Thioredoxin reductase
Thioredoxin reductases (TR) are enzymes that use NADPH to reduce oxidized thioredoxin. The so
reduced thioredoxin is then used as electron donor in reactions involving dithiol-disulfide couples
to regulate the cell redox environment at different levels (Figure 6). There are three TR homologues
in mammals Thioredoxin Reductase 1 or TR1, Thioredoxin Reductase 2 or TR2 and the
Thioredoxin/Glutathione Reductase or TGR. All three isozymes have different cellular locations
and are all selenoproteins (reviewed in Reeves and Hoffmann 2009).
TR1 is the major protein disulfide reductase of the cell and is found in the cytoplasm and the
nucleus. It reduces the thioredoxin 1 via an NADPH dependent reaction (Figure 6) (Arnér and
Holmgren 2000). Studies enable to identity the implication of this enzyme in a wide range of
functions notably DNA repair, regulation of cell signaling, redox homeostasis, as well as cancer
prevention (Arnér and Holmgren 2000).
TR2 is a mitochondrial isoform involved in the reduction of the mitochondrial thioredoxin 2 and
glutaredoxine2 but is also capable of binding thioredoxin 1 (Turanov, Su, and Gladyshev 2006).
TGR is specifically expressed in testis and differs from the two firsts by an additional N-terminal
glutaredoxine domain. By this feature, this isozyme is believed to be involved in the reduction of
both thioredoxin and glutathione systems (Sun et al. 2001).
All three TRs share common features. They are organized in homodimer. Each subunit of the dimer
is organized in four domains: the FAD binding domain, and NADPH binding domain, the interface
domain and the conserved C-terminal domain including the conserved redox motif Gly-Cys-Sec-
Gly or GCUG. The later domain is in an extended sequence that is structurally flexible (Figure 7).
This flexibility enables the electron transfer from the active site to the protein surface (Fritz-Wolf,
Urig, and Becker 2007; Fritz-Wolf et al. 2011).
Introduction
27
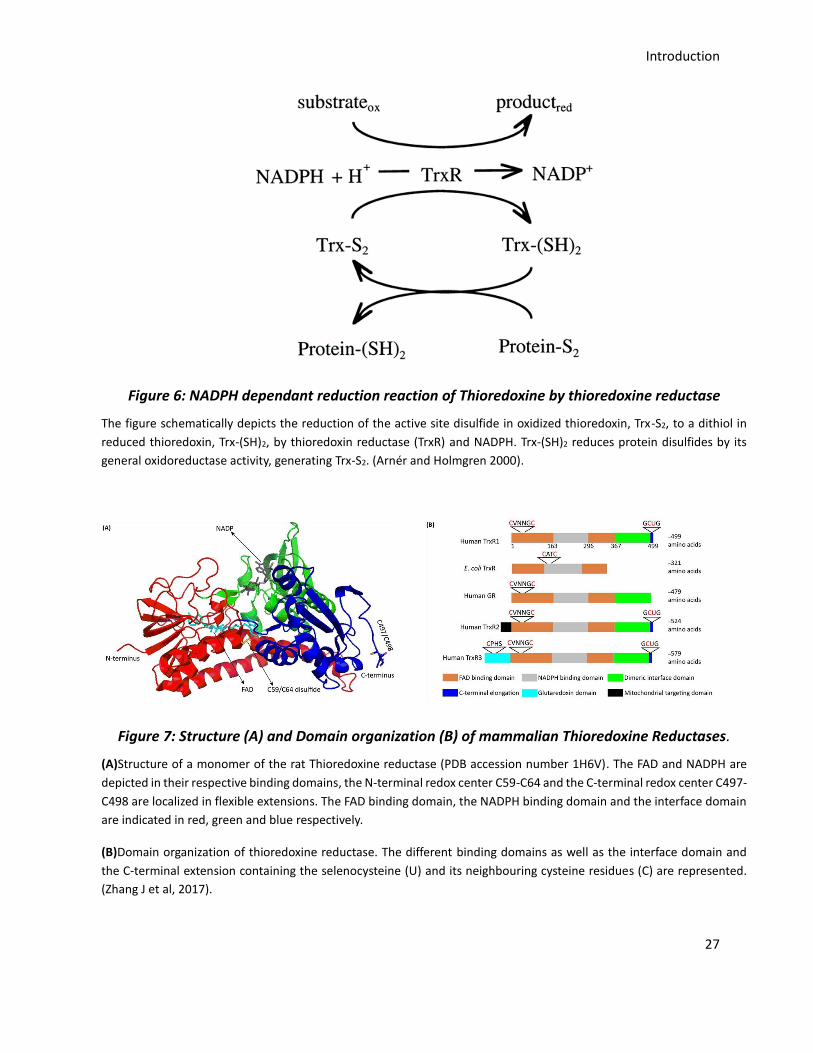
Figure 6: NADPH dependant reduction reaction of Thioredoxine by thioredoxine reductase
The figure schematically depicts the reduction of the active site disulfide in oxidized thioredoxin, Trx-S2, to a dithiol in
reduced thioredoxin, Trx-(SH)2, by thioredoxin reductase (TrxR) and NADPH. Trx-(SH)2 reduces protein disulfides by its
general oxidoreductase activity, generating Trx-S2. (Arnér and Holmgren 2000).
Figure 7: Structure (A) and Domain organization (B) of mammalian Thioredoxine Reductases.
(A)Structure of a monomer of the rat Thioredoxine reductase (PDB accession number 1H6V). The FAD and NADPH are
depicted in their respective binding domains, the N-terminal redox center C59-C64 and the C-terminal redox center C497-
C498 are localized in flexible extensions. The FAD binding domain, the NADPH binding domain and the interface domain
are indicated in red, green and blue respectively.
(B)Domain organization of thioredoxine reductase. The different binding domains as well as the interface domain and
the C-terminal extension containing the selenocysteine (U) and its neighbouring cysteine residues (C) are represented.
(Zhang J et al, 2017).

Introduction
28
1.2.3.2 Glutathione peroxidase
Human Glutathione Peroxide family has height members. Six of them, GPx1 to 6 are
selenoproteins (reviewed in Reeves and Hoffmann 2009). The Sec residue is highly conserved and
is located in the enzyme active site. It plays an essential role in the reactions and in the interaction
with substrates. Proteins of this family use glutathione as an electron donor to catalyze the
reduction of peroxides notably hydrogen peroxide and phospholipid peroxides and thus have a
central function in oxidative stress protection.
Glutathione peroxidase 1 or GPx1 was the first selenoprotein identified (Flohe, Günzler, and
Schock 1973) and is one of the most abundant (Lei, Cheng, and McClung 2007). It is an
ubiquitously expressed protein of 22 kDa which active form is a homotetramer. As other enzymes
of this family, it uses two glutathione molecules GSH as substrate to catalyze the reduction of
peroxides and produces oxidized glutathione GSSG, which is later reconverted into GSH by the
enzyme glutathione reductase (Lubos, Loscalzo, and Handy 2011).
Structurally, GPx1 is characterized by a thioredoxin-fold organized in seven β-sheets, with five of
them forming the core of the enzyme surrounded by four α-helices (Structure by Kavanagh et al
2005 PDB accession number 2F8A). The unique Sec residue is located at position 46 and forms
with two other amino acids Gln81 and Trp136 the catalytic center.
Reactions catalyzed by GPx1 are implicated in a wide range of physiological processes (reviewed
in Reeves and Hoffmann 2009). Overexpression of the enzyme in mice was reported to lead to
several effects including hyperglycemia, resistance to insulin and obesity (McClung et al. 2004).
1.2.3.3 Methionine-R-sulfoxide reductase1
Methionine (Met) is with cysteine (Cys) the second sulfur containing amino acid of proteins.
Oxidation of this residue can lead to important functional and structural protein alterations,
therefore, the importance of Methionine-R-sulfoxide reductases to maintain enzymatic cellular
activities. This family of proteins is composed of four enzymes: MsrA, MsrB1, MsrB2 and MsrB3.
The function of this family of enzymes is to reduce S- and R- enantiomers of methionine sulfoxide
that are produced during Met oxidation by reactive oxygen species. The MsrB1 is the only

Introduction
29
selenoprotein of the family that contains a Sec residue in its catalytic site. This enzyme reduces
the R- enantiomer only. It is localized in the cytosol and in the nucleus and shows a maximum
activity in liver and kidney (Fomenko et al. 2009).
1.2.4 Structural organization of mammalian ER resident selenoproteins
Seven proteins of the selenoproteome reside in the Endoplasmic Reticulum (ER) (Shchedrina et
al. 2010). Those proteins are found to be involved in a wide range of functions, notably the
regulation of thyroid hormone synthesis, calcium homeostasis, protein folding and ER associated
degradation (reviewed in Pitts and Hoffmann 2017) but for many of them, as it is the case for
selenoproteins in general, their function is still unclear. Among ER resident selenoproteins, five
of them are membrane proteins (Figure 8), notably, the Iodothyronine Diodinase type 2 (DIO2),
SelenoproteinK (SelenoK), SelenoproteinS (SelenoS), SelenoproteinT (SelenoT) and
SelenoproteinN (SelenoN) (Figure 8). Four of the ER selenoproteins handle a thioredoxin-like motif
that contains the single Sec residue and for only three of them, the thioredoxin motif is oriented
inside the ER Lumen. SelenoN is the only one with a calcium binding EF-hand domain. However,
SelenoK was also found to be involved in the calcium homeostasis control.

Introduction
30
Figure 8: Domain organization of ER selenoproteins
This diagram illustrates the relative position of Sec residues (red), signal peptides (green), transmembrane domains
(yellow), thioredoxin-like motifs (pink), EF hand motifs (orange), and ER retention signals (white triangles).
Established binding/interaction sites are denoted by three-quarter circle symbols (Pitts and Hoffmann 2017).

Introduction
31
1.2.4.1 Selenoprotein K (SelenoK)
SelenoK is a small 16 kDa protein from the SelS/SelK family (Shchedrina et al. 2011a; Liu, Zhang,
and Rozovsky 2014) localized at the endoplasmic reticulum (ER) membrane (Lu et al. 2006).
Topologic prediction revealed that the small N-terminal domain is oriented toward the cytosol
whereas the intrinsically disordered C-terminus is oriented in the ER lumen. This C-terminal
domain handles the Sec residue at position 92 (Shchedrina et al. 2010) and an SH3 binding domain
(Li 2005). It is inserted in ER membrane by one single transmembrane domain matching amino
acids 20 to 42.
SelenoK is organized as a homodimer through a diselenide intermolecular bound that can be
reduced by thioredoxin reductase (Liu, Zhang, and Rozovsky 2014).
SelenoK was proved to be involved in many processes. It is used as cofactor by the acyl transferase
DHHC6 for the inositol 1-4-5 triphosphate receptor (IP3R) palmitoylation. This post-translationnal
modification stabilize the calcium channel IP3R (Hoffman 2015). Increased expression level of
SelenoK was correlated to an increase of misfolded proteins in the endoplasmic reticulum and it
was proved that SelenoK is involved in the degradation of glycosylated substrates by the
endoplasmic reticulum associated protein degradation pathway (ERAD) (Shchedrina et al. 2011a).
1.2.4.2 Selenoprotein S (SelenoS)
SelenoS or VCP interacting membrane protein (VIMP) is another ER membrane protein. It is also
a member of the SelS/SelK family which has thirty-three members in human. This family shares
common characteristics. Notably, they are proteins of maximum 300 amino acids, with a unique
transmembrane domain. Among the last five residues of the intrinsically disordered C-terminus is
usually found a Sec or a Cys residue (Shchedrina et al. 2010, 2011b).
SelenoS has two isoforms. The longer isoform contains a Sec residue and is constituted by a coil-
coiled domain organized in two helices followed by a disordered domain where the Sec residue is
located at the position 188. The coil-coiled domain is important for the dimerization and for the
binding of the p97 ATPase (Christensen et al. 2012).
Functional studies revealed that SelenoS has a disulfide reductase activity similar to that of the

Introduction
32
thioredoxin reductases (Liu, Zhang, and Rozovsky 2014) as well as a peroxidase activity (Liu, Zhang,
and Rozovsky 2014). As SelenoK, it is a member of the ERAD machinery and it is responsible of
misfolded protein retro-transport from the ER to the cytoplasm where they will be addressed to
the proteasome for degradation (Ye et al. 2004).
1.2.4.3 Type 2 Iodothyronine Deiodinase 2 (DIO2)
Iodothyronine deiodinase is a family of proteins involved in the regulation of thyroid hormone. In
human, this family is composed of three members, Iodothyronine Deiodinase type 1, 2 and 3 or
DIO1, DIO2, DIO3. DIO 1 and 3 are localized within the plasma membrane whereas DIO2 is an ER
membrane protein.
DIO2 has a single transmembrane domain. Its small N-terminus is in the ER lumen whereas the
main part of the protein resides in the cytosol. It contains one thioredoxin-fold domain that
handles the Sec residue. (Figure 9). The enzyme is responsible for the conversion of the
prohormone thyroxine to active thyroid hormone 3,3’,5- triiodothyronine (T3). Studies addressing
its expression demonstrated its implication in muscle regeneration and development, as its
maximum expression level was observed in muscle after birth or following an injury (Mullur, Liu,
and Brent 2014).
Structure of the DIO3 catalytic domain was solved and enable to confirm the presence of the
predicted thioredoxin-fold motif and a peroxiredoxin-like catalytic domain that suggested a
mechanistic relationship with peroxiredoxine (Schweizer and Steegborn 2015) (Figure 9). It
revealed also the structural arrangement of the deiodinase-specific insertion site (Dio-insertion)
as well as the structural location of the Sec residue that appears to act as a substrate binding
residue (Schweizer and Steegborn 2015).

Introduction
33
Figure 9: 3D Structure and Topology of DIO3 catalytic domain.
The catalytic site is composed of three main domains. A peroxiredoxine-like domain (purple), a thioredoxine fold
(light green) and a deiodinase-insertion site (blue). (Schweizer and Steegborn 2015).
1.2.4.4 Selenoprotein T (SelenoT)
Selenoprotein T or SelenoT is a member of a family of proteins identified as Redox or Rdx family.
Other members in the selenoproteome are SelenoW, SelenoH and SelenoV. Members of Rdx
family are present in numerous organs and tissues, but SelenoT expression is very high during
development, also confined to endocrine tissues in adulthood. One characteristic of this family is
the presence of a thioredoxin-fold (Dikiy et al. 2007).
SelenoT is a small membrane protein of 19 kDa that is inserted in the ER membrane through two
transmembrane domains (Figure 8). Studies showed that it is also localized in the Golgi and
possibly in the cytosol (Dikiy et al. 2007).
The thioredoxin-fold structurally organized as described in chapter 1.2.2 is oriented toward the ER
lumen and contains the single Sec residue at position 17 in the conserved redox motif CxxU. In
another protein of the same family, Selenoprotein W, the redox motif was found to be located on

Introduction
34
a loop between β1 and α1 adjacent to the β-sheet (Aachmann et al. 2007). Homology-based
modelling of SelenoT revealed a thioredoxin-like secondary structure β1-α1- β2- β3- β4-linker- α2
(Aachmann et al. 2007).
Several studies demonstrated that SelenoT exhibits a thioredoxin reductase-like activity (Boukhzar
et al. 2016) and that it is implicated in calcium homeostasis. Its overexpression was correlated to
increased cytosolic calcium mobilization (Grumolato et al. 2008). Recently, SelenoT was found to
be a novel subunit of the A-type OST complex, necessary for ER homeostasis and exerting a pivotal
adaptative function that allows endocrine cells to properly achieve the maturation and secretion
of hormones (Hamieh et al. 2017).
1.2.4.5 Selenoprotein M (SelenoM) and Selenoprotein F (SelenoF or Sep 15)
Selenoprotein M or SelenoM is a small 15 kDa selenoprotein of the endoplasmic reticulum which
is expressed predominantly in the brain (Y. Zhang et al. 2008). Functional studies revealed that,
SelenoM is implicated in body weight regulation as well as calcium homeostasis, but its molecular
mechanism is still unclear.
NMR structure of SelenoM disclosed a thioredoxin-fold domain, which incudes the Sec residue.
Its secondary structure is organized as followed, β1-α1-α2-β2-β3-β4-α3 with the redox motif CxxU
localized between β1 and α1 (Figure 10).
Selenoprotein F or SelenoF shares 37% sequence identity with SelenoM and it is also localized
within the ER. Studies revealed that SelenoF binds the UDP-glucose:glycoprotein
glucosyltransferase (UGGT) through its UGGT binding domain (Figure 8). Therefore, ti was thought
to mediate disulfide bond of glycoproteins that are modified by UGGT (reviewed in Pitts and
Hoffmann 2017).
NMR structure of SelenoF showed a thioredoxin-fold with secondary structures organized as
SelenoM with CxU redox motif between the first β sheet and α helix (Figure 10). Analysis of this
structure revealed a local conformational modification of the redox center of both SelenoM and
SelenoF after thiol-disulfide exchange. This observation suggested a thiol-disulfide isomerase
activity (Ferguson et al. 2006).

Introduction
35
Figure 10: NMR structure of Selenoprotein M (with CxxU motif) and Selenoprotein F (with CxU
motif)(Ferguson et al. 2006). Both proteins are formed by a canonical thioredoxin-fold domain.

Introduction
36
1.3 Selenoprotein N
1.3.1 SELENON gene and diseases
1.3.1.1 SELENON Related Myopathies
Selenoprotein N gene, SELENON, is the first gene coding for a selenoprotein which mutation was
directly linked to a human genetic disease. Mutations in SELENON can lead to a group of four
different muscular disorders: the rigid-spine congenital muscular dystrophy, the multiminicore
disease, the Mallory body-like desmin related myopathy and the congenital fiber-type
disproportion myopathy. These different clinical syndromes are now classified as SELENON-
related myopathies (SELENON-RM) (Castets et al. 2012). Despite different clinical descriptions,
SELENON-RM patients present common symptoms such as weakness of the neck, spine rigidity
leading to scoliosis (Figure 11) and respiratory insufficiency (Lescure et al. 2016; Castets et al.
2012). Recent reports suggested that the respiratory insufficiency syndrome that was traditionally
attributed to respiratory muscles weakness could also be attributed to abnormal lung
development, as demonstrated in Selenon-/- mice as a model for SELENON-RM (Moghadaszadeh
et al. 2013).
Many mutations in the SELENON gene were characterized, including the coding region, and the
SECIS element located in the 3’UTR region(Allamand et al. 2006). This last mutation inhibits
thebinding of SBP2 tp the SECIS RNA structure. As this interaction is essential for Sec
incorporation, the SECIS mutation inhibits SelenoN expression. Surprisingly and despite the
specific muscular phenotype in SELENON-RM patients, SelenoN is ubiquitously expressed.
However, analyses of SelenoN expression pattern in both zebrafish and mouse embryos
demonstrated a strong expression of this mRNA in fetal tissues, specifically in somites and
notochord that are precursors of muscle and spine structures (Deniziak 2007; Castets 2011), and
in proliferative muscle progenitors (Petit et al. 2003).
1.3.1.2 SELENON and breast cancer
SELENON gene expression has been reported to be post-transcriptionaly regulated by the
microRNA miR-193-3p, one microRNA that suppresses breast cancer cell growth (Tsai et al. 2016).

Introduction
37
Microarray experiments combined to bioinformatics approaches identified SELENON among five
genes as regulated by the miR-193-3p. Real time PCR experiments confirmed the downregulation
of the expression of the SELENON gene and two other genes CCDN1 and PLAU in miR-193-3p
mimic transfected cells. In addition, knockdown of SELENON and the other target genes
suppressed cell growth similar to miR-193-3p overexpression in breast cancer cells. This suggested
that the miR-193-3p suppresses cancer cell growth by silencing those genes (Tsai et al. 2016) and
it indicated a putative oncogenic function for the SELENON gene which remains to be investigated.
Figure 11 : Clinical effect of SELENON mutations on children affect by muscular congenital
disorders (Flanigan et al, 2000)

Introduction
38
1.3.2 Selenoprotein N associated functions
1.3.2.1 Function in muscle establishment and maintenance
In order to study the role and impact of SelenoN deficiency, two knock out models in mice and
zebrafish were established. On one hand, SelenoN depletion in zebrafish led to a somite
disorganization and a strong alteration of the global muscle architecture (Jurynec et al. 2008;
Deniziak et al. 2007). This model also presented a defect in the slow fiber development (Jurynec
et al. 2008). On the other hand, loss of function of SelenoN in mice induced no obvious phenotype
compared to wild-type in normal breeding situation but. However, when exposed to a forced
swimming test, a situation mimicking global stress and situation combining physic, environmental,
thermal and respiratory stresses, the selenon-/- mice developed symptoms similar to SELENON-
RM patients such as a spinal rigidity, development of a kyphosis accompanied by a reduced
mobility, and small change in proportion of slow fibers in the paraspinal muscles (Castets et al.
2011). Altogether, this information raised the hypothesis that SelenoN is essential for the
establishment of muscle during embryogenesis, and for its maintenance under stress condition.
Another study showed that SelenoN depleted muscles of knock-out mice are defective in
regeneration, due to decrease in number of muscle stem cells or satellite cells. This last phenotype
was also observed in SELENON-RM patients. Muscle biopsies from patients showed a reduction
of satellite cells that worsened with age, probably due to degeneration. Tacken together, these
results suggested that SelenoN could be essential for the proliferation and/or the maintenance of
muscle progenitors in adult muscle.
1.3.2.2 Calcium concentration regulation: Ryanodine receptor and SERCA1 activities control
The link of SelenoN and to ryanodine receptors (RyR) was demonstrated in vivo. RyRs are a family
of calcium channels implicated in the ion transport from the sarcoplasmic reticulum (SR) to the
cytoplasm and are essential for muscle contraction. It was reported that SelenoN is essential for
RyR activity, since SelenoN deficiency caused RyR dysregulation, impairing calcium influx into the
cytoplasm (Jurynec et al. 2008). These data suggest that SelenoN could play a role in RyR
regulation by controlling its oxidative status or by acting as a chaperone. Indeed, it was proved
that RyR activity is controlled by the oxidation/reduction of several cysteine residues (Castets et

Introduction
39
al. 2012).
SarcoEndoplasmic Reticulum Ca2+ATPase (SERCA) is anoter family of proteins involved in calcium
homeostasis by transporting the bivalent ion from the cytoplasm to the endopasmic reticulum
(ER). This calcium pump family counts many members and among them, Serca2b which is an
ubiquituously expressed variant (Baba-Aıs̈sa et al. 1998). Serca2b activity is regulated by the redox
status of two cysteines at position 875 and 887 that are localized within the ER lumen (Li Y et al,
2014). Trapping-mutant experiments by modification of SelenoN active site combined to mass
spectrometry analysis enlighted the binding of SelenoN to Serca2b. In addition, it was shown that
the two Serca2b regulating cysteines are important for this binding. Moreover, comparison of
calcium concentration in ER ([Ca2+] ER) and of accumulation rate indicated that both are
significantly increased in cells expressing SELENON, compared to knock-out cells. In this later
situation, concentration level is restored either by introducing SELENON or by providing a
catalase-peroxidase, which induced a peroxidase dependent reduction of Serca2b cysteines.
Taking together, this study suggested that SELENON plays a role in intra-ER calcium concentration
regulation through activation of the calcium pump Serca2b, consecutive to the reduction of its
two cysteines in the ER Lumen (Marino et al, 2015).
Taking together, studies of SelenoN regulation activity on both ryanodine receptors RyRs and the
calcium pump Serca2b indicated that SelenoN might play an essential role in calcium cellular
homeostasis by controlling its transport between cytoplasm and ER. The question that arises is
what is the signal or the condition that will trigger the action of SelenoN on calcium cellular
transport in one direction compared to the other?

Introduction
40
1.3.2.3 Cell redox homeostasis and cell defense against oxidative damages
SelenoN is ubiquitously expressed with a higher expression level in proliferative muscle cells, such
as the fibroblasts and the myoblasts (Petit et al. 2003). A measurement of oxidant activity level in
cells from SELENON-RM patients revealed an increased basal oxidant activity in myoblasts
compared to controls. Moreover, blot-assays revealed an increase in oxidized proteins content in
fibroblasts and myoblasts of SELENON-RM patients. In addition, both type of cells treated with
peroxide showed a reduced cell survival, suggesting an increased sensitivity to oxidative stress in
cells lacking SelenoN. Taken together, the results of this study suggested increased sensitivity to
oxidative stress is associated to the lack of SelenoN in SELENON-RM patient cells, as a
consequence of an increase in basal oxidant activity level. Therefore, it was proposed that SelenoN
protect cells from oxidative damage by reducing or by keeping the basal level of oxidative activity
(Arbogast et al. 2009).
1.3.3 Description of SelenoN associated domains
1.3.3.1 The eukaryotic SelenoproteinN
In humans, the third exon which is an Alu sequence is alternatively spliced out leading to two
isoforms. The longer isoform contains two Sec codons, whereas the shorter without exon three
contains only one. This second isoform is predominantly expressed and abundantly found in
skeletal muscle, brain, lungs, and placenta. Only the shorter isoform is translated into a 70 kDa
protein with one single Sec residue (Petit et al. 2003). SelenoN is an integral ER membrane protein
with an N-terminal hydrophobic region that represents the transmembrane (TM) domain. This
domain was found to present an addressing and retention signal in the ER (Petit et al. 2003).
Topologic analysis locates the protein N-terminal end in the cytosol, whereas the main protein,
including its predicted active site, is located in the ER lumen (Figure 12). Moreover, inspection of
the amino acid sequence revealed the presence of an EF-hand calcium binding domain.
Bioinformatics analyses predicted, three glycosylated asparagines, and a redox motif SCUG
containing the Sec or U residue (Error! Reference source not found.). This redox motif possesses s
equence similarities with the thioredoxin reductases conserved catalytic motif GCUG (Castets et
al. 2009). In the mammalian thioredoxin reductases, the selenolthiol formed by the Cys and Sec

Introduction
41
residues of the motif represents the active site (Sandalova et al, 2001). As proposed by Sandalova
et al, the couple Cys497-Sec498 represents a second redox center in the reaction of electron
transfer to the substrate Thioredoxin (Figure 13).
Figure 12: Schematic representation of the topology of the human SelenoN in the
endoplasmic reticulum lumen and of its bioinformatics predicted domains.
SCUG= Putative catalytic site. Bioinformatics searches using SelenoN sequence revealed no significant homology
to any other known protein. In SelenoN, aside from the N-terminal transmembrane domain (blue dashed box),
motif prediction searches identified a typical EF-hand motif (green box), corresponding to a Ca2+ binding domain.
Selenoprotein activity may also be deduced from the sequence context of the Sec residue, which constitutes a
landmark of the catalytic center. SelenoN harbors a SCUG predicted catalytic site, reminiscent of the thioredoxin
reductase GCUG motif. This similarity suggests a reductase activity. This redox motif is included within an UAS
conserved domain, a domain of unknown function (orange box). It was shown that the protein is glycosylated and
the positions of the three Asn modified residues were identified (depicted as red Y shapes). (adapted from Castets
et al, 2012)
Figure 13 : Reaction mechanism for mammalian TrxR
The fully oxidized enzyme-bound FAD picks up two electrons from one NADPH (I) and reduces the disulfide to a
dithiol pair (redox center C59/C64) to form the N-terminal reduced intermediate (II), which further passes the
electrons to generate the N-terminal oxidized (C59/C64) and C-terminal selenylsulfide reduced intermediate
(C497/U498) (III). Finally, another NADPH further donates two electrons to the partially reduced enzyme (III) to
generate the fully reduced enzyme (IV) (Zhang et al. 2017)

Introduction
42
As described previously, zSelenoN is located within the endoplasmic reticulum membrane with its N-
terminus oriented in the cytosol, whereas the C-terminus with the main part of the protein is localized
within the lumen of the organelle. The endoplasmic reticulum is known to be the primary storage site for
cellular calcium with concentration reaching micromolar levels (Treiman M. et al, 2002). Eukaryotic
SelenoN contains an EF-Hand domain, a predicted calcium binding domain. Structurally, EF-Hand domains
are organized as α-helix-β-sheet-α-helix motifs (Figure 14). Binding of the calcium to the domain can have
several effects ranging from a scaffold or structural organization role to a conformational induce-change
that can lead to an inactive/active protein transition. The affinity of the calcium depends on the structure
of the domain.
Figure 14: Structural organization of an EF
hand domain
(https://www.quora.com/What-is-the-difference-
between-EF-Hand-and-helix-turn-helix-protein-motifs)
1.3.3.2 Bacterial Selenoprotein N
Phylogenetic analyses identified one single bacterial SelenoN homolog among all bacteria genome
sequenced so far, in Candidatus poribacteria. This bacterium is a sponge obligatory symbiot (Siegl
et al, 2011) and genomic examination suggested that the presence of SelenoN in this only bacterial
organism might have originated from a horizontal gene transfer. The bacterial SelenoN displays
two main features: absence of an N-terminal transmembrane domain, and a thioredoxin-like
sequence naturally fused to its C-terminal end (Figure 15). The presence of this thioredoxin-like
domain was identified by bioinformatical approaches comparing the bacterial SelenoN with
proteins of known function. Interestingly this domain is well conserved including two cysteines
that are important in the function of thioredoxin, but in the bacterial SelenoN, there is only one
cysteine whereas the first one is mutated into Asparagine (Figure 15). This particularity suggests

Introduction
43
that this domain might correspond to either a one cys-peroxiredonin or to a monothiol
glutaredoxin. The exact characterization of this domain can be assessed by the structure.
As found in the human SelenoN, the bacterial SelenoN sequence handles the conserved SCUG
motif which, as mentioned above might be the catalytic site comparable to that of thioredoxin
reductases. Hence, one can hypothesize on a possible functional interaction between the bacterial
SelenoN and its C-terminal thioredoxin-like extension. This could be achieved either by a structural
conformation of a monomer to enable the contact between both domains, or by a dimerization
of the protein in a way that the C-terminal thioredoxin domain of one monomer contacts the
SCUG redox center of the second monomer. This latest situation is reminiscent to the
conformation and functional organization of the thioredoxin reductases.
Figure 15: Schematic representation of the bacterial SelenoN and comparison to its human
ortholog
The upper panel showed a schematic comparison of the bacterial and the human SelenoN. SCUG= putative
catalytic site. The lower panel is an alignement of the bacterial C-terminal domain with known thioredoxin-folds.
The conserved Cysteines of the motif are highlighted in yellow.

Introduction
44
1.4 Aim of the thesis and theoretical methodology
From the evidence presented above, one can conclude that SelenoN function resides at the
crossroad between diverse pathways covering the calcium signalling and oxidative stress,
controlling the redox status of different cellular partners. However, as for many other
selenoproteins, its exact molecular function and catalytic mechanism remains elusive.
The research program on selenoprotein N initiated by Dr. Lescure in the department of RNA
architecture and reactivity of the IBMC (Strasbourg), combines two approaches to elucidate its
mechanism: a biochemical enzymatic approach and in parallel a structural approach. The
structural approach of the project will be conducted in collaboration with the departement of
structural biology in Homburg leaded by Prof. Dr. Roy Lancaster. The advantage of a structural
approach resides in the fact that it can disclose an unsuspected function based on the
identification of possible characteristic conserved folds that are not necessarily directly accessible
from the protein sequence, but that are informative about potential catalytic core binding
activities. Such a situation was previously presented for the mouse deiodinase DIO3, as
identification of a peroxiredoxine-like fold provided valuable hints concerning its catalytic
mechanism. Additionally, investigations on the folding and structural rearrangement unveiled the
functional mechanism for SelenoM and SelenoF.
The aim of my PhD project is to lay the foundations for SelenoN structure-function studies. For
this purpose, the structure of purified Selenoprotein N should be determined by crystallization
and X-ray analyses following the strategy detailed in Figure 16. Preliminary expression assays in
human cells showed that the human protein is less stable and that it is expressed at a very low
level compared to the zebrafish protein. The reason for this difference in protein stability and
accumulation is unknown, however and because of this property, the zebrafish instead of the
human protein will be used in this study. In addition, the bacterial protein will be also studied in
parallel. This bacterial protein presents interesting features corresponding to common domains
with the eukaryotic protein, but also a specific domain that suggests an evolution of the function.

Introduction
45
Expression assays made in bacterial system leads to a protein of quality high enough for structural
studies.
Importantly, analysis of the SelenoN structure might be an essential contribution to a better
understanding of its function, as well as its dysfunction in the diverse forms of SELENON-related
myopathies. In order to identify possible characteristic conserved folds, determination of the
SelenoN 3D-structure is a prerequisite. This 3D-structure will be interpreted within the framework
of SelenoN phylogenic residues conservation and positions of pathogenic mutations characterized
in patients with SELENON-related myopathy.
Figure 16: Flowchart of the methodology to be used for SelenoN structural studies
The comparison of the bacterial and human SelenoN structures, together with the interpretation of the overall protein
architecture, will be conducted based on SelenoN phylogenic conservation and the positions of pathogenic mutations
characterized in patients with SELENON-related myopathies.

Materials
46
2 Materials and Methods

Materials
47
2.1 Materials 2.1.1 Chemicals
Table 2: Chemicals
Chemicals
Supplier
Acetone VWR, Darmstadt
Agar: Bacto Agar BD, Sparks USA
Agarose: SeaKem LE Agarose Cambrex, Rockland, USA
Ammoniumperoxodisulfat (APS) Roth, Karlsruhe
Ampicillin Roth, Karlsruhe
Antifoam 204 SIGMA-Aldrich, Steinheim
Benzamidine Hydrochloride Hydrate AppliChem, Darmstadt
Bromchlorindolylphosphate (BCIP) SIGMA-Aldrich, Steinheim
Bromphenol blue SIGMA-Aldrich, Steinheim
Calciumchloride VWR, Darmstadt
Chloramphenicol Roth, Karsruhe
Coomassie Brilliant Blue G250 Roth, Karlsruhe
dNTP-Mix (100 mM) Bioline, Luckenwalde
Acetic acid
Zentrales Chemikalienlager, Universität des
Saarlandes
Dimethylformamide (DMF) Sigma-Aldrich, Hannover
Ethanol, absolut (99%) VWR, Löwen, Belgien
Ethidium bromide Roth, Karlsruhe
Ethylene diamine tetraacid (EDTA) SIGMA-Aldrich, Steinheim
Dextrose Zentrales Chemikalienlager, Universität des
Saarlandes
Glycerol (99%) Zentrales Chemikalienlager, Universität des
Saarlandes

Materials
48
Bacto Yeast Extract BD, Sparks USA
Imidazole Zentrales Chemikalienlager, Universität des
Saarlandes
Isopropanol VWR, Darmstadt
Isopropyl ß-D1-Thiogalactopyranosid
(IPTG)
SIGMA-Aldrich, Steinheim
HEPES Roth, Karlsruhe
Lyzozyme Sigma-Aldrich, Hannover
ß-Mercaptoethanol (ß-ME) MERCK, Darmstadt
Roth, Karlsruhe
Magnesium chlorid Hexahydrat (MgCl) VWR, Löwen, Belgien
Methanol VWR, Darmstadt
Milk powder Roth, Karlsruhe
Sodium cacodylate Sigma-Aldrich, Hannover
Sodium chloride VWR, Löwen, Belgien
Sodium dodecylsulfate (SDS) Roth, Karlsruhe
Sodium hydroxyde AppliChem, Darmstadt
Nickel(II)-Sulfat-Hexahydrat VWR, Darmstadt
Polyethylene glycole (PEG) 3350 Sigma-Aldrich, Hannover
Polyethylene glycole (PEG) 6000 Sigma-Aldrich, Hannover
Peptone BD, Sparks USA
Phenylmethylsulfonylfluorid (PMSF) SIGMA-Aldrich, Steinheim
Rothiophorese Gel30 (37,5:1) Roth, Karlsruhe
Chloridric acid (37%) VWR, Löwen, Belgien
Tetramethylethylendiamine (TEMED) Roth, Karlsruhe
Tween 20 Roth, Karlsruhe
Tryptone BD, Sparks USA
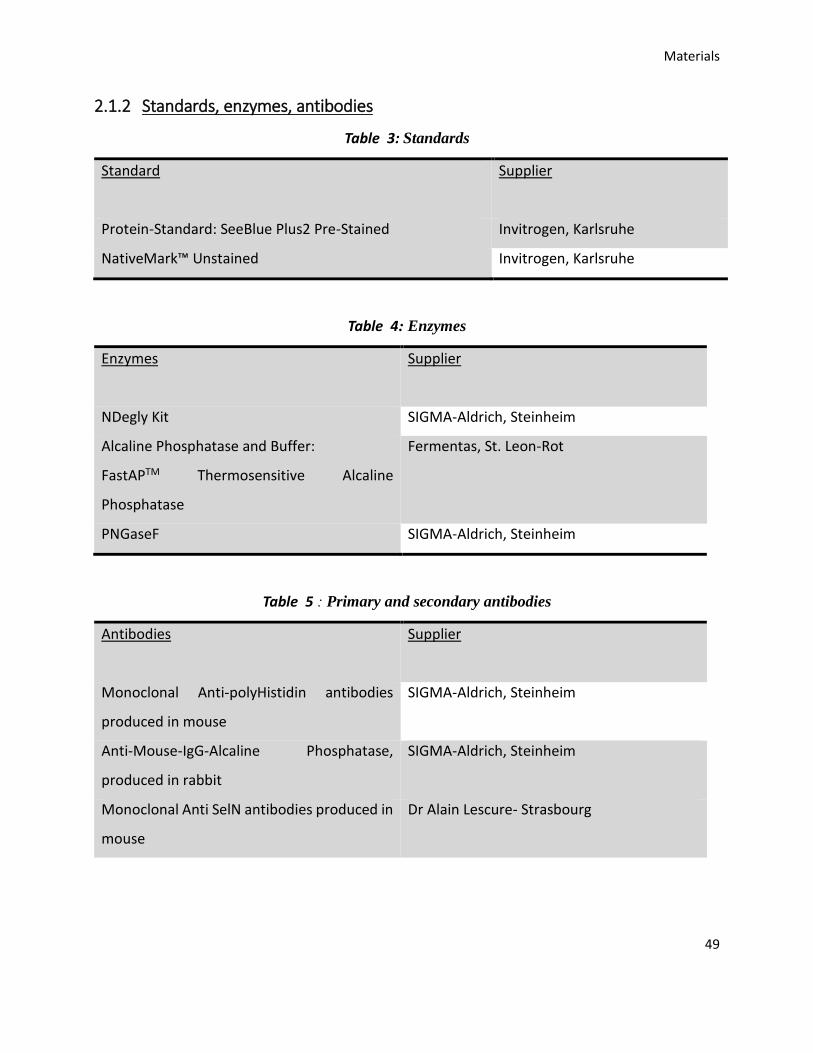
Materials
49
2.1.2 Standards, enzymes, antibodies
Table 3: Standards
Standard
Supplier
Protein-Standard: SeeBlue Plus2 Pre-Stained Invitrogen, Karlsruhe
NativeMark™ Unstained Invitrogen, Karlsruhe
Table 4: Enzymes
Enzymes
Supplier
NDegly Kit SIGMA-Aldrich, Steinheim
Alcaline Phosphatase and Buffer:
FastAPTM Thermosensitive Alcaline
Phosphatase
Fermentas, St. Leon-Rot
PNGaseF SIGMA-Aldrich, Steinheim
Table 5 : Primary and secondary antibodies
Antibodies
Supplier
Monoclonal Anti-polyHistidin antibodies
produced in mouse
SIGMA-Aldrich, Steinheim
Anti-Mouse-IgG-Alcaline Phosphatase,
produced in rabbit
SIGMA-Aldrich, Steinheim
Monoclonal Anti SelN antibodies produced in
mouse
Dr Alain Lescure- Strasbourg

Materials
50
2.1.3 Commercial kits
Table 6: Crystallisation screens
Screen Supplier
Crystal Screen Hampton Research, Aliso Viejo, CA, USA
Crystal Screen 2 Hampton Research, Aliso Viejo, CA, USA
PEG/Ion Screen Hampton Research, Aliso Viejo, CA, USA
Cryo Screen Hampton Research, Aliso Viejo, CA, USA
JSCG Core I suite Qiagen, Hilden
HT Memgold Molecular Dimension, Suffolk, UK
HT Memgold II Molecular Dimension, Suffolk, UK
Wizard Jena Bioscience
Morpheus I Molecular Dimension, Suffolk, UK
Morpheus II Molecular Dimension, Suffolk, UK
2.1.4 Purification material
The protein purification was carried out using a ÄKTA Purifier system (GE Healthcare)
Table 7: Column and matrix used for Chromatography
Column/Matrix
Supplier
His 60 Ni Superflow resin Clontech Takara
HiTrap, 1ml-column GE Healthcare, München
HiLoad 16/60 Superdex 200
column
GE Healthcare, München
HiPrep 10/300 Superdex 200 GE Healthcare, München

Materials
51
2.1.5 Equipment and accessories
Table 8: Equipment
Device
Supplier
Analytical balance CPA225D Sartorius, Göttingen
Growing shaker Minitron Infors-HT, Bottmingen,
Schweiz
Unitron Infors-HT, Bottmingen,
Schweiz
Agarose and Gel
electrophorese Apparatus
MINI-SUB CELL-GT“ BioRad, München
Blot-Apparatus Mini Trans-Blot
Electrophoretic Transfer
Cell
BioRad, München
Incubator (37°C) Binder, Tuttlingen
Chromatography-System ÄKTApurifier FPLC GE Helthcare, München
Ice machine Manitowoc, Herborn
Freezer (-20°C) Liebherr, Ochsenhausen
Freezer (-80°C) Liebherr, Ochsenhausen
High-pressure cell disruption
apparatus
EmulsiFlex Avestin, Ottawa, Kanada
Inkubator for crystallisation
plates (18°C)
VinoThek Liebherr, Ochsenhausen
Crystal Mation Rigatu, Kent, England
Crystallisation robot Phoenix Art Robbins, Sunnyvale USA
Fridge (4 °C) Liebherr, Ochsenhausen
Lab balance Extend Sartorius, Göttingen
Magnetic MSH20A IDL, Nidderau

Materials
52
Stirer Variomag mobil Thermo Scientific, Waltham
(MA), USA
Microscope „CX31“ Olympus, Hamburg
Microscope „SZX9“ Olympus, Hamburg
Microwave Severin, Sundern
Orbital-Shaker (Blots und Gele) DOS-10l NeoLab, Heidelberg
DOS-20S NeoLab, Heidelberg
pH-Meter Seven Easy Mettler Toledo, Giessen
Photometer Ultrospec 2100 pro GE Healthcare, München
WPA BiowaveCOa 8000 cell
density meter (Zur
Messung der optischen
Dichte OD600)
Biochrom Ltd. Cambrige UK
Pipettes
((2/10/20/100/200/1000 µL)
Gilson, VilliersLeBel, France
SDS-Gel electrophorese
Apparatus
Xcell SureLock Invitrogen, Karlsruhe
Mini Protean3 BioRad, München
Voltage sensor PowerPac BASIC BioRad, München
Sterilbanch MSC-Advantage Thermo Scientific, Waltham
(MA), USA
Thermomixer Comfort Eppendorf, Hamburg
Thermocycler MyCycler BioRad, München
Drying incubator (60°C) Binder, Tuttlingen
Rotator Intelli-Mixer NeoLab, Heidelberg
UV-Table Bender, Wiesloch
Water system Ultra Pure, Milli-Q Integral
15
Millipore, Schwalbach/Ts

Materials
53
Vortexer Vortex-Genie 2 Scientific Industries, Bohemia
(NY), USA
Centrifuge
Avanti J-26XP Beckman Coulter, Krefeld
Eppendorf 5424 Eppendorf, Hamburg
Eppendorf 5810R Eppendorf, Hamburg
Microfuge 18 Beckman Coulter, Krefeld
2.1.6 Supplie and other material
Table 9: Supplies
Material Supplier
96 deep well Block, 2 mL Crystallization-Assay Costar, Amsterdam, Niederlande
96 well Cristallisation plate „MD 11-00-100“ Molecular Dimensions, Suffolk, UK
24 well Plate „Comboplate” Greiner Bio-One, Frickenhausen
Aluminum foil 30u-quality Roth, Karlsruhe
Beakers, various sizes VWR, Darmstadt
Blotmembrane: Immobilon-Transfer
Membrane (PVDF)
Millipore, Schwalbach/Ts
Dialysis-tube: MWCO 30 kDa, 43 mm Millipore, Schwalbach
Disposable Scalpels Braun, Melsungen
UV cuvette Sarstedt, Nümbrecht
Erlenmeyer various sizes VWR, Darmstadt
EasySeal DWB Sheets for cristallisations
plates
Molecular Dimensions, Suffolk, UK
SureSeal DWB Sheets for deep well Blocks Molecular Dimensions, Suffolk, UK
Falcon-tubes 15 ml, 50 ml Greiner Bio-one, Nürtingen

Materials
54
Glass bottles, various sizes VWR, Darmstadt
Concentrator: Centriprep Centrifugal Filter
Devices, MWCO 30 kDa, 50 mL
Millipore, Schwalbach/Ts
Parafilm Pechiney, Menasha, USA
Pasteur pipettes (plastic) Sarstedt, Nümbrecht
Pipettes (plastic), sterile (5, 10 and 25 ml) Greiner Bio-One, Frickenhausen
PCR tubes 200 µl Biozym, Hessisch Oldendorf
Petri dishes (plastic) Sarstedt, Nümbrecht
Tubes of 1.5 ml / 2 ml Sarstedt, Nümbrecht
Tubes (plastic), sterile (13 ml) Sarstedt, Nümbrecht
Tips 10 / 200 / 1000 µl Gilson, VilliersLeBel, Frankreich
Syringes 1 ml Becton Dickinson, Madrid, Spanien
Syringes 5/10/20/50 ml Braun, Melsungen
Sterilfilter (0,2 und 0,45 µm) Millipore, Schwalbach/Ts
Glass cylinder, various sizes Vitlab, Seeheim-Jugenheim
Sterilfilter (0,2 und 0,45 µm) Sarstedt, Nümbrecht
Whatman-Paper: Mini Trans Blot Filter paper BioRad, Münschen
Centrifuge tube (70 ml, 1 l) Beckman Coulter, Krefeld

Materials
55
2.1.7 Computer program
Table 10: Computer program
Program Supplier
Adobe Acrobat Adobe
Crystal Trak Rigaku, Kent, UK
ExPASy http://web.expasy.org
Kappa Camera Control Kapp optronics, Gleichen
Microsoft Word 2007 Microsoft
NanoDrop 2000 Thermo Scientific, Bonn
OmniSEC Malvern Instruments, Herrenberg
Origin Pro 9G Originlab, Northhampton, USA
Unicorn Workstation 5.11 GE-Healthcare, München, Germany
ATSAS 2.8.0 EMBL, Hamburg, Germany
CCP4 Program suite STFC Rutherford Appleton Laboratory, Oxon,
UK (Winn MD 2011)
Phenix Program suite Berkely, USA (Kapral 2010)
WinCOOT UK
PyMOL DeLano Scientific LLC, San Carlos, USA

Materials
56
DICROWEB http://dichroweb.cryst.bbk.ac.uk
Phyre2 http://www.sbg.bio.ic.ac.uk/~phyre2
2.1.8 ESRF Beamlines
Table 11: ESRF beamlines used and their characteristics
Beamline Wavelength Characteristics References
BM29 7-15 keV -for experiment small angle x-ray scattering of
proteins in solution
(Pernot et al. 2010)
ID29 6-20 keV -tunable wavelength for single or multi
wavelength anomalous dispersion
-10-50 µm beam diameter
(de Sanctis et al. 2012)
ID23-1 5-20 keV -tunable wavelength for single or multi
wavelength anomalous dispersion
-10-45 µm beam diameter
(Nurizzo et al. 2006)
ID23-2 14.2 keV -10 µm beam diameter (Flot et al. 2010)
ID30B 6-20 keV -tunable wavelength for single or multi
wavelength anomalous dispersion
-20-200 µm beam diameter
(Mueller-Dieckmann et
al. 2015)
The access of ESRF beamlines was provided through the Frankfurt-Homburg Block Allocation
Group (BAG)>

Materials
57
2.1.9 Buffers and stock solutions
Table 12: Buffers, Stock solutions and their composition
Buffer and solution Composition
Ampicillin stock solution (100x) 100 mg Ampicillin/mL in H2O (sterile filtered,
stored at -20°C)
5-Brom-4-chlor-3-indolylphosphat(BCIP)
solution
50 mg BCIP/mL DMF (stored at –20°C)
Chloramphenicol (stock solution) 31 mg Chloramphenicol/ml in ethanol, stored at -
20°C
Coomassie solution 1.25 g Coomassie Brilliant Blue R250, 200 mL
H2O, 50 mL
Acetic acid, 250 mL Methanol
Destaining solution
Coomassie gels
10% Acetic Acid
Kanamycin stock solution 30 mg/mL in water, stored at –20°C
Penicilline-Streptomycine
Hygromycine
Doxicyclyne

Materials
58
Table 13: Buffers, Stock solutions and their composition
Buffer/Stock solution Composition
Loading buffer 6x (SDS-PAGE) 0.25 mM Tris-HCl pH 6.8, 40% (w/v) Glycerol, 20% (v/v)
ßmercaptoethanol, 8% (w/v) SDS, 0.004% (w/v)
Bromophenol Blue
Nitro-blue tetrazolium (NBT) solution 50 mg NBT/mL in 70% Dimethylformamid (DMF), stored at
4°C
Phenylmethylsulfonylfluoride (PMSF)
stock
100 mM PMSF in 100% isopropanol
Running buffer 10x (SDS PAGE) 500 mM Tris-HCl, 1.92 M Glycine, 1% (w/v) SDS
Sodium dodecyl sulfate(SDS) 10% 10 g SDS in 100 mL water
PBS buffer 10X 160 g NaCl, 4 g KCl, 4 g KH2PO4, 23.2 g Na2HPO4 in 2 L
water; pH 7.45
PBST buffer 100 mL 10X PBS, 0.5 mL Tween 20, in 1L water
Blot buffer (Western blot) 38 mM Glycine, 10 mM Tris-HCl, 20% (v/v) Methanol
Blocking solution (Western Blot) 5 g/L milk dissolved into TBST

Materials
59
2.1.10 Gels
2.1.10.1 SDS-PAGE gels
8 % Separating gel:
Component
4 Gels
H20 9.3 mL
Rothiphorese 30 5.3 mL
1 M Tris-HCl pH 8.8 5 mL
SDS 10% 200 µL
Temed 10 µL
10 % APS 200 µL
10 % Separating gel:
Component
4 Gels
H20 7.9 mL
Rothiphorese 30 6.7 mL
1 M Tris-HCl pH 8.8 5 mL
SDS 10% 200 µL
Temed 10 µL
10 % APS 200 µL

Materials
60
5 % Stacking gel:
Component
4 Gels
H20 4.1 mL
Rothiphorese 30 1 mL
1 M Tris pH 6.5 750 µL
SDS 10% 60 µL
Temed 10 µL
10 % APS 60 µL
2.1.10.2 Clear Native PAGE
8% Separating gel
Component
4 Gels
H20 9.3 mL
Rothiphorese 30 5.3 mL
1 M Tris-HCl pH 8.8 5 mL
Temed 10 µL
10 % APS 200 µL
5% Stacking gel
Component
4 Gels
H20 4.1 mL
Rothiphorese 30 1 mL
1 M Tris pH 8.8 750 µL
Temed 10 µL
10 % APS 60 µL

Materials
61
2.1.11 Media for cell culture
Table 14: Media for Escherichia coli culture
Medium Composition
LB medium 10 g/L Bacto Tryptone, 5 g/L Bacto Yeast Extract,
5 g/L NaCl
LB plate 10 g/L Bacto Tryptone, 5 g/L Bacto Yeast Extract,
5 g/L NaCl,
15 g/L Bacto Agar
Table 15: Media for HEK 293 Trex cells culture
Medium and stock solution Composition and preparation
DMEM Commercial
Foetal Bovine Serum Commercial
CD293 Commercial

Materials
62
2.1.12 Buffers for purification
Table 16: Buffers used for bacterial SelenoN purification
Purification step Composition
Lysis
Lysis and loading on the
Ni-NTA matrix
30 mM Tris-HCl pH 8.0, 300 mM NaCl, 2 mM
MgCl2, 10% glycerol, 0,5 mM TCEP, 1 mM
PMSF, 2 mM Benzamidine, 130 µg/mL of
denaturated lysozyme
Affinity
chromatography
Chaperone removal or
ATP wash
30 mM Tris-HCl pH 8.0, 300 mM NaCl, 2 mM
MgCl2, 0,5 mM TCEP, 30% glycerol, and 5
mM ATP
Elution 30 mM Tris-HCl pH 8.0, 300 mM NaCl, 2 mM
MgCl2, 10% glycerol, 0,5 mM TCEP, 750 mM
Imidazole
Size exclusion
chromatography
30 mM Tris-HCl pH 8.0, 300 mM NaCl, 10%
Glycerol, 2 mM MgCl2, and 0.5 mM TCEP.

Materials
63
Table 17 : Buffers used for zebrafish SelenoN purification
Purification step Composition
Lysis 100mM Tris HCl pH 7.5
Solubilization
30 mM Tris-HCl Ph 7.5, 5 mM
MgCl2, 1.25 CaCl2, 10%
glycerol, 0.5 mM TCEP, 150
mM NaCl, 0.5 β DM
Afinity chromatography
Loading on matrix 30 mM Tris-HCl pH 7.5, 5 mM
MgCl2, 1.25 CaCl2, 10%
glycerol, 0.5 mM TCEP, 150
mM NaCl, 0.05 β DM
Elution 30 mM Tris-HCl pH 7.5, 5 mM
MgCl2, 1.25 CaCl2, 10%
glycerol, 0.5 mM TCEP, 150
mM NaCl, 0.05 β DM, 400mM
Imidazole
Size exclusion
chromatography
30 mM Tris-HCl pH7.5, 2mM
EGTA, 2mM EDTA, 10%
glycerol, 0.5 mM TCEP, 150
mM NaCl, 0.05 β DDM

Materials
64
2.1.13 Biological material
2.1.13.1 Vectors
Table 18 : Vectors and their specifications
Plasmid Specification Promote
r
Resistance
marker
Inducer Supplier
pGRO7 GroES- GroEL AraB Cm Arabinose Qiagen
pQE70 Cter (His)6 tag T5 Amp IPTG Qiagen
pcDNA5 Cter(His)6 tag CMV Hygromicine Doxycycline or
tetracycline
Thermofisher
pGRO7 vector: Expression of recombinant proteins in Escherichia coli (E. coli) often results in
various problems, such as the formation of insoluble proteins accumulating in inclusion bodies
and protease degradation of the protein. These issues often are result of the improper folding of
the expressed proteins. Molecular chaperones have been demonstrated to be involved in the
proper protein folding process (Nishihara et al. 1998). Thus, coexpression of a chaperone with the
protein of interest has been shown to stimulate well folded protein production in high quantity.
The pGRO7 vector presents these following features: Chloramphenicol resistance as marker,
Arabinose-dependent induction of GroES and GroEL chaperones expression (Figure 17).
pQE70 is a vector suitable for expression in E. coli that enables the introduction of the (His)6 tag
at the C terminus of the recombinant protein, and also ensures that only the full length of the
recombinant protein will be purified. Protein expression is induced by addition of IPTG (Figure 17).
pcDNA5 is a vector for high level expression in mammalian cells designed for use with the Flp-In™
System (Thermofisher). The protein expression in under control of thehuman CMV promoter and
induced by tetracycline or doxycycline. The FLP Recombination Target (FRT) site enable the Flp

Materials
65
recombinase-mediated integration of the vector into the Flp-In™ host cell line. Selection of a
stable cell line is made by the resistance to hygromycin (Figure 18).
Figure 17: Vectors used for bacterial SelenoN expression in E coli (http://www.biofeng.com)
Figure 18: pcDNA5 vector used for zebrafish SelenoN expression in HEK 293 Trex cells
(http://www.biofeng.com)

Materials
66
2.1.13.2 Escherichia coli and HEK cells strains
Structural studies by x-ray crystallography requires not only soluble, but also well folded and
conformationally homogenous material.
Escherichia coli is a bacterial host system that is often used for the protein expression in structural
biology. Besides the high quantity of protein that it is possible to yield, it presents advantages that
it is easy to handle. The strain used here to express recombinant bacterial SelenoN is XL1-Blue.
Besides all benefits cited above, bacterial expression system has some limitation e.g. lacking post
translational modifications when used to express eukaryotic. Those modifications are required for
a proper protein folding and tentative to express this kind of proteins in bacterial system usually
lead to unfolded protein resulting to insoluble material. In such case, mammalian expression
systems are used. Human Embryonic Kidney (HEK) cells is one of the two most used mammalian
expression system. The strain used to express is HEK 239Trex TM is a strain specifically designed for
stable cell line generation.

Experimental Methods
67
2.2 Methods 2.2.1 Biochemical Methods
2.2.1.1 Heterologeous expression in different systems
2.2.1.1.1 Bacterial SelenoN (bSelenoN) heterologeous expression in E. coli system
2.2.1.1.1.1 Transformation by electroporation of electrocompetent Ecoli cells
An aliquot of 100µL of electrocompetent cells was mixed with 10 ng of pQE70(bSelenoN) vector
and incubated on ice during 5 min. The mix was then transferred in a cold electroporation cuvette
and the electroporation was conducted according to BioRAD instructions for E. coli cells. Right
after the electropulse, 1 mL LB was added to the mix and then incubated at 37 °C. After 1 h, the
mixture was centrifuged 4200 rpm for 15 min, 1 mL was removed from the mixture without
disturbing the cell pellet, and the rest is plated on selective plates of LB (Cam 30 µg/mL, Amp 100
µg/mL) + 2% dextrose and incubated overnight at 37 °C.
2.2.1.1.1.2 Expression of Candidatus poribacteriae SelenoN in E coli
2 expressing clones were grew overnight at 37°C in LB containing Amp 100 µg/mL + Cam 30 µg/ml
+ 2% glucose to generate a seed culture. The following morning, the seed was used to inoculate a
culture medium with the same composition supplemented with arabinose 5 mg/ml at final OD600
0.1. The culture was incubated at 30°C with constant shaking till OD600 reaches 0.6, and then
incubated on ice for 15 min (cold chock). Cells were then collected through a centrifugation step
during 15 min at 4200 rpm to change the growth medium. The purpose of this step was to remove
the Arabinose which induces chaperones expression and Glucose which inhibits SelenoN
expression. The pellet was resuspended into the same volume of LB (Amp 100 µg/mL + Cam 30
µg/mL) + 0,5 mM IPTG. After an overnight incubation in the shaker (around 170 rpm) at 18°C, cells
were harvested by centrifugation at 4200 rpm for 15 min at 4°C.
2.2.1.1.1.3 Expression of Selenomethionine labelled bSelenoN (Semet-bSelenoN)
Expression of Selenomethionine labelled bSelenoN was made following the same protocol as
previously described. After growing the seed culture, the culture medium (see composition
above) was inoculated at final concentration OD600 0.1. Cells were grown at 30°C until OD600
reaches 0.7-0.8 then after a cold chock, cells were washed in sterile deionized water before being
resuspended at the same density in minimum medium containing 50 µg/mL L-Selenomethionine.

Experimental Methods
68
After 30 min of shaking at 30°C, IPTG was added at final concentration 0,5 mM and temperature
was decreased to 18°C for the overnight induction.
2.2.1.1.2 Zebrafish SelenoN heterologous expression in HEK 293 Trex cells
2.2.1.1.2.1 Transfection of pcDNA5(zSelenoN) in HEK 293 Trex cells and selection of an expressing
clone (Made by Melanie Thamy-Braye in Strasbourg)
Flp-In TM T-RexTM system was used to generate a stable inducible cell line following the
manufacturer instructions. The system has three main components: pcDNA5TM/FRT/TO vector
containing already the gene of interest zSelenoN, pOG44 vector for transient expression of Flp
recombinase (Broach and Hicks 1980; Broach, Guarascio, and Jayaram 1982) and mammalian HEK
293 Trex cells. The DreamFectTM Gold (Oz Bioscience) was used as the transfection agent. It is a
Lipid-mediated reagent that form complex with the DNA (plasmids) and will be internalized inside
mammalian cell by endocytosis (Felgner and Ringold 1989).
Co-transfection with pO44 and pcDNA5 vector was made with a cell concentration of 6*105 and
106 cells/mL and consists on adding to HEK 293 Trex cell culture (in DMEM+ 10%FCS, +1% Penicillin
and Streptomycin), the mixture of DNA and DreamfectTM gold according to the manufacturer
instructions.
Selection was made in three steps. First cells were selected for integration of the gene, secondly
integrants were tested for the integration of the gene of interest at the right position, and finally
integrant are tested for their expression level.
48h after the transfection, cells were trypsinized and resuspended in fresh medium. 24h after
medium exchange, clone selection based on antibiotic resistance was started. Integration of
pcDNA5 in the host confers hygromycin resistance. Medium was then exchanged with DMEM
supplemented with 250 µg/mL hygromycin (selection medium). The selection medium was
renewed five times every two days. After the last exchange, resistant clones were isolated at a
concentration one clone per well in a 96 well plate. Selection was continued over 8 days. After
this first step of selection, integrants were expanded and prepared for the second step of
selection.

Experimental Methods
69
The second step of the selection consisted on testing for integrants lack of β-galactosidase activity.
Flp-In T-Rex Cells are designed so that they express galactosidase under the control of SV40 early
promoter. These properties aim at controlling the gene insertion. The integration of the gene via
the Flp recombinase-mediated DNA recombination at the FRT site (Gorman, Fox, and Wahl 1991)
leads to the inactivation of LacZ gene transcription therefore a lack of galactosidase activity. The
galactosidase activity is translated by a blue coloration of cells in reaction to the lacZ reaction
buffer (K4Fe(CN)6, 3H2O, 5 mM K3Fe(CN)6, 1 mM MgCl2, 1.25mg/mL X-gal). Integrants with blue
color were discarded and colorless integrants were prepared for the last selection step.
The last selection consisted on testing the expression level. Protein expression was induced during
24h by adding doxycycline which is a stable analogue of tetracycline at final concentration 0.01
µg/mL. Cells were lysed by sonication and the protein loading buffer was directly added to the
crude extract. The mixture was charged on a SDS-PAGE gel and after the run, total proteins were
transferred on a PVDF membrane for a western blot. The membrane was later incubated with
anti zSelenoN primary antibodies and anti mouse-IGg secondary antibodies.

Experimental Methods
70
2.2.1.1.2.2 Expression of recombinant zSelenoN in HEK 293 Trex cells
2.2.1.1.2.2.1 Expression in suspension
Initially, the biomass was generated in adherent culture using either 75 or 175 cm2 flasks. After
reaching confluence, the adherent cells were trypsinized and resuspended into 60mL/flask to
enable the transportation from the IBMC to the platform instruct of the CBI. The suspension
culture was then started using 2*60mL at 106cells/mL concentration. The used medium was
DMEM supplemented with 10% fetal bovine serum and 1% penicillin-streptomycine to limit
bacterial contamination. The generation time of the HEK 293 Trex cells is about 24hours in the
DMEM. Therefore, the dilution in increasing volume was made so that the initial cell concentration
was maintained. After reaching the expected volume, doxycycline was added to a final
concentration of 0.5µg/mL to induce protein expression during 24 to 48 hours (Figure 19). The
expression was carried out at 37°C in an atmosphere with 5% CO2 and 70% humidity, with an
agitation speed of 90rpm.
5.2 g of expressing cell pellet was collected per liter DMEM medium.
2.2.1.1.2.2.2 Cell adaptability to CD293 medium
Cells adaptation to medium designed for expression in suspension such as CD293 medium without
FBS was assayed. The adaptation consisted on gradually switch from the DMEM to the CD293
medium. Cells were cultured at 37°C in an atmosphere with 5% CO2 and 70% humidity, with an
agitation speed of 90rpm. Initially, cells were in a medium composed of 95% DMEM and 5%
CD293. After each two weeks, the amount of DMEM was reduced and CD293 increased. During
each medium modification step, viability of cells was counted, and cells resuspended in a medium
volume to keep a density of 1*106 cells /mL. During this adaptation, the viability curve was
supposed to decrease until it reached a point where it increased to the normal level were cells are
considered adapted.
2.2.1.1.2.2.3 Adherent culture in plate
Overexpression of zSelenoN was also made in adherent HEK cells culture. The expression was
carried out at 37°C in an atmosphere with 5% CO2 and 70% humidity. Initially, the biomass was
generated in adherent culture using 75 cm2 flasks. After reaching confluence, cells were

Experimental Methods
71
trypsinized, resuspended to a dilution ¼ and dispensed in 4 *75cm2 flasks. Culture reached
confluence after 2 days. Each flask was treated with trypsin before being resuspended in 6*37.5
ml and dispensed in 6*225 cm2 plates. The last passing step was made from 225 cm2 flasks to
500cm2 plates (Figure 20). After cells reached confluence, medium was removed by aspiration and
replaced with the DMEM medium containing 0.5µg/mL doxycycline to induce protein expression.
After 48hours, medium was aspired, and cells were rinsed with PBS and collected by scratching
them from plate surfaces.

Experimental Methods
72
Figure 19 Flowchart of expression in suspension
Figure 20 Flowchart of expression adherent culture

Experimental Methods
73
2.2.1.2 Recombinant protein purification
2.2.1.2.1 Bacterial SelenoN purification
11 g of cell pellet were resuspended in 200 ml of lysis buffer. The lysate was transferred to
ultracentrifuge tubes and centrifuged for 1h at 100 000 g at 4°C. The supernatant which constitute
the soluble extract was collected avoiding any disturbance of the pellet.
The soluble extract was batched with 4 ml of Ni-NTA matrix, preequilibrated in the lysis buffer, for
1 h at RT. Then the batch was transferred onto a column, and the flow through was collected by
gravity flow. The batch was then washed twice with 5 bed volumes of lysis buffer containing 20
mM imidazole.
The matrix was then batched twice with 5 bed volumes of chaperones removal buffer and
incubated for 30 min at 37°C on a rotating wheel. The batch was then transferred onto a column
and the wash was collected by gravity flow. The batch was repeated for 15 min and fractions thus
collected constitute ATP washes.
The protein was eluted with 750 mM imidazole in the lysis buffer without proteases inhibitors
The eluate from the IMAC purification of bSelenoN produced in E coli was concentrated to a
volume of 2 mL with pressure dialysis using 50 mL concentrators with cut-off of 30 kDa.
Recommended speeds for Amicon Ultra concentrators were followed.
The IMAC purified bSelenoN protein was polished using the Hiload Superdex 200 16/60 GL column
on an AKTA purifier system. The Superdex 200 column was first washed with 2 bed volume of
water then with at least 2 bed volume of buffer. 2 mL of purified bSelenoN were loaded onto the
Superdex 200 16/60 column. Elution of protein was followed by measuring the absorbance at 280
nm. Aliquots corresponding to the A280 peaks were analyzed by SDS-PAGE.
2.2.1.2.2 Zebrafish SelenoN purification
Cell pellet was resuspended to 30% (weight/volume) into the lysis buffer containing 100mM Tris

Experimental Methods
74
HCl pH 8.0, 10% glycerol, EDTA free tablet protease inhibitor and 0.5 mM TCEP. After
homogenization, cells were sonicated at 4°C during 3 min using the following features: pulse on
2sec, pulse off 2sec, amplitude 40%.
The lysate was centrifuged for 20 min at 12000 rpm (17400g) at 4°C. The membrane pellet thus
obtained was resuspended in the lysis buffer supplemented with 150 mM NaCl and 0.25% β-DM.
The expressed zSelenoN was solubilized from the membrane under mild agitation at 4°C during
1h.
After centrifugation (20min at 12000rpm), the solubilized membrane fraction was loaded in batch
with 1mL Ni-IDA column with a flow 0.5 mL/min.
After washing the matrix with 10CV solubilization buffer, the protein was eluted over a gradient
of Imidazole from 0 to 400 mM Imidazole.
After checking fraction enrichment on a SDS-PAGE gel, fractions containing zSelenoN were
concentrated to 4 mL using an amicon with the cut off 50KDa. After centrifugation to pellet the
insoluble aggregates, the sample was loaded on a Superdex 200 10/300. The run was carried out
at 4°C with buffer composed of 50 mM TrisHCl pH 8.0, 150 mM NaCl, 0.5 mM TCEP, 10% Glycerol
(zSelenoN Buffer) supplemented with 0.025% β-DDM.

Experimental Methods
75
2.2.2 Biophysical methods
2.2.2.1 Small Angle X-ray Scattering (SAXS) in line with Size Exclusion Chromatography (SEC)
2.2.2.1.1 SAXS data acquisition
SAXS is a method used to characterize biological macromolecules in solution. It is applicable to a
broad range of particle size. The basic principle of the method is the following: a sample
(macromolecule in solution) is illuminated with an x-ray beam andthe randomly oriented
molecules in solution will scatter the radiation (Figure 21). Data acquisition is split up in multiple
frames which were merged resulting in a 1D curve. The analysis will provide different information
on the macromolecule like: Structural changes in different conditions, the molecular weight, the
radius of gyration, the degree of folding, denaturation, disorder, as well as a low-resolution shape
of the molecule (Figure 22). Scattering of the solvent must be subtracted to get the scattering from
the dissolved molecule.
The most important requirement for the measurement is the sample quality. Basically, the sample
must be as homogenous as possible (monodisperse) and free of any aggregation. Two ways of
measurements are possible: the static measurement andthe High Pressure Liquid
Chromatography coupled to SAXS (HPLC-SAXS). The HPLC-SAXS has the advantage that the
preceeding size exclusion chromatography separates different oligomers and aggregation, and
then all particles leaving the column are analyzed separately by SAXS according to their elution
volume.
2.2.2.1.2 SAXS data processing and interpretation
Data obtained are 1-dimensional scattering function. The scattered intensity is related to the
diffusion vector q or momentum transfer with the equation
𝑞( Å-1 or nm-1 ) = 4 π sinθ/λ
Where 2θ is the angle between direct and diffused beam and λ the wavelength of the beam (Figure
21).
Data are processed using the package ATSAS 2.8.0 (D Franke et al. 2017). After selecting frames of

Experimental Methods
76
the peak within the same Rg range, buffer signal is subtracted. The resulting frames are scaled and
averaged. The averaged curve is used for the Guinier as well as for the P (r) analysis.
Figure 21: Schematic representation of a SAXS experiment.
Molecules randomly oriented in solution scatter an incoming beam. The resulting signal is translated in a 1-
dimensional scattering curve which analysis can provide structural parameters and can be used for an initio
modeling of an envelope of the molecule (Kikhney and Svergun 2015b).
Figure 22: Workflow used for SAXS data processing.

Experimental Methods
77
2.2.2.1.3 Guinier Analysis
The Guinier analysis corresponds to the analysis of the SAXS curve at very small scattering angles.
Its approximation enables the intensity calculation through the relation (Guinier and Fournet
1955):
𝐿𝑛𝐼(𝑞) = 𝐿𝑛𝐼(0) − q2 * Rg2/3
𝐿𝑛𝐼(𝑞) 𝑖s a function of the diffusion vectorqand enables to determine the protein radius of
gyration Rg of the protein from the linear part and enables the extrapolation of diffused intensity
at zero angle I(0). The radius of gyration Rg is defined as the mass distribution of the
macromolecule around its center of gravity. It is a powerful parameter to evaluate protein
structural or conformational changes upon different conditions
The analysis of the Guinier trace enables to assess the quality of the sample as the linearity at low
angle is a proof of absence of aggregatesor interpaticle interferences (Figure 23).
Figure 23 example of Guinier traces of a sample with aggregate Vs no aggregation (Putnam et
al. 2007)
2.2.2.1.4 Kratky plot analysis
The Kratky plot is the representation of q2I(q) as a function of q (Glatter and Kratkt 1982). The
profile of this curve gives information about the degree of folding, flexibility, as well as the

Experimental Methods
78
presence of more than one domain in the protein.
The bell shape is characteristic of a globular protein, a bell shape followed by a shoulder is
characteristic of a multidomain protein, a bell shape followed by a plateau will characterize a
partially folded protein or a protein with flexible linkers, and a plateau will characterize an
unfolded protein (Figure 24).
Figure 24: different Kratky traces that describe different protein shapes
(https://www-ssrl.slac.stanford.edu/~saxs/analysis/assessment.html)
2.2.2.1.5 Distance distribution function: P(r) versus r analysis
The pair distance distribution function or P(r) function is the real space representation of the SAXS
curve. Its trace is supposed to be smooth, non-negative and approaching zero at the maximum
dimension of the particle usually called Dmax. In general, the pair distance distribution describes
the paired-set of all distances between points in an object. When applying the principle to
macromolecules, point of an object can be translate to electrons of the molecule. Thus, from this
function, one can monitor structural changes even in few residues in a macromolecule since
structural change implies a change of distance between electrons.
2.2.2.1.6 SAXS experiment with bacterial and zebrafish SelenoN
SAXS measurements were conducted on the Beam Line 29 (BM29) (Pernot et al. 2010) (Table 11)

Experimental Methods
79
at the European Synchotron Radiation Facilities (ESRF) in Grenoble-France with an X-ray beam of
12 KeV. For SelenoN proteins analysis, 70 µL of highly pure recombinant SelenoN concentrated at
4-15mg/mL was used for the HPLC-SAXS (Table 19). The sample was loaded on a Superdex 200
10/300 GL coupled in line with SAXS. The elution of the protein was monitored by a UV and SAXS
detectors. And SAXS data were processed with softwares of ATSAS package (Table 20) following
the framework described in Figure 22.
Table 19: SAXS SelenoN sample details
Organism Candidatus Poribacteriae Danio rerio (zebrafish)
Source Purified from E. coli Purified from HEK 293 Trex
cells
Molar extinction coefficient E
0.1%
1.6 1.2
M from chemical composition
(Da)
64772 62670
SEC SAXS column Superdex 200 10/300 Superdex 200 10/300
Loading concentration (mg/mL) 15 10 or 4.5
Injection volume (µL) 70 70
Flow rate (ml/mL) 0.5 0.5
Table 20:Software employed for SelenoN SAXS data reduction analysis and interpretation
SAXS data reduction PRIMUSqt from ATSAS 2.8.0 (Petoukhov et al., 2012)
Data basic analysis PRIMUSqt from ATSAS 2.8.0 (Petoukhov et al., 2012)
Bead modelling DAMMIF (Franke & Svergun, 2009) and DAMMIN (Svergun, 1999) via ATSAS online (https://www.embl-hamburg.de/biosaxs/atsas-online/)
Three-dimensional graphic model
representation
PyMOL (DeLano, 2003)

Experimental Methods
80
2.2.2.2 Secondary structure studies using circular dichroism spectroscopy
Circular dichroism spectroscopy (CD spectroscopy) is based on the difference in absorption of the
left and the right handed circularly polarized light (Figure 25). The circular dichroism signal is
observed when a molecule contains one or more light absorbing group (chiral chromophores).
Biological macromolecules are chiral for instance, the twenty-common amino acid that form
proteins are chiral themselves. The CD spectroscopy has been used to assess the secondary
structure of the recombinant proteins. Secondary structure elements such as alpha helix and beta
sheet have a particular CD signature (Figure 25). Measurements made in the far UV (below 260
nm) can be used to predict the percentage of each of those elements in a protein. The obtained
CD spectra contains information on percentage of each structural element and analysis with
specific algorithms designed for fitting protein CD spectra will provide insight into the secondary
structure. Folded and unfolded roteins will have a different CD spectra profile (Figure 26).
For the measurements, 100 µL of protein solution concentrated at 0.1-0.3 mg/mL was used in
1mm cuvettes. Buffer were first exchanged using amicon concentrator to 3 mM Tris, 15 mM NaCl
0.5 mM TCEP for the bacterial SelenoN, and to the same buffer supplemented with 2 mM EDTA,
2 mM EGTA, 0.05% β-DDM for the zebrafish SelenoN.

Experimental Methods
81
Figure 25: circular discroism spectroscopy principle and Circular dichroism spectra of α helices,
β-sheet and rancom coil
CD spectra characteristic from each secondary structure are presented on the right panel: red = random coil, green =
α-helix, blue = β-sheet
(http://www.isa.au.dk/facilities/astrid2/beamlines/AU-cd/images/CD-principle-1200px.png and
http://www.fbs.leeds.ac.uk/facilities/cd/images/1.png)
Figure 26: Circular Dichroism spectra profiles of a folded vs unfolded protein
(https://www.urmc.rochester.edu/structural-biology-biophysics/services/biomolecular-
characterization.aspx)

Experimental Methods
82
2.2.3 X-ray crystallography
Obtaining a protein structure using the x-ray crystallography is a long and empirical process that
can require several years of intensive research. The prerequisite to this technique is obtaining a
pure homogenous protein solution. The concentrated protein sample is submitted to different
parameters and conditions that leading to the bulding of protein crystals. Crystals are submitted
to x-ray diffraction experiments. Each element of the crystal (protein and solvent) and each
electron of the protein will contribute to the diffraction (Figure 27). The diffraction pattern is
therefore characteristic of the protein. From the collected data, an electron density map can be
calculated and the position of each atom that constitutes the studied protein can be determined.
Figure 27: Workflow to assess a protein model using x-ray crystallography
https://www.creative-biostructure.com/images/X-ray-Crystallography-Platform-1.png)

Experimental Methods
83
2.2.3.1 Crystallogenesis
2.2.3.1.1 Protein crystal definition
A crystal can be defined as periodical packing of molecules in three dimensionalspaces. The
elementary unit of a crystal is called a unit cell that is characterized by three vectors a, b, c and
three angles α, β, γ. The crystal lattice is built from the unit cell through the relation:
𝑡 ⃗⃗ = m𝑎 ⃗⃗⃗ +n𝑏 ⃗⃗⃗ +p𝑐 ⃗⃗
Where m, n, and p are integer numbers.
The unit cell contains all information about symmetry operations like rotation, translation. The
smallest unit in the unit cell is the asymmetric unit generating the complete unit cell by all
symmetry operations of the space group.
A protein crystal is a periodical repetition of a unit cell and a motif where the motif is the protein.
Inside the crystal, proteins are not compactly packed as there is a part of the crystal volume that
is occupied by solvent. This solvent volume is calculated by the so-called Matthews coefficient
(Matthews 1968). It is admitted that the proportion of the Solvent in the crystal varied between
30 and 75%. This percentage gives information about the number of protein molecules that
constitute the motif.
2.2.3.1.2 Parameters that influence protein solubility in solution
Crystallization is the process in which a molecule evolves from a soluble state to a 3D organized
solid state. Two main steps constitute this process: the nucleation and the crystal growth. In the
case of protein, crystallization can occur when its solubility in solution gradually decreases
according to different parameters such as:
• The protein concentration
• The nature of the precipitant and its concentration
• The pH of the solution that can influence the protein charge and stability
• The Ionic strength
• The Temperature that can affect stability and solubility of the protein.

Experimental Methods
84
• Additives, effectors, and ligands that can induce conformational change on the protein
that can lead to a higher stability or compactness of the protein.
2.2.3.1.3 The Phase Diagram
The phase diagram is obtained by varying one of the parameters that influence the protein
solubility, for example here the precipitant concentration as a function of the protein
concentration. This leads to three main regions that represent the state of the molecule from
soluble state to crystal (Figure 28).
• The area under the solubility curve represents an undersaturated solution where no
crystallization is possible.
• The metastable zone limited by the solubility and the precipitation curves is important for
the crystallogenenis as the nucleation and the crystal growth are possible only in that zone.
The solution is then supersaturated.
• The precipitation zone is the zone where the protein and the precipitant concentrations
are too high and that leads to a protein precipitation that can be non-reversible
Figure 28: Phase diagram representing the protein concentration against any
adjustable parameters (Khurshid et al. 2014)

Experimental Methods
85
2.2.3.1.4 Vapor diffusion technique: the hanging and the sitting drops
Many techniques for the protein crystallization have been developed, however the vapor diffusion
technique associated to either the hanging or the sitting drop is the most popular and the aim is
to bring to solution to a supersaturated state. The principle of the hanging drop is the following:
a drop mixed of concentrated protein and precipitating agent is mounted on a cover slip that is
the used to close a greased well containing the reservoir solution. The reservoir solution contains
the precipitant agent at a higher concentration than in the drop. Due to the gradient
concentration, the water will evaporate from the drop towards the reservoir thus, lowering the
drop size and increasing the protein concentration and bringing the drop to the supersaturated
state. If the other parameters as the pH, ionic strength, temperature are appropriate, nucleation
followed by crystal growth can occur until the equilibrium between the drop and the reservoir is
reached. The principle of the sitting drop is the same except that the drop is not hanging on a
cover slip but is sitting on a smaller well adjacent to the reservoir well (Figure 29).
2.2.3.1.5 Crystallization of bacterial and zebrafish SelenoN
In our experiments, the vapor diffusion technique has been used. The bacterial as well as the
zebrafish selenoN where concentrated to 10-12mg/mL before the buffer was exchanged to
remove the glycerol prior to the crystallization set up. For the bacterial SelenoN, 2µL drops where
set up with a protein to precipitant ratio of 1:1. Different cocktails of crystallization solutions
where tested using a 24 well plate. Most of the condition tested where self-designed by varying
the PEG 6000 concentration as well as the nature of the buffer at pH 6.5.
In the contrary for the zSelenoN, only the sitting drop in 96 well plates was used. The protein was
first concentrated followed by an overnigth deglycosylation at room temperature using the
endoglycosydase F1 (suitable for native deglycosylation). Different commercial and self designed
screens were tested.
2.2.3.1.6 Selenomethionine-bSelenoN crystallization setups using microseeding
Selenomethionine-bSelenoN crystals were grown by combining vapor diffusion technique with
microseeding technique (D’Arcy, Mac Sweeney, and Haber 2003). Native bselenoN crystals were
harvested and placed in a tube containing 50 µL reservoir solution and a small crushing ball. The

Experimental Methods
86
seeding material was prepared by crushing them through vortexing the preparation. Then serial
dilutions of the seed material were made as described in Figure 30.
For the crystallization, the same reservoir solution (same composition with the seed material)
was used and seed material was used to set-up crystallization drops in a ratio of 1:1 with the
SeMet-bSelenoN (Figure 30).
Figure 29: Crystallization by vapor diffusion technique (http://soft-
matter.seas.harvard.edu/images/1/17/Drop2.gif)
Figure 30: Principle of microseeding technique

Experimental Methods
87
2.2.3.2 X-ray diffraction and data analysis
2.2.3.2.1 X-ray diffraction Principle
X-rays are high energy electromagnetic radiation. Their diffraction is the result of their interaction
with electrons of protein atoms.
The diffraction is possible when the Bragg law is respected. This Bragg law suggests that if an
incoming beam with a wavelength λ hits with an angle θ a family of parallel lattice planes with a
spacing distance d between them, the diffraction is possible when the following relation is
respected:
2d*sinθ = nλ
Where n is an integer number.
When the equation is respected, diffractedwaves in phase will be summed and this results on a
diffraction spot that will be recorded by the detector during the data collection. Each spot is
characterized by a triplet of coordinates h,k,l which are called Miller indices. In the crystal, set of
equivalent and equidistant lattice planes are defined by the Miller indices which are integer
numbers of intercepts of a set of lattice planes with each of the unit cell axes.
2.2.3.2.2 X-ray diffraction data quality assessment parameters
Data quality is appreciated according to different parameters such as:
• The resolution corresponds to the minimum distance than can be distinguished between
two points. It is expressed in Å.
• The Rsymm factor can be defined as the disagreement between intensities of equivalent
reflections. The lower the Rsymm value is the better the data are.
• The completeness which is the percentage of experimentally measured number of
reflections compared to the expected number of reflections.
• Multiplicity is the number of measurements made on a unique type of reflection. It
determines how significant the statistics, in particular the Rsymm values, are.
• Rmerge which is a merged data quality assessment can be defined as the consistency of

Experimental Methods
88
measurements made on a unique reflection according to the multiplicity
• I/δ(I) represents the signal to noise ratio.
2.2.3.2.3 The Electron density map calculation and the phase problem
Interaction of x-rays with proteins electron results on an electron density map that is specific of
each protein. The calculation of this map is translated by the equation
𝜌(𝑥, 𝑦, 𝑧) = (1
𝑉)∑
ℎ
∑
𝑘
∑ 𝐹
𝑙
(ℎ, 𝑘, 𝑙)𝑒−2𝛱𝑖(ℎ𝑥+𝑘𝑦+𝑙𝑧)
Where V is the unit cell Volume, F (h, k, l) is the structure factor of the diffracted wave, xyz position
coordinates of a point in the asymmetric unit cell.
The structure factor can be defined by the relation:
𝐹(ℎ, 𝑘, 𝑙) = ∑𝑓(𝑗)𝑒2𝛱𝑖(ℎ𝑥(𝑗)+𝑘𝑦(𝑗)+𝑙𝑧(𝑗)
𝑗
This can be also written𝐹(ℎ, 𝑘, 𝑙) = ⎸𝐹(ℎ𝑘𝑙) ⎸ 𝑒𝑖𝜑(ℎ𝑘𝑙)
Where f(j) is the structure factor of each atom j of the unit, ⎸𝐹(ℎ𝑘𝑙) ⎸is the amplitude of the
diffracted wave which is proportional to its intensity and 𝜑(ℎ𝑘𝑙) the phase of the diffracted wave.
During the data collection, the phase information is not measured, only the intensity is directly
accessible which makes the direct calculation of the electron density map not possible.
Nevertheless, there are indirect methods used to recover the phase information. In the following
chapter, I will present the two main methods used, the molecular replacement and the
experimental phasing.
2.2.3.2.3.1 Molecular replacement
Molecular replacement is based on the use of the phase information protein template to calculate
the electron density map of atarget protein. This method is applicable only when the target
protein has a highier sequence homology with the template usually more than 30%. The resulting
structure factor will be characterized by the template phase and the target amplitude.

Experimental Methods
89
In this method, Patterson functions are calculated for both the template and the target then are
compared and oriented according to 3 angles of the space that are called Euler angles. The aim
of this procedure is to maximize the numbers of superposed peaks that could correspond to
intermolecular vectors. This first step defines the so-called Rotation function. Patterson maps that
contain correlation vectors from the first step are later superposed to define three vectors in the
space. The use of Euler angles and vectors in combination will help to position the template
protein inside the unit lattice of the target protein.
2.2.3.2.3.2 Experimental phasing
2.2.3.2.3.2.1 Principle of experiment phasing
Experimental phasing is based on the determination of a marker atom substructure. The marker
atom will provide a difference in data that will be used to determine its location and extend it to
the rest of the protein. Marker atoms are generally heavy atoms that will provide data with a so-
called anomalous signal.
Anomalous signal comes from the fact that a part of the energy of an incoming beam with a
wavelength λ that correspond to the absorption threshold of the marker atom will be absorbed
by electrons of its inner shell and this will result on the transition of those electrons to an outer
shell. This transition will generate an electronic difference compared to other atoms which
implies a different and more complicated structure factor thus a different phase and amplitude.
The wave diffracted by the heavy atom will be different from the other and its structure factor is
then described by the equation
𝑓 = 𝑓0 + 𝑓′(𝜆) + 𝑖𝑓′′(𝜆)
Where 𝑓0 is independent from the wavelength λ,𝑓′′ and 𝑓′ are structure factors which their
values will be dependent on the nature of the heavy atom and the wavelength of the incoming
beam. 𝑓′ is in phase with 𝑓0 but not with 𝑓′′. Because of the imaginary number i, there is a phase
shift of between 𝑓′ and 𝑓′′.This phase shift leads to the non-respect of the Friedel’s Law which
says that structure factors of equivalent reflections (h, k, l) and (-h, -k, -l) are also equivalent in
other terms

Experimental Methods
90
⎸𝐹(ℎ, 𝑘, 𝑙)⎸ = ⎸𝐹(−ℎ,−𝑘,−𝑙)⎸ or ⎸F(+)⎸= ⎸F(-)⎸ In the case of anomalous difference, ⎸F(+)⎸≠ ⎸F(-)⎸
This difference of structure factors of equivalent reflections describes a function that is called
anomalous difference and is written
𝛥⎸𝐹⎸𝑎𝑛𝑜 = (⎸𝐹(+)⎸ − ⎸𝐹(−)⎸)𝑓′/2𝑓′′
The calculation of the Patterson map is based on this anomalous difference and aim to determine
position of marker atoms that are responsible of the anomalous signal.
2.2.3.2.3.2.2 Isomorphous replacement
Isomorphous replacement requires crystals which are individually derivatized with one or more
heavy atoms. The heavy atom is characterized by a strong electron density. Like other atoms it
contributes to the overall diffraction intensity.
Experimentally, derivatized crystals can be obtained by two ways: one way is to soak a native
crystal in a solution containing heavy atoms. The second way is by co-crystallization which means,
setting up crystallization drops with heavy atoms.
The most important factor in this technique is that native and derivatized crystals should be
isomorphouswhich means that they should belong to the same space group and have the same
cell parameters. The difference of the intensity signal between native and derivatized crystals
enables to determine heavy atoms position. Their position is then used to calculate their structure
factors and phases and later extend it to the protein.
2.2.3.2.3.2.3 Single or Multiple Wavelength Anomalous Dispersion
The method consists on recording data from the same crystal at different wavelengths close to
the normal anomalous wavelength. This enables to determine atoms that are responsible of the
anomalous signal and to position them. Their position as for the MIR will be used to calculate their
phase and extend it to the protein.
The advantage of the technique is that it can be achieved using one single crystal therefore,

Experimental Methods
91
overcome potential problems of non-isomorphism.
2.2.3.2.4 From the electron density map to the structural model
Once calculated, the electron density map can be ameliorated by flattening solvent which aim at
reducing the noise and increasing the protein signal this step is called density modification.
Once ameliorated, the atomic model can be build inside the map. The final model is obtained after
cycles of building and refining and is described by a set of calculated structure factor 𝐹𝑐𝑎𝑙𝑐 of
each atom and an experimental observation for each structure factor amplitudes 𝐹𝑜𝑏𝑠.
Refining steps consist on modifying the model so to get the highest accuracy with the
experimental data. Structural parameters of the model such as the model coordinates, B-factors,
bulk solvent correction will be refined against experimental data to obtain the best fit between
the observed structure factor amplitude 𝐹𝑜𝑏𝑠 and the computed model structure factor
amplitude 𝐹𝑐𝑎𝑙𝑐 .
The quality of the overall fit between the final model and the diffraction data can be translated
by two main parameters which are the R factor and the RFreefactor. Both factors are calculatedfrom
the same equation which is
𝑅 = 𝑅𝑓𝑟𝑒𝑒 = (∑⎸𝐹𝑜𝑏𝑠 − 𝐹𝑐𝑎𝑙𝑐⎸)/(∑ ⎸𝐹𝑜𝑏𝑠⎸)ℎ𝑘𝑙
ℎ𝑘𝑙
Where F is the structure factor.
The difference between both factors is that 𝑅 is calculated for all reflections whereas 𝑅𝑓𝑟𝑒𝑒 is
calculated with 5% of non-refined reflections.
In other say, R factors will translate in percentage the agreement between the observed phase
from the experiment and the calculated phase by the model. The lower the R factor, the more
accurate the model is.

Experimental Methods
92
2.2.3.2.5 SelenoN X-ray diffraction data processing and phasing and structural model
Data were collected using MxCuBE program (Gabadinho et al. 2010) at different beamlines of
the ESRF Synchontron (Table 11). After testing for the X-ray diffraction quality by a
characterization step, the data processing quality was automatically generated by the program
EDNA (Incardona et al. 2009). Collected data were processed using Mosflm (Leslie and Powell
2007). Later, POINTLESS (Phil Evans 2014) and SCALA (Philip Evans 2006) program were used to
identify the space group and to scale data respectively. Molecular replacement was made using
MOLREP (Vagin and Teplyakov 2010) and also PHASER MR (McCoy 2007) from Phenix (Adams et
al. 2010). Experimental phasing was made using in the pipeline CRANK 2 (Ness et al. 2004) or
the SHELX (Sheldrick 2008; Schneider and Sheldrick 2002) program containing SHELX C, D and E
to determine the number of marker atoms, determine and refine their positions respectively.
Protein model was built with BUCCANEER (Cowtan 2006). Refinement was made using COOT
(Emsley and Cowtan 2004) and REFMAC5 (Murshudov et al. 2011) programs.

Discussion
93
3 Results

Discussion
94
3.1 Bioinformatic analysis of bacterial and zebrafish SelenoN amino acid sequences
To determine the degree of identity and similarity between the human, zebrafish and bacterial
SelenoNs, amino acid sequences of the proteins were aligned using the BLASTP program (Altschul
et al. 1997). The alignment showed 67 % identity between the human and zebrafish proteins,
covering 96% of both sequences. The bacterial and zebrafish protein sequences (appendix 1)
displayed 37% identity but in this case, the alignment was limited to one common region
containing Sec residue and encompassing position 382-507 of the zebrafish and 229-355 of the
bacterial SelenoN. The N-terminal domain of the human and zebrafish SelenoN was not found or
conserved in the bacterial SelenoN however, there is an additional C-terminal domain in the
bacterial SelenoN corresponding to a thioredoxin fold which is not found in zebrafish and human
SelenoN (Figure 31).
To identify proteins with similar structures or domains, amino acid sequences of both bacterial
and zebrafish proteins where analyzed with the online program SWISSMODEL (Biasini et al. 2014;
Bordoli et al. 2009; Arnold et al. 2006; Guex, Peitsch, and Schwede 2009). Identified structural
information can be later used as template to solve the structure by molecular replacement.
First, the bacterial sequence was provided as an input to search for similar domains. When using
the full-length sequence, only the thioredoxin fold corresponding to the C-terminus was
encovered by the search. This domain corresponds to 26% of the sequence and the closest
structure identified was the thiol disulfide interchange protein from Bacteroides sp (PDB
accession number 2LRN) which displayed 32.62% identity with the bacterial SelenoN C-terminal
domain from position 409 to 558. Next, the sequence corresponding to that domain was omitted
and the remaining SelenoN sequence was submitted to search for homologues. This time, four
additional close structures were found (Figure 32B) corresponding respectively to the C-terminal
domain of a protein of unknown function from Archeoglobus fulgidus (PDB accession number
3DT5) covering the position 33 to 85, G coupled receptor kinase 1 from Bos taurus (PDB accession

Discussion
95
number 3C5O) position 137 to 182 and the UAS domain of the human UBX domain containing
protein 7 (PDB accession number 2DLX) covering position 229 to 355.
The zebrafish sequence was analyzed using the same workflow. First the full sequence was
investigated to search for similar structures. In this case, two main domains were covered
respectively, the EF-Hand domain and a C-terminal domain from position 381 to 507
corresponding to the sequence aligned with the bacterial SelenoN which has 15% identity with
the UAS domain of the human UBX domain containing protein 7 (PDB accession number 2DLX).
UAS domain which is found in both the bacterial and zebrafish sequences is a thioredoxin fold of
unknown function. In UBX domain containing protein 8, this domain was found to bind fatty acid
leading protein oligomerization. Then, the two zebrafish domain sequences were removed, and
the remaining sequence was resubmitted. This time, additional close structures were disclosed
and without surprise are different from the bacterial hits (Figure 32A).
Only one common domain could be identified between bacterial and zebrafish SelenoNs. That
domain aligned with a thioredoxin fold of unknown structure and contains the putative catalytic
site SCUG with the only Sec residue. The diferent domains notably the EF-hand and
transmembrane domain for the zebrafish and the additional C-terminal thioredoxin-fold for the
bacterial suggest an evolution of function probably resulting from an adaptation process to the
organism.

Discussion
96
Figure 31 : Schematic representation of the alignment between zebrafish, human and
bacterial SelenoN proteins.
Amino acid sequences of all three proteins where aligned using the BLASTP program. In blue is the common
sequence to all three organisms, in green is the additional C-terminal thioredoxin fold found only in bacterial
SelenoN sequence; in orange is the C-terminal sequence found only in zebrafish and in humal SelenoNs and in red
is the C-terminal bacterial sequence. Percentages represent the degree of identity between sequences.
Figure 32 Schematic representation of bioinformatics analysis of zebrafish and bacterial
SelenoN amino acid sequences with the program SWISSMODEL online
Numbers represent positions of amino acid that where covered by the alignment. In grey are PDB
identifications of template structures and the identity percentage with SelenoN.

Discussion
97
3.2 Results on zebrafish selenoN
3.2.1 Overexpression, purification and biophysical characterization of zebrafish
SelenoN
3.2.1.1 Overexpression of the zebrafish SelenoN in mammalian cells HEK293
To produce large amount of zebrafish SelenoN or zSelenoN, an inducible stable cell line expressing
the protein was engineered. To improve its expression in human cultured cells, the zebrafish
SelenoN sequence was optimized for translation efficiency and the residue Sec was mutated into
Cys. For purification purpose by affinity, the sequence of a His8 tag was added at the C-terminus
of zSelenoN sequence. The optimized sequence was cloned into pcDNA5 vector where the protein
expression is under control of the human cytomegalovirus promoter (CMV) and inducible by
addition of tetracycline or its stable analogue doxycycline. This construct was transfected into the
Flp-IN HEK 293TrexTM cell line that allows the directed insertion of the expression vector at one
genome position using the FLP recombinase. Stable recombinant clones were successfully
selected and isolated (made by Melanie Thamy-Braye in Strasbourg).
The recombinant HEK 293Trex cells expressing zSelenoN were grown in DMEM medium containing
10% fetal bovine serum, either as suspension or adherent cultures. Biomass was increased as
described in the previous chapter before induction of zSelenoN expression by addition of
doxycycline to the growth medium. In suspension, it was observed that cells tend to form large
aggregates although variable in size (Figure 33B). This aggregation resulted of a high cell density in
the culture. It was hypothesized that this aggregation could limit the expression level of zSelenoN
because cells within the aggregates have less access to oxygen therefore a reduced metabolism
and secondly, limited accessibility to the inducer compared to cells on the surface.
To alleviate this problem, cell adaptation to synthetic medium designed for suspension culture,
such as the CD293 medium without Fetal Bovine Serum was tested. However, cell viability
dropped drastically when DMEM medium concentration was below 50%. Finally, cells did not
survive the adaptation and died at a medium composition 75% CD293 and 25% DMEM.

Discussion
98
Since the adaptation to synthetic medium for suspension culture was not possible, the expression
protocol was optimized for adherent culture. No difference in expression level and in biomass
quantities was observed between suspension and adherent culture (data not shown). This
expression method presented the advantages of using fewer amount of medium and requires
limited manipulations, therefore avoiding risks of contamination.
Figure 33 : Mammalian HEK 293T cells in adherent and in suspension cultures.
A: HEK cells in adherent culture at 80% confluence grown in DMEM medium and Fetal Bovine Serum.
B: HEK cells aggregates in suspension culture at a density of 106 cells/mL. Magnification is different in
the two views.

Discussion
99
3.2.1.2 Detergent and additives screening
Three grams of induced cells expressing zSelenoN where used for this purification test. Cells were
resuspended in a hypotonic lysis buffer, and lysed by six cycles of freeze and thaw. Membrane
fraction was resuspended and divided into 3 equal fractions. Different detergents were added in
these fractions at final concentrations: 0.25% Dodecyl-β-Maltoside (DDM), 2% Decyl-β-Maltoside
(DM), 6% CHAPS. After incubation, the solubilized membrane fraction was purified by affinity
chromatography using a loaded Ni-IDA matrix in batch. Flow through were collected and matrix
washed in buffer containing 80mM Imidazole. The bound protein was eluted with 400 mM
Imidazole.
Analysis of the eluted fraction by SDS-PAGE showed that elution fractions of the DM are more
concentrated and more homogenous than the others (Figure 34). This might be attributed to two
interpretations: first the DM better solubilized the zSelenoN, secondly the binding of the protein
to the matrix is more efficient in the presence of DM compared to the other detergents, possibly
because of a better accessibility of the tag.
To test the stability of the protein in the different detergents combined with different additives,
eluted fractions of each detergent experiment were concentrated. Afterwards, the fractions were
divided into four fractions then, EDTA+EGTA were added at final concentration of 2 mM, in one
hand and on the other hand MgCl2 or CaCl2 were added at final concentration of 10 mM. In
addition, DM fraction was incubated with Octyl-glucoside (OG) at final concentration of 2.5%
before being divided into four fractions that were prepared also as described before. After
incubation for 4h at 4°C, purified protein status was analyzed on a Clear Native PAGE gel (Wittig
and Schägger 2005, 2008).
Comparing the “control” lanes with detergents without additives, it appears that DM tends to
better stabilize the protein than the other (Figure 35). Indeed, in the presence of the DDM, the
purified zSelenoN migrated as a smear on the top of the gel and a band of lower molecular weight
(MW), whereas in the presence of DM, it migrated as two discrete bands and less smear. The

Discussion
100
CHAPS condition seems to have same effect as the DDM. DM appears to be the best condition in
this case. The addition of 10mM MgCl2 seems to have no significant effect on the migration. In
contrary, in the presence of 10 mM CaCl2, the lower MW decreased in intensity and is converted
into the higher MW bands. Again, in the presence of DDM, CHAPS or OG, the band appeared as a
smear whereas with DM, it corresponded to more resolved band. In the presence of EDTA and
EGTA, DDM was no significantly different compared to the “control”, whereas in DM and CHAPS
conditions, the lower MW band appeared to be predominant and well resolved. Altogether,
combination of DM and 2mM EDTA+EGTA seemed to be the most suitable for the protein
homogeneity and stability (Figure 35)

Discussion
101
Figure 34: zSelenoN solubilization and purification using different detergents.
2% Decyl-β- Maltoside (DM), 0.25% Dodedyl-β-maltoside (DDM), 6% CHAPS.
Affinity purification visualization using an 8% SDS PAGE gel which was Coomassie stained. LF: Loaded
Fraction, FT: Flow Through, W: washes with 80 mM Imidazole, E: Elution fraction.
Figure 35 :Detergent/ additives screening
Results were visualized on an 8% Clear Native PAGE gel which was coomassie stained.

Discussion
102
3.2.1.3 Optimization of the purification protocol
Induced HEK 293 cells expressing zSelenoN were collected and lysed. Membrane fraction was
sedimented by centrifugation and the membrane proteins were solubilized with 0.5% Decyl-β-
maltoside as described.
Then the zebrafish recombinant SelenoN was purified from the solubilized membrane fraction in
two steps: a Ni-NTA affinity using DM containing buffers followed by a size exclusion
chromatography using DDM containing buffers. The first step of the purification enabled to
remove most contaminants from the protein extract. The binding of the protein on the Ni affinity
column was efficient as the band corresponding to zSelenoN is absent in the flow-through (Figure
36B). The recombinant protein was with an imidazole gradient. Two peaks were obtained. Analysis
on a SDS-PAGE gel of the fractions showed that zSelenoN was mainly eluted in the second peak
and was purified close to homogeneity (Figure 36A and 36B). Fractions of the second peak were
pooled, concentrated, and then loaded on a Superdex 200 10/300 for a polishing step by size
exclusion chromatography. As shown on Figure 36C and 36D, the loaded fraction was eluted in 2
peaks, both corresponding to the recombinant zSelenoN. The first and enlarged peak came out
directly after the void volume (8 mL for the column used), the second sharp and monodisperse
peak came out at a volume that theoretically corresponded for this column to a molecule of about
150 kDa. It is important to keep in mind that the eluted particle corresponded to a protein-
detergent complex. ZSelenoN elution in two peaks could be explained by the purification of two
different conformations or two different oligomers. One could also hypothesize the eventual
presence of a binding partner in one of the two peaks. However, similar amount of protein was
recovered in both peaks which, were further analyzed individually.
In conclusion, 3 mg of pure recombinant zSelenoN protein equally distributed in two size exclusion
peaks as shown in (Figure 36D) were obtained from 3 g cultured cells in a two-steps purification
procedure.

Discussion
103
Figure 36 :Chromatography purification of zebrafish SelenoN
The recombinant zebrafish SelenoN was solubilized from the cell membrane fraction, and then purified by Ni-NTA affinity
followed by a size exclusion chromatography. As required for membrane proteins, detergent was maintained in the buffer
during the whole process. The solubilization and the affinity were performed using DM as in size exclusion DDM was used as
detergent.
The SDS-PAGE gel (B) and chromatogram (A) show the elution profile over an imidazole gradient through a 1mL Ni-NTA
column. The protein came out in the second peak that eluted at approximately 140 mM Imidazole.
The SDS-PAGE gel (D) and chromatogram (C) show the elution profile through a superdex 200 10/300. The peak 1 elute after
but close to the void volume and displayed a flat shape, the sharp peak 2 elute between 14 and 15 mL elution volume. Both
peaks contained equal amount of the recombinant pure zSelenoN as seen on the SDS-PAGE gel

Discussion
104
3.2.1.4 Effect of bivalent ion
Since the eukaryotic SelenoN contains a conserved calcium binding Ef-hand domain, effect of
bivalent ions on zSelenoN conformation was tested by native gel analysis. Second peak recovered
from the size exclusion chromatography was first dialyzed to remove EDTA and EGTA.
Fractions were prepared by addition of EGTA and increasing amount of CaCl2 or MgCl2, as well as
a combination of both CaCl2 and MgCl2. Samples were then incubated for 4h at 4°C, and
fractionated on an 8% clear Native PAGE gel. The separation of proteins of different entities was
visualized by a western blot using an antibody directed against zSelenoN (Figure 37A).
Two forms were detected. In the control fraction without any additives, the two entities were
present, and the faster migrating band was predominant. With increasing concentrations of
magnesium, the lower form was increasing in intensity and above 0.5 mM MgCl2, the higher band
was disappearing. In contrary, the lower form was converted to the higher one with increasing
Ca2+ concentrations. Moreover, third higher-migrating band was appearing with increasing Ca2+
concentrations (Figure 37A). This suggests a conformational rearrangement effect of bivalent ions
notably, in presence of Ca2+ zSelenoN tends to form higher oligomer and in the presence of Mg2+,
the reverse effect is observed.
To estimate the apparent molecular weight of the previously visualized entities, the purified
protein fractions incubated with the different additives were analyzed on a Coomassie stained
Blue Native PAGE (Wittig, Braun, and Schägger 2006; Wittig and Schägger 2008). The migration
profile appeared like the one obtained with the Clear Native PAGE although the two higher bands
were less defined. The lower band migrated at an apparent mass of about 140 kDa if the particle
is globular, and the second form migrated at a position around 250 kDa (Figure 37B).
Binding parameters of the Ca2+ with zebrafish protein was investigated using the Microscale
Thermophoresis. EGTA was used as negative control to compare the dose-response signal
amplitude in both conditions. Several ranges of Ca2+ concentration (nanomolar, micromolar and
millimolar ranges) were covered in the experiment but unfortunately, no interpretable result

Discussion
105
could be obtained (result not shown). However, all attempts to add Ca2+ in a concentrated zSelenoN
sample resulted in an irreversible precipitation of the protein therefore, all following
characterization of zebrafish SelenoN were made in presence of EGTA.
Figure 37: Effect of bivalent ions on zSelenoN oligomeric status.
The second peak of the size exclusion chromatography was dialyzed to remove EDTA and EGTA, before being used for these
experiments.
Gel A: after incubation at 4°C with either 1 mM EGTA, MgCl2 or CaCl2 at final concentrations of 0.25, 0.5, 0.75, 1mM or 0.5mM
CaCl2 + 0.5 mM MgCl2., zSelenoN samples were fractionated on an 8% clear native PAGE gel then analyzed by a western blot
using an anti-zSelenoN antibody.
Gel B: after incubation at 4°C with 0.5 mM EDTA+EGTA, 1mM and 10mM of CaCl2 or MgCl2, 1mM MgCl2+CaCl2., zSelenoN
samples were fractionated on a 3-12% Blue native PAGE gel and revealed by coomassie stain.

Discussion
106
3.2.1.5 Biophysical parameters from the SAXS measurement
In order to calculate structural parameters as well as to obtain a low-resolution model of
zSelenoN, SAXS coupled to a preceding High-Pressure Liquid Chromatography (HPLC-SAXS) was
performed.
Seventy µL of pure recombinant zSelenoN concentrated at 10 mg/mL from the purification peak
2 or 4.5 mg/mL from the purification peak 1 (Figure 36C and 36D) were used for HPLC-SAXS.
Samples were loaded separately on a Superdex 200 10/300 GL coupled in line with SAXS. The
elution of the protein was monitored by UV and SAXS detectors at the beamline BM29 of the
European Synchrotron Facility (ESRF) in Grenoble.
The purification peak 1 yielded a profile with 3 peaks recorded by the UV detector at 280nm and
4 peaks (appendix 2B) recorded by SAXS detectors corresponding to different molecule sizes. The
purification peak 2 on the other hand displayed one main peak recorded by the UV at 280nm and
two peaks recorded from SAXS detectors and corresponding to two main populations of molecules
with different sizes (see appendix 2 A and 2C). For the subsequent analysis, only data from the
purification peak 2 were processed.
The Rg and I(0) traces (Figure 38A) as a function of frame number showed that the sample was
highly pure as expected from the purification profile. The profile exhibited two peaks. The first
was identified as a protein-detergent complex according to its UV absorption at 280 nm (see
appendix 3) and the second peak corresponded to detergent micelles as no UV absorption was
detected at the wavelength 280 nm (Slotboom et al. 2008). Buffer frames where subtracted from
frames 1960 to 2000 (see highlighted frames on Figure 38A) that corresponded to the highest I(0)
with a similar Rg. After buffer subtraction, intensities of the frames were averaged for subsequent
analysis.
Averaged data were first analyzed with the program SHANUM (Konarev and Svergun 2015; D
Franke et al. 2017) to determine the s range with the minimum signal to noise ratio. Following this
first analysis, data were cut to smax=4nm-1.

Discussion
107
The LogI(s) versus s plot (Figure 38B) represents the primary averaged SAS data of the selected
frames, with Guinier plot (Konarev P.V., et al 2003) shown as inset. The Guinier plot was linear to
the first measured s values (with a R2 = 0.9974) which indicates the absence of aggregation.
Analysis provided a radius of gyration (Petoukhov et al. 2007) of about 4.18 ± 0.03 nm .
The Kratky plot (Figure 38C) display a bell-shaped curve as expected for a predominantly folded
particle.
The distance distribution analysis (D I Svergun 1993) (Figure 38C) gave the values of the maximal
particle size: Dmax was 14.80 nm and the Porod volume described as the scattering particle volume
(Porod, 1951) is 334.53 nm3. The P(r) versus r was well defined as it displayed a smooth and
concave approach to zero at r=0 and r= Dmax. The calculated Rg in the real space was similar to the
Guinier analysis.
Molecular weight (MW) was evaluated using different approaches. The calculation according to
the Porod volume (Vp) provided a value of 209 kDa assuming a ratio Vp to MW of 1.6 (Whitten et
al, 2017). MW estimation according to the MoW indicated a mass of 156.8 kDa (Table 21).

Discussion
108
Figure 38 Curves and Structural parameters derived from HPLC-SAXS performed on zebrafish
SelenoN.
(A) Plot showing I(0) as a function of frame. Frames are proportional to the time and therefore to the elution
volume for the SEC-SAXS run. One frame was recorded per second with a flow of 0.5mL/min. Therefore, it
represents 120 frames per mL of elution Volume. Highlighted data frames were selected for averaging to obtain
the ln(I) versus s. (B) Ln I(s) versus s plot with the inset showing Guinier plot. (C) Kratky plot from the data in (B)
represented for s< 3nm-1. (D) P(r) versus r profile from the data in (B).

Discussion
109
Table 21 Structural parameters calculated from the HPLC-SAXS of the purification peak 2 of
the zebrafish SelenoN
Guinier Analysis
I(0) (nm-1
) 17.77 ±0.05
Rg (nm) 4.18 ±0.03
sRg range 0.68 – 1.3
Correlation coefficient R2 0.997
P(r) analysis
I(0) (nm-1
) 17.8±0.3
Rg(nm) 4.29±013
Dmax(nm) 14.80
s range (nm-1
) 0.17-4.23
Χ2
(total estimate from GNOM) 0.969 (0.868)
Porod Volume (nm-3
) 334.5
Molecular Weight estimation (kDa)
Theoretical MW of the monomer 72
MW by DATMOW 156.8
MW calculated from porod volume (ratio Vp to MW) 209 (1.6)

Discussion
110
3.2.1.6 Ab initio modelling of zSelenoN
Ab initio modeling conducted using two different approaches was made. DAMMIF (Daniel Franke
and Svergun 2009) was run twenty times with parameters assuming that the molecule is a dimer
of zSelenoN. Models generated were grouped into 4 main clusters (appendix 3) with a χ2 between
1.054 and 1.111. Distance between the different generated models is named Normalized Spatial
Discrepancy (NSD). It translates the degree of similarity between generated models and therefore
the stability or confidence of the average model. Similar model will typically have a NSD less or
close to 1. The DAMMIF NSD value was 1.976, indicative of a high distance between all the twenty
models. The fourth cluster included most of the models obtained and is presented in Figure 39.
Modelling in space based on diffusion curves did not lead to a unique solution. Therefore, the
DAMMIN program (Dmitri I Svergun 1999) was run twenty times independently. Models thus
obtained were grouped into clusters and compared using the DAMAVER program (Volkov and
Svergun 2003) to evaluate the distance between the different solutions. In our case, the NSD
varied between 0.494 to 0.663 which indicates a good correlation and a good stability of the
average solution.
The average and refined solution was then used as input for one last DAMMIN run. The
experimental diffusion curve was then compared to the theoretical DAMMIN model and the fit
between both is estimated by the factor χ2 (D I Svergun 1993). In our case, the χ2 value was 21.65
which is very high and unexpected (Table 22).

Discussion
111
Figure 39 : Ab initio modelling of zSelenoN
Bead models where generated with DAMMIN and with DAMMIF programs. Picture of the models where made by PYMOL
DAMMIF cluster 4 DAMMIN
15
.78
nm
14
.28
nm

Discussion
112
Table 22: Shape calculation and model-fitting result of zSelenoN
DAMMIF
q range for fitting (Å-1) 0.02 - 0.2
NSD (standard deviation), No of cluster 1.976 (0.248), 4
Χ2 range 1.054 – 1.111
MW of the model (kDa) 188
Resolution (Å) from SASRES 69 ± 3
DAMMIN
Χ2 21.65
volume of the model (nm-3) 286.43
Resolution (Å) from SASRES 37± 3

Discussion
113
3.2.1.7 Secondary structure studies
The percentage of the different secondary structure elements was evaluated using the Circular
Dichroism (CD) spectroscopy (Whitmore and Wallace 2008). For this purpose, 200 µL of protein
solution at 0.1-0.3 mg/mL concentration was used in a 1 mm cuvette. Prior to measurements
buffer was exchanged to 3 mM Tris-HCl, 15 mM NaCl 0.5 mM, 2mM EDTA, 2 mM EGTA, 0.05%
DDM.
After collecting the raw signal, the buffer signal was subtracted and the data were processed on-
line using the DICROWEB server (Lobley, Whitmore, and Wallace 2002; Whitmore and Wallace
2004, 2008). The signal above 190 nm was too noisy (Figure 40). Therefore, Protein data sets
smp180 (Abdul-Gader, Miles, and Wallace 2011) and SP175 (Lees et al. 2006) specific for
membrane proteins were used for calculation using the algorithms SELCON3 (Sreerama and
Woody 1993; Sreerama, Venyaminov, and Woody 1999), CONTIN LL (Provencher and Gloeckner
1981; Van Stokkum et al. 1990) and CDSSTR (Compton and Johnson 1986; Manavalan and Johnson
1987; Sreerama, Venyaminov, and Woody 2000). Results of the calculation obtained were
averaged for each secondary structure element.
In parallel, a bioinformatic prediction tool: PHYRE2 (Kelley et al. 2015) based on the amino acid
sequence of the protein was run to calculate the theoretical value of the secondary structure
elements and compare to the experimental data.
By comparing theoretical CD spectra of folded Vs unfolded protein (Figure 26), one could see that
zSelenoN CD spectra profile corresponded to a well folded protein (Figure 40). However, the
experimental values obtained were very different from the theoretical one. CD spectra analysis
indicated that the protein is α-helical rich with about 56% of the overall protein and contains only
12% β-sheet. The PHYRE2 program predicted a lower α-helical content and corresponding higher
β-sheet content.
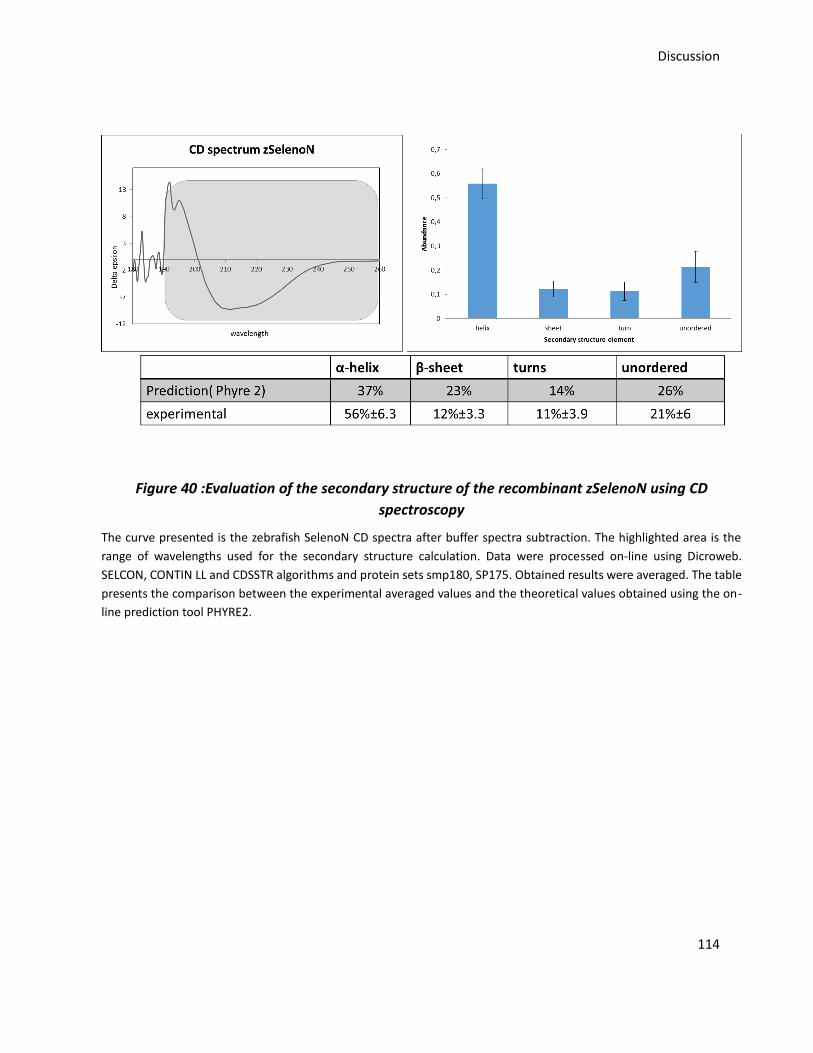
Discussion
114
Figure 40 :Evaluation of the secondary structure of the recombinant zSelenoN using CD
spectroscopy
The curve presented is the zebrafish SelenoN CD spectra after buffer spectra subtraction. The highlighted area is the
range of wavelengths used for the secondary structure calculation. Data were processed on-line using Dicroweb.
SELCON, CONTIN LL and CDSSTR algorithms and protein sets smp180, SP175. Obtained results were averaged. The table
presents the comparison between the experimental averaged values and the theoretical values obtained using the on-
line prediction tool PHYRE2.

Discussion
115
3.2.2 Crystallization of zebrafish SelenoN and optimization
The purified zSelenoN protein was concentrated to 10-12 mg/mL and glycerol was removed by
buffer exchange using amicon concentrators prior to crystallization trials. Both peaks (Figure 36D)
were crystallized separately. Phenix robot was used to generate nanodrops in 96 well plates as
described by Müller and Lancaster in 2013. Different commercial screens designed for membrane
proteins were initially tested. No crystals were observed under those conditions.
Eukaryotic SelenoN is a glycosylated transmembrane protein of the endoplasmic reticulum and
sugar moiety of glycosylated proteins can behave as floppy extremities that prevent nucleation
and crystallization (Mesters and Hilgenfeld 2007). To tackle this problem, zSelenoN was assayed
for native deglycosylation using different endoglycosidases notably endo F1, F2 of the NDegly kit
(SigmaTM). The main asset of the tested endoglycosidases is that they present a small size and
therefore they can easily access inside a folded protein to cut glycoside residues. Among the
enzymes tested, Endo F1 was the only one to remove sugar residues from zSelenoN in native
conditions. Comparing EndoF1 deglycosylation on the native with PNGase on the denaturated
zSelenoN confirmed that Endo F1 removed all glycoside groups of zSelenoN (Figure 41A and 40B).
Assays were made to determine the efficiency of native deglycosylation at room temperature to
limit the protein stress. Results showed that an overnight incubation at room temperature with
the enzyme is enough to deglycosylate the protein (see endo F1 Vs PNGase F on Figure 41).
Native deglycosylation was carried out on a dilute sample (1-2 mg/ml) at room temperature
overnight. Then, the protein sample was subjected to centrifugation using a 50 kDa cut off amicon
concentrator to wash out the endo F1 glucosidase (32 kDa) and the glycerol prior to concentration
and crystallization screen. First hits were obtained. Spherulites were observed after a few weeks
of incubation at 18°C in a condition containing 0.1% Na cacodylate pH 6.5 and 30% PEG 2000.
Then, different additives (CaCl2, MgCl2, and ZnCl) were added to the screens. Different conditions
containing CaCl2 and MgCl2 gave rise to spherulites (Figure 42) that were transferred to
cryoprotectant solution composed of the crystallization condition supplemented with glycerol and

Discussion
116
then flash-frozen in liquid nitrogen. X-ray experiments using these spherulites exhibited low
resolution diffraction at 15 Å.
Those spherulites were used as seed material using same reservoir solutions. Small crystals with
a size between 20 and 25µm (Figure 43) grew in conditions containing 0.1 M MES or MOPS pH 6.5,
0.2 M CaCl2, 6.5% PEG 2000 at 18°C. Unfortunately, X-ray experiments showed no diffraction from
these obtained crystals.
Figure 41 :zSelenoN deglycosylation essays
Gel A: Visualization of the native deglycosylation of zSelenoN using differents endoglycosydases: F1, F2 and F1+F2. C=
control, Peak1=size exclusion peak1, Peak2= size exclusion peak 2.
Gel B: Optimization of native deglycosylation condition. Endo F1 was tested either overnight or for 24 hours. The
efficiency of the deglycosylation is evaluated by comparison with the denaturing deglycosylation using PNGaseF.

Discussion
117
Figure 42: Optimization of zSelenoN crystallization trial.
Pictures 1, 2 and 3 are crystallization drops of zSelenoN Peak 2 in the condition 0.1M Na cacodylate pH 6.5, 30% PEG
2000. 1=glycosylated zSelenoN, 2= deglycosylated zSelenoN, 3= deglycosylated zSelenoN + additives
Figure 43 : zebrafish SelenoN crystals obtained after seeding
Crystals were obtained using deglycosylated protein and seeding material. The crystals grew in conditions 0.1M MES or
MOPS pH 6.5, 6.5% PEG2000 and 0.2M CaCl2.

Discussion
118
3.3 Results on Candidatus poribacteriae SelenoN
3.3.1 Overexpression, purification and biophysical characterization of bacterial
SelenoN
3.3.1.1 Overexpression and purification
The Candidatus poribacteria SelenoN sequence optimized for expression in E. coli was cloned into
the pQE70 vector to generate a C-terminal fusion with a His8 tag expressed under the control of
the bacterial T5 promoter. This construct was transformed into E coli XL1-Blue-pGRO7 (Camr) that
co-expressed the chaperons GroES and GroEL to improve SelenoN solubility. The expression was
performed in LB medium containing first arabinose to induce the expression of chaperones, then
IPTG was added to induce SelenoN expression.
Recombinant bacterial SelenoN (bSelenoN) was purified from the soluble extract in two
chromatography steps beginning with Ni-NTA affinity, followed by a size exclusion
chromatography. The first step of the purification resulted in the removal of most contaminants
from the protein extract (appendix 4A). bSelenoN was eluted from the resin with 750 μM
imidazole. After concentration, the eluate was then loaded on a Superdex 200 16/60 column for
a polishing step by size exclusion chromatography. As show on Figure 44A, the loaded fraction
was eluted in two peaks, both corresponding to the recombinant bSelenoN. The first peak came
out directly with the void volume (40 mL for the column used) and is likely to correspond to large
complexes or to aggregatesof bSelenoN. The second peak is monodisperse and eluted at an
elution volume between 70 and 80 mL. Eluted fractions corresponding to the two peaks were
analyzed by SDS-PAGE, the majority of bSelenoN is retained within peak 2, suggesting that the
protein preparation was homogenous.
Overall, 6 mg of pure recombinant bSelenoN protein (Figure 44) were obtained from 11 g cells
cultured in 6 L LB medium, in a two-step purification procedure.
In order to confirm the monodispersity and also appreciate the apparent molecular weight of the
recombinant bacterial SelenoN, a blue Native PAGE analysis was carried out. The protein eluted

Discussion
119
in the second peak (Figure 44A), was monodisperse and monomodal as only one single band was
detected. Surprisingly, this band migrated at a position between 66 and 146 KDa (Figure 44C) as
the calculated mass is 64 kDa.
Figure 44 :Purification of the Candidatus poribacteriae SelenoN
The bacterial recombinant SelenoN was purified by affinity followed by a size exclusion chromatography. (A) The
chromatogram showed the elution profile through a superdex 200 16/60. (B) The peak 2 eluted between 70 and
80 mL and contained bSelenoN as a pure sample as seen on the SDS PAGE gel. (C) The Native Blue PAGE showed
that the protein fraction is monomodal as only one band or one oligomer was detected on the gel

Discussion
120
3.3.1.2 Biophysical parameters from the Size exclusion chromatography coupled with Small Angle
Light Scattering measurement
In order to calculate structural parameters as well as a low-resolution model, SAXS coupled to a
preceding HPLC (HPLC-SAXS) was conducted.
Seventy µL of highly pure recombinant bSelenoN concentrated to 15 mg/mL was loaded on a
Superdex 200 10/300 GL coupled in line with SAXS. The elution of the protein was monitored by
UV and SAXS detectors. Frames corresponding to the single peak (see appendix 5) were scaled
and averaged. Data were analyzed with the program ATSAS 2.8.0 from the EMBL Hamburg. The
resulting averaged scattering curve (see below) was then used for further analysis.
The Rg and I(0) traces (Figure 45A) as a function of frame number showed that the sample was
highly pure as expected from the purification profile. The protein eluted as one single peak with
a linear Rg profile. Buffer frames where subtracted from frames 1814 to 1824 that corresponded
to the highest I(0) and similar Rg. After buffer subtraction, intensities of the frames where
averaged for subsequent analysis.
Data where first analyzed with the program SHANUM to determine the s range minimizing signal
to noise ratio. Following this first analysis, data where cut to smax of 4nm-1.
The LogI(s) versus s plot (Figure 45B) represents the primary averaged SAS data of the selected
frames, with Guinier plot shown as inset. The Guinier plot was linear to the first measured s values
(with a R2 = 0.998) which suggested the absence of aggregation. Analysis provided a radius of
gyration of about 3.66±0.14 nm.
The Kratky plot (Figure 45C) displayed a bell-shaped curve as expected for a predominantly folded
particle.
The distance distribution (Figure 45D) analysis gave the values of the maximal particle size Dmax
which is 12.82 nm and the Porod volume 113.5 nm3.The P(r) versus r was well defined as it showed
a smooth and concave approach to zero at r = 0 and r = Dmax. The calculated Rg in the real space

Discussion
121
was higher than the one using the Guinier approach.
Molecular weight was evaluated using different approaches. The calculation according to the
Porod volume (Vp) gave a value of 72 kDa assuming a ratio Vp to MW of 1.5. MW estimation
according to the MoW and the Volume of correlation gave respectively 83 and 73 kDa (Table 23.
Figure 45 Curves and Structural parameters derived from HPLC-SAXS analysis of the bacterial
SelenoN.
(A)Plot of I(0) as a function of frame number. Frames are proportional to the time and therefore to the elution volume of
SEC-SAXS run. One frame was recorded per second with a flow of 0.5mL/min. This represented 120 frames per mL of
elution Volume. Data frames between 1814 and 1824 were selected for averaging to obtain the ln(I) versus s.(B) Ln I(s)
versus s plot with the inset showing Guinier plot. (C) Kratky plot from the data in (B) represented for s < 2.5 nm-1. (D) P(r)
versus r profile from the data in (B).

Discussion
122
Table 23: Structural parameters calculated from the SAXS data analysis of the bacterial
SelenoN.
Guinier Analysis
I(0) (nm-1
) 56.94 ±0.11
Rg (Å) 3.66 ±0.14
sRg range 0.74 – 1.17
Correlation coefficient R2 0.998
P(r) analysis
I(0) (nm-1
) 57.77±0.16
Rg(nm) 3.94±0.019
Dmax(nm) 15.24
s range (nm-1
) 0.17-4
Χ2
(total estimate from GNOM) 0.997 (0.426)
Porod Volume (nm-3
) 113.8
Molecular Weight estimation (KDa)
Theoretical MW of the monomer 64
MW by DATMOW 83.2
MW by DATVC 73.2
MW calculated from porod volume (ratio Vp to MW) 72.4

Discussion
123
3.3.1.3 Ab initio modelling of bacterial SelenoN
The Ab initio modeling workflow was the same used for zSelenoN. DAMMIF was run twenty times
with parameters assuming that the molecule is a monomer. From this run, four main clusters
were obtained with a χ2 between 1.337 and 1.441. The NSD was close to 1 indicative of a high
degree of a similarity between models. All models were grouped into one single cluster (Figure
46).
DAMMIN program was also run twenty times independently. The NSD varied between 0.562 and
0.640, which again indicated a good correlation between the different generated models.
The average and refined solution was then used as input for a last DAMMIN run and the resulting
χ2 was 4.761 (Table 24), indicative of a poor agreement between the solution and the
experimental data.
Figure 46 Ab initio modelling of the bacterial SelenoN using two approaches
19
nm
15
.1n
m
DAMMIF DAMMIN

Discussion
124
Table 24: Shape calculation and model-fitting results of bacterial SelenoN
DAMMIF
q range for fitting (Å-1) 0.02 - 0.2
NSD (standard deviation), No of cluster 1.021 (0.105), 1
Χ2 range 1.337 – 1.411
MW of the model (kDa) 78.4
Resolution (Å) from SASRES 45 ± 3
DAMMIN
Χ2 4.761
volume of the model (nm-3) 139.8
Resolution (Å) from SASRES 35 ± 3

Discussion
125
3.3.1.4 Secondary structure studies
As carried out for the eukaryotic SelenoN, the percentage of the different secondary structure
element was evaluated by Circular Dichroism (CD) spectroscopy analysis. To achieve this goal, 200-
300 µL of protein solution was used at 0.1-0.3 mg/mL in 1 mm cuvette. Buffer was exchanged to
3mM Tris, 15mM NaCl and 0.5mM TCEP prior to measurements.
Data were processed like described above for the zebrafish SelenoN. The same algorithms were
run but protein reference sets 3, 4 and 7 (Sreerama and Woody 2000) were used.
The first observation was that, comparing to theoretical CD spectra of folded vs unfolded protein,
the profile of the bacterial SelenoN CD spectra corresponded to a well folded protein (Figure 47).
After processing, values obtained experimentally for the different structural features were not
significantly different from the theoretical one predicted by the PHYRE2 program. The protein
showed an enriched α-helical contain (40 - 45%) for only 20% β-sheet.

Discussion
126
Figure 47 :Evaluation of the secondary structure of the recombinant bacterial SelenoN using
CD spectroscopy
The curve represents the bacterial CD spectra obtained after subtracting the buffer spectra. The highlighted area
represents the range of wavelengths that was used for secondary structure calculation. Data where processed on-
line using Dicroweb. SELCON, CONTIN LL and CDSSTR algorithms were used with protein sets 3, 4 and 7. Results of
all calculations were averaged. The table presents the comparison between the experimental averaged values and
the theoretical values obtained using the on-line prediction PHYRE2 program.
Discussion
127
3.3.2 Crystallization of bacterial SelenoN and X-ray diffraction experiments
3.3.2.1 Crystallization of native SelenoN
The protein was concentrated to 10-12 mg/mL before the storage buffer was exchanged using
amicon concentrator to a buffer close to physiological conditions (30 mM Tris-HCl pH 7.5 and 150
mM NaCl) prior to crystallization screening.
Initial screens were performed with sitting drops using the vapor diffusion technique. Drops were
made by mixing protein solution and reservoir solution to a 1 to 1 ratio using the Phenix robot at
a nanoliter scale (100-200nL). Several commercial screens designed for 96 well plates were used,
and plates were incubated at 18°C. No crystal grew directly when using commercial screen
instead, crystalline precipitate was observed in some conditions. Volume of those conditions was
scaled-up to 2 µL drops in 24 well plates. Fragile crystals grew in one of the conditions containing
0.1M HEPES pH 6.5 and 20% PEG 6000. Next, a screen of different buffers and PEG6000
concentrations was made around that condition in a 24 well plate format.
Crystals grew under different conditions of the screen after incubation ranging from 5 days up to
several months. Crystallization conditions included 0.1M of different buffers: MES, Tris-HCl,
Sodium cacodylate, at pH 6.5 and PEG 6000 or 3350 with percentages of 20, 30, and 35 %. Crystals
obtained displayed a needle-like shape with sizes between 50 and 100 µm (Figure 48). Some
conditions were reproducible but gave tiny crystals of poor quality notably, the X-ray diffraction
pattern showed double lattice profile and poor resolution.
After collecting several datasets at different ESRF beamlines, data were processed using Mosflm
(Leslie et al, 2011). The processing failed at early stage for most of the dataset and indexing was
not possible. Those that were successfully processed resulted in different space groups but in
some case with poor resolution.

Discussion
128
Figure 48: Crystals of bacterial SelenoN were obtained in different conditions.
Crystals of SelenoN1 grew in different conditions. A = 0.1M MES pH 6.5, 30% PEG6000, B= 0.2M Ca acetate, 20%
PEG3350, C= 0.1M Na cacodylate, 20% PEG6000.
Table 25: Data statistics after autoprocessing by EDNA of different bSelenoN crystals

Discussion
129
The best diffracting crystal defined after data processing grew in the condition 0.2M Calcium
acetate and 20% PEG3350 but unfortunately, this condition was not reproducible. Crystals were
soaked in cryoprotectant solution composed of reservoir solution supplemented with 20%
glycerol before being flash-frozen in liquid nitrogen. X-ray experiments were made at the beam
line ID 23.1 of the ESRF in Grenoble. Data were collected until 1.9 Å resolution (Table 25).
Processing was made using Mosflm. Crystals of this condition belong to space group C2221 with
cell parameters a=b=95.686 Å c=85.240 Å, α=β=ɣ=90°.
Data were scaled using the program SCALA (Kabsch 1988) and cut at a resolution of 2.3 Å
according to the I/δ(I) and Rmerge recommended limits that must be respectively over 2 and under
50% for further use. The data statistics table below (Table 26) summarizes the crystal quality at
the end of the scaling process.
Table 26: Best crystal of bacterial SelenoN data statistics after processing with Mosflm
Space group C2221
Unit cell constants a=b=95.686Å c=85.240Å, α=β=ɣ=90°
Resolution 33 -2.3 Å (2.42 -2.3)
Completeness 99.2 % (99.8)
I/δ(I) 5.6 (1.95)
Rmerge 0.133 (0.392)
Reflections 82143 (11981)
Unique reflections 17568 (2553)
Multiplicity 4.7 (4.7)
Mosaicity 0.25
In brackets are values fort he outer shell

Discussion
130
3.3.2.2 SeMet-SelenoN purification, crystallization and crystals derivatization
For the purpose of experimental phasing, selenomethionine labelled bacterial SelenoN was
produced following an adapted protocol derived from the native expression one. After removing
chaperones expressing medium, cells were washed with cold water before being resuspended in
a Selenomethionine labelling medium. The selenomethionine was added prior to protein
induction with IPTG. Surprisingly, a higher amount of cells where obtained compared to the native
protein expression. In fact, 30g of expressing cells where obtained from 6L expressing medium.
The purification protocol and buffers were all the same to those used for the native bacterial
SelenoN. The yield was also on the same scale.
Similarly, to what was observed for the native protein purification, most of contaminants were
removed during the first step of the purification (appendix 4B). The selenomethionylated protein
also eluted in the second peak of the size exclusion chromatography. It appeared monodisperse
and monomodal as only one single band was detected. To confirm the monodispersity and also
appreciate the apparent molecular weight of the selenomethionine labelled bacterial SelenoN, a
native Blue PAGE analysis was conducted. The same migration profile was observed for the native
protein (Figure 49).
Initial crystallization screens were made again using the same conditions described previously for
the native protein. The same commercial and self-prepared screens were tested but no crystal
was obtained.
Crystals grew in self-prepared conditions containing 0.1M MES or MOPS pH 6.5 and 20-30% PEG
6000 only when combining hanging drop vapor diffusion with seeding technique (Figure 30).
Crystals of the native protein were crushed and used as seeding material at different dilutions 10-
1 to 10-6. Selenomethionine-labelled SelenoN crystals were tested at the ID23.1 beamline of the
ESRF where the wavelength is tunable.
Crystals were first tested for their X-ray diffraction properties. The best of them diffracted to 2.8
Å (Figure 50). Then, the selenium signal was searched by an energy scan. Unfortunately, the signal

Discussion
131
was very weak (result not shown) for all crystals tested and collecting data at selenium edge was
not possible.
Figure 49: Purification of the Selenomethionine labelled bacterial SelenoN
The chromatogram (A) shows the elution profile of the labelled protein over a superdex 200 16/60. The peak 2
eluted between 70 and 80 mL and contains Selenomethinine labelled SelenoN as a pure sample as depicted on the
coomassie stained SDS PAGE gel (B). The coomassie stained Native PAGE (C) showed that the protein fraction was
monodisperse and that its migration profile is similar to as the native protein.

Discussion
132
In order to introduce marker atoms to enable experimental phasing, selenomethionine-labelled
SelenoN crystals were soaked in Ta6Br12 (Knäblein et al. 1997).
Powder of the cluster was added to the crystallization drop. The crystal was considered efficiently
soaked when turned greenish (Figure 51). After collecting, the soaked crystal was washed in the
reservoir solution containing 20% glycerol before flash-cooling in liquid nitrogen. X-ray diffraction
measurement were performed at the Ta and Br edges. Data were collected at peak, inflection and
low remote wavelengths using an adapted collection strategy automatically calculated by the
EDNA program and further processed with Mosflm.
Data collected at the Ta edge were of a very poor quality and completeness. In fact, indexing was
not possible for the peak and remote data set. Data collected at the inflection point showed a
strong anomalous signal only at a very low resolution around 7Å.
Data collected at Br edge were of a better quality and exhibited an anomalous signal at a better
resolution than Ta. Inflection and peak datasets were successfully processed using Mosflm.
Statistics of data collected at peak and inflection point at the Bromide edge are presented (Table
27). Those data exhibited anomalous signal but have a poor resolution that is under 3.4 Å. Crystals
belong to a different space group and have different unit cell parameters compared to the native.
They belong to the space group P212121 and have the following unit cell parameters, a = 43.92 Å
b = 78.32 Å c = 93.63 Å, α= β = ɣ = 90°. The absence of isomorphism with the native crystal excludes
the possibility of phasing using isomorphous replacement methods. The only method that will be
trying are therefore based on anomalous dispersion and will be discussed later in the discussion
chapter.

Discussion
133
Figure 51: Crystals of Ta6Br12 soaked bacterial selenomethionine-SelenoN
Figure 50: Crystal of bacterial SeMet-SelenoN and its x-ray diffraction.
Crystals grew when combining vapor diffusion with seeding using crushed native crystals as seeding material.

Discussion
134
Table 27: Data statistics of Selenomethionine SelenoN crystal soaked in Ta6Br12.
Space group P212121 P212121
Unit cell constants a=43.92Å b=78.31Å c=93.63Å, α=β=ɣ=90°
a=44.208Å b=78.657Å c=94.136Å, α=β=ɣ=90°
Resolution (Å) 47.07-3.65 (4.00 -3.65) 46.77-3.40 (3.73 -3.40)
Completeness 98.8% (96.1) 99.4% (97.7)
Anomalous completeness 96.2 % (86.9) 95.9% (89.6)
Mean (I/sd (I)) 7.0 (1.3) 8.7 (1.8)
Reflections 23395 (4871) 28260 (6320)
Unique reflections 3933 (886) 4762 (1080)
Multiplicity 5.9 (5.5) 5.9 (5.9)
Anomalous multiplicity 3.2 (3.1) 3.2 (3.2)
DelAnom CC (1/2) 0.475 (0.517) 0.486 (0.571)
Mosaicity 0.40 0.40
Wavelength (λ) 0.9197 (Peak) 0.9191 (Inflection point)
Data were collected at peak and inflection point wavelengths at the bromine absorption edge and were later
processed with Mosflm and scaled with Scala. CC: correlation coefficient, Numbers in parentheses are for the
outershell
3.3.3 Molecular replacement of the bacterial SelenoN The UAS domain of human UBX containing protein 7 and thiol disulfide interchange protein from
Bacteroides sp structures that represent respectively 13% and 33% degree of identity with two
invidual domains of bacterial SelenoN could not be used as templates for the molecular
replacement. However, the thiol-disulfide oxidoreductase protein (PDB accession number 4NMU)
that represents a 28% degree of identity with the C-terminal thioredoxin-like domain of SelenoN
was used. The program MOLREP (Vagin and Teplyakov 2010) was run using default parameters

Discussion
135
and yielded a partial structure that was later optimized with iterative cycles of building in COOT
(Emsley and Cowtan 2004) and refinement with REFMAC5 (Murshudov et al. 2011).
With no surprise, the solution was limited to the last 140 amino acids corresponding to the C-
terminal thioredoxin-like domain (Figure 15). As expected, the model obtained displayed
characteristics of thioredoxin-fold notably a core of β-sheets surrounded by α-helices. The RFree
was 52%, which is a high value for a molecular replacement solution. In our case, it is remarkable
that 52% could be attributed, even though only 1/4th of the protein could be correctly covered
with a low percentage identity. From the local geometry analysis (Figure 52), the partial structure
fit well into the electron density map, but quality parameters were averaged over the whole
structure. This is one possible explanation for the high value of the RFree factor.
Figure 52: Molecular replacement of the bacterial SelenoN.
The upper panel shows the protein model obtained after molecular replacement covering the C-terminal thioredoxin-
fold. The lower panel shows the fit of the protein model in the calculated electron density map.

Discussion
136
4 Discussion

Discussion
137
4.1 Bioinformatic analysis of bacterial and zebrafish amino acid sequences
It is important to note the degree of conservation between in the human and the zebrafish
proteins on one hand and the zebrafish and the bacterial proteins on the other hand. Alignment
yielded respectively 67% identity for the two eukaryotes and 37% identity between zebrafish and
Candidatus poribacteriae. In addition, most of the differences are clustered within the
transmembrane region in eukaryote and the additional thioredoxin fold in bacteria. Previous
experiments demonstrated that manipulation of the zebrafish SelenoN is easier than its human
counterpart, probably due to the high GC content of the human SelenoN DNA, and that the
zebrafish SelenoN is expressed at a higher level in culture cell than its human homolog. The
structure and domain conservation between both eukaryotes makes zebrafish a good alternative
for SelenoN structural and functional studies.
Analysis of the zebrafish SelenoN amino acid sequence showed the presence at the N-terminus of
a transmembrane domain organized in one α-helix from amino acids 43 to 53 and an EF hand
domain which is a calcium binding domain. These two domains were not found in the bacterial
sequence.
The 37% identity between the bacterial and the zebrafish sequence covers the conserved SelenoN
sequence which corresponds to the UAS domain of a human protein of unknown function: the
human UBX domain containing protein 7 (UBXD7) (PDB accession number 2DLX) that was
identified in the analysis and presents 13 to 15% identity. From the structural point of view, this
domain corresponds to a thioredoxin fold domain that was found to bind fatty acids and is
responsible of protein UBXD8 oligomerization (Kim et al. 2013). The domain consists of 126 amino
acids covering from amino acid 381 to 507 in zebrafish sequence and from 229 to 355 in bacterial
sequence. The domain was modelled using the SWISSMODEL program on-line. It is organized in
five α- helices and three β-sheets (Figure 53A). The hypothetic catalytic site is located at the end
of one helix and the beginning of a turn (Figure 53A). The thioredoxin fold domain of the C-terminal
bacterial sequence was also modeled (Figure 53B) using the disulfide interchange protein from

Discussion
138
Bacteroide sp. (PDB accession number 2LRN) as template. It consists of six β-strands with four of
them organized as a core surrounded by four α-helices.
Figure 53: Models from SWISSMODEL of the two-main domain found on bacterial and
zebrafish SelenoN.
A model of the UAS domain found in both bacterial and zebrafish sequence. The highlighted area is the
hypothetical active site including the predicted catalytic motif, the SCUG sequence.
B model for the thioredoxin-like domain found at the C-terminus in the bacterial sequence.

Discussion
139
4.2 Zebrafish SelenoN
4.2.1 Expression/Purification and biophysical characterization of the recombinant
zebrafish SelenoN
In this study, the recombinant zSelenoN was expressed in mammalian HEK 293Trex cells as an
integral membrane protein. The used stable transformed strain was specifically designed for
inducible expression. Based on our result, this strain can be used for expression of zSelenoN as
efficiently in suspension or adherent cell culture (results not shown). Therefore, to limit
manipulations and avoid contamination, adherent culture was used as an expression system to
produce zSelenoN. Screening different detergents showed that solubilization with decyl-β-
maltoside (DM) condition yielded elution fractions with a higher purity and higher amount of
protein compared to the dodecyl-β-maltoside (DDM) and CHAPS. In addition, screening of
different cationic additives combined with the detergents on a Native PAGE gel showed a major
oligomer that is more prominent when DM combined with EGTA and EDTA was used.
Because of the presence of an EF-hand domain, one would expect a destabilizing or stabilizing
action of Ca2+ on the protein surprisingly, the result of the additive screening suggested that the
protein is more stable when chelating Ca2+ from the buffer. One possible explanation is that Ca2+
binding is involved in the regulation of a catalytic activity and that cannot be reproduced in
absence of the substrate.
The cell membranes containing the recombinant protein were isolated by differential
centrifugation. Recombinant zSelenoN was successfully solubilized with DM and further purified
in two chromatographic steps. Using a Hiload Superdex 200 10/300 GL size exclusion
chromatography, the zSelenoN protein eluted in two peaks: a first flat peak followed by a second
sharp peak. The elution volume of the second peak corresponded theoretically to a globular
particle of 150 kDa. SDS-PAGE analysis showed that both peaks contained the protein without
major contaminants and evaluation of the amount of protein in each fraction by absorbance at
280 nm showed that both fractions contained equal amount of zSelenoN. Interestingly, based on
the difference between the migration on a denaturing gel and the expected size calculated from
the amino acid sequence (72 kDa instead of 64 kDa as predicted by EXPASY) and also based on

Discussion
140
the deglycosylation assay using PNGaseF, these data confirmed that the protein produced
transited through the endoplasmic reticulum and has been post-translationally modified. Human
SelenoN was shown to be glycosylated in vivo (Petit et al. 2003), and mass spectrometry analyses
on zSelenoN demonstrated that the protein was N-glycosylated on two residues (communication
from M. Baltzinger). This modification is believed to be important for protein solubility and
folding, since its expression in presence of an inhibitor of protein glycosylation, tunicamycin,
induced destabilization of the product. In addition, previous expression attempts in bacteria failed
to produce any soluble protein even without the transmembrane domain.
Small angle X-ray scattering (SAXS) has emerged as an important tool to control the quality of a
purified protein sample, to evaluate the structural parameters such as the maximum length and
gyration radius of a particle as well as modelling a low-resolution structure in solution (Kikhney
and Svergun 2015a). Such information collected could be useful to compare two proteins
homologs such as, wild type vs. mutant, full length vs. truncated forms, and even a structural or
a conformational modification in a protein resulting for example from a binding even with a
partner.
SAXS experiments were performed in-line with a preceding separation step. Both peaks of
purified zSelenoN were analyzed. The I(0) vs. No of frame trace of the flat peak suggested that the
sample is a mixture of several zSelenoN oligomers whereas in the case of the sharp peak, only the
protein-detergent complex peak and the detergent free micelles peak were detected. The
detergent micelle peak was identified by comparing the I(0) curve to the A280 curve. On the I(0)
curve, two peaks were identified and only the first one was also detected at A280. As DDM presents
a very low absorbance at A280 the peak corresponding to the detergent could clearly be identified.
It is important to mention that the two peaks that were detected in this case where also detected
when analyzing the purification flat peak (appendix 2D). Since the flat peak was showed to be
polydisperse, further analysis and characterization was only made with the sharp and
monodisperse peak.
The monodispersity and absence of aggregates in the zSelenoN sharp peak were confirmed by
the SAXS analysis: the Rg trace was horizontal under the protein-detergent complex peak and the
Guinier plot was linear for the first measured s values.

Discussion
141
The Kratky plot displayed two bell-shaped peaks which tend to zero at the maximum values of s.
This behavior suggested a well folded and multidomain particle. Keeping in mind that this analysis
was carried out on a protein-detergent complex, the part of the protein surrounded by detergents
monomers corona could appear as a domain different from the soluble remaining part of the
protein. This could explain the Kratky plot profile. On the other hand, as suggested by it amino
acid sequence analysis, zSelenoN was predicted to contain more than one domain.
The molecular weight and oligomer status were calculated using different approaches. Based on
the on SDS-PAGE migration, the denaturated glycosylated monomer is 72 kDa while the
calculated value in native conditions is within the range of 150-210 kDa. This value is 2 to 3 times
higher than the monomer value without detergent. This result is in favor of a compact trimer or
dimer. When combining the results with the estimation from the retention volume on the
superdex 200 10/300 column which is 150 kDa one can conclude that the protein-detergent
complex contains a compact dimer of zSelenoN and several monomers of DDM.
zSelenoN secondary structure content was investigated by circular dicroism (CD) spectroscopy.
Experimentally, the protein was found to be well folded as only 21% of residues were calculated
as unordered. This result is consistent with the bioinformatics prediction using the program
PHYRE2 on-line. However, experimental and bioinformatics analyses were divergent concerning
the percentage of secondary structure contents of: α-helices and β-sheets. The percentage of α-
helices calculated experimentally is 56% and only 37% for the bioinformatics estimation whereas,
23% of β-sheets were estimated bioinformatically and only 12% experimentally. One should keep
in mind that the bioinformatics analysis is based only on the amino acid sequence and do not take
in account several parameters such as post-translational modification, oligomerization or
presence of detergent. Hence, the difference observed between the calculated and theoretical
values could be attributed to such parameters. To be able to compare more accurately with the
theoretical values, one should first evaluate the secondary structure of the deglycosylated and
truncated protein without the transmembrane domain.

Discussion
142
4.2.2 Ca2+ effect on zebrafish SelenoN
As the EF-hand domain of zSelenoN is localized in the ER Lumen, one would expect that the
binding site is active and that the protein structure and/or function is sensitive to the Ca2+
concentration. In order to investigate the effect of the bivalent ion on the protein, it was required
to determine and control its binding parameters. First the effect of the binding was analyzed on
a native PAGE gel to test for an induced-change of conformation. In the presence of EGTA, the
protein migrated as a 140 kDa globular particle whereas, in the presence of Ca2+, it migrated to a
higher molecular weight. This result suggested that the protein was sensitive to the Ca2+
environment and that its conformation/oligomerization was controlled by Ca2+. The binding
constant was investigated using microscale thermophoresis (MST) (Jerabek-Willemsen et al.
2011), and EGTA was used as negative control. Several concentration of Ca2+ were tested. In the
case of binding, one would expect the signal amplitude of the Ca2+ conditions to be higher than
the EGTA condition and that the Ca2+ binding curve displays a sigmoid shape. Surprisingly, no
difference could be observed between Ca2+ and EGTA conditions. This result gives rise to three
hypotheses: first, due to its conformation, the EF hand domain of zSelenoN was not active and
did not bind the Ca2+. Indeed, the Calcium binding protein 4 (CaBP4) presents in its amino acid
sequence four EF Hand domains but the second one, eventhough presenting a classic EF-hand
motif is not able to bind Ca2+ due to its conformation (Park et al. 2014). Secondly, regarding the
fact that incubation with Ca2+ led to oligomerization of the protein as was seen on the native PAGE
gel, one can suggest that the Ca2+ binds, but that for some reason, this binding cannot be
monitored by thermophoresis. The third hypothesis is that the protein aggregated in presence of
Ca2+, resulting in the absence of a signal. In the Ca2+ binding superfamily, there are proteins such
as the Calbindin D28K which is a highly conserved Ca2+ binding protein with six EF-hand domains.
Oligomerization of four of the binding sites was proved to be mediated by Ca2+ binding, whereas
the binding on the sixth one which has a low Ca2+ affinity leads to severe aggregation of the
protein (Cedervall et al. 2005).
Ca2+ binding could not be further investigated since the binding constant could not be calculated
using MST. It is important to mention that all attempts to add Ca2+ in concentrated zSelenoN

Discussion
143
samples led to protein precipitation. Therefore, further characterization of zebrafish SelenoN was
only conducted in presence of EGTA.
4.2.3 Crystallization and structural studies in solution of the zebrafish SelenoN
Characterization of zSelenoN purified from HEK 293 Trex cells showed that the protein was well
folded and that the protein sample was of a good quality for crystallization trials. Crystals were
initially obtained after intensive optimization. The difficulty in the crystallization of zSelenoN
resides in the fact that it is a glycosylated membrane protein. On one side, the requirement of
detergent to keep the protein in solution is a first limit to the crystallization since, detergents in
solution can form phase separation thus reducing the possibility or probability of nucleation and
crystal growth (Papers, Garavito, and Ferguson-miller 2001; Newby et al. 2009). The second hurdle
for the crystallization is the glycosylation. Glycan residues are in one hand necessary to support
the corect folding of the protein during expression, on the other hand they are conformationally
flexible, thus minimizing the probability for crystal contacts (Tang et al. 2005; Kalisz et al. 1990;
Mesters and Hilgenfeld 2007).
With no surprise, no crystalline precipitate was obtained in the first screens using the glycosylated
protein. Only when removing sugar residues from the protein spherulites could be obtained
although with a very weak diffraction to 15 Å. Those spherulites were used later as seeding
material and small crystals could be obtained. X-ray diffraction experiments of those crystals
showed no diffraction. They are either of a poor quality due to their size or due to internal
disorder. Alternatively, their quality could have been impaired during the cryoprotection
treatment. zSelenoN crystals size and quality should be optimized for example using iterative
seeding (D’Arcy, Mac Sweeney, and Haber 2003; D’Arcy et al. 2014). If no increase in size could be
obtained, one should try to make in situ measurements using a small beam.
Low resolution models were calculated using DAMMIN and DAMMIF programs. Models with Dmax

Discussion
144
values of 14.85 nm and 15.78 nm were obtained respectively, which in the case of DAMMIN was
in a good agreement with the calculated value from the P(r) function. The molecular weight and
volume of the models were also in a good agreement with the P(r) function. The DAMMIN model
and the dominant cluster of the DAMMIF model displayed the same shape. When taken
individually, the twenty shape models generated by DAMMIN program displayed χ2 values in
agreement with the scattering data and the different models obtained presented low distance
between each other. Therefore, the average model was expected to be within the same χ2 range.
The high χ2 value of DAMMIN model can be attributed to the presence of detergents or glycan
residues. In the case of a protein of known structure, it would have been interesting to generate
a model and fit it into the SAXS shape but in our case, the identity with aligned protein templates
is very low. Therefore, models generated would be of a very poor quality and not reliable.

Discussion
145
4.3 Candidatus poribacteriae SelenoN
4.3.1 Expression/Purification and biophysical characterization of the recombinant
bacterial SelenoN
The recombinant bacterial SelenoN was expressed in E. coli and purified using a two-step
protocol. This protocol was optimized and SDS-PAGE analysis of the purified bacterial SelenoN
showed that the full-length protein was expressed and purified without significant proteolysis.
Using a Hiload Superdex 200 16/60 GL size exclusion chromatography, the peak of the
recombinant bacterial SelenoN eluted at a volume corresponding to a globular particle of 75 kDa.
The migration on a blue native PAGE confirmed the monodispersity and monomodality of the
bacterial SelenoN fraction, and showed an approximate molecular weight of 80 kDa. Based on the
difference in mobility on the native and the denaturing PAGE, it is likely that the recombinant
protein is either not globular and could form an elongated shape retarding its migration on the
native PAGE compared to the SDS PAGE. Alternatively, it could form a very compact homodimer
that migrates as a smaller molecule.
As for zSelenoN, the molecular weight in native condition could also be determined using SAXS
experiments. It was evaluated in the range of 72-83 kDa which is 11 to 13% greater than the
denaturated monomer. The result of this estimation is in good agreement with on the one hand
the calculation using SEC in line with RALS, corresponding to about 76 kDa and on the other hand
the mobility on the native PAGE gel.
The secondary structure content was experimentally determined and bioinformatically
estimated. Results of both analyses are consistent. CD spectra displayed a profile of a well-folded
protein and analysis estimated only 20% of unordered residues. The bacterial SelenoN is more
likely to be α-helical enriched (40%) and with a percentage of 23% of β-sheets. This secondary
structure report is the first for the bacterial SelenoN and as for zSelenoN, it can be used later to
investigate structural rearrangements due to mutations or binding of interaction partners.

Discussion
146
4.3.2 Structural studies of the recombinant bacterial SelenoN
Low resolution models were calculated using DAMMIN and DAMMIF approaches. Models
displayed Dmax values of 15.1 nm and 19 nm respectively, which in the case of DAMMIN was in a
good agreement with the calculated value of the P(r) function. The molecular weight and volume
of the models were also in a good agreement with the P(r) function. Both models displayed similar
shapes but, according to the Dmax values, the DAMMIN model seemed to be the most accurate.
Native bacterial SelenoN was crystallized at 18°C using the hanging drop vapor diffusion
technique with a concentration of 12 mg/mL. Crystals of a needle shape with a size ranging
between 50 and 100 µm were obtained under different conditions. They belonged to different
space groups. Crystal quality was compared with their statistics after processing of the data
obtained and the best of them was used for molecular replacement attempts.
Molecular replacement is a challenging method for the phasing of a protein of unknown structure
such as SelenoN. As described for the obtained partial model, only limited part could be covered
by the process and this yielded a result of a poor quality. It is more common and trustable for a
protein of unknown structure to phase with the help of anomalous scatterer signals. The most
problematic part when using this method is to efficiently insert the marker atom that will provide
the data with an anomalous signal that is strong enough and so to keep a good resolution. There
are several ways to insert a marker atom. The mostet common is to express and purify proteins
including a Selenomethionine (SeMet) label. Through a specific expression process, the
selenomethionine is inserted in place of methionine and the specific signal of the selenium later
is used for the phasing. This technique was applied for the bacterial SelenoN. The SeMet labeled
protein was efficiently expressed and purified yielding a sample of quality equivalent to the native
protein. Diffracting crystals were obtained by vapor diffusion combined with seeding but
unfortunately, those crystals displayed a very poor anomalous signal.
The other way to insert anomalous signal is, after growing crystals to soak them into heavy atoms
solution. SeMet bacterial SelenoN crystals were used for this purpose. As the limit to our heavy
atoms screening was the number of crystals, I choose to test the cluster Ta6Br12 as first anomalous
scatterer. The advantage of this cluster is that one can collect data for experimental phasing at

Discussion
147
either Br or Ta edges, and also one can soak by directly adding the green powder over the drop
containing the crystal. The crystal is considered efficiently soaked when it turns greenish, which
happened in this case. As expected the anomalous signal was strong enough to be detected and
data were collected at both Br and Ta edges. Attempts to phase using the so collected and
processed data failed because of the poor resolution due to soaking treatment and, because the
soaking yielded a modification of the space group and unit cell parameters therefore, the native
crystal data could not be used for isomorphous replacement.
4.3.3 The bacterial SelenoN thioredoxine-like fold
The molecular replacement covered the last 140 C-terminal amino acid of the bacterial SelenoN.
As predicted, this domain adopted a classical thioredoxin-fold constituted by four ß-sheets
surrounded by alpha helices. The pecularity of the bacterial SelenoN is that the fold contains only
one cysteine instead of two within the conserved C-X-X-C motif, the first cysteine being replaced
by an asparagine. This situation suggested that this thioredoxin-like fold corresponds to either a
monothiol glutaredoxin or to a one-cys peroxiredoxin. Structurally, peroxiredoxins are organized
as a core of seven β-sheets surrounded by four α-helices whereas glutaredoxins are organized as
a core of four β-sheets surrounded by three α-helices (Pan and Bardwell, 2006). The solution of
the molecular replacement displayed a structural organization closer to that of the glutaredoxins.
Therefore, we propose that the bacterial thioredoxin-like domain of SelenoN corresponds to a
monothiol glutaredoxin (Figure 54). Glutaredoxins are as other thioredoxin family members
electron donor involved in redox reactions. The reduced monothiol glutaredoxin exchanges
electrons with gluthationylated proteins and later uses gluthatione to regenerate the oxidized
form (Figure 54).

Discussion
148
Figure 54: The C-terminal thioredoxine-like fold of the bacterial SelenoN
The left panel display the structure deduced from the X-ray diffraction interprated by molecular replacement. The
left pannel is a schematic representation oft he enzymatic mechanisms catalyzed by monothiol glutaredoxin.
Baseed on it structural organisation, the C-terminal thoioredoxin-like domain of the bacterial SelenoN is predicted
to belongs to this group of reducing enzymes.

Discussion
149
4.4 Comparison between bacterial and zebrafish SelenoN
Taken together, the results presented in this project stressed that eukaryotic and bacterial
SelenoN share several features, but also present differences (Table 28).
In their amino acid sequence, bioinformatic analyses revealed a difference of domain
composition: Zebrafish sequence contained at its N-terminus a transmembrane domain organized
in one α-helix, followed by an EF Hand domain. Ca2+ binding was shown to influence the
conformational organization of zebrafish SelenoN, but binding parameters could not be
calculated.
A common domain was found in both organisms. This domain corresponding to the C-terminus
domain of the zebrafish SelenoN contains the redox motif SCUG and aligned with the UAS domain
of the human protein UBXD7. This domain was proved to bind fatty acid (Kim et al. 2013) and is
suggested to be involved in cholesterol metabolism (Loregger et al. 2017). In Selenoprotein N,
since it includes the predicted redox motif, this domain could correspond to a catalytic function.
Bacterial SelenoN was lacking the two first N-terminal domains and presented an additional C-
terminal domain corresponding to a thioredoxin-fold. First X-ray analysis suggested that this C-
terminal thioredoxin-fold might correspond to a monothiol glutaredoxin.
Both SelenoN proteins were found to be well folded and α-helical enriched, suggesting a common
general organization. However, the zebrafish SelenoN behaved as a compact dimer whereas
bacterial SelenoN behaved as an extended monomer. This latter observation was further
confirmed by analytical ultracentrifugation analysis (result not shown). The difference observed
could be the result of adaptability or an evolution of functions regarding the difference in domains
composition and intracellular localization in respective organisms.

Discussion
150
Table 28: Comparison of zebrafish and Candidatus poribacteriae SelenoN

Conclusions and perspectives
151
5 Conclusion and perspectives

Conclusions and perspectives
152
The aim of this PhD project was to lay foundation for the structural studies of SelenoN to
help in the understanding of its dysfunction in SELENON-related myopathies. The strategy to attain
this goal was by working on the bacterial and the zebrafish SelenoN orthologs simultaneously.
Once solved, the bacterial structure could be used as a template to solve the zebrafish SelenoN
structure. Since the zebrafish SelenoN has 67% identity with the human protein, important
structure information relevant to the pathogenic mutations could be derived. The structure solved
would be a prerequisite for a better understanding of SelenoN function and its catalytic
mechanism.
The zebrafish full-length SelenoN has been successfully expressed in HEK 293 Trex culture
cells as a membrane protein to ensure the complete post-translational modifications necessary
for its folding. The purification strategy made of affinity and size exclusion chromatography was
optimized and yielded a first polydisperse fraction and a second monodisperse stable fraction. The
second fraction was used to characterize the molecular weight, the shape and the secondary
structure of the recombinant protein.
The monodisperse and stable fraction was more likely to correspond to a compact dimer
that was experimentally characterized to be well-folded and α-helical rich with 56% of α-helices
and only 12% β-sheet. Optimization of the crystallization condition by native deglycosylation,
reservoir solution optimization and seeding yielded small crystals that were obtained with both
polydisperse and monodisperse fractions. Their size and quality should be optimized as no X-ray
diffraction could be observed with classical experimental technique. For the continuation of the
project, one could envisage on first place iterative seeding but, if not yielding better and bigger
crystals, in situ measurement could be made to limit the manipulation and therefore the stress of
the crystals.
It was shown that zSelenoN is sensitive to the Ca2+ environment and that its
oligomerization is mediated by Ca2+ binding. It was also observed that if not properly controlled,
Ca2+ binding can lead to severe aggregation. Calculations of binding affinity by microscale
thermophoresis failed. To further investigate this Ca2+ effect, we recommend investigating the

Conclusions and perspectives
153
binding affinity using label free techniques such as Isothermal calorimetry and in parallel with
analytical ultra centrifugation, to follow and characterize the oligomerization process.
The difficulty when working on the zefrafish recombinant comes from the fact that on one
hand detergents are necessary for all steps which makes the interpretation of characterization
results less accurate and on the other hand, the glycosylations which of course are necessary for
the folding, but are not suitable for characterization as well as crystallization.
In the case of the bacterial protein, the recombinant soluble SelenoN was overexpressed
in E coli using co-expression of GroES/GroEL chaperones, purified it using affinity and size
exclusion chromatographies, and characterized its secondary structure content and shape. The
so-produced protein is an elongated monomer that was found to be well folded and alpha helical
rich with 40% of α-helices and 23% β-sheet content. Crystals of the protein that diffracted up to
1.9 Å were obtained using a purified fraction concentrated to 10 mg/mL, after few days to few
weeks depending on the conditions. All crystals obtained presented same needle-like shape and
belong to space groups C2221 or P212121. The molecular replacement yielded a partial model that
covers 1/4th of the protein corresponding to the additional C-terminal thioredoxin-fold domain.
Later, phasing based on anomalous scatterers was tried. For this purpose, Ta6Br12 cluster was used
to derivate SeMet-bSelenoN crystals. Anomalous signal was successfully inserted but yielded a
decrease in the crystal quality. Next, attempts to phase by single or multiwavelengths anomalous
dispersion failed. The main reason for this unsuccessful phasing was that crystallization was very
poorly reproducible so that, systematic screening for heavy atoms derivatives was not possible.
Production of bacterial selenoN and initial crystallization conditions are now established. The only
limit to get to the structure is to obtain a quantity of crystals large enough for more and efficient
marker atoms screening in terms of type, concentration and soaking time.
It is important to rethink the initial strategy that was designed for SelenoN structure
studies. As a reminder, one aspect of working with the bacterial construct was that, the solved
structure of the bacterial SelenoN was to be used as a template for molecular replacement to
solve zSelenoN structure. Regarding the experimental results of the characterization, once

Conclusions and perspectives
154
zSelenoN crystals are obtained, it is recommended to introduce anomalous signal for the phasing,
since too many differences between both recombinants were observed in terms of secondary
structural element content, oligomerization behavior, shape and theoretical domain content
according to their topology, suggesting that the degree of similarity is not extended. Even the only
common domain between the bacterial and the zebrafish amino acid sequences, presents just
37% degree of identity. As previously seen, molecular replacement in this condition will yield a
poor result that will cover only a part of the protein. Nowadays, new X-ray diffraction experiments
and phasing methods with less stress on the crystals are being developed, notably, in situ
measurements of small crystals using a very small beam combined with native SAD. The native
SAD is based on anomalous scattering of chemical elements that are naturally found in the protein
such as sulfur, iron, or calcium. This aims at avoiding the step of crystal derivatization and thus
limit the probability of decreasing the crystal quality during the treatments.
Many questions of biological relevance are still opened concerning this project. Differences
observed between the bacterial and eukarotic SelenoN are suggested to translate an evolution of
the function as well as a specification in different organisms. Also, SelenoN-RM animal models as
well as patients have a muscular phenotype. As this protein is present in higher eukaryotes but
also in organism lacking any muscular organization, one can suggest that the function of the
protein is broader than the muscle establishement and maintenance as suggested by studies on
animal models. One can also suggest that the muscular function observed in higher eukaryots is
the result of an evolution. Mutations leading to SelenoN-RM can be grouped into two main
regions of the gene. Region covering exons 5 to 8 and the region covering exons 10 and 11 that
correspond to the predicted catalytic center. Mutations in the first region can be suggested to lead
to a structural reorganization leading itself to a loss of function or to a loss of binding with a
partner. The second region mutations are indeed suggested to lead to a direct loss of function.
During my PhD work, we had the opportunity to use two different expression systems:
first, the E coli system which is adapted for structural studies and second, a mammalian cells HEK
293 Trex culture which is less common than bacterial systems but more appropriate for eukaryotic
recombinant protein harboring post-translational modifications. We could evaluate the

Conclusions and perspectives
155
advantages and disadvantages of both systems: E. coli remains certainly a very good expression
system to produce high quantities of protein, which is an advantage for a structural study, but is
not capable of post-translational modifications that are required in certain case for proper
eukaryotic protein folding and stability. Mammalians HEK cells on the other hand are capable of
these modifications but are more time and money consuming and less easy to handle because of
a higher risk of contamination and a higher sensitivity to stress.
This thesis was a collaboration between Dr. Lescure Alain of “Institut de Biologie
Moleculaire et Cellulaire-IBMC” Strasbourg and Prof. Dr. Lancaster Roy of the “Zentrum Fur
Human- und Molekulare Biologie” Homburg. Both laboratories brought to the project different
and complementary expertises. The Strasbourg laboratory is a biomolecular and cellular biology
lab which has the expertise in selenoproteins while the Homburg laboratory is a structural biology
laboratory with expertise in membrane proteins studies using the X-ray crystallography. In
Strasbourg, expression and purification protocols of both bacterial and zebrafish constructs were
developed while the biophysical characterizations as well as the X-ray crystallography were
conducted in Homburg.

Appendix
156
6 Appendix

Appendix
157
Appendix 1: amino acid sequences of bacterial and zebrafish SelenoNs
> Zebrafish_SelenoN MATDVDKTPAGEQKDDHEDRGTPSSRRGRSRFTQISSLFIIAAIPVISFCIKYYLDIQFVKRHEAGLKALGADGL
FFFSSLDTDHDLYLSPEEFKPIAEKLTGVAPPPEYEEEIPHDPNGETLTLHAKMQPLLLESMTKSKDGFLGVSHS
SLSGLRSWKRPAISSSTFYASQFKVFLPPSGKSAVGDTWWIIPSELNIFTGYLPNNRFHPPTPRGKEVLIHSLLS
MFHPRPFVKSRFAPQGAVACIRATSDFYYDIVFRIHAEFQLNDVPDFPFWFTPGQFAGHIILSKDASHVRDFHI
YVPNDKTLNVDMEWLYGASETSNMEVDIGYLPQMELGAEGPSTPSVIYDEQGNMIDSRGEGGEPIQFVFEEI
VWSEELKREEASRRLEVTMYPFKKVPYLPFSEAFSRASAEKKLVHSILLWGALDDQSCUGSGRTLRETVLESSP
VLALLNQSFISSWSLVKELEDLQGDVKNLELSEKARLHLEKYTFPVQMMVVLPNGTVVHHINANNFLDQTSM
KPEDEGPGLSFSAGFEDPSTSTYIRFLQEGLEKAKPYLES
>Bacterial_SelenoN
MVDFNNTLSSTASVQVAAHWDPIENTANNLHRSTEEKFNRDKAQWQEPVEMTWEQWLEVFNPGPAHPL
KNYSTADFQVFLPPSTVNVADVWDLDTEGILPFLRQFHPSATMKLPRYGSIPSDQKDAKACLRALSPEYADIVF
RIHARFTLDASIDAYFMPAQFAGHLIINRNSRTIHQWTLSLPNRNSNVDIGAFRSHDIGFVPRMELCSVSETQP
ESIVWEAAITAEEADKKFQNSLYKFAEIEWTPIEEAVELAKASNRSIHAVLLFGVLDDESCUGTGKALRAGPLSS
PKVINLLNTHFVNVWVLLRELPALQTGAKGATAGTLATKLRQHYSDSVDILTLTADLEVIEHLPSKSLWHPDYL
PQSEWIPRYLELLTSSVDVEVVPQKPGELGKHGLSRRLVKAYEELGKPAPDFSATDLDGKPISLQQYRGKVVLL
DFWAVWNGFCIGDILRVKKIYNTYKDQGFDIIGVSLDTDETKLRNYLQENDISWRQIYSGLERQSPLAQQYDV
RSIPTRWLIDRDGKLIAHETHHKLISRKGRESDLEQVVAEAVVNKKSAESVKFAIIRDSDD

Appendix
158
Appendix2: SEC-SAXS of zebrafish SelenoN
(A) intensity trace as a function of frame number of the Purification Peak2 (Figure 34 C and D)
(B) intensity trace as a function of frame number of the purification peak 1 (Figure 34 C and D)
(C) A280nm trace as a function of elution time. of the peak
(D) Merge of intensity traces peak 1 (orange) and peak 2 (blue)
1 = protein-detergent complex, 2 = detergent micelle

Appendix
159
Appendix 3 : representatives of zSelenoN clusters obtained after modelling with DAMMIN program

Appendix
160
Appendix 4: Native and selenomethionine labelled bacterial SelenoN Imac purification
(A) Imac purification of bacterial SelenoN
(B) Imac purification of selenomethionine labelled bacterial SelenoN
M = protein marker, CE = Crude extract or lysate, LF = loaded fraction, FT = flow through, W20 =
wash with 20 mM Imidazole, WATP = wash with 5mM ATP to remove chaperones, Elution=elution
fractions

Appendix
161
Appendix 5: SEC-SAXS of bacterial SelenoN
(A) Intensity as a function of elution volume of the bacterial SelenoN
(B) Intensity as a function of frame number of the bacterial SelenoN

References
162
7 References

References
163
Aachmann, Finn L., Dmitri E. Fomenko, Alice Soragni, Vadim N. Gladyshev, and Alexander Dikiy. 2007. “Solution Structure of Selenoprotein W and NMR Analysis of Its Interaction with 14-3-3 Proteins.” Journal of Biological Chemistry 282 (51):37036–44. https://doi.org/10.1074/jbc.M705410200.
Abdul-Gader, Ali, Andrew John Miles, and Bonnie A Wallace. 2011. “A Reference Dataset for the Analyses of Membrane Protein Secondary Structures and Transmembrane Residues Using Circular Dichroism Spectroscopy.” Bioinformatics 27 (12). Oxford University Press:1630–36.
Adams, Paul D, Pavel V Afonine, Gábor Bunkóczi, Vincent B Chen, Ian W Davis, Nathaniel Echols, Jeffrey J Headd, L-W Hung, Gary J Kapral, and Ralf W Grosse-Kunstleve. 2010. “PHENIX: A Comprehensive Python-Based System for Macromolecular Structure Solution.” Acta Crystallographica Section D: Biological Crystallography 66 (2). International Union of Crystallography:213–21.
Allamand, Valerie, Pascale Richard, Alain Lescure, Celine Ledeuil, Delphine Desjardin, Nathalie Petit, Corine Gartioux, Ana Ferreiro, Alain Krol, and Nadine Pellegrini. 2006. “A Single Homozygous Point Mutation in a 3′ Untranslated Region Motif of Selenoprotein N mRNA Causes SEPN1-related Myopathy.” EMBO Reports 7 (4). EMBO Press:450–54.
Altschul, Stephen F, Thomas L Madden, Alejandro A Schäffer, Jinghui Zhang, Zheng Zhang, Webb Miller, and David J Lipman. 1997. “Gapped BLAST and PSI-BLAST: A New Generation of Protein Database Search Programs.” Nucleic Acids Research 25 (17). Oxford University Press:3389–3402.
Arbogast, Sandrine, Maud Beuvin, Bodvaël Fraysse, Haïyan Zhou, Francesco Muntoni, and Ana Ferreiro. 2009. “Oxidative Stress in SEPN1-Related Myopathy: From Pathophysiology to Treatment.” Annals of Neurology 65 (6):677–86. https://doi.org/10.1002/ana.21644.
Arnér, Elias S J, and Arne Holmgren. 2000. “Physiological Functions of Thioredoxin and Thioredoxin Reductase.” European Journal of Biochemistry 267 (20):6102–9. https://doi.org/10.1046/j.1432-1327.2000.01701.x.
Arnold, Konstantin, Lorenza Bordoli, Jürgen Kopp, and Torsten Schwede. 2006. “The SWISS-MODEL Workspace: A Web-Based Environment for Protein Structure Homology Modelling.” Bioinformatics 22 (2). Oxford University Press:195–201.
Baba-Aıs̈sa, Fawzia, Ludo Van Den Bosch, Frank Wuytack, Luc Raeymaekers, and Rik Casteels. 1998. “Regulation of the Sarco/endoplasmic Reticulum Ca 2+-ATPase (SERCA) 2 Gene Transcript in Neuronal Cells.” Molecular Brain Research 55 (1). Elsevier:92–100.
Baum, M K, G Shor-Posner, S Lai, G Zhang, H Lai, M A Fletcher, H Sauberlich, and J B Page. 1997. “High Risk of HIV-Related Mortality Is Associated with Selenium Deficiency.” Journal of Acquired Immune Deficiency Syndromes and Human Retrovirology : Official Publication of the International Retrovirology Association 15 (5):370–74. http://www.ncbi.nlm.nih.gov/pubmed/9342257.
Beck, M A. 1999. “Selenium and Host Defence towards Viruses.” The Proceedings of the Nutrition Society 58 (3):707–11. http://www.ncbi.nlm.nih.gov/pubmed/10604206.

References
164
Behne, D, H Weiler, and A Kyriakopoulos. 1996. “Effects of Selenium Deficiency on Testicular Morphology and Function in Rats.” Journal of Reproduction and Fertility 106 (2):291–97. http://www.ncbi.nlm.nih.gov/pubmed/8699413.
Benton, D, and R Cook. 1990. “Selenium Supplementation Improves Mood in a Double-Blind Crossover Trial.” Psychopharmacology 102 (4):549–50. http://www.ncbi.nlm.nih.gov/pubmed/2096413.
Bianco, Antonio C, Domenico Salvatore, Balázs Gereben, Marla J Berry, and P Reed Larsen. 2002. “Biochemistry, Cellular and Molecular Biology, and Physiological Roles of the Iodothyronine Selenodeiodinases.” Endocrine Reviews 23 (1):38–89. https://doi.org/10.1210/edrv.23.1.0455.
Biasini, Marco, Stefan Bienert, Andrew Waterhouse, Konstantin Arnold, Gabriel Studer, Tobias Schmidt, Florian Kiefer, Tiziano Gallo Cassarino, Martino Bertoni, and Lorenza Bordoli. 2014. “SWISS-MODEL: Modelling Protein Tertiary and Quaternary Structure Using Evolutionary Information.” Nucleic Acids Research 42 (W1). Oxford University Press:W252–58.
Bordoli, Lorenza, Florian Kiefer, Konstantin Arnold, Pascal Benkert, James Battey, and Torsten Schwede. 2009. “Protein Structure Homology Modeling Using SWISS-MODEL Workspace.” Nature Protocols 4 (1). Nature Publishing Group:1–13.
Bösl, Michael R, Kazuaki Takaku, Masanobu Oshima, Susumu Nishimura, and Makoto M Taketo. 1997. “Early Embryonic Lethality Caused by Targeted Disruption of the Mouse Selenocysteine tRNA Gene (Trsp).” Proceedings of the National Academy of Sciences 94 (11). National Acad Sciences:5531–34.
Boukhzar, Loubna, Abdallah Hamieh, Dorthe Cartier, Yannick Tanguy, Ifat Alsharif, Matthieu Castex, Arnaud Arabo, et al. 2016. “Selenoprotein T Exerts an Essential Oxidoreductase Activity That Protects Dopaminergic Neurons in Mouse Models of Parkinson’s Disease.” Antioxidants & Redox Signaling 24 (11):557–74. https://doi.org/10.1089/ars.2015.6478.
Broach, James R, Vicki R Guarascio, and Makkuni Jayaram. 1982. “Recombination within the Yeast Plasmid 2μ Circle Is Site-Specific.” Cell 29 (1). Elsevier:227–34.
Broach, James R, and James B Hicks. 1980. “Replication and Recombination Functions Associated with the Yeast Plasmid, 2μ Circle.” Cell 21 (2). Elsevier:501–8.
Castets, Perrine, Anne T. Bertrand, Maud Beuvin, Arnaud Ferry, Fabien Le Grand, Marie Castets, Guillaume Chazot, et al. 2011. “Satellite Cell Loss and Impaired Muscle Regeneration in Selenoprotein N Deficiency.” Human Molecular Genetics 20 (4):694–704. https://doi.org/10.1093/hmg/ddq515.
Castets, Perrine, Alain Lescure, Pascale Guicheney, and Valérie Allamand. 2012. “Selenoprotein N in Skeletal Muscle: From Diseases to Function.” Journal of Molecular Medicine 90 (10):1095–1107. https://doi.org/10.1007/s00109-012-0896-x.
Castets, Perrine, Svetlana Maugenre, Corine Gartioux, Mathieu Rederstorff, Alain Krol, Alain Lescure, Shahragim Tajbakhsh, Valérie Allamand, and Pascale Guicheney. 2009. “Selenoprotein N Is Dynamically Expressed during Mouse Development and Detected Early

References
165
in Muscle Precursors.” BMC Developmental Biology 9:46. https://doi.org/10.1186/1471-213X-9-46.
Caton-williams, Julianne, and Zhen Huang. 2008. “Biochemistry of Selenium-Derivatized Naturally Occurring and Unnatural Nucleic Acids” 5:396–407.
Cedervall, Tommy, Ingemar Andre, Cheryl Selah, James P Robblee, Peter C Krecioch, Robert Fairman, Sara Linse, and S A Karin. 2005. “Calbindin D 28k EF-Hand Ligand Binding and Oligomerization : Four High-Affinity Sites S Three Modes of Action †,” 13522–32. https://doi.org/10.1021/bi050861q.
Christensen, Lea Cecilie, Njal Winther Jensen, Andrea Vala, Jurate Kamarauskaite, Linda Johansson, Jakob Rahr Winther, Kay Hofmann, Kaare Teilum, and Lars Ellgaard. 2012. “The Human Selenoprotein VCP-Interacting Membrane Protein (VIMP) Is Non-Globular and Harbors a Reductase Function in an Intrinsically Disordered Region.” Journal of Biological Chemistry 287 (31). ASBMB:26388–99.
Compton, Larry A, and W Curtis Johnson. 1986. “Analysis of Protein Circular Dichroism Spectra for Secondary Structure Using a Simple Matrix Multiplication.” Analytical Biochemistry 155 (1). Elsevier:155–67.
Cowtan, Kevin. 2006. “The Buccaneer Software for Automated Model Building. 1. Tracing Protein Chains.” Acta Crystallographica Section D: Biological Crystallography 62 (9). International Union of Crystallography:1002–11.
Cunniff, Brian, Gregg W Snider, Nicholas Fredette, Jason Stumpff, Robert J Hondal, and Nicholas H Heintz. 2014. “Resolution of Oxidative Stress by Thioredoxin Reductase: Cysteine versus Selenocysteine.” Redox Biology 2. Elsevier:475–84.
D’Arcy, Allan, Terese Bergfors, Sandra W Cowan-Jacob, and May Marsh. 2014. “Microseed Matrix Screening for Optimization in Protein Crystallization: What Have We Learned?” Acta Crystallographica Section F: Structural Biology Communications 70 (9). International Union of Crystallography:1117–26.
D’Arcy, Allan, Aengus Mac Sweeney, and Alexander Haber. 2003. “Using Natural Seeding Material to Generate Nucleation in Protein Crystallization Experiments.” Acta Crystallographica Section D: Biological Crystallography 59 (7). International Union of Crystallography:1343–46.
Deniziak, Marzanna, Christine Thisse, Mathieu Rederstorff, Colette Hindelang, Bernard Thisse, and Alain Lescure. 2007. “Loss of Selenoprotein N Function Causes Disruption of Muscle Architecture in the Zebrafish Embryo.” Experimental Cell Research 313 (1). Elsevier:156–67.
Dikiy, Alexander, Sergey V. Novoselov, Dmitri E. Fomenko, Aniruddha Sengupta, Bradley A. Carlson, Ronald L. Cerny, Krzysztof Ginalski, Nick V. Grishin, Dolph L. Hatfield, and Vadim N. Gladyshev. 2007. “SelT, SelW, SelH, and Rdx 12: Genomics and Molecular Insights into the Functions of Selenoproteins of a Novel Thioredoxin-like Family.” Biochemistry 46 (23):6871–82. https://doi.org/10.1021/bi602462q.
Emsley, Paul, and Kevin Cowtan. 2004. “Coot: Model-Building Tools for Molecular Graphics.”

References
166
Acta Crystallographica Section D: Biological Crystallography 60 (12). International Union of Crystallography:2126–32.
Evans, Phil. 2014. “CCP4 Tools for X-Ray Integration and Data Processing.” Nihon Kessho Gakkaishi 56 (Supplement). The Crystallographic Society of Japan:s24–s24.
Evans, Philip. 2006. “Scaling and Assessment of Data Quality.” Acta Crystallographica Section D: Biological Crystallography 62 (1). International Union of Crystallography:72–82.
Felgner, Philip L, and G M Ringold. 1989. “Cationic Liposome-Mediated Transfection.” Nature 337 (6205). Springer:387–88.
Ferguson, Andrew D., Vyacheslav M. Labunskyy, Dmitri E. Fomenko, Demet Araç, Yogarany Chelliah, Carlos A. Amezcua, Josep Rizo, Vadim N. Gladyshev, and Johann Deisenhofer. 2006. “NMR Structures of the Selenoproteins Sep15 and SelM Reveal Redox Activity of a New Thioredoxin-like Family.” Journal of Biological Chemistry 281 (6):3536–43. https://doi.org/10.1074/jbc.M511386200.
Flohe, L, W A Günzler, and H H Schock. 1973. “Glutathione Peroxidase: A Selenoenzyme.” FEBS Letters 32 (1). Elsevier:132–34.
Flot, David, Trevor Mairs, Thierry Giraud, Matias Guijarro, Marc Lesourd, Vicente Rey, Denis van Brussel, Christian Morawe, Christine Borel, and Olivier Hignette. 2010. “The ID23-2 Structural Biology Microfocus Beamline at the ESRF.” Journal of Synchrotron Radiation 17 (1). International Union of Crystallography:107–18.
Fomenko, Dmitri E., Sergey V. Novoselov, Sathish Kumar Natarajan, Byung Cheon Lee, Ahmet Koc, Bradley A. Carlson, Tae Hyung Lee, Hwa Young Kim, Dolph L. Hatfield, and Vadim N. Gladyshev. 2009. “MsrB1 (Methionine-R-Sulfoxide Reductase 1) Knock-out Mice: Roles of MsrB1 in Redox Regulation and Identification of a Novel Selenoprotein Form.” Journal of Biological Chemistry 284 (9):5986–93. https://doi.org/10.1074/jbc.M805770200.
Fomenko, Dmitri E, and Vadim N Gladyshev. 2003. “Identity and Functions of CxxC-Derived Motifs.” Biochemistry 42 (38). ACS Publications:11214–25.
Franke, Daniel, and Dmitri I Svergun. 2009. “DAMMIF, a Program for Rapid Ab-Initio Shape Determination in Small-Angle Scattering.” Journal of Applied Crystallography 42 (2). International Union of Crystallography:342–46.
Franke, D, M V Petoukhov, P V Konarev, and A Panjkovich. 2017. “Computer Programs ATSAS 2 . 8 : A Comprehensive Data Analysis Suite for Small-Angle Scattering from Macromolecular Solutions.” International Union of Crystallography, 1212–25. https://doi.org/10.1107/S1600576717007786.
Fritz-Wolf, Karin, Sebastian Kehr, Michaela Stumpf, Stefan Rahlfs, and Katja Becker. 2011. “Crystal Structure of the Human Thioredoxin Reductase-Thioredoxin Complex.” Nature Communications 2:383.
Fritz-Wolf, Karin, Sabine Urig, and Katja Becker. 2007. “The Structure of Human Thioredoxin Reductase 1 Provides Insights into C-Terminal Rearrangements during Catalysis.” Journal of Molecular Biology 370 (1). Elsevier:116–27.

References
167
Gabadinho, José, Antonia Beteva, Matias Guijarro, Vicente Rey-Bakaikoa, Darren Spruce, Matthew W Bowler, Sandor Brockhauser, David Flot, Elspeth J Gordon, and David R Hall. 2010. “MxCuBE: A Synchrotron Beamline Control Environment Customized for Macromolecular Crystallography Experiments.” Journal of Synchrotron Radiation 17 (5). International Union of Crystallography:700–707.
Gorman, Stephen O, DANIEL T Fox, and Geoffrey M Wahl. 1991. “Recombinase-Mediated Gene Activation and Site-Specific Integration in Mammalian Cells.” Science 251 (4999). The American Association for the Advancement of Science:1351.
Grumolato, Luca, Hafida Ghzili, Maité Montero-Hadjadje, Stéphane Gasman, Jean Lesage, Yannick Tanguy, Ludovic Galas, Djida Ait-Ali, Jérôme Leprince, and Nathalie C Guérineau. 2008. “Selenoprotein T Is a PACAP-Regulated Gene Involved in Intracellular Ca2+ Mobilization and Neuroendocrine Secretion.” The FASEB Journal 22 (6). FASEB:1756–68.
Guex, Nicolas, Manuel C Peitsch, and Torsten Schwede. 2009. “Automated Comparative Protein Structure Modeling with SWISS-MODEL and Swiss-PdbViewer: A Historical Perspective.” Electrophoresis 30 (S1). Wiley Online Library.
Guinier, A, and G Fournet. 1955. “Small Angle Scattering.” Rays 14.
Hamieh, Abdallah, Dorthe Cartier, Houssni Abid, André Calas, Carole Burel, Christine Bucharles, Cedric Jehan, Luca Grumolato, Marc Landry, and Patrice Lerouge. 2017. “Selenoprotein T Is a Novel OST Subunit That Regulates UPR Signaling and Hormone Secretion.” EMBO Reports. EMBO Press, e201643504.
Hawkes, W C, and L Hornbostel. 1996. “Effects of Dietary Selenium on Mood in Healthy Men Living in a Metabolic Research Unit.” Biological Psychiatry 39 (2):121–28. https://doi.org/10.1016/0006-3223(95)00085-2.
Hidiroglou, M. 1979. “Trace Element Deficiencies and Fertility in Ruminants: A Review.” Journal of Dairy Science 62 (8):1195–1206. https://doi.org/10.3168/jds.S0022-0302(79)83400-1.
Incardona, M-F, Gleb P Bourenkov, Karl Levik, Romeu A Pieritz, Alexander N Popov, and Olof Svensson. 2009. “EDNA: A Framework for Plugin-Based Applications Applied to X-Ray Experiment Online Data Analysis.” Journal of Synchrotron Radiation 16 (6). International Union of Crystallography:872–79.
Jerabek-Willemsen, Moran, Chistoph J Wienken, Dieter Braun, Philipp Baaske, and Stefan Duhr. 2011. “Molecular Interaction Studies Using Microscale Thermophoresis.” Assay and Drug Development Technologies 9 (4). Mary Ann Liebert, Inc. 140 Huguenot Street, 3rd Floor New Rochelle, NY 10801 USA:342–53.
Jurynec, Michael J, Ruohong Xia, John J Mackrill, Derrick Gunther, Thomas Crawford, Kevin M Flanigan, Jonathan J Abramson, Michael T Howard, and David Jonah Grunwald. 2008. “Selenoprotein N Is Required for Ryanodine Receptor Calcium Release Channel Activity in Human and Zebrafish Muscle.” Proceedings of the National Academy of Sciences of the United States of America 105 (34):12485–90. https://doi.org/10.1073/pnas.0806015105.
Kabsch, Wolfgang. 1988. “Evaluation of Single-Crystal X-Ray Diffraction Data from a Position-

References
168
Sensitive Detector.” Journal of Applied Crystallography 21 (6). International Union of Crystallography:916–24.
Kalisz, Henryk M, Hans-jtirgen Hecht, Dietmar Schomburg, Rolf D Schmid, Gbf-gesellschafl Biotechnologische Forschung, Mascheroder Weg, and D- Braunschweig. 1990. “Crystallization and Preliminary X-Ray Diffraction Studies of a Deglycosylated Glucose Oxidase from Aspergillus Niger,” 207–9.
Kelley, Lawrence A, Stefans Mezulis, Christopher M Yates, Mark N Wass, and Michael J E Sternberg. 2015. “The Phyre2 Web Portal for Protein Modeling, Prediction and Analysis.” Nature Protocols 10 (6). Nature Research:845–58.
Khurshid, Sahir, Emmanuel Saridakis, Lata Govada, and Naomi E Chayen. 2014. “Porous Nucleating Agents for Protein Crystallization.” Nature Protocols 9 (7). Nature Research:1621–33.
Kikhney, Alexey G, and Dmitri I Svergun. 2015a. “A Practical Guide to Small Angle X-Ray Scattering ( SAXS ) of Flexible and Intrinsically Disordered Proteins.” FEBS Letters 589 (19). Federation of European Biochemical Societies:2570–77. https://doi.org/10.1016/j.febslet.2015.08.027.
Kikhney, Alexey G, and Dmitri I Svergun . 2015b. “A Practical Guide to Small Angle X-ray Scattering (SAXS) of Flexible and Intrinsically Disordered Proteins.” FEBS Letters 589 (19PartA). Wiley Online Library:2570–77.
Kim, Hyeonwoo, Hong Zhang, David Meng, Geoffrey Russell, Joon No Lee, and Jin Ye. 2013. “UAS Domain of Ubxd8 and FAF1 Polymerizes upon Interaction with Long-Chain Unsaturated Fatty Acids.” Journal of Lipid Research 54 (8). ASBMB:2144–52.
Kiremidjian-Schumacher, L, M Roy, H I Wishe, M W Cohen, and G Stotzky. n.d. “Supplementation with Selenium and Human Immune Cell Functions. II. Effect on Cytotoxic Lymphocytes and Natural Killer Cells.” Biological Trace Element Research 41 (1–2):115–27. Accessed October 16, 2017. http://www.ncbi.nlm.nih.gov/pubmed/7946899.
Knäblein, Jörg, Torsten Neuefeind, Frank Schneider, Andreas Bergner, Albrecht Messerschmidt, Jan Löwe, Boris Steipe, and Robert Huber. 1997. “Ta 6 Br 12 2+, a Tool for Phase Determination of Large Biological Assemblies by X-Ray Crystallography.” Elsevier.
Konarev, Petr V, and Dmitri I Svergun. 2015. “A Posteriori Determination of the Useful Data Range for Small-Angle Scattering Experiments on Dilute Monodisperse Systems.” IUCrJ 2 (3). International Union of Crystallography:352–60.
Labunskyy, Vyacheslav M, Dolph L Hatfield, Vadim N Gladyshev, Labunskyy Vm, Hatfield Dl, Gladyshev Vn, and Selenoproteins Molecular. 2014. “SELENOPROTEINS : MOLECULAR PATHWAYS AND PHYSIOLOGICAL ROLES,” 739–77. https://doi.org/10.1152/physrev.00039.2013.
Lacourciere, G M. 1999. “Biosynthesis of Selenophosphate.” BioFactors (Oxford, England) 10:237–44. https://doi.org/10.1002/biof.5520100222.
Lees, Jonathan G, Andrew J Miles, Frank Wien, and B A Wallace. 2006. “A Reference Database

References
169
for Circular Dichroism Spectroscopy Covering Fold and Secondary Structure Space.” Bioinformatics 22 (16). Oxford University Press:1955–62.
Lei, Xin Gen, Wen-Hsing Cheng, and James P McClung. 2007. “Metabolic Regulation and Function of Glutathione Peroxidase-1.” Annual Review of Nutrition 27:41–61. https://doi.org/10.1146/annurev.nutr.27.061406.093716.
Leslie, Andrew G W, and Harold R Powell. 2007. “Processing Diffraction Data with MOSFLM.” Evolving Methods for Macromolecular Crystallography 245. Springer:41–51.
Li, Shawn S-C. 2005. “Specificity and Versatility of SH3 and Other Proline-Recognition Domains: Structural Basis and Implications for Cellular Signal Transduction.” Biochemical Journal 390 (3). Portland Press Limited:641–53.
Liu, Jun, Zhengqi Zhang, and Sharon Rozovsky. 2014. “Selenoprotein K Form an Intermolecular Diselenide Bond with Unusually High Redox Potential.” FEBS Letters 588 (18). Wiley Online Library:3311–21.
Lobley, A, Lee Whitmore, and B A Wallace. 2002. “DICHROWEB: An Interactive Website for the Analysis of Protein Secondary Structure from Circular Dichroism Spectra.” Bioinformatics 18 (1). Oxford University Press:211–12.
Loregger, A., Raaben, M., Tan, J., Scheij, S., Moeton, M., van den Berg, M., Zelcer, N. 2017. Haploid Mammalian Genetic Screen Identifies UBXD8 as a Key Determinant of HMGCR Degradation and Cholesterol Biosynthesis. Arteriosclerosis, thrombosis, and vascular biology, ATVBAHA-117.
Lu, Cailing, Feichan Qiu, Haijun Zhou, Yong Peng, Wei Hao, Jialin Xu, Jiangang Yuan, Shizhen Wang, Boqin Qiang, and Caimin Xu. 2006. “Identification and Characterization of Selenoprotein K: An Antioxidant in Cardiomyocytes.” FEBS Letters 580 (22). Wiley Online Library:5189–97.
Lubos, Edith, Joseph Loscalzo, and Diane E. Handy. 2011. “Glutathione Peroxidase-1 in Health and Disease: From Molecular Mechanisms to Therapeutic Opportunities.” Antioxidants & Redox Signaling 15 (7):1957–97. https://doi.org/10.1089/ars.2010.3586.
Manavalan, Parthasarathy, and W Curtis Johnson. 1987. “Variable Selection Method Improves the Prediction of Protein Secondary Structure from Circular Dichroism Spectra.” Analytical Biochemistry 167 (1). Elsevier:76–85.
Matthews, Brian W. 1968. “Solvent Content of Protein Crystals.” Journal of Molecular Biology 33 (2). Elsevier:491–97.
McClung, James P, Carol A Roneker, Weipeng Mu, Donald J Lisk, Paul Langlais, Feng Liu, and Xin Gen Lei. 2004. “Development of Insulin Resistance and Obesity in Mice Overexpressing Cellular Glutathione Peroxidase.” Proceedings of the National Academy of Sciences of the United States of America 101 (24). National Acad Sciences:8852–57.
McCoy, Airlie J. 2007. “Solving Structures of Protein Complexes by Molecular Replacement with Phaser.” Acta Crystallographica Section D: Biological Crystallography 63 (1). International Union of Crystallography:32–41.
References
170
Mesters, Jeroen R, and Rolf Hilgenfeld. 2007. “Protein Glycosylation , Sweet to Crystal Growth ? † & DESIGN 2007,” 18–20.
Moghadaszadeh, Behzad, Branden E Rider, Michael W Lawlor, Martin K Childers, Robert W Grange, Kushagra Gupta, Steve S Boukedes, Caroline A Owen, and Alan H Beggs. 2013. “Selenoprotein N Deficiency in Mice Is Associated with Abnormal Lung Development.” The FASEB Journal 27 (4). FASEB:1585–99.
Mueller-Dieckmann, Christoph, Matthew W Bowler, Philippe Carpentier, David Flot, Andrew A McCarthy, Max H Nanao, Didier Nurizzo, Petra Pernot, Alexander Popov, and Adam Round. 2015. “The Status of the Macromolecular Crystallography Beamlines at the European Synchrotron Radiation Facility.” The European Physical Journal Plus 130 (4). Springer:70.
Mullur, Rashmi, Yan-Yun Liu, and Gregory A Brent. 2014. “Thyroid Hormone Regulation of Metabolism.” Physiological Reviews 94 (2). Am Physiological Soc:355–82.
Murshudov, Garib N, Pavol Skubák, Andrey A Lebedev, Navraj S Pannu, Roberto A Steiner, Robert A Nicholls, Martyn D Winn, Fei Long, and Alexei A Vagin. 2011. “REFMAC5 for the Refinement of Macromolecular Crystal Structures.” Acta Crystallographica Section D: Biological Crystallography 67 (4). International Union of Crystallography:355–67.
Ness, Steven R, Rudolf A G de Graaff, Jan Pieter Abrahams, and Navraj S Pannu. 2004. “CRANK: New Methods for Automated Macromolecular Crystal Structure Solution.” Structure 12 (10). Elsevier:1753–61.
Newby, Zachary E R, Joseph D O’Connell, Franz Gruswitz, Franklin A Hays, William E C Harries, Ian M Harwood, Joseph D Ho, John K Lee, David F Savage, and Larry J W Miercke. 2009. “A General Protocol for the Crystallization of Membrane Proteins for X-Ray Structural Investigation.” Nature Protocols 4 (5). Nature Publishing Group:619–37.
Nishihara, Kazuyo, Masaaki Kanemori, Masanari Kitagawa, Hideki Yanagi, and Takashi Yura. 1998. “Chaperone Coexpression Plasmids: Differential and Synergistic Roles of DnaK-DnaJ-GrpE and GroEL-GroES in Assisting Folding of an Allergen of Japanese Cedar Pollen, Cryj2, inEscherichia Coli.” Applied and Environmental Microbiology 64 (5). Am Soc Microbiol:1694–99.
Nurizzo, Didier, Trevor Mairs, Matias Guijarro, Vicente Rey, Jens Meyer, Pablo Fajardo, Joel Chavanne, J-C Biasci, Sean McSweeney, and Edward Mitchell. 2006. “The ID23-1 Structural Biology Beamline at the ESRF.” Journal of Synchrotron Radiation 13 (3). International Union of Crystallography:227–38.
Pan, J. L., & Bardwell, J. C. 2006. The origami of thioredoxin‐like folds. Protein science, 15(10), 2217-2227.
Papers, J B C, R Michael Garavito, and Shelagh Ferguson-miller. 2001. “Detergents as Tools in Membrane Biochemistry *,” 32403–7. https://doi.org/10.1074/jbc.R100031200.
Park, Saebomi, Congmin Li, Françoise Haeseleer, Krzysztof Palczewski, and James B Ames. 2014. “Structural Insights into Activation of the Retinal L-Type Ca2+ Channel (CaV1. 4) by Ca2+-Binding Protein 4 (CaBP4).” Journal of Biological Chemistry 289 (45). ASBMB:31262–73.

References
171
Pernot, P, P Theveneau, T Giraud, R Nogueira Fernandes, D Nurizzo, D Spruce, J Surr, S McSweeney, A Round, and F Felisaz. 2010. “New Beamline Dedicated to Solution Scattering from Biological Macromolecules at the ESRF.” In Journal of Physics: Conference Series, 247:12009. IOP Publishing.
Petit, Nathalie, Alain Lescure, Mathieu Rederstorff, Alain Krol, Behzad Moghadaszadeh, Ulla M Wewer, and Pascale Guicheney. 2003. “Selenoprotein N: An Endoplasmic Reticulum Glycoprotein with an Early Developmental Expression Pattern.” Human Molecular Genetics 12 (9). Oxford University Press:1045–53.
Petoukhov, Maxim V, Peter V Konarev, Alexey G Kikhney, and Dmitri I Svergun. 2007. “ATSAS 2.1–towards Automated and Web-Supported Small-Angle Scattering Data Analysis.” Applied Crystallography 40 (s1). International Union of Crystallography:s223–28.
Pitts, Matthew W, and Peter R Hoffmann. 2017. “Endoplasmic Reticulum-Resident Selenoproteins as Regulators of Calcium Signaling and Homeostasis.” Cell Calcium. Elsevier Ltd, 1–11. https://doi.org/10.1016/j.ceca.2017.05.001.
Provencher, Stephen W, and Juergen Gloeckner. 1981. “Estimation of Globular Protein Secondary Structure from Circular Dichroism.” Biochemistry 20 (1):33–37.
Putnam, Christopher D, Michal Hammel, Greg L Hura, and John A Tainer. 2007. “X-Ray Solution Scattering (SAXS) Combined with Crystallography and Computation: Defining Accurate Macromolecular Structures, Conformations and Assemblies in Solution.” Quarterly Reviews of Biophysics 40 (3). Cambridge University Press:191–285.
Reeves, M A, and P R Hoffmann. 2009. “The Human Selenoproteome: Recent Insights into Functions and Regulation.” Cellular and Molecular Life Sciences 66 (15). Springer:2457–78.
Reich, Hans J, and Robert J Hondal. 2016. “Why Nature Chose Selenium.” ACS Chemical Biology 11 (4):821–41. https://doi.org/10.1021/acschembio.6b00031.
Sanctis, Daniele de, Antonia Beteva, Hugo Caserotto, Fabien Dobias, José Gabadinho, Thierry Giraud, Alexandre Gobbo, Matias Guijarro, Mario Lentini, and Bernard Lavault. 2012. “ID29: A High-Intensity Highly Automated ESRF Beamline for Macromolecular Crystallography Experiments Exploiting Anomalous Scattering.” Journal of Synchrotron Radiation 19 (3). International Union of Crystallography:455–61.
Schneider, Thomas R, and George M Sheldrick. 2002. “Substructure Solution with SHELXD.” Acta Crystallographica Section D: Biological Crystallography 58 (10). International Union of Crystallography:1772–79.
Schweizer, Ulrich, and Clemens Steegborn. 2015. “New Insights into the Structure and Mechanism of Iodothyronine Deiodinases.” https://doi.org/10.1530/JME-15-0156.
Shchedrina, Valentina A., Robert A. Everley, Yan Zhang, Steven P. Gygi, Dolph L. Hatfield, and Vadim N. Gladyshev. 2011a. “Selenoprotein K Binds Multiprotein Complexes and Is Involved in the Regulation of Endoplasmic Reticulum Homeostasis.” Journal of Biological Chemistry 286 (50):42937–48. https://doi.org/10.1074/jbc.M111.310920.
Shchedrina, Valentina A, Robert A Everley, Yan Zhang, Steven P Gygi, Dolph L Hatfield, and Vadim

References
172
N Gladyshev. 2011b. “Selenoprotein K Binds Multiprotein Complexes and Is Involved in the Regulation of Endoplasmic Reticulum Homeostasis.” Journal of Biological Chemistry 286 (50). ASBMB:42937–48.
Shchedrina, Valentina A, Yan Zhang, Vyacheslav M Labunskyy, Dolph L Hatfield, and Vadim N Gladyshev. 2010. “Structure–function Relations, Physiological Roles, and Evolution of Mammalian ER-Resident Selenoproteins.” Antioxidants & Redox Signaling 12 (7). Mary Ann Liebert, Inc. 140 Huguenot Street, 3rd Floor New Rochelle, NY 10801 USA:839–49.
Sheldrick, George M. 2008. “A Short History of SHELX.” Acta Crystallographica Section A: Foundations of Crystallography 64 (1). International Union of Crystallography:112–22.
Slotboom, Dirk Jan, Ria H Duurkens, Kees Olieman, and Guus B Erkens. 2008. “Static Light Scattering to Characterize Membrane Proteins in Detergent Solution.” Methods 46 (2). Elsevier:73–82.
Sreerama, Narasimha, Sergei Y U Venyaminov, and Robert W Woody. 1999. “Estimation of the Number of α-Helical and β-Strand Segments in Proteins Using Circular Dichroism Spectroscopy.” Protein Science 8 (2). Cambridge University Press:370–80.
Sreerama, Narasimha, Sergei Yu Venyaminov, and Robert W Woody. 2000. “Estimation of Protein Secondary Structure from Circular Dichroism Spectra: Inclusion of Denatured Proteins with Native Proteins in the Analysis.” Analytical Biochemistry 287 (2). Elsevier:243–51.
Sreerama, Narasimha, and Robert W Woody. 1993. “A Self-Consistent Method for the Analysis of Protein Secondary Structure from Circular Dichroism.” Analytical Biochemistry 209 (1). Elsevier:32–44.
Sreerama, Narasimha, and Robert W Woody . 2000. “Estimation of Protein Secondary Structure from Circular Dichroism Spectra: Comparison of CONTIN, SELCON, and CDSSTR Methods with an Expanded Reference Set.” Analytical Biochemistry 287 (2). Elsevier:252–60.
Stokkum, Ivo H M Van, Hans J W Spoelder, Michael Bloemendal, Rienk Van Grondelle, and Frans C A Groen. 1990. “Estimation of Protein Secondary Structure and Error Analysis from Circular Dichroism Spectra.” Analytical Biochemistry 191 (1). Elsevier:110–18.
Sun, Q A, L Kirnarsky, S Sherman, and V N Gladyshev. 2001. “Selenoprotein Oxidoreductase with Specificity for Thioredoxin and Glutathione Systems.” Proceedings of the National Academy of Sciences of the United States of America 98 (7):3673–78. https://doi.org/10.1073/pnas.051454398.
Svergun, D I. 1993. “A Direct Indirect Method of Small-Angle Scattering Data Treatment.” Journal of Applied Crystallography 26 (2). International Union of Crystallography:258–67.
Svergun, Dmitri I. 1999. “Restoring Low Resolution Structure of Biological Macromolecules from Solution Scattering Using Simulated Annealing.” Biophysical Journal 76 (6). Elsevier:2879–86.
Tang, Jie, Christine Luong Yu, Steven R Williams, Eric Springman, Douglas Jeffery, Paul A Sprengeler, Alberto Estevez, et al. 2005. “Expression , Crystallization , and Three-Dimensional Structure of the Catalytic Domain of Human Plasma Kallikrein *” 280
References
173
(49):41077–89. https://doi.org/10.1074/jbc.M506766200.
Tsai, Kuo-wang, Chung-man Leung, Yi-hao Lo, Ting-wen Chen, and Wen-ching Chan. 2016. “Arm Selection Preference of MicroRNA-193a Varies in Breast Cancer.” Nature Publishing Group, no. February. Nature Publishing Group:1–13. https://doi.org/10.1038/srep28176.
Turanov, Anton A., Dan Su, and Vadim N. Gladyshev. 2006. “Characterization of Alternative Cytosolic Forms and Cellular Targets of Mouse Mitochondrial Thioredoxin Reductase.” Journal of Biological Chemistry 281 (32):22953–63. https://doi.org/10.1074/jbc.M604326200.
Vagin, Alexei, and Alexei Teplyakov. 2010. “Molecular Replacement with MOLREP.” Acta Crystallographica Section D: Biological Crystallography 66 (1). International Union of Crystallography:22–25.
Volkov, Vladimir V, and Dmitri I Svergun. 2003. “Uniqueness of Ab Initio Shape Determination in Small-Angle Scattering.” Journal of Applied Crystallography 36 (3). International Union of Crystallography:860–64.
Weekley, Claire M, and Hugh H Harris. 2013. “Which Form Is That? The Importance of Selenium Speciation and Metabolism in the Prevention and Treatment of Disease.” Chemical Society Reviews 42 (23). Royal Society of Chemistry:8870–94.
Whitmore, Lee, and B A Wallace. 2004. “DICHROWEB, an Online Server for Protein Secondary Structure Analyses from Circular Dichroism Spectroscopic Data.” Nucleic Acids Research 32 (suppl_2). Oxford University Press:W668–73.
Whitmore, Lee, and Bonnie A Wallace. 2008. “Protein Secondary Structure Analyses from Circular Dichroism Spectroscopy: Methods and Reference Databases.” Biopolymers 89 (5). Wiley Online Library:392–400.
Wittig, Ilka, Hans-Peter Braun, and Hermann Schägger. 2006. “Blue Native PAGE.” Nature Protocols 1 (1). Nature Publishing Group:418.
Wittig, Ilka, and Hermann Schägger. 2005. “Advantages and Limitations of Clear-native PAGE.” Proteomics 5 (17). Wiley Online Library:4338–46.
Wittig, Ilka, and Hermann Schägger . 2008. “Features and Applications of Blue-native and Clear-native Electrophoresis.” Proteomics 8 (19). Wiley Online Library:3974–90.
Wittwer, A J, and W M Ching. 1989. “Selenium-Containing tRNA (Glu) and tRNA (Lys) from Escherichia Coli: Purification, Codon Specificity and Translational Activity.” BioFactors (Oxford, England) 2 (1):27–34.
Wittwer, Arthur J. 1983. “Specific Incorporation of Selenium into Lysine-and Glutamate-Accepting tRNAs from Escherichia Coli.” Journal of Biological Chemistry 258 (14). ASBMB:8637–41.
Wittwer, Arthur J, Lin Tsai, Wei Mei Ching, and Thressa C Stadtman. 1984. “Identification and Synthesis of a Naturally Occurring Selenonucleoside in Bacterial tRNAs: 5-[(Methylamino) Methyl]-2-Selenouridine.” Biochemistry 23 (20):4650–55.

References
174
Yamashita, Yumiko, Heidi Amlund, Tamami Suzuki, Tatsuro Hara, Mohammed Anwar Hossain, Takeshi Yabu, Ken Touhata, and Michiaki Yamashita. 2011. “Selenoneine, Total Selenium, and Total Mercury Content in the Muscle of Fishes.” Fisheries Science 77 (4). Springer:679–86.
Yamashita, Yumiko, and Michiaki Yamashita. 2010. “Identification of a Novel Selenium-Containing Compound, Selenoneine, as the Predominant Chemical Form of Organic Selenium in the Blood of Bluefin Tuna.” Journal of Biological Chemistry 285 (24):18134–38. https://doi.org/10.1074/jbc.C110.106377.
Ye, Yihong, Yoko Shibata, Chi Yun, David Ron, and Tom A Rapoport. 2004. “A Membrane Protein Complex Mediates Retro-Translocation from the ER Lumen into the Cytosol.” Nature 429 (6994). Nature Publishing Group:841–47.
Yu, S Y, Y J Zhu, and W G Li. 1997. “Protective Role of Selenium against Hepatitis B Virus and Primary Liver Cancer in Qidong.” Biological Trace Element Research 56 (1):117–24. http://www.ncbi.nlm.nih.gov/pubmed/9152515.
Zhang, Junmin, Xinming Li, Xiao Han, Ruijuan Liu, and Jianguo Fang. 2017. “Targeting the Thioredoxin System for Cancer Therapy.” Trends in Pharmacological Sciences 38 (9). Elsevier Ltd:794–808. https://doi.org/10.1016/j.tips.2017.06.001.
Zhang, Yan, You Zhou, Ulrich Schweizer, Nicolai E Savaskan, Deame Hua, Jonathan Kipnis, Dolph L Hatfield, and Vadim N Gladyshev. 2008. “Comparative Analysis of Selenocysteine Machinery and Selenoproteome Gene Expression in Mouse Brain Identifies Neurons as Key Functional Sites of Selenium in Mammals.” Journal of Biological Chemistry 283 (4). ASBMB:2427–38.