daffodil international university thesis paper
TRANSCRIPT

DAFFODIL INTERNATIONAL UNIVERSITY
THESIS PAPER
ON
“STUSY ON ELECTRICITY GENERATION COST DETERMINATION”
Supervisor
Dr. M. Shamsul Alam
Professor and Dean
Faculty of Engineering
Daffodil International University
Prepared By
Abdur Rahman
ID: 153-33-2911
Department of EEE
Daffodil International University
ii ©DAFFODIL INTERNATIONAL UNIVERSITY
APPROVAL
This thesis titled “Study on Electricity Generation Cost Determination”, submitted by Abdur
Rahman to the Department of Electrical and Electronics Engineering, Daffodil International
University, has been accepted as satisfactory for the partial fulfillment of the requirements for
the degree of B.Sc. Electrical and Electronics Engineering and approved as to its style and
contents. The presentation has been held on
BOARD OF EXAMINERS
_______________________
Professor Dr. M. Shamsul Alam
Dean
Faculty of Engineering

iii ©DAFFODIL INTERNATIONAL UNIVERSITY
DECLARATION
We hereby declare that; this thesis has been done by us under the supervision of Dr. M.
Shamsul Alam Professor Dean Faculty of Engineering Daffodil International
University. We also declare that neither this thesis nor any part of this thesis has been
submitted elsewhere for award of any degree or diploma.
Supervised by:
Professor Dr. M. Shamsul Alam
Dean
Faculty of Engineering
Daffodil International University
Submitted by:
Abdur Rahman
ID: 153-33-2911
Department of EEE
Daffodil International University
iv ©DAFFODIL INTERNATIONAL UNIVERSITY
ACKNOWLEDGEMENT
First, we express our heartiest thanks and gratefulness to almighty Allah for his
Divine blessing makes us possible to complete this thesis successfully.
We feel grateful to and wish our profound our indebtedness to Professor Dr. M.
Shamsul Alam Dean Faculty of Engineering Daffodil International University,
Dhaka. Deep knowledge& keen interest of our supervisor in the field of Electric
power influenced us to carry out this thesis. His endless patience, scholarly
guidance, continual encouragement, constantan energetic supervision,
constructive criticism, valuable advice at all stage made it possible to complete
this thesis. We would like to thank our entire course mate in Daffodil International
University, who took part in this discuss while completing the course work.
Finally, we must acknowledge with due respect the constant support and patients
of our parents.

v ©DAFFODIL INTERNATIONAL UNIVERSITY
ABSTRACT
This thesis is on “Study on Electricity Generation Cost Determination”. In the
solicited bids, the bidders shall offer bulk power tariff based on the capacity
payment and energy payment and also provide the equivalent levelized tariff. The
capacity payment will be made in Bangladeshi currency (Taka). This will cover
debt service, return on equity, fixed operation and maintenance cost, insurance and
other fixed cost. The energy payment will be denominated in local currency to the
extent to which the variable costs are in local currency. This will cover the variable
costs of operation and maintenance, including fuel. Interconnection of IPP to
transmission system: The power will be purchased from the IPP at a specified
voltage and frequency at the outgoing terminal of the substation of the power plant.
The cost of interconnecting facilities up to outgoing terminals of the private power
project will be borne by the private power producers. Severe power crisis
compelled the Government to enter into contractual agreements for high cost
temporary solution, such as rental power and small IPPs, on an emergency basis,
much of its diesel or liquid-fuel based. This has imposed tremendous fiscal
pressure. With a power sector which is almost dependent on natural-gas fired
generation (89.22%), the country is confronting a simultaneous shortage of natural
gas and electricity. Nearly 400-800 MW of power could not be availed from the
power plants due to shortage of gas supply. Other fuels for generating low-cost,
base-load energy, such as coal, or renewable source like hydropower, are not
readily available and Government has no option but to go for fuel diversity option
for power generation.

vi ©DAFFODIL INTERNATIONAL UNIVERSITY
TABLE OF CONTENTS
TABLE OF CONTENTS
INDEX Page
No
Board of examiners ii
Declaration iii
Acknowledgement iv
Abstract v
CHAPTERS
CHAPTER 1: INTRODUCTION
1.1: Introduction 9
1.2: Electricity Generation Structure 10
1.3: Use of different types of energy 11
1.4: Power Sector in Outline Perspective Plan of Bangladesh 12
1.5: Objectives 14
1.6: Thesis Outlines 14
CHAPTER 2: ELECTRICITY GENERATION TARIFF
2.1: Tariff 15
2.2: Electricity tariff 15
2.3: Basis of electricity rates 15
2.4: Electricity generation 16
2.5: Electricity generation in Bangladesh 16
2.6: Important terms for Calculation 16
2.7: Electricity Situation at a glance 19
CHAPTER 3: PROJECT COST
3.1: Used and Useful Assets 21
3.2: Intangible Plant 21
3.3: Production Plant 22
3.4: General Plant 22
CHAPTER 4: FIXED COST
4.1: Depreciation 23
4.2: Loan 23
4.3: Export Credit Agency (ECA) Loan 24
4.4: Commercial Loan 24
4.5: Equity 25
4.6: Return on Equity 25
4.7: Regulatory Working Capital (RWC) 26
4.8: Cash Working Capital 27
4.9: Materials & Supplies Inventory 27
4.10: Pre-payments 28

vii ©DAFFODIL INTERNATIONAL UNIVERSITY
CHAPTER 5: VARIABLE COST
5.1: Fuel Cost 29
5.2: Important Terms for Calculation 29
5.3: Non-Fuel or Operation & Maintenance Cost 30
CHAPTER 6: TARIFF CALCULATION
6.1: Tariff Calculation Method 32
6.2: Assumption Data-1 33
6.3: Project Cost 34
6.4: Fixed Cost Calculation 35
6.4.1: Depreciation Calculation 35
6.4.2: ECA loan calculation 35
6.4.3: Commercial loan calculation 38
6.4.4: Equity calculation 41
6.5: Total fixed cost and per unit fixed cost 43
6.6: Variable cost calculation 44
6.6.1: Fuel Cost Calculation 45
6.6.2: Non-Fuel or Operation and Maintenance cost Calculation (July) 46
6.7: Chart of cost 47
6.8: Assumption Data-2 48
6.9: Project Cost 49
6.10: Fixed Cost Calculation 49
6.10.1: Depreciation Calculation 49
6.10.2: ECA loan calculation 50
6.10.3: Commercial loan calculation 53
6.10.4: Equity calculation 55
6.11: Total fixed cost and per unit fixed cost 57
6.12: Variable cost calculation 58
6.12.1: Fuel Cost Calculation 58
6.12.2: Non-Fuel or Operation and Maintenance cost Calculation (July) 59
6.13: Chart of cost 60
6.14: Assumption Data-3 61
6.15: Project Cost 62
6.16: Fixed Cost Calculation 63
6.16.1: Depreciation Calculation 63
6.16.2: ECA loan calculation 63
6.16.3: Commercial loan calculation 65
6.16.4: Equity calculation 68
6.17: Total fixed cost and per unit fixed cost 69
6.18: Variable cost calculation 70
6.18.1: Fuel Cost Calculation 70
6.18.2: Non-Fuel or Operation and Maintenance cost Calculation (July) 71
6.19: Chart of cost 72
6.20: Tariff Rate 73
6.21: Bill Explanation 74
CHAPTER 7: CONCLUSION
7.1: Conclusion 76

viii ©DAFFODIL INTERNATIONAL UNIVERSITY
7.2 Limitations of the Work 77
7.3: Future Scopes of the Work 78
7.4: REFERENCES 79
CHART OF TABLES
Table No. 2.1 19
Table No. 6.1: Assumption data-1 33
Table No. 6.2: Project Cost 34
Table No. 6.3: ECA loan calculation 37
Table No. 6.4: Commercial loan calculation 40
Table No. 6.5: Equity calculation 42
Table No. 6.6: Total Fixed Cost 43
Table No. 6.7: Power Production Statement 44
Table No. 6.8: Components for Non-Fuel Cost (MTk) 46
Table No. 6.9: Chart of cost 47
Table No. 6.10: Assumption Data-2 48
Table No. 6.11: Project cost 49
Table No. 6.12: ECA Loan Calculation 51
Table No. 6.13: Commercial loan calculation 54
Table No. 6.14: Equity calculation 56
Table No. 6.15: Total Fixed cost 57
Table No. 6.16: Power Production Statement 57
Table No. 6.17: Components for Non-Fuel Cost (MTk) 59
Table No. 6.18: Chart of Cost 60
Table No. 6.19: Assumption Data 3 61
Table No. 6.20: Project cost 62
Table No. 6.21: ECA Loan Calculation 64
Table No. 6.22: Commercial loan calculation 67
Table No. 6.23: Equity calculation 69
Table No. 6.24: Fixed cost 69
Table No. 6.25: Power Production Statement 70
Table No. 6.26: Components for Non-fuel cost (MTk) 71
Table No. 6.27: Chart of cost 72
Table No. 6.28: Tariff Rate 73
9 ©DAFFODIL INTERNATIONAL UNIVERSITY
CHAPTER 1
INTRODUCTION
1.1 Introduction
Electricity is the key of all modern inventions. Now-a-days it is a basic need of our everyday life.
It plays a great role wherever people live and works in industry, agriculture, and transportation etc.
The living customary and prosperity of a nation vary directly with increase in use of power. As
technology is advancing the consumption of power is steady rising. Sufficient and reliable supply of
electricity may be a major requirement for a sustained and triple-crown economic development effort
and economic condition reduction. In Bangladesh 149.4 million of the populations out of 167 million
don't have direct access to electricity and remaining 17.6 million folks have access however reliable
and quality power remains on the far side their reach (BPDB, 2018). So as to realize the expansion
rate, handiness of a fairly priced and reliable supply of electricity may be a requirement. Gift
generation of electrical power in Bangladesh isn't sufficient to satisfy the customers growing
demand. Therefore, it's uphill to make sure a relentless provides of electrical power to all or any
customers throughout the country. On the opposite hand, the present power stations have lost their
lifetime; they're not reliable for steady generation. Therefore, it's to get replaced previous generating
units in varied power stations. Shortage of power is significant issue and robust barrier for the event
of our country. Government of Bangladesh has such a large amount of limitations to line up sufficient
powerhouse. The GOVT has given high priority to development of the arena considering its
importance in overall development of the country. The GOVT has set the goal of providing electricity
to all or any voters by 2020. [1] And to achieve this goal the government has already taken many
steps. A lot of new power plants has been established.
Bangladesh's energy infrastructure is kind of tiny, inadequate and poorly managed. The per capita
energy consumption in Bangladesh is one amongst very cheap (433 kWh) within the world. Non-
commercial energy sources, equivalent to wood fuel, animal waste and crop residues square measure
calculable to account for over 1/2 the country's energy consumption. Bangladesh has tiny reserves
of oil and coal however terribly massive fossil fuel resources. Industrial energy consumption is
usually fossil fuel (around 66%), followed by oil, hydropower and coal. Electricity is that the major
supply of power for many of the country's economic activities. Bangladesh's put in electrical
generation capability is 20000 MW in 2018 [2]; 90 percent of that is taken into account to be
‘available’. 90 percent of the population has access to electricity with a per capita handiness of 433

10 ©DAFFODIL INTERNATIONAL UNIVERSITY
kWh every year. (29 0ctober, 2017)
Problems within the Bangladesh’s electrical power sector embody corruption in administration, high
system losses, and delays in completion of recent plants, low efficiencies, erratic power offer,
electricity felony, blackouts and shortages of funds for power station maintenance. Overall, the
country’s generation plants are unable to satisfy system demand over the past decade. [3]
1.2 Electricity Generation Structure
Under the Ministry of Power, Energy & Mineral Resources and Bangladesh Energy Regulatory
Commission (BERC), government companies generate electricity with many different types of
Power Plants. On the other hand, through IPP (Independent Power Producer) and through Rental
electricity is produced in the private sector which is purchased by the Government at a fixed rate.
Besides that, big industries produce 1200 MW electricity for their ow use from which additional 88
MW is supplied to the national grid. At present nearly, 63 percent of total electricity production is
produced from public entities. BPDB alone produces 46 percent of total electricity production.
Electricity Generation Structure can be shown as:
Ministry of Power, Energy & Mineral Resources
Energy & Mineral Resources Division BERC Power
Division
Power Cell CEI REB
Rural Power Co. Ltd
PBS
DPDC DESCO BPDB
PGCB
APSCL
EGCB
NWPGCL
WZPDCL
IIPs

11 ©DAFFODIL INTERNATIONAL UNIVERSITY
1.3 Use of Different Types of Energy
Natural Gas is used as primary energy in most of the present power plants. 58.45% of total electricity
is made from gas-based power plants. Besides gas, 9.69% of electricity is made by burning High
Speed Diesel (HSD), 20.69% is made by burning Furnace Oil, 3.02% is made by burning coal, 0.13%
comes from renewable energy and 6.69% is imported from India. Additionally, virtually the 1.33%
of total electricity is made from Karnafuly Hydro power station. Because of the rise of multiple use
of gas in chemical, industries, factories and alternative sectors it's unfeasible to produce adequate
amount gas (extracted from the present gas fields) to fulfill the demand of the facility plants.
Insufficiency of gas causes 500MW less production of electricity from existing power plants.
From the above discussion it is evident that in the power sector the following issues are to be
addressed with due importance at the moment -
➢ Inadequacy of supply of electricity compared to demand.
➢ Dependency on single energy (gas) for electricity generation.
➢ Investment or participation of private sector in electricity generation is at the
minimum level.
➢ To meet the increasing demand of electricity huge amount of investment is
needed, the lion's share of which should come from private sector or from public- private
partnership.
➢ Shortage of electricity is not attributed to generation alone but
transmission and distribution are also responsible for the existing short fall.

12 ©DAFFODIL INTERNATIONAL UNIVERSITY
➢ Limited use of renewable energy.
The Perspective arrange of the GOVT and also the Work arrange framed in per the angle arrange
towards mitigation of the on top of mentioned issues square measure mentioned within the following
chapters.
1.4 Power Sector in Outline Perspective Plan of Bangladesh
Following Vision for Power Sector Development has been mentioned in the Outline Perspective Plan
of Bangladesh (2010-2021) –
➢ Electricity Generation in the country by 2010: 6500 MW
➢ Electricity Generation in the country by 2013: 8500 MW
➢ Electricity Generation in the country by 2015: 11,500 MW
➢ Electricity Generation in the country by 2018: 14000 MW
➢ Electricity Generation in the country by 2021: 20,000 MW
➢ Electricity for all by 2021
There is a planning of the Government of achieving the following objectives for making the vision
a reality. The Following issues have been identified to reach the objectives –
➢ To ensure energy security.
➢ Making the power sector financially viable and able to facilitate economic
growth.
➢ Increasing the sector’s efficiency.
➢ Introducing a new corporate culture in the power sector entities.
➢ Improving the reliability and quality of electricity supply.
➢ Using natural gas including imported Liquefied Natural Gas (LNG), coal and
oil as the primary fuels for electricity generation.
➢ Increasing private sector participation to mobilize finance.
➢ Matching supply and demand for electricity.
13 ©DAFFODIL INTERNATIONAL UNIVERSITY
➢ To ensure energy security for all.
➢ To reduce the consumption of natural gas, thereby releasing gas for use as
fertilizer, or to increase the use of coal for electricity production to release gas for alternative use.
➢ Finalization of the coal extraction plan.
➢ Reasonable cost-effective price policy for gas, coal and electricity, these
being under government control.
➢ Energy mix for electricity generation.
➢ Energy conservation.
➢ Promotion of renewable.
➢ Efficiency of the power sector.
➢ Reduction of system loss.
➢ Importation of LNG.
To address these issues the following Constraints, Possibilities & Strategies are identified –
1.4.1 Constraints
➢ Insufficiency of fuel.
➢ Absence of adequate public and private investment in power generation.
➢ Absence of Cost Reflective Tariffs.
➢ Absence of Primary Energy Supply Chain.
1.4.2 Possibilities
➢ Coal-based power plants using domestic and imported coal.
➢ Rup-pur Nuclear Power Plant.
➢ Availability of new gas both Off-shore and On-shore.
➢ Public-Private Partnership Projects.
➢ Prospect of participation of local investors in the sector.
➢ Medium-term agreement to import LNG and steps to be taken.

14 ©DAFFODIL INTERNATIONAL UNIVERSITY
1.4.3 Strategies
➢ To diversify the use of primary energy, such as - gas, coal and liquid fuel,
for power generation.
➢ To have provision for dual fuel in power plants wherever possible.
➢ To increase power generation through renewable sources, such as solar,
wind, small hydro etc.
➢ To implement nuclear fuel-based power plant.
➢ To finance power generation projects through Public-Private Partnership,
government funding for Independent Power Producer (IPP).
➢ To increase sector efficiency, reform measures must be implemented. [4]
1.5 Objective
The Objective of this thesis study is to calculate the generating price of an electrical power station
that’s tariff calculation. The most objective is to be told concerning tariff and the way to calculate
generating price of an electrical station. This thesis can facilitate to seek out the parameters that
square measure caused to maximize the generating price. To do this, following terms need to be
calculated one in every of them is that the fastened prices of generation, like Depreciation
Expenses, Loan, Equity & regulative assets (RWC) and another one is Variable Costs that
embody Fuel price and Non-Fuel price. Adding these 2 prices (Fixed Cost & Variable Costs) can
result in the full generating price. Then it’ll be simple to seek out the parameters that have an effect
on the generating price largely and to reduce the generating price by taking necessary steps.
1.6 Thesis Outline
This thesis study is organized as follows –
Chapter-1 introduces the electricity generation structure, use of different types of energy,
power sector in outline perspective plan of Bangladesh and the objective of this thesis study.
Chapter-2 reviews the electricity generation tariff and electricity generation in Bangladesh.
Chapter-3 discusses about the project cost of power plant and its categories.
Chapter-4 explains about the fixed cost of electricity generation along with its parameters. Chapter-
5 describes about the variable cost and its parameters with few important terms.
Chapter-6 analyzes tariff calculation of electricity generation and presents the result.
Chapter-7 concludes with some recommendations, limitations and future scopes of the work.

15 ©DAFFODIL INTERNATIONAL UNIVERSITY
CHAPTER 2
ELECTRICITY GENERATION TARIFF
2.1 Tariff
Tariff means that a document, approved by the Commission, listing the terms and conditions of
service and a schedule of rates, beneath that licensee services are provided.
2.2 Electricity Tariff
Electricity tariff (sometimes cited as electricity evaluation or the value of electricity) varies widely
from country to country, and should vary considerably from neck of the woods to neck of the woods
among a particular country. There square measure several reasons that account for these variations
in value. The price of power generation depends mostly on the kind and market value of the fuel
used, government subsidies, government and business regulation, and even native weather patterns.
2.3 Basis of Electricity Rates
Electricity prices vary between countries and can even vary within a single region, or distribution
network of the same country. In standard regulated monopoly markets, electricity rates typically
vary for residential, commercial and industrial customers. Prices for any single class of electricity
customer can also vary by time-of-day, or by the capacity, or nature of the supply circuit (e.g. 5 KW,
12 KW, 18 KW, 24 KW are typical in some of the large developed countries); for industrial
customers, single-phase vs. 3-phase, etc. If a specific market allows real-time dynamic pricing, a
more recent option in limited markets to date typically following the introduction of electronic
metering, prices can even vary between times of low and high electricity network demand.
The actual electricity rate (Cost per unit of electricity) that a customer pays can often be heavily
dependent on customer charges, particularly for small customers (e.g. residential users). [3]
16 ©DAFFODIL INTERNATIONAL UNIVERSITY
2.4 Electricity Generation
Electricity generation is the process of generating electrical power from other sources of primary
energy.
The fundamental principles of electricity generation were discovered during the 1820s and early
1830s by the British individual physicist. His basic technique continues to be used nowadays –
‘Electricity is generated by the movement of a loop of wire, or disc of copper between the poles of a
magnet.’ For electrical utilities, it's the primary method within the delivery of electricity to shoppers.
The opposite processes, electricity transmission, distribution and electric power storage and recovery
mistreatment pumped-storage ways are commonly administrated by the electrical power trade.
Electricity is most frequently generated at an influence station by electro-mechanical generators,
primarily driven by heat engines fueled by chemical combustion, or fission however additionally by
different means that cherish the K.E. of flowing water and wind. Different energy sources embrace
star electrical phenomenon, geothermic power and electro-chemical battery. [5]
2.5 Electricity Generation in Bangladesh
There are some isolated diesel power stations at overseas and islands that don't seem to be
connected with the National Grid. Terminal voltage of various generators is eleven potential units,
11KV, 11.5KV and 15.75 KV.
Different types of power plants generate electricity and synchronize it with the national grid. Within
the Jap Zone (Eastern aspect of Jamuna river), electricity is generated from autochthonous gas and a
little proportion through hydro power. Within the Western Zone, Coal and foreign liquid fuel is
employed for generation of electricity. The fuel price per unit generation within the Western Zone is
far above that of the Jap Zone. Therefore, as a policy, low price electricity generated within the Jap
Zone is transferred to the Western Zone through the 230 potential unit East-West inhume
instrumentation cable. [3]
2.6 Important Terms for Calculation
Availability Factor: It means the ratio of (a) the number of hours a generating unit is
mechanically able to produce power in a given period to (b) the number of hours in the period. A

17 ©DAFFODIL INTERNATIONAL UNIVERSITY
factor less than 100% indicates planned or unplanned outages for maintenance. A plant’s
availability factor will be higher than its capacity factor, because a plant is not used in every hour it
is available.
Capacity Factor: It means the ratio of (a) the net amount of electricity a plant actually
generates in a given time period to (b) the amount that the plant could have produced if it had operated
continuously at full power operation during the same period. Capacity factor is dependent on both
the mechanical availability of the plant and the economic desirability to run the plant given the
particular cost to run it.
Commission: It means the Bangladesh Energy Regulatory Commission.
Effective Date: Means the date on which a proposed tariff schedule with rates is permitted
by the Commission to become effective.
Independent Power Producer/Small Power Producer (IPP/SPP):
Independent Power Producer/Small Power Producer (IPP/SPP) is a non-government owned
Generation Company. The Government of Bangladesh solicits selects and contracts with Independent
Power Producers (IPP) and Small Power Producers (SPP) under the terms and conditions of its policies
as published. Under the terms of the Bangladesh Energy Regulatory Commission (BERC) Act, all
IPP/SPP are required to obtain a license from the BERC and have tariff rates charged-to-consumers
approved by the BERC.
Kilowatt (KW): Means a measure of electricity defined as a unit of demand or
capacity, measured as 1 kilowatt (1,000 watts) of power generated.
Kilowatt-Hour (KWh): It means a measure of electricity defined as a unit of work or
energy, measured as 1 kilowatt (1,000 watts) of power expended for 1 hour.
Load Factor: Load Factor means the ratio of the average load to peak load served by a
plant or power system during a specified time interval. A higher load factor indicates higher use of

18 ©DAFFODIL INTERNATIONAL UNIVERSITY
the generating resources.
Rate: It means the authorized charges, per unit or level of consumption, for a specified time
period for any of the classes of generation licensee services provided to a customer.
Regulations: Means any regulations developed and promulgated by the Commission
according to the Bangladesh Energy Regulatory Commission Act, 2003 (Act No-13 of 2003),
including subsequent amendments to the Act.
Schedule: It means a statement of the pricing format of electricity and the terms and
conditions governing its applications.
Terms and Conditions of Service: Means a published document included as part of a
licensee’s tariff that establishes the licensee’s terms and conditions for providing service to a
customer, discussing such issues as the conditions under which connection will be provided to a
customer metering, disconnection policies, payment instructions, consumer complaints procedures,
etc. [6]

19 ©DAFFODIL INTERNATIONAL UNIVERSITY
2.7 Electricity Situation at a Glance
Table No-2.1: Electricity Situation at a Glance [7]
Generation Capacity 17340 MW
Maximum Generation (19-09-2018) 11623 MW
Present Demand 11405 MW
Transmission Line(400kV) 698 Ckt. K.M
Transmission Line(230kV) 3343 Ckt. K.M
Transmission Line(132kV) 7082 Ckt. K.M
Distribution line (September 2016) 341000 KM
Transmission and distribution losses 12.19%
Per capita generation (29 October, 2017) 433KWh
Per capita generation (September 2016) 75.9 Million
Electricity Growth 12%

20 ©DAFFODIL INTERNATIONAL UNIVERSITY
Figure-2.1: Electricity Generation, Consumption & Installed Capacity of Bangladesh [7].
Year-wise Electricity Generation
Figure-2.2: Year-wise Electricity Generation [7]
0
5000
10000
15000
20000
25000
2014 2015 2016 2017 2018
Electricity Generation, Consumption and Installed Capacity of Bangladesh
Installed Generation Consumption
42964698.5
3728
4643 4615
5666 5695
89459414
11573
0
2000
4000
6000
8000
10000
12000
14000
2009 2010 2011 2012 2013 2014 2015 2016 2017 2018
Maximum Generation(MW)

21 ©DAFFODIL INTERNATIONAL UNIVERSITY
CHAPTER 3
PROJECT COST
3.1 Used and Useful Assets
In creating application for a tariff rate, or a modification within the tariff’s terms and conditions, the
electrical generation licensee should file a schedule that shows the first acquisition value of the
quality, the accumulated depreciation, cyberspace quality price once reduction for accumulated
depreciation, and also the quantity of the present depreciation to be enclosed within the Tariff Rate
application for the check year. [6]
Generally, these assets must be used and useful for serving the licensee’s customers. The asset
accounts considered for a generation licensee are broken into three categories –
➢ Intangible Plant.
➢ Production plant.
➢ General plant.
3.2 Intangible Plant
An asset that is not physical in nature. Company holding (items equivalent to patents, trademarks,
copyrights, and business methodologies), goodwill and complete recognition square measure all
common intangible assets in today's marketplace. If an organization enters a legal agreement to work
beneath another company's patent, with no plans of extending the agreement, it'd have a restricted
life and would be classified as an explicit quality. [8]
Intangible Assets represent rights, privileges, and competitive advantages owned by a business. They
are intangible only in the sense that they have no physical substance. Very often, their legal status
may be of critical importance to the longevity of a company. Examples of intangible assets include:
patents, copyrights, franchises, trademarks, and goodwill. Similar to plant assets (Which depreciate)
and natural resources (Which deplete), intangibles are amortized. Normally, however, no

22 ©DAFFODIL INTERNATIONAL UNIVERSITY
Accumulated Amortization account is used; the credit is made to the Asset account itself. Intangible
plant would consist of organization, franchises and consents, and miscellaneous intangible plant. [9]
3.3 Production Plant
Production plant would come with land and land rights, structures and enhancements, accent
electrical instrumentation and miscellaneous power station instrumentation. Steam production plants
would to boot embody boiler plant instrumentation, engines and engine driven generators and turbo
generator units. electricity plant would any embody reservoirs, dams and waterways, water wheels,
turbines and generators, roads, railroads and bridges. Star thermal production units would also
embody concentrating collectors, radiation observance instrumentation, engines and engine driven
generators and turbo generator units. Star electrical phenomenon production units would come with
the electrical phenomenon panels, mounting racks, radiation observance instrumentation, balance of
system instrumentation and energy storage devices. Wind production units would come with the
wind-powered generators, towers, wind observance instrumentation and balance of system
instrumentation. Different production would any embody fuel holders, producers and accessories,
prime movers and generators.
3.4 General Plant
A power station, additionally said as an influence plant or powerhouse and generally generating
station or generating plant, is associate industrial facility for the generation of electrical power. Most
power stations contain one or a lot of generators, a rotating machine that converts mechanical power
into power. General plant would include land and land rights, structures and improvements, office
furniture and equipment, transportation equipment, stores equipment, tools, shop and garage
equipment, laboratory equipment, power operated equipment, communication equipment,
miscellaneous equipment and other tangible property. [6]

23 ©DAFFODIL INTERNATIONAL UNIVERSITY
CHAPTER 4
FIXED COST
4.1 Depreciation
The amount of depreciation enclosed as a value is that the total annual depreciation for all used
and helpful assets for the check year. The quantity of the present depreciation is
accessorial as associate expense in total prices at the present value of the assets and isn't
subject to rating based upon any consequent revision of the quality valuation. [6]
Corporations record depreciation on all plant assets except land. Since the quantity of
depreciation is also relatively large, depreciation expense is commonly a big consider deciding
profits. For this reason, most financial plan users have an interest within the quantity of, and the
methods accustomed reason, a company’s depreciation expense. Depreciation is that the
quantity of plant quality price allotted to every accounting amount profiting from the plant
asset’s use. Depreciation may be a method of allocation, not valuation. Eventually, all assets
except land wear out or become therefore inadequate or passes that they're sold-out or discarded;
so, firms must record depreciation on each plant quality except land. They record depreciation
even when the value of a plant quality quickly rises higher than its original price as a result of
eventually the quality is not any longer helpful to its current owner. [10]
Annual Depreciation = 𝑻𝒐𝒕𝒂𝒍 𝑪𝒂𝒑𝒊𝒕𝒂𝒍−𝑺𝒂𝒍𝒗𝒂𝒈𝒆 𝑽𝒂𝒍𝒖𝒆
𝑷𝒍𝒂𝒏𝒕 𝑳𝒊𝒇𝒆
4.2 Loan
In finance, a loan may be a debt provided by associate entity (Organization or Individual) entity
at a rate of interest, and proved by a note that specifies, among alternative things, the principal
quantity, of interest and date of reimbursement. A loan entails the reallocation of the topic
asset(s) for an amount of your time, between the loaner and also the receiver
In a loan, the borrower initially receives or borrows an amount of money, known as the

24 ©DAFFODIL INTERNATIONAL UNIVERSITY
principal, from the loaner associated is indebted to pay back or repay an equal quantity of cash
to the loaner at a later time.
The loan is mostly provided at a value, noted as interest on the debt that provides associate
incentive for the loaner to have interaction within the loan. During a legal loan, every of those
obligations and restrictions is enforced by contract, which might conjointly place the receiver
below extra restrictions called loan covenants. Though this text focuses on financial loans, in
observe any material object could be season. [11]
Commercial Loan
Figure-4.1: Types of Loan.
4.3 Export Credit Agency (ECA) Loan
A financial organization or agency that gives trade funding to domestic corporations for his
or her international activities.
Credit agencies (ECAs) give funding services akin to guarantees, loans and insurance to those
corporations so as to push exports within the domestic country. The first objective of ECAs is
to get rid of the chance and uncertainty of payments to exporters once commerce outside their
country. ECAs take the chance off from the bourgeois and shift it to themselves, for a premium.
ECAs conjointly underwrite the industrial and political risks of investments in overseas markets
that are usually deemed to be high risk. [12]
4.4 Commercial Loan
A commercial loan is a debt-based funding arrangement between a business and a financial
institution such as a bank, typically used to fund major capital expenditures and/or cover
operational costs that the company may otherwise be unable to afford, as opposed to a loan
Loan
ECA Loan
Commercial Loan

25 ©DAFFODIL INTERNATIONAL UNIVERSITY
made to an individual. [13]
Loan advanced to a business rather than to a client. Business loans are sometimes for a
short-run, secured (Backed by a Collateral) or unsecured, and are typically advanced for finance
instrumentality, machinery, or inventory. Banks sometimes need the business borrowers to
submit monthly and annual money statements, and to take care of insurance cowl on the
supported item. [14]
4.5 Equity
Equity is the difference between the value of the assets/interest and the cost of the liabilities of
something owned. For example, if someone owns a machine worth $15,000 but owes $5,000 on
that machine, the machine represents $10,000 equity. Equity can be negative if liability exceeds
assets. Equity is the value of an asset less the value of all liabilities on that asset.
When starting a business, the owners put funds into the business to finance various business
operations. Under the model of a private limited company, the business and its owners are
separate entities, so the business is considered to owe these funds to its owners as a liability in
the form of share capital. Throughout the business's existence, the value (equity) of the business
will be the difference between its assets (The value it provides) and its liabilities (The costs,
such as the initial investments, which its owners and other creditors put into it). [15]
4.6 Return on Equity
The return on equity represents investor’s expectations of the returns of an investment of
comparable risks elsewhere in that country.
The Commission’s preference in decisive the come back on equity could be a type of a capital
quality evaluation model (CAPM). It assumes that the value of equity is that the sum of a riskless
rate of come back, and a comeback to compensate investors for market risk. It's the responsibility
of the retailer applying for a tariff rate amendment to advocate a rate of come back on equity
and supply adequate support to justify that Tariff Rate.
26 ©DAFFODIL INTERNATIONAL UNIVERSITY
4.7 Regulatory Working Capital (RWC)
The last major element is regulatory working capital. In licensee tariff rate design, ‘regulatory
working capital’ has a different meaning than the term ‘working capital’ in normal accounting.
Regulatory working capital is a measure of licensee funding of daily
operating expenditures and a variety of non-plant investments that are necessary to sustain the
ongoing operations of the licensee. The tariff rate establishment factor of regulatory working
capital is designed to identify these ongoing funding requirements, on average, over a test year.
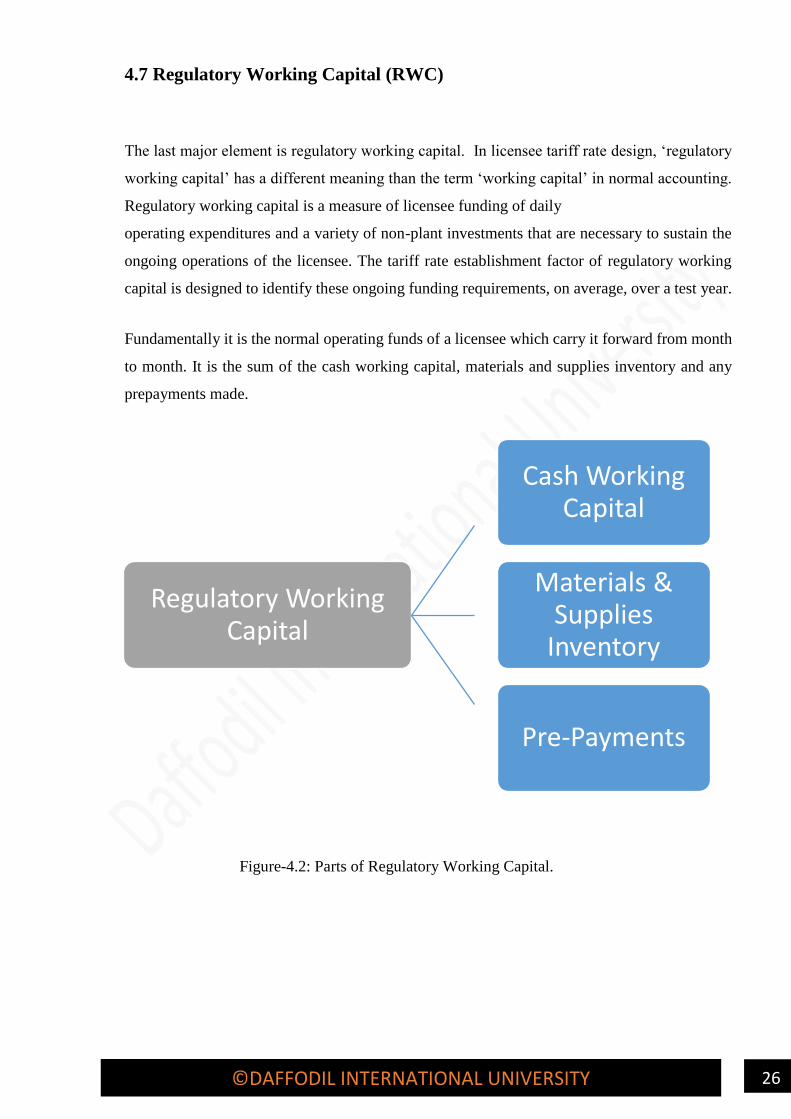
Fundamentally it is the normal operating funds of a licensee which carry it forward from month
to month. It is the sum of the cash working capital, materials and supplies inventory and any
prepayments made.
Figure-4.2: Parts of Regulatory Working Capital.
Regulatory Working Capital
Cash Working Capital
Materials & Supplies
Inventory
Pre-Payments

27 ©DAFFODIL INTERNATIONAL UNIVERSITY
4.8 Cash Working Capital
Cash working capital represents the licensee provided cash required for payment of operation
expenses, to maintain compensating cash balances and similar needs between the time the
expenditures are necessary to provide the services and the time collections are received for the
services.
For a licensee, the formula calculates 1/6th (Approximately 60 days) of operation and
maintenance expenses for one year. For a well-managed natural monopoly, this computation
represents the average time and amount that the licensee must provide cash for operations before
collections are received from the service. This calculation would apply for generation.
Cash Working Capital = 𝑨𝒏𝒏𝒖𝒂𝒍 𝑶𝒑𝒆𝒓𝒂𝒕𝒊𝒐𝒏 & 𝑴𝒂𝒊𝒏𝒕𝒂𝒏𝒆𝒏𝒄𝒆 𝑪𝒐𝒔𝒕
𝟔
4.9 Materials & Supplies Inventory
Materials and supplies are the licensee’s inventory value for material and supplies necessary to
meet daily requirements of providing service. A 12-month average for the test year is used.
Materials and supplies should be summarized for tariff rate setting purposes into two categories
-Operation & Maintenance and Construction.
Materials & Supplies Inventory = 𝑻𝒐𝒕𝒂𝒍 𝒂𝒎𝒐𝒖𝒏𝒕 𝒐𝒇 𝟏 𝒚𝒆𝒂𝒓 𝑴𝒂𝒕𝒆𝒓𝒊𝒂𝒍𝒔 𝒂𝒏𝒅 𝑺𝒖𝒑𝒑𝒍𝒊𝒆𝒔 𝑪𝒐𝒔𝒕
𝟏𝟐

28 ©DAFFODIL INTERNATIONAL UNIVERSITY
4.10 Pre-payments
Pre-payments are created ahead of the amount to that they apply and embrace things cherish
pre-paid rents, insurance and taxes. The amounts ordinarily allowed are supported identical
standards printed on top of for Materials & provides Inventories. the common monthly
mensuration amount ought to cover quite one take a look at year review, since bound pre- paid
expenses (Such as pre-paid insurance) usually are created for periods in far more than one year.
Total the pre-paid balances over regardless of the longest cycle of anyone element of the pre-
payment item and so average it for the take a look at year amount. [6]
Pre- Payments = 𝑶𝒏𝒆 𝑨𝒗𝒆𝒓𝒂𝒈𝒆 𝒀𝒆𝒂𝒓 𝒐𝒇 𝑷𝒓𝒆𝒑𝒂𝒊𝒅 𝑰𝒕𝒆𝒎
𝟏𝟐
Example:
Regulatory Working Capital for Generation
Cash Working Capital
(One-Sixth of Operation and Maintenance Expense) 2,586,360,000 Tk
Materials & Supplies 2,122,140,000 Tk
Pre-payments 45,000,000 Tk
Total Regulatory Working Capital 4,753,500,000 Tk
Page 17

29 ©DAFFODIL INTERNATIONAL UNIVERSITY
CHAPTER 5
VARIABLE COST
5.1 Fuel Cost
In electricity generation, fuel cost is the amount of cost that calculates for per unit generation.
Each generation unit shall have a tariff rate part which is fuel cost, involved in the generation of
the electricity. [6]
Total Fuel Cost = Fuel Price × Fuel Consumption
5.2 Important Terms for Calculation
Plant Factor: Plant Factor (The net capacity factor of a power plant) is the ratio of
KWh generated o the total amount of energy the plant produced during a period of time to the
product of plant capacity and the number of hours for which the plant was in operation. Capacity
factors vary greatly depending on the type of fuel that is used and the design of the plant.
Plant Factor = 𝑮𝒆𝒏𝒆𝒓𝒂𝒕𝒆𝒅 𝑬𝒍𝒆𝒄𝒕𝒓𝒊𝒄𝒊𝒕𝒚 𝒊𝒏 𝑴𝑾𝒉
𝑶𝒑𝒆𝒓𝒂𝒕𝒊𝒏𝒈 𝑪𝒂𝒑𝒂𝒄𝒊𝒕𝒚(𝑴𝑾)×𝑯𝒐𝒖𝒓𝒔 𝒊𝒏 𝑪𝒖𝒓𝒓𝒆𝒏𝒕 𝑴𝒐𝒏𝒕𝒉
A base load power plant with a capacity of 1,000 Megawatts (MW) might produce 648,000
Megawatt-Hours (MWh) in a 30-day month. The plant factor is 0.9 or 90%
Plant Factor = 𝟔𝟒𝟖𝟎𝟎𝟎
𝟏𝟎𝟎𝟎×𝟑𝟎×𝟐𝟒 = 0.90 = 90%
Heat Rate: Heat Rate means a measure of the thermal efficiency of a power plant. The
measure is expressed in British thermal units per net Kilowatt-Hour of electricity. The lower

30 ©DAFFODIL INTERNATIONAL UNIVERSITY
the plant’s heat rate, the higher the plant’s efficiency, because it requires fewer units of fuel
input to produce a KWh of electricity.
Heat Rate = 𝑪𝒂𝒍𝒐𝒓𝒊𝒇𝒊𝒄 𝑽𝒂𝒍𝒖𝒆 𝒐𝒇 𝑭𝒖𝒆𝒍×𝑭𝒖𝒆𝒍 𝑪𝒐𝒏𝒔𝒖𝒎𝒑𝒕𝒊𝒐𝒏
𝑮𝒆𝒏𝒆𝒓𝒂𝒕𝒆𝒅 𝑬𝒍𝒆𝒄𝒕𝒓𝒊𝒄𝒊𝒕𝒚
Calorific Value: The amount of heat produced by the complete combustion of a material or
fuel. Measured in units of energy per amount of material, e.g. KJ/Kg.
In other words, calorific value (CV) is a measure of heating power and is dependent upon the
composition of the gas. The CV refers to the amount of energy released when a known volume
of gas is completely combusted under specified conditions.
Calorific Value of Gas: The CV of gas, which is dry, gross and measured at standard
conditions of temperature and pressure, is usually quoted in Mega Joules per Cubic Meter
(MJ/m3).
5.3 Non-Fuel or Operation & Maintenance Cost
This is the annual cost associated with the Salary & Allowance or Personnel Expenses, Repairs
& Maintenance of Plant and Machineries, Lube oil, Grease & Vaseline, Administrative and
others expenses of a power plant. Included are costs related to Operation & Maintenance,
Employee Expenses and Miscellaneous costs such as Administrative Expenses. [16]

31 ©DAFFODIL INTERNATIONAL UNIVERSITY
Figure-5.1: Parts of Non-Fuel or Operation & Maintenance Cost.
Page 19
Non-Fuel or Operation & Maintanance Cost
Salary & Allowance Or Personnel Expenses
Office Expenses
Exchange Rate Fluctuation
Asset Insurance Fund
General & Administrative Exp.
VOMP

32 ©DAFFODIL INTERNATIONAL UNIVERSITY
CHAPTER 6
TARIFF CALCULATION
6.1 Tariff Calculation Method
Each generation unit shall have a two-part tariff rate. One part will consist of the fixed cost and
the other part will consist of the variable cost involved in the generation of the electricity.
For tariff calculation of Electricity Generation, following terms need to be calculated –
1. Fixed Cost
➢ Annual Depreciation
➢ ECA Loan Calculation
➢ Commercial Loan Calculation
➢ Equity Calculation
➢ Regulatory Working Capital
2. Variable Cost
➢ Fuel Cost
➢ Non-Fuel or Operation & Maintenance Cost
This study develops an analytical model for electricity production cost accounting of power
plants. The advantage of this approach is that it expressly examines the underlying structure of
it. This study summarizes the tariff calculation of electricity generation. I’ve collected
necessary information of many power plants from BERC (Bangladesh Energy regulative
Commission). Then consistent with the quality formulas I actually have calculated the cost
accounting details of power plants as well as fixed costs (Depreciation, Loan, Equity and
regulative operating Capital) and Variable price (Fuel price and Non-Fuel or Operation &
Maintenance Cost). And consistent with these prices is actually have determined monthly tariff
price of electricity generation for many power plants.

33 ©DAFFODIL INTERNATIONAL UNIVERSITY
6.2 Assumption Data-1
Name of Power Plant & Unit: Haripur CDC 360 MW Power Plant
Category of Technology: CC
Type of Fuel: Gas
For tariff calculation of Haripur CDC 360 MW Power Plant, the assumption
data is given below –
Table No 6.1: Assumption Data-1
SL
NO
Parameter/Assumption/Boundary Condition Unit
1 Net Capacity of the Power Plant 360 Watt
2 Project Cost (USD 845.15/kW) 25697.29284 MTk
3 Exchange Rate 84.46 BDT/USD
4 Month Operation Hours 730 Hours
5 Calorific Value of Gas 1002.32 Kj/Cft
6 Fuel Price 79.82 Tk/KCft
7 Equity 30%
8 Debt (70% of Total Rate Base) 70%
9 Foreign/ECA Loan Facilities (60% of Total Debt) 60%
10 Local/Commercial Loan facilities (40% of Total Debt) 40%
11 Return on Equity 15%
12 Rate of Interest of ECA Loan Facilities 10%
13 Rate of Interest of Commercial Loan Facilities 10%
14 Effective Plant Life 15 Years
15 Loan Repayment 10 Years
16 Salvage Value 5%
17 Cash working capital 59.1667 MTk
18 Materials & Supplies 0.0000
19 Pre-payments 0.0778 MTk
20 Interest on Regulatory Working Capital 10%

34 ©DAFFODIL INTERNATIONAL UNIVERSITY
6.3 Project Cost
Table No. 6.2: Project Cost
SL
No Item
Cost(10^6Tk) Cost Tk
Share
(%) 1 Intangible Plant 688.7 688687448.5 2.68%
2 Production Plant or Plant
machinery and equipment 0.0
2.1
Plant and machinery
C&F,11/33 KV sub-
station, Power Evacuation
Line
21308.2 21308195221.0 82.92%
3 General Plant 0.0
3.1 Land and Land
Development 326.4 326355619.3 1.27%
3.2 Infrastructure (Building &
Civil Works) 853.2 853150122.5 3.32%
3.3 Office Furniture and
Equipment 25.7 25697292.8 0.10%
3.4 Laboratory Equipment 12.8 12848646.4 0.05%
3.5 Electric Equipment 12.8 12848646.4 0.05%
3.6 Transportation &
Communication 174.7 174741591.4 0.68%
3.7 Miscellaneous Equipment 12.8 12848646.4 0.05%
3.8 Others tangible
Equipment 12.8 12848646.4 0.05%
3.9 Interest During
Construction 1066.4 1066437653.0 4.15%
3.1O Contingencies 1202.6 1202633305.0 4.68%
4 Total Project Cost
(1+2+3) 25697.3 25697292839.2 100.00%

35 ©DAFFODIL INTERNATIONAL UNIVERSITY
6.4 Fixed Cost Calculation
6.4.1 Depreciation Calculation
Total project cost = 25697.29284*10^6 Tk
Salvage value = 5%
Plant life = 15 years
Annual depreciation =Total Capital − Salvage Value
Plant Life
= 25697.29284∗10^6−(25697.29284∗10^6∗5%)
15
= 1627495213.15 TK
Monthly depreciation =1627495213.15
12
= 135624601.10 TK
6.4.2 ECA Loan Calculation
Given that,
Loan/Debt amount is 70% of Used & Useful Asset = 25697.29284×10^6×0.70
= 1.8*1010 Tk
60% of total debt amount that is ECA loan = 1.8*1010 × 0.60
= 1.079*1010 Tk
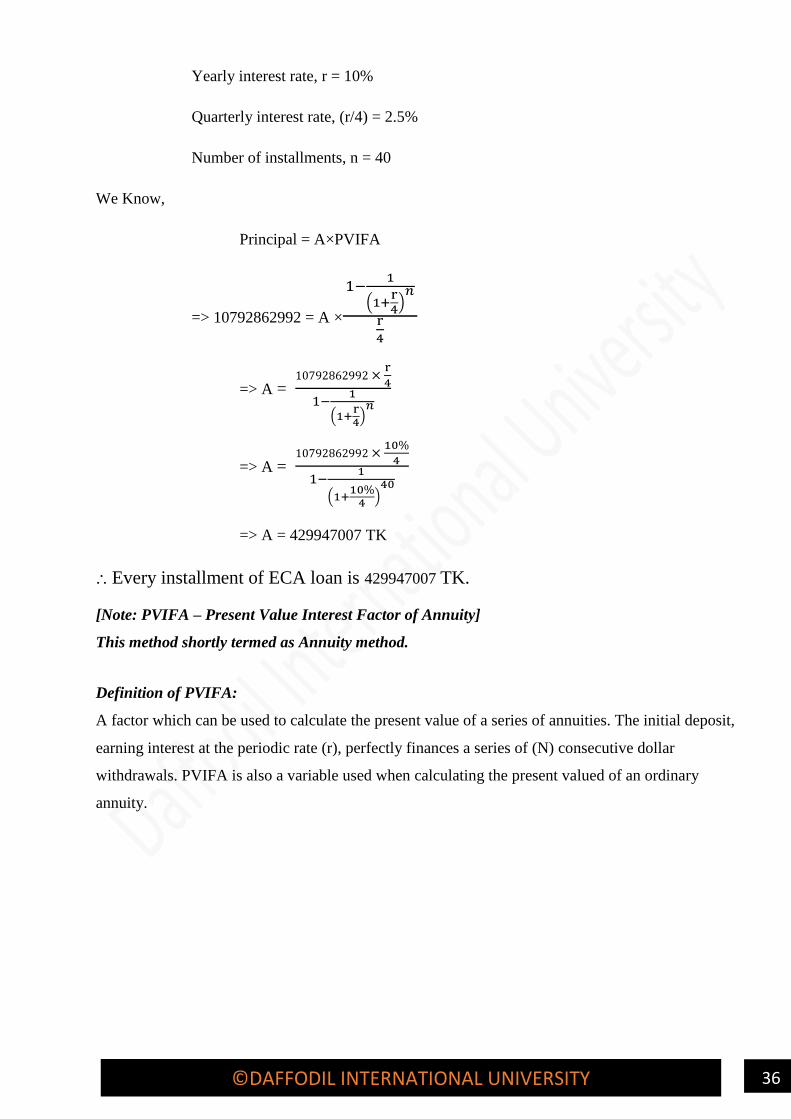
⸫ Principal, P = 10792862992 Tk
36 ©DAFFODIL INTERNATIONAL UNIVERSITY
Yearly interest rate, r = 10%
Quarterly interest rate, (r/4) = 2.5%
Number of installments, n = 40
We Know,
Principal = A×PVIFA
=> 10792862992 = A ×
1−1
(1+r4
)𝑛
r
4
=> A = 10792862992 ×
r
4
1−1
(1+r4
)𝑛
=> A = 10792862992 ×
10%
4
1−1
(1+10%
4)
40
=> A = 429947007 TK
⸫ Every installment of ECA loan is 429947007 TK.
[Note: PVIFA – Present Value Interest Factor of Annuity]
This method shortly termed as Annuity method.
Definition of PVIFA:
A factor which can be used to calculate the present value of a series of annuities. The initial deposit,
earning interest at the periodic rate (r), perfectly finances a series of (N) consecutive dollar
withdrawals. PVIFA is also a variable used when calculating the present valued of an ordinary
annuity.

37 ©DAFFODIL INTERNATIONAL UNIVERSITY
Table No.6.3: ECA Loan Calculation
Q
ua
rter
s
Pri
nci
pal
Beg
inn
ing
(Tk
) (1
)
Inst
all
men
t
(Tk
) (2
)
Qu
art
erly
Inte
rest
(T
k)
(3)=
(1)
x
(.0
25
)
Pri
nci
pal
Rep
ay
men
t
(Tk
) (4
)= (
2)
– (
3)
Pri
nci
pal
En
din
g (
Tk
)
(5)=
(1
) –
(4)
Yea
rly
Inte
rest
(T
k)
1st 10792862992 429947007 269821575 160125432 10632737561
2nd 10632737561 429947007 265818439 164128568 10468608993
3rd 10468608993 429947007 261715225 168231782 10300377211
4th 10300377211 429947007 257509430 172437576 10127939635 1054864669
5th 10127939635 429947007 253198491 176748516 9951191119
6th 9951191119 429947007 248779778 181167229 9770023890
7th 9770023890 429947007 244250597 185696409 9584327481
8th 9584327481 429947007 239608187 190338820 9393988661 985837053
9th 9393988661 429947007 234849717 195097290 9198891371
10th 9198891371 429947007 229972284 199974722 8998916649
11th 8998916649 429947007 224972916 204974090 8793942558
12th 8793942558 429947007 219848564 210098443 8583844116 909643481
13th 8583844116 429947007 214596103 215350904 8368493212
14th 8368493212 429947007 209212330 220734676 8147758535
15th 8147758535 429947007 203693963 226253043 7921505492
16th 7921505492 429947007 198037637 231909369 7689596123 825540034
17th 7689596123 429947007 192239903 237707104 7451889019
18th 7451889019 429947007 186297225 243649781 7208239238
19th 7208239238 429947007 180205981 249741026 6958498212
20th 6958498212 429947007 173962455 255984551 6702513661 732705565
21st 6702513661 429947007 167562842 262384165 6440129496
22nd 6440129496 429947007 161003237 268943769 6171185727
23rd 6171185727 429947007 154279643 275667363 5895518363
24th 5895518363 429947007 147387959 282559048 5612959316 630233681
25th 5612959316 429947007 140323983 289623024 5323336292
26th 5323336292 429947007 133083407 296863599 5026472692
27th 5026472692 429947007 125661817 304285189 4722187503
28th 4722187503 429947007 118054688 311892319 4410295184 517123895

38 ©DAFFODIL INTERNATIONAL UNIVERSITY
29th 4410295184 429947007 110257380 319689627 4090605557
30th 4090605557 429947007 102265139 327681868 3762923689
31st 3762923689 429947007 94073092 335873914 3427049775
32nd 3427049775 429947007 85676244 344270762 3082779012 392271855
33rd 3082779012 429947007 77069475 352877531 2729901481
34th 2729901481 429947007 68247537 361699470 2368202012
35th 2368202012 429947007 59205050 370741956 1997460055
36th 1997460055 429947007 49936501 380010505 1617449550 254458564
37th 1617449550 429947007 40436239 389510768 1227938782
38th 1227938782 429947007 30698470 399248537 828690245
39th 828690245 429947007 20717256 409229751 419460494
40th 419460494 429947007 10486512 419460494 0 102338477
Return on ECA Loan per year (Sum of yearly interest rate/10) = 640501727 Tk
Return on ECA Loan per month (Return on loan per year/12) = 53375143.9Tk
6.4.3 Commercial Loan Calculation
Given that,
Loan/Debt amount is 70% of Used & Useful Asset = 25697.29284×10^6×0.70
= 1.8*1010 Tk
40% of total debt amount that is Commercial loan = 1.8*1010 × 0.40
= 7195241995 Tk
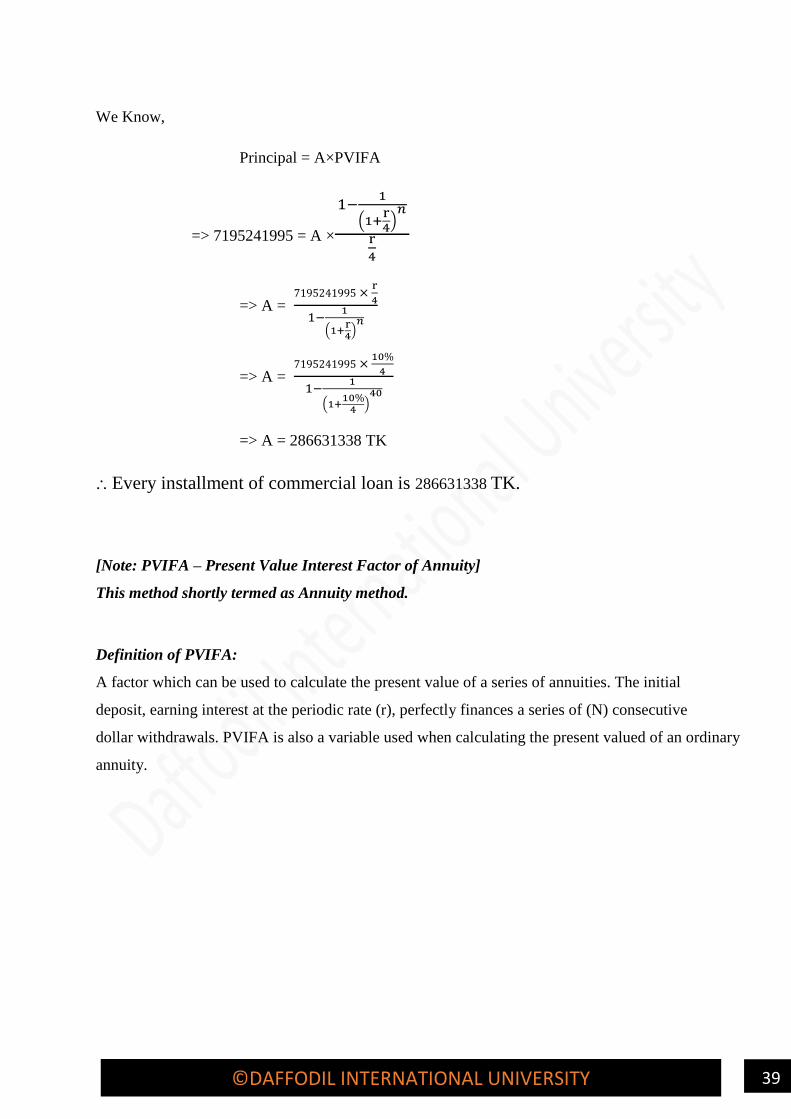
⸫ Principal, P = 7195241995 Tk
Yearly interest rate, r = 10%
Quarterly interest rate, (r/4) = 2.5%
Number of installments, n = 40
39 ©DAFFODIL INTERNATIONAL UNIVERSITY
We Know,
Principal = A×PVIFA
=> 7195241995 = A ×
1−1
(1+r4
)𝑛
r
4
=> A = 7195241995 ×
r
4
1−1
(1+r4
)𝑛
=> A = 7195241995 ×
10%
4
1−1
(1+10%
4)
40
=> A = 286631338 TK
⸫ Every installment of commercial loan is 286631338 TK.
[Note: PVIFA – Present Value Interest Factor of Annuity]
This method shortly termed as Annuity method.
Definition of PVIFA:
A factor which can be used to calculate the present value of a series of annuities. The initial
deposit, earning interest at the periodic rate (r), perfectly finances a series of (N) consecutive
dollar withdrawals. PVIFA is also a variable used when calculating the present valued of an ordinary
annuity.

40 ©DAFFODIL INTERNATIONAL UNIVERSITY
Table No6..4: Commercial Loan Calculation
Q
ua
rters
Pri
nci
pal
Beg
inn
ing
(Tk
) (1
) I
nst
all
men
t
(Tk
) (2
)
Qu
art
erly
Inte
rest
(T
k)
(3)
=(1
) x
(.0
25
) P
rin
cip
al
Rep
ay
men
t
(Tk
) (4
) =
(2)
– (
3)
P
rin
cip
al
En
din
g (
Tk
)
(5)=
(1
) –
(4)
Y
earl
y
Inte
rest
(T
k)
1st 7195241995 286631338 179881050 106750288 7088491707
2nd 7088491707 286631338 177212293 109419045 6979072662
3rd 6979072662 286631338 174476817 112154521 6866918141
4th 6866918141 286631338 171672954 114958384 6751959757 703243113
5th 6751959757 286631338 168798994 117832344 6634127413
6th 6634127413 286631338 165853185 120778152 6513349260
7th 6513349260 286631338 162833732 123797606 6389551654
8th 6389551654 286631338 159738791 126892546 6262659108 657224702
9th 6262659108 286631338 156566478 130064860 6132594247
10th 6132594247 286631338 153314856 133316482 5999277766
11th 5999277766 286631338 149981944 136649394 5862628372
12th 5862628372 286631338 146565709 140065628 5722562744 606428987
13th 5722562744 286631338 143064069 143567269 5578995475
14th 5578995475 286631338 139474887 147156451 5431839024
15th 5431839024 286631338 135795976 150835362 5281003661
16th 5281003661 286631338 132025092 154606246 5126397415 550360023
17th 5126397415 286631338 128159935 158471402 4967926013
18th 4967926013 286631338 124198150 162433187 4805492825
19th 4805492825 286631338 120137321 166494017 4638998808
20th 4638998808 286631338 115974970 170656368 4468342441 488470377
21st 4468342441 286631338 111708561 174922777 4293419664
22nd 4293419664 286631338 107335492 179295846 4114123818
23rd 4114123818 286631338 102853095 183778242 3930345575
24th 3930345575 286631338 98258639 188372698 3741972877 420155787
25th 3741972877 286631338 93549322 193082016 3548890861
26th 3548890861 286631338 88722272 197909066 3350981795
27th 3350981795 286631338 83774545 202856793 3148125002

41 ©DAFFODIL INTERNATIONAL UNIVERSITY
28th 3148125002 286631338 78703125 207928213 2940196789 344749263
29th 2940196789 286631338 73504920 213126418 2727070371
30th 2727070371 286631338 68176759 218454578 2508615793
31st 2508615793 286631338 62715395 223915943 2284699850
32nd 2284699850 286631338 57117496 229513842 2055186008 261514570
33rd 2055186008 286631338 51379650 235251688 1819934321
34th 1819934321 286631338 45498358 241132980 1578801341
35th 1578801341 286631338 39470034 247161304 1331640037
36th 1331640037 286631338 33291001 253340337 1078299700 169639043
37th 1078299700 286631338 26957492 259673845 818625855
38th 818625855 286631338 20465646 266165691 552460163
39th 552460163 286631338 13811504 272819834 279640330
40th 279640330 286631338 6991008 279640330 0 68225651
Return on Commercial Loan per year (Sum of yearly interest rate/10) = 427001151.6 Tk
Return on Commercial Loan per month (Return on loan per year/12) = 35583429.3 Tk
6.4.4 Equity Calculation
Given that,
Equity amount is 30% of total rate base.
Since total rate base is = 1.8*1010 Tk
Therefore, Equity amount = 1.8*1010 × 0.30
= 7709187852 TK
Principal, P = 7709187852 Tk
Return on equity rate, r = 15%
Effective plant life, n = 15 years

42 ©DAFFODIL INTERNATIONAL UNIVERSITY
We Know,
Principal = A×PVIFA
=> 7709187852 = A ×
1−1
(1+r)𝑛
r
4
=> A = 7709187852 ×r
1−1
(1+r)𝑛
=> A = 7709187852 × 15%
1−1
(1+15%)15
=> A = 1318402585 TK
[Note: PVIFA – Present Value Interest Factor of Annuity]
This method shortly termed as Annuity method.
Definition of PVIFA:
A factor which can be used to calculate the present value of a series of annuities. The initial
deposit, earning interest at the periodic rate (r), perfectly finances a series of (N) consecutive
dollar withdrawals. PVIFA is also a variable used when calculating the present valued of an ordinary
annuity.
Table No. 6.5: Equity Calculation
Qu
art
ers
Pri
nci
pal
Beg
inn
ing
(Tk
) (1
)
In
stall
men
t
(Tk
) (2
)
Yea
rly
Inte
rest
(T
k)
(3)=
(1
) x
(0.1
5)
P
rin
cip
al
Rep
ay
men
t
(Tk
) (4
)= (
2)
– (
3)
P
rin
cip
al
En
din
g (
Tk
)
(5)=
(1
) –
(4)
1st 7709187852 1318402585 1156378178 162024407 7547163445
2nd 7547163445 1318402585 1132074517 186328068 7360835377
3rd 7360835377 1318402585 1104125307 214277278 7146558099
4th 7146558099 1318402585 1071983715 246418870 6900139229
5th 6900139229 1318402585 1035020884 283381700 6616757528
6th 6616757528 1318402585 992513629 325888955 6290868573
7th 6290868573 1318402585 943630286 374772299 5916096274
8th 5916096274 1318402585 887414441 430988144 5485108131

43 ©DAFFODIL INTERNATIONAL UNIVERSITY
9th 5485108131 1318402585 822766220 495636365 4989471765
10th 4989471765 1318402585 748420765 569981820 4419489946
11th 4419489946 1318402585 662923492 655479093 3764010853
12th 3764010853 1318402585 564601628 753800957 3010209896
13th 3010209896 1318402585 451531484 866871100 2143338796
14th 2143338796 1318402585 321500819 996901765 1146437030
15th 1146437030 1318402585 171965555 1146437030 0
Return on Equity per year (Sum of yearly interest rate/15) = 804456728 Tk
Return on Equity per month (Return on Equity per year/12) = 67038060.7 Tk
6.5 Total Fixed Cost & Per Unit Fixed Cost
Table No.6.6: Total Fixed Cost
Item Monthly Yearly
Depreciation expense
(Tk) 135624601.10 1627495213.15
ECA Loan (Tk) 53375143.95 640501727.39
Commercial Loan (Tk) 35583429.30 427001151.59
Return on equity (Tk) 67038060.66 804456727.92
Regulatory Working
Capital (Tk) 493703.56 5924442.74
Total amount (Tk) 292114938.57 3505379262.79
Total amount (MTk) 292.11 3505.38
44 ©DAFFODIL INTERNATIONAL UNIVERSITY
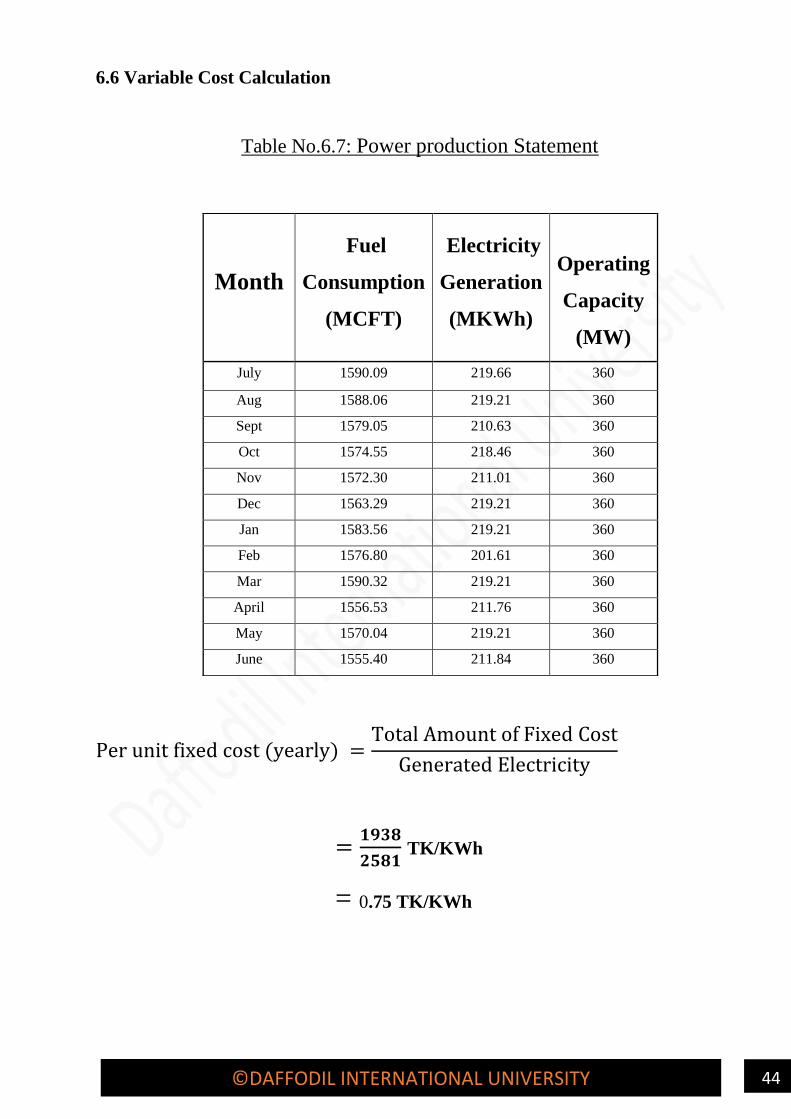
6.6 Variable Cost Calculation
Table No.6.7: Power production Statement
Per unit fixed cost (yearly) =Total Amount of Fixed Cost
Generated Electricity
=𝟏𝟗𝟑𝟖
𝟐𝟓𝟖𝟏 TK/KWh
= 0.75 TK/KWh
Month
Fuel
Consumption
(MCFT)
Electricity
Generation
(MKWh)
Operating
Capacity
(MW)
July 1590.09 219.66 360
Aug 1588.06 219.21 360
Sept 1579.05 210.63 360
Oct 1574.55 218.46 360
Nov 1572.30 211.01 360
Dec 1563.29 219.21 360
Jan 1583.56 219.21 360
Feb 1576.80 201.61 360
Mar 1590.32 219.21 360
April 1556.53 211.76 360
May 1570.04 219.21 360
June 1555.40 211.84 360
45 ©DAFFODIL INTERNATIONAL UNIVERSITY
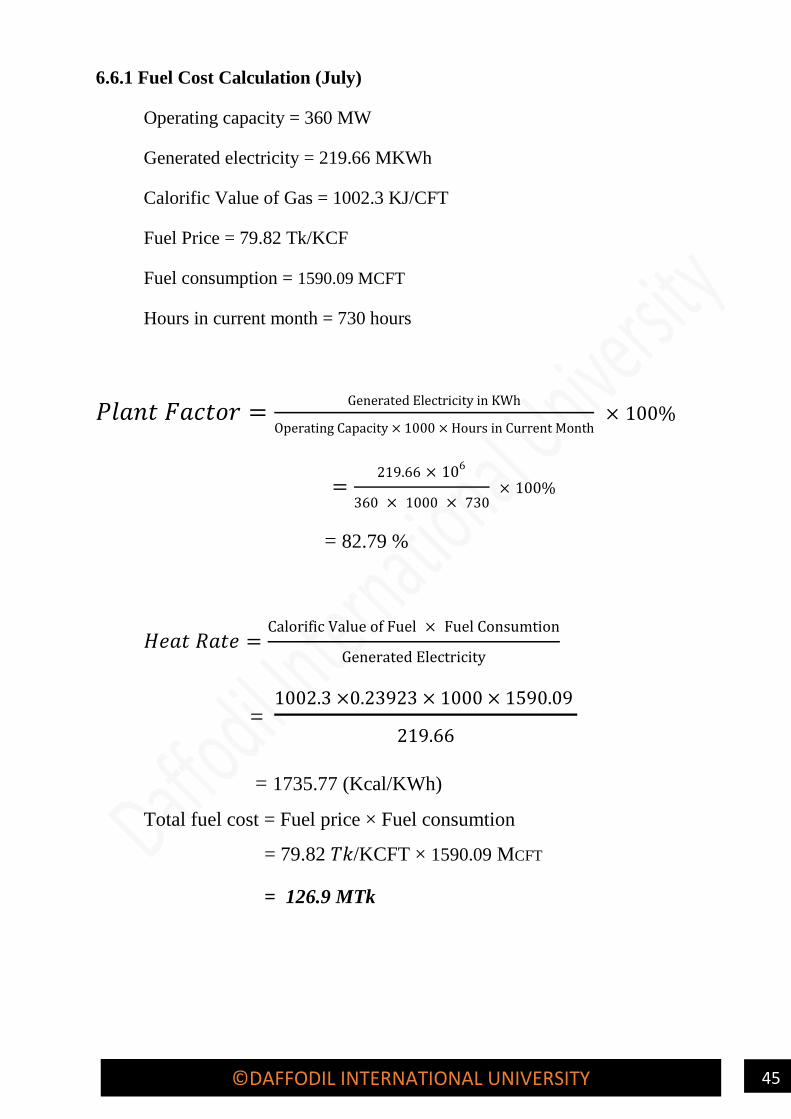
6.6.1 Fuel Cost Calculation (July)
Operating capacity = 360 MW
Generated electricity = 219.66 MKWh
Calorific Value of Gas = 1002.3 KJ/CFT
Fuel Price = 79.82 Tk/KCF
Fuel consumption = 1590.09 MCFT
Hours in current month = 730 hours
𝑃𝑙𝑎𝑛𝑡 𝐹𝑎𝑐𝑡𝑜𝑟 =Generated Electricity in KWh
Operating Capacity × 1000 × Hours in Current Month × 100%
=219.66 × 10⁶
360 × 1000 × 730 × 100%
= 82.79 %
𝐻𝑒𝑎𝑡 𝑅𝑎𝑡𝑒 =Calorific Value of Fuel × Fuel Consumtion
Generated Electricity
= 1002.3 ×0.23923 × 1000 × 1590.09
219.66
= 1735.77 (Kcal/KWh)
Total fuel cost = Fuel price × Fuel consumtion
= 79.82 𝑇𝑘/KCFT × 1590.09 MCFT
= 126.9 MTk

46 ©DAFFODIL INTERNATIONAL UNIVERSITY
Fuel cost per unit energy =Total Fuel Cost
Generated Electricity
=126.9
219.66
=0.578 Tk/KWh
6.6.2 Non-Fuel or Operation & Maintenance Cost Calculation (July)
Table No. 6.8: Components for Non-Fuel Cost (MTk)
Mo
nth
To
tal
Per
son
nel
Ex
p. (M
TK
)
Off
ice
Ex
pen
ses
(MT
K)
Ex
cha
ng
e
Rate
Flu
ctu
ati
on
(MT
K)
Ass
ets
Insu
ran
ce
(MT
K)
F
un
d G
ener
al
&
Ad
min
istr
ati
v
e E
xp
. (M
TK
) V
OM
P
(MT
K)
To
tal
No
n-
Fu
el C
ost
(MT
K)
July 6.90 0.40 12.90 0.08 8.10 1.43 29.80
Aug 6.87 0.40 12.85 0.08 8.06 1.42 29.68
Sept 6.82 0.39 12.75 0.08 8.01 1.41 29.46
Oct 6.68 0.39 12.50 0.08 7.84 1.39 28.87
Nov 6.92 0.40 12.95 0.08 8.13 1.43 29.92
Dec 6.64 0.38 12.42 0.08 7.80 1.38 28.69
Jan 6.88 0.40 12.86 0.08 8.08 1.42 29.72
Feb 6.87 0.40 12.85 0.08 8.06 1.42 29.68
Mar 6.91 0.40 12.93 0.08 8.11 1.43 29.86
April 6.89 0.40 12.90 0.08 8.09 1.43 29.78
May 6.87 0.40 12.85 0.08 8.06 1.42 29.68
June 6.91 0.40 12.92 0.08 8.11 1.43 29.85
Generated Electricity = 219.66 MKwh
Total Non-Fuel or O & M Cost = 29.80 MTk
Per Unit Non-Fuel or O & M Cost = 𝑁𝑜𝑛−𝐹𝑢𝑒𝑙 𝐶𝑜𝑠𝑡 (𝑀𝑇𝐾)
𝐺𝑒𝑛𝑒𝑟𝑎𝑡𝑒𝑑 𝐸𝑙𝑒𝑐𝑡𝑟𝑖𝑐𝑖𝑡𝑦(𝑀𝐾𝑤ℎ)
47 ©DAFFODIL INTERNATIONAL UNIVERSITY
= 29.80 𝑀𝑇𝑘
219.66 𝑀𝐾𝑤ℎ
=0.136 Tk/Kwh
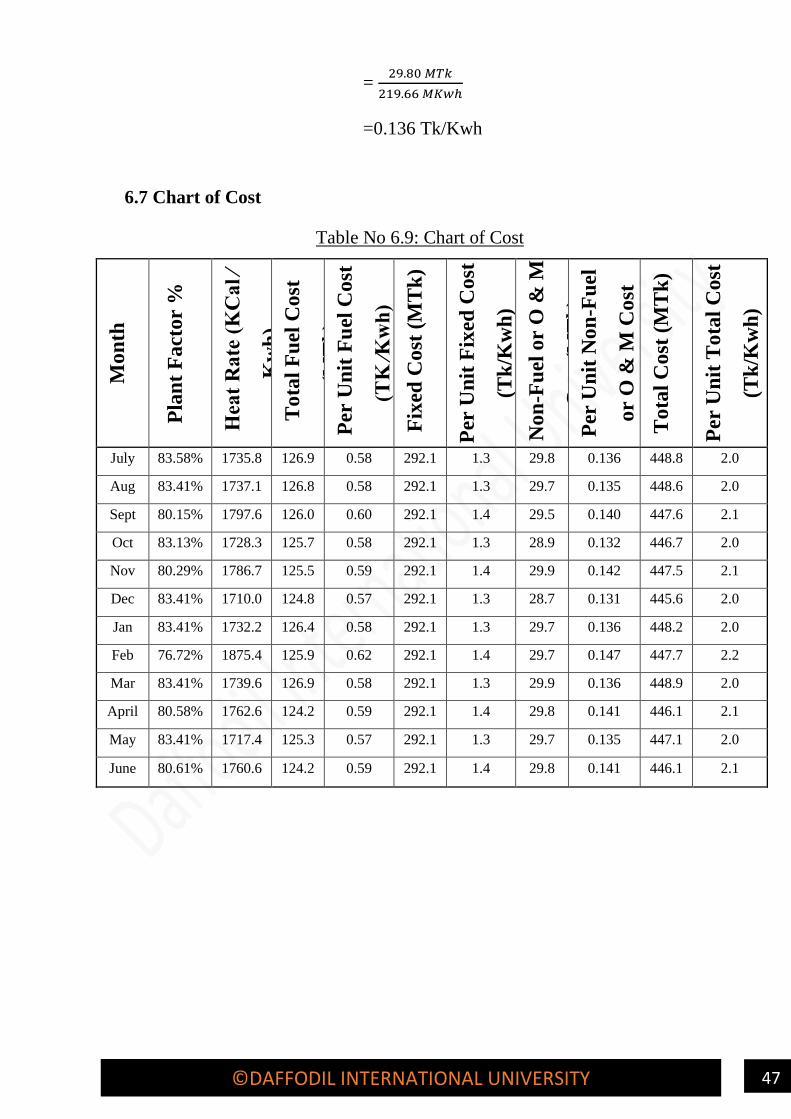
6.7 Chart of Cost
Table No 6.9: Chart of Cost
Mo
nth
Pla
nt
Fact
or
%
Hea
t R
ate
(K
Ca
l ⁄
Kw
h)
To
tal
Fu
el C
ost
(MT
k)
Per
Un
it F
uel
Co
st
(TK
⁄Kw
h)
Fix
ed C
ost
(M
Tk
)
Per
Un
it F
ixed
Co
st
(Tk
/Kw
h)
No
n-F
uel
or
O &
M
Co
st (
MT
k)
P
er U
nit
No
n-F
uel
or
O &
M C
ost
(Tk
/KW
H)
T
ota
l C
ost
(M
Tk
)
Per
Un
it T
ota
l C
ost
(Tk
/Kw
h)
July 83.58% 1735.8 126.9 0.58 292.1 1.3 29.8 0.136 448.8 2.0
Aug 83.41% 1737.1 126.8 0.58 292.1 1.3 29.7 0.135 448.6 2.0
Sept 80.15% 1797.6 126.0 0.60 292.1 1.4 29.5 0.140 447.6 2.1
Oct 83.13% 1728.3 125.7 0.58 292.1 1.3 28.9 0.132 446.7 2.0
Nov 80.29% 1786.7 125.5 0.59 292.1 1.4 29.9 0.142 447.5 2.1
Dec 83.41% 1710.0 124.8 0.57 292.1 1.3 28.7 0.131 445.6 2.0
Jan 83.41% 1732.2 126.4 0.58 292.1 1.3 29.7 0.136 448.2 2.0
Feb 76.72% 1875.4 125.9 0.62 292.1 1.4 29.7 0.147 447.7 2.2
Mar 83.41% 1739.6 126.9 0.58 292.1 1.3 29.9 0.136 448.9 2.0
April 80.58% 1762.6 124.2 0.59 292.1 1.4 29.8 0.141 446.1 2.1
May 83.41% 1717.4 125.3 0.57 292.1 1.3 29.7 0.135 447.1 2.0
June 80.61% 1760.6 124.2 0.59 292.1 1.4 29.8 0.141 446.1 2.1
48 ©DAFFODIL INTERNATIONAL UNIVERSITY
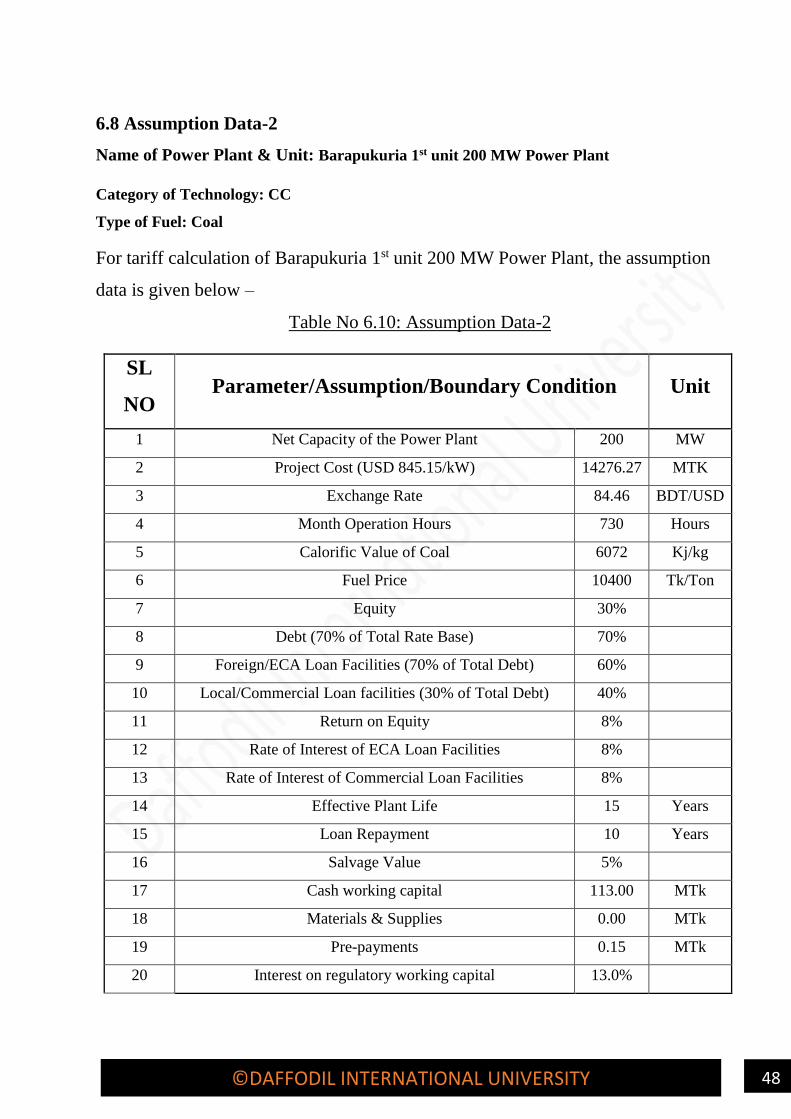
6.8 Assumption Data-2
Name of Power Plant & Unit: Barapukuria 1st unit 200 MW Power Plant
Category of Technology: CC
Type of Fuel: Coal
For tariff calculation of Barapukuria 1st unit 200 MW Power Plant, the assumption
data is given below –
Table No 6.10: Assumption Data-2
SL
NO Parameter/Assumption/Boundary Condition Unit
1 Net Capacity of the Power Plant 200 MW
2 Project Cost (USD 845.15/kW) 14276.27 MTK
3 Exchange Rate 84.46 BDT/USD
4 Month Operation Hours 730 Hours
5 Calorific Value of Coal 6072 Kj/kg
6 Fuel Price 10400 Tk/Ton
7 Equity 30%
8 Debt (70% of Total Rate Base) 70%
9 Foreign/ECA Loan Facilities (70% of Total Debt) 60%
10 Local/Commercial Loan facilities (30% of Total Debt) 40%
11 Return on Equity 8%
12 Rate of Interest of ECA Loan Facilities 8%
13 Rate of Interest of Commercial Loan Facilities 8%
14 Effective Plant Life 15 Years
15 Loan Repayment 10 Years
16 Salvage Value 5%
17 Cash working capital 113.00 MTk
18 Materials & Supplies 0.00 MTk
19 Pre-payments 0.15 MTk
20 Interest on regulatory working capital 13.0%

49 ©DAFFODIL INTERNATIONAL UNIVERSITY
6.9 Project Cost
Table No. 6.11: Project Cost
SL
No Item
Cost(10^6Tk) Cost (Tk)
Share
(%) 1 Intangible Plant 382.6041378 382604137.8 2.68%
2 Production Plant or Plant
machinery and equipment 0
2.1
Plant and machinery
C&F,11/33 KV sub-
station, Power
Evacuation Line
11837.88624 11837886240 82.92%
3 General Plant 0
3.1 Land and Land
Development 181.3086772 181308677.2 1.27%
3.2 Infrastructure (Building
& Civil Works) 473.97229 473972290 3.32%
3.3 Office Furniture and
Equipment 14.2762738 14276273.8 0.10%
3.4 Laboratory Equipment 7.138136899 7138136.899 0.05%
3.5 Electric Equipment 7.138136899 7138136.899 0.05%
3.6 Transportation &
Communication 97.07866183 97078661.83 0.68%
3.7 Miscellaneous Equipment 7.138136899 7138136.899 0.05%
3.8 Others tangible
Equipment 7.138136899 7138136.899 0.05%
3.9 Interest During
Construction 592.4653627 592465362.7 4.15%
3.1O Contingencies 668.1296137 668129613.7 4.68%
4 Total Project Cost
(1+2+3) 14276.27 14276273805 100%
6.10 Fixed Cost Calculation
6.10.1 Depreciation Calculation
Total project cost = 14276.27*10^6 Tk
Salvage value = 5%
Plant life = 15 years

50 ©DAFFODIL INTERNATIONAL UNIVERSITY
Annual depreciation =Total Capital − Salvage Value
Plant Life
= 14276.27∗10^6−(14276.27∗10^6∗5%)
15
= 904164007.6 TK
Monthly depreciation =904164007.6
12
= 75347000.64 TK
6.10.2 ECA Loan Calculation
Given that,
Loan/Debt amount is 70% of Used & Useful Asset = 14276.27×10^6×0.70
= 9993389000 Tk
60% of total debt amount that is ECA loan = 9993389000× 0.60
= 5996034998 Tk
⸫ Principal, P = 5996034998 Tk
Yearly interest rate, r = 8%
Quarterly interest rate, (r/4) = 2%
Number of installments, n = 40
We Know,
Principal = A×PVIFA
=> 5996034998 = A ×
1−1
(1+r4
)𝑛
r
4
=> A = 5996034998 ×
r
4
1−1
(1+r4
)𝑛

51 ©DAFFODIL INTERNATIONAL UNIVERSITY
=> A = 5996034998 ×
8%
4
1−1
(1+8%4
)40
=> A = 219189543 TK
⸫ Every installment of ECA loan is 219189543 TK.
[Note: PVIFA – Present Value Interest Factor of Annuity]
This method shortly termed as Annuity method.
Definition of PVIFA:
A factor which can be used to calculate the present value of a series of annuities. The initial deposit,
earning interest at the periodic rate (r), perfectly finances a series of (N) consecutive dollar
withdrawals. PVIFA is also a variable used when calculating the present valued of an ordinary
annuity.
Table No.6.12: ECA Loan Calculation
Qu
art
ers
Pri
nci
pal
Beg
inn
ing
(Tk
) (1
)
Inst
all
men
t
(Tk
) (2
)
Qu
art
erly
Inte
rest
(Tk
) (3
)=(1
)
x (
.02
5)
P
rin
cip
al
Rep
ay
men
t
(Tk
) (4
)= (
2)
– (
3)
Pri
nci
pal
En
din
g (
Tk
)
(5)=
(1
) –
(4)
Yea
rly
Inte
rest
(Tk
)
1st 5996034998 219189543 119920700 99268843 5896766155
2nd 5896766155 219189543 117935323 101254220 5795511935
3rd 5795511935 219189543 115910239 103279304 5692232630
4th 5692232630 219189543 113844653 105344891 5586887740 467610914
5th 5586887740 219189543 111737755 107451788 5479435951
6th 5479435951 219189543 109588719 109600824 5369835127
7th 5369835127 219189543 107396703 111792841 5258042286
8th 5258042286 219189543 105160846 114028697 5144013589 433884022
9th 5144013589 219189543 102880272 116309271 5027704318
10th 5027704318 219189543 100554086 118635457 4909068861
11th 4909068861 219189543 98181377 121008166 4788060695
12th 4788060695 219189543 95761214 123428329 4664632366 397376949
52 ©DAFFODIL INTERNATIONAL UNIVERSITY
13th 4664632366 219189543 93292647 125896896 4538735470
14th 4538735470 219189543 90774709 128414834 4410320636
15th 4410320636 219189543 88206413 130983130 4279337506
16th 4279337506 219189543 85586750 133602793 4145734712 357860520
17th 4145734712 219189543 82914694 136274849 4009459864
18th 4009459864 219189543 80189197 139000346 3870459518
19th 3870459518 219189543 77409190 141780353 3728679165
20th 3728679165 219189543 74573583 144615960 3584063205 315086665
21st 3584063205 219189543 71681264 147508279 3436554926
22nd 3436554926 219189543 68731099 150458445 3286096481
23rd 3286096481 219189543 65721930 153467614 3132628868
24th 3132628868 219189543 62652577 156536966 2976091902 268786870
25th 2976091902 219189543 59521838 159667705 2816424197
26th 2816424197 219189543 56328484 162861059 2653563138
27th 2653563138 219189543 53071263 166118280 2487444857
28th 2487444857 219189543 49748897 169440646 2318004211 218670482
29th 2318004211 219189543 46360084 172829459 2145174752
30th 2145174752 219189543 42903495 176286048 1968888704
31st 1968888704 219189543 39377774 179811769 1789076935
32nd 1789076935 219189543 35781539 183408004 1605668930 164422892
33rd 1605668930 219189543 32113379 187076165 1418592766
34th 1418592766 219189543 28371855 190817688 1227775078
35th 1227775078 219189543 24555502 194634042 1033141036
36th 1033141036 219189543 20662821 198526722 834614314 105703556
37th 834614314 219189543 16692286 202497257 632117057
38th 632117057 219189543 12642341 206547202 425569855
39th 425569855 219189543 8511397 210678146 214891709
40th 214891709 219189543 4297834 214891709 0 42143859
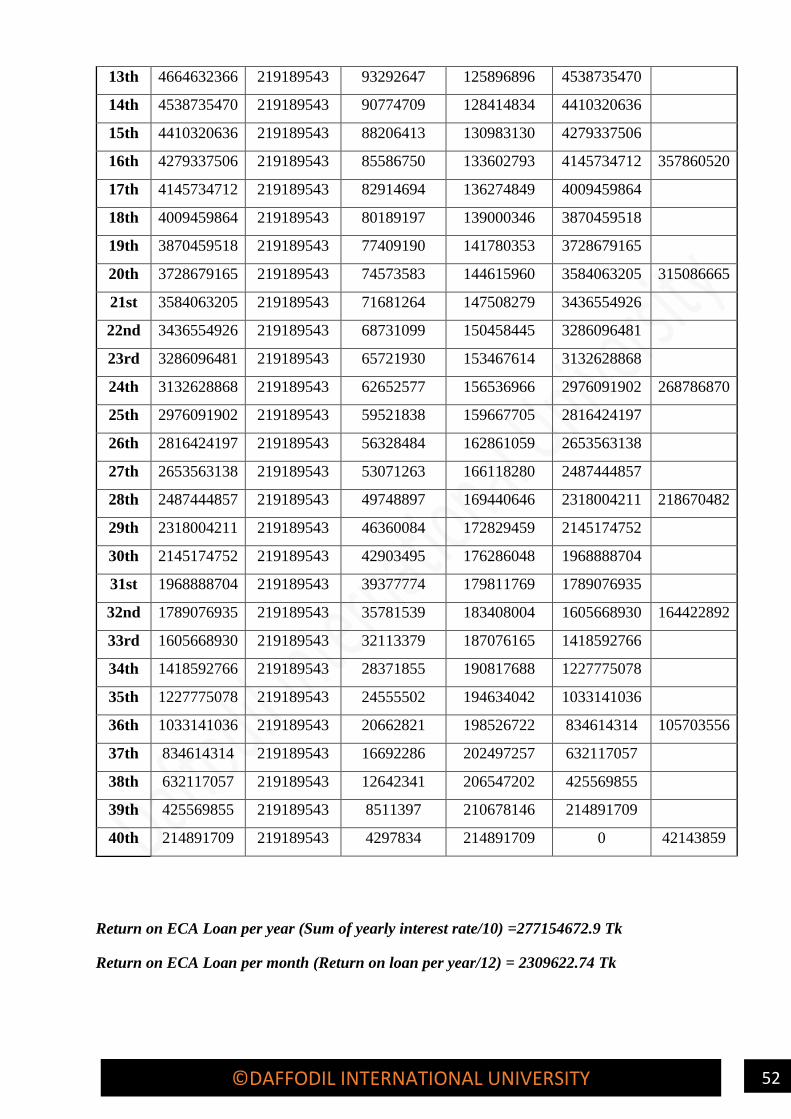
Return on ECA Loan per year (Sum of yearly interest rate/10) =277154672.9 Tk
Return on ECA Loan per month (Return on loan per year/12) = 2309622.74 Tk

53 ©DAFFODIL INTERNATIONAL UNIVERSITY
6.10.3 Commercial Loan Calculation
Given that,
Loan/Debt amount is 70% of Used & Useful Asset = 14276.27×10^6×0.70
= 9993389000 Tk
40% of total debt amount that is ECA loan = 9993389000 × 0.40
= 146126362 Tk
⸫ Principal, P = 146126362 Tk
Yearly interest rate, r = 8%
Quarterly interest rate, (r/4) = 2%
Number of installments, n = 40
We Know,
Principal = A×PVIFA
=> 146126362 = A ×
1−1
(1+r4
)𝑛
r
4
=> A = 146126362 ×
r
4
1−1
(1+r4
)𝑛
=> A = 146126362 ×
8%
4
1−1
(1+8%4
)40
=> A = 79947133 TK
⸫ Every installment of commercial loan is 79947133 TK.
[Note: PVIFA – Present Value Interest Factor of Annuity]
This method shortly termed as Annuity method.
Definition of PVIFA:
A factor which can be used to calculate the present value of a series of annuities. The initial
deposit, earning interest at the periodic rate (r), perfectly finances a series of (N) consecutive

54 ©DAFFODIL INTERNATIONAL UNIVERSITY
dollar withdrawals. PVIFA is also a variable used when calculating the present valued of an ordinary
annuity.
Table No.6.13: Commercial Loan Calculation
Inst
all
men
t
(Tk
) (2
)
Qu
art
erly
Inte
rest
(Tk
) (3
)=(1
)
x (
.03
)
Pri
nci
pal
Rep
ay
men
t
(Tk
) (4
)=
(2)
– (
3)
Pri
nci
pal
En
din
g
(Tk
)
(5)=
(1
) –
(4)
Y
earl
y
Inte
rest
(Tk
)
146126362 79947133 66179229 3931177436
146126362 78623549 67502813 3863674623
146126362 77273492 68852870 3794821753
146126362 75896435 70229927 3724591826 311740610
146126362 74491837 71634526 3652957301
146126362 73059146 73067216 3579890085
146126362 71597802 74528560 3505361524
146126362 70107230 76019132 3429342393 289256015
146126362 68586848 77539514 3351802878
146126362 67036058 79090305 3272712574
146126362 65454251 80672111 3192040463
146126362 63840809 82285553 3109754910 264917966
146126362 62195098 83931264 3025823646
146126362 60516473 85609889 2940213757
146126362 58804275 87322087 2852891670
146126362 57057833 89068529 2763823142 238573680
146126362 55276463 90849899 2672973242
146126362 53459465 92666897 2580306345
146126362 51606127 94520235 2485786110
146126362 49715722 96410640 2389375470 210057777
146126362 47787509 98338853 2291036617
146126362 45820732 100305630 2190730987
146126362 43814620 102311742 2088419245
146126362 41768385 104357977 1984061268 179191246
146126362 39681225 106445137 1877616131
146126362 37552323 108574039 1769042092
146126362 35380842 110745520 1658296571
146126362 33165931 112960431 1545336141 145780321

55 ©DAFFODIL INTERNATIONAL UNIVERSITY
146126362 30906723 115219639 1430116501
146126362 28602330 117524032 1312592469
146126362 26251849 119874513 1192717957
146126362 23854359 122272003 1070445954 109615261
146126362 21408919 124717443 945728511
146126362 18914570 127211792 818516719
146126362 16370334 129756028 688760691
146126362 13775214 132351148 556409543 70469037
146126362 11128191 134998171 421411371
146126362 8428227 137698135 283713237
146126362 5674265 140452097 143261139
146126362 2865223 143261139 0 28095906
Return on Commercial Loan per year (Sum of yearly interest rate/10) = 184769781.9 Tk
Return on Commercial Loan per month (Return on loan per year/12) = 15397481.83 Tk
6.10.4 Equity Calculation
Given that,
Equity amount is 30% of total rate base.
Since total rate base is =14276.27×10^6Tk
Therefore, Equity amount = 14276.27×10^6 × 0.30
= 4282882141 TK
Principal, P = 4282882141 Tk
Return on equity rate, r = 8%
Effective plant life, n = 15 years
We Know,
Principal = A×PVIFA
=> 4282882141 = A ×
1−1
(1+r)𝑛
r
4

56 ©DAFFODIL INTERNATIONAL UNIVERSITY
=> A = 4282882141 ×r
1−1
(1+r)𝑛
=> A = 4282882141 × 8%
1−1
(1+8%)15
=> A = 500367172 TK
[Note: PVIFA – Present Value Interest Factor of Annuity]
This method shortly termed as Annuity method.
Definition of PVIFA:
A factor which can be used to calculate the present value of a series of annuities. The initial
deposit, earning interest at the periodic rate (r), perfectly finances a series of (N) consecutive
dollar withdrawals. PVIFA is also a variable used when calculating the present valued of an ordinary
annuity.
Table No.6.14: Equity Calculation
Qu
art
ers
Pri
nci
pal
Beg
inn
ing
(Tk
) (1
)
In
stall
men
t
(Tk
) (2
)
Yea
rly
Inte
rest
(T
k)
(3)=
(1)
x
(0.1
5)
Pri
nci
pal
Rep
aym
ent
(Tk
) (4
)= (
2)
–
(3)
Pri
nci
pal
En
din
g (
Tk
)
(5)=
(1)
– (
4)
1st 4282882141 500367172 342630571 157736600 4125145541
2nd 4125145541 500367172 330011643 170355528 3954790013
3rd 3954790013 500367172 316383201 183983971 3770806042
4th 3770806042 500367172 301664483 198702688 3572103354
5th 3572103354 500367172 285768268 214598903 3357504451
6th 3357504451 500367172 268600356 231766816 3125737635
7th 3125737635 500367172 250059011 250308161 2875429474
8th 2875429474 500367172 230034358 270332814 2605096661
9th 2605096661 500367172 208407733 291959439 2313137222
10th 2313137222 500367172 185050978 315316194 1997821028
11th 1997821028 500367172 159825682 340541489 1657279539
12th 1657279539 500367172 132582363 367784808 1289494730
13th 1289494730 500367172 103159578 397207593 892287137
14th 892287137 500367172 71382971 428984201 463302937
15th 463302937 500367172 37064235 463302937 0
Return on Equity per year (Sum of yearly interest rate/15) = 214841696 Tk
Return on Equity per month (Return on Equity per year/12) = 17903474.6 Tk

57 ©DAFFODIL INTERNATIONAL UNIVERSITY
6.11 Total Fixed Cost & Per Unit Fixed Cost
Table No.6.15: Total Fixed Cost
Item Monthly Yearly
Depreciation expense (Tk) 75347000.64 904164007.6
ECA Loan (Tk) 23096222.74 277154672.9
Commercial Loan (Tk) 15397481.83 184769781.9
Return on equity (Tk) 17903474.63 214841695.5
Return on Regulatory Working Capital 1225775.547 14709306.57
Total amount (Tk) 132969955.4 1595639464
Total amount (MTk) 132.9699554 1595.639464
Table No.6.16: Power production Statement
Month
Fuel
Consumption
(MTon)
Electricity
Generation
(MKWh)
Operating
Capacity
(MW)
July 0.0409 71.26 200
Aug 0.0408 71.17 200
Sept 0.0406 70.77 200
Oct 0.0405 70.56 200
Nov 0.0403 70.46 200
Dec 0.0384 70.06 200
Jan 0.0410 70.97 200
Feb 0.0405 70.66 200
Mar 0.0395 71.27 200
April 0.0407 69.76 200
May 0.0410 70.36 200
June 0.0405 69.71 200

58 ©DAFFODIL INTERNATIONAL UNIVERSITY
Per unit fixed cost (yearly) =Total Amount of Fixed Cost
Generated Electricity
=𝟏𝟓𝟗𝟓.𝟔𝟑𝟗𝟒𝟔𝟒
𝟖𝟒𝟕 TK/KWh
= 1.8839 TK/KWh
6.12 Variable Cost Calculation
6.12.1 Fuel Cost Calculation (July)
Operating capacity = 200 MW
Generated electricity = 71.26 MKWh
Calorific Value of Coal = 6072 KJ/KG
Fuel Price = 10400 Tk/Ton
Fuel consumption = 0.0409 MTon
Hours in current month = 730 hours
𝑃𝑙𝑎𝑛𝑡 𝐹𝑎𝑐𝑡𝑜𝑟 =Generated Electricity in KWh
Operating Capacity × 1000 × Hours in Current Month × 100%
=71.26 × 10⁶
200 × 1000 × 730 × 100%
= 48.81 %
𝐻𝑒𝑎𝑡 𝑅𝑎𝑡𝑒 =Calorific Value of Fuel × Fuel Consumtion
Generated Electricity
= 6072 × 1000 × 0.0409
71.26
= 1735.77 (KJ/KWh)
Total fuel cost = Fuel price × Fuel consumtion
= 10400 𝑇𝑘/Ton × 0.4850 MTon
= 5044 MTk

59 ©DAFFODIL INTERNATIONAL UNIVERSITY
Fuel cost per unit energy =Total Fuel Cost
Generated Electricity
=5044
847
=5.955 Tk/KWh
6.12.2 Non-Fuel or Operation & Maintenance Cost Calculation(July)
Table No. 6.17: Components for Non-Fuel Cost (MTk)
Mo
nth
To
tal
Per
son
nel
Ex
p. (M
TK
) O
ffic
e
Ex
pen
ses
(MT
K)
Ex
cha
ng
e
Ra
te
Flu
ctu
ati
on
(MT
K)
Ass
ets
Insu
ran
ce
(MT
K)
G
ener
al
&
Ad
min
istr
ati
v
e E
xp
. (M
TK
) V
OM
P
(MT
K)
To
tal
No
n-
Fu
el C
ost
(MT
K)
JULY 13.18 0.76 24.63 0.15 15.47 2.74 56.92
AUG 13.11 0.76 24.55 0.15 15.40 2.72 56.69
SEPT 13.03 0.74 24.36 0.15 15.30 2.69 56.26
OCT 12.75 0.74 23.87 0.15 14.98 2.65 55.14
NOV 13.22 0.76 24.74 0.15 15.53 2.74 57.13
DEC 12.69 0.72 23.72 0.15 14.89 2.63 54.80
JAN 13.13 0.76 24.57 0.15 15.42 2.72 56.75
FEB 13.11 0.76 24.55 0.15 15.40 2.72 56.69
MAR 13.20 0.76 24.70 0.15 15.49 2.74 57.03
APRIL 13.15 0.76 24.63 0.15 15.45 2.74 56.88
MAY 13.11 0.76 24.55 0.15 15.40 2.72 56.69
JUNE 13.20 0.76 24.67 0.15 15.49 2.74 57.01
TOTAL 156.87 9.08 293.52 1.78 184.22 32.52 678
Generated Electricity = 71.26 MKwh
Total Non-Fuel or Operation & Maintenance Cost = 56.92 MTk
Per unit Non-Fuel or O & M Cost = 𝑁𝑜𝑛−𝐹𝑢𝑒𝑙 𝐶𝑜𝑠𝑡 (𝑀𝑇𝑘)
𝐺𝑒𝑛𝑒𝑟𝑎𝑡𝑒𝑑 𝐸𝑙𝑒𝑐𝑡𝑟𝑖𝑐𝑖𝑡𝑦(𝑀𝐾𝑤ℎ)
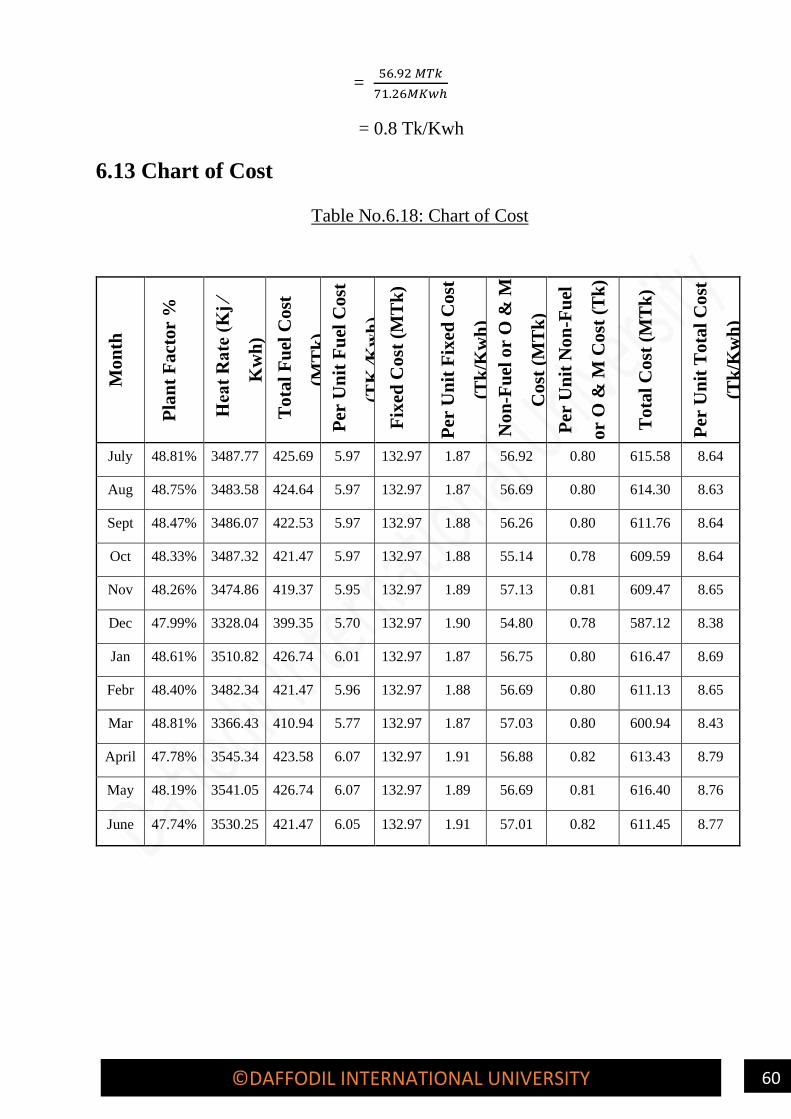
60 ©DAFFODIL INTERNATIONAL UNIVERSITY
= 56.92 𝑀𝑇𝑘
71.26𝑀𝐾𝑤ℎ
= 0.8 Tk/Kwh
6.13 Chart of Cost
Table No.6.18: Chart of Cost
Mo
nth
Pla
nt
Fact
or
%
Hea
t R
ate
(K
j ⁄
Kw
h)
To
tal
Fu
el C
ost
(MT
k)
Per
Un
it F
uel
Cost
(TK
⁄Kw
h)
Fix
ed C
ost
(M
Tk
)
Per
Un
it F
ixed
Cost
(Tk
/Kw
h)
No
n-F
uel
or
O &
M
Cost
(M
Tk
)
Per
Un
it N
on
-Fu
el
or
O &
M C
ost
(T
k)
To
tal
Cost
(M
Tk
)
Per
Un
it T
ota
l C
ost
(Tk
/Kw
h)
July 48.81% 3487.77 425.69 5.97 132.97 1.87 56.92 0.80 615.58 8.64
Aug 48.75% 3483.58 424.64 5.97 132.97 1.87 56.69 0.80 614.30 8.63
Sept 48.47% 3486.07 422.53 5.97 132.97 1.88 56.26 0.80 611.76 8.64
Oct 48.33% 3487.32 421.47 5.97 132.97 1.88 55.14 0.78 609.59 8.64
Nov 48.26% 3474.86 419.37 5.95 132.97 1.89 57.13 0.81 609.47 8.65
Dec 47.99% 3328.04 399.35 5.70 132.97 1.90 54.80 0.78 587.12 8.38
Jan 48.61% 3510.82 426.74 6.01 132.97 1.87 56.75 0.80 616.47 8.69
Febr 48.40% 3482.34 421.47 5.96 132.97 1.88 56.69 0.80 611.13 8.65
Mar 48.81% 3366.43 410.94 5.77 132.97 1.87 57.03 0.80 600.94 8.43
April 47.78% 3545.34 423.58 6.07 132.97 1.91 56.88 0.82 613.43 8.79
May 48.19% 3541.05 426.74 6.07 132.97 1.89 56.69 0.81 616.40 8.76
June 47.74% 3530.25 421.47 6.05 132.97 1.91 57.01 0.82 611.45 8.77

61 ©DAFFODIL INTERNATIONAL UNIVERSITY
6.14 Assumption Data-3
Name of Power Plant & Unit: Faridpur Peaking 54 MW Power Plant
Category of Technology: CC
Type of Fuel: F. Oil
For tariff calculation of Faridpur Peaking 54 MW Power Plant, the assumption
data is given below –
Table No 6.19: Assumption Data-3
SL
NO Parameter/Assumption/Boundary Condition Unit
1 Net Capacity of the Power Plant 54 MW
2 Project Cost (USD 845.15/kW) 3854.59 MTk
3 Exchange Rate 84.46 BDT/USD
4 Month Operation Hours 730 Hours
5 Calorific Value of F.Oil 36000 Kj/Liter
6 Fuel Price 54 Tk/Liter
7 Equity 30%
8 Debt (70% of Total Rate Base) 70%
9 Foreign/ECA Loan Facilities (60% of Total Debt) 60%
10 Local/Commercial Loan facilities (40% of Total Debt) 40%
11 Return on Equity 15%
12 Rate of Interest of ECA Loan Facilities 12%
13 Rate of Interest of Commercial Loan Facilities 12%
14 Effective Plant Life 15 Years
15 Loan Repayment 10 Years
16 Salvage Value 5%
17 Cash working capital 21.1667 MTk
18 Materials & Supplies
19 Pre-payments 0.0249 MTk
20 Interest on regulatory working capital 15%

62 ©DAFFODIL INTERNATIONAL UNIVERSITY
6.15 Project Cost
Table No. 6.20: Project Cost
SL
No Item Cost(10^6Tk) Cost Tk
Share
(%) 1 Intangible Plant 103.30 103303012 2.68%
2 Production Plant or Plant
machinery and equipment
2.1
Plant and machinery
C&F,11/33 KV sub-
station, Power Evacuation
Line
3196.23 3196226028 82.92%
3 General Plant
3.1 Land and Land
Development 48.95 48953293 1.27%
3.2 Infrastructure (Building &
Civil Works) 127.97 127972388 3.32%
3.3 Office Furniture and
Equipment 3.85 3854590 0.10%
3.4 Laboratory Equipment 1.93 1927295 0.05%
3.5 Electric Equipment 1.93 1927295 0.05%
3.6 Transportation &
Communication 26.21 26211212 0.68%
3.7 Miscellaneous Equipment 1.93 1927295 0.05%
3.8 Others tangible Equipment 1.93 1927295 0.05%
3.9 Interest During
Construction 159.97 159965485 4.15%
3.1O Contingencies 180.39 180394812 4.68%
4 Total Project Cost
(1+2+3) 3854.59 3854590000 100.0%
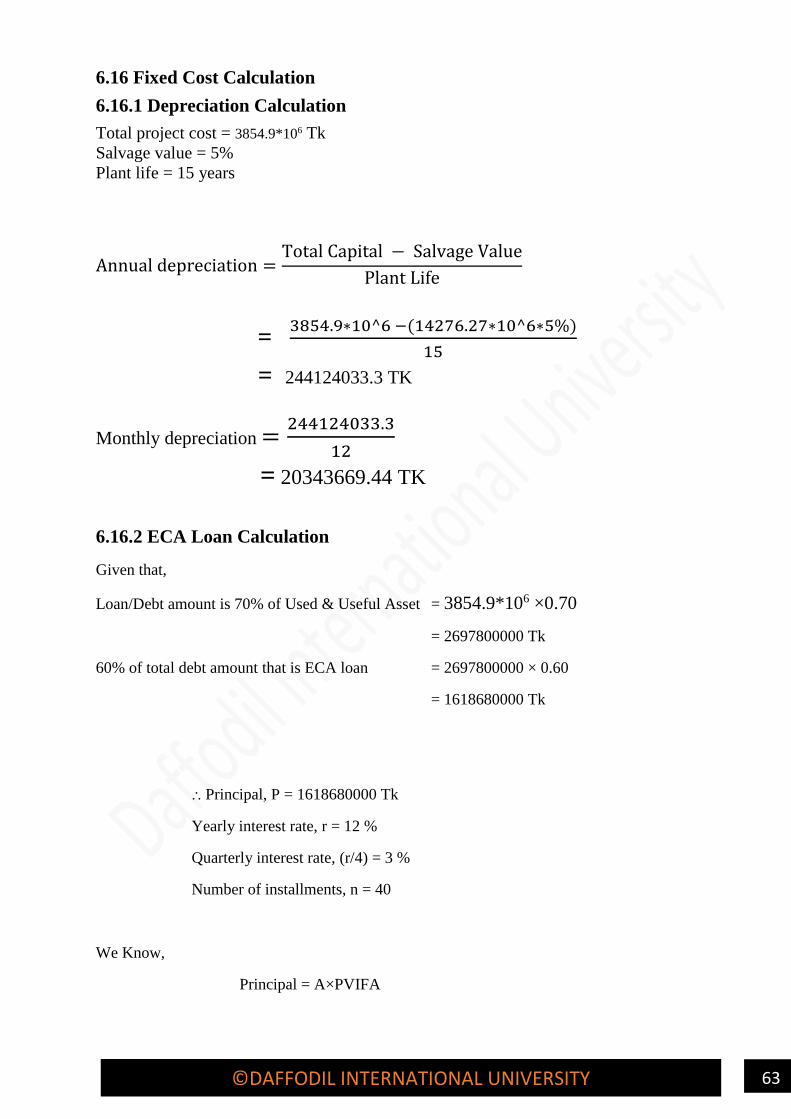
63 ©DAFFODIL INTERNATIONAL UNIVERSITY
6.16 Fixed Cost Calculation
6.16.1 Depreciation Calculation
Total project cost = 3854.9*106 Tk
Salvage value = 5%
Plant life = 15 years
Annual depreciation =Total Capital − Salvage Value
Plant Life
= 3854.9∗10^6 −(14276.27∗10^6∗5%)
15
= 244124033.3 TK
Monthly depreciation =244124033.3
12
= 20343669.44 TK
6.16.2 ECA Loan Calculation
Given that,
Loan/Debt amount is 70% of Used & Useful Asset = 3854.9*106 ×0.70
= 2697800000 Tk
60% of total debt amount that is ECA loan = 2697800000 × 0.60
= 1618680000 Tk
⸫ Principal, P = 1618680000 Tk
Yearly interest rate, r = 12 %
Quarterly interest rate, (r/4) = 3 %
Number of installments, n = 40
We Know,
Principal = A×PVIFA

64 ©DAFFODIL INTERNATIONAL UNIVERSITY
=> 1618680000 = A ×
1−1
(1+r4
)𝑛
r
4
=> A = 1618680000 ×
r
4
1−1
(1+r4
)𝑛
=> A = 1618680000 ×
12%
4
1−1
(1+12%
4)
40
=> A = 70038666 TK
⸫ Every installment of ECA loan is 70038666 TK.
[Note: PVIFA – Present Value Interest Factor of Annuity]
This method shortly termed as Annuity method.
Definition of PVIFA:
A factor which can be used to calculate the present value of a series of annuities. The initial deposit,
earning interest at the periodic rate (r), perfectly finances a series of (N) consecutive dollar
withdrawals. PVIFA is also a variable used when calculating the present valued of an ordinary
annuity.
Table No.6.21: ECA Loan Calculation
Qu
art
ers
Pri
nci
pal
Beg
inn
ing
(T
k)
(1)
Inst
all
men
t (T
k)
(2)
Qu
art
erly
Inte
rest
(T
k)
(3)=
(1)
x (
.02
)
Pri
nci
pal
Rep
ay
men
t (T
k)
(4)=
(2
) –
(3)
Pri
nci
pal
En
din
g (
Tk
) (5
)=
(1)
– (
4)
Yea
rly
In
tere
st
(Tk
)
1st 1618927800 70038666 48567834 21470832 1597456968
2nd 1597456968 70038666 47923709 22114957 1575342011
3rd 1575342011 70038666 47260260 22778406 1552563605
4th 1552563605 70038666 46576908 23461758 1529101846 190328711
5th 1529101846 70038666 45873055 24165611 1504936236
6th 1504936236 70038666 45148087 24890579 1480045656
7th 1480045656 70038666 44401370 25637297 1454408360
8th 1454408360 70038666 43632251 26406415 1428001944 179054763
9th 1428001944 70038666 42840058 27198608 1400803336
10th 1400803336 70038666 42024100 28014566 1372788770
11th 1372788770 70038666 41183663 28855003 1343933767
12th 1343933767 70038666 40318013 29720653 1314213114 166365835

65 ©DAFFODIL INTERNATIONAL UNIVERSITY
13th 1314213114 70038666 39426393 30612273 1283600841
14th 1283600841 70038666 38508025 31530641 1252070200
15th 1252070200 70038666 37562106 32476560 1219593640
16th 1219593640 70038666 36587809 33450857 1186142783 152084334
17th 1186142783 70038666 35584283 34454383 1151688400
18th 1151688400 70038666 34550652 35488014 1116200386
19th 1116200386 70038666 33486012 36552655 1079647731
20th 1079647731 70038666 32389432 37649234 1041998497 136010379
21st 1041998497 70038666 31259955 38778711 1003219785
22nd 1003219785 70038666 30096594 39942073 963277712
23rd 963277712 70038666 28898331 41140335 922137378
24th 922137378 70038666 27664121 42374545 879762833 117919001
25th 879762833 70038666 26392885 43645781 836117051
26th 836117051 70038666 25083512 44955155 791161897
27th 791161897 70038666 23734857 46303809 744858087
28th 744858087 70038666 22345743 47692924 697165164 97556996
29th 697165164 70038666 20914955 49123711 648041452
30th 648041452 70038666 19441244 50597423 597444030
31st 597444030 70038666 17923321 52115345 545328684
32nd 545328684 70038666 16359861 53678806 491649879 74639380
33rd 491649879 70038666 14749496 55289170 436360709
34th 436360709 70038666 13090821 56947845 379412864
35th 379412864 70038666 11382386 58656280 320756583
36th 320756583 70038666 9622697 60415969 260340614 48845401
37th 260340614 70038666 7810218 62228448 198112167
38th 198112167 70038666 5943365 64095301 134016865
39th 134016865 70038666 4020506 66018160 67998705
40th 67998705 70038666 2039961 67998705 0 19814051
Return on ECA Loan per year (Sum of yearly interest rate/10) = 118261885 Tk
Return on ECA Loan per month (Return on loan per year/12) = 9855157.087 Tk
6.16.3 Commercial Loan Calculation
Given that,
Loan/Debt amount is 70% of Used & Useful Asset = 3854.9*106 ×0.70
= 2697800000 Tk
40% of total debt amount that is ECA loan = 2697800000 × 0.40
= 1079120000 Tk

66 ©DAFFODIL INTERNATIONAL UNIVERSITY
⸫ Principal, P = 1079120000 Tk
Yearly interest rate, r = 12%
Quarterly interest rate, (r/4) = 3%
Number of installments, n = 40
We Know,
Principal = A×PVIFA
=> 1079120000 = A ×
1−1
(1+r4
)𝑛
r
4
=> A = 1079120000 ×
r
4
1−1
(1+r4
)𝑛
=> A = 1079120000 ×
12%
4
1−1
(1+12%
4)
40
=> A = 46692444 TK
⸫ Every installment of commercial loan is 46692444 TK.
[Note: PVIFA – Present Value Interest Factor of Annuity]
This method shortly termed as Annuity method.
Definition of PVIFA:
A factor which can be used to calculate the present value of a series of annuities. The initial
deposit, earning interest at the periodic rate (r), perfectly finances a series of (N) consecutive
dollar withdrawals. PVIFA is also a variable used when calculating the present valued of an ordinary
annuity.

67 ©DAFFODIL INTERNATIONAL UNIVERSITY
Table No.6.22: Commercial Loan Calculation
Qu
art
ers
Pri
nci
pal
Beg
inn
ing
(T
k)
(1)
In
stall
men
t (T
k)
(2)
Qu
art
erly
Inte
rest
(T
k)
(3)=
(1)
x (
.03
)
Pri
nci
pal
Rep
ay
men
t (T
k)
(4)=
(2
) –
(3)
Pri
nci
pal
En
din
g
(Tk
)
(5)=
(1
) –
(4)
Yea
rly
In
tere
st
(Tk
)
1st 1079285200 46692444 32378556 14313888 1064971312
2nd 1064971312 46692444 31949139 14743305 1050228007
3rd 1050228007 46692444 31506840 15185604 1035042403
4th 1035042403 46692444 31051272 15641172 1019401231 126885808
5th 1019401231 46692444 30582037 16110407 1003290824
6th 1003290824 46692444 30098725 16593719 986697104
7th 986697104 46692444 29600913 17091531 969605573
8th 969605573 46692444 29088167 17604277 952001296 119369842
9th 952001296 46692444 28560039 18132405 933868891
10th 933868891 46692444 28016067 18676377 915192513
11th 915192513 46692444 27455775 19236669 895955845
12th 895955845 46692444 26878675 19813769 876142076 110910556
13th 876142076 46692444 26284262 20408182 855733894
14th 855733894 46692444 25672017 21020427 834713467
15th 834713467 46692444 25041404 21651040 813062426
16th 813062426 46692444 24391873 22300571 790761855 101389556
17th 790761855 46692444 23722856 22969589 767792267
18th 767792267 46692444 23033768 23658676 744133590
19th 744133590 46692444 22324008 24368436 719765154
20th 719765154 46692444 21592955 25099490 694665664 90673586
21st 694665664 46692444 20839970 25852474 668813190
22nd 668813190 46692444 20064396 26628048 642185142
23rd 642185142 46692444 19265554 27426890 614758252
24th 614758252 46692444 18442748 28249697 586508555 78612667
25th 586508555 46692444 17595257 29097188 557411368
26th 557411368 46692444 16722341 29970103 527441264
27th 527441264 46692444 15823238 30869206 496572058
28th 496572058 46692444 14897162 31795282 464776776 65037997

68 ©DAFFODIL INTERNATIONAL UNIVERSITY
29th 464776776 46692444 13943303 32749141 432027635
30th 432027635 46692444 12960829 33731615 398296020
31st 398296020 46692444 11948881 34743564 363552456
32nd 363552456 46692444 10906574 35785870 327766586 49759587
33rd 327766586 46692444 9832998 36859447 290907139
34th 290907139 46692444 8727214 37965230 252941909
35th 252941909 46692444 7588257 39104187 213837722
36th 213837722 46692444 6415132 40277313 173560410 32563601
37th 173560410 46692444 5206812 41485632 132074778
38th 132074778 46692444 3962243 42730201 89344577
39th 89344577 46692444 2680337 44012107 45332470
40th 45332470 46692444 1359974 45332470 0 13209367
Return on Commercial Loan per year (Sum of yearly interest rate/10) = 78841256.7 Tk
Return on Commercial Loan per month (Return on loan per year/12) = 6570104.725 Tk
6.16.4 Equity Calculation
Given that,
Equity amount is 30% of total rate base.
Since total rate base is = 3854.9*106 Tk
Therefore, Equity amount = 3854.9*106 × 0.30
= 1156377000 TK
Principal, P = 1156377000 Tk
Return on equity rate, r = 15%
Effective plant life, n = 15 years
We Know,
Principal = A×PVIFA
=> 1156377000 = A ×
1−1
(1+r)𝑛
r
4
=> A = 1156377000 ×r
1−1
(1+r)𝑛
=> A = 1156377000 × 15%
1−1
(1+15%)15
=> A = 197760186 TK
[Note: PVIFA – Present Value Interest Factor of Annuity]
This method shortly termed as Annuity method.
Definition of PVIFA:
A factor which can be used to calculate the present value of a series of annuities. The initial
deposit, earning interest at the periodic rate (r), perfectly finances a series of (N) consecutive
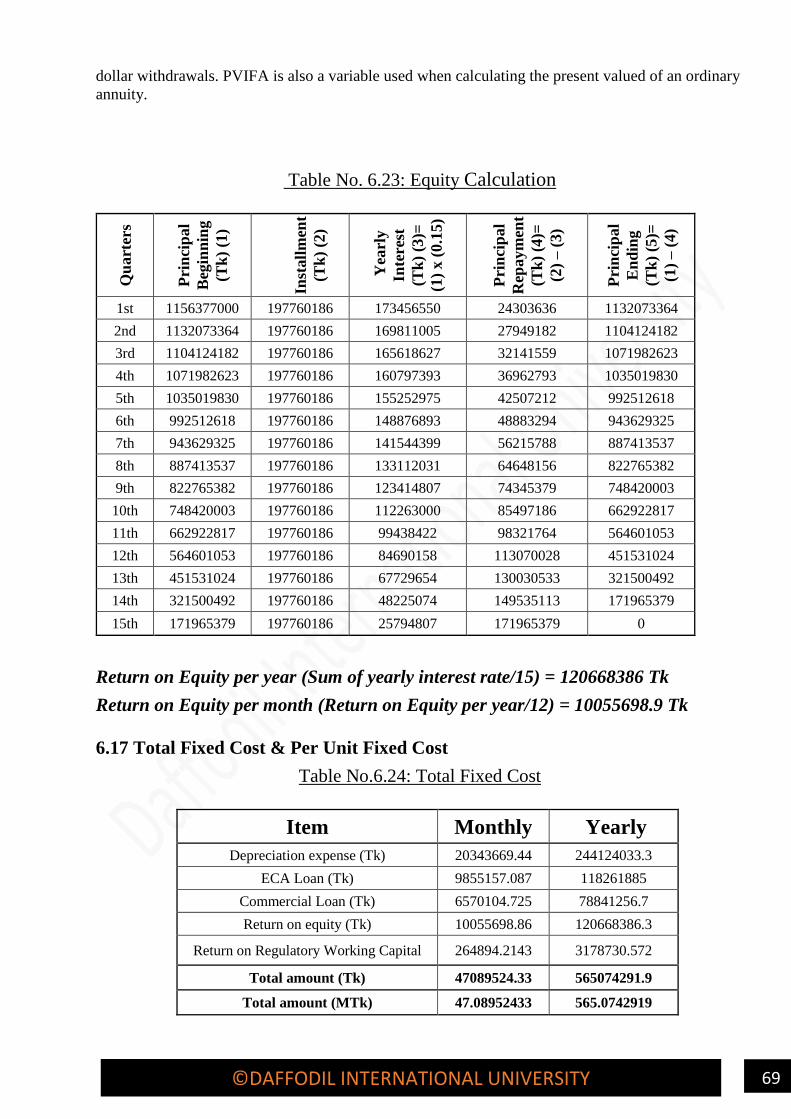
69 ©DAFFODIL INTERNATIONAL UNIVERSITY
dollar withdrawals. PVIFA is also a variable used when calculating the present valued of an ordinary
annuity.
Table No. 6.23: Equity Calculation
Qu
art
ers
Pri
nci
pal
Beg
inn
ing
(Tk
) (1
)
Inst
all
men
t
(Tk
) (2
)
Yea
rly
Inte
rest
(Tk
) (3
)=
(1)
x (
0.1
5)
Pri
nci
pal
Rep
aym
ent
(Tk
) (4
)=
(2)
– (
3)
Pri
nci
pal
En
din
g
(Tk
) (5
)=
(1)
– (
4)
1st 1156377000 197760186 173456550 24303636 1132073364
2nd 1132073364 197760186 169811005 27949182 1104124182
3rd 1104124182 197760186 165618627 32141559 1071982623
4th 1071982623 197760186 160797393 36962793 1035019830
5th 1035019830 197760186 155252975 42507212 992512618
6th 992512618 197760186 148876893 48883294 943629325
7th 943629325 197760186 141544399 56215788 887413537
8th 887413537 197760186 133112031 64648156 822765382
9th 822765382 197760186 123414807 74345379 748420003
10th 748420003 197760186 112263000 85497186 662922817
11th 662922817 197760186 99438422 98321764 564601053
12th 564601053 197760186 84690158 113070028 451531024
13th 451531024 197760186 67729654 130030533 321500492
14th 321500492 197760186 48225074 149535113 171965379
15th 171965379 197760186 25794807 171965379 0
Return on Equity per year (Sum of yearly interest rate/15) = 120668386 Tk
Return on Equity per month (Return on Equity per year/12) = 10055698.9 Tk
6.17 Total Fixed Cost & Per Unit Fixed Cost
Table No.6.24: Total Fixed Cost
Item Monthly Yearly
Depreciation expense (Tk) 20343669.44 244124033.3
ECA Loan (Tk) 9855157.087 118261885
Commercial Loan (Tk) 6570104.725 78841256.7
Return on equity (Tk) 10055698.86 120668386.3
Return on Regulatory Working Capital 264894.2143 3178730.572
Total amount (Tk) 47089524.33 565074291.9
Total amount (MTk) 47.08952433 565.0742919
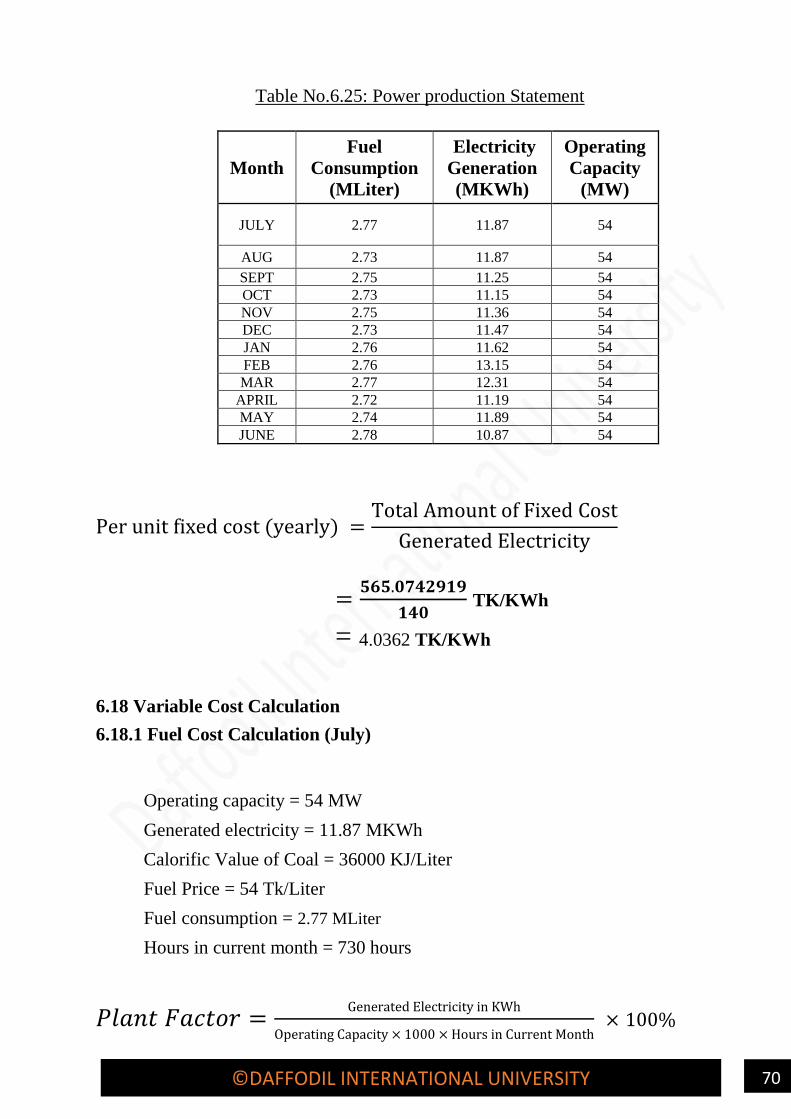
70 ©DAFFODIL INTERNATIONAL UNIVERSITY
Table No.6.25: Power production Statement
Month
Fuel
Consumption
(MLiter)
Electricity
Generation
(MKWh)
Operating
Capacity
(MW)
JULY 2.77 11.87 54
AUG 2.73 11.87 54
SEPT 2.75 11.25 54
OCT 2.73 11.15 54
NOV 2.75 11.36 54
DEC 2.73 11.47 54
JAN 2.76 11.62 54
FEB 2.76 13.15 54
MAR 2.77 12.31 54
APRIL 2.72 11.19 54
MAY 2.74 11.89 54
JUNE 2.78 10.87 54
Per unit fixed cost (yearly) =Total Amount of Fixed Cost
Generated Electricity
=𝟓𝟔𝟓.𝟎𝟕𝟒𝟐𝟗𝟏𝟗
𝟏𝟒𝟎 TK/KWh
= 4.0362 TK/KWh
6.18 Variable Cost Calculation
6.18.1 Fuel Cost Calculation (July)
Operating capacity = 54 MW
Generated electricity = 11.87 MKWh
Calorific Value of Coal = 36000 KJ/Liter
Fuel Price = 54 Tk/Liter
Fuel consumption = 2.77 MLiter
Hours in current month = 730 hours
𝑃𝑙𝑎𝑛𝑡 𝐹𝑎𝑐𝑡𝑜𝑟 =Generated Electricity in KWh
Operating Capacity × 1000 × Hours in Current Month × 100%

71 ©DAFFODIL INTERNATIONAL UNIVERSITY
=11.87 × 10⁶
54 × 1000 × 730 × 100%
= 30.11 %
𝐻𝑒𝑎𝑡 𝑅𝑎𝑡𝑒 =Calorific Value of Fuel × Fuel Consumtion
Generated Electricity
= 36000 × 1000 × 2.77
11.87
= 2011.96 (KJ/KWh)
Total fuel cost = Fuel price × Fuel consumtion
= 54 𝑇𝑘/Liter × 2.77 MLiter
= 149.73 MTk
Fuel cost per unit energy =Total Fuel Cost
Generated Electricity
=149.73
11.87
=12.61 Tk/KWh
6.18.2 Non-Fuel or Operation & Maintenance Cost Calculation(July)
Table No. 6.26: Components for Non-Fuel Cost (MTk)
Mo
nth
To
tal
Per
son
nel
Ex
p. (M
TK
)
Off
ice E
xp
ense
s
(MT
K)
Ex
cha
ng
e R
ate
Flu
ctu
ati
on
(MT
K)
Ass
ets
Insu
ran
ce
(MT
K)
F
un
d G
ener
al
&
Ad
min
istr
ati
ve
Ex
p. (M
TK
)
VO
MP
(M
TK
)
To
tal
No
n-F
uel
Co
st (
MT
K)
To
tal
No
n-F
uel
Co
st (
TK
)
JULY 2.21 0.13 4.12 0.02 2.59 1.59 10.66 10661437.32
AUG 2.20 0.13 4.11 0.02 2.58 1.58 10.62 10619400.47
SEPT 2.18 0.12 4.08 0.02 2.56 1.57 10.54 10540062.86
OCT 2.14 0.12 4.00 0.02 2.51 1.54 10.33 10327508.81
NOV 2.21 0.13 4.14 0.02 2.60 1.59 10.70 10702882.59
DEC 2.12 0.12 3.97 0.02 2.49 1.53 10.26 10264749.3

72 ©DAFFODIL INTERNATIONAL UNIVERSITY
JAN 2.20 0.13 4.11 0.02 2.58 1.58 10.63 10631834.05
FEB 2.20 0.13 4.11 0.02 2.58 1.58 10.62 10619400.47
MAR 2.21 0.13 4.14 0.02 2.59 1.59 10.68 10682159.96
APRIL 2.20 0.13 4.12 0.02 2.59 1.59 10.65 10653148.28
MAY 2.20 0.13 4.11 0.02 2.58 1.58 10.62 10619400.47
JUNE 2.21 0.13 4.13 0.02 2.59 1.59 10.68 10678015.44
TOTAL 26.27 1.52 49.15 0.30 30.85 18.91 127.00 127000000
Generated Electricity = 11.87 MKwh
Total Non-Fuel or Operation & Maintenance Cost = 10.66 MTk
Per unit Non-Fuel or O & M Cost = 𝑁𝑜𝑛−𝐹𝑢𝑒𝑙 𝐶𝑜𝑠𝑡 (𝑀𝑇𝑘)
𝐺𝑒𝑛𝑒𝑟𝑎𝑡𝑒𝑑 𝐸𝑙𝑒𝑐𝑡𝑟𝑖𝑐𝑖𝑡𝑦(𝑀𝐾𝑤ℎ)
= 10.66 𝑀𝑇𝑘
11.87 𝑀𝐾𝑤ℎ
= 0.898 Tk/Kwh
6.19 Chart of Cost
Table No.6.27: Chart of Cost
Mo
nth
Pla
nt
Fa
cto
r %
Hea
t R
ate
(K
Ca
l ⁄
Kw
h)
To
tal
Fu
el C
ost
(MT
k)
Per
Un
it F
uel
Co
st
(TK
⁄Kw
h)
Fix
ed C
ost
(M
Tk
)
Per
Un
it F
ixed
Co
st
(Tk
/Kw
h)
No
n-F
uel
or
O &
M
Co
st (
MT
k)
Per
Un
it N
on
-Fu
el
or
O &
M C
ost
(Tk
/KW
H)
To
tal
Co
st (
MT
k)
Per
Un
it T
ota
l C
ost
(Tk
/Kw
h)
July 30.11% 2011.96 149.73 12.61 47.09 3.97 10.66 0.90 207.48 17.48
Aug 30.11% 1981.48 147.46 12.42 47.09 3.97 10.62 0.89 205.17 17.29
Sept 28.54% 2106.30 148.59 13.21 47.09 4.19 10.54 0.94 206.22 18.33
Oct 28.27% 2113.40 147.69 13.25 47.09 4.23 10.33 0.93 205.10 18.40
Nov 28.83% 2082.47 148.37 13.06 47.09 4.14 10.70 0.94 206.16 18.14
Dec 29.11% 2046.50 147.23 12.83 47.09 4.10 10.26 0.89 204.59 17.83

73 ©DAFFODIL INTERNATIONAL UNIVERSITY
Jan 29.48% 2045.56 149.05 12.83 47.09 4.05 10.63 0.91 206.77 17.79
Feb 33.36% 1810.53 149.28 11.35 47.09 3.58 10.62 0.81 206.98 15.74
Mar 31.23% 1937.05 149.50 12.15 47.09 3.83 10.68 0.87 207.27 16.84
April 28.38% 2096.05 147.01 13.14 47.09 4.21 10.65 0.95 204.75 18.30
May 30.16% 1987.23 148.14 12.46 47.09 3.96 10.62 0.89 205.85 17.31
June 27.58% 2199.81 149.96 13.79 47.09 4.33 10.68 0.98 207.72 19.11
6.20 Tariff Rate
This is for information of all concerned that in accordance with the BERC) published
in the energy rate, dated: 23 November 2017, the new tariff rates with respect to
retail sales of electricity of Dhaka Electric Supply Company Ltd. (DESCO) has been
made effective from bill month November 2017 as the followings [17]
Table – 6.28: Tariff Rate
SL Customer Category
Per Unit
Rate
(Tk.)
1
Category-A: Residential
a First Step: From 000 to 100 units 2.6
b Second Step: From 101 to 400 units 3.3
c Third Step: From 401 to above 5.65
2 Category-B: Agricultural pumping 1.93
3
a Category-C: Small Industries
b Flat Rate 4.35 4.35
c Off-Peak Time 3.5
Peak Time 5.95
4 Category-D: Non-Residential (Light & Power)
5 Category-E: Commercial
a Flat Rate 5.58

74 ©DAFFODIL INTERNATIONAL UNIVERSITY
b Off-Peak Time 4.05
c Peak Time 8.45
6
Category-F: Medium Voltage, General Purpose (11 KV)
a Flat Rate 4.17
b Off-Peak Time 3.43
c Peak Time 7.12
7 Category-G-1: Extra High Voltage (DESCO 132 KV) 2.12
8
Category-G-2: Extra High Voltage, General Purpose (132 KV)
a From 23:00 to 06:00 1.49
b From 06:00 to 13:00 2.48
c From 13:00 to 17:00 1.66
d From 17:00 to 23:00 5.52
e Flat Rate 2.82
9
Category-H: High Voltage, General Purpose (33 KV)
a Flat Rate 3.92
b Off-Peak Time 3.33
c Peak Time 6.82
10 Category-I: Rural Electrification Board (33 KV)
a DESCO to REB 2.12
11 Category-J: Street Light and Water Pumps 3.98
6.20 Bill Explanation
What all utility bills should contain?
Bills – for electricity – should always be dated and contain the following information (Usually
on the first page of the bill) –
➢ Your Name and Address.
➢ Your customer account or reference number (Always quote this when you

75 ©DAFFODIL INTERNATIONAL UNIVERSITY
contact your supplier).
➢ The name of your supplier and its contact details.
➢ How much you need to pay (Including any money owed from previous bills)
and when you need to pay by.
More Detailed Information -
The following more detailed information about the amount of energy you’ve used is often found
on a separate page of the bill –
➢ Billing Period – The period in which you used the energy you’re being charged
for.
➢ Meter Readings – The difference between the previous and latest reading is the
amount of energy (Measured in Kilowatt Hours or KWh) you’ve used.
➢ The amount your supplier is charging you for each KWh of electricity. If
you pay a standing charge (Which covers things like meter readings and the cost of
keeping you connected to the network) you’ll pay a single rate; if not then you will
pay a higher price for a given number of units and then a lower rate thereafter.
➢ Meter Number – If your supplier has changed your meter during the billing
period you’ll see readings for two different meter numbers. [18]
76 ©DAFFODIL INTERNATIONAL UNIVERSITY
CHAPTER 7
CONCLUSION
7.1 Conclusion
Electricity generation tariff is an important issue of our country. Because electricity tariff rate
depends on electricity generation tariff rate and is related with our economic growth. When
electricity tariff rate becomes high then poor people of our country suffers a lot. By thinking
about them, electricity tariff rate of our country should be low. If we use natural gas as a fuel
then we can reduce fuel cost of generation. Al-though natural gas is insufficient in our country.
So, we should make public awareness about misuse of our natural gas. Our government should
take step for improvement our power station. In our power station, generators efficiency rate is
low. It should be increased to a high value by taking necessary steps.
On the other hand, electricity plays vital role in the socio-economic development and
poverty reduction. Presently 90% (in 2018) of the total population has access to electricity and
per capita generation is only 372 KWh (in 2014), which are very low compared to other
developing countries. The Government has given highest priority to power sector development
in Bangladesh and is committed to making electricity available to all citizens by 2021. In this
connection, the Government has initiated implementing reform measures in the power sector,
including significant development programs of which this Project constitutes an important part.
After all, at present Bangladesh power sector is in loss crisis. On a consolidated basis the
losses from inadequate end-use customer tariffs are compensated from profits in the generation
and transmission segment of the power sector. However, inadequate tariffs will, in the first
place affect the distribution segment and lead there to a similar situation than the one prevailing
today despite all efforts to improve efficiency and performance, the distribution companies will
not be in the position to collect sufficient money to pay for their operating expenses and their
debt service
In consequence the upstream segments of the power sector (Generation and Distribution) will
not receive sufficient money; which in turn will lead to a continuation of the maintenance
backlog in the generation segment and even worse in delays in the financing of important
investment in the enhancement and improvement of the system.

77 ©DAFFODIL INTERNATIONAL UNIVERSITY
Improvement of the quality of power supply to end-use customer needs to be achieved fast to
improve acceptance of tariff increases. Performance and efficiency improvements on the other
hand will require significant investment in the first place in power generation capacity and in
consequence in the downstream transmission and distribution equipment. The projections
assume that investment of TK 165.9 billion (US$ 2.4 billion) will be required for rehabilitation
of existing and installation of new power generation capacity in the coming four years. In
addition to that some TK 50 billion (US$ 0.7 billion) will have to invested in the expansion of
the transmission system and TK 77.8 billion (US$ 1.1 million) in the rehabilitation, enhancement
and expansion of the distribution system.
It is finally a decision to be taken by the Government to what extent a tariff increase can be
enforced in Bangladesh given the present quality of supply. The financial projections show
that even a gradual increase of tariffs with the objective to achieve full cost recovery in 2021
will create serious problems in the distribution companies, which could – in consequence – result
in a similar situation that the power sector is facing today.
7.2 Limitations of the Work
There are few limitations I have faced are mentioned below -
➢ In this study the data of power plants I have used are collected from BERC
(Bangladesh Energy Regulatory Commission) but some of these data are
assumption.
➢ The generating cost of power plants I have calculated are almost the same as that
given by BERC. The slight difference of cost caused by the data that are assumption.
➢ In this thesis, I have discussed about electricity generation structure and
calculated the generating cost of several power plants. But the tariff rate of electric
power depends on both generating cost and transmission distribution cost. To
calculate the tariff rate of electric power, transmission and distribution cost
needs to be calculated along with the generation cost.

78 ©DAFFODIL INTERNATIONAL UNIVERSITY
7.3 Future Scopes of the Work
Normally, Tariff rate of electrical power depends on generating price and transmission cost. If
generating price and transmission cost are high then electrical tariff rate can high and vice-
versa. In this paper, I even have mentioned concerning generating price, a way to calculate
generating price with example. I even have additionally mentioned concerning the necessary
terms that is chargeable for high generating price. Anyone will work to calculate the
transmission and cost. Interested folks will study to calculate the generating price for a high
capability electrical power plant. And can also study to calculate the transmission and cost. If
anyone will calculate the transmission and cost then he/she can ready to calculate
the tariff rates.

79 ©DAFFODIL INTERNATIONAL UNIVERSITY
REFERENCES
[1] https://en.wikipedia.org/wiki/Electricity_sector_in_Bangladesh, July 2018.
[2] V.K. Mehta & Rohit Mehta, Principles of Power System , 4th Revised Edition, S. Chand &
Company Ltd. http://www.bpdb.gov.bd/bpdb_new/index.php/site/daily_generation_report,
11 September, 2018.
[3] http://en.wikipedia.org/wiki/Electricity_sector_in_Bangladesh, retrieved on 05 December,
2018.
[4] http://www.powerdivision.gov.bd, retrieved on 06 December, 2015.
[5] https://en.wikipedia.org/wiki/Electricity_generation, retrieved on 07July, 2018.
[6] Electricity Generation Tariff Methodology from BERC.
[7] https://energypedia.info/wiki/Bangladesh_Energy_Situation#Electricity, retrieved on 08
December, 2015.
[8] http://www.investopedia.com/terms/i/intangibleasset.asp, retrieved on 09 December, 2015.
[9] http://seattlecentral.edu/faculty/moneil/A220/L10/Horngren10.htm, retrieved on 09
December, 2015.
[10] https://courses.candelalearning.com/acct/chapter/depreciation-of-plant-assets/, retrieved on
11 December, 2015.
[11] https://en.wikipedia.org/wiki/Loan, retrieved on 11 December, 2015.
[12] http://www.investopedia.com/terms/e/export-credit-agency.asp, retrieved on 14 December,
2015.
[13] http://www.investopedia.com/terms/c/commercial-loan.asp, retrieved on 14 December,
2015.
[14] http://www.businessdictionary.com/definition/commercial-loan.html, retrieved on 18
December, 2015.
[15] https://en.wikipedia.org/wiki/Equity_%28finance%29, retrieved on 18 December, 2015.
[16] http://www.nei.org/Knowledge-Center/Nuclear-Statistics/Costs-Fuel,-Operation,-Waste-
Disposal-Life-Cycle, retrieved on 24 April, 2016.
[17] https://www.desco.org.bd/?page=tariff-rate-2, retrieved on 27 November, 2017.
[18] http://www.powerdivision.gov.bd, retrieved on 20 December, 2016.