daily indian precipitation analysis formed from a merge of
TRANSCRIPT
Daily Indian Precipitation Analysis Formed from a Merge of Rain-Gauge Data with the
TRMM TMPA Satellite-Derived Rainfall Estimates
A. K. MITRA, A. K. BOHRA
National Centre for Medium Range Weather Forecasting (NCMRWF), Noida, India
M. N. RAJEEVAN
National Atmospheric Research Laboratory, Tirupati, India
and
T. N. KRISHNAMURTI
Department of Meteorology, FSU, Tallahassee, Florida, USA
(Manuscript received 16 July 2008, in final form 16 December 2008)
Abstract
The Tropical Rainfall Measuring Mission (TRMM) Microwave Imager (TMI) and Precipitation Radar (PR) have enhanced the accuracy of rainfall estimation from satellites over ocean and land. An algorithm to merge TRMM Multi-satellite Precipitation Analysis (TMPA) satellite estimates with the India Meteorological Department (IMD) rain-gauge values is tested for the Indian monsoon region. A daily merged gauge and satellite data product (NMSG) at 1° latitude-longitude resolution for the Indian monsoon region is prepared to depict the large-scale aspects of monsoon rainfall. The satellite product used as a first guess is the TRMM TMPA for daily estimates. Incorporation of IMD gauge data corrects the mean biases of the TMPA values. TMPA alone is able to depict the space-time distribution of monsoon rainfall patterns. The merging of gauge data enhances the value of the satellite information; therefore, the NMSG is more representative than TMPA. Daily, monthly, and seasonal fields are prepared and compared with the land-only gridded data of the India Meteorological Department National Climate Centre (IMDNCC) at the same resolution. This inter-comparison with another independent dataset confirms the utility of the NMSG, produced by this objective analysis algorithm. The comparison of the merged data with the TMPA data reveals the regions where the satellite estimates have mean biases. Objective statistical scores also confirm the goodness of NMSG. The NMSG data are meant for use in verification of large-scale rainfall features from numerical models for the monsoon region.
Journal of the Meteorological Society of Japan, Vol. 87A, pp. 265–279, 2009 265DOI:10.2151/jmsj.87A.265
Corresponding author: Ashis K. Mitra, National Centre for Medium Range Weather Forecasting, Ministry of Earth Sciences, A - 50, Institute Area, Sector - 62, Noida, UP, India 201307E-mail: [email protected]Ⓒ2009, Meteorological Society of Japan
1. Introduction
The monsoon rains of India are vital to agriculture, economy, and the rhythm of life in the region. India is located in the Asian monsoon regime, which is a
major component of the Earth’s climate system. Realistic modeling, simulation, and prediction of this monsoon at different space-time scales are chal-lenging scientific tasks for the global Earth system science community. The science pertaining to mon-soons has progressed significantly in the last two decades, due to an increasing wealth of new data from satellite observations and enhanced computing power. Numerical models have been further improved at all major international centers around the globe. Proper evaluation, verification, and diagnosis of the

266 Journal of the Meteorological Society of Japan Vol. 87A
numerical modeling system for monsoons is an important task that provides feedback to model improvements, and keeps users and forecasters aware of the current capabilities and limitations of such numerical models (Ebert and McBride 2000). For Indian monsoons, among all the parameters to be analyzed and verified, rainfall is the most crucial for benchmarking the capabilities and performances of the models.
Over land, rainfall measurements from rain gauges are the most used and trusted information source. Over oceanic regions, however, rainfall estimates from satellites are the only option, except for regions that have coastal radar. Furthermore, many regions over land have sparse or no in situ rain gauge or radar instrumentation, and satellite-derived rainfall esti-mates are useful in those regions as well. However, it has been well-documented that precipitation estimates from satellites are biased over land (Rosenfeld and Mintz 1988; Scofield and Kuligowski 2003; McCollum et al. 2002). Thus, it is a natural extension to merge rain gauge data and satellite estimates to tap the excellent spatial coverage afforded by satellite information and the good bias characteristics of the rain-gauge data. Such datasets include the Global Precipitation Climatology Project (GPCP) (Huffman et al. 1997) and the Climate Prediction Center’s Merged Analysis of Precipitation (CMAP) (Xie and Arkin 1996); however, their spatial (2.5° latitude/longitude) and temporal (pentad and monthly) scales are rather coarse for monitoring phenomena such as the advance and retreat of monsoon-related precipitation. Furthermore, the rain gauge data used are mostly from reports that are available from the Global Telecommunication System (GTS), and the number of reports available from GTS over India pales compared to the number available from the India Meteorological Department National Climate Centre (IMDNCC).
Recently, several global (in longitude) high-resolution rainfall products have become available. The TRMM Multi-satellite Precipitation Analyses (TMPA) (Huffman et al. 2007) merges rainfall estimates from all available passive microwave sensors (TMI, Special Sensor Microwave Imager (SSMI), Advanced Microwave Sounding Unit (AMSU), and Advanced Scanning Radiometer- Earth Observing System (AMSR-E) that have been calibrated by the TRMM Precipitation Radar (PR), and fills in spatial gaps with estimates derived from calibrated infrared (IR) data. The National Oceanic
and Atmospheric Administration (NOAA) Climate Prediction Center (CPC) morphing technique (CMORPH) analyses of Joyce et al. (2004) take a different approach, in which only passive microwave-derived precipitation estimates are used, and IR data are used for spatial interpolation and "morphing" of the rainfall features. Global Satellite Mapping of Precipitation (GSMaP) (Okamoto et al. 2007) uses a Kalman-filter technique to combine the various rainfall estimates. All of these precipitation analyses are produced routinely and are freely available. In this paper, we describe a methodology in which daily IMD rain-gauge data are combined with TMPA satellite estimates to substantially reduce the bias of the satellite estimates.
For the Indian monsoon region, use of IR data from geo-stationary satellites was explored earlier to study various aspects of monsoon rainfall (Krishnamurti et al. 1983; Arkin et al. 1989; Kripalini et al. 1991; Kelkar and Rao 1992; Gambheer and Bhat 2000; Mitra et al. 2003b). However, rainfall from IR data does not capture the higher intensities of monsoon rainfall, and the details of the finer scales are not well-represented. In recent years, satellite rainfall estimates based on microwave data have demonstrated more promise for studies of the tropical convective systems, including the monsoon. The structure of rainfall over monsoon Asia and its intra-seasonal variations were studied using TRMM PR data (Hirose and Nakamura 2002). The latent heat related to the rainfall during the onset of the monsoon and the evolution of the monsoon were also studied by TRMM data (Ramata and Barros 2004; Rahman et al. 2007; Tao et al. 2006). A large-scale diurnal model of the Asian monsoon was also studied by TRMM data (Krishnamurti and Kisthwal 2000). At a much finer spatial scale, the TRMM PR data were used to study the characteristics and life cycle of the monsoon convection and rain in the northern Indian subcontinent and part of the Himalayas (Bhatt and Nakamura 2005; Houze et al. 2007; Liu et al. 2007). The hydrologic cycle for the tropics was also studied by TRMM data (Roads 2003). Additionally, the hydrometeor structure of monsoon depressions over north central India and the associated details of the monsoon convection were studied in detail by TRMM PR data (Stano et al. 2002).
Microwave sensors provide more accurate rainfall measurements than are possible from IR data because IR information merely yields the integrated temper-ature from the surface to the cloud tops; in contrast,
March 2009 A. K. MITRA et al. 267
radiation at microwave frequencies passes through clouds, and the signals are modulated in various ways. Therefore, information from microwave sensors provides characteristics of hydrometeors that cannot be obtained from IR information. In addition to the TRMM Microwave Imager (TMI), TRMM houses PR. The TRMM PR-calibrated TMI rainfall estimates provide unparalleled remotely sensed rainfall esti-mates over land surfaces. In spite of all the advantages, however, uncertainties do exist in quan-titative assessment in rainfall products at various space-time scales (Kummerow et al. 2006; Stephens and Kummerow 2007). The rain-retrieval algorithms from spaceborne rain radar might have biases (Nakamura 1991). The rainfall algorithm is also sensitive to rainfall climate regimes (Berg et al. 2006). It may not be possible to correct these biases due to the space-time variations in them. Clima-tologically distinct space-time regimes add un -certainties: regional and temporal differences exist in algorithm performances in various regions of the world (Dinku and Anagnostou 2005). Rainfall esti-mates are also dependent on storm height, time of the year (season), latitude, local time of the day, and cloud structures (Furuzawa and Nakamura 2005). It is thus expected that the final TRMM rainfall products like TMPA will still have biases.
In this study, we prepare a daily merged gauge and satellite data product at 1° x 1° latitude-longitude resolution for the Indian monsoon region. The satellite product used is the TMPA (3B42V6 or TMPA research version) daily estimates. The 3B42V6 product is calibrated by gauges via ratio-adjusted bias (with current GTS monthly gauges). In our study, we use the 3B42V6 as first guess, as this is the best available comprehensive dataset. Explicit incorpo-ration of more regional gauge data available from IMD corrects the mean biases in the TMPA values. TMPA does not include this IMD data available in the local network. Daily, monthly, and seasonal fields are prepared and compared with the land-only gridded data of the India Meteorological Department (IMD) for the 2006 monsoon season. A comparison of the merged data with the TMPA data reveals the regions where the satellite estimate has mean biases. The final merged near-real-time data is meant for use in validating numerical models over land and ocean.
2. Data and methodology
In this study, the objective analysis method used to produce daily rainfall data on a regular latitude-
longitude grid for the Indian region, including ocean, is a successive-correction method (Krishnamurti et al. 1983; Mitra et al. 1997; Mitra et al. 2003a). This National Centre for Medium Range Weather Fore-casting (NCMRWF) merged satellite-gauge (NMSG) algorithm uses first-guess rainfall information obtained from satellite estimates over land and ocean. Earlier (Mitra et al. 1997; Mitra et al. 2003a) IR-based rainfall estimates from the Indian National Satellite System (INSAT) were used. Similar simple objective analysis algorithms of rainfall have been used in various other studies for different regions (Gairola and Krishnamurti 1991; Weymouth et al. 1999; Xie et al. 2003; Sinha et al. 2006; Rajeevan et al. 2006; Roy Bhowmik and Das 2007). However, with the availability of microwave-based daily estimates, it is better to use them as the first guess in the objective analysis of rainfall. In this current NMSG algorithm, the analysis resolution is 1° x 1° latitude-longitude. This resolution is appropriate to depict the large-scale description of rainfall patterns associated with the monsoon. The domain of the analysis is between 40°E and 120°E longitude and 40°S and 40°N latitude, covering the Indian monsoon region.
The successive-correction method is similar to that of Cressman (1959), which involves the successive modification of an initial guess field (satellite estimates) based on observed station data (rain gauge). Presuming that the gauges are perfect, the error (bias) correction for the satellite estimate at each grid point is derived. First, the satellite estimates are interpolated to station location to form a first guess. Their differences from the observed station values provide an error estimate at the station location. This set of irregularly spaced values is used to derive corrections at the desired grid points, using successive iterative corrections. The details of the weights and interpolations are described in Mitra et al. (2003a). During the successive corrections, four scan radii (1.5°, 1.3°, 1.15°, and 1.0°) are used. Since the intention is to represent the observed large-scale monsoon rainfall at 1° latitude-longitude grid boxes, the scan radii were selected this way to account for the continuity of the large-scale rainfall in relation to the processes occurring in the neighboring grids. The last scan represents the actual scale to be captured.
The first guess used in this NMSG daily rainfall analysis is the TRMM Multi-satellite Precipitation Analysis (TMPA) available at three-hourly time intervals at 0.25° latitude-longitude spatial resolution
268 Journal of the Meteorological Society of Japan Vol. 87A
(Huffman et al. 2007) for the extended tropical belt; hence, it is very suitable for the Indian monsoon region. From the three-hourly TMPA data, the daily-accumulated (24-hour accumulated) rainfall valid at 0300 UTC is computed for the Indian region, which is compatible to the accumulated 24-hour (daily) rainfall values from the IMD gauges valid at the same 0300 UTC. From the original 0.25°, the data were bi-linearly interpolated to the analysis grid of 1° x 1° resolution. TMPA provides a calibration-based scheme for combining precipitation estimates from multiple satellites. TMPA has two sub-products, the real-time (RT) and the 3B42V6 (TMPA research version) products. The RT product has the potential to be used in real-time NMSG analysis, as it becomes available after nine hours of real time. In this study, we have used the best and complete 3B42V6 product, popularly known as TRMM 3B42V6. This product is calibrated by the current month's gauges available from GTS, stored under the Climate Prediction Center’s (CPC’s) GPCP and Climate Anomaly Monitoring System (CAMS) projects. The number of gauges used for calibration in 3B42V6 was, on average, 73 per day for the India region, which may not be enough. We used more regional daily gauge data (400) available from the local network of IMD stations.
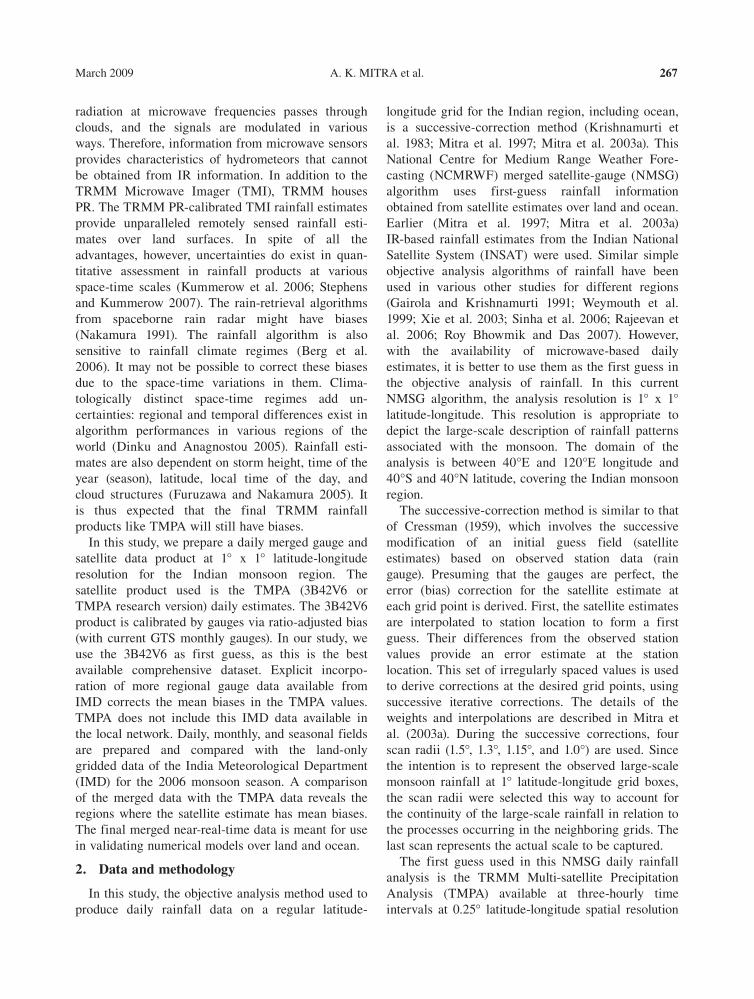
The other data are the 24-hour accumulated daily rain-gauge data (valid at 0300 UTC) of IMD stations for the 2006 monsoon season. IMD operates 537 observatories, which measure and report rainfall that has occurred in the past 24 h ending at 0300 UTC. Figure 1a presents the distribution of IMD gauges on a typical day during the 2006 monsoon season. The daily number of gauges available during 122 days of the season is indicated in Fig. 1b. On average, 383 gauge observations were available on a daily basis. On many days, close to 400 gauges were available. Most of the data also become available to NCMRWF on a daily basis in real time through the com-munication channels of GTS and the dedicated link of NCMRWF with IMD. The purpose of using IMD gauge data in this study is to have the maximum possible number of gauges, so that in principle it should be possible to use the NMSG algorithm in a near-real-time application to prepare merged satellite-gauge data products on a routine basis with 3B42RT type as the satellite input. Earlier near-real-time merged data preparation was possible with gauge and INSAT IR rain data (Mitra et al. 2003a). However, with the availability of a variety of daily satellite
rainfall data having information from microwave channels and calibrated multi-satellite rainfall data, TMPA data is a more viable and useful option to be used as a first guess in our preparation of the daily merged dataset for the monsoon region.
One main reason for selecting the 2006 monsoon season for preparing the daily merged satellite-gauge datasets was the fact that a large number of gauge
Fig. 1. (a) Distribution of rain gauges on a typical day during the 2006 monsoon season.
(b) Daily number of gauges from the Indian region used in this study during the 122-day 2006 monsoon season.
Fig. 1a
Fig. 1b
March 2009 A. K. MITRA et al. 269
values were available from IMD, and three-hourly rainfall rates from the NASA TMPA algorithm were available. Our testing and comparison of the NMSG for the 2006 monsoon season will showcase the possibility of a best available daily dataset for the Indian monsoon region, including land and neigh-boring oceanic regions. Additionally, the 2006 monsoon season was unique: as many as 16 low-pressure systems formed over the Indian region (12 over the Bay of Bengal, one over the Arabian Sea, and three over land) (IMD 2006). Of these systems, eight intensified (seven over the Bay of Bengal and one over land) into monsoon depressions and one into a severe cyclonic storm (over the Arabian Sea). Therefore, the NMSG for the 2006 monsoon season might be used widely for research purposes and model verifications related to the large-scale aspect
of monsoons. Independently analyzed gridded daily rainfall data (land only) prepared by the IMDNCC for the land region only are also used here to compare our NMSG product with the IMDNCC data. The details of the preparation of the IMDNCC data and the algorithm are given by Rajeevan et al. (2006). The IMDNCC data uses more gauges. The IMDNCC archive has rainfall records from 6329 stations, which includes many observations coming from the state governments and other departments. It takes a considerable amount of time to process, digitize, and apply quality control checks before they are used in the IMDNCC daily gridded dataset. Long-period daily gridded data at 1° x 1° lat-long resolution recently became available (Rajeevan et al. 2006). In the IMDNCC product used in this study, 1803 stations were used, as they were available more
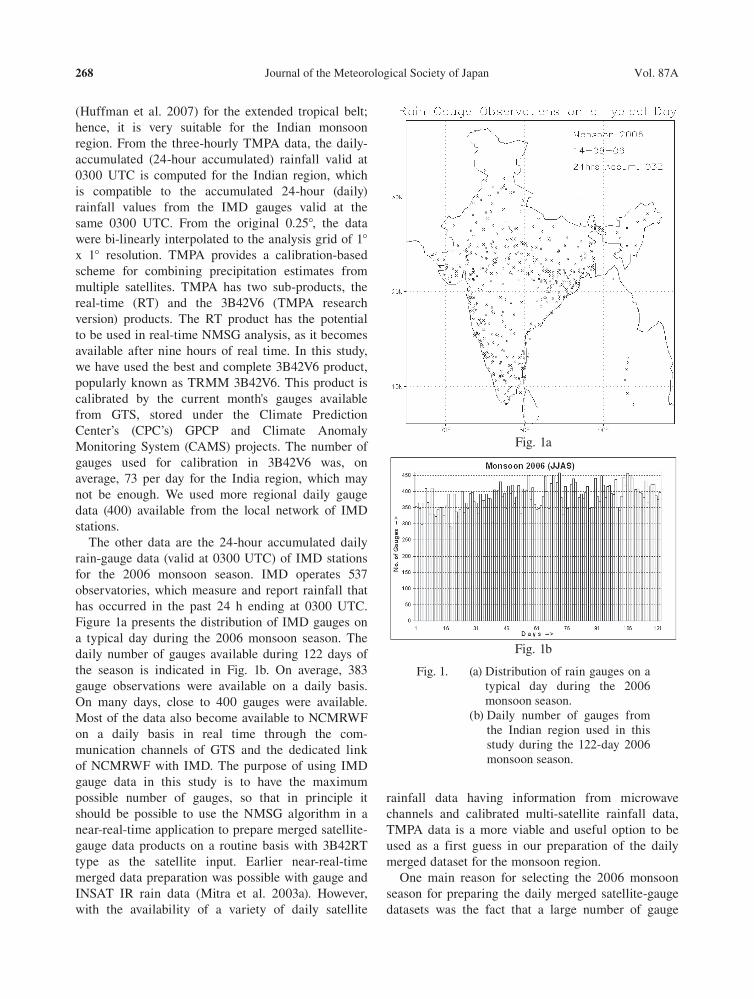
Fig. 2. Rainfall (mm day-1) from TMPA for four different months during the 2006 monsoon season.
270 Journal of the Meteorological Society of Japan Vol. 87A
consistently. In contrast, our NMSG includes 383 IMD gauges daily, which are available within 48 hours of observation to be used in near real time. With these available near-real-time data, we want to confirm the goodness of the NMSG that depicts the large-scale monsoon rainfall over India and its neighborhood.
3. Results and discussion
TMPA monthly rainfalls were obtained from the daily data. The monthly rainfall distributions for June, July, August, and September (JJAS) of 2006 are indicated in the panels of Fig. 2 in millimeters per day. During all the months of the monsoon season, typical monsoon rainfall distribution patterns were observed for the region. The rainfall plots reveal rainfall maxima over the west coast of India and
along the monsoon trough, which generally extends from the Bay of Bengal towards the northwestern part of India. The higher rainfall associated with the monsoon lows and depressions, forming over the northern Bay of Bengal is also captured in the TMPA rain. The northeastern part of India, which also receives heavy rain, is also well represented here. A rain shadow region north of Sri Lanka is also observed during the season. Therefore, on average, the spatial distribution of monsoon rain is well captured by the TMPA data.
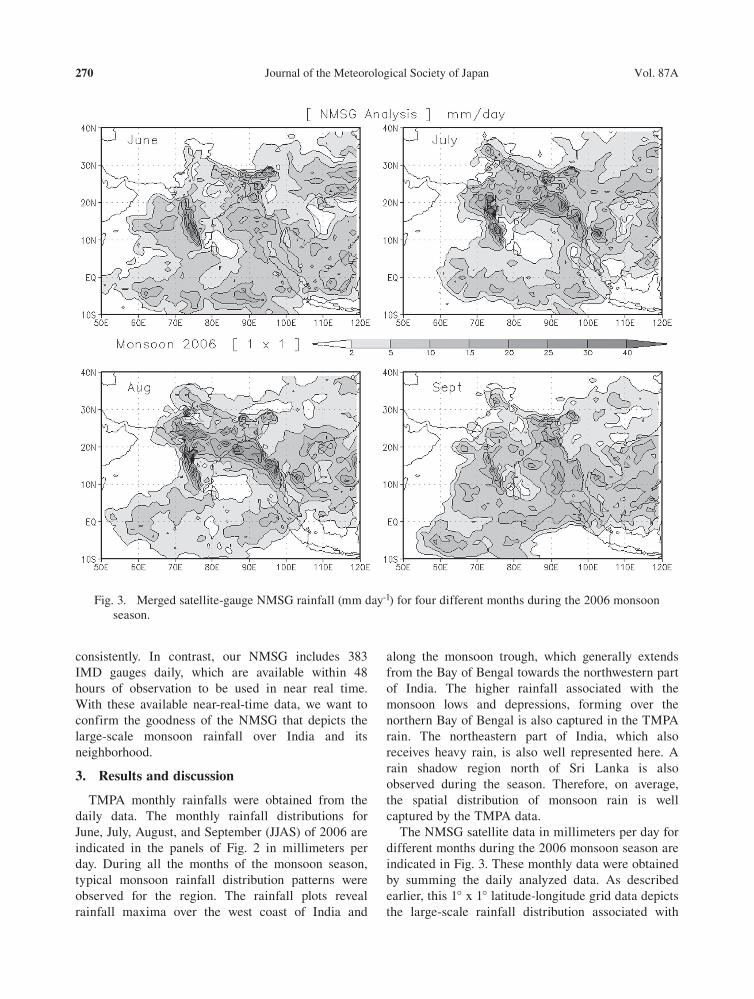
The NMSG satellite data in millimeters per day for different months during the 2006 monsoon season are indicated in Fig. 3. These monthly data were obtained by summing the daily analyzed data. As described earlier, this 1° x 1° latitude-longitude grid data depicts the large-scale rainfall distribution associated with
Fig. 3. Merged satellite-gauge NMSG rainfall (mm day-1) for four different months during the 2006 monsoon season.

March 2009 A. K. MITRA et al. 271
the monsoon for the region. To prepare this data, the daily TMPA data were used as the first guess. The first guess from TMPA was then corrected by merging the available gauge data. Compared to the monthly TMPA data, in the NMSG rainfall distribution we observe that the rainfall intensity changed over some regions. The incorporation of gauge data into NMSG corrects the biases of the TMPA data over those regions. As the gauge data are only over land, the corrections are seen only for the land portion. No changes are observed over sea and oceanic regions. Figure 3 indicates that the rainfall
over the west coast region and the northeastern part is enhanced. The impact of incorporating gauge data is clearly seen in Fig. 4, which reveals the differences in rainfall values in millimeters per day between NMSG and the corresponding TMPA for four different months during the 2006 monsoon season. More rainfall usually occurs in June, July and August than in September. In Fig. 4, the positive values (higher NMSG values than TMPA values) are shaded at 2, 5, 10, 15, 20, and 25 mm per day, and the negative values (higher TMPA values than NMSG values) are contoured, with contour lines having
Fig. 4. Difference of analyzed and first-guess (NMSG–TMPA) rainfall (mm day-1) for four different months during the 2006 monsoon season.
272 Journal of the Meteorological Society of Japan Vol. 87A
values of 1, 2, 4, 6, 8, and 10 mm per day. As NMSG incorporates gauge data over land, the NMSG values are more realistic than the TMPA values. Clearly, the TMPA underestimates the rainfall in two distinct regions, the west coast extending towards the northwestern part of India, and the northeastern part of the country.
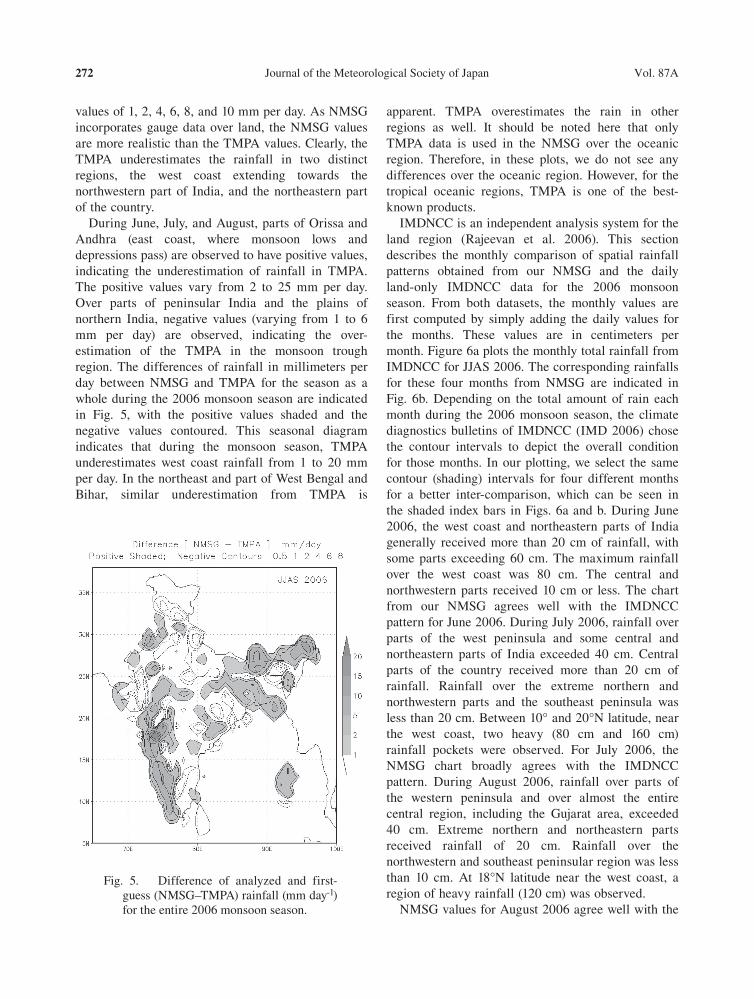
During June, July, and August, parts of Orissa and Andhra (east coast, where monsoon lows and depressions pass) are observed to have positive values, indicating the underestimation of rainfall in TMPA. The positive values vary from 2 to 25 mm per day. Over parts of peninsular India and the plains of northern India, negative values (varying from 1 to 6 mm per day) are observed, indicating the over-estimation of the TMPA in the monsoon trough region. The differences of rainfall in millimeters per day between NMSG and TMPA for the season as a whole during the 2006 monsoon season are indicated in Fig. 5, with the positive values shaded and the negative values contoured. This seasonal diagram indicates that during the monsoon season, TMPA underestimates west coast rainfall from 1 to 20 mm per day. In the northeast and part of West Bengal and Bihar, similar underestimation from TMPA is
apparent. TMPA overestimates the rain in other regions as well. It should be noted here that only TMPA data is used in the NMSG over the oceanic region. Therefore, in these plots, we do not see any differences over the oceanic region. However, for the tropical oceanic regions, TMPA is one of the best-known products.
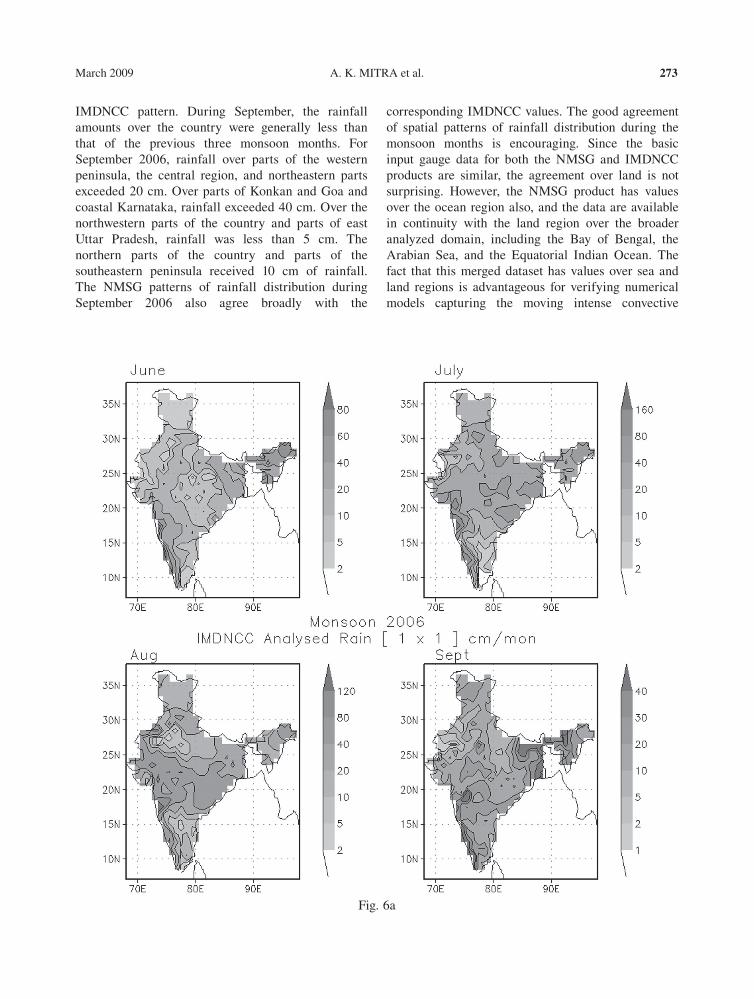
IMDNCC is an independent analysis system for the land region (Rajeevan et al. 2006). This section describes the monthly comparison of spatial rainfall patterns obtained from our NMSG and the daily land-only IMDNCC data for the 2006 monsoon season. From both datasets, the monthly values are first computed by simply adding the daily values for the months. These values are in centimeters per month. Figure 6a plots the monthly total rainfall from IMDNCC for JJAS 2006. The corresponding rainfalls for these four months from NMSG are indicated in Fig. 6b. Depending on the total amount of rain each month during the 2006 monsoon season, the climate diagnostics bulletins of IMDNCC (IMD 2006) chose the contour intervals to depict the overall condition for those months. In our plotting, we select the same contour (shading) intervals for four different months for a better inter-comparison, which can be seen in the shaded index bars in Figs. 6a and b. During June 2006, the west coast and northeastern parts of India generally received more than 20 cm of rainfall, with some parts exceeding 60 cm. The maximum rainfall over the west coast was 80 cm. The central and northwestern parts received 10 cm or less. The chart from our NMSG agrees well with the IMDNCC pattern for June 2006. During July 2006, rainfall over parts of the west peninsula and some central and northeastern parts of India exceeded 40 cm. Central parts of the country received more than 20 cm of rainfall. Rainfall over the extreme northern and northwestern parts and the southeast peninsula was less than 20 cm. Between 10° and 20°N latitude, near the west coast, two heavy (80 cm and 160 cm) rainfall pockets were observed. For July 2006, the NMSG chart broadly agrees with the IMDNCC pattern. During August 2006, rainfall over parts of the western peninsula and over almost the entire central region, including the Gujarat area, exceeded 40 cm. Extreme northern and northeastern parts received rainfall of 20 cm. Rainfall over the northwestern and southeast peninsular region was less than 10 cm. At 18°N latitude near the west coast, a region of heavy rainfall (120 cm) was observed.
NMSG values for August 2006 agree well with the
Fig. 5. Difference of analyzed and first-guess (NMSG–TMPA) rainfall (mm day-1) for the entire 2006 monsoon season.
March 2009 A. K. MITRA et al. 273
IMDNCC pattern. During September, the rainfall amounts over the country were generally less than that of the previous three monsoon months. For September 2006, rainfall over parts of the western peninsula, the central region, and northeastern parts exceeded 20 cm. Over parts of Konkan and Goa and coastal Karnataka, rainfall exceeded 40 cm. Over the northwestern parts of the country and parts of east Uttar Pradesh, rainfall was less than 5 cm. The northern parts of the country and parts of the southeastern peninsula received 10 cm of rainfall. The NMSG patterns of rainfall distribution during September 2006 also agree broadly with the
corresponding IMDNCC values. The good agreement of spatial patterns of rainfall distribution during the monsoon months is encouraging. Since the basic input gauge data for both the NMSG and IMDNCC products are similar, the agreement over land is not surprising. However, the NMSG product has values over the ocean region also, and the data are available in continuity with the land region over the broader analyzed domain, including the Bay of Bengal, the Arabian Sea, and the Equatorial Indian Ocean. The fact that this merged dataset has values over sea and land regions is advantageous for verifying numerical models capturing the moving intense convective
Fig. 6a

274 Journal of the Meteorological Society of Japan Vol. 87A
weather systems and for various other research purposes.
From the daily analyzed values, the seasonal total rainfall (JJAS) was also computed for the 2006 monsoon season from the NMSG and IMDNCC datasets. Figure 7 depicts the inter-comparison of spatial patterns of rainfall for the 2006 monsoon season as a whole. The west coast, west central, central, and eastern parts of the country received
more than 100 cm of rainfall. Rainfall over parts of the west coast and extreme northeastern parts exceeded 200 cm, while that over the southeastern peninsula and the northwestern parts of the country was less than 50 cm. We find very good agreement of values and patterns between analyzed data from NMSG and that from IMDNCC for the monsoon season as a whole. The rainfall maxima of 300 cm between 10° and 20°N are well captured in the
Fig. 6b
Fig. 6. (a) IMDNCC analyzed total rainfall (cm month-1) for four different months during the 2006 monsoon season.
(b) Merged satellite-gauge NMSG total rainfall (cm month-1) for four months during the 2006 monsoon season.
March 2009 A. K. MITRA et al. 275
NMSG analysis. The above comparisons indicate that the merged analysis from NMSG and the land-only analysis from IMDNCC agree very well over land, in terms of rainfall distribution and intensity, for the different months of the monsoon and for the season as a whole. NMSG is a complete daily rainfall dataset for the monsoon season: over land it has the best depiction due to the gauges, and over ocean it has unique and best available TMPA estimates.
Objective scores are computed to compare the TMPA and NMSG with the IMDNCC products to provide quantitative information about the goodness of the proposed merged product from a statistical point of view. Here, we assume that the IMDNCC rainfall data is closest to the true observed state of the atmosphere. Standard statistical parameters like equitable threat score (ETS), hit rate (HR), and correlation coefficient (CC) are computed for the comparisons. A brief description of these categorical statistics is given in Ebert et al. 2007. HR (success rate) is the ratio of the number of correctly forecast points above a threshold to that of the number of forecast points above the corresponding threshold. ETS is commonly used as an overall efficiency
Fig. 7. IMDNCC- and NMSG-analyzed total rainfall (cm) during the 2006 monsoon season.
Fig. 8. Equitable Threat Scores of TMPA (3B42) and NMSG against IMDNCC, for different thresholds, for four different regions for the 2006 monsoon season.
276 Journal of the Meteorological Society of Japan Vol. 87A
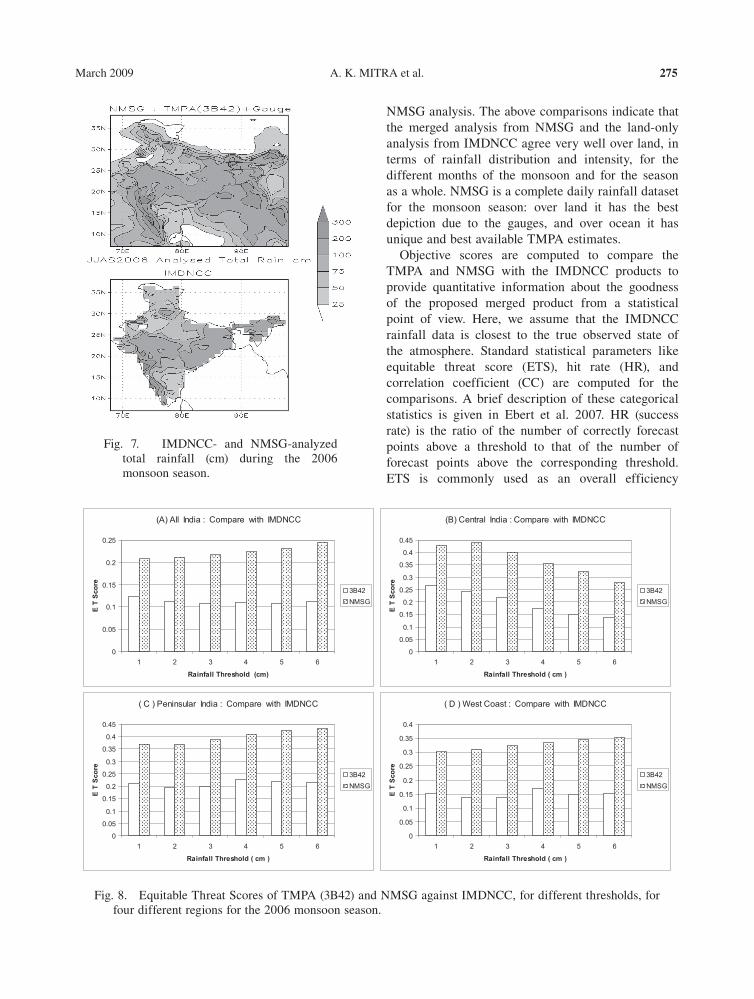
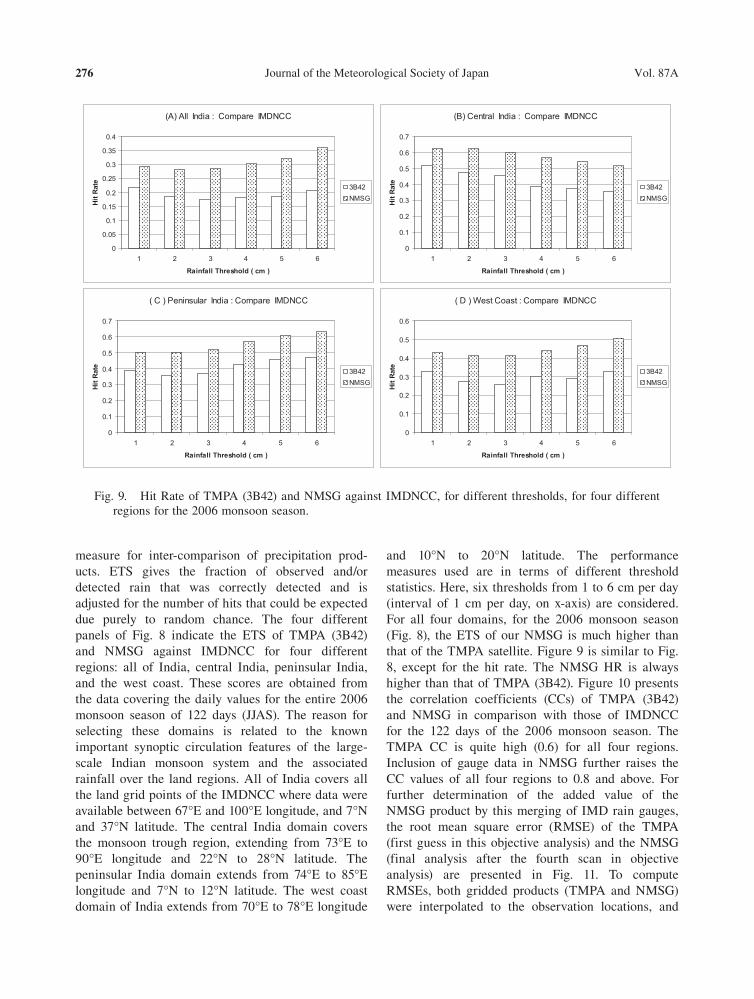
measure for inter-comparison of precipitation prod-ucts. ETS gives the fraction of observed and/or detected rain that was correctly detected and is adjusted for the number of hits that could be expected due purely to random chance. The four different panels of Fig. 8 indicate the ETS of TMPA (3B42) and NMSG against IMDNCC for four different regions: all of India, central India, peninsular India, and the west coast. These scores are obtained from the data covering the daily values for the entire 2006 monsoon season of 122 days (JJAS). The reason for selecting these domains is related to the known important synoptic circulation features of the large-scale Indian monsoon system and the associated rainfall over the land regions. All of India covers all the land grid points of the IMDNCC where data were available between 67°E and 100°E longitude, and 7°N and 37°N latitude. The central India domain covers the monsoon trough region, extending from 73°E to 90°E longitude and 22°N to 28°N latitude. The peninsular India domain extends from 74°E to 85°E longitude and 7°N to 12°N latitude. The west coast domain of India extends from 70°E to 78°E longitude
and 10°N to 20°N latitude. The performance measures used are in terms of different threshold statistics. Here, six thresholds from 1 to 6 cm per day (interval of 1 cm per day, on x-axis) are considered. For all four domains, for the 2006 monsoon season (Fig. 8), the ETS of our NMSG is much higher than that of the TMPA satellite. Figure 9 is similar to Fig. 8, except for the hit rate. The NMSG HR is always higher than that of TMPA (3B42). Figure 10 presents the correlation coefficients (CCs) of TMPA (3B42) and NMSG in comparison with those of IMDNCC for the 122 days of the 2006 monsoon season. The TMPA CC is quite high (0.6) for all four regions. Inclusion of gauge data in NMSG further raises the CC values of all four regions to 0.8 and above. For further determination of the added value of the NMSG product by this merging of IMD rain gauges, the root mean square error (RMSE) of the TMPA (first guess in this objective analysis) and the NMSG (final analysis after the fourth scan in objective analysis) are presented in Fig. 11. To compute RMSEs, both gridded products (TMPA and NMSG) were interpolated to the observation locations, and
Fig. 9. Hit Rate of TMPA (3B42) and NMSG against IMDNCC, for different thresholds, for four different regions for the 2006 monsoon season.

March 2009 A. K. MITRA et al. 277
then the RMSEs were computed at the station on a daily basis. This is a standard practice in data assimilation procedures to check the quality of the final analyses. We examined the RMSEs in each successive scan during the objective analysis, and they were observed to decrease with each step. For clarity, Fig. 11 indicates the RMSEs of the guess and the analysis. On a daily basis, the NMSG system-atically indicated reduced RMSEs, demonstrating that the quality of the NMSG is superior to that of the TMPA. Insertion of more gauges has helped reduce the biases of the TMPA.
4. Summary
An algorithm to merge TMPA satellite estimates with the IMD rain gauge values was tested for the
Indian monsoon region. The NMSG at 1° latitude-longitude resolution for the Indian monsoon region is prepared for the 2006 monsoon season. Incorporation of IMD gauge data corrects the mean biases of the TMPA values. TMPA alone is able to depict the space-time distribution of monsoon rainfall patterns. Merging gauge data enhances the value of the satellite estimates; therefore, the NMSG is more reliable. Daily, monthly and seasonal fields are prepared and compared with the land-only gridded data of IMD at the same resolution. This inter-com-parison with another independent dataset (IMDNCC) confirms the utility of the NMSG algorithm. A comparison of the merged data with the TMPA data indicates the regions where the satellite estimates have mean biases. Objective statistical scores also confirm the goodness of NMSG. An optimal near-real-time rain-monitoring strategy for Indian regions might therefore involve the use of this NMSG product, coming from combined information from the TMPA satellite data and available near-real-time IMD gauge data. TMPA data is available after a month, and the IMD gauges are available within 48 hours of the observation time. The final NMSG merged data are meant for use in the verification of large-scale aspects of numerical models for the Indian monsoon region.
Work on improving satellite estimates must co -ntinue. A lack of validation sites and incomplete validation databases do not help tune the inversion uncertainties in the radiative transfer models of the satellite rainfall estimation algorithms. The ground validation of TRMM products is a continuing process (Wolff et al. 2005). More ground validation sites over the Indian region (land and sea) will be useful. Microwave rainfall estimation over the coastal regions requires special attention (McCollum and Ferraro 2005). The west coast of India is also a topog-raphically complex region, where the rain estimation procedure from the satellite needs to be calibrated with more care for more realistic satellite rain estimation.
Acknowledgements
Rain-gauge data and IMDNCC-analyzed gridded data were available from IMD. TRMM TMPA satel-lite rain estimates were made available from the Na -tional Aeronautics and Space Administration (NASA) TRMM project. The work of Prof. T. N. Krishnamurti was partially supported by NASA TRMM Grant No. NNX07AD39G. Comments and suggestions from two
Fig. 10. Correlation Coefficients of TMPA (3B42) and NMSG against IMDNCC, for four different regions for the 2006 mon-soon season.
Fig. 11. Daily RMSE of TMPA (3B42) and NMSG against gauges during the 2006 monsoon season.

278 Journal of the Meteorological Society of Japan Vol. 87A
anonymous reviewers helped to improve the manu-script substantially. Personal communications with Dr. G. J. Huffman and his group at NASA were very useful.
References
Arkin, P. A., A. V. R. K. Rao, and R. R. Kelkar, 1989: Large-Scale precipation and OLR from INSAT 1B during the 1986 southwest monsoon season, J. Climate, 2, 619–628.
Berg, W., T. L. Ecuyer, and C. Kummerow, 2006: Rainfall climate regimes: The relationship of regional TRMM rainfall biases to the envi-ronment, J. Appl. Meteor. Climatol., 45(3), 434–454.
Bhatt, B. C., and K. Nakamura, 2005: Characteristics of monsoon rainfall around the Himalayas revealed by TRMM Precipitation Radar, Mon. Wea. Rev., 133(1), 149–165.
Cressman, G. P., 1959: An operational objective analysis system, Mon. Wea. Rev., 87, 367–374.
Dinku, T., and E. Anagnostou, 2005: Regional differences in over-land rainfall from PR- calibrated TMI algorithm, J. Appl. Meteor., 44, 189–205.
Ebert, E. E., and J. L. McBride, 2000: Verification of precipitation in weather systems, Determination of systematic errors, J. Hydrology, 239, 179–202.
Ebert, E. E., J. Janowiak, and C. Kidd, 2007: Comparison of near real time precipitation estimates from satellite observations and nu -merical models, Bull. Amer. Meteor. Soc., 88, 47–64.
Furuzawa, F. A., and K. Nakamura, 2005: Differences of rainfall estimates over land by Tropical Rainfall Measuring Mission (TRMM) Precipitation Radar (PR) and TRMM Microwave Imager (TMI)-Dependence on storm height, J. Appl. Meteor., 44(3), 367–383.
Gairola, R. K., and T. N. Krishnamurti, 1992: Rain rates based on SSM/I, OLR and raingauge data sets, J. Meteor. Atmos. Phys., 50, 165–174.
Gambheer, A. V., and G. S. Bhat, 2000: Life cycle characteristics of deep cloud systems over the Indian region using INSAT-1B pixel data, Mon. Wea. Rev., 128, 4071–4083.
Hirose, M., and K. Nakamura, 2002: Spatial and seasonal variation of rain profiles over Asia observed by space-borne Precipitation Radar, J. Climate, 15(23), 3443–3458.
Houze, R. A., D. C. Wilton, and B. F. Smull, 2007: Monsoon convection in the Himalayan region as seen by the TRMM PR, Quart. J. Roy. Meteor. Soc., 133, 1389–1411.
Huffman, G. J., R. F. Adler, P. Arkin, A. Chang, R. Ferraro, A. Gruber, J. Janowiak, A. McNab, B. Rudolf, and U. Schneider, 1997: The GPCP combined precipitation dataset, Bull. Amer. Meteor. Soc., 78, 5–20.
Huffman, G. J., R. F. Adler, D. T. Bolvin, G. Gu, E. J. Nelkin, K. P. Bowman, Y. Hong, E. F. Stocker, and D. B. Wolff, 2007: The TRMM Multisatellite Precipitation Analysis (TMPA): Quasi-Global, multiyear, combined-sensor pre-cipitation estimates at fine scales, J. Hydro. Meteor., 8(1), 38–55.
India Meteorological Department, 2006: Climate Diagnostics Bulletin of India: Near Real Time Analyses, JJAS 2006 , Issue no 124-127 & Spl. Issue no. 42, National Climate Centre, IMD, Pune – 5, India
Joyce, R. J., J. E. Janowiak, P. A. Arkin, and P. Xie, 2004: CMORPH: A method that produces global precipitation estimates from passive microwave and infrared data at high spatial and temporal resolution, J. Hydro. Meteor., 5(3), 487–503.
Kelkar, R. R., and A. V. R. K. Rao, 1992: Extraction of quantitative meteorological information from INSAT imagery. J. Meteor. Soc. Japan, 70, 551–561.
Kripalini, R. H., S. V. Singh, and P. A. Arkin, 1991: Large scale features of rainfall and OLR over India and adjoining regions, Contr. Atmos. Phys., 64, 159–161.
Krishnamurti, T. N., S. Cocke, R. Pasch, and S. Low-Nam, 1983: Precipitation estimates from rain-gauge and satellite observations, summer MONEX , FSU Report:83-7, Dept. of Meteorology, Florida State University, USA., 373 pp.
Krishnamurti, T. N., and C. M. Kishtawal, 2000: A pronounced continental-scale diurnal mode of the asian summer monsoon., Mon. Wea. Rev., 128(2), 462–473.
Kummerow, C., W. Berg, J. Thomas-Stahle, and H. Masunaga, 2006: Quantifying global un -certainties in a simple microwave rainfall algorithm, J. Tech., 23(1), 23–37.
Liu, C., E. J. Zipser, and S. W. Nesbitt, 2007: Global distribution of tropical deep convection: Different perspectives from TRMM infrared

March 2009 A. K. MITRA et al. 279
and radar data, J. Climate, 20(3), 489–503.McCollum, J. R., W. F. Krajewski, R. R. Ferraro, and
M. B. Ba, 2002: Evaluation of biases of satellite rainfall estimation algorithms over the conti-nental United States, J. Appl. Meteor., 41, 1065–1080.
McCollum, J. R., and R. R. Ferraro, 2005: Microwave rainfall estimation over coasts, J. Tech, 22(5), 497–512.
Mitra, A. K., A. K. Bohra, and D. Rajan, 1997: Daily rainfall analysis for Indian summer monsoon region, Int. J. Climatology, 17(10), 1083–1092.
Mitra, A. K., M. Dasgupta, S. V. Singh, and T. N. Krishnamurti, 2003a: Daily rainfall for Indian monsoon region from merged satellite and raingauge values: large-scale analysis from real-time data, J. Hydro. Meteor., 4(5), 769–781.
Mitra, A. K., M. D. Gupta, R. K. Paliwal, and S. V. Singh, 2003b: Observed daily large-scale rain-fall patterns during BOBMEX-99, Proceedings of Indian Academy of Sciences (Earth & Planetary Science), 112(2), 223–232.
Nakamura, K., 1991: Biases of rain retrieval algorithms for spaceborne radar caused by non-uniformity of rain, J. Atmos. Oceanic Technol., 8(3), 363–373.
Okamoto, A. K., T. Iguchi, N. Takahashi, T. Ushio, J. Awaka, S. Shige, and T. Kubota, 2007: High precision and high resolution global pre-cipitation map from satellite data, ISAP 2007 Proceedings, 506–509. (http://www.gsmap.aero.osakafu-u.ac.jp)
Rahman, S. H., B. Simon, and P. C. Joshi, 2007: Evolution of geophysical parameters over the Indian Ocean region during contrasting mon-soon years of 2002 and 2003 using TRMM/TMI data, Theor. Appl. Climatol., 89(3-4), 211–227.
Rajeevan, M., J. Bhate, J. D. Kale, and B. Lal, 2006: High resolution daily gridded rainfall data for the Indian region: Analysis of break and active monsoon spells, Current Science, 91(3), 296–306.
Ramata, M., and A. P. Barros. 2004: Estimation of latent heating of rainfall during the onset of the Indian monsoon using TRMM PR and radiosonde data, J. Appl. Meteor., 43(2), 328–349.
Roads, J., 2003: The NCEP–NCAR, NCEP–DOE, and TRMM tropical atmosphere hydrologic cycles , JHYM, 4(5), 826–840.
Rosenfeld, D., and Y. Mintz, 1988: The evaporation of rain falling from convective clouds as obtained from radar measurements, J. Appl. Meteor., 27(3), 209–215.
Roy Bhowmik, S. K., and A. K. Das, 2007: Rainfall analysis for Indian monsoon region using the merged rain gauge observations and satellite estimates: Evaluation of monsoon rainfall features, J. Earth Syst. Sci., 116(3), 187–198.
Scofield, R. A., and R. J. Kuligowski, 2003: Status and outlook of operational satellite precipitation algorithms for extreme-precipitation events, Wea. Forecasting, 18, 1037–1051.
Sinha, S. K., S. G. Narkhedkar, and A. K. Mitra, 2006: Barnes objective analysis scheme of daily rainfall over Maharastra (India) on a mesoscale grid, Atmosfera, 19(2), 109–126.
Stano, G., T. N. Krishnamurti, T. S. Kumar, and A. Chakraborty, 2002: Hydrometeor structure of a composite monsoon depression using the TRMM radar, Tellus A, 54(4), 370–381.
Stephens, G. L., and C. D. Kummerow, 2007: The remote sensing of clouds and precipitation from space: a review, J. Atmos. Sci., 64(11), 3742–3765.
Tao, W.-K., E. A. Smith, R. F. Adler, Z. S. Haddad, A. Y. Hou, T. Iguchi, R. Kakar, T. N. Krishnamurti, C. D. Kummerow, S. Lang, R. Meneghini, K. Nakamura, T. Nakazawa, K. Okamoto, W. S. Olson, S. Satoh, S. Shige, J. Simpson, Y. Takayabu, G. J. Tripori, and S. Yang, 2006: Retrieval of latent heating from TRMM Measurements, Bull. Amer. Meteor. Soc., 87(11), 1555–1572.
Weymouth, G., G. A. Mills, D. Jones, E. E. Ebert, and M. J. Manton, 1999: A continental scale daily rainfall analysis, Aust. Met. Mag., 48, 169–179.
Wolff, D. A., D. A. Marks, E. Amitai, D. S. Silberstein, B. L. Fisher, A. Tokay, J. Wang, and J. L. Pippitt, 2005: Ground Validation for the TRMM. J. Tech., 22(4), 365–380.
Xie, P., and P. A. Arkin, 1996: Gauge-based monthly analysis of global land precipitation from 1971 to 1994, J. Geophys. Res., 101, 19023–19034.
Xie, P., J. E. Janowiak, P. A. Arkin, R. Adler, A. Gruber, R. Ferraro, G. J. Huffman, and S. Curtis, 2003: GPCP pentad precipitation analyses: An experimental dataset based on gauge observations and satellite estimates, J. Climate, 16(13), 2197–2214.
