dairy cooperatives in the 21st century
TRANSCRIPT
United StatesDepartment ofAgriculture
Rural Business–and CooperativePrograms
ResearchReport 225
Dairy Cooperatives in the 21st Century —The First Decade
Dairy Cooperatives in the 21st Century —The First Decade
United StatesDepartment ofAgriculture
Rural Business–and CooperativePrograms
ResearchReport 225
Abstract Dairy cooperatives continued to dominate the milk industry at the first-handler level
during 2000-10. The number of dairy cooperatives shrunk by a net of 60 cooperatives
during 2000-10. Of the 83 cooperatives that exited, 49 were sold or otherwise went out
of operation, 30 had merged with another cooperative, and 4 no longer had producer
milk. Twenty-three new cooperatives formed during 2000-10. There were eight more
cooperatives with diversified operations, mostly due to existing cooperatives expand-
ing the scope of their operations. There were few fluid processing cooperatives in both
2000 and 2010, even with a net decline of just one cooperative. Niche marketing coop-
eratives were the most dynamic among the manufacturing/processing cooperatives
with many entries, exits, and operational changes. The number of bargaining-only
cooperatives continued to far out-number the other operating types of dairy coopera-
tives, despite declining by a net 49 cooperatives during 2000-10. Small cooperatives
(those handling less than 50 million pounds of milk per year) no longer represented a
majority of the Nation’s dairy cooperatives. The North Atlantic region continued to have
the most dairy cooperatives headquartered there, though a majority of these were
small cooperatives.
Key Words: Dairy cooperatives, milk, milk marketing, dairy producers, extra value
Dairy Cooperatives in the 21st Century—The First Decade
Carolyn B. Liebrand
Rural Business-Cooperative Service
RBS Research Report 225
July 2012
Cover photo by USDA photographer Lance Cheung

Preface The Cooperative Marketing Act of 1926 tasked the U.S. Department of Agriculture
(USDA) to gather data on cooperatives and to conduct research on issues related to
the cooperative marketing of agricultural products and the cooperative purchase of
farm supplies and services. This project serves to document changes in the dairy
cooperative sector over the first decade of the 21st century. It follows the previous
report, Rural Business-Cooperative Service (RBS) Research Report 187: Structural
Change in the Dairy Cooperative Sector, 1992-2000.
Information for this report comes primarily from data collected via surveys of U.S dairy
cooperatives conducted by RBS. In 1997, 2002, and 2007, surveys collected detailed
information on the marketing operations of dairy cooperatives. Dairy cooperatives’ size
categories were also based on information from these marketing operations surveys.
Financial data was collected from RBS’s annual surveys of all agricultural coopera-
tives.
For the periodic marketing operations surveys, any cooperative that marketed milk for
member-producers was considered a dairy cooperative. By necessity, the annual RBS
survey used a different criterion—if a majority of the cooperative’s sales were from the
sale of milk and dairy products, it was considered a dairy cooperative.
Industry statistics were taken from various USDA agencies: Economic Research
Service, Foreign Agricultural Service, and the National Agricultural Statistics Service.
The extra value index calculations followed the methodology previously developed by
RBS (Research Report 212: Measuring Performance of Dairy Cooperatives by K.
Charles Ling, June 2006).
i

ii
iii
Contents Highlights . . . . . . . . . . . . . . . . . . . . . . . . . . . . . . . . . . . . . . . . . . . . . . . . . . . . . . . . . . .iv
Iintroduction . . . . . . . . . . . . . . . . . . . . . . . . . . . . . . . . . . . . . . . . . . . . . . . . . . . . . . . . .1
Background . . . . . . . . . . . . . . . . . . . . . . . . . . . . . . . . . . . . . . . . . . . . . . . . . . . . . . . . . .1
Milk production trends . . . . . . . . . . . . . . . . . . . . . . . . . . . . . . . . . . . . . . . . . . .1
Dairy product production trends . . . . . . . . . . . . . . . . . . . . . . . . . . . . . . . . . . .1
Marketing environment . . . . . . . . . . . . . . . . . . . . . . . . . . . . . . . . . . . . . . . . . .2
Regulations . . . . . . . . . . . . . . . . . . . . . . . . . . . . . . . . . . . . . . . . . . . . . . . . . . .2
Dairy cooperative dynamics . . . . . . . . . . . . . . . . . . . . . . . . . . . . . . . . . . . . . . . . . . . . .2
Operating types of dairy cooperatives . . . . . . . . . . . . . . . . . . . . . . . . . . . . . . .4
Changes by type of dairy cooperative . . . . . . . . . . . . . . . . . . . . . . . . . . . . . . .4
Changes by size of dairy cooperative . . . . . . . . . . . . . . . . . . . . . . . . . . . . . . .5
Changes by regional headquarters of dairy cooperatives . . . . . . . . . . . . . . . .7
Dairy cooperatives in 2010 . . . . . . . . . . . . . . . . . . . . . . . . . . . . . . . . . . . . . . . . . . . .10
Financial Performance . . . . . . . . . . . . . . . . . . . . . . . . . . . . . . . . . . . . . . . . . . . . . . . . 10
Extra Value . . . . . . . . . . . . . . . . . . . . . . . . . . . . . . . . . . . . . . . . . . . . . . . . . .13
Summary . . . . . . . . . . . . . . . . . . . . . . . . . . . . . . . . . . . . . . . . . . . . . . . . . . . . . . . . . .16
List of Tables
Table 1—Dairy cooperative exits and entries, 2000-2010 . . . . . . . . . . . . . . . . . . . . . .3
Table 2—Types of dairy cooperative exits and entries between 2000 and 2010 . . . . .6
Table 3—Dairy cooperative exits and entries, by size, 2000-2010 . . . . . . . . . . . . . . . .8
Table 4—Dairy cooperative exits and entries, by region, 2000-2010 . . . . . . . . . . . . . .9
Table 5—Status of 2010 dairy cooperatives, by mode of operation, size . . . . . . . . . .11
Table 6—Status of 2010 dairy cooperatives, by region . . . . . . . . . . . . . . . . . . . . . . .12
Table 7—Dairy cooperatives with positive average Extra Value Index, 2000-04 . . . . . .
and 2005-09 . . . . . . . . . . . . . . . . . . . . . . . . . . . . . . . . . . . . . . . . . . . . . . . .14
Table 8—Comparison of dairy cooperatives average Extra Value Index for . . . . . . . . . .
2000-04 and 2005-09, by operating mode and status . . . . . . . . . . . . . . . . .16
Appendix table 1—2010 dairy cooperatives by operating mode, status, size . . . . . . . . .
and region . . . . . . . . . . . . . . . . . . . . . . . . . . . . . . . . . . . . . . . . . . . . . . . . . .22
Appendix table 2—Ranking of manufacturing/processing dairy cooperatives by
the Extra Value Index . . . . . . . . . . . . . . . . . . . . . . . . . . . . . . . . . . . . . . . . .24
Appendix table 3—Ranking of bargaining-only dairy cooperatives by
the Extra Value Index . . . . . . . . . . . . . . . . . . . . . . . . . . . . . . . . . . . . . . . . .26
Map—Change in Number of Dairy Cooperatives Between 2000 and 2010 by
Headquarters Region . . . . . . . . . . . . . . . . . . . . . . . . . . . . . . . . . . . . . . . . . .30
Highlights
In the first decade of the 21st century, dairy cooperatives lost a net of 60 coopera-
tives—dropping from 211 in 2000 to 151 in 2010. Of the 151 dairy cooperatives operat-
ing in 2010, almost 3 of every 4 had been in operation prior to 1992, but only a little
more than 1 in 7 had been formed since 2000.
The number of dairy cooperatives that disappeared between 2000 and 2010 outpaced
the number of new cooperatives that were formed by nearly four to one. Almost two of
every five dairy cooperatives existing in 2000 had gone out of existence by 2010, aver-
aging 7.5 cooperative exits per year between 2000 and 2010. About two new dairy
cooperatives were formed per year, on average.
Most of the 83 cooperatives that ceased to exist between 2000 and 2010 were sold or
otherwise went out of operation (49 cooperatives) while 30 merged with another coop-
erative. Four no longer handled member-producer milk.
There were eight more cooperatives with diversified operations in 2010 than in 2000.
The increase was mostly due to cooperatives that broadened their operations to
become diversified, where there was just one newly formed diversified cooperative.
Three of the four exits of diversified cooperatives were by merger.
All the other operating types saw declines in their numbers. The number of coopera-
tives that did not operate plants for manufacturing or processing milk products saw the
largest decline between 2000 and 2010, but continued to far out-number the other
operating types of dairy cooperatives.
There was ample adjustment among cooperatives that manufactured or processed
their members’ milk into specialty niche products. Over the 2000-10 decade, quite a
few cooperatives exited or ceased making niche products, while at the same time a
number of cooperatives began making niche products or were formed in order to make
niche products.
The small cooperatives (those handling less than 50 million pounds of milk annually)
had more exits and entries than either medium-sized cooperatives (50 to 1 billion
pounds) or large cooperatives (1 billion pounds or more). Furthermore, the net drop of
63 small cooperatives during 2000-10 was the largest change among the 3 size
groups. Accordingly, small cooperatives went from being a majority of the Nation’s
dairy cooperatives (60.2 percent in 2000) to 42.4 percent in 2010.
Medium-sized cooperatives showed the smallest net change in numbers—a decline of
three cooperatives, while the number of large cooperatives grew by a net of six coop-
eratives, mostly due to increases in the amount of milk handled by existing coopera-
tives.
Close to one-half of the 83 dairy cooperative exits were in the North Atlantic region. In
addition, the North Atlantic was the only region where a majority of the cooperative
exits were by merger. The South Atlantic region (with the fewest cooperatives of all the
regions in 2000) had no exits and added two cooperatives during 2000-10. The East
North Central region had 8 new cooperatives form between 2000 and 2010 while the
North Atlantic region had 7 new cooperatives form—accounting for almost two-thirds of
iv

all new dairy cooperatives. In contrast, the South Central region was the only region
with no new cooperatives.
The performance of dairy cooperatives was examined using a measure of financial
performance that takes into account the alternative cost of using member-supplied
capital, the extra value index. The results indicate that, on average, dairy cooperatives
generated extra value for their members for the entire decade, meaning their earnings
were able to cover a nominal charge for their use of member-supplied capital. The
results also indicated that for cooperatives that merged, financial performance was not
an obvious reason for their exit; rather, a strong position may have made them attrac-
tive merger candidates. On the other hand, for the cooperatives that dissolved by
2010, poor financial performance may have been a contributing factor.
The changes outlined in this report reveal dairy cooperatives to be flexible, responsive
organizations that adapt to member needs in the marketplace. Dairy cooperatives rep-
resent a major share of U.S. milk production even as some have altered their opera-
tions to meet changes in the market environment and some have gone out of busi-
ness. The cooperative model for U.S. milk producers appears resilient across a range
of operating types.
v

Dairy Cooperatives in the 21st Century—TheFirst Decade
Carolyn Betts Liebrand
Agricultural Economist
Introduction
The beginning of the 21st century found dairy
cooperatives continuing to dominate the milk industry
at the first-handler level. Over this first decade of the
2000s, dairy cooperatives continued to adapt their
operations in order to best market their members’
milk. Some cooperatives expanded operations to han-
dle increased member milk supplies by building or
expanding manufacturing plants. In addition, they
added equipment, facilities, and expertise to hone
product lines to better serve their customers.
Cooperatives merged and created alliances to increase
efficiency, in part by reducing marketing and adminis-
trative overhead expenses. Atypical events included a
dairy cooperative bankruptcy and the sale of a long-
enduring cooperative to an investor-owned dairy com-
pany.
This report examines and describes the changes
in the U.S. dairy cooperative sector that have occurred
in the first decade of the 21st century. The changes in
cooperative numbers according to their mode of oper-
ation, their size, and where they are headquartered are
documented. In addition, the financial performance of
dairy cooperatives is examined.
Background
Dairy cooperatives exist to serve their member-
owner dairy producers. Dairy producers have long
looked to cooperatives to provide a market outlet for
the milk they produce and representation in the mar-
ketplace. Accordingly, conditions in the broader dairy
industry have direct implications for dairy cooperative
operations.
Milk production trendsThe volume of milk marketed by U.S. producers
grew an average of 2.6 billion pounds annually
between 2000 and 2010 (box 1). Cow numbers
decreased by an average of 9,700 head annually, but
there were increases in 6 of the 10 years. In contrast,
the number of licensed dairy herds in the United
States continued on a steady downward trend.
Accordingly, the number of memberships in coopera-
tives with a majority of sales from milk and dairy
products shrunk by an average of 5,300 per year dur-
ing 2000-10. The number of producer-members of
cooperatives that handled producer milk likewise
showed a drop between 2002 and 2007 to about 50,000
producer-members.
The volume of milk marketed by U.S. milk pro-
ducers per licensed dairy herd nearly doubled from an
annual average of 2.4 million pounds per licensed
dairy herd in 2003 to 3.6 million pounds in 2010.
Likewise, the amount of milk produced per dairy
cooperative producer-member also increased between
2002 and 2007 (the years it was measured). Moreover,
cooperative member-producers marketed about 82
percent of all milk marketed by U.S. producers in both
2002 and 2007.
Dairy product production trendsThe figures in box 2 provide a snapshot of pro-
duction and marketing in the major dairy product cat-
egories with the volume marketed by cooperatives.
Notable is the continued growth in cheese production
for 2000-10. Cooperative marketing of cheese did not
follow suit. Cheese marketed by cooperatives was 435
million pounds lower in 2007 than in 2002, while U.S.
cheese production rose by 1.2 billion pounds between
1

those 2 years. Accordingly, the share of cheese market-
ed by cooperatives continued a downward trend,
falling to 26 percent in 2007.
Nonfat dry milk (NFDM) production continued
on an upward trend. Likewise, dairy cooperatives
marketed 96 percent of U.S. NFDM production in
2007, up from 84 percent in 2002. U.S. butter produc-
tion also increased an average of 30.7 million pounds
per year between 2000 and 2010. Dairy cooperatives
marketed 71 percent of the U.S. butter production in
2002 and 2007.
The volume of milk used for fluid products in the
United States increased 3 billion pounds from 2000 to
2010, while the cooperative share of the U.S. packaged
fluid milk volume was steady at 7 percent both in 2002
and 2007.
In total, the volume of milk cooperatives manu-
factured or processed rose somewhat from 56.2 million
pounds in 2002 to 57.5 million pounds in 2007.
However, dairy cooperatives’ share of the volume of
the total milk used in manufacturing processing in the
United States declined slightly from 33.1 percent in
2002 to 31.0 percent in 2007.
Marketing environment The first decade of the 21st century was tumul-
tuous for both the dairy industry and the United States
economy generally. The volatility of milk prices expe-
rienced in the 1990s only increased in the first decade
of the 21st century. Average monthly milk price
peaked in November 2007 at an all-time record of
$21.90 per hundredweight (cwt) and then fell to less
than $11.50 per cwt for June and July of 2009, revers-
ing the fortunes of many a dairy farmer (box 3).
Month-to-month changes in average milk price were
greater than $2 per cwt 8 times in the decade. (In con-
trast, month-to-month changes were more than $2 per
cwt just 6 times from 1980 to 2000.)
While milk prices were swinging from record
highs to record lows, feed prices saw dramatic increas-
es toward the end of the decade. As a result, annual
average income over feed cost (a measure of milk pro-
duction profitability) was erratic, ranging by a margin
of $7.49 per cwt of milk from high to low between 2000
and 2010. (By way of comparison, it varied by just
$2.91 per cwt from high to low during the previous
decade.)
Likewise, total sales (net of sales between cooper-
atives) for cooperatives with a majority of sales from
milk and dairy product sales fluctuated from year to
year over 2000-10. These cooperatives’ total sales fell in
5 of the 10 years between 2000 and 2010 and ranged
from an increase of $8.1 billion in 2007 to a drop of
$9.9 billion in 2009. (In contrast, total sales for cooper-
atives with majority milk and dairy product sales fell
only once in the previous decade, with the largest
year-to-year change at only $1.9 billion).
RegulationsIn the regulatory arena, the Federal milk market-
ing orders were consolidated into 11 orders as this cen-
tury began. In 2004, the Western order was terminated,
leaving 10 milk marketing orders in the United States.
The milk price support program was also altered to
support dairy product prices rather than milk prices.
The support purchase price for nonfat dry milk was
lowered while the purchase price for butter support
was raised. There were minimal government purchas-
es of surplus dairy products during the decade. An
income support program was instituted where under
certain conditions the U.S. Government made direct
monthly payments to qualifying dairy producers.
Dairy Cooperative Dynamics
Dairy cooperatives are vibrant organizations,
adapting to changes in the marketplace and member
needs while striving to maximize their efficiency and
effectiveness. The trend to fewer dairy producers pro-
ducing larger milk volumes is mirrored by the net
decline of 60 cooperatives serving member-milk pro-
ducers between 2000 and 2010 (table 1). Moreover, of
the 211 cooperatives operating in 2000, 83 coopera-
tives, or almost two of every five, had exited by 2010.
However, while a majority of cooperatives dissolved
(49 cooperatives), quite a few exits (30 cooperatives)
were by merger with other dairy cooperatives. The
mergers represent producer organizations realigning
themselves to address the increase in size of their cus-
tomers and to improve efficiency in milk marketing
and handling operations. Only a handful of coopera-
tives (4 cooperatives) ceased handling producer milk
between 2000 and 2010.
As an indication of the vitality of the cooperative
form of business for milk marketing, 23 new coopera-
tives formed over the 2000-10 decade. And, of the 83
cooperatives that ceased to exist, one-third exited by
merging into another cooperative. Furthermore, the
members of cooperatives that were sold or ceased
operation often signed up with other coopertives.
Thus, the drop in the number of cooperatives does not
2

3
Ta
ble
1—
Dair
y c
oo
pera
tive e
xit
sen
trie
s a
nd
, 2
000-1
0
Tota
lN
et
2000
No longer
Exits
Entr
ies
42010
change
tota
lM
erg
ed
1D
issolv
ed
2"d
airy”3
2000-1
02000-1
0to
tal
2000-1
0
_______________________________________________________________________
__
__
__
__
__
__
__
__
__
__
__
__
__
__
__
__
__
_
Num
ber
of dairy
coopera
tives
211
30
49
483
23
15
1-6
0
Perc
ent of 2000
_______
_________________________________________________________
__________________________________________________
Share
14.2
23.2
1.9
39.3
10
.97
1.6
-28
.4
1C
oopera
tives that m
erg
ed w
ith a
noth
er
coopera
tive a
nd
were
not th
e s
urv
ivin
g e
ntity
.2
Coopera
tives that w
ere
sold
, dis
solv
ed, etc
.3
Coopera
tives n
o lon
ger
handlin
g m
em
ber
milk
.4
Inclu
des c
oopera
tives form
ed b
y m
erg
er
of exis
ting c
oopera
tives w
hen the n
ew
entity
opera
ted u
nder
a n
ew
nam
e.
indicate a decline in the usefulness of dairy coopera-
tives, but rather points to their ability to adapt to mar-
ket conditions and member needs.
Operating types of dairy cooperativesOver the years, dairy farmers have banded
together to form cooperative businesses to better mar-
ket their milk. The methods these farmers directed
their cooperatives to use to ensure a market for their
raw milk varied widely. For this reason, dairy cooper-
atives have been broadly classified according to their
type of operations.
Diversified cooperatives carry out a diverse set of
activities, such as making and marketing a variety of
dairy products while also selling a large portion of
their members’ milk as bulk, raw milk to other han-
dlers to ensure that members have a place in the mar-
ket. Their products may include butter, dried milk
powder(s), and cheese. The butter and cheese may be
produced in bulk for other manufacturers or in con-
sumer-ready packages, or both. Some cooperatives
produce cheese or dry milk products with specific cri-
teria as requested by their customers. Diversified
cooperatives may also bottle fluid milk and make
“soft” products such as yogurt, cottage cheese, and
sour cream. Typically, these cooperatives handle a
large volume of milk and have members in numerous
States.
Fluid processing cooperatives process their mem-
bers’ milk in bottling plants and market packaged bev-
erage milk. In addition, they may make a variety of
soft products and/or ice cream. However, very few
cooperatives have gone this route exclusively. The
fluid processing sector is competitive and requires
ample financial resources and top-notch management.
Niche marketing cooperatives typically process
all of their members’ milk in the cooperative’s plants
to manufacture and market specialty or branded
cheese and other dairy products for particular mar-
kets. They often market their products directly to con-
sumers and typically handle a relatively small volume
of milk. A few sell a portion of their milk raw, and in
some cases the cooperative does not have its own man-
ufacturing facilities, but has made arrangements with
a processor (or processors) to make their specialty
products.
Bargaining-only cooperatives are the most
numerous type of dairy cooperative in the United
States. They operate at the first-handler level in seek-
ing to secure the most profitable outlets for their mem-
bers’ milk and provide producers a say in the market.
They may negotiate prices and terms of trade, as well
as secure a buyer(s) for members’ milk. For the most
part, bargaining-only cooperatives do not own plants.
Some have members in multiple States and handle a
large volume of milk while others are quite small and
provide only basic marketing services for members.
Two other operating types, “bargaining-balanc-
ing” and “hard product manufacturing” are no longer
economically viable. Bargaining-balancing coopera-
tives were those that operated at the first-handler level
bargaining for their producer-members, but also had
plant facilities to accommodate handlers’ needs and/or
to balance milk supplies. Their manufacturing opera-
tions were generally used for manufacturing commod-
ity dairy products (butter, powder, and sometimes
cheese) for last-resort balancing of surplus milk vol-
ume. The cost of inefficient plant utilization led this
type of cooperative to merge with other cooperatives,
alter their operations, or dissolve.
In fact, between 2000 and 2010, five bargaining-
balancing cooperatives expanded their operations to
the point that they are considered diversified coopera-
tives while one merged with a diversified dairy coop-
erative. And since 2000, three bargaining-balancing
cooperatives closed their plants to focus on bargaining
only while two dissolved. However, dairy coopera-
tives continue to provide the balancing function in
milk markets—now it is mostly provided by the diver-
sified cooperatives. The diversified cooperatives direct
varying volumes of milk through their systems of
plants to accommodate the ebb and flow of milk pro-
duction and demand.
Similarly, hard-product manufacturing coopera-
tives have adopted diversified operations. Previously,
these cooperatives used most of their members’ milk
in their own manufacturing plants to make undifferen-
tiated, commodity dairy products. These cooperatives
had the opportunity to capture processor margins by
operating well-run, large-scale modern plants, but
found that their margins became very narrow. Some
found it more advantageous to diversify their product
lines and to formulate products to unique customer
specifications. One hard-product manufacturing coop-
erative merged with other cooperatives and through
the combination of operations, gained the advantages
of diverse operations. Interestingly, none of the hard-
product manufacturing cooperatives went out of busi-
ness altogether in the 10-year period.
Changes by type of dairy cooperativeThere was substantial adjustment in dairy coop-
erative operations between 2000 and 2010. In fact,
there were as many changes in operating focus as
4

there were new cooperatives formed (23). There were
net declines in the number of cooperatives according
to all operating types, except for diversified dairy
cooperatives—the only type that saw an increase in
their numbers (table 2).
Even so, three diversified cooperatives merged to
better position their producer-members in the market-
place while one diversified cooperative was sold to a
privately owned dairy company (its members then
joined alternative dairy cooperatives, for the most
part). Another diversified cooperative became pre-
dominately focused on its fluid operations and so is
classified as a fluid processing cooperative. Therefore,
of the 14 diversified cooperatives in 2000, five were no
longer counted in the diversified category in 2010.
One new diversified cooperative was formed in
the 2000-10 decade by a merger of three manufactur-
ing/processing dairy cooperatives (diversified, fluid
processing, and hard-product manufacturing). There
were a dozen cooperatives that expanded the scope of
their operations to become categorized as diversified,
with the bulk of these (seven cooperatives) being for-
mer bargaining-balancing or hard-product manufac-
turing cooperatives. Three niche marketing coopera-
tives grew into diversified operations and two
formerly bargaining-only cooperatives added manu-
facturing/processing operations between 2000 and
2010. Remarkably, a majority of the diversified cooper-
atives in 2010 (13 out of 22 cooperatives) were not
operating as diversified cooperatives a decade earlier.
Of the four fluid cooperatives operating in 2000,
three went out of existence by 2010—one by merger
and two through dissolution. Furthermore, no new
cooperatives were formed to operate primarily in the
fluid milk processing arena. However, notably, one
bargaining-only cooperative did add fluid milk bot-
tling operations during the decade and a diversified
cooperative became more appropriately classified as a
fluid processing cooperative. So, there were three fluid
processing cooperatives in 2010, only one of which had
been a fluid bottler the entire decade.
The niche marketing category saw quite a bit of
change between 2000 and 2010, despite the net decline
of just four cooperatives. Of the 23 niche marketing
cooperatives in 2000, eight went out of operation by
2010. Three of these were relatively short-lived cooper-
atives, as they were formed after 1992 and went out of
operation by 2010. Furthermore, another five coopera-
tives moved out of niche operations over the decade.
Three medium-sized niche marketing cooperatives
added additional product lines and became diversi-
fied, while two small niche cooperatives ceased manu-
facturing operations but continued to exist as bargain-
ing-only cooperatives. As a result, by 2010 a majority
of the niche marketing cooperatives in existence 10
years earlier (13 cooperatives) had either exited or
ceased manufacturing niche products.
At the same time, five new niche marketing coop-
eratives were formed between 2000 and 2010 to make
and market niche dairy products. Mostly they sought
to capitalize on unique milk production characteristics
such as “organic” or “grass-fed.” In addition, four
small cooperatives that had been performing only bar-
gaining services in 2000 began manufacturing special-
ty cheese by 2010. In some cases, these cooperatives
were returning to the cheese manufacturing business.
As mentioned above, there were no longer any
cooperatives that fit in the bargaining-balancing or
hard-product manufacturing categories. Most of these
(10 cooperatives) altered their operations to continue
in operation—7 as diversified and 3 as bargaining-only
cooperatives.
Fittingly, the most numerous type of dairy coop-
erative, bargaining-only, saw the largest decline in
numbers between 2000 and 2010. The largest number
exited by dissolving (36 cooperatives) while 24
merged, mostly into diversified cooperatives.
Bargaining-only cooperatives were the only type
where some (four cooperatives) no longer handled
producer milk. Seven bargaining-only cooperatives
added manufacturing/processing operations to
become niche marketing cooperatives (four coopera-
tives), fluid processing cooperatives (one cooperative),
or diversified cooperatives (two cooperatives).
Meanwhile, there were 17 newly formed bargain-
ing-only cooperatives. In addition, as mentioned
above, five cooperatives got out of the manufacturing
business to focus solely on their bargaining functions.
Despite the net decline of 49 cooperatives over the
decade, bargaining-only cooperatives continue to far
out-number the other operating types of dairy cooper-
atives in 2010.
Changes by size of dairy cooperative Dairy cooperatives were also classified according
to the amount of milk they handled. (However, milk
volume is not necessarily a proxy for the number of
member-farms since the amount of milk produced on
any given farm varies widely, with some cooperatives
dominated by members with large herd sizes, others
with smaller, and some with mixed farm sizes).
The small cooperatives (those handling less than
50 million pounds of milk annually) continued to be
the most numerous size of cooperative, but the num-
5

6
Ta
ble
2—
Typ
es o
f d
air
y c
oo
pera
tive e
xit
s a
nd
en
trie
s b
etw
een
2000 a
nd
2010
Exits
Net
No
Mode
plu
sM
ode
change
2000
longer
Tota
lchanges
mode
changes
Tota
l2010
2000-
Opera
ting M
ode
co-o
ps
Merg
ed
1D
issolv
ed
2"d
airy"3
Exits
from
changes
Entr
ies
4to
additio
ns
co-o
ps
10
Num
ber
of dairy c
oopera
tives
___________________________________________________________________________
__
__
__
__
__
__
__
__
__
__
__
__
__
__
__
__
__
__
__
__
__
_
Div
ers
ified
14
31
04
15
11
21
32
28
Flu
id4
12
03
03
02
23
-1
Nic
he
23
08
08
513
54
91
9-4
HP
M, B
B 5
14
22
04
10
14
00
00
-14
Barg
ain
ing-o
nly
156
24
36
464
771
17
52
21
07
-49
Tota
l211
30
49
483
23
23
23
n/a
15
1-6
0
Perc
ent of 2000 c
oopera
tives, by type
P
erc
ent of 2010 c
oopera
tives, by type
Perc
ent
_
of 2000
Div
ers
ified
21.4
7.1
0.0
28.6
7.1
35.7
4.5
54
.55
9.1
57
.1
Flu
id25.0
50.0
0.0
75.0
0.0
75.0
0.0
66
.76
6.7
-25
.0
Nic
he
0.0
34.8
0.0
34.8
21.7
56.5
26
.32
1.1
47
.4-1
7.4
HP
M, B
B 5
14.3
14.3
0.0
28.6
71.4
100.0
n/a
n/a
n/a
-10
0.0
Barg
ain
ing-o
nly
15.4
23.1
2.6
41.0
4.5
45.5
15
.94
.72
0.6
-31
.4
Tota
l14.2
23.2
1.9
39.3
10.9
15
.21
5.2
-2
8.4
Note
: M
ode o
f opera
tion w
as d
ete
rmin
ed fro
m the m
ark
eting o
pera
tions s
urv
ey d
ata
of 1997, 2002 a
nd/o
r 2007.
1C
oopera
tives that m
erg
ed w
ith a
noth
er
coopera
tive a
nd
were
not th
e s
urv
ivin
g e
ntity
.2
Coopera
tives that w
ere
sold
, dis
solv
ed, etc
.3
Coopera
tives n
o lon
ger
handlin
g m
em
ber
milk
.4
Inclu
des c
oopera
tives form
ed b
y m
erg
er
of exis
ting c
oopera
tives w
hen the n
ew
entity
opera
ted u
nder
a n
ew
nam
e.
5H
ard
Pro
duct M
anu
factu
ring a
nd B
arg
ain
ing B
ala
ncin
g c
oopera
tives

ber dropped sharply from 127 small cooperatives in
2000 to 64 in 2010 (table 3). In fact, most of the 83 dairy
cooperative exits between 2000 and 2010 were in the
small cooperative category (62 cooperatives). Most of
the small cooperatives exited by dissolution (41 coop-
eratives), while 17 small cooperatives merged with
other cooperatives and 4 no longer handled producer
milk. At the same time, 14 small cooperatives grew in
size.
Despite the large number of exits, 12 new small
cooperatives were formed over 2000-10, representing a
majority of the 23 newly formed dairy cooperatives.
Regardless, the net decline of 63 small cooperatives
was the largest among the size groups.
There was quite a bit of adjustment among the
medium-sized cooperatives (those handling from 50 to
1 billion pounds of milk annually), yet the number of
medium-size cooperatives declined by just 3 coopera-
tives in the 2000-10 period. Nineteen medium coopera-
tives went out of operation—12 by merger while 7 dis-
solved. Seven changed size category where six
medium-sized cooperatives grew into large coopera-
tives and just one shrank. As noted above, 13 small
cooperatives grew into medium-sized cooperatives.
Finally, 10 new medium-sized cooperatives were
formed during the decade.
In contrast, the number of large cooperatives
(those that handled 1 billion pounds or more of milk
annually) grew by a net of six cooperatives. This
growth was due to increases in the amount of milk
handled by seven existing cooperatives, with just one
newly formed large cooperative. Otherwise, there was
little change among the large cooperatives, where just
one cooperative exited by merger and one by dissolu-
tion and none shrunk in size.
Changes by regional headquarters of dairycooperatives
Dairy cooperatives continue to have a presence in
every region of the United States. The most dairy
cooperatives were headquartered in the North Atlantic
region, both in 2000 and in 2010. This region also had
the most cooperative exits among the regions (table 4).
Of the 41 cooperative exits in the North Atlantic dur-
ing the decade, 21 were by merger. Most of those that
merged had been members of a federation that dis-
banded, and they subsequently merged into a large
diversified cooperative, also headquartered in the
North Atlantic. While most of those merging were
small bargaining cooperatives, three medium and
large manufacturing/processing cooperatives head-
quartered in the North Atlantic went out by merging.
There were seven newly formed dairy coopera-
tives in the North Atlantic region. One was the result
of the merger between the three manufacturing/pro-
cessing cooperatives mentioned above. Most were
newly formed, small bargaining-only cooperatives,
some organized by organic milk producers. Still, there
was a net reduction of 34 cooperatives from 2000 to
2010, more than in any other region.
The South Atlantic region was unique in being
the only region not to have any dairy cooperative exits
and to see an increase in the number of dairy coopera-
tives headquartered there. Two new medium-sized
bargaining-only cooperatives formed between 2000
and 2010, giving the South Atlantic a total of five dairy
cooperatives, the second-fewest dairy cooperatives in
2010, rather than the fewest as in 2000.
The East North Central region had 14 dairy coop-
eratives exit—almost all by dissolution, where just 1
merged and 2 no longer handled producer milk. Yet,
there were eight entries—three of which were small
niche marketing cooperatives and the remaining five
were bargaining-only cooperatives. So, there was a net
decline of six cooperatives in the East North Central
region.
Similarly, the West North Central region had 19
dairy cooperatives exit. Most dissolved and two no
longer handled producer milk, but five had merged
with other cooperatives. Only two new cooperatives
were formed in the West North Central region.
Therefore, the West North Central region had the sec-
ond-largest decline in number of dairy cooperatives
(17 cooperatives) among the regions.
In contrast, the South Central region saw just one
cooperative merge with another dairy cooperative and
another dissolve between 2000 and 2010. Furthermore,
it was the only region with no new cooperatives. The
net decline of two dairy cooperatives meant the South
Central region had the fewest dairy cooperatives in
2010.
The Western region had 2 cooperatives exit by
merger and 5 that dissolved, so 7 out of the 16 dairy
cooperatives headquartered there in 2000 had exited
by 2010. Most of those that dissolved were small and
medium bargaining-only cooperatives, but one was a
fluid processing cooperative that went bankrupt. Four
bargaining-only cooperatives were formed between
2000 and 2010—all in the Mountain States of Idaho,
New Mexico, and Utah.
7

8
Ta
ble
3—
Dair
y c
oo
pera
tive e
xit
s a
nd
en
trie
s, b
y s
ize, 2000-1
0
Exits
Entr
ies
No
Siz
eplu
s2000-
Siz
e
plu
s
Net
Siz
e2000
longer
Tota
lchanges
siz
e2010-
changes
siz
e2010
change
cate
gory
co-o
ps
Merg
ed
1D
issolv
ed
2"d
airy"3
Exits
from
changes
Entr
ies
4to
changes
co-o
ps
2000-1
0_____________________________________________________________________________________________________________________________________
Num
ber
of coopera
tives
Sm
all5
127
17
41
462
14
76
12
11
36
4-6
3
Mediu
m6
62
12
70
19
726
10
13
23
59
-3
Larg
e7
_22
_1
_1
0_2
_0
2_
1_
78
28
6
Tota
l211
30
49
483
21
23
21
15
1-6
0
Perc
ent of 2000 c
oopera
tives, by s
ize
P
erc
ent of 2010 c
oopera
tives, by s
ize
Perc
ent
_
of 2000
Sm
all5
13.4
32.3
3.1
48.8
11.0
59.8
18
.81
.62
0.3
-49
.6
Mediu
m6
19.4
11.3
0.0
30.6
11.3
41.9
16
.92
2.0
39
.0-4
.8
Larg
e7
4.5
4.5
0.0
9.1
0.0
9.1
3.6
25
.02
8.6
27
.3
Tota
l14.2
23.2
1.9
39.3
10.0
15
.21
3.9
-28
.4
Note
: S
ize c
ate
gory
was d
ete
rmin
ed fro
m the m
ark
eting o
pera
tions s
urv
ey d
ata
of 1997, 2002 a
nd/o
r 2007.
1C
oopera
tives that m
erg
ed w
ith a
noth
er
coopera
tive a
nd w
ere
not th
e s
urv
ivin
g e
ntity
.2
Coopera
tives that w
ere
sold
, dis
solv
ed, etc
.3
Coopera
tives n
o lon
ger
handlin
g m
em
ber
milk
.4
Inclu
des c
oopera
tives form
ed b
y m
erg
er
of exis
ting c
oo
pera
tives w
hen the n
ew
entity
opera
ted u
nder
a n
ew
nam
e.
5C
oopera
tives that h
andle
d less than 5
0 m
illio
n p
ounds o
f m
ilk a
nnually
.6
Coopera
tives that h
andle
d 5
0 to 9
99 m
illio
n p
ounds o
f m
ilk a
nnually
.7
Coopera
tives that h
andle
d 1
bill
ion o
r m
ore
pounds o
f m
ilk a
nnually
.

9
Ta
ble
4—
Dair
y c
oo
pera
tive e
xit
s a
nd
en
trie
s, b
y r
eg
ion
, 2000-1
0
No longer
Tota
l2000-1
02010
Net
2000 c
oops
Merg
ed
1D
issolv
ed
2dairy
3exits
Entr
ies
4coops
change
Num
ber
of coopera
tives
Nort
h A
tlantic
88
21
20
04
17
54
-34
South
Atlantic
30
00
02
52
East N
ort
h C
entr
al
41
111
21
48
35
-6
West N
ort
h C
entr
al
55
512
21
92
38
-17
South
Centr
al
51
10
20
3-2
Weste
rn_19
_2
_5
0_
7_
4_
16
-3A
ll re
gio
ns
211
30
49
48
32
31
51
-60
Perc
ent of
Perc
ent of
Perc
ent of 2000 c
oopera
tives, by r
egio
n
2010
2000
__________________________________________________________
____
_________
_________
Nort
h A
tlantic
23.9
22.7
0.0
46
.61
3.0
-38
.6
South
Atlantic
0.0
0.0
0.0
0.0
40
.06
6.7
East N
ort
h C
entr
al
2.4
26.8
4.9
34
.12
2.9
-14
.6
West N
ort
h C
entr
al
9.1
21.8
3.6
34
.55
.3-3
0.9
South
Centr
al
20.0
20.0
0.0
40
.00
.0-4
0.0
Weste
rn10.5
26.3
0.0
36
.82
5.0
-15
.8
All
regio
ns
14.2
23.2
1.9
39
.31
5.2
-28
.4
1C
oopera
tives that m
erg
ed w
ith a
noth
er
coopera
tive a
nd w
ere
not th
e s
urv
ivin
g e
ntity
.2
Coopera
tives that w
ere
sold
, dis
solv
ed, etc
.3
Coopera
tives n
o longer
handlin
g m
em
ber
milk
.4
Entr
ies inclu
de c
oop
era
tives form
ed b
y m
erg
er
of exis
tin
g c
oopera
tives w
hen the n
ew
entity
opera
ted u
nder
a n
ew
nam
e.

Dairy cooperatives in 2010
Of the 151 dairy cooperatives operating in 2010,
almost 3 of every 4 (110 cooperatives) had been operat-
ing since prior to 1992 (table 5). Most of these coopera-
tives had been operating since well before 1990s,
where at least a dozen had been operating for over 75
years. Eighteen cooperatives were relatively newer
cooperatives, having been formed during 1992-99,
while 23 cooperatives were newly formed during 2000-
10.
As the marketing environment and needs of the
producer-members changes, dairy cooperatives adjust
their operations. Some cooperatives significantly
altered their operations such that they were identified
as a different operating type. Nineteen of the coopera-
tives that had been operating since prior to 1992 had
changed their mode of operation during 2000-10.
Moreover, four of the newer cooperatives had also
changed their mode of operation during 2000-10.
However, 91 of the Nation’s dairy cooperatives in 2010
had been in operation since prior to 1992 and had con-
tinued in the same mode of operation durinng 2000-10.
While these cooperatives likely expanded, altered, and
adapted their operations over the years, they remained
in the same category of operations.
Furthermore, a majority of the cooperatives of
each operating type had been in operation since prior
to 1992. However, bargaining-only cooperatives were
the only type of dairy cooperative where a majority
(71.0 percent) had been operating since prior to 1992
and had not changed from focusing solely on bargain-
ing functions over the 2000-10 decade. In contrast, only
a minority of the manufacturing/processing coopera-
tives (diversified, fluid processing, and niche market-
ing cooperatives) that had been in operation since
prior to 1992 had continued operating within the same
mode of operation during 2000-10. For example, only
27.3 percent of the 22 diversified cooperatives, had
been operating with diversified operations since prior
to 1992. Similarly, while all three of the fluid process-
ing cooperatves had been in operation since prior to
1992, just one had been identified as a fluid processing
cooperative since prior to 1992.
Among the manufacturing/processing coopera-
tives, niche marketing cooperatives were remarkable
because they had the highest proportion of coopera-
tives (42.1 percent) that had been in operation since
prior to 1992 and that had remained niche marketers
for the 2000-10 decade (where 3 cooperatives had
niche operations for 100 years or more). At the same
time, niche marketing cooperatives also had the largest
proportion of entries (26.3 percent) during 2000-10.
The proportion of cooperatives in 2010 that had
been in operation since prior to 1992 was similar
among the size groups. Yet, the small cooperatives had
the largest proportion (71.9 percent) of cooperatives in
continuous operation since prior to 1992 that were still
in the same size category in 2010 as in 2000. Barely
over one-half of the medim and large cooperatives
(54.2 and 53.6 percent, respectively) had been operat-
ing since prior to 1992 and were still within the same
size category as in 2000. Furthermore, a number of the
newer medium and large cooperatives had changed
size category over the 2000-10 decade.
At the end of the decade, almost all of the small
cooperatives were niche marketing and bargaining-
only cooperatives, with three out of four small cooper-
atives being the latter (where the operating modes and
size categories are based on 2007 survey data; appen-
dix table 1). Conversely, a majority of the large cooper-
atives were diversified cooperatives (60.7 percent),
while 35.7 percent were bargaining-only cooperatives.
The medium-size category was dominated by bargain-
ing-only cooperatives (84.7 percent). There were no
small diversified cooperatives or large niche market-
ing cooperatives by 2010.
Finally, a majority of dairy cooperatives in every
region except the Western and South Atlantic regions
had been in operation since prior to 1992 (table 6). The
West North Central and North Altantic regions had
the largest proportion of cooperatives that had been in
operation since prior to 1992 (84.2 and 79.6 percent,
respectively). In contrast, one-fourth of the dairy coop-
eratives in the Western region, and 40.0 percent in the
South Atlantic, had entered during 2000-10. Also,
nearly one-fourth of the cooperatives (22.9 percent) in
the East North Central region had entered during
2000-10.
Financial performance
Agricultural marketing cooperatives with a
majority of their sales from milk and dairy products
averaged nearly $400 million annually over 2000-09 in
total net income before taxes (NIBT). In 2009, coopera-
tives with a majority of their sales from milk and dairy
products reported a decade-high $742.9 million in net
income. Furthermore, 2008 total NIBT of $533.3 million
10

11
Ta
ble
5—
Dair
y c
oo
pera
tives, b
y len
gth
of
tim
e in
op
era
tio
n, m
od
e o
f o
pera
tio
n a
nd
siz
e, 2010
Mode o
f opera
tion
Siz
e c
ate
gory
___________________________________________________________________________
_______________________________
Barg
ain
ing
All
Div
ers
ified
Flu
idN
iche
only
Sm
all
Mediu
mLarg
e___________________________________________________________________________
_______________________________
Num
ber
of coopera
tives
Dairy c
oopera
tives, 2010
151
22
319
10
76
45
92
8
Continuous o
pera
tion
1
Mode c
hanged
219
10
24
31
11
5
Sam
e m
ode 3
_91
_6
1_8
76
46
32
15
Tota
l, c
ontinuous o
pera
tion
110
16
312
79
47
43
20
New
er4
Mode c
hanged
24
20
02
02
2
Sam
e m
ode 3
14
30
2_
95
45
Tota
l, n
ew
er
18
50
21
15
67
Entr
ies 2
000-1
023
10
51
71
21
01
Perc
ent of 2010 c
oopera
tives
Continuous o
pera
tion
1
Mode c
hanged
212.6
45.5
66.7
21.1
2.8
1.6
18
.61
7.9
Sam
e m
ode 3
60.3
27.3
33.3
42.1
71
.07
1.9
54
.25
3.6
Tota
l, c
ontinuous o
pera
tion
72.8
72.7
100.0
63.2
73
.87
3.4
72
.97
1.4
New
er4
Mode c
hanged
22.6
9.1
0.0
0.0
1.9
0.0
3.4
7.1
Sam
e m
ode 3
_9.3
13.6
0.0
10.5
_8
.47
.8_
6.8
17
.9
Tota
l, n
ew
er
11.9
22.7
0.0
10.5
10
.37
.81
0.2
25
.0
Entr
ies 2
000-1
015.2
4.5
0.0
26.3
15
.91
8.8
16
.93
.6
1C
oopera
tives in e
xis
tence s
ince p
rior
to 1
992 a
nd in c
on
tinuous o
pera
tion thro
ugh 2
010.
2M
ode o
f opera
tion (
siz
e c
ate
gory
) changed d
uring 2
000
-10.
3O
pera
ted w
ith s
am
e m
ode o
f opera
tion (
siz
e c
ate
gory
) during 2
000-1
0.
4C
oopera
tives e
nte
ring d
uring 1
992-9
9 a
nd in o
pera
tion t
hro
ugh 2
010.

12
Ta
ble
6—
Dair
y c
oo
pera
tives, b
y len
gth
of
tim
e in
op
era
tio
n a
nd
reg
ion
, 2010
Nort
hS
outh
East N
ort
hW
est N
ort
hS
outh
Atlantic
Atlantic
Centr
al
Centr
al
Centr
al
Weste
rn___________________________________________________________
__________________________________________________
Num
ber
of coopera
tives
Continuous o
pera
tion
143
224
32
27
New
er
24
13
41
5
Entr
ies 2
000-1
03
_7
_2
_8
_2
0_
4
2010 c
oops
54
535
38
31
6
Perc
ent of 2010 c
oopera
tives
_____________________________________________________________________________________
Continuous o
pera
tion
179.6
40.0
68.6
8
4.2
66
.74
3.8
New
er
27.4
20.0
8.6
10
.53
3.3
31
.3
Entr
ies 2
000-1
03
_13.0
_40.0
_22.9
__
5.3
__
0.0
25
.0
2010 c
oops
100.0
100.0
100.0
10
0.0
10
0.0
10
0.0
1C
oopera
tives in e
xis
tence s
ince p
rior
to 1
992 a
nd in c
ontinuous o
pera
tion thro
ugh 2
010.
2C
oopera
tives e
nte
ring d
uring 1
992-9
9 a
nd in o
pera
tion thro
ugh 2
010.
3C
oopera
tives b
egin
nin
g o
pera
tions in 2
000-1
0 p
eriod, in
clu
din
g c
oopera
tives form
ed b
y m
erg
er
of exis
ting c
oopera
tives w
hen the n
ew
entity
opera
ted u
nder
a n
ew
nam
e.

was the second highest for dairy cooperatives in the
years 2000-10 (figure 12). The low NIBT was $283.6
million in 2002.
Extra ValueThe “extra value” measure was developed by
USDA Rural Development Cooperative Programs
staff. This measure allows the evaluation of coopera-
tives’ use of member-supplied funds—whether mem-
bers’ capital is earning more, or less, than it could in
alternative investments. A positive extra value indi-
cates that a cooperative has created value by its opera-
tions, while a negative extra value means that a coop-
erative has actually diminished the value of members’
investment.
The diverse operations of dairy cooperatives
require different levels of capital usage. One way to
neutralize the effect of this diversity of cooperative
operations is to express extra value as a ratio. Extra
value divided by the cooperative’s operating capital
indicates the rate at which a cooperative is creating
extra value. Operating capital represents the financial
resources available to cooperative management to run
the business.
Extra value is calculated by subtracting an inter-
est charge on equity from net savings. The interest
charge on equity is found by multiplying member
equity by a charge for member equity. “LIBOR plus 2”
is used to represent the charge for member equity
because the charge is not commonly found on coopera-
tives’ balance sheets. The LIBOR-plus-2 rate used is
the December average British Banker’s Association’s
London Inter-Bank Offered Rate (BBA Libor for U.S.
dollar loans with a 12-month maturity) plus 200 basis
points. Libor plus 2 represents the commonly held
opinion that banks in the United States generally will
extend loans to a firm with a better-than-average cred-
it rating, at an interest rate of about 200 basis points
above the LIBOR. This is the same charge for equity
capital that was used in previous applications of the
extra value measure.
The Extra Value Index (EVI) is calculated by
dividing the extra value by operating capital.
Operating capital is simply fixed assets plus net work-
ing capital (current assets minus current liabilities).
For this report, sufficient financial information
for the extra value to be calculated was available for
only a portion of the dairy cooperatives. Nonetheless,
the results indicate that on average, both the manufac-
turing/processing cooperatives (diversified, fluid pro-
cessing, and niche marketing cooperatives) and bar-
gaining-only cooperatives generated positive extra
value for their members for almost the entire decade
(fig 13). (Bargaining-only cooperatives together aver-
aged a slightly negative EVI in 2005.) Dairy coopera-
tive earnings, on average, were able to cover a nominal
charge for their use of member-supplied capital
throughout the decade.
Individual cooperatives’ EVI were also averaged
for 2000-04 and for 2005-09 to get a picture of dairy
cooperatives’ performance during the decade. For the
2000-04, EVI was calculated for 141 cooperatives with
sufficient data, while for 2005-09, the EVI could be cal-
culated for 110 cooperatives. Table 7 shows the num-
ber of cooperatives with positive average EVI for 2000-
04 and 2005-09, and the individual cooperatives’
rankings can be found in appendix table 2.
Most manufacturing/processing cooperatives
operating in 2010 that had been in continuous opera-
tions since prior to 1992 had positive EVI for both
halves of the 2000-10 decade. In fact, only one of these
manufacturing/processing cooperative had negative
average EVI for 2005-09. Likewise, a majority of the
bargaining-only cooperatives operating in 2010 that
had been in continuous operation since prior to 1992
had positive average EVI during the decade, but the
proportion was smaller than for manufacturing/pro-
cessing cooperatives.
The cooperatives that dissolved had smaller pro-
portions with positive average EVI. In particular, just
one-third and one-fourth of the bargaining-only coop-
eratives that dissolved averaged positive extra value
for 2000-04 and 2005-09, respectively. In contrast, a
majority of the cooperatives that merged averaged
positive EVI whether manufacturing/processing or
bargaining only.
Only two manufacturing/processing cooperatives
were in the top 10 percent of the EVI ranking of all
cooperatives for 2000-04. One of these was a coopera-
tive operating in 2010 that had been in continuous
operation since prior to 1992 and the other a coopera-
tive that dissolved prior to 2010. The same manufac-
turing/processing cooperative also ranked in the top 10
percent for 2005-09. Meanwhile, there was just one
manufacturing/processing cooperative that ranked in
the bottom 10 percent, and it was a cooperative operat-
ing in 2010 that had been in continuous operation
since prior to 1992, and ranked in the bottom 10 per-
cent for 2005-09 only.
Most of the cooperatives ranking in the top or
bottom 10 percent by average EVI were bargaining-
only cooperatives for both 2000-04 and 2005-09. In
2000-04, six bargaining-only cooperatives operating in
2010 that had been in continuous operation since prior
13

14
Ta
ble
7—
Dair
y c
oo
pera
tives w
ith
po
sit
ive a
vera
ge E
xtr
a V
alu
e In
dex, 2000-0
4 a
nd
2005-0
9
2005-0
92000-0
4_________________________________________________________
___
__________________________________________________
Type/s
tatu
sC
oopera
tives 1
Avera
ge E
VI >
0C
oopera
tives 2
Avera
ge E
VI >
0_________________ _______________________________
________________ ___________________________
Num
ber
of
Num
ber
of
Perc
ent
Num
ber
N
um
ber
P
erc
ent
co-o
ps
co-o
ps
of co-o
ps o
f co-o
ps
Manufa
ctu
ring/p
rocessin
g c
oopera
tives
Continuous o
pera
tion
325
21
84.0
24
23
95
.8
New
er
45
480.0
74
57
.1
Entr
ies 2
000-1
0n/a
n/a
n/a
11
10
0.0
Merg
ed 5
65
83.3
21
50
.0
Dis
solv
ed 6
_5
_3
60.0
n/a
n/a
n/a
41
33
80.5
34
29
85
.3
Barg
ain
ing-o
nly
coo
pera
tives
Continuous o
pera
tion
358
42
72.4
51
33
64
.7
New
er
45
480.0
54
80
.0
Entr
ies 2
000-1
03
266.7
11
76
3.6
Merg
ed 5
15
10
66.7
54
80
.0
Dis
solv
ed 6
_19
_6
31.6
_4
_1
25
.0
100
64
64.0
76
49
64
.5
11
41 c
oopera
tives h
ad s
uffi
cie
nt data
for
Extr
a V
alu
e Ind
ex (
EV
I) c
alc
ula
tion.
21
10 c
oopera
tives h
ad s
uffi
cie
nt data
for
EV
I calc
ula
tion.
3C
oopera
tives in e
xis
tence s
ince p
rior
to 1
992 a
nd in c
ontinuous o
pera
tion thro
ugh 2
010.
4C
oopera
tives e
nte
ring d
uring 1
992-9
9 a
nd in o
pera
tion thro
ugh 2
010.
5C
oopera
tives that w
ent out of busin
ess b
y m
erg
er
betw
een 2
000 a
nd 2
010.
6C
oopera
tives that w
ent out of busin
ess b
etw
een 2
000 a
nd 2
010, not in
clu
din
g those that m
erg
ed.

15
to 1992 and five bargaining-only cooperatives that
merged by 2010 were in the top 10 percent of the coop-
eratives, according to average EVI. Alternatively, for
2005-09, five new bargaining-only cooperatives ranked
in the top 10 percent, according to average EVI. The
relatively large number of bargaining-only coopera-
tives ranking in the top or bottom 10 percent may be
due in part to the nature of the bargaining-only opera-
tions. Many of the bargaining-only cooperatives had
relatively few assets, which resulted in rather large
EVIs when a moderate amount of extra value was
divided by a relatively small value for operating capi-
tal.
Finally, some 90 cooperatives had data for both
time periods—30 manufacturing/processing coopera-
tives and 60 bargaining-only cooperatives. Of these, 23
of the manufacturing/processing cooperatives and 45
of the bargaining-only cooperatives were cooperatives
operating in 2010 that had been in continuous opera-
tion since prior to 1992. Seventy percent of these manu-
facturing/processing cooperatives had higher average
EVI in 2005-09 over 2000-04, and none averaged nega-
tive EVI for 2005-09. In contrast, less than one-half of
the bargaining-only cooperatives operating in 2010 that
had been in continuous operation since prior to 1992
saw an improvement in their average EVI for 2005-09
compared to 2000-04. On top of that, a smaller propor-
tion of these bargaining-only cooperatives had positive
average EVI for 2005-09 than for 2000-04 (Table 8). One
bargaining-only cooperative operating in 2010 that had
been in continuous operation since prior to 1992
ranked in the top 10 percent of all cooperatives for both
2000-04 and 2005-09, (as did one enduring manufactur-
ing/processing cooperative, mentioned above.)
It appears that many cooperatives of both types
(manufacturing/processing and bargaining-only coop-
eratives) were able to perform well in volatile econom-
ic times, with manufacturing/processing cooperatives
perhaps a bit better off in the second half of the decade.
The new entries and newer dairy cooperatives
had mixed results. Some had their average EVI
improve between 2000-04 and 2005-09, while at the
same time fewer had positive extra value in 2005-09
compared to 2000-04. However, the newer bargaining-
only cooperatives had the same number with positive
extra value for both time periods.
Only one of the bargaining-only cooperatives that
merged saw an improvement in average EVI between
2000-04 and 2005-09, and none of those that dissolved
had positive average EVI for 2005-09.
These results indicate that for cooperatives that
merged, poor financial performance was not an obvi-
ous reason for their exit. In fact, a strong position may
have made them attractive merger candidates. But it
should be noted that only one cooperative that merged
saw its average EVI improve for 2005-09 over 2000-04.
On the other hand, for the bargaining-only coop-
eratives that dissolved over 2000-10, poor financial per-
formance may have been a contributing factor. Just
one-third of the bargaining-only cooperatives that dis-
solved had positive extra value for 2000-04 and none
had positive EVI for 2005-09.
Summary
The changes outlined in this report reveal dairy
cooperatives to be flexible, responsive organizations
that adapt to members’ needs in the marketplace and
continue to take a variety of paths in marketing mem-
bers’ milk. Some dairy cooperatives have long-
endured. Others continued in operation by significant-
ly altering their operations. And also, new dairy
cooperatives formed during 2000-10.
Like their dairy-farmer owners, dairy coopera-
tives declined in number even as the amount of milk
they produced and marketed continued to grow. Small
cooperatives declined to less than one-half of the
Nation’s dairy cooperatives, even though a majority of
the North Atlantic cooperatives continue to be small.
Much of the adjustment in dairy cooperative numbers
was in the small category where a majority went out of
business, but quite a few merged or grew into medi-
um-sized cooperatives.
Modes of operation that were successful in previ-
ous decades have given way to alternative operating
types. Some dairy cooperatives adapted to a changed
marketplace by shifting out of bargaining-balancing
operations and from a limited hard-product manufac-
turing focus over the 2000-10 time period. Other dairy
cooperatives left manufacturing-processing operations
behind altogether whereas others added plant opera-
tions over the decade. Bargaining-only cooperatives
were perhaps the most flexible operating type as evi-
denced by the numerous entries and exits. This could
be in part due to their having few fixed assets.
On the other hand, over one-half of the niche
marketing cooperatives in existence in 2000 went out of
business or out of niche marketing operations by 2010,
while over one-fourth of the 2010 niche marketing
cooperatives had adopted niche marketing operations
during the decade.
At the same time that some dairy cooperatives
have made marked adaptations to their marketing

16
Ta
ble
8—
Co
mp
ari
so
n o
f d
air
y c
oo
pera
tives a
vera
ge E
xtr
a V
alu
e In
dex f
or
2000-0
4 a
nd
2005-0
9, b
y o
pera
tin
g m
od
e a
nd
sta
tus
1
Extr
a v
alu
e index
________________________________________________________________________________
Coopera
tives
2000-2
004
2005-2
009
EV
I im
pro
ved
Opera
ting m
ode/s
tatu
sE
VI>
0E
VI>
0
Num
ber
of coopera
tives
_______________________________________________________________________________________________
Manufa
ctu
ring/p
rocessin
g c
oopera
tives
Continuous o
pera
tion 2
23
20
23
16
New
er
35
42
2
Merg
ed 4
_2
_2
_1
_0
30
26
26
18
Barg
ain
ing-o
nly
co
opera
tives
Continuous o
pera
tion 2
45
32
30
22
New
er
34
33
2
Entr
ies 2
000-1
03
21
2
Merg
ed 4
53
41
Dis
solv
ed 5
_3
_1
_0
_0
60
41
38
27
Perc
ent of coopera
tives in c
ate
gory
_______________________________________________________________
Manufa
ctu
ring/p
rocessin
g c
oopera
tive
Continuous o
pera
tion 2
87.0
10
0.0
69
.6
New
er
380.0
40
.04
0.0
Merg
ed 4
100.0
50
.00
.0
Barg
ain
ing-o
nly
co
opera
tives
Continuous o
pera
tion
271.1
66
.74
8.9
New
er
375.0
75
.05
0.0
Entr
ies 2
000-1
066.7
33
.36
6.7
Merg
ed 4
60.0
80
.02
0.0
Dis
solv
ed 5
33.3
0.0
0.0
1In
clu
des o
nly
those d
airy c
oopera
tives w
ith d
ata
for
both
tim
e p
eriods (
2000-0
4 a
nd 2
005-0
9).
2C
oopera
tives in e
xis
tence s
ince p
rior
to 1
992 a
nd in c
ontinuous o
pera
tion thro
ugh 2
010.
3C
oopera
tives e
nte
ring d
uring 1
992-9
9 a
nd in o
pera
tion thro
ugh 2
010.
4C
oopera
tives that w
ent out of busin
ess b
y m
erg
er
betw
een 2
000 a
nd 2
010.
5C
oopera
tives that w
ent out of busin
ess b
etw
een 2
000 a
nd 2
010, not in
clu
din
g those that m
erg
ed.
situations, many cooperatives have long-endured
within a particular marketing mode or size category.
That is not to say that they have not made adjustments
to address changes in the marketplace. These coopera-
tives have modernized their plants and equipment,
built or acquired new plants, expanded product lines,
entered joint ventures, and/or broadened member ser-
vices, even as they continued with the same general
type of operations.
While the dairy cooperative sector is buffeted by
the same economic storms as the broader economy
and impacted by changes in milk production, the
financial performance data suggests that dairy cooper-
atives on average are able to use member capital effec-
tively. However, the economic environment, to the
extent that is common to all dairy cooperatives, may
impact each cooperative’s performance differently. In
the distressful economic times of the later part of the
decade, some dairy cooperatives made additional pay-
ments to their members to help them through the diffi-
culties of record-low pay prices and record-high input
costs. This type of assistance boosted members’ bottom
lines but likely reduced the cooperatives’ NIBT.
All this attests to the viability of the cooperative
model in dairy marketing while at the same time high-
lighting that there is no one ideal mode of dairy coop-
erative operation. The fact that dairy cooperatives
have been able to thrive using a variety of operating
modes and under a broad range of economic condi-
tions indicates that dairy cooperatives are likely to
continue as the marketing organizations of choice for
many dairy farmers in the years to come.
17

18
Box 1–U.S. milk production, 2000-10
40
50
60
70
80
90
100Thousands
Fig 2–U.S. licensed dairy herds; cooperative memberships, 2000-10Milk producer-members
Licensed Dairy Herds
Memberships in co-ops with majority milk and dairy product sales
70
90
110
130
150
170
190
210
2000 2001 2002 2003 2004 2005 2006 2007 2008 2009 2010
Fig 1–U.S. milk marketed by producers and milk cow inventory, 2000-10
Billion pounds
100,000 head
Sources:USDA/National Agricultural Statistics Service, Quick Stats Operations with Milk Cows, Milk Productionhttp://quickstats.nass.usda.gov/results/F57EF7D3-3F2D-3BB6-B257-851485453586
http://www.rurdev.usda.gov/rbs/coops/dairy.htmUSDA/Rural Business-Cooperative Service, Cooperative Programs National Datahttp://www.rurdev.usda.gov/rbs/coops/data.htmDownloaded 09/14/2011
USDA/Rural Business-Cooperative Service, Marketing Operations of Dairy Cooperatives–Historical Summaries
Notes: Dairy cooperative memberships numbers are from RBS’s annual survey of farmer cooperatives and include all voting members in cooperatives where 50 percent or more of their sales came from milk and dairy products—so some members may not be milk producers. The milk producer-members numbers are gathered by RBS’s survey of dairy cooperative marketing operations, conducted in 5-year intervals, and reflect the milk producing members of all cooperatives that handled milk and had producer-members. Data for licensed dairy herds not available prior to 2003.
4090
140190240290340390
Fig 3–Milk cow inventory and milk marketed per licensed dairy herd; milk marketed per member-producer, 2000-10 Milk per
producer-member (10,000 lbs)Milk marketed by producers per licensed opera onCows per licensed herd (head)

19
Box 2–U.S. dairy product production and use, 2000-10
1,500
2,000
unds
Fig 6–Butter
-
50,000
100,000
150,000
200,000
250,000 M
illio
n po
unds
Fig 4–Cheese
Milk marketed by producersMarketed by dairy cooperatives
-200 400 600 800
1,000 1,200 1,400 1,600 1,800 2,000
Mill
ion
poun
ds
Fig 5–Nonfat dry milk
U.S. production
Exports
Marketed by dairy cooperatives
Sources:USDA Foreign Agricultural Servicehttp://www.fas.usda.gov/psdonline/psdDownload.aspxUSDA/Rural Business-Cooperative Service–Marketing Operations of Dairy Cooperatives-Historical Summaries
Downloaded 09/21/11
-
500
1,000
1,500
Mill
ion
s
U.S. production
Marketed by dairy cooperatives
0
10,000
20,000
30,000
40,000
50,000
60,000
70,000
Mill
ion
s
Fig 7–Fluid milk
U.S. consumption
Packaged by cooperatives
0
20,000
40,000
60,000
80,000
100,000
120,000
140,000
Mill
ion
poun
ds
Fig 8–Milk, factory use
U.S. factory use
Manufactured by cooperatives

20
Box 3–Milk marketing–economic data, 2000-10
$0
$5
$10
$15
$20
$25
$/cwt
0
5
10
15
20
25
Do
llars
per
cw
t
Fig. 10–Milk production income and feed costs
Milk production income
Total Feed costs
Income over feed cost
30
35
40
$
Fig. 11–Dairy cooperatives, total net sales 1/
Total net sales
1/Total sales excluding sales between cooperatives.
Source: USDA/National Agricultural Statistics Service Quick Stats National Milk Price Received, $/CW
Downloaded 9/14/2011
http://quickstats.nass.usda.gov/results/F0FEA479-A822-31C6-A3AE-F4CC3E930261
Source: Economic Research Service
http://www.ers.usda.gov/Data/CostsAndReturns/testpick.htm Downloaded 09/19/11
Source: USDA/Rural Business Cooperative Service
http://www.rurdev.usda.gov/rbs/coops/data.htm Downloaded 09/21/11
Net business volume excludes sales between cooperatives.
0
5
10
15
20
25
30
35
40
Bil
lio
n $
Total net sales
Fig. 9–Average monthly prices received for all milk, United States

21
Box 4–Dairy cooperative financial performance, 2000-10
$0
$100
$200
$300
$400
$500
$600
$700
$800M
illio
nFig. 12–Net income before taxes for dairy cooperatives
Cooperatives with majority milk and dairy product sales
-10.0%
0.0%
10.0%
20.0%
30.0%
40.0%
50.0%
EVI
Fig. 13–Dairy cooperatives 1 average extra value index
Bargaining only
Manufacturing-Processing
1 Cooperatives with producer-member milk.Source: USDA/Rural Business-Cooperative Servicehttp://www.rurdev.usda.gov/rbs/coops/data.htm Downloaded 09/21/11
-10.0%

22
Ap
pen
dix
tab
le 1
—2010 d
air
y c
oo
pera
tive b
y o
pera
tin
g m
od
e, sta
tus, siz
e, an
d r
eg
ion
Sm
all
Mediu
mLarg
eT
ota
lS
mall
M
ediu
m Larg
eS
mall
M
ediu
m L
arg
e
Opera
ting m
ode,
Siz
e, dis
trib
ution
Num
ber
of coopera
tives
dis
trib
ution b
y s
ize
by o
pera
ting m
ode
Perc
ent
Perc
ent
Co
ntinous o
pera
tion
1
Opera
ting m
ode:
31
19
454
57.4
35.2
7.4
48
.43
2.2
14
.3
Div
ers
ified
05
11
16
0.0
31.3
68.8
0.0
11
.65
5.0
Flu
id1
11
333.3
33.3
33.3
2.1
2.3
5.0
Nic
he
93
012
75.0
25.0
0.0
19
.17
.00
.0
Barg
ain
ing o
nly
37
34
879
46.8
43.0
10.1
_7
8.7
_7
9.1
_4
0.0
To
tal, e
nduring
47
43
20
110
42.7
39.1
18.2
10
0.0
10
0.0
10
0.0
New
er
coopera
tives
2
Opera
ting m
ode:
Div
ers
ified
00
55
0.0
0.0
100.0
0.0
0.0
71
.4
Flu
id0
00
00.0
0.0
0.0
0.0
0.0
0.0
Nic
he
20
02
100.0
0.0
0.0
40
.00
.00
.0
Barg
ain
ing o
nly
36
211
27.3
54.5
18.2
_6
0.0
10
0.0
_2
8.6
To
tal, n
ew
er
56
718
27.8
33.3
38.9
10
0.0
10
0.0
10
0.0
Entr
ies 2
000-1
03
Opera
ting m
ode:
Div
ers
ified
00
11
0.0
0.0
100.0
0.0
0.0
10
0.0
Flu
id0
00
00.0
0.0
0.0
0.0
0.0
0.0
Nic
he
50
05
100.0
0.0
0.0
41
.70
.00
.0
Barg
ain
ing o
nly
710
017
41.2
58.8
0.0
_5
8.3
10
0.0
__
0.0
To
tal, n
ew
12
10
123
52.2
43.5
4.3
10
0.0
10
0.0
10
0.0
2010 d
airy c
oopera
tives
Opera
ting m
ode:
Div
ers
ified
05
17
22
0.0
22.7
77.3
0.0
8.5
60
.7
Flu
id1
11
333.3
33.3
33.3
1.6
1.7
3.6
Nic
he
16
30
19
84.2
15.8
0.0
25
.05
.10
.0
Barg
ain
ing o
nly
47
50
10
107
43.9
46.7
9.3
_7
3.4
_8
4.7
_3
5.7
To
tal
64
59
28
151
42.4
39.1
18.5
1
00
.01
00
.01
00
.0
Co
ntin
ue
d—

Ap
pen
dix
tab
le 1
(co
nt.
)—2010 d
air
y c
oo
pera
tives, b
y o
pera
tin
g m
od
e, sta
tus, siz
e, an
d r
eg
ion
Sm
all
Mediu
mLarg
eT
ota
lS
mall
M
ediu
m Larg
eS
mall
M
ediu
m L
arg
e
Regio
n,
Siz
e, dis
trib
ution
Num
ber
of coopera
tives
dis
trib
ution b
y s
ize
by r
egio
n
Perc
ent
Perc
ent
Regio
ns
Nort
h A
tlantic
31
19
454
57.4
35.2
7.4
48
.43
2.2
14
.3
South
Atlantic
03
25
0.0
60.0
40.0
0.0
5.1
7.1
East N
ort
h C
entr
al
16
12
735
45.7
34.3
20.0
25
.02
0.3
25
.0
West N
ort
h C
en
tral
16
15
738
42.1
39.5
18.4
25
.02
5.4
25
.0
South
Centr
al
02
13
0.0
66.7
33.3
0.0
3.4
3.6
Weste
rn1
87
16
6.3
50.0
43.8
__
1.6
_1
3.6
_2
5.0
All
regio
ns
64
59
28
151
42.4
39.1
18.5
10
0.0
10
0.0
10
0.0
No
tes: S
mall:
handle
d less than 5
0 m
illio
n p
ounds o
f m
ilk p
er
year;
Mediu
m: handle
d 5
0 to 9
99 m
illio
n p
ounds o
f m
ilk p
er
year;
Larg
e: handle
d 1
bill
ion o
r m
ore
pounds o
f m
ilk p
er
year.
Mode o
f opera
tion a
nd s
ize c
ate
gory
based o
n 2
007 m
ark
eting o
pera
tions s
urv
ey d
ata
.1
Coopera
tives in e
xis
tence s
ince p
rior
to 1
992 a
nd in c
on
tinuas o
pera
tion thro
ugh 2
010.
2C
oopera
tives e
nte
ring d
uring 1
992-9
9 a
nd in o
pera
tion t
hro
ugh 2
010.
3In
clu
des c
oopera
tives form
ed b
y m
erg
er
of exis
ting c
oopera
tives w
hen the n
ew
entity
opera
ted u
nder
a n
ew
nam
e.
23

24
Ap
pen
dix
tab
le 2
—R
an
kin
g o
f m
an
ufa
ctu
rin
g/p
rocessin
g1
dair
y c
oo
pera
tives b
y t
he E
xtr
a V
alu
e In
dex
First half o
f decade (
2000-0
4)
Second h
alf o
f decade (
2005-0
9)
Rank
Extr
aam
ong
Rank
Top/
Extr
aR
ank a
mong
Rank
Top/
valu
em
fg/p
roc.
am
ong a
llbottom
valu
em
fg/p
roc.
am
ong a
llbottom
Sta
tus/c
oop c
ode
index
coops 2
coops 3
10%
index
coops 2
coops 3
10%
Co
ntinuous o
pera
tion 4
E-M
P 1
+2
14
T
OP
+1
3
T
OP
E-M
P 1
7+
526
.+
22
61
.
E-M
P 4
+6
35
.+
82
6.
E-M
P 7
+7
36
.+
11
36
.
E-M
P 1
9+
837
.+
24
68
.
E-M
P 1
8+
940
.+
23
65
.
E-M
P 6
+10
42
.+
10
33
.
E-M
P 9
+12
45
.+
13
41
.
E-M
P 1
3+
13
46
.+
17
52
.
E-M
P 5
+14
47
.+
93
2.
E-M
P 2
+15
48
.+
41
6.
E-M
P 1
6+
17
60
.+
20
57
.
E-M
P 1
4+
18
63
.+
18
54
.
E-M
P 1
1+
19
66
.+
15
48
.
E-M
P 8
+20
67
.+
12
40
.
E-M
P 2
2+
21
71
.+
28
74
.
E-M
P 1
5+
23
78
.+
19
56
.
E-M
P 1
0+
24
79
.+
14
46
.
E-M
P 2
0+
25
81
.+
25
69
.
E-M
P 2
6+
27
85
.
E-M
P 2
1+
30
91
.+
27
73
.
E-M
P 3
-34
102
.+
72
5.
E-M
P 2
3-
37
110
.+
29
78
.
E-M
P 1
2-
39
119
.+
16
50
.
E-M
P 2
5-
41
125
.
E-M
P 2
4-
34
10
1
BO
TT
OM
Continued—

25
Ap
pen
dix
tab
le 2
(co
n’t
)—R
an
kin
g o
f m
an
ufa
ctu
rin
g/p
rocessin
g1
dair
y c
oo
pera
tives b
y t
he E
xtr
a V
alu
e I
nd
ex
First half o
f decade (
2000
-04)
Second h
alf o
f decade (
2005-0
9)
Rank
Extr
aa
mong
Rank
Top/
Extr
aR
ank a
mong
Rank
Top/
valu
em
fg/p
roc.
am
ong a
llbottom
valu
em
fg/p
roc.
am
ong a
llbottom
Sta
tus/c
oop c
ode
index
coops 2
coops 3
10%
iindex
coops 2
coops 3
10%
New
er
5
NR
-MP
1+
315
.+
21
4.
NR
-MP
2+
11
43
.+
31
5.
NR
-MP
6+
28
86
.-
31
85
.
NR
-MP
7+
32
93
.-
32
86
.
NR
-MP
5-
35
103
.-
30
81
.
NR
-MP
3+
62
2.
NR
-MP
4+
21
59
.
Entr
ies 2
000-1
0
NE
W-M
P 7
+5
20
.
Merg
ed
6
M-M
P 4
+4
20
.
M-M
P 1
+16
55
.+
26
72
.
M-M
P 2
+22
76
.-
33
97
.
M-M
P 5
+26
83
.
M-M
P 3
+31
92
.
M-M
P 6
-38
112
.
Dis
solv
ed
7
D-M
P 1
+1
12
T
OP
D-M
P 2
+29
90
.
D-M
P 3
+33
97
.
D-M
P 4
-36
104
.
D-M
P 5
-40
121
.
1In
clu
des d
ivers
ified, fluid
pro
cessin
g a
nd n
iche m
ark
eting
coopera
tives.
25
-year
avera
ge E
VI ra
nk a
mong a
ll m
anufa
ctu
ring/p
roce
ssin
g c
oopera
tives w
ith E
VI data
.3
5-y
ear
avera
ge E
VI ra
nk a
mong a
ll 141 c
oopera
tives for
2000-0
4 a
nd a
ll 110 c
oopera
tives for
2005-0
9.
4C
oopera
tives in e
xis
tence s
ince p
rior
to 1
992 a
nd in c
on
tinuous o
pera
tion thro
ugh 2
010.
5C
oopera
tives e
nte
ring d
uring 1
992-9
9 a
nd in o
pera
tion t
hro
ugh 2
010.
6C
oopera
tives that w
ent out of busin
ess b
y m
erg
er
betw
een 2
000 a
nd 2
010.
7C
oopera
tives that w
ent out of busin
ess b
etw
een 2
000 a
nd 2
010, not in
clu
din
g those that m
erg
ed.

26
Ap
pen
dix
tab
le 3
—R
an
kin
g o
f b
arg
ain
ing
-on
ly d
air
y c
oo
pera
tives b
y t
he E
xtr
a V
alu
e In
dex
F
irst half o
f decade (
2000-0
4)
S
econd h
alf o
f decade (
2005-0
9)
Rank
Extr
aam
ong
Rank
Top/
Extr
aR
ank a
mong
Rank
Top/
valu
ebarg
ain
ing-
am
ong a
llbottom
valu
ebarg
ain
ing-
am
ong a
llbottom
Sta
tus/c
oop c
ode
index
only
co-o
ps 1
co-o
p 2
10%
index
only
co-o
ps 1
co-o
ps 2
10%
Continuous o
pera
tion
3
E-B
O 3
3+
11
TO
P+
49
77
.
E-B
O 6
4+
55
TO
P
E-B
O 6
3+
66
TO
P
E-B
O 2
+8
8
TO
P+
89
TO
P
E-B
O 5
9+
10
10
T
OP
E-B
O 5
6+
12
13
T
OP
E-B
O 7
+16
19
.+
14
18
.
E-B
O 5
+17
21
.+
11
12
.
E-B
O 4
5+
19
23
.-
63
95
.
E-B
O 5
2+
20
24
.
E-B
O 5
4+
21
25
.
E-B
O 1
6+
22
27
.+
28
39
.
E-B
O 1
4+
23
28
.+
26
37
.
E-B
O 6
0+
24
29
.
E-B
O 1
8+
29
34
.+
31
44
.
E-B
O 1
3+
30
38
.+
25
35
.
E-B
O 1
2+
31
39
.+
23
31
.
E-B
O 2
8+
32
41
.+
43
66
.
E-B
O 4
9+
33
44
.-
69
10
3
B
OT
TO
M
E-B
O 2
0+
35
50
.+
33
47
.
E-B
O 4
7+
39
54
.-
66
99
.
E-B
O 3
9+
40
56
.-
55
87
.
E-B
O 4
6+
41
57
.-
65
98
.
E-B
O 1
0+
42
58
.+
18
24
.
E-B
O 9
+43
59
.+
17
23
.
E-B
O 2
9+
44
61
.+
44
67
.
E-B
O 5
7+
45
62
.
E-B
O 2
6+
46
64
.+
41
63
.
E-B
O 3
0+
47
65
.+
46
71
.
E-B
O 2
2+
48
68
.+
35
51
.
E-B
O 2
3+
49
69
.+
36
53
.
Continued—

27
Ap
pen
dix
tab
le 3
(co
nt.
)—R
an
kin
g o
f b
arg
ain
ing
-on
ly d
air
y c
oo
pera
tives b
y t
he E
xtr
a V
alu
e In
dex
F
irst half o
f decade (
2000-0
4)
S
econd h
alf o
f decade (
2005-0
9)
Rank
Extr
aam
ong
Rank
Top/
Extr
aR
ank a
mong
Rank
Top/
valu
ebarg
ain
ing-
am
ong a
llbottom
valu
ebarg
ain
ing-
am
ong a
llbottom
Sta
tus/c
oop c
ode
index
only
co-o
ps 1
co-o
ps 2
10%
index
only
co-o
ps 1
co-o
ps 2
10%
E-B
O 6
+51
72
.+
13
17
.
E-B
O 1
9+
52
73
.+
32
45
.
E-B
O 5
8+
53
74
.
E-B
O 3
2+
54
75
.+
48
76
.
E-B
O 3
+55
77
.+
91
0
TO
P
E-B
O 2
5+
56
80
.+
39
60
.
E-B
O 3
4+
58
84
.-
50
79
..
E-B
O 3
1+
59
87
.+
47
75
.
E-B
O 5
3+
60
88
.
E-B
O 3
8+
63
95
.-
54
84
.
E-B
O 4
+64
96
.+
10
11
T
OP
E-B
O 4
0-
66
99
.-
57
89
.
E-B
O 6
1-
67
100
.
E-B
O 3
6-
68
101
.-
52
82
.
E-B
O 1
7-
69
105
.+
29
42
.
E-B
O 6
2-
70
106
.
E-B
O 2
7-
75
113
.+
42
64
.
E-B
O 2
1-
76
114
.+
34
49
.
E-B
O 4
4-
78
116
.-
62
94
.
E-B
O 2
4-
79
117
.+
37
55
.
E-B
O 4
2-
80
118
.-
60
92
.
E-B
O 4
8-
85
126
.-
67
10
0
B
OT
TO
M
E-B
O 4
3-
87
128
B
OT
TO
M-
61
93
.
E-B
O 5
0-
91
132
B
OT
TO
M-
71
10
5
B
OT
TO
M
E-B
O 5
5-
94
135
B
OT
TO
M
E-B
O 5
1-
95
136
B
OT
TO
M-
72
10
6
B
OT
TO
M
E-B
O 1
5-
97
138
B
OT
TO
M+
27
38
.
E-B
O 1
+1
1
T
OP
E-B
O 1
1+
22
30
.
E-B
O 3
5-
51
80
.
E-B
O 3
7-
53
83
.
E-B
O 4
1-
59
91
.
E-B
O 8
+1
51
9.
Continued—
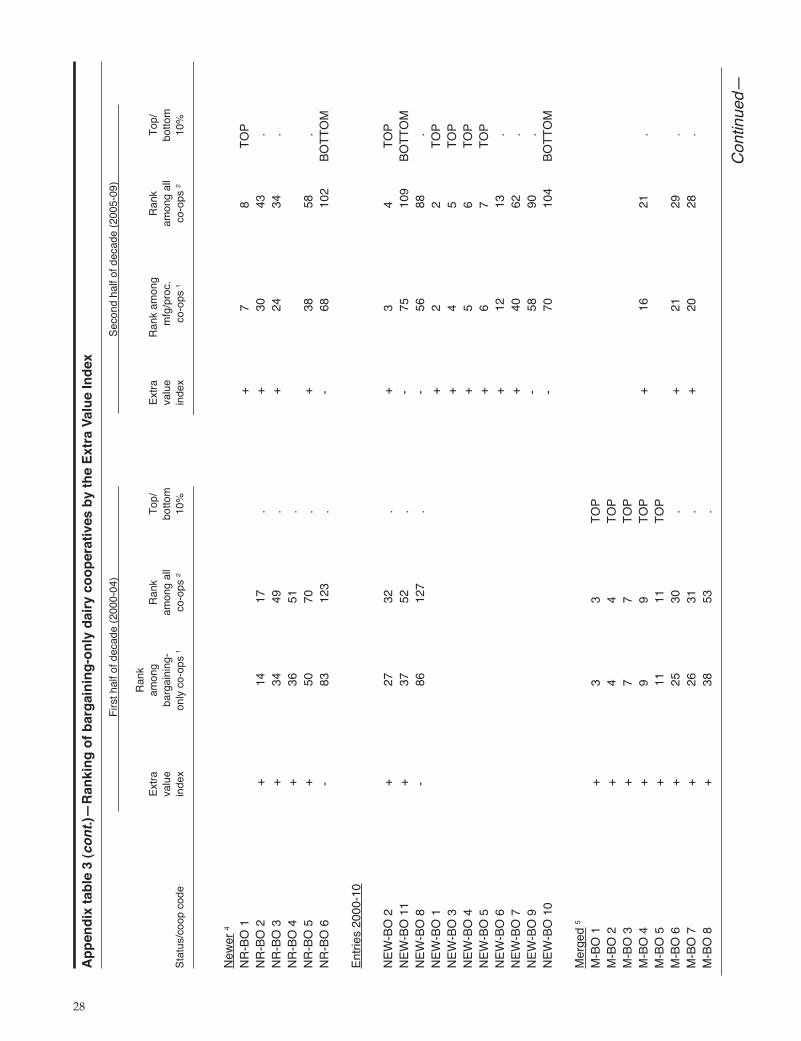
28
Ap
pen
dix
tab
le 3
(co
nt.
)—R
an
kin
g o
f b
arg
ain
ing
-on
ly d
air
y c
oo
pera
tives b
y t
he E
xtr
a V
alu
e In
dex
F
irst half o
f decade (
2000-0
4)
S
econd h
alf o
f decade (
2005-0
9)
Rank
Extr
aam
ong
Rank
Top/
Extr
aR
ank a
mong
Rank
Top/
valu
ebarg
ain
ing-
am
ong a
llbottom
valu
em
fg/p
roc.
am
ong a
llbottom
Sta
tus/c
oop c
ode
index
only
co-o
ps 1
co-o
ps 2
10%
index
co-o
ps 1
co-o
ps 2
10%
Ne
wer
4
NR
-BO
1+
78
TO
P
NR
-BO
2+
14
17
.+
30
43
.
NR
-BO
3+
34
49
.+
24
34
.
NR
-BO
4+
36
51
.
NR
-BO
5+
50
70
.+
38
58
.
NR
-BO
6-
83
123
.-
68
10
2
B
OT
TO
M
Entr
ies 2
000-1
0
NE
W-B
O 2
+27
32
.+
34
TO
P
NE
W-B
O 1
1+
37
52
.-
75
10
9
B
OT
TO
M
NE
W-B
O 8
-86
127
.-
56
88
.
NE
W-B
O 1
+2
2
T
OP
NE
W-B
O 3
+4
5
T
OP
NE
W-B
O 4
+5
6
T
OP
NE
W-B
O 5
+6
7
T
OP
NE
W-B
O 6
+1
21
3.
NE
W-B
O 7
+4
06
2.
NE
W-B
O 9
-5
89
0.
NE
W-B
O 1
0-
70
10
4
B
OT
TO
M
Merg
ed
5
M-B
O 1
+3
3
TO
P
M-B
O 2
+4
4
TO
P
M-B
O 3
+7
7
TO
P
M-B
O 4
+9
9
TO
P+
16
21
.
M-B
O 5
+11
11
T
OP
M-B
O 6
+25
30
.+
21
29
.
M-B
O 7
+26
31
.+
20
28
.
M-B
O 8
+38
53
.
Continued—

29
Ap
pen
dix
tab
le 3
(co
nt.
)—R
an
kin
g o
f b
arg
ain
ing
-on
ly d
air
y c
oo
pera
tives b
y t
he E
xtr
a V
alu
e In
dex
F
irst half o
f decade (
2000-0
4)
S
econd h
alf o
f decade (
2005-0
9)
Rank
Extr
aam
ong
Rank
Top/
Extr
aR
ank a
mong
Rank
Top/
valu
ebarg
ain
ing-
am
ong a
llbottom
valu
ebarg
ain
ing-
am
ong a
llbottom
Sta
tus/c
oop c
ode
index
only
co-o
ps 1
co-o
ps 2
10%
index
only
co-o
ps 1
co-o
ps 2
10%
M-B
O 8
+38
53
.
M-B
O 9
+57
82
.
M-B
O 1
0+
61
89
.
M-B
O 1
1-
72
108
.-
73
10
7
BO
TT
OM
M-B
O 1
2-
74
111
.
M-B
O 1
3-
89
130
B
OT
TO
M
M-B
O 1
4-
98
139
B
OT
TO
M+
19
27
.
M-B
O 1
5-
99
140
B
OT
TO
M
Dis
solv
ed
6
D-B
O 1
+2
2T
OP
D-B
O 2
+13
16
.-
76
11
0
BO
TT
OM
D-B
O 3
+15
18
.
D-B
O 4
+18
22
.
D-B
O 5
+28
33
.
D-B
O 6
+62
94
.
D-B
O 7
065
98
.
D-B
O 8
-71
107
.-
64
96
.
D-B
O 9
-73
109
.
D-B
O 1
0-
77
115
.
D-B
O 1
1-
81
120
.-
74
10
8
BO
TT
OM
D-B
O 1
2-
82
122
.
D-B
O 1
3-
84
124
.
D-B
O 1
4-
88
129
B
OT
TO
M
D-B
O 1
5-
90
131
B
OT
TO
M
D-B
O 1
6-
92
133
B
OT
TO
M
D-B
O 1
7-
93
134
B
OT
TO
M
D-B
O 1
8-
96
137
B
OT
TO
M
D-B
O 1
9-
100
141
B
OT
TO
M
D-B
O 2
0+
45
70
.
15
-year
avera
ge E
VI ra
nk a
mong a
ll barg
ain
ing-o
nly
coop
era
tives w
ith E
VI data
.2
5-y
ear
avera
ge E
VI ra
nk a
mong a
ll 141 c
oopera
tives for
2000-0
4 a
nd a
ll 110 c
oopera
tives for
2005-0
9.
3C
oopera
tives in e
xis
tence s
ince p
rior
to 1
992 o
r in
continuous o
pera
tion thro
ugh 2
010.
4C
oopera
tives e
nte
ring d
uring 1
992-9
9 a
nd in o
pera
tion thro
ugh 2
010.
5C
oopera
tives that w
ent out of busin
ess b
y m
erg
er
betw
een 2
000 a
nd 2
010.
6C
oopera
tives that w
ent out of busin
ess b
etw
een 2
000 a
nd 2
010, not in
clu
din
g those that m
erg
ed.

30
Map—Change in Number of Dairy Cooperatives Between 2000 and 2010 by Headquarters Region
West North Central
-17 (30.9%)
Western (including
Alaska and Hawaii)
-3 (-15.8%)
South Central
-2 (-40.0%)
South Atlantic
+2 (+66.7%)
North
Atlantic
-34 (-38.6%)
East North Central
-6 (-14.6%)

31
U.S. Department of AgricultureRural Business–Cooperative ServiceStop 3250Washington, D.C. 20250-3250
Rural Business–Cooperative Service (RBS) provides research, manage-ment, and educational assistance to cooperatives to strengthen the eco-nomic position of farmers and other rural residents. It works directly withcooperative leaders and Federal and State agencies to improve organiza-tion, leadership, and operation of cooperatives and to give guidance tofurther development.
The cooperative segment of RBS (1) helps farmers and other rural resi-dents develop cooperatives to obtain supplies and services at lower costand to get better prices for products they sell; (2) advises rural residentson developing existing resources through cooperative action to enhancerural living; (3) helps cooperatives improve services and operating effi-ciency; (4) informs members, directors, employees, and the public on howcooperatives work and benefit their members and their communities; and(5) encourages international cooperative programs. RBS also publishesresearch and educational materials and issues Rural Cooperatives maga-zine.
The U.S. Department of Agriculture (USDA) prohibits discrimination inall of its programs and activities on the basis of race, color, national ori-gin, age, disability, and where applicable, sex (including gender identityand expression), marital status, familial status, parental status, religion,sexual orientation, political beliefs, genetic information, reprisal, orbecause all or part of an individual's income is derived from any publicassistance program. (Not all prohibited bases apply to all programs.)Persons with disabilities who require alternative means for communica-tion of program information (Braille, large print, audiotape, etc.) shouldcontact USDA's TARGET Center at (202) 720-2600 (voice and TDD).
To file a complaint of discrimination, write to:
USDAAssistant Secretary for Civil RightsOffice of the Assistant Secretary for Civil Rights1400 Independence Avenue, S.W., Stop 9410Washington, DC 20250-9410
Or call toll-free at (866) 632-9992 (English) or (800) 877-8339 (TDD) or(866) 377-8642 (English Federal-relay) or (800) 845-6136 (Spanish Federal-relay). USDA is an equal opportunity provider and employer.