dairy farmers’ welfare losses from farm-to-retail milk ... intermediaries of a particular...
TRANSCRIPT

© 2016. Mazhir Nadeem Ishaq, Li Cui Xia & Rukhsana Rasheed. This is a research/review paper, distributed under the terms of the Creative Commons Attribution-Noncommercial 3.0 Unported License http://creativecommons.org/licenses/by-nc/3.0/), permitting all non-commercial use, distribution, and reproduction in any medium, provided the original work is properly cited.
Dairy Farmers’ Welfare Losses from Farm-To-Retail Milk Price Adjustments: Highlight on Market Integration and Price Transmission
By Mazhir Nadeem Ishaq, Li Cui Xia & Rukhsana Rasheed Northeast Agriculture University
Abstract- This study was carried out in four districts of Punjab province of Pakistan with a focus to examine milk market integration, price adjustments and price spreads in short-run and long-run equilibrium for fluid milk. Price transmission describes how a price change at one level of market chain corresponds to another level. Vector Error Correction Model (VECM) was applied to estimate the symmetry of price transmission. Monthly average prices of milk producer and consumer covering the period from 2010 to 2016 were used in the empirical analysis. Seasonality was an important factor in milk production and was kept in account. Stationarity between farm and retail prices was examined through Augmented-Dicky Fuller (ADF) test whereas, the nature of long-term co-integration among price series was estimated by Johansen co-integration test.
Keywords: milk supply chain, price transmission, seasonality, price elasticity, co-integration, dairy prices, error correction model, punjab.
GJMBR-B Classification: JEL Code: M20
DairyFarmersWelfareLossesfromFarmToRetailMilkPriceAdjustmentsHighlightonMarketIntegrationandPriceTransmission
Strictly as per the compliance and regulations of:
Global Journal of Management and Business Research: BEconomics and CommerceVolume 16 Issue 7 Version 1.0 Year 2016 Type: Double Blind Peer Reviewed International Research JournalPublisher: Global Journals Inc. (USA)Online ISSN: 2249-4588 & Print ISSN: 0975-5853

Dairy Farmers’ Welfare Losses from Farm-To-Retail Milk Price Adjustments: Highlight on Market Integration and Price Transmission
Mazhir Nadeem Ishaq α, Li Cui Xia σ & Rukhsana Rasheed ρ
Abstract- This study was carried out in four districts of Punjab province of Pakistan with a focus to examine milk market integration, price adjustments and price spreads in short-run and long-run equilibrium for fluid milk. Price transmission describes how a price change at one level of market chain corresponds to another level. Vector Error Correction Model (VECM) was applied to estimate the symmetry of price transmission. Monthly average prices of milk producer and consumer covering the period from 2010 to 2016 were used in the empirical analysis. Seasonality was an important factor in milk production and was kept in account. Stationarity between farm and retail prices was examined through Augmented-Dicky Fuller (ADF) test whereas, the nature of long-term co-integration among price series was estimated by Johansen co-integration test. Analysis results proves that an asymmetric price transmission existed in milk supply system. Granger causality test established the price causality direction, from retailer to producer and not vice versa. VECM confirmed an inefficient market integration and endorse the fact that market power is towards the retailers’ side who abuse their power to place the farmers as price takers. The study suggest public-private interventions to improve the milk market structure to strengthen farmers’ negotiation power in vertical market. Keywords: milk supply chain, price transmission, seasonality, price elasticity, co-integration, dairy prices, error correction model, punjab.
I. Introduction
a) Background of Study olatility of price in agribusiness markets not only affects farm revenue and farmer’s ability to maintain their operations but it also validates the
market structure and it performance. Price is an essential economic tool which linked the different levels and/or intermediaries of a particular product market, such as dairy enterprise (Serra and Goodwin 2003). The efficiency of agricultural markets depends on a high degree of perfect and fair price mechanism based on efficient integration among various marketing stakeholders. Agriculture development may be achieved if changes in price at one level (e.g. consumer) are efficiently transmitted to next level of Market structure (Producer). In Pakistan, milk producers are deprived from the welfare effects of positive price changes due to Author α σ ρ: College of Economics and Management, Northeast Agriculture University, Harbin, 150030. e-mail: [email protected]
inefficient transmission from retailers to dairy farmers. This price disparity resulted the rural economy with losses and under-development. This market inefficiency dilemma has led to the unfair redistribution of economic resources form agriculture sector to other enterprises.
In Pakistan’s agriculture, the dairy farming is an important income generating activity. Milk produce contributes a major share to gross national income (GNP). Milk is very important livestock product which can provide a consistent source of income to small-scale dairy farmers (Shinoj et al. 2008). Livestock farming in agriculture sector is recognized as a potential source of employment generation for rural small, marginal and landless laborers. Livestock supplements human food in form of milk, meat, eggs, and skins along with farmyard manure for agriculture production. According to official statists of Economic survey of Pakistan, the contribution of livestock towards agriculture value addition and in the national GDP is 58.3% and 11.6 % respectively. Livestock’s gross value addition represents an increasing trend of 2.7 percent to the corresponding previous period of 2014-15 and overall value had increased from 756.6 billion PKR to 776.5 PKR. The current estimated population milk producing animals (cow, buffaloes, goats, sheep and camel) was around 176.6 million. In Pakistan, the total milk production for the year 2015-16 was recorded as 54.328 million tons and is presumed to be 6th in global milk producers. Buffaloes and cows are two major dairy animals which are primarily reared for milk production in Pakistan and their share in total milk production is 61 % and 32.8% respectively (GOP2015, and GOP 16).
The milk marketing system generally engaged various marketing agents which add some kind of utility at each specific marketing node. A marketing node in any marketing chain is referred to as a stage/level where exchange or transformation of a product takes place (Zia 2007). In Pakistan, milk marketing chain is usually composed of five different marketing nodes; milk producers, local milk collectors (Dhodi), processors/dairy plants, wholesalers/distributors, and retailers or milk shops. The overall milk marketing system is broadly segmented into two marketing channels; informal milk marketing channels and formal milk marketing channels. The traditional or informal milk marketing system deals with collection and distribution
V
© 20 16 Global Journals Inc. (US)
27
Globa
l Jo
urna
l of M
anag
emen
t an
d Bu
siness Resea
rch
Volum
e XVI Issu
e VII
Ver
sion
IYe
ar
()
2016
B

of raw fresh milk without any legal license issued from a regulatory department. Formal milk marketing system undertakes milk collection, processing and distribution under a lawful mechanism of dairy and food regulatory department to ensure food safety regulations. Milk marketing in Pakistan is dominated by informal sector as it occupies more than 94% share and rest is of milk is marketed by formal milk processing sector. Due to huge investment in reconstruction and new capacity building in formal dairy sector, the scenario is altering with rapid pace. However, the milk producers are free to sell their milk production according to price and services provided by existing available marketing system; either informal or formal channels.
Vertical price transmission analysis in milk marketing channels and spatial markets is a subject of considerable attention to examine price relationship among milk producers, wholesalers and final consumers. The price transmission is a complex economic relationship between the producers and the consumers and it explains how a price change atone marketing level react towards the next level in the marketing system of product. The prices of milk producers on farm gate is a sensitive issue as the marketing agents/middlemen often offered low prices as compare to their fair share from retail market prices. The price spread in milk marketing chain of Pakistan is wider as many small scale intermediaries are engaged. Retail prices do not absorb any negative change in prices which can lowers the retailers’ profit margin and the price change is immediately shifted to consumer price (Azzam 1999).The market power exercised by processors or retailers tend to increase the difference between producer and consumer prices and resultantly reduce producer’s share in consumer expenditure. This could be possibly explained in presences of adjustment costs, noncompetitive market structure, profit maximizing motives and non-linearities in supply & demand (Falkowski 2010).
According to the Peltzman (2000) majority of producer and consumer markets are often characterized by asymmetrical price transmission. The distribution of welfare effects e.g. farmers’ benefit due to rise in retail price or consumer advantage due to fall in farm prices could not be materialized due the asymmetric price movements (Tekguc 2013).In developing countries to examine the functioning of vertical food markets, it is important to evaluate how marketing agents are delivering for the farmers and the consumers’ welfare. The conditions of agribusiness market play a vital role in determining the retail prices and marketing middlemen (processors, distributors, retailers) often have enough market power to have upper hand over farm prices.
The potential causes of asymmetric price transmission could be the abuse of marketing power (Von Cramon-Taubadel and Meyer 2004); intensity of competition in market (Bailey and Brorsen, 1989);
elasticity of product demand (Pletzam 2000); extent of product perishability (Reziti 2014); search costs in local markets (Chavas and Mehta2004); adjustment costs; menu and spatial costs (Goodwin and Harper 2000); government interventions to support farm gate prices (Lass et al. 2001).The distribution efficiency of a product can be examined through getting insight into the nature of relationship between producer and consumer prices. An asymmetric price relationship is considered as an economic disadvantageous for producers and consumers ((Stewart and Blayney 2011).
In agriculture marketing, the distribution of profits and issues of marketing margins within the marketing channels are important to be investigated. Analysis of demand and supply shocks assist to understand the direction of market adjustments and price movements in moving goods from one level of marketing chain to another. Globally the subject of price transmission has been widely studied for many commodities such as wheat and wheat flour (Jung and Byeong 2015), pork (Goodwin and Harper 2000; Abdulai 2002), lamb meat (Ben-Kaabia and Gil 2007), maize (Acquah and Dadzie 2010), fish (Shinoj et al. 2008), and milk (Lass et al. 2001; Capps and Sherwell 2007).
As regards dairy products, although various studies had already been conducted on price transmission mechanism and market cointegrations issues; however their conclusion and the evidences varies and mixed across the geographical locations and commodities. Chavas and Metha (2004) carried out an empirical analysis for the butter market in the US and they found a strong evidence of asymmetry in the adjustment of retail prices. A study on whole milk price transmission elasticity was conducted by Capps and Sherwell (2007). The applied Houck error correction model (ECM) for analysis and their results proved that an asymmetric price transmission mechanism was present in farm-retail price relationship. Reziti (2014) found positive asymmetries during their study on milk and butter in the dairy industry of Austria. Stewart and Blayney (2011) conducted a study for the whole milk and cheddar cheese market in US and reported that asymmetric price movements between farm and retail level. They proved that the price shocks between two levels were transmitted with a delay as well as in an asymmetrical pattern. Recently, Reziti (2014) carried out a study in the Greek milk sector and threshold error correction autoregressive model was applied on monthly price data ranging from January 1989 to April 2009. This study results detect a nonlinear price adjustment between milk consumer and producers and abuse of market power by milk processor and retailers was observed.
b) Statement of the Problem
To analyze price adjustments in an unregulated milk marketing system and to evaluate the underlying
28
Globa
l Jo
urna
l of M
anag
emen
t an
d Bu
siness Resea
rch
Volum
e XVI Issu
e VII
Ver
sion
IYe
ar
()
2016
© 2016 Global Journals Inc. (US)1
BDairy Farmers’ Welfare Losses from Farm-To-Retail Milk Price Adjustments: Highlight on Market
Integration and Price Transmission

© 20 16 Global Journals Inc. (US)
29
Globa
l Jo
urna
l of M
anag
emen
t an
d Bu
siness Resea
rch
Volum
e XVI Issu
e VII
Ver
sion
IYe
ar
()
2016
B
Dairy Farmers’ Welfare Losses from Farm-To-Retail Milk Price Adjustments: Highlight on Market Integration and Price Transmission
symmetries is a complex phenomenon. The available information about Pakistani milk market evidenced thatmilk producers within prevailing milk supply chain are in a vulnerable position. Usually they sell milk to local milk collectors (Dodhi) at the prices which are almost half ofretailers’ prices. In Pakistan some studies had been conducted on rice and citrus markets; however so far no research is carried out to examine the vertical price transmission and cointegration issues for milk marketingin Punjab province. Therefore for Pakistan’s dairy sector, a research gap exist to identify the behavior and the nature of relationship among milk marketing agents/middlemen arising from milk price shocks. This study is an attempt to undertake the vertical price transmission analysis and to gain an insight into price adjustmentsamong milk producers, wholesalers and retailers in four districts. The specific objectives of this study were; (i) to examine the short run milk price variation among inter-market and intra-marketing agents during flush and lean season of milk production; (ii) To analyze the nature of market integration and the long run vertical price transmission between the prices of milk producers and consumers. Hence, this study will deliver some valuable information on the directions of price adjustments and market integrations which is expected to be useful for the stakeholders involved in milk supply chain of Pakistan.
II. Materials and Methods
a) Description of Study Area and Data SourceThe study area for this research was the south
region of Punjab province. Agriculture and rearing of livestock is the primary source of livelihood for rural residents of this geographical location in Pakistan. From south region of Punjab province four districts namely Vehari, Lodhran, Bahawalpur and Muzaffargrah were purposively selected. These districts have a rich population of livestock and milk production activities. Monthly average prices for milk producer and consumer were collected from four districts of the Punjab. The data used for this research was obtained from secondary sources. To acquire milk producer prices that match up with retail prices is a complex proposition. Agriculture statistics of Pakistan (2010) was chosen as first source of data. Second source of data was the essential food commodity price list which is monthly publicized from each of the District Coordination Office (DCO). A continuous reliable source of data on milk producers’ prices could not found as such; however the data for one pair of milk consumer prices and milk producers’ prices for four districts was estimated on averages after discussions with livestock, dairy development officials and dairy industry experts. Monthly milk price observations ranging from January 2010 to June 2016were collected and undergone through data analysis. The nominal price data provided by the agriculture statistical office and the DCO office was deflated to
January 2010 in terms of the Pakistan consumer price index to calculate the real price change in milk. Variables are transformed in logarithms.
b) Methodology for Price Spread over Different MarketsEfficiency analysis of marketing chain provides
reliable information about price movements or spread within markets and over different marketing agents. In this paper for calculating price spread over selected district markets and for various marketing agents, we used Rudra’s (1992) approach which is explained the price spread by symbol θ±δ. The sign θ indicate the midpoint of milk price to various market middlemen in a given market. The symbol θ+δ expressed the highest observed value and θ-δ is for the lowest observed value. The intra-market price variation is denoted by the symbol ±δ. After estimating and comparing the values of θ for different middlemen within the same market or for different regional markets for the same middlemen gives some idea about the inter-market and intra-market price variations. Rudra (1992) hypothesis for the calculation of price spread for different markets and over different marketing middlemen was applied. This hypothesis explained that a market of homogenous product becomes perfectly competitive as if the range of price variations for the homogenous product within different markets (excluding transactions cost) in any particular marketing middlemen as well as inter-marketing agents for the same period is almost close to uniformity. In developing economies like Pakistan, the agricultural inputs and outputs data related to market analysis are usually short-term in nature. Hence, in determining the competitiveness of milk producers’ and consumers’ prices within districts markets, the Rudra’s (1992) estimates seem to be more pertinent and applicable.
c) Selection of Price Series for Price Transmission Analysis
Due to various milk marketing agents (i.e. milk collectors, wholesalers, processors, distributors and retailers), there could be a number of possible combination of price series. However, we only emphasis on milk producer and consumer level in the vertical milk market linkages and selected farm and retail prices. According to study objectives, in this paper we applied different test for estimating the trend of price transmission. First of all, the descriptive statistics wasapplied in order to examine the relationship between milk producer and consumer as well as to describe the main features of a data collection. Certain other statistical tests were also applied to validate the results.
d) Unit root Test, Cointegration Test and Granger’s Causality Test
It is very important to examine the price relationship over time; a) whether selected price series are stationary or not, b)if the price series are non-stationary with a unit root, what is the type of co

30
Globa
l Jo
urna
l of M
anag
emen
t an
d Bu
siness Resea
rch
Volum
e XVI Issu
e VII
Ver
sion
IYe
ar
()
2016
© 2016 Global Journals Inc. (US)1
BDairy Farmers’ Welfare Losses from Farm-To-Retail Milk Price Adjustments: Highlight on Market
Integration and Price Transmission
integrated orders, c) if price series are co-integrated what is the direction of causality. If the price series are stationary at levels, then we can apply "ordinary least square" estimation method to examine the relationship between two price series. But if the series are non-stationary and have unit root then to determine the relationship, the series are taken at the first or second difference levels and the Error Correction Models (ECM) is applied for the purpose. We applied the commonly developed Augmented Dicky-Fuller test to assess whether the selected price series have unit root or not. The null hypothesis for milk producer and consumer price series was that; it is non-stationary having a unit root. Null hypothesis results, if fail to reject Ho rather accept it, meaning that price series have unit root and are non-stationary. The required lag number for ADF test is determined by using Schwarz information criteria (SIC).
Pt=𝐶𝐶 + 𝛽𝛽𝛽𝛽 + 𝛼𝛼𝛼𝛼𝛽𝛽 − 1 + ∑ 𝛾𝛾∆𝛼𝛼𝛽𝛽 − 1 + 𝜀𝜀𝛽𝛽𝐾𝐾𝑖𝑖=1 (1)
Where Pt = denote prices natural logarithm C denote intercept t is a linear time trend
If the selected time series price data is stationary on differencing, then the co-integrated order [I(1)] between price series is said to be present. We
used Johansen (1988) test to find out the cointegration relationship between the price series.
𝛼𝛼𝑝𝑝𝛽𝛽~ = 𝛼𝛼 + 𝛽𝛽𝛼𝛼𝑐𝑐𝛽𝛽~ + 𝑉𝑉𝛽𝛽 (2)
If Ppt and Pct price series are co-integrated and in the order of I(1), then the residuals Vt would be I(0).
To examine the long run conintegration between two price series, we applied Granger causality test. The presence of long run relationship between two price series is detected if a significant information is statistically predicted by P1 about the future values of P2. The relationship is defined as P1 have Granger-causality for P2.In this study the estimation of Granger-causality test was very important; as no prior information on causal relationship between milk producer and consumer prices is established in literature for milk marketing system of Punjab. The null hypothesis was formulated in such a way that its rejection would provide Granger causality for P1 to the price series P2.
e) Empirical Models used for Price TransmissionMeyer and Von Cramon-Taubadel (VECM)
model (2004) was used to examine the price dynamic relationship for non-stationary and co-integrated price series (Ppt and Pct). The Vector Error Correction model assumes the equation as follows:
∆𝛼𝛼𝑐𝑐𝛽𝛽 = 𝛼𝛼 + 𝜌𝜌�∆𝛼𝛼𝑐𝑐𝛽𝛽−1 − 𝛽𝛽∆𝛼𝛼𝑝𝑝𝛽𝛽−1� + 𝛿𝛿∆𝛼𝛼𝑝𝑝𝛽𝛽− + 𝜃𝜃∆𝛼𝛼𝑐𝑐𝛽𝛽−1 + 𝜀𝜀𝛽𝛽 (3)
= =
WhereΔPpt and ΔPpt-1 stand for the changes in farm-gate and lagged changes in farm-gate prices. ΔPct and ΔPct-1 denotes the changes in retail and lagged changes in farm-gate prices. The speed of adjustment to long run equilibrium is denoted by an error correction term "ρ". While “β” and δ indicates price transmission elasticity in long-run and short-run between two prices respectively. εt represent the white noise ( residual). The white noise (εt) is expected to be zero at the long run equilibrium
levels of both Pct and Ppt. However 𝜀𝜀𝛽𝛽 could be either positive or negative when both price series are away from their long run equilibrium. In other words; the white-noise (εt) would be positive if Pct series is well above its long-run equilibrium and(εt) is negative in the opposite case of Ppt series.
The error correction term (ECT) entered into Error Correction Model is a residual of equation (1) which is lagged by one period.
∆𝛼𝛼𝑐𝑐𝛽𝛽 = 𝛽𝛽0 + ∑ 𝛽𝛽1𝑛𝑛∆𝛼𝛼𝑝𝑝𝛽𝛽−1+1𝐾𝐾𝑛𝑛=1 + ∑ 𝛽𝛽2𝑚𝑚∆𝛼𝛼𝑐𝑐𝛽𝛽−𝑚𝑚𝐿𝐿
𝑚𝑚=1 + 𝜑𝜑 ∗ 𝐸𝐸𝐶𝐶𝐸𝐸𝛽𝛽−1 + 𝜀𝜀𝛽𝛽 (4)
Where 𝐸𝐸CTt−1 = 𝛼𝛼𝑐𝑐t−1 − 𝛼𝛼0 − 𝛼𝛼1 ∗𝛼𝛼𝑝𝑝t−1Granger and Lee (1989) in their study of US
industry inventory proposed a modification in equation (2) which enables to estimate the two co-integrated
prices variables asymmetric price transmission. They included additional dummy variables in the model and segmented the error correction term into ECT+ -and ECT-.
∆𝛼𝛼𝑐𝑐𝛽𝛽 = 𝛽𝛽0 + ∑ 𝛽𝛽1𝑛𝑛∆𝛼𝛼𝑝𝑝𝛽𝛽−𝑛𝑛+1 + ∑ 𝛽𝛽2𝑚𝑚∆𝛼𝛼𝑐𝑐𝛽𝛽−𝑚𝑚 + 𝜑𝜑1𝐷𝐷1𝛽𝛽+𝐸𝐸𝐶𝐶𝐸𝐸𝛽𝛽−1 + 𝜑𝜑2𝐷𝐷1𝛽𝛽
−𝐿𝐿𝑚𝑚=1
𝑁𝑁𝑛𝑛=1 𝐸𝐸𝐶𝐶𝐸𝐸𝛽𝛽−1 + 𝜀𝜀𝛽𝛽 (5)
with 𝐷𝐷1𝛽𝛽+ = 1 if 𝐸𝐸CTt−1 > 0 and 0 otherwise, 𝐷𝐷1𝛽𝛽
− =1 if
ECTt−1 < 0 and 0 otherwise.The long -run asymmetry hypothesis in equation (3) is:𝐻𝐻0: 𝜑𝜑1 = 𝜑𝜑2 it will tested through F-test.
To assess both aspect of response variation, the contemptuous response term was segmented into positive and negative components through Von Cramon-Taubadel and Flahlbusch (1994) which follow the form
:∆𝛼𝛼𝑐𝑐𝛽𝛽 = 𝛽𝛽0 + ∑ 𝛽𝛽1𝑘𝑘+ 𝐷𝐷𝑐𝑐𝛽𝛽+∆𝛼𝛼𝑝𝑝𝛽𝛽−𝑛𝑛+1 + ∑ 𝛽𝛽1𝑘𝑘
− 𝐷𝐷2𝛽𝛽− ∆𝛼𝛼𝑝𝑝𝛽𝛽−𝑛𝑛+1 + ∑ 𝛽𝛽2𝑚𝑚
𝐿𝐿𝑚𝑚=1 ∆𝛼𝛼𝑐𝑐𝛽𝛽−𝑚𝑚 + 𝐷𝐷1𝛽𝛽
+𝐸𝐸𝐶𝐶𝐸𝐸𝛽𝛽−1 + 𝜑𝜑2𝐷𝐷1𝛽𝛽−𝐿𝐿
𝑘𝑘=1𝑁𝑁𝑘𝑘=1 𝐸𝐸𝐶𝐶𝐸𝐸𝛽𝛽−1 + 𝜀𝜀𝛽𝛽 (6)

© 20 16 Global Journals Inc. (US)
31
Globa
l Jo
urna
l of M
anag
emen
t an
d Bu
siness Resea
rch
Volum
e XVI Issu
e VII
Ver
sion
IYe
ar
()
2016
B
Dairy Farmers’ Welfare Losses from Farm-To-Retail Milk Price Adjustments: Highlight on Market Integration and Price Transmission
with 𝐷𝐷2𝛽𝛽+ = 1 if 𝛥𝛥𝛼𝛼pt−𝑘𝑘+1 > 0 and 0 otherwise, 𝐷𝐷2𝛽𝛽
− =1 if 𝛥𝛥𝛼𝛼pt-𝑙𝑙+1 < 0 and 0otherwise.
To test both symmetry hypothesis for short run and long run, the equation (4) can be used in conjunction with joint F-test as under:
𝐻𝐻0 = ∑ 𝛽𝛽1𝑘𝑘+𝑁𝑁
𝑘𝑘=1 = ∑ 𝛽𝛽1𝑘𝑘−𝑁𝑁
𝑘𝑘=1 𝑎𝑎𝑛𝑛𝑎𝑎 𝜑𝜑1 = 𝜑𝜑2 (7)
According to von Cramon-Taubadel, valid inferences with respect to the parameters of interest in (1) or (4) requires the Ppt to be weakly exogenous. On account of this, Boswijk and Urbain testing procedure was followed and in the first step "Ppt" was estimated through marginal model as follow:
∆𝛼𝛼𝑝𝑝𝛽𝛽 = 𝛾𝛾0 + 𝛾𝛾1(𝐿𝐿)∆𝛼𝛼𝑝𝑝𝛽𝛽−1 + 𝛾𝛾2(𝐿𝐿)∆𝛼𝛼𝑝𝑝𝛽𝛽−1 + 𝑒𝑒𝛽𝛽 (8)
In the second step; we applied a variable addition test and fitted residual "ɛt" was estimated through marginal model (5); {in the structural model (2)
insignificant results for fitted residual in the structural model, a slightly conditioned “Error Correction Model” is assumed on short-run weekly exogenous variables. To proceeds further and to test the significance of long run parameters with respect to weak exogeneity, the ECTt-1 is added from equation (1) to equation (5).
However, if the results of all tests revealed a non-cointegration between variables, the VAR model can be specified and estimated. In this situation, the two equation included in VAR model can be written as follows:
𝛼𝛼𝑝𝑝𝛽𝛽 = 𝛼𝛼° + 𝛼𝛼1𝛼𝛼𝑝𝑝𝛽𝛽−1 + … … … … + 𝛼𝛼𝑘𝑘𝛼𝛼𝑝𝑝𝛽𝛽−𝑘𝑘 + 𝛾𝛾1𝛼𝛼𝑐𝑐𝛽𝛽−1 + … … … . +𝛾𝛾𝑘𝑘𝛼𝛼𝑐𝑐𝛽𝛽−𝑘𝑘 + 𝜀𝜀𝛽𝛽 (9) 𝛼𝛼𝑐𝑐𝛽𝛽 = 𝛽𝛽° + 𝛽𝛽1𝛼𝛼𝑐𝑐𝛽𝛽−1 + … … … … + 𝛽𝛽𝑘𝑘𝛼𝛼𝑐𝑐𝛽𝛽−𝑘𝑘 + 𝑐𝑐1𝛼𝛼𝑝𝑝𝛽𝛽−1 + … … … . +𝑐𝑐𝑘𝑘𝛼𝛼𝑝𝑝𝛽𝛽−𝑘𝑘 + 𝜀𝜀𝛽𝛽 (10)
Where Ppt and Pct are milk producer and consumers prices, and Ppt-k and Pct-k are lagged milk producer and consumers prices respectively.
III. Results and Discussion
a) Descriptive Statistics of Milk Prices at Dairy farmers and Milk Consumer level
In this section, we would discuss the price transmission and price adjustment analysis between the milk producer and consumer prices for selected four districts of Punjab province. The important descriptive
statistics derived from the analysis of respective price series are mentioned in Table 1.Average price per liter of fresh raw milk for producers ranged from was 23 PKR to 48 PKR. Average retail milk price ranged 40PKR/L to 78PKR/L. The information reported in Table 1, demonstrates noteworthy difference between farm and retail level milk prices among four districts during the period 2010 to 2016. The relative variation in milk prices under investigation are likely due to unregulated marketing system and cost of transporting ,ilk from rural areas to urban center.
Table 1: Overview of milk prices along milk marketing channel over period: 2010-2016
Districts Mean Median Standard Deviation Minimum Maximum
Milk Prices at Farm Level
Vehari 36 35 1.45 23 38
Lodhran 34 33.5 2.36 24 36
Bahawalpur 35 34 1.34 25 37
Muzaffargarh 38 36 1.36 25 38
Milk Prices at Retail Level
Vehari 45 44 2.35 35 77
Lodhran 46 45.6 3.56 36 75
Bahawalpur 45 44 2.35 35 74
Muzaffargarh 46 45 3.5 38 78
Source: Authors calculations from collected data, 2016.
b) Seasonality and Milk Price VariationsIn Pakistan, the seasonality is an important
factor and the milk production cycle encompassed flush and lean seasons. Milk production from December 15th
to April15th is considered as flush season whereas, from 16th April to August 15th is lean season. The rest of period also varies between mini flush (September toOctober) and mini lean (November and April). This
variation in milk production is due to changing weather and availability of fodder production in hot summer and winter. The prices during flush and lean seasons remained fluctuated. In flush season, milk production is more but consumption is less. Therefore, milk collectors (Dodhi) decrease milk prices. On the other hand during the lean season, extreme hot summer / or in winter months, the consumers like to consume more milk in the
and (4)}. If the outcomes of this test explained

32
Globa
l Jo
urna
l of M
anag
emen
t an
d Bu
siness Resea
rch
Volum
e XVI Issu
e VII
Ver
sion
IYe
ar
()
2016
© 2016 Global Journals Inc. (US)1
BDairy Farmers’ Welfare Losses from Farm-To-Retail Milk Price Adjustments: Highlight on Market
Integration and Price Transmission
Vehari, Lodhran, Bahawalpur and Muzaffargarh and over different marketing middlemen was estimated during both lean and flush season of one year. The important outcomes are mentioned in Table-2.
Table 2: Price Variations during Flush and Lean seasons among Inter and Intra- Milk Marketing Agents/Middlemen
Flush Season Milk Price Adjustments among Middlemen
District Milk Producers Milk Collectors (Dhodi)
Small Processors Retailers/Milk Shops
Vehari 45.75+2.90 55.30+10.10 62.65+8.25 63.5+8.00
(6.33) (18.3) (13.16) (12.6)
Lodhran 43.50+2.50 57.00+9.90 64.25+8.75 65.00+8.25
(5.74) (17.5) (13.61) (12.61)
Bahawalpur 46.25+2.00 54.00+9.88 63.50+7.5 64.00+8.20
(4.32) (18.3) (11.8) (12.8)
Muzaffargrah 45.00+2.25.00 56.50+9.75 61.25+7.7 63.50+7.75
(5) (17.27) (12.57) (12.2)
Lean Season Milk Price Adjustments among Middlemen
Vehari 48.25+2.00 58.00+10.50 66.25+8.00 68.00+8.25
(4.14) (18.1) (12.07) (12.13)
Lodhran 47.50+2.50 57.50+11.25 67.25+8.75 69.00+9.50
(5.26) (19.56) (13.01) (13.76)
Bahawalpur 49.35+2.20 58.25+10.25 68.25+8.25 70.00+8.20
form of milk beverages and tea. Therefore, in summer and winter due to lean season and more consumption, milk prices rise up very high towards consumers’ side but a slight increase is observed for milk producers. The market integration and price variation among districts
(4.45) (17.6) (12.08) (11.71)
Muzaffargrah 48.55+2.50 60.20+10.25 65.25+8.00 68.50+8.50
(5.14) (17.02) (12.26) (12.4)
Note: Price for standard milk (Fat 4.5%, SNF 8.5% and CLR 27.74) in lean season by Milk Producers was Rs.48 and flush season it was Rs.43 during 2015-16.(ii) Figures within parenthesis indicate percentage variation of price during milk peak and lean season
The estimation of fresh milk price variation was not far from uniformity when milk is sold directly from producers to consumers, as the percentage of price variation lies between 4.14 and 6.33. However, the percentage of price variation lies between 11.71 and 19.56 for inter-markets and/or intra-marketing agents which was far from uniformity. The possible explanation of this pattern may be as when milk collectors (Dhodi), small milk processors and retailers engaged in milk marketing chain; they added more transactions costs and absorb highest price margin. The highest percentage change in price was absorbed by milk collectors (Dhodi), followed by processors and retailers.The results in Table-2 explained the significant impact ofseasonality on milk prices. The price for per liter was a little high during the lean season for all district markets and/or for all types of marketing middlemen. The graphical representation also explained that milk prices
exhibit seasonal patterns for flush and lean season (Figure 2).
© 20 16 Global Journals Inc. (US)
33
Globa
l Jo
urna
l of M
anag
emen
t an
d Bu
siness Resea
rch
Volum
e XVI Issu
e VII
Ver
sion
IYe
ar
()
2016
B
Dairy Farmers’ Welfare Losses from Farm-To-Retail Milk Price Adjustments: Highlight on Market Integration and Price Transmission
-
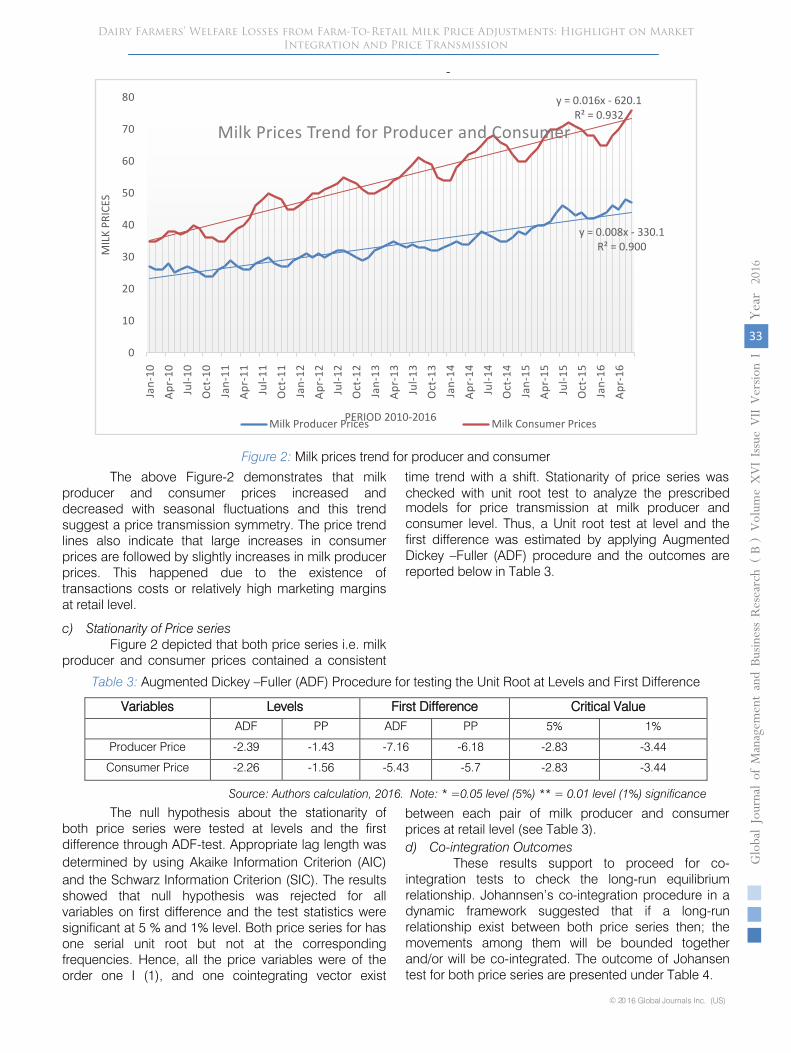
Figure 2: Milk prices trend for producer and consumer
The above Figure-2 demonstrates that milk producer and consumer prices increased and decreased with seasonal fluctuations and this trend suggest a price transmission symmetry. The price trend lines also indicate that large increases in consumer prices are followed by slightly increases in milk producer prices. This happened due to the existence of transactions costs or relatively high marketing margins at retail level.
c) Stationarity of Price seriesFigure 2 depicted that both price series i.e. milk
producer and consumer prices contained a consistent
time trend with a shift. Stationarity of price series was checked with unit root test to analyze the prescribed models for price transmission at milk producer and consumer level. Thus, a Unit root test at level and the first difference was estimated by applying Augmented Dickey –Fuller (ADF) procedure and the outcomes are reported below in Table 3.
y = 0.008x - 330.1R² = 0.900
y = 0.016x - 620.1R² = 0.932
0
10
20
30
40
50
60
70
80
Jan-
10Ap
r-10
Jul-1
0O
ct-1
0Ja
n-11
Apr-
11Ju
l-11
Oct
-11
Jan-
12Ap
r-12
Jul-1
2O
ct-1
2Ja
n-13
Apr-
13Ju
l-13
Oct
-13
Jan-
14Ap
r-14
Jul-1
4O
ct-1
4Ja
n-15
Apr-
15Ju
l-15
Oct
-15
Jan-
16Ap
r-16
MIL
K PR
ICES
PERIOD 2010-2016
Milk Prices Trend for Producer and Consumer
Milk Producer Prices Milk Consumer Prices
Table 3: Augmented Dickey –Fuller (ADF) Procedure for testing the Unit Root at Levels and First Difference
Variables Levels First Difference Critical ValueADF PP ADF PP 5% 1%
Producer Price -2.39 -1.43 -7.16 -6.18 -2.83 -3.44
Consumer Price -2.26 -1.56 -5.43 -5.7 -2.83 -3.44
Source: Authors calculation, 2016. Note: * =0.05 level (5%) ** = 0.01 level (1%) significance
The null hypothesis about the stationarity of both price series were tested at levels and the first difference through ADF-test. Appropriate lag length was determined by using Akaike Information Criterion (AIC) and the Schwarz Information Criterion (SIC). The results showed that null hypothesis was rejected for all variables on first difference and the test statistics were significant at 5 % and 1% level. Both price series for has one serial unit root but not at the corresponding frequencies. Hence, all the price variables were of the order one I (1), and one cointegrating vector exist
between each pair of milk producer and consumer prices at retail level (see Table 3).d) Co-integration Outcomes
These results support to proceed for co-integration tests to check the long-run equilibrium relationship. Johannsen’s co-integration procedure in a dynamic framework suggested that if a long-run relationship exist between both price series then; the movements among them will be bounded together and/or will be co-integrated. The outcome of Johansen test for both price series are presented under Table 4.

34
Globa
l Jo
urna
l of M
anag
emen
t an
d Bu
siness Resea
rch
Volum
e XVI Issu
e VII
Ver
sion
IYe
ar
()
2016
© 2016 Global Journals Inc. (US)1
BDairy Farmers’ Welfare Losses from Farm-To-Retail Milk Price Adjustments: Highlight on Market
Integration and Price Transmission
Table 4: Results of Johansen Co-integration test for milk producer and consumer prices
District Hypnotized co-integration equations
Trace test statistics
p-value Max-Eigen value statistics
p-value
Vehari None 21.64 0.0013* 19.63 0.0103*At most 1 2.156 0.13 2.156 0.1302
Muzaffargrah None 9.37 0.321 9.21 0.237At most 1 0.063 0.853 0.063 0.853
Lodhran None 19.83 0.0011* 17.38 0.0113*At most 1 2.36 0.129 2.36 0.129
Bahawalpur None 23.64 0.0023* 21.27 0.0023*At most 1 1.85 0.183 1.85 0.183
Source: Authors findings, 2016. ** MacKinnon-Haug-Michelis (1999) p-value and *indicate rejection of the hypothesis at the 0.05 level. Trace and Max-eigen value tests indicate 1 co integration equation at 0.05 levels.
The coinegrating vector in Johansen (1998) test included a constant term with formulation of null and alternative hypotheisis [Ho = the number of cointegrating vectors is zero (r=0); H1=one cointegrating vector is (r=1)]. AIC criteria were used to
e) Detection of Milk Price SymmetryThe next important step in price transmission
analysis of milk marketing was to determine the asymmetry of price movements between producer and consumer. Granger causality test was applied to find out the possible direction of price movements between marketing agents. To avoid from heteroscedasticity and Autocorrelation-consistent (HAC), seasonal dummies were added in the model. Granger causality test findings are presented in Table 5.
Table 5: Granger Causality test based on monthly data of milk producer and consumer level from 2010:01 to 2016:06
District Effect Hypothesized cause
F- statistics p value Conclusion
Vehari Producer Price Consumer Price 0.21 0.763 Reject
Consumer Price Producer Price 3.16 0.028* Do not reject
Muzaffargarh Producer Price Consumer Price 1.27 0.261 Reject
Consumer Price Producer Price 0.46 0.56 Reject
Lodhran Producer Price Consumer Price 1.02 0.346 Reject
Consumer Price Producer Price 8.79 0.002* Do not reject
Bahawalpur Producer Price Consumer Price 0.39 0.624 Reject
Consumer Price Producer Price 4.83 0.003* Do not reject
Source: Author findings, 2016.Notes: The null hypothesis is that one price series does not Granger cause to another; significance */** indicate rejection of null hypothesis at 1% and 5%.
milk producer → milk collector/dodhi → milk processors → distributors → retailers
The Granger causality analysis suggested two parallel effects of upward and downward price movement in a typical milk marketing chain :
The outcomes of Granger Causality test proved that in our marketing chain, there is a downward price mechanism. Hence, the direction of causality was from milk consumers to milk producer because the milk marketing middlemen have enough market power. This situation dragged the dairy farmers in a vulnerable position and deprived them from getting fair prices of their milk production. This problem stemmed from two major reasons; (i) milk is a perishable commodity and it cannot be retained or stock for a longer period of time
(ii) the Pakistani’s dairy farmers have not established and joined effective cooperative organizations. Hence, this poor structural arrangement of dairy sector compelled the dairy farmers in a price taker position.
f) Estimates of Vector Error Correction Model and Price Transmission
The findings presented in Table 3 & 4 explained that the trace and Maxi-eigen statistics were greater than critical values; price series were stationary at first
determine appropriate lag lengths. The statistics values of both λ trace and λ max test suggested that the null hypothesis was rejected for the zero cointegrating vectors and long-run relationship for one cointegrating vector was present between each price series (see Table 4).

© 20 16 Global Journals Inc. (US)
35
Globa
l Jo
urna
l of M
anag
emen
t an
d Bu
siness Resea
rch
Volum
e XVI Issu
e VII
Ver
sion
IYe
ar
()
2016
B
Dairy Farmers’ Welfare Losses from Farm-To-Retail Milk Price Adjustments: Highlight on Market Integration and Price Transmission
findings for testing asymmetry in price transmission within milk supply from producer to consumer through Vector Error Correction Model are presented under Table 6.
Table 6: Estimates of Vector Error Correction (VECM) for testing Asymmetry in Price Transmission of Milk Marketing Channels
Variables Coefficients Std. Error t-statistics (p-value)Δ ln Producer pricet-1 0.482* 0.071 6.789 0.007
Δ ln Consumer price t 0.316* 0.126 2.507 0.013
Δ ln Consumer pricet-1 0.416* 0.119 3.496 0.002
β1 0.028* 0.0106 2.641 0.021
β2 -0.013* 0.006 -2.167 0.021
β3 -0.029** 0.005 -5.801 0.035
β4 0.231 0.119 1.94 0.246
β5 -0.026* 0.008 -3.250 1.48e-05
β6 0.035** 0.009 3.889 0.034
β7 -0.026** 0.007 -3.714 0.051
β8 0.038* 0.011 3.454 0.024
β9 -0.029* 0.005 -5.80 0.001
β0 0.0001 0.008 0.0125 0.384
ECT-t-1 -0.076
ECT+t-1 0.280
D-W 1.92
R- squared 0.685
Adjusted R2 0.659
S.E. of Regression 0.023
RSS 0.103
Mean Dependent 0.006
differences and one co-integrating vector long-run relationship exist. These conditions support us to run the Vector Error Corrections Model (VECM) to evaluate how one price behave if one price increases or decrease in short-run and how it adjust for long-run equilibrium. The
S.D. Dependent 0.042
F-Statistics 36.435
Source: Authors calculations, 2016. */**/*** statistically significant at the 1% 5% and 10% levels, respectively. Δ ln Producer_milk is the milk producer log-price in first difference; Δ ln Consumer_milk is the consumer log-price in first difference. Lag order has been selected according to (AIC) Information Criteria.
run equilibrium rather than short run adjustment. According to our results, it is evident that a decrease in
milk prices at retail level are more quickly adjusted to decrease farmer price however, a increase in consumer prices is not transmitted with same adjustments. These results are also supported by findings of Rezitis and Reziti (2011) article which conclude that consumer prices increase faster than milk producer price. Our study results are also in accordance to Awokuse and Wang (2009); Capps and Sherwell (2007); and, (Yong and Nie 2016) studies, where asymmetric price transmission was also evidenced for both long run and short run equilibrium. The estimates in Table 6 conclude that when milk producer price increases one unit, the milk retailers contemptuously shift this one unit increase
The findings of VECM revealed that there exist positive relationship for outward price movements (milk producer → milk consumer) and negative relationship is found for downward movement (milk consumer → milk producer). The test of asymmetry for short-run suggested that the pattern of price movements for increase in prices was different than to decrease in prices (Table 6). The coefficients of ECT± showed that increase or decrease in consumer prices will affect the change in producer prices; however, greater price variations were observed for long

36
Globa
l Jo
urna
l of M
anag
emen
t an
d Bu
siness Resea
rch
Volum
e XVI Issu
e VII
Ver
sion
IYe
ar
()
2016
© 2016 Global Journals Inc. (US)1
BDairy Farmers’ Welfare Losses from Farm-To-Retail Milk Price Adjustments: Highlight on Market
Integration and Price Transmission
to consumer price in order to retain its profit at fixed level (deviation equal to zero).The coefficient of VECM expressed price adjustments during a period of time. For one month (i.e. short-run period) one unit positive change in consumer’s price would approximately adjust milk producer price 7.6% whereas in long-run equilibrium it is around 28% (Table 6). Hence, decrease in milk producer prices during flush season in long-run equilibrium did not transmitted to consumer welfare. This is attributable to marketing middlemen/retailers who absorb all the positive price deviation and did not shift this advantage to consumers. Consequently, coefficients of the segmented ECT revealed the asymmetric price transmission was obvious in milk marketing chain, Table 6. Our findings were also supported by a study conducted by Acosta and Valdes (2013) who analyzed the vertical milk market price transmission pre-consignation methods. Their study also suggested positive price transmission asymmetries and concluded that increase in farmer prices are passed on more quickly and more completely to retail prices than to decrease in farmer prices.
IV. Conclusions and Recommendations
This study was carried out to examine the price adjustments for short-run and long-run equilibrium. The symmetry of price adjustments between milk producer and consumer was studied through price transmission analysis. Time series data of milk prices ranged from January 2010 to June 2016 for producer and consumerwere analyzed by applying VECM along with descriptive statistics. Both the price series were stationary at first difference; the Johansen cointegration test provided the evidence of long term cointegration in prices. The estimates of Vector Error Correction model (VECM) revealed that milk consumer price (Pct) was exogenous and the outcomes of Granger causality test validate the evidence of unidirectional price causality from farm to retail side and not vice versa. The analysis provide an indication that milk marketing system working in selected districts is imperfect , market power is on the demand side and asymmetric price transmission is evident in milk supply chain. The possible justification for this could be that marketing middlemen earn largeprofit margins when milk price increases during hot summer or winter (lean season). The middlemen still make abnormal profit during flush seasons when milk supply is more but its demand declines. Thus, prices are transmitted from consumers to milk producers in an asymmetric mode and middlemen abuse their market power to absorb positive price shock or transmit with delay in long run equilibrium. The pattern of asymmetric price transmission towards the principal stakeholders i.e. milk producers and consumers during peak and lean seasons of milk production, not only lowers the dairy farmers’ profitability but also abolish the consumer welfare effects.
The study suggest that the asymmetric flow of prices can be make smaller if milk producers are integrated into small or large milk cooperatives organizations. The milk collecting associations will help to reduce the transactions costs, offer reliable milk market with better returns and minimize the middlemen role/margins. The public or private interventions are also recommended to improve the milk marketing system of Pakistan. It could be achieved through better storage or low cost chilling units provided to milk producers at substantial rates for enhancing the perishable life of milk. These efforts would results to capture a larger share of milk producer in consumer price. Thus, study evidenced for market imperfections could be utilized for achieving a close collaboration of milk producers to re-structure the milk supply system in Punjab province. Such collaboration would enable the farmers to strengthen their negotiation power in the vertical market linkages and having a better position for taking the price decision.
V. Acknowledgement
This study was carried out under National Natural Science Foundation, China (7167031183) under a major project “Impact of infant powder milk safety trust index on product competitiveness- Index measurement, construction of related market model and market simulation” (G0300502).
References Références Referencias
1. Abdulai, A., (2002). Using threshold cointegration to estimate asymmetric price transmission in the Swiss pork market, Applied Economics, 34: 679-687.
2. Acquah, H.G., Dadzie, S.K.N., (2010). An application of the von Cramon-Taubadel and Loy error correction models in analyzing asymmetric adjustment between retail and wholesale maize prices in Ghana, Journal of Development and Agricultural Economics, 2:100-106.
3. Awokuse, T.O., Wang, X., (2009). Threshold effects and asymmetric price adjustment in U.S. dairy markets. Canadian Journal of Agricultural Economics, 57: 269-286.
4. Azzam, A.M., (1999). Asymmetry and rigidity in farm-retail price transmission. American Journal of Agricultural Economics, 81:525-533.
5. Bailey, D., Brorsen, B.W., (1989). Price Asymmetry in Spatial Fed Cattle Markets. Western Journal of Agricultural Economics, 14:246-252.
6. Ben, K. M., Gil, J.M. (2007). Asymmetric price transmission in the Spanish lamb sector. European Review of Agricultural Economics, 34: 53-80.
7. Capps, O., Sherwell, J.P. (2007). Alternative approaches in detecting asymmetry in farm-retail price transmission of fluid milk. Agribusiness, 23: 313 – 331.

© 20 16 Global Journals Inc. (US)
37
Globa
l Jo
urna
l of M
anag
emen
t an
d Bu
siness Resea
rch
Volum
e XVI Issu
e VII
Ver
sion
IYe
ar
()
2016
B
Dairy Farmers’ Welfare Losses from Farm-To-Retail Milk Price Adjustments: Highlight on Market Integration and Price Transmission
8. Chavas, J., Mehta, A., (2004). Price Dynamics in a Vertical Sector: The Case of Butter. American Journal of Agricultural Economics, 86:1078-1093.
9. Falkowski, J., (2010). Price transmission and market power in a transition context: evidence from the Polish fluid milk sector. Post-Communist Economies, 22: 513-529.
10. Goodwin, B.K., Harper, D.C. (2000): Price transmission, threshold behavior, and asymmetric adjustment in the U.S. pork sector. Journal of Agricultural and Applied Economics, 32: 543-553.
11. Government of Pakistan, 2010. Agricultural statistics of Pakistan. Ministry of Food, Agriculture and Livestock, Economic Wing, Islamabad, Pakistan.
12. Government of Pakistan, 2016. Economic Survey of Pakistan, Economic affairs wing, Finance ministry, Islamabad.
13. Granger, C.W.J., Lee, T.H., (1989). Investigation of production, sales and inventory relationships using multi-cointegration and non-symmetric error correction models. Journal of Applied Econometrics, 4:145-159.
14. Johansen, S., (1988). Statistical analysis of cointegrating vectors. Journal of Economic Dynamics and Control, 12:231-254.
15. Jung, H. H., Ahn, B. I. (2015). Multiple-regime price transmission between wheat and wheat flour prices in Korea. Agricultural Economics (Zeme delská Ekonomika), 61(12) 552-563.
16. Lass, D.A., Adanu, M., Allen, P.G., (2001). Impacts of the Northeast dairy compact on New England retail prices. Agricultural and Resource Economics Review, 30: 83-92.
17. Peltzman, S., (2000). Prices rise faster than they fall. Journal of Political Economy, 108:466-502.
18. Reziti, I., (2014). Price transmission analysis in the Greek milk market. Journal of Economics and Business, 64:75-86.
19. Rezitis, A. N., Reziti, I. (2011). Threshold cointegration in the Greek milk market. Journal of International Food & Agribusiness Marketing, 23(3), 231-246.
20. Rudra, A., (1992). Political Economy of Indian Agriculture (Calcutta: KP Bhagchi and Co).
21. Serra, T., Goodwin, B.K., (2003). Price transmission and the asymmetric adjustment in the Spanish dairy sector. Applied Economics, 35:1889-1999.
22. Shinoj, P., Kumar, B.G., Sathiadhasb, R., Dattaa, K.K., Menona, M., Singha, S.K. (2008). Spatial price integration and price transmission among major fish markets in India. Agricultural Economics research, 327-335.
23. Stewart, H. Blayney, D.P., (2011). Retail dairy prices fluctuate with the farm value of milk. Agricultural and Resource Economics Review, 40: 201 – 217.
24. Tekguc, H., (2013). Oligopoly and price transmission in Turkey’s fluid milk market. Agribusiness, 29: 293 – 305.
25. Von, C.T., Fahlbusch, S., (1994). Identifying asymmetric price transmission with error correction models. Poster Session EAAE European Seminar in Reading U.K.
26. Von, C.T., Meyer, S. (2004). Asymmetric Price transmission: A Survey. Journal of Agricultural Economics, 55:581-611.
27. Yong, C.Y., Nie, P.Y., (2016). Asymmetric competition in food industry with product substitutability. Agric. Econ. – Czech, 62: 324–333
28. Zia, U., (2007). Analysis of Milk Marketing Chain–Pakistan. Italian Journal of Animal Science, 6:1384-1386.

This page is intentionally left blank
3
38
Globa
l Jo
urna
l of M
anag
emen
t an
d Bu
siness Resea
rch
Volum
e XVI Issu
e VII
Ver
sion
IYe
ar
()
2016
© 2016 Global Journals Inc. (US)1
BDairy Farmers’ Welfare Losses from Farm-To-Retail Milk Price Adjustments: Highlight on Market
Integration and Price Transmission