dairy farming is a global industry!...– metabolic alkalosis impairs physiologic activity of...
TRANSCRIPT

Dairy farming is a global industry!

Disease and economics of the transition period
John Fetrow VMD, MBA Professor of Dairy Production Medicine
College of Veterinary Medicine University of Minnesota
There are many colleagues who have contributed to this presentation Dr. Mike Overton Dr. Jesse Goff
Dr. Sandra Godden Dr. Ricardo Chebel Dr. Mike Hutjens
Dr. James Drakely This presentation is copyright 2015 by the authors. Do not distribute in any way without permission.
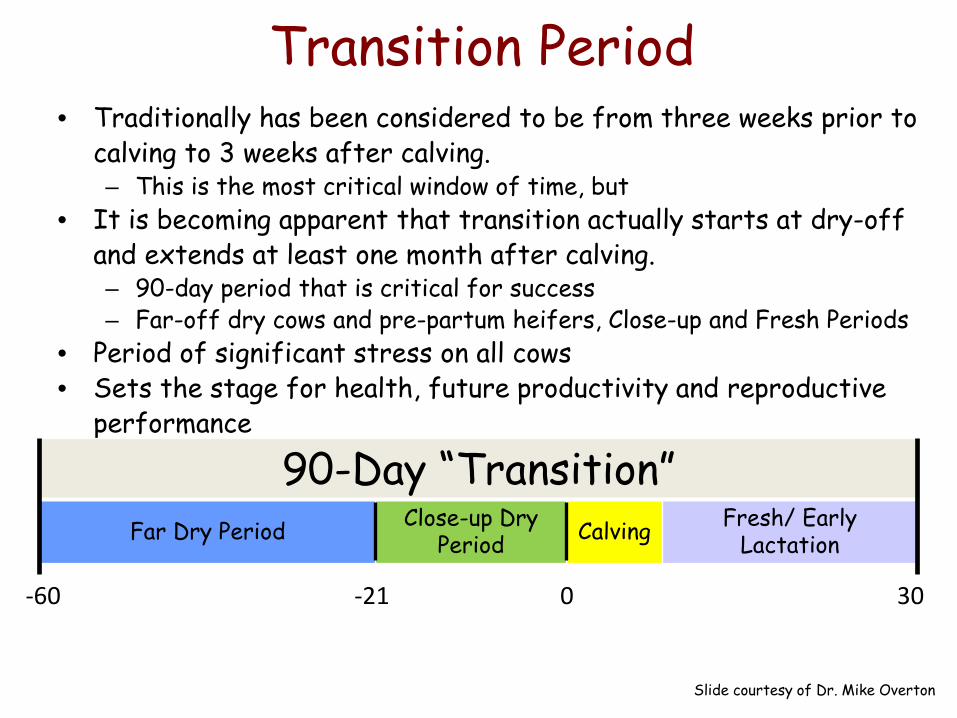
Transition Period • Traditionally has been considered to be from three weeks prior to
calving to 3 weeks after calving. – This is the most critical window of time, but
• It is becoming apparent that transition actually starts at dry-off and extends at least one month after calving. – 90-day period that is critical for success – Far-off dry cows and pre-partum heifers, Close-up and Fresh Periods
• Period of significant stress on all cows • Sets the stage for health, future productivity and reproductive
performance 90-Day “Transition”
Far Dry Period Close-up Dry Period Calving Fresh/ Early
Lactation
-60 -21 0 30
Slide courtesy of Dr. Mike Overton

Transition period • significant hormonal, metabolic,
immunologic, and physiologic transitions – late pregnancy (fetal growth) – production of colostrum – parturition – initiation of lactation
• most of the disease events in a cow’s life – may set the stage for diseases later on – infertility, mastitis, lameness
• much of culling happens in transition period

Dairy Cows Experience Dramatic Metabolic Changes During Transition
• Key issues: – LARGE increase in glucose demand by the uterus/fetus and then
mammary gland – Dramatic changes in hormone levels – Potentially large changes in feed intake – Hypocalcemia – Immunosuppression
• Key adaptations: – Peripheral tissues decrease their use of glucose and spare it for use
by the pregnant uterus and mammary gland – Increased gluconeogenesis by the liver – Increased mobilization of body fat and protein
Slide courtesy of Dr. Mike Overton

Incidence of major health problems in US dairy herds from USDA-National Animal Health Monitoring Surveys
% Cattle Affected
Year of Survey 1995 2001 2007
Mastitis 13.4 14.7 16.5
Lameness 10.5 11.6 14.0
Retained Placenta 7.8 7.8 7.8
Milk Fever 5.9 5.2 4.9
Displaced Abomasum 2.8 3.5 3.5
Dairy cows commonly have a lot of problems in the transition period.

Post-calving Disorders in 61 High Producing Holstein Herds
(24,442 lb.)
Jordan et al., JDS, 1993
Slide courtesy of Dr. Sandra Godden
Retained placenta 9.0 % Milk fever 7.2 % Displaced abomasum 3.3 % Down cows 1.1 %


Days in milk at disease event 10,000 cow dairy
Metritis Average DIM: 6 days *for metritis < 21 DIM

Days in milk at disease event 10,000 cow dairy
Displaced Abomasum Average DIM: 17 days *For DA at less than 80 DIM

Days in milk at disease event 10,000 cow dairy
Mastitis Average DIM: 36 days
+/- 31 days *for first case of mastitis at less than 100 DIM

Lame events in a 10,000 cow dairy

Dystocia
Displaced abomasum
Poor production
Culling
Ketosis Fatty liver
Metritis Retained placenta
Mastitis Poor
fertility Lameness
Pneumonia
Transition problems do not occur in isolation
Nutrition Housing Comfort
Vaccination Treatment
Care

Transition problems • Transition problems are part
of a complex and interacting system, where many factors affect the risk and severity of disease.
• It is not useful to think that a particular disease occurs in isolation
• Preventing disease requires an understanding of the system and interventions that fix the system
• Good management can reduce the risk and impact of transition cow diseases

Mastitis
Retained Fetal Membranes and Metritis
Ketosis/ Fatty Liver
Milk Fever
Displaced Abomasum
Lameness
Decreasing DMI Around Calving
Insufficient Vitamins, Trace Minerals, or Anti-Oxidants
High DCAD or Low Mg diets
Negative Energy + Protein Balance Increasing NEFA
Immune Suppression Hypocalcemia Lost Muscle Tone
Insufficient Dietary Effective Fiber
Rumen acidosis
Slide from Dr. Jesse Goff


Transition cow problems • There are many contributing causes of transition cow
problems, but most of the problems are caused by three common pathways 1. Negative energy balance around calving
• And likely negative protein balance
2. Hypocalcemia • Both clinical and more importantly subclinical
3. Immune suppression • Partly due to the first two, but also mediated by
hormonal changes, stress, management errors, and other nutritional deficiencies (selenium, vitamin E)

1. Negative energy balance • Energy is needed for maintenance, fetal growth,
colostrum production, lactation, and immune functions – Reduced dry matter intake around calving adds to the
problem – If physiologic systems that respond to negative energy
balance have been down-regulated during the dry period, the cow may not be able to respond to the sudden increased need for energy at parturition and early lactation
• Result: ketosis, fatty liver, poor production, retained placenta, metritis, mastitis, other infectious diseases, delay in reproductive cycling, and increased risk of culling and death.

Glucose Demand vs. Supply
Glucose and amino acids are energy source requirements for the fetus. Glucose is required by mammary gland to produce colostrum and milk.
Whole-body glucose demand vs. total splanchnic output in cows fed a high grain diet for ad libitum intake during the dry period.
Overton TR.. 2000. http://vaca.agro.uncor.edu/~pleche/material/Material%20II/A%20archivos%20internet/Alimentacion/transicion.pdf Accessed 1/19/13.
Slide courtesy of Dr. Mike Overton

What is Happening to Feed Intake?
7
9
11
13
15
17
19
21
23
-21 -18 -15 -12 -9 -6 -3 0 3 6 9 12 15 18 21
Day relative to calving
DMI (k
g/d)
50
150
250
350
450
550
650
NEFA
, mEq
/L
DMINEFA
Overton TR.. 2000. http://vaca.agro.uncor.edu/~pleche/material/Material%20II/A%20archivos%20internet/Alimentacion/transicion.pdf Accessed 1/19/13.
Slide courtesy of Dr. Mike Overton

0
5
10
15
20
25
1 3 5 7 9 11 13 15 17 19
Slide from Dr. Mike Hutjens U of I
Healthy (22)Sick (24)
( )
RP/MET (10)DA/KET (13)
Feed intake post partum for normal and sick cows Cows that will be diagnosed as sick later are already eating less feed.
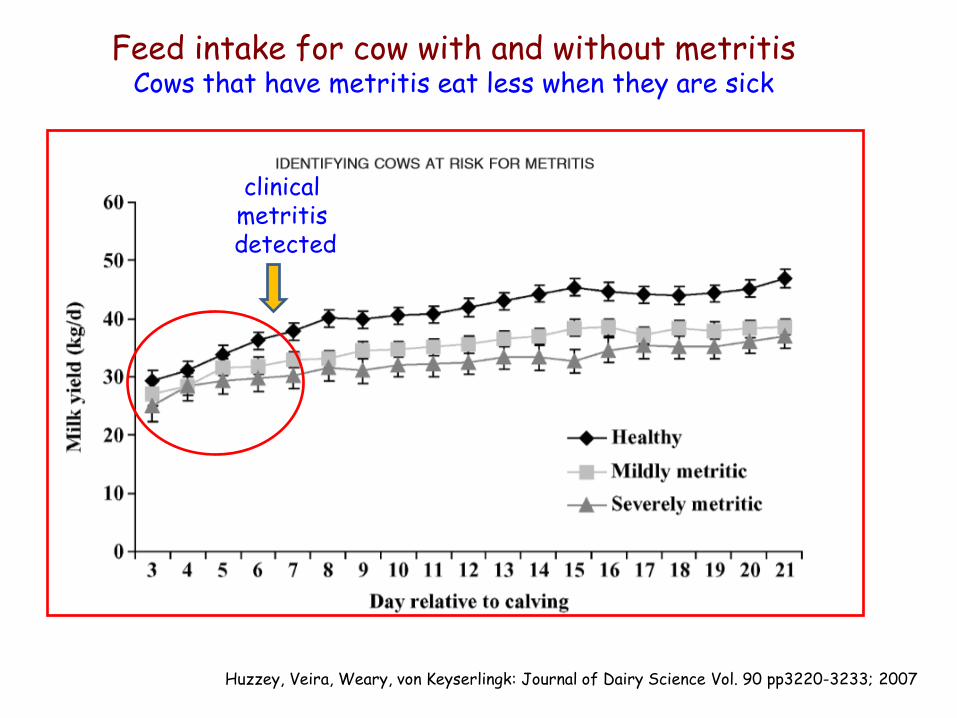
Feed intake for cow with and without metritis Cows that have metritis eat less when they are sick
Huzzey, Veira, Weary, von Keyserlingk: Journal of Dairy Science Vol. 90 pp3220-3233; 2007
clinical metritis detected

Feed intake for cow with and without metritis Cows that will get metritis were eating less feed before calving!
Huzzey, Veira, Weary, von Keyserlingk: Journal of Dairy Science Vol. 90 pp3220-3233; 2007
clinical metritis detected
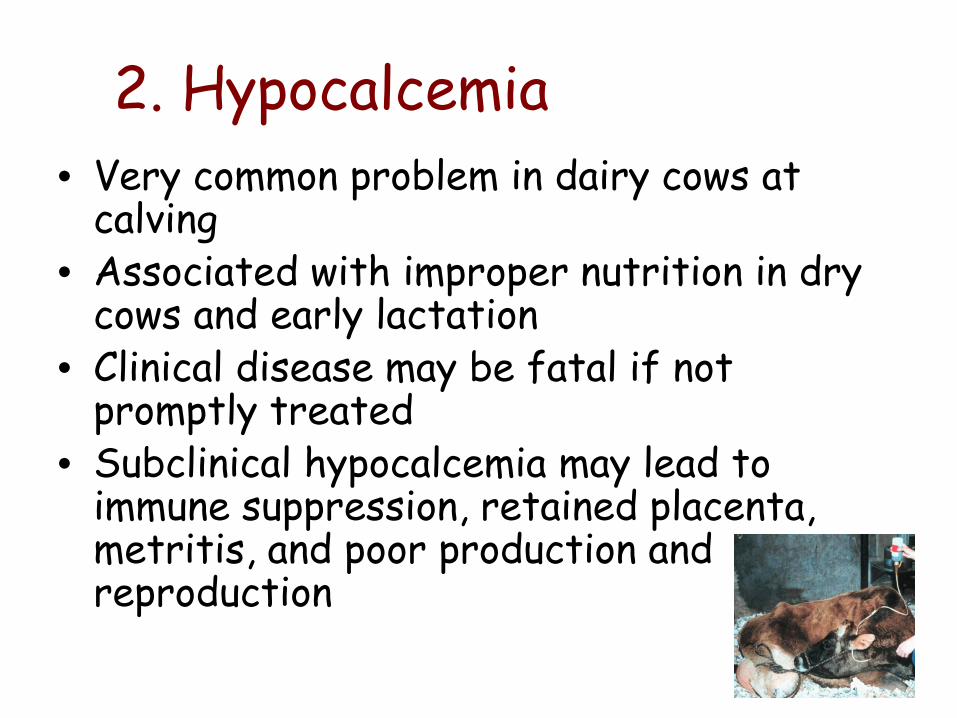
2. Hypocalcemia • Very common problem in dairy cows at
calving • Associated with improper nutrition in dry
cows and early lactation • Clinical disease may be fatal if not
promptly treated • Subclinical hypocalcemia may lead to
immune suppression, retained placenta, metritis, and poor production and reproduction
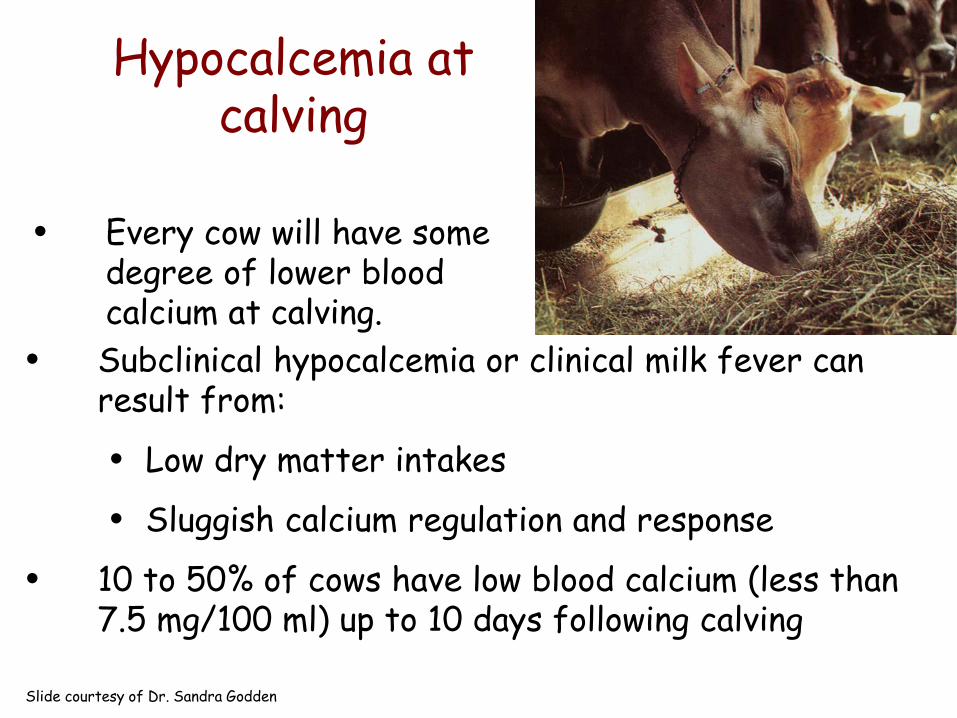
Hypocalcemia at calving
• Every cow will have some degree of lower blood calcium at calving.
• Subclinical hypocalcemia or clinical milk fever can result from:
• Low dry matter intakes
• Sluggish calcium regulation and response
• 10 to 50% of cows have low blood calcium (less than 7.5 mg/100 ml) up to 10 days following calving
Slide courtesy of Dr. Sandra Godden

Early-Mid Dry Period
Extracellular Calcium Pool (8-10 g)
Plasma Calcium Pool (2.5-3.0 g)
Calcitonin +
Bone Deposition Diet - Dry: 50 g/d Intestine
Urinary Loss (0.25-1.0 g/d)
Fecal Loss (6-10 g/d)
Fetal Bone (2-10 g/d)
Calcitonin +
Passive Absorption
Slide courtesy of Dr. Sandra Godden
Calcitonin is driving calcium into bones.

Periparturient Period
Extracellular Calcium Pool (8-10 g)
Plasma Calcium Pool (2.5-3.0 g)
PTH ++
Bone Resorption Diet - Dry: 50 g/d - Lactating: >100 g/d
Intestine
1,25-(OH)2 vit. D +
Colostrum/Milk (20-80 g/d)
Urinary Loss (0.25-1.0 g/d)
Fecal Loss (6-10 g/d)
Fetal Bone (2-10 g/d)
PTH -
Slide courtesy of Dr. Sandra Godden
Parathyroid hormone must take calcium from bones.

Cows with hypocalcemia eat less: more negative energy balance
Slide courtesy of Dr. Sandra Godden

Cows with milk fever have higher cortisol levels: stress hormone; immune suppression
Slide courtesy of Dr. Sandra Godden
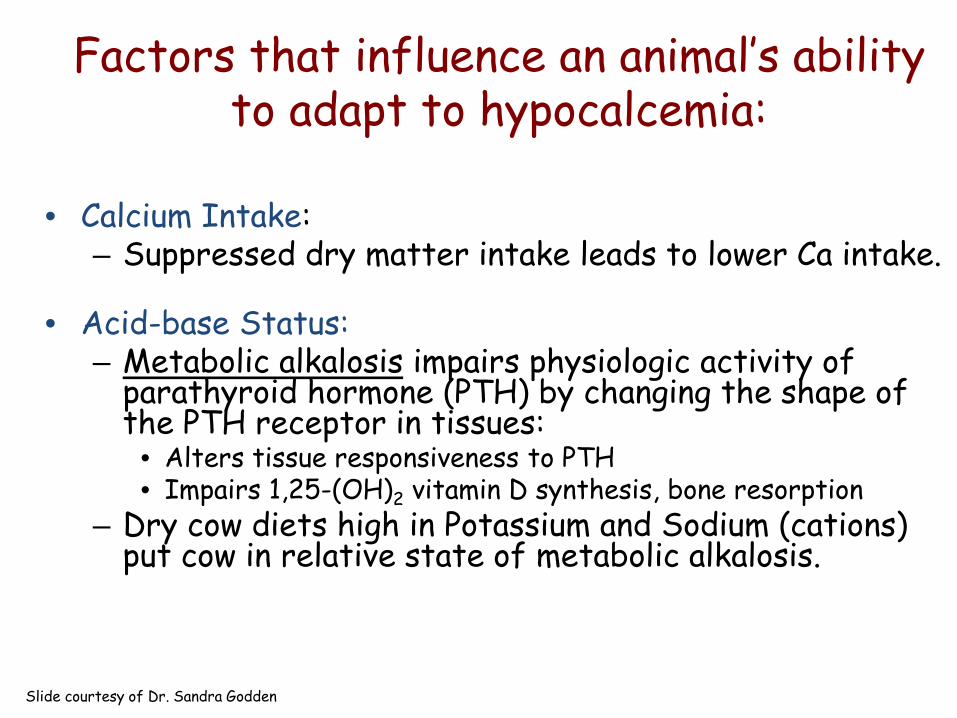
Factors that influence an animal’s ability to adapt to hypocalcemia:
• Calcium Intake: – Suppressed dry matter intake leads to lower Ca intake.
• Acid-base Status:
– Metabolic alkalosis impairs physiologic activity of parathyroid hormone (PTH) by changing the shape of the PTH receptor in tissues:
• Alters tissue responsiveness to PTH • Impairs 1,25-(OH)2 vitamin D synthesis, bone resorption
– Dry cow diets high in Potassium and Sodium (cations) put cow in relative state of metabolic alkalosis.
Slide courtesy of Dr. Sandra Godden

VCNA-FA July 2000 Goff Page 322
PTH Binding to Tissue Receptors
Poor PTH-receptor binding with metabolic alkalosis. This makes it difficult for the cow to respond to hypocalcemia.
Slide courtesy of Dr. Jesse Goff and Dr. Sandra Godden

A. pH=7.35 Normal Mg
Cyclic AMP
PTH
Receptor
C. pH=7.35 Hypomagnesemia
PTH
Receptor
B. pH=7.45 Normal Mg
Receptor
PTH
Adenyl cyclase complex
Adenyl cyclase complex
Adenyl cyclase complex
Mg++
Cyclic AMP Cyclic AMP
Mg++ ??
Slide courtesy of Dr. Jesse Goff and Dr. Sandra Godden

3. Immune suppression • Suppressed immunity increases the risk of
several peri-partum diseases • Less vigorous detachment of the placenta and increased
retained placenta • Metritis • Mastitis • Respiratory infections
• Lower energy intake reduces immune responses to challenges
• Hypocalcemia and hypomagnesemia impairs immune system function
• Higher cortisol levels in stressed cows suppresses immune responses

Immune suppression: other factors
• Low selenium levels • Low vitamin E levels • Other stressors: mostly causes of reduced
feed intake – Uncomfortable – Cold or hot – Crowded – Dirty – Competition (cows and heifers) – Lack of water – Limited feed, bunk space – Moldy feeds

Mastitis
Retained Fetal Membranes and Metritis
Ketosis/ Fatty Liver
Milk Fever
Displaced Abomasum
Lameness
Decreasing DMI Around Calving
Insufficient Vitamins, Trace Minerals, or Anti-Oxidants
High DCAD or Low Mg diets
Negative Energy + Protein Balance Increasing NEFA
Immune Suppression Hypocalcemia Lost Muscle Tone
Insufficient Dietary Effective Fiber
Rumen acidosis
Slide from Dr. Jesse Goff
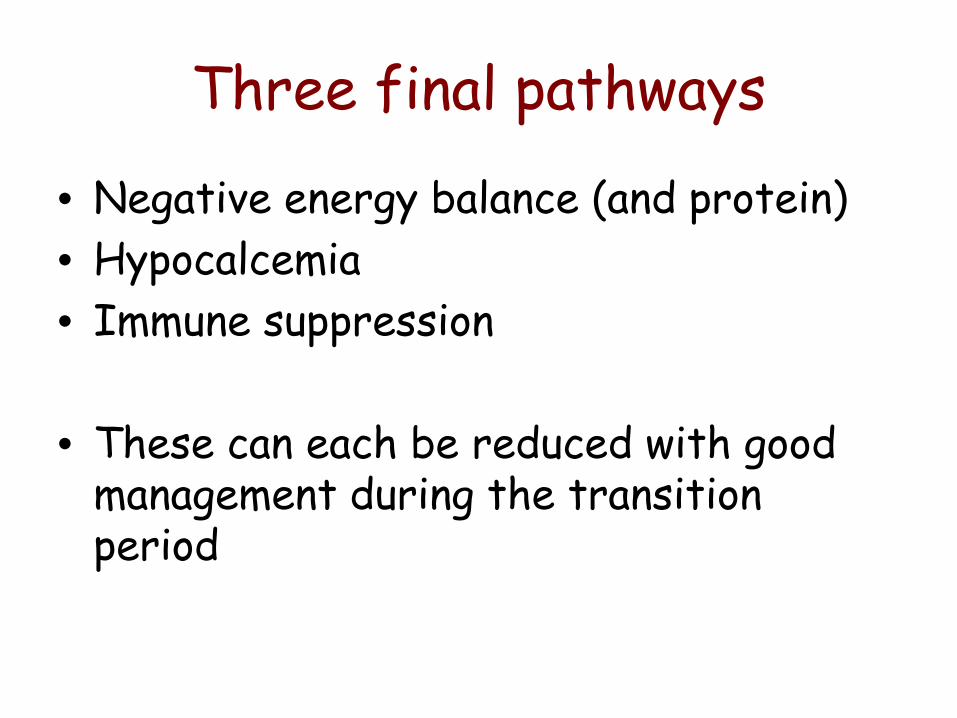
Three final pathways
• Negative energy balance (and protein) • Hypocalcemia • Immune suppression
• These can each be reduced with good
management during the transition period

Transition and economics

Economic analysis • The purpose of an economic analysis is to
inform the decision maker.
• Decisions are made for many reasons. – economics is only one of the reasons
• For most dairy decisions, the economic analysis need only provide a close estimate of the order of magnitude of the economics. – Models are tools; even imperfect models can
provide useful information. For many purposes, a rough estimate is good enough for managerial decision making.

Impact of disease • It is tempting to think of a disease as though it
were like a traffic accident – Everything was fine until the accident and then
there are bad consequences: costs, continuing illness, death, disability, etc.
• Transition cow disease does not work that way – Often, there is dysfunction in the cow well before
the clinical case is recognized. – Often, the causes of the disease are in place well
before the actual clinical case is recognized. – Management mistakes create the conditions that
lead to the disease.
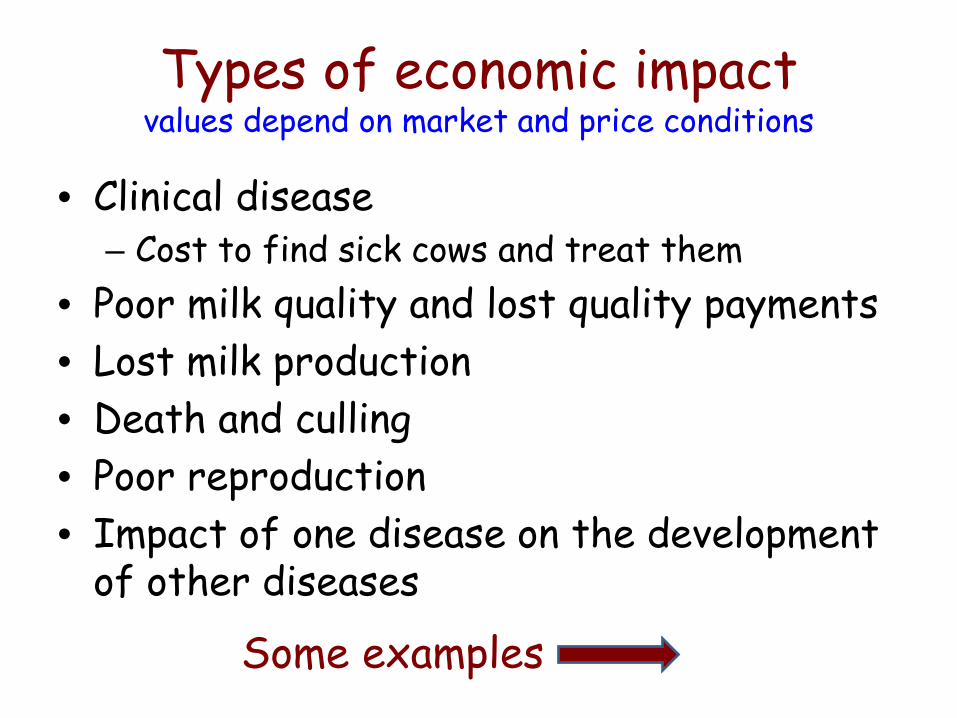
Types of economic impact values depend on market and price conditions
• Clinical disease – Cost to find sick cows and treat them
• Poor milk quality and lost quality payments • Lost milk production • Death and culling • Poor reproduction • Impact of one disease on the development
of other diseases
Some examples

Economics and clinical disease
• for a defined disease, estimates can be made about the cost of a single case – treatment costs
• drugs, labor, milk discard, veterinary services – lost milk production – increased risk of culling or death – impacts on reproductive performance – impact on mastitis incidence
• the total cost for all cases can then be based on the incidence of the disease if good records are kept

Cost of a case of metritis
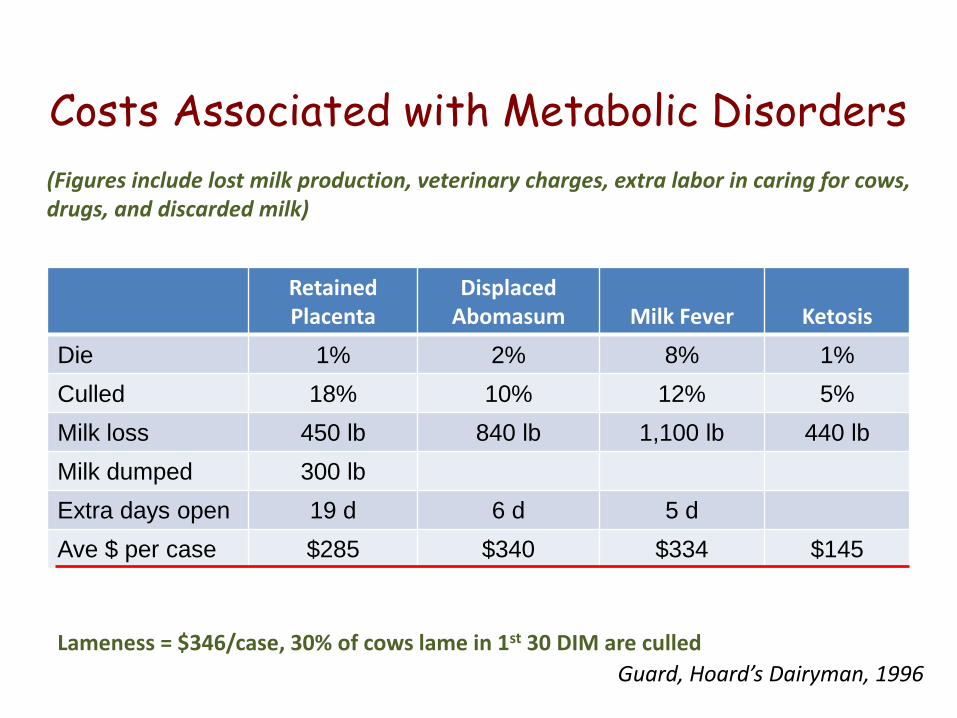
Costs Associated with Metabolic Disorders
Retained Placenta
Displaced Abomasum
Milk Fever
Ketosis
Die 1% 2% 8% 1% Culled 18% 10% 12% 5% Milk loss 450 lb 840 lb 1,100 lb 440 lb Milk dumped 300 lb Extra days open 19 d 6 d 5 d Ave $ per case $285 $340 $334 $145
Guard, Hoard’s Dairyman, 1996
(Figures include lost milk production, veterinary charges, extra labor in caring for cows, drugs, and discarded milk)
Lameness = $346/case, 30% of cows lame in 1st 30 DIM are culled
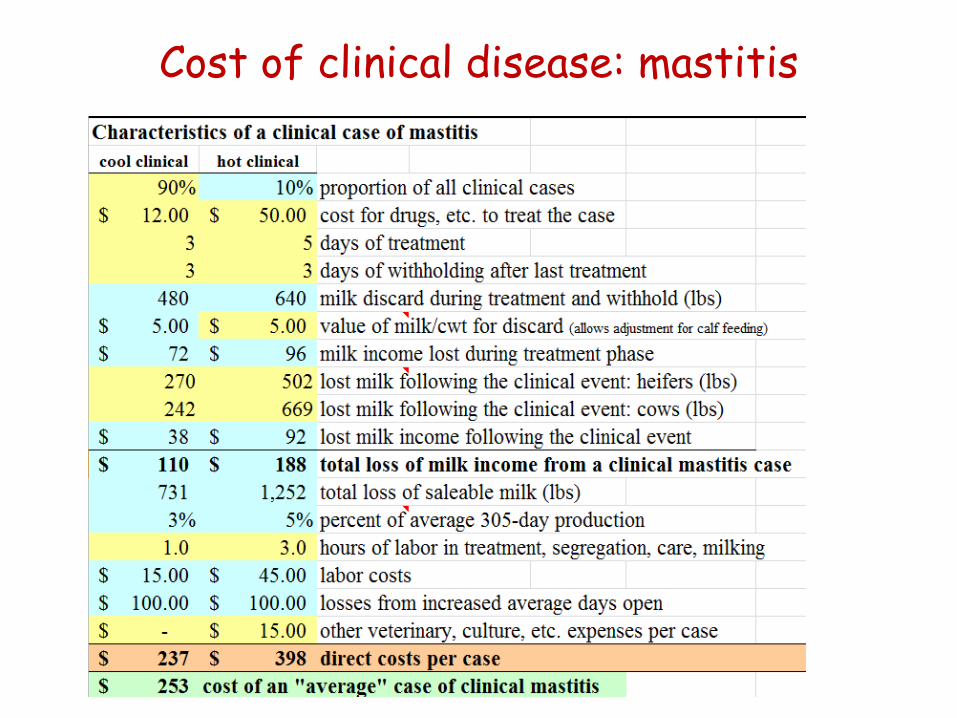
Cost of clinical disease: mastitis

Loss due to mastitis over desired goal

0102030405060708090
100
1 3 5 7 9 11 13 15 17 19
Milk production post partum for normal and sick cows
Healthy (22)Sick (24)
( )
RP/MET (10)DA/KET (13)
Slide from Dr. Mike Hutjens U of I
Much of the economic impact may be “invisible”: Much of the loss comes later with lower production, poor reproduction, and culling.
Research by Dr. Richard Wallace and others, Univ. of Illinois
days

Profit loss it transition problems reduce milk production across the lactation

Culling
Goal: • < 5 % of milking herd
should leave the dairy before 60 days in milk.
• <3% should die before 60 days in milk.
Transition problems significantly increase the risk that a cow will be culled.

When Cows Leave and Risk of Leaving the Herd MN DHIA data (10/96 – 10/01)
0%
2%
4%
6%
8%
10%
12%
20 62 104
146
188
230
272
314
356
398
440
21- Day Period Ending Day
% C
ows
Leav
ing
That
Lef
t In
the
Perio
d
0.00%
0.04%
0.08%
0.12%
0.16%
0.20%
0.24%
Aver
age
Risk
per
D o
f Lea
ving
In a
Pe
riod
Percent of Those Leaving Risk of Leaving
624,614 Cows Leaving From ~2,800 Herds
Source: 2002, S. Stewart, Univ. of Minnesota

Cost of death and culling


Effects of Periparturient Diseases on Long Term Reproductive Performance
Diseases
Disease Outcome Yes No
AOR (95% CI) MIC, d
Pregnant 305 DIM,
%
AOR (95% CI) MIC, d
Pregnant 305 DIM,
%
Stillbirth 1.6 (1.4, 1.8)
187.3 ± 5.2
52.3 Referent 152.6 ± 1.0
73.7
Ketosis 1.8 (1.4, 2.4)
191.7 ± 9.7
42.4 Referent 153.5 ± 1.0
73.3
Metritis 1.2 (1.2, 1.3)
168.5 ± 2.7
66.3 Referent 151.8 ± 1.1
73.8
Mastitis 1.3 (1.2, 1.3)
167.7 ± 1.7
68.7 Referent 147.0 ± 1.2
74.9
Slide courtesy of Dr. Ricardo Chebel

100
90
80
70
60
50
40
30
20
10
00 100 200 300
Prop
ortio
n no
npre
gnan
t, %
Impact of mastitis on abortion and pregnancy rates
0
5
10
15
20
25
30
35
Risco et al.,1999
Chebel et al.,2004
Moore et al.,2005
Preg
nanc
y loss
, %
No Mastitis Mastitis
28 to 35 d
30 to 45 d
45 to 135 d
DIM
Median days to conception:
Control = 114
Mastitis = 134
Santos et al. Anim. Reprod. Sci. (2004)
Effect of mastitis – P < 0.001
Slide courtesy of Dr. Ricardo Chebel

Effect of lameness early in lactation on reproductive efficiency
• Lame cows within 30 DIM had prolonged (34 vs. 29 d) anovular period (Garbarion et al., 2006)
• Lame cows within 70 DIM had longer interval to pregnancy (149 vs. 119 d) (Bicalho et al., 2007)
Slide courtesy of Dr. Ricardo Chebel

Goals for disease rates • Goals should be set in conversation with the dairyman
– at the simplest level, the goal is “better than now” • For many diseases, epidemiologic studies and looking
at high achievement herd results can guide the determination of goals. – It is important to have effective disease recording
systems • Diseases may not be reliably indentified or recorded on
many dairies. • Economically, improving disease status from bad to
OK is more valuable than going from OK to great. – work on areas where there are big problems or
opportunities
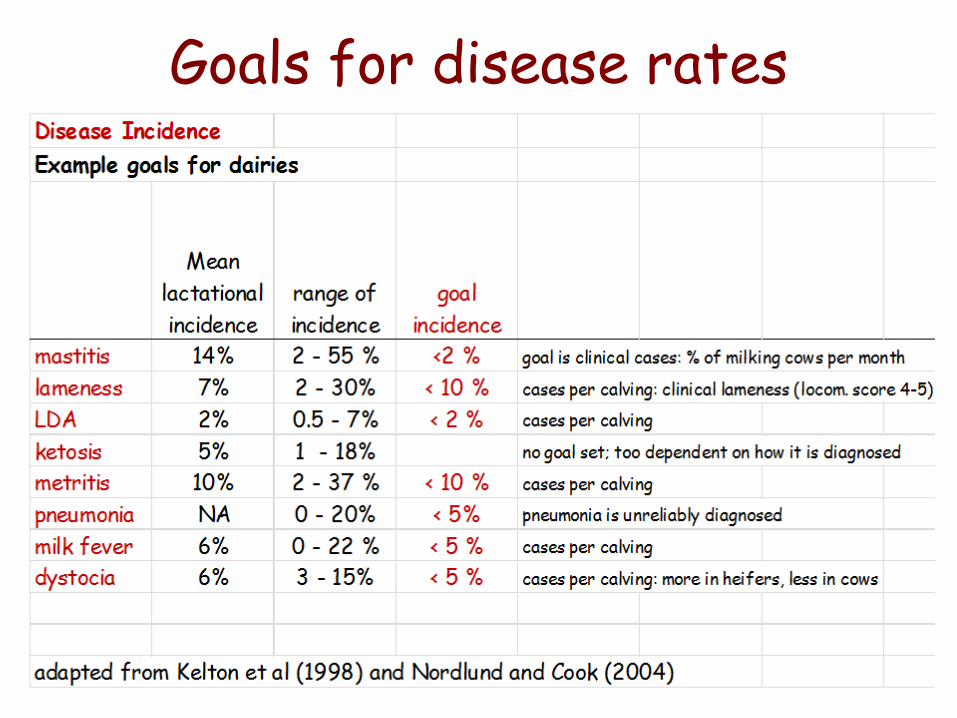
Goals for disease rates

Economics and disease
• It is not particularly useful to calculate the total cost of disease on a dairy – The dairy will not likely achieve “no disease”, so
there will always be costs • The more interesting question is:
– What is the cost of disease above a reasonable and achievable level of disease on this dairy?
• “Avoidable loss” • Losses at actual levels compared to desired levels of
the disease

Calculating the “avoidable loss” due to disease on a dairy
• “avoidable loss” provides an estimate of the benefit of improving management and achieving the dairy’s goals.
• It also provides an upper limit on how much can be spent to achieve the goal. – usually will not want to spend the whole
potential gained value • you want some profit
– improved management may not actually achieve the full goal

Calculating the cost of diseases: loss above goals levels of disease

Calculating the difference between a herd’s current disease incidence and a reasonable and achievable goal.
Remember: This only estimates the loss to excess disease. It does not include the likely larger impact on production from poor transition in cows that never become clinically sick.


Impact of the transition period
• For many dairies, improving transition management could significantly improve production, reduce culling and death, and reduce the incidence of disease.
• There are ways to estimate the economic potential of improvements.
• Managers must work constantly to find ways to improve the transition period.

Thank you very much for your attention.