dairy processing 008
TRANSCRIPT

6.1 Introduction: the role of predictive modelling
Processing of food products is designed in part to reduce or eliminate potentiallypathogenic microorganisms which may cause serious illness if ingested.Consumers are now demanding fresher, less processed foods, and there is amove towards the development of minimally processed foods, which areprotected by a series of intervention steps (or ‘hurdles’) (Leistner and Gorris,1995). It is essential that the efficacy of these hurdles be assessed for each foodproduct; however, the traditional approach of challenge testing is timeconsuming and labour intensive. Mathematical modelling of microbial survivaland growth in foods provides a structured approach to ensure the safety of thefood supply.
Thermal inactivation of microorganisms in static systems is usually describedby theD- andz-value concepts as discussed below, with temperature generallyheld constant. The situation in canning operations or continuous flow systemssuch as high-temperature short-time (HTST) pasteurisation, ultra hightemperature (UHT) and sterilisation processes is somewhat more complex,due to non-isothermal conditions, thus an integrated lethal effect approach isrequired (Kessler, 1986). In addition, the kinetics of inactivation in continuoussystems differ from those of batch systems, since in the former systems there areadditional factors such as pressure and shear forces which can influencemicrobial survival (Mackey and Bratchell, 1989; Fairchildet al., 1994). As mostmodern food processes are continuous, it is necessary to have additionalinformation on survival of microorganisms in these processes; however, fewstudies have been published on laboratory or pilot plant continuous flow systems(for review, see Fairchildet al., 1994). Development of databases and models
6
Modelling the effectiveness ofpasteurisationR. C. McKellar, Agriculture and Agri-Food Canada

for microbial behaviour in foods during processing and storage is an importantpart of predictive modelling, thus we initiated studies to develop models for thesurvival of selected food-borne microorganisms and milk enzymes during HTSTpasteurisation. This chapter will present some of the basic concepts of modellingthermal inactivation. It will then describe how pasteurisation models have beendeveloped using a pilot plant pasteuriser, followed by a summary of the modelsdeveloped to date. Finally, a brief review of risk assessment will be presented,with details relating to the incorporation of pasteurisation models into the riskassessment framework.
6.2 The development of thermal models
The classical approach to thermal destruction of microorganisms assumessimple first-order reaction kinetics under isothermal conditions:
dSt
dt� ÿk0St 6:1
whereSt is the survival ratio (Nt=N0, whereNt is the number of cells at timetand N0 the number of cells at time 0), andk0 is the rate constant. Thus thenumber of surviving cells decreases exponentially:
St � eÿk0t 6:2
and when expressed as log10 gives:
log St � ÿkt 6:3
wherek � k0=ln 10. The well-knownD-value (time required for a 1-log reduc-tion) is thus equal to 1/k, wherek is the slope (Fig. 6.1). TheD-values can alsobe expressed as:
D-value� tlogN0 ÿ logNt
6:4
When log D-values are plotted against the corresponding temperatures, thereciprocal of the slope is equal to thez-value, which is the increase intemperature required for a 1-log decrease inD-value (Fig. 6.1 inset). The rateconstant can also be related to the temperature by the Arrhenius equation:
k � N0eÿEa=RT 6:5
whereEa is the activation energy,R is the universal gas constant, andT is thetemperature in K.
The food processing industry has enjoyed an enviable record of safety, thusthe concept of exponential death of microorganisms has persisted, and is nowconsidered accepted dogma. In spite of this, non-linear survival curves werereported for some bacteria almost 100 years ago (Moatset al., 1971). Thetheoretical basis for assuming logarithmic behaviour for bacteria is based on theassumption that bacterial populations are homogeneous with respect to thermal
Modelling the effectiveness of pasteurisation 105

tolerance, and that inactivation is due to a single critical site per cell (Moatset al.,1971). Both of these assumptions have been questioned, and thus concerns havebeen raised regarding the validity of extrapolation of linear inactivation curves(Campanella and Peleg, 2001; Cerf, 1977). In general, there are two classes ofnon-linear curves: those with a ‘shoulder’ or lag prior to inactivation, and thosewhich exhibit tailing. These two phenomena may be present together, or withother observed kinetics such as biphasic inactivation. A wide variety of complexinactivation kinetics have been reported, and several of these are shown in Fig.6.2, which include shoulder (a), biphasic (b), sigmoidal (c), and concave (d).
Stringeret al. (2000) have assigned the possible explanations for non-linearkinetics into two classes: those due to artifacts and limitations in experimentalprocedure, and those due to normal features of the inactivation process. The firstclass encompasses such limitations as
• Variability in heating procedure• Use of mixed cultures or populations• Clumping• Protective effect of dead cells• Method of enumeration• Poor statistical design.
The second class includes such situations as
• Possible multiple hit mechanisms• Natural distribution of heat sensitivity• Heat adaptation.
Fig. 6.1 Definition of theD- andz-values describing thermal inactivation kinetics.
106 Dairy processing

These two classes roughly parallel two concepts reviewed by Cerf (1977) toexplain tailing in bacterial survival curves. The first of these (the ‘mechanistic’approach) also makes the assumption of homogeneity of cell resistance andproposes that thermal destruction follows a process analogous to a chemicalreaction. In this approach, deviations from linearity are attributed mainly toartifacts; however, tailing is also related to the mechanism of inactivation orresistance. In the second (the ‘vitalistic’ approach) it is assumed that the cellspossess a normal heterogeneity of heat resistance, thus survival curves should besigmoidal or concave upward (Cerf, 1977).
Inactivation curves which deviate from simple exponential often have a lag orshoulder region prior to the exponential phase. This shape of inactivation curveis probably the one most commonly experienced by researchers. A simple linearmodel to account for this behaviour was developed by Whiting (1993):
logNt �logN0 when 0< t < tL
logN0 ÿ 1D
� ��t ÿ tL� when t > tL
8<: 6:6
wheretL is the lag phase prior to inactivation. The Fermi equation, which is the‘mirror image’ of the common logistic growth function, is also used for deathcurves which exhibit a shoulder (Pruitt and Kamau, 1993):
Fig. 6.2 Examples of non-linear thermal inactivation curves: (a) shoulder; (b) biphasiclogistic; (c) sigmoidal; (d) concave.
Modelling the effectiveness of pasteurisation 107
logSt � log1� eÿbtL
1� eb�tÿtL�
� �6:7
whereb is the maximum specific death rate (Fig. 6.2a). When one wishes toinclude a secondary, more heat-resistant population, the resulting biphasiclogistic function is (Whiting, 1993):
logSt � logF�1� eÿb1tL �1� eb1�tÿtL� �
�1ÿ F��1� eÿb2tL �1� eb2�tÿtL�
� �6:8
whereb1 is the maximum specific death rate for the primary population andb2 isthe maximum specific death rate for the secondary population. TraditionalD-values may be calculated as 2.3/b for each population. Lag phases are not alwayspresent, though this can be accounted for by setting the value oftL to zero. Anexample of the output of this function is given in Fig. 6.2(b). Sigmoidalinactivation curves (Fig. 6.2(c)) can also be modelled using the asymmetricGompertz function (Lintonet al., 1995):
logSt � CeÿeA�Bt ÿ CeÿeA6:9
where A, B and C are coefficients. Another of the more common shapes ofsurvival curves is the concave curve, which has no lag, and a single, tailingpopulation (Fig. 6.2(d)). This function is best represented by the power law:
logSt � ÿ tp
D6:10
wherep is the power. A concave curve is produced whenp< 1.One recent development in the modelling of bacterial survival is the use of
distributions. This is based on the assumption that lethal events are probabilisticrather than deterministic, and that individual cells vary in their apparent thermalstability. The Weibull distribution is used in engineering to model time tofailure, so it is appropriate for modelling bacterial inactivation. The distributionof survival times would then follow the probability density function (PDF) forthe Weibull (solid line in Fig. 6.3):
PDF� �
�
t�
� ��ÿ1eÿ�t=��
�
6:11
where� and� are parameters relating to the scale and shape of the distribution,respectively (vanBoekel, 2002). The survival curve is then the cumulativedistribution function (CDF) (dotted line in Fig. 6.3):
CDF� eÿ�t=���
6:12
It can be easily seen that the CDF of the Weibull distribution is essentially areparameterisation of the power law function (equation 6.10).
As mentioned earlier, non-isothermal conditions predominate in continuousfood processes. Bigelow’s (1921) model has been the non-isothermal standardmodel for the low-acid canned food industry for many decades. In this approach,the processing timeF is determined by integrating the exposure time at various
108 Dairy processing

temperaturesT�t� to time at a reference temperatureTRef (Nuneset al., 1993):
F �Z
10�T�t�ÿTRef�=z dt 6:13
This model is considered to be an approximation of the Arrhenius model whichis valid over a wide range (4–160ºC) of temperatures (Nuneset al., 1993):
PE� 1t0
Z t
0eÿ�Ea=R���1=T�ÿ�1=T0�� dt 6:14
wherePE = integrated lethal effect, or pasteurisation effectEa = energy of activation (J molÿ1)R = 8.314 (J molÿ1 Kÿ1)T = temperature (K)T0 = reference temperature (345 K)t = time (s)t0 = reference time (15 s).
The reference temperature (345 K or 72ºC) and time (15 s) correspond to theInternational Dairy Federation standard for pasteurisation (Kessler, 1986).
It is often necessary for milk processors to demonstrate that the process theywish to use is effective in delivering the required lethal effect for the productand microorganism of concern. The integrated lethal effect is a useful concept,as it allows two or more processes which use different time/temperaturecombinations to be compared for efficacy against food-borne pathogens;however, there are few data available relating microbial survival to processing
Fig. 6.3 Examples of the probability distribution function (solid line) and thecumulative distribution function (broken line) for a Weibull distribution.
Modelling the effectiveness of pasteurisation 109

conditions. This is of particular concern in the case of pasteurisation of milk,where the only accepted test for proper pasteurisation is the alkalinephosphatase (AP) test (Staal, 1986; International Dairy Federation, 1991).The relationship between AP inactivation and survival of food-borne pathogensis largely unknown, as is the response of AP to processing under alternativetime/temperature combinations. In addition, data are lacking on the influence ofcontinuous thermal processing on other milk enzymes which may be useful inmonitoring thermal process above or below that required for pasteurisation(Griffiths, 1986; Andrews et al., 1987; Zehetneret al., 1996). Theseconsiderations prompted the initiation of work to develop mathematical modelsdescribing the survival of food-borne pathogens and selected milk enzymesduring HTST pasteurisation.
6.3 Key steps in model development
6.3.1 Strains and culture conditionsBacterial strains used in the various studies were maintained in glycerol atÿ20ºC and propagated on Tryptic Soy Broth containing 0.6% (w/v) YeastExtract (TSBYE). Strains were transferred twice into TSBYE at 30ºC for 24 h,then inoculated into 20 litres of TSBYE at 30ºC for 24 h. The cultures wereconcentrated to approximately 800 ml using a Pellicon filtration system with anHVMP000C5 0.45�m filter and stored overnight at 4ºC.
6.3.2 Pasteuriser designThe pasteuriser (Fig. 6.4) was designed to heat milk at a rate of 363 kg hÿ1 from2ºC to temperatures as high as 80ºC, and cool back to 4.5ºC with 90%regeneration. Pressure on the milk leaving the regeneration section was boostedby means of a positive displacement pump to obtain a mean pressure differentialof 41.4 kPa over the raw or feed side of the regeneration unit. The temperature ofthe milk in the pasteuriser was controlled using a Yokogawa YS170 processvariable air-activated controller with three proportional settings in degreesCelsius.
6.3.3 Holding tubesHolding tubes were constructed of 304 stainless steel with an internal diameterof 2.2 cm. The length of the holding tubes varied from 0.62 m (5.42 s) to as longas 17.23 m (63.93 s) depending on the residence time desired: a summary ofholding times and lengths appears in Table 6.1.
Previous work of D’Aoustet al. (1987) estimated a Reynolds number of10 500 for milk at 72ºC in a 16.2 s holding tube, which is well above the criticalminimum of 4000 required for turbulent flow. The minimum holding time wasdetermined using a conductivity meter with the salt testing procedure set forth
110 Dairy processing

Fig. 6.4 Schematic diagram of the pilot-scale high-temperature short-time (HTST) pasteuriser from McKellaret al. (1994b) reprinted withpermission fromJournal of Food Protection. Copyright held by the International Association for Food Protection, Des Moines, Iowa, USA. AuthorsMcKellar and Modler are with Agriculture & Agri-Food Canada, Guelph, Canada; authors Couture, Hughes, Mayers, Gleeson, and Ross are with
Health Canada, Ottawa, Ontario, Canada.

by the International Association of Milk, Food, and Environmental Sanitarians,the Public Health Service and the Dairy Industry Committee (1992).
The minimum time, from the point of product entry into the regenerationsection until collection at the receiving tank (excluding holding tubes), wasestimated to be 57.8 s. The component times were as follows: regeneration (rawside) 5.00 s; heating, 4.63 s; regeneration (pasteurised side) to sampling valve14.98 s; sampling valve to receiving tank 29.87 s; timing pump 3.28 s. Totalresidence time was obtained by adding the sum of the above times (57.8 s) to the‘corrected’ holding tube times, reported in Table 6.1. This time was useful fordetermining when the product, for a particular heat treatment, had cleared thepasteurisation system.
6.3.4 Temperature monitoringTemperatures were monitored using thermocouples (TC) at the following points(Fig. 6.4):
• TC 1 – end of regeneration (raw milk side)• TC 2 – after positive pump and before seating• TC 3 – end of heating• TC 4 – end of holding tube• TC 5 – end of holding tube
oapproximately same location
• TC 6 – end of regeneration (pasteuriser side).
Thermocouples were inserted at the geometric centre of the product stream withthe exterior stainless steel sheath being insulated with Imcolok Thermo Cel.
The thermocouples were connected to a Digistrip II recorder set to read at 2-sintervals and to print out all measurements at 1-min intervals. Data were
Table 6.1 Holding times in APV-Crepaco Junior Paraflow Pasteurisera
Holding Measuredb Standard Maximum Correctedc
tube length minimum deviation deviation holding time(m) holding time (s)
(s)
0.62 2.49 0.02 0.06 5.422.78 9.97 0.03 0.14 12.904.33 14.80 0.04 0.16 17.738.71 31.09 0.14 0.38 34.02
17.23 61.00 0.07 0.25 63.93
a Data are from McKellaret al. (1994b) reprinted with permission fromJournal of Food Protection.Copyright held by the International Association for Food Protection, Des Moines, Iowa, USA.Authors McKellar and Modler are with Agriculture & Agri-Food Canada, Guelph, Ontario, Canada;authors Couture, Hughes, Payers, Gleeson, and Ross are with Health Canada, Ottawa, Ontario,Canada.b Determined using the salt conductivity test (n� 5).c Obtained by adding 2.93 s to the minimum holding time to allow for feed and return port connectors(calculated from the total volume of the connectors assuming 80% efficiency).
112 Dairy processing

simultaneously collected with a portable computer using Telix V3.11communications software. The thermocouples were calibrated at the Heat andThermometry Laboratory, Physics Division, National Research Council ofCanada, and were accurate within�0.2ºC when tested at 1ºC intervals between0 and 120ºC. Prior to each run the thermocouples were also checked for erroragainst ice-water.
6.3.5 Milk processingMilk (3.5% milkfat) was obtained from the Greenbelt Farm of AgricultureCanada one day prior to experimentation. Approximately 1200–1600 litres ofHolstein milk were pumped from the delivery truck to a 1670-litre Cherry-Burrell tank. When pathogen inactivation was being studied, milk was addedalso to two Mueller tanks each containing 200 litres of whole milk which hadbeen previously heated to 80ºC for 1 h, then cooled to 4ºC. Each tank was theninoculated with 400 ml of culture concentrate (to approx. 108 cfu mlÿ1), and100 ml of the dye Fast Green FCF in distilled H2O (1% w/v) was added as amarker for inoculated milk.
Processing consisted of starting at the highest temperature for a given holdingtube, e.g. 80ºC, and working down in 0.5–1.0ºC increments until the lowesttemperature had been achieved. This normally spanned the range of 5ºC for atotal of 6–10 samples per holding tube. Samples were taken only after thedesired temperature had been achieved and maintained for a minimum of 3 min.When milk containing pathogens was being processed, temperatures were setusing uninoculated milk from a bulk tank. Once a constant temperature had beenestablished, flow was switched to the Mueller tank, and milk was sampled afterthe green dye had become apparent in the outflow. The flow rate was monitoredusing a mass flow meter, and was adjusted to 6.3 kg minÿ1 by manuallycontrolling the variable speed drives of the feed and booster pumps.
6.3.6 Program developmentThe program to calculate PE was written in VisualBasic. PE for each section ofthe pasteuriser was determined by converting time at the indicated temperatureto the equivalent time at the reference temperature using the empirical kineticequation described by Kessler (equation 6.14). For each section of thepasteuriser, the cumulative lethal effect was determined using the trapezoidalrule (Gibaldi and Perrier, 1975), and expressed as PE. Total PE was calculatedby adding the individual PE values for each section.
The stages in the HTST modelling program are given in Fig. 6.5. When amodel was being derived, data from the TCs with the corresponding holdingtube and residual enzyme activity or viable counts were input for each sample.Equipment calibration factors and residence times in the various parts of thesystem were input from separate configuration files. Lethal temperature wasarbitrarily set at 60ºC. A range forEa/R was defined (usually 60 000 to 80 000)
Modelling the effectiveness of pasteurisation 113

Fig. 6.5 Flow chart describing the development and validation of HTST models from McKellaret al. (1994b) reprinted with permission fromJournal of Food Protection. Copyright held by the International Association for Food Protection, Des Moines, Iowa, USA. Authors McKellar andModler are with Agriculture & Agri-Food Canada, Guelph, Canada; authors Couture, Hughes, Mayers, Gleeson, and Ross are with Health Canada,
Ottawa, Ontario, Canada.

and the lowest value was selected. For eachEa/R, a total PE was calculated foreach sample, and least-squares regression was performed between PE and log10
% initial activity or initial cfu mlÿ1. In order to improve the fit, a power lawtransformation (equation 6.10) of PE was incorporated in which a range of PEc
values were calculated (c� 0:2 to 1.0). The method of least squares was used(PEc vs. log10 % initial activity or initial cfu mlÿ1) to obtain the best value ofcby minimising the error sum of squares (ESS) for each value ofEa/R. ESS isdefined as�1ÿ r2� � TSS, where TSS is the total sum of squares.
Values ofEa/R were incremented by 500, and the iteration was repeated asdescribed above. The iterations were terminated when the new ESS value didnot improve on the previous value by more than 0.0001. The final modelconsisted of the bestEa/R, slope, intercept and power (c). Output for eachsample for further plotting was in the formx� PEc, y� experimental data(log10 % initial activity or initial cfu mlÿ1).
When an enzyme model was being validated, TC data, log10 % initial activityvalues, and equipment configuration were input as described above (Fig. 6.5).The optimumEa/R andc values were fixed, and PEc was calculated for each datapoint. Intercept (a) and slope (b) values from the model were used to calculatepredicted activity using the following equation:
Predicted activity� a� b � PEc 6:15
and output was in the formx � predicted activity,y � experimental activity.
6.4 Models for key enzymes and pathogens
In model development, the parameter estimates for at least three trials werepooled for each milk enzyme or pathogen studied, and the mean parametervalues are given in Table 6.2. Due to the importance of pasteurisation in milkprocessing, the first model was developed for AP (McKellaret al., 1994b).There was also a need to develop models for milk enzymes which might be usedto confirm processing at temperatures above or below pasteurisation. Higher
Table 6.2 Model parameters for inactivation of various milk enzymes and food-bornepathogens during HTST pasteurisation
Target Trials Intercept Slope PowerEa/R (� 1000)
Alkaline phosphatase 3 2.05 ÿ4.05 0.50 66.5 -Glutamyl transpeptidase 3 2.00 ÿ0.281 0.75 66.5Lactoperoxidase 3 2.12 ÿ0.096 0.75 59.0Catalase 3 1.94 ÿ2.65 0.50 82.0�-L-fucosidase 3 1.87 ÿ17.6 1.00 39.8Listeria innocua 5 1.86 ÿ24.9 0.80 59.5Listeria monocytogenes 3 1.68 ÿ18.4 0.80 48.5Enterobacter sakazakii 3 2.31 ÿ24.4 0.65 59.5
Modelling the effectiveness of pasteurisation 115

temperatures (at least 75ºC) are appropriate for processing of more viscous dairyproducts such as ice-cream mix. Lactoperoxidase (LP) and -glutamyl trans-peptidase (TP) are two naturally occurring milk enzymes which are inactivatedat higher temperatures, and models were developed for these enzymes(McKellar et al., 1996). Temperatures below pasteurisation of 63–65ºC (termedsub-pasteurisation or thermisation) are used to extend the storage life of bulkmilk. Models have also been developed for catalase (CA) (Hirviet al., 1996) and�-L-fucosidase (FC) (McKellar and Piyasena, 2000) which are appropriate forsub-pasteurisation temperatures. Parameter values for all enzyme models arefound in Table 6.2.
Validation experiments were done for AP, LP, TP and CA using data fromtrials not used to develop the original models (procedure in Fig. 6.5). Since therewas generally close agreement among the three trials for all these enzymes, agood relationship was obtained between predicted and experimental activities,with r2 values ranging from 0.735 to 0.993 (McKellaret al., 1994b, 1996; Hirviet al., 1996).
Survival models for several food-borne pathogens have also been derived.Listeria innocua, a non-pathogen, is often used as a substitute forL.monocytogenesin situations (such as food processing environments) where itwould be undesirable to introduce pathogens (Fairchild and Foegeding, 1993). Amodel developed forL. innocua (Table 6.2) was shown to underpredictinactivation ofL. monocytogenes, thus predictions are ‘fail-safe’ (Piyasenaetal., 1998). Enterococcus faecium, a non-pathogen, is also used as a modelorganism for pathogens, particularly in Europe (Gagnon, 1989). The inactivationcurve for this microorganism deviated strongly from linearity, and there werelarge inter-trial variations. Thus a random coefficient model using the biphasiclogistic function (equation 6.8) was used to fit the data (Rosset al., 1998). Theaverage lnD-values for the two populations were 0.825 and 2.856.
One of the more interesting target microorganisms examined in these studieswas Enterobacter sakazakii, an ‘emerging’ pathogen found to contaminateinfant formula. It was reported by Nazarowec-White and Farber (1997b) that 0–12% infant formula samples found on the Canadian retail market (from fivedifferent companies) containedE. sakazakii. Taxonomy and microbiology ofthis microorganism were described by Nazarowec-White and Farber (1997a) intheir review onE. sakazakii. Model parameter values (Table 6.2) were generatedfor this pathogen from three independent trials, and the resulting regression linesare shown in Fig. 6.6 (Nazarowec-Whiteet al., 1999).
The power values listed for the various enzymes and pathogens (Table 6.2)give an indication of the extent of non-linearity of the inactivation curves. Asdescribed above, fitting with the power law function is appropriate for concave(tailing) inactivation curves when the power value is less than 1.0. In all casesexcept one, power values were less than 1.0, suggesting that, even in acontinuous flow system, inactivation kinetics for many milk enzyme and food-borne pathogens deviate substantially from the linear. This supports the generalobservation made earlier that few, if any, survival curves are truly linear,
116 Dairy processing

suggesting that a first-order model for thermal inactivation is inadequate. Amore mechanistic appproach is clearly required to establish standard modellingprocedures for thermal inactivation of milk enzymes and pathogens in acontinuous flow system.
The parameter estimates from Table 6.2 were used to develop a stand-alonesoftware (PasTime) which was designed to provide users with a simple methodfor calculating log reductions of milk enzymes and pathogens achieved by time–temperature combinations specified by the user (McKellaret al., 1994a).Provision was also made to allow the user to enter calibration data (i.e. holdingtube times and pasteurisation efficiency). The program is available free from theauthor.
6.5 Modelling and risk assessment
Historically the production of safe food has been based on numerous codes ofpractice and regulations enforced by various governing bodies worldwide. Withthe increased concern regarding the existence of microbial hazards in foods, amore objective approach is warranted, which has led to the introduction of theHazard Analysis Critical Control Point (HACCP) system. HACCP as a tool forsafety management consists of two processes: building safety into the productand exerting strict process control (Notermans and Jouve, 1995). The principlesof HACCP have been set out by the Codex Alimentarius Commission(CODEX, 1993) and consist of seven steps: hazard analysis, determination ofCritical Control Points (CCP), specification of criteria, implementation ofmonitoring system, corrective action, verification, and documentation(Notermanset al., 1995). HACCP processes as defined for various food
Fig. 6.6 Linear models derived from three HTST trials withEnterobacter sakazakii.Data are from Nazarowec-Whiteet al. (1999) reprinted with permission fromFood
Research International. Copyright held by Elsevier Science Publishers.
Modelling the effectiveness of pasteurisation 117

products are often based on qualitative information and expert opinion.Moreover, the microbiological criteria underlying HACCP are poorlyunderstood or defined (Buchanan, 1995).
The concept of risk assessment as defined by the Food and AgricultureOrganisation and the World Health Organisation (FAO/WHO, 1995) provides amore quantitative approach to food-borne hazards. Quantitative risk assessment(QRA) is the scientific evaluation of known or potential adverse health effectsresulting from human exposure to food-borne hazards (Notermans and Jouve,1995). It consists of four steps: hazard identification, exposure assessment, doseresponse assessment, and risk characterisation (Fig. 6.7) (Notermans and Teunis,1996). QRA is also considered to be part of the larger concept of risk analysis,which includes, in addition, risk management and risk communication steps(Fig. 6.7) (Notermans and Teunis, 1996). Risk assessment specifically supportsstep 3 of HACCP (Fig. 6.7) (Notermanset al., 1995). The relationship betweenHACCP and risk assessment has not always been completely clear. For example,both processes start with the identification of hazards. Risk assessment isintended to provide a scientific basis for risk management, while HACCP is asystematic approach to the control of potential hazards in food operations(Foegeding, 1997). Thus, risk assessment concerns the overall product safety,while HACCP enhances overall product safety by assuring day-to-day processcontrol (Foegeding, 1997). The view of risk assessment being associated withone step of HACCP may be a limited one. In a contrasting view, both HACCPand risk assessment are encompassed in risk analysis, with HACCP representingone management strategy (Fig. 6.7) (Foegeding, 1997).
Fig. 6.7 Comparison of HACCP, risk analysis and risk assessment.
118 Dairy processing

The recent ratification of the World Trade Organisation (WTO) agreementwill have a major impact on the development of new approaches for theregulation of food. Countries will be encouraged to base their procedures onCodex standards and guidelines to maintain and enhance safety standards(Hathaway and Cook, 1997). This will lead to the development of harmonisedrisk assessment and risk management frameworks, providing input into HACCP,which is the primary vehicle for achieving enhanced food safety goals(Hathaway and Cook, 1997). As the use of HACCP increases, there will be aneed for a clear understanding of the relationship among HACCP,microbiological criteria, and risk assessment (Buchanan, 1995). Regulators willbe called upon to participate in all aspects of HACCP development, in particularto establish public health-based targets, elucidate microbiological criteria,develop improved techniques in microbiological risk assessment, and developthe means for evaluating the relative performance of HACCP systems(Buchanan, 1995). Harmonisation of international rules will clearly requirestandardised approaches (Lammerding, 1997).
In order to understand the role of predictive microbiology in risk assessment,it is necessary to further examine the various steps in more detail (Lammerding,1997). Hazard identification involves the identification and characterisation ofbiological hazards that may be present in foods. Exposure assessment refers tothe qualitative and/or quantitative evaluation of the likely intake of thebiological agent. Dose–response assessment refers specifically to thedetermination of the number of microorganisms ingested, and the frequencyand severity of adverse heath effects. Risk characterisation is the qualitative and/or quantitative estimation of the probability of occurrence and severity of knownor potential adverse health effects in a given population.
Mathematical modelling can have the greatest influence on the exposureassessment and dose–response assessment steps. Implicit in the concept ofexposure assessment is the influence of processing and environmental factors onthe survival and growth of food-borne pathogens. Mathematical models canpredict the extent of impact of unit operations on the numbers ofmicroorganisms, which in turn determines the exposure (Buchanan and Whiting,1996). Specific mathematical functions to quantitate microbial growth and deathcan be incorporated into risk assessments (Buchanan and Whiting, 1996;McNab, 1997; Walls and Scott, 1997; vanGerwen and Zwietering, 1998). Forexample, the Gompertz function is used to evaluate growth parameters:
logN�t� � A� C�e�ÿeÿB�tÿM��� 6:16
where N�t� is the number of cells at timet, A is the asymptotic count astdecreases to zero,C is the difference in value between the upper and lowerasymptotes,B is the relative growth rate atM, and M is the time where theabsolute growth rate is maximum (Buchanan and Whiting, 1996). Thermal deathmodels can be used to establish theD-value for a microorganism (equation 6.4).Much information on microbial growth and survival has been documented, andthe resulting predictive software packages such as Food MicroModel have been
Modelling the effectiveness of pasteurisation 119

used to predict the influence of food composition and environmental conditionson growth and survival of potentially hazardous microorganisms (Panisello andQuantick, 1998). Models can therefore be used to develop CCPs, and showwhere data for risk assessments are missing (Baker, 1995). In addition, modelscan support regulations and optimise product formulations and support processcontrol (Baker, 1995). Mathematical modelling can also support quantitation indose–response assessment. The beta Poisson distribution model for dose–response is (Buchanan and Whiting, 1996):
Pi � 1ÿ 1� N�
� ��6:17
where Pi is the probability of infection,N is the exposure, and� and � arecoefficients specific to the pathogen. One is cautioned in the use of mathe-matical models for quantitative risk assessment; important issues to rememberare the need for high quality data, extensive validation of models in foods, andavoiding extrapolation beyond the conditions used to generate the model(McNab, 1997).
In QRA, mathematical models are used to estimate the ultimate risk to theconsumer as a function of input values taken from various points along the‘farm-to-fork’ continuum. Due to heterogeneity of microorganisms, variabilityaround single point estimates of risk can be significant. Thus, point estimatesgive limited information, describing single instances such as ‘worst case’scenarios (Buchanan and Whiting, 1996; Lammerding and Fazil, 2000).Improvements in prediction can be made by incorporating uncertainty.Uncertainty is an important factor in risk analysis, since it limits our ability tomake reliable predictions of risk. Uncertainty may arise from inherent variabilityin the biological system, or from lack of information or understanding of themechanisms involved (McNab, 1997). Uncertainty can be minimised byobtaining more, high quality data; however, as this is not always feasible,alternatives must be sought. One approach is to describe variability usingprobability distributions to represent parameter values. These distributions canbe built from empirical data, knowledge of underlying biological phenomena, orexpert opinion (Lammerding and Fazil, 2000), and the process leads to an outputwhere risk is expressed as a probability distribution. Risk analysis software suchas @RISKTM, which uses Monte Carlo analysis to simulate output distributionsof risk based on variability of input data, can facilitate the risk assessmentprocess (Buchanan and Whiting, 1996; Lammerding and Fazil, 2000).
Nauta (2000) has emphasised the need to separate true biological variabilitydue to heterogeneity of populations from uncertainty, the lack of perfectknowledge of the parameter values. This is commonly neglected in riskassessment studies. Working with data on growth ofBacillus cereus inpasteurised milk, Nauta (2000) showed that prediction of outbreak size maydepend on the way that uncertainty and variability are separated.
The extended application of risk assessment procedures to the survival ofE.coli O157:H7 in ground beef hamburgers was studied by Cassinet al. (1998)
120 Dairy processing

who defined the term Process Risk Model to predict the probability of anadverse impact as a function of multiple process parameters. This approach isbased on the assumption that risk is determined by process variables, and thatbehaviour of the microorganism can be described mathematically. Simulationswere done with the Monte Carlo approach, and rank correlations were used tofind variables which were most strongly correlated with illness. This processallowed the identification of CCPs.
6.6 Risk assessment and pasteurisation
Mathematical modelling has been applied to dairy products and processes(Griffiths, 1994); however, there has been limited application of QRA. Riskassessments have been done for the growth ofB. cereusin pasteurised milk(Zwieteringet al., 1996; Notermanset al., 1997), survival ofL. monocytogenesin soft cheese (Bemrahet al., 1998), and survival ofL. monocytogenesduringmilk processing (Peeler and Bunning, 1994). This latter study also incorporatedestimates of survival with pasteurisation at several time–temperaturecombinations. Some of the limited number of risk assessments performed havebeen reviewed, and a number of weaknesses and omissions have been identified(Cassinet al., 1996; Schlundt, 2000). The process of QRA is still in its infancy,however, and standards have yet to be developed. There is a clear advantage tothe food industry and consumers to further develop the concepts of QRA andapply them to both common and novel food processes, and it is expected thatsignificant advances will be made in this field over the next decade.
Returning now to the pasteurisation models, we note that mean parametervalues (Table 6.2) provide single output values for each set of processingconditions, but do not take into account inter-trial variability. In order to makethese models more relevant to QRA, the risk analysis software @RISKTM, aMicrosoft Excel add-in, was used. @RISKTM expresses model parameters asdistributions, and when simulations are performed, outputs are calculated asdistributions. Thus, a range of probable output (e.g. survival) values for aspecified set of processing conditions is obtained, and the probability ofachieving a target log reduction can be estimated.
An Excel spreadsheet was prepared which contained the model andcalculations of PE and log10 reduction for each of the target enzymes orpathogens. Model parameters (Ea/R, intercept, slope and power) were enteredinto the spreadsheet as normal distributions with mean and standard deviationvalues taken from previously published information for each target (Table 6.2).For some targets, it was discovered that parameter estimates were correlated. Forexample, significant correlations were observed betweenEa/R and both slope(r2 � 0:647) and intercept (r2 � 0:240) for the fiveL. innocua trials. Duringsimulations, @RISKTM normally takes random sample values from each of theinput distributions. If parameter values are correlated, it is necessary to have@RISKTM adjust sampling patterns to include these correlations.
Modelling the effectiveness of pasteurisation 121

Monte Carlo is the traditional method for sampling distributions in whichsamples are taken randomly throughout the input distribution (Vose, 1996). Latinhypercube is a recent development in sampling technology which employsstratification of the input probability distributions, resulting in fewer iterationsthan the traditional Monte Carlo method. For these studies, Latin hypercubesimulations were done with a total of 1500 iterations for each replicatesimulation. As an example of this process, simulated log reductions weregenerated for AP, FC andL. monocytogenesusing a holding time of 65ºC for 15 s(corresponding to thermisation), and the probability density functions are shownin Fig. 6.8. These conditions resulted in a narrow band of probabilities for AP,with greater predicted range for both FC andL. monocytogenes. Thermisationdoes not completely inactivate AP, while FC (a potential indicator ofthermisation) experiences a greater than 2 log reduction in most iterations. Themean log reduction ofL. monocytogenesunder these conditions is greater than 3.
Improvements in predictive power from @RISKTM models can be realised bythe use of percentiles. Probability distributions generated by simulation aredivided into equal probability increments called percentiles. Percentilesrepresent the percentage of generated results which are less than or equal tothe associated log reduction. A failure is scored when the predicted inactivationis greater than the experimental value at that percentile (i.e., a ‘fail-dangerous’prediction). The lower percentiles are associated with lower, more conservativeestimates of log reduction at a particular set of processing conditions.
As an example, the results of simulations carried out with threeE. sakazakiitrials are shown in Table 6.3 (Nazarowec-Whiteet al., 1999). At the 5thpercentile, the model ‘failed dangerous’ with Trials A and B; however, the more
Fig. 6.8 Probability distributions for�-L-fucosidase,Listeria monocytogenes, andalkaline phosphatase generated from @RISKTM simulations with processing at 65ºC for
15 s.
122 Dairy processing

conservative estimated log reduction associated with the 1st percentile did notresult in any failures (Table 6.3). At the higher percentiles, a greater number offailures are observed, indicating that the corresponding predicted log reductionsare too ambitious, and unlikely to be achieved in practice. This approach allowsthe user to set the level of allowable risk, then select the processing conditionswhich will result in the desired degree of inactivation. The value of thisapproach was further examined by comparing thermal inactivation ofE.sakazakiiwith that of L. monocytogenes. Results of the comparison (Table 6.4)show that at all temperatures simulated,E. sakazakiiwas more heat-sensitivethanL. monocytogenes, with greater than 1-log difference at 68ºC (Table 6.4).Comparison of simulated log10 reductions associated with the 1st and 5thpercentiles revealed thatE. sakazakiiwas only slightly more heat-sensitive at68ºC thanL. monocytogenes, with differences of 0.5 and 0.25 log at the twopercentiles, respectively (Table 6.4). This apparent decreased difference in heatsensitivity between the two pathogens associated with the 1st and 5th percentilepredictions reflects the greater uncertainty in the slope parameter for theE.sakazakiimodel compared to that for theL. monocytogenesmodel (Nazarowec-White et al., 1999).
Models which can predict the probability of achieving a desired level ofsafety are an important addition to risk assessment models which are still largely
Table 6.3 Validation of E. sakazakiimodel using @RISKTM simulationsa
Number of failuresc
Percentileb Trial A Trial B Trial C(n� 12) (n� 24) (n� 22)
1d 2 3 1 2 3 1 2 3
1 0 0 0 0 0 0 0 0 02 0 0 0 0 1 1 0 0 05 1 1 1 3 3 3 0 0 010 2 2 2 8 8 8 4 4 315 3 3 3 12 12 13 12 12 1120 3 3 3 16 16 16 15 15 1525 4 4 4 19 19 18 17 17 1830 6 6 6 20 19 19 18 18 1835 7 7 7 20 20 20 18 18 1840 8 8 8 20 20 20 19 19 19
a Data are from Nazarowec-Whiteet al. (1999) reprinted with permission fromFood ResearchInternational. Copyright held by Elsevier Science Publishers.b Probability distributions generated by simulation are divided into equal probability incrementscalled percentiles. Percentiles represent the percentage of simulated results which are less than orequal to the associated log reduction.c A failure is scored when the predicted inactivation was greater than the experimental value at thatpercentile (i.e., a ‘fail-dangerous’ situation). The lower percentiles are associated with lower, moreconservative, estimates of log reduction at a particular set of processing conditions.d Replicate simulations.
Modelling the effectiveness of pasteurisation 123
qualitative, and based primarily on expert opinion. To facilitate this process, thepasteurisation models described above have been incorporated into the riskanalysis software, AnalyticaÕ, which is commonly used for building riskassessment models for the food industry. This software supports a modularapproach, thus pasteurisation models may be easily incorporated into larger riskassessment models designed to encompass the entire ‘farm-to-fork’ continuum.Models for microbial survival and growth have also been incorporated intoseveral large databases which are available to the food industry. FoodMicroModel, which is based on work done by the Institute of Food Researchin the UK and their collaborators (McClureet al., 1994), is a commerciallyavailable software package which is continually updated, but which requires anannual licensing fee. The Pathogen Modelling Program (PMP) was designed bythe United States Department of Agriculture to provide assistance to the foodindustry, and is available free of charge (Buchanan, 1993). Pasteurisationmodels discussed here will be incorporated into the PMP.
6.7 Future trends
The models described in this chapter have thus far been confined to enzymesand pathogens in whole milk. Other dairy products are also of concern, thusmodels will continue to be expanded to include more viscous dairy productssuch as ice-cream mix. For example, preliminary studies have been undertakento assess the extent to which the thickening agent guar gum can influence HTSTprocessing (Piyasena and McKellar, 1999). Other liquid food and beverage
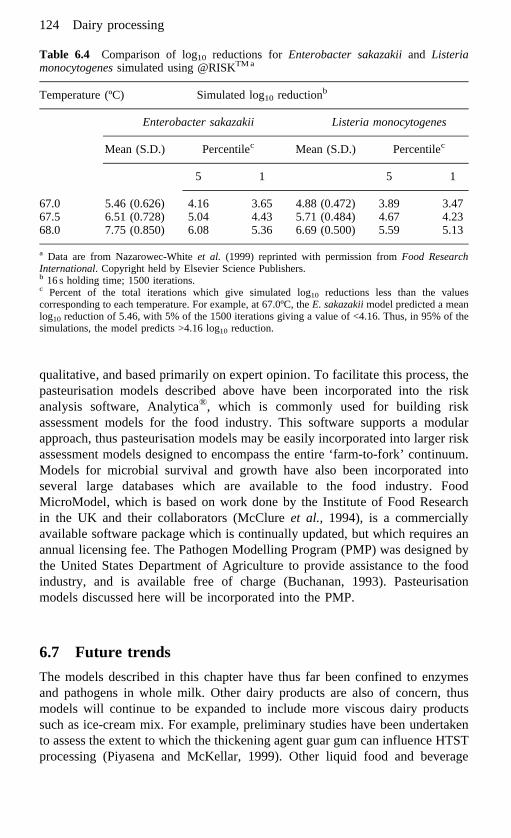
Table 6.4 Comparison of log10 reductions forEnterobacter sakazakiiand Listeriamonocytogenessimulated using @RISKTM a
Temperature (ºC) Simulated log10 reductionb
Enterobacter sakazakii Listeria monocytogenes
Mean (S.D.) Percentilec Mean (S.D.) Percentilec
5 1 5 1
67.0 5.46 (0.626) 4.16 3.65 4.88 (0.472) 3.89 3.4767.5 6.51 (0.728) 5.04 4.43 5.71 (0.484) 4.67 4.2368.0 7.75 (0.850) 6.08 5.36 6.69 (0.500) 5.59 5.13
a Data are from Nazarowec-Whiteet al. (1999) reprinted with permission fromFood ResearchInternational. Copyright held by Elsevier Science Publishers.b 16 s holding time; 1500 iterations.c Percent of the total iterations which give simulated log10 reductions less than the valuescorresponding to each temperature. For example, at 67.0ºC, theE. sakazakiimodel predicted a meanlog10 reduction of 5.46, with 5% of the 1500 iterations giving a value of <4.16. Thus, in 95% of thesimulations, the model predicts >4.16 log10 reduction.
124 Dairy processing

products may also be potential sources of risks. Apple cider is often soldunpasteurised to consumers who consider this product to be more natural;however,E. coli O157:H7 is often a potential risk in this product. Limitedthermal treatment of this product, combined with other intervention strategies,may present a solution. To this end, preliminary HTST models have beendeveloped for a model microorganism,Pediococcussp., in simulated apple cider(Piyasenaet al., 2003).
Other thermal and non-thermal processing technologies are gaining inpopularity. Current regulations which require specified time–temperaturetreatments are based on thermal processes, thus it is difficult to establishequivalent process conditions. Some of these technologies, such as radiofrequency (RF) and ohmic heating, are thermal processes, and thus may bemodelled by some modification of the present HTST models. In contrast, themechanisms by which non-thermal processes such as pulse electric field (PEF)and ultraviolet light inactivate microorganisms are as yet poorly understood. Ithas become apparent that further work is needed to establish adequate modellingapproaches for these technologies (Institute of Food Technologists, 2000).
It is now well known that thermal resistance of bacteria can be influenced bythe conditions or stage of growth. Production of heat-shock proteins by bacteriarenders them increasingly resistant to thermal treatment. Cross-protection withother stresses such as low pH and starvation has also been observed.Development of adequate models to describe these phenomena will require agreater knowledge of the physiological changes taking place in bacterial cells,thus there will be a move away from empirical modelling to more mechanisticmodels which are based on expression of key genes or synthesis of heat-shockproteins essential for survival. This molecular modelling approach is one whichis being actively explored worldwide. Our research group is closely involvedwith a large molecular modelling project with the University of Guelph.
It is well known that bacterial survival curves are rarely first-order, yet noconcerted approach to this problem has been suggested. The use of distributions,which imply heterogeneity of cells, seems like a worthwhile and most promisingapproach. Recent interested in the heterogeneity of bacterial cells (Booth, 2002)and an improved understanding of the factors which determine intra-cellvariations in heat resistance will further strengthen our ability to provideadequate models to the food industry.
6.8 Sources of further information and advice
Important references include McMeekinet al.(1993), a reference book describingsome of the principles of predictive food microbiology; Vose (1996), a bookdescribing the fundamentals of risk analysis and Monte Carlo simulation; andmore recently a book on food process modelling with specific chapters onmodelling uncertainty (Van Impeet al., 2001), food safety (Baranyi and Pin,2001) and thermal processing (Nicolaı¨ et al., 2001 and Bakaliset al., 2001).
Modelling the effectiveness of pasteurisation 125
The PMP is available from the USDA at: http://www.arserrc.gov/mfs/pathogen.htm
Food MicroModel is available from Leatherhead Food RA at: http://www.lfra.co.uk/
Other useful sites:
IDF: http://www.fil-idf.org/National Milk Producers’ Federation (US): http://www.nmpf.org/National Dairy Council (US): http://www.nationaldairycouncil.org/National Dairy Council of Canada: http://www.ndcc.caAgriculture and Agri-Food Canada: http://www.agr.gc.ca/index_e.phtmlCanadian Dairy regulations: http://www.dairyinfo.agr.ca/cdicdrcan.htmUnited States Dairy regulations: http://www.dairyinfo.agr.ca/cdicdrusa.htmInternational Dairy regulations: http://www.dairyinfo.agr.ca/cdicdrint.htm
6.9 ReferencesANDREWS A T, ANDERSON MandGOODENOUGH P W(1987), ‘A study of the heat stabilities
of a number of indigenous milk enzymes’,J Dairy Res, 54, 237–246.BAKALIS S, COX P W and FRYER P J (2001), ‘Modelling thermal processes: heating’, in
Tijsken L M M, Hertog M L A T M and Nicolaı¨ B M, Food Process Modelling,Woodhead Publishing, Cambridge, 340–364.
BAKER D A (1995), ‘Application of modelling in HACCP plan development’,Int J FoodMicrobiol, 25, 251–261.
BARANYI J and PIN C (2001), ‘Modelling microbiological safety’, in Tijsken L M M,Hertog M L A T M and Nicolaı¨ B M, Food Process Modelling, WoodheadPublishing, Cambridge, 383–401.
BEMRAH N, SANAA M, CASSIN M H, GRIFFITHS M W and CERF O (1998), ‘Quantitative riskassessment of human listeriosis from consumption of soft cheese made from rawmilk’, Prev Vet Med, 37, 129–145.
BIGELOW W D (1921), ‘Logarithmic nature of thermal death time curves’,J Inf Dis, 29, 538.BOOTH I R (2002), ‘Stress and the single cell: Intrapopulation diversity is a mechanism to
ensure survival upon exposure to stress’,Int J Food Microbiol, 78, 19–30.BUCHANAN R L (1993), ‘Developing and distributing user-friendly application software’,J
Ind Microbiol, 12, 251–255.BUCHANAN R L (1995), ‘The role of microbiological criteria and risk assessment in
HACCP’, Food Microbiol, 12, 421–424.BUCHANAN R L andWHITING R C (1996), ‘Risk assessment and predictive microbiology’,J
Food Protect, Suppl, 59, 31–36.CAMPANELLA O H and PELEG M (2001), ‘Theoretical comparison of a new and the
traditional method to calculateClostridium botulinumsurvival during thermalinactivation’, J Sci Food Agric, 81, 1069–1076.
CASSIN M H, PAOLI G M, MCCOLL R SandLAMMERDING A M (1996), ‘Hazard assessment ofListeria monocytogenesin the processing of bovine milk – Comment’,J FoodProtect, 59, 341–342.
CASSIN M H, PAOLI G M andLAMMERDING A M (1998), ‘Simulation modeling for microbialrisk assessment’,J Food Protect, 61, 1560–1566.
126 Dairy processing

CERF O(1977), ‘Tailing of survival curves of bacterial spores’,J Appl Bacteriol, 42, 1–19.CODEX (1993), ‘Guidelines for the application of the Hazard Analysis Critical Control
Point system. Codex Alimentarius (CCFH) Alinorm 93/13A-Appendix II’.D’AOUST J Y, EMMONS D B, MCKELLAR R, TIMBERS G E, TODD E C D, SEWELL A Mand
WARBURTON D W (1987), ‘Thermal inactivation ofSalmonellaspecies in fluidmilk’, J Food Protect, 50, 494–501.
FAIRCHILD T M and FOEGEDING P M (1993), ‘A proposed nonpathogenic biologicalindicator for thermal inactivation ofListeria monocytogenes’, Appl EnvironMicrobiol, 59, 1247–1250.
FAIRCHILD T M, SWARTZEL K R andFOEGEDING P M(1994), ‘Inactivation kinetics ofListeriainnocua in skim milk in a continuous flow processing system’,J Food Sci, 59,960–963.
FAO/WHO (1995), ‘Application of risk analysis to food standards issues’, inReport of theJoint FAO/WHO Expert Consultation, World Health Organisation, Geneva,Switzerland, 13–17.
FOEGEDING P M (1997), ‘Driving predictive modelling on a risk assessment path forenhanced food safety’,Int J Food Microbiol, 36, 87–95.
GAGNON B (1989), ‘Canadian code of recommended manufacturing practices forpasteurized/modified atmosphere packed/refrigerated foods’, inGuidelines forthe `Code of Practice on Processed Refrigerated Foods’, Agri-Food SafetyDivision, Agriculture Canada.
GIBALDI M andPERRIER D(1975),Pharmacokinetics, Marcel Dekker, New York.GRIFFITHS M W (1986), ‘Use of milk enzymes as indices of heat treatment’,J Food
Protect, 49, 696–705.GRIFFITHS M W (1994), ‘Predictive modelling: applications in the dairy industry’,Int J
Food Microbiol, 23, 305–315.HATHAWAY S C andCOOK R L (1997), ‘A regulatory perspective on the potential uses of
microbial risk assessment in international trade’,Int J Food Microbiol, 36, 127–133.
HIRVI Y, GRIFFITHS M W, MCKELLAR R C and MODLER H W (1996), ‘Linear-transform andnon-linear modelling of bovine catalase inactivation in a high-temperature short-time pasteurizer’,Food Res Int, 29, 89–93.
INSTITUTE OF FOOD TECHNOLOGISTS(2000), ‘Kinetics of microbial inactivation foralternative food processing technologies. A report of the Institute of FoodTechnologists for the Food and Drug Administration’,J Food Sci, 65, S4–S108.
INTERNATIONAL ASSOCIATION OF MILK, FOOD, AND ENVIRONMENTAL SANITARIANS, UNITED
STATES PUBLIC HEALTH SERVICE AND THE DAIRY INDUSTRY COMMITTEE(1992), ‘3-Aaccepted practices for the sanitary construction, installation, testing and operationof high-temperature short-time and higher-heat shorter-time pasteurizer systems.Standard No. 603-06, revised’,Dairy Food Environ Sanit, 12, 423–477.
INTERNATIONAL DAIRY FEDERATION (1991),Alkaline Phosphatase Test as a Measure ofCorrect Pasteurization, International Dairy Federation, Brussels.
KESSLER H G(1986), ‘Considerations in relation to some technological and engineeringaspects’, inMonograph on Pasteurized Milk, IDF Bulletin 200, International DairyFederation, Brussels, 80–86.
LAMMERDING A M (1997), ‘An overview of microbial food safety risk assessment’,J FoodProtect, 60, 1420–1425.
LAMMERDING A M andFAZIL A (2000), ‘Hazard identification and exposure assessment formicrobial food safety risk assessment’,Int J Food Microbiol, 58, 147–157.
Modelling the effectiveness of pasteurisation 127

LEISTNER L andGORRIS L G M (1995), ‘Food preservation by hurdle technology’,TrendsFood Sci Technol, 6, 41–46.
LINTON R H, CARTER W H, PIERSON M Dand HACKNEY C R (1995), ‘Use of a modifiedGompertz equation to model nonlinear survival curves forListeria monocytogenesScott A’, J Food Protect, 58, 946–954.
MACKEY B M andBRATCHELL N (1989), ‘The heat resistance ofListeria monocytogenes’,Lett Appl Microbiol, 9, 89–94.
MCCLURE P J, BLACKBURN C D, COLE M B, CURTIS P S, JONES J E, LEGAN J D, OGDEN I D, PECK
M W, ROBERTS T A, SUTHERLAND J P, WALKER S Jand BLACKBURN C D W (1994),‘Modelling the growth, survival and death of microorganisms in foods: the UKfood micromodel approach’,Int J Food Microbiol, 23, 265–275.
MCKELLAR R C andPIYASENA P (2000), ‘Predictive modelling of the inactivation of bovinemilk �-L-fucosidase in a high-temperature short-time pasteurizer’,Int Dairy J, 10,1–6.
MCKELLAR R C, MODLER H W, COUTURE H, HUGHES A, MAYERS P, GLEESON Tand ROSS W H
(1994a), ‘Pasteurisers – killing time’,Dairy Ind Intl, 59, 49.MCKELLAR R C, MODLER H W, COUTURE H, HUGHES A, MAYERS P, GLEESON Tand ROSS W H
(1994b), ‘Predictive modeling of alkaline phosphatase inactivation in a high-temperature short-time pasteurizer’,J Food Protect, 57, 424–430.
MCKELLAR R C, LIOU S andMODLER H W (1996), ‘Predictive modelling of lactoperoxidaseand gamma-glutamyl transpeptidase inactivation in a high-temperature short-timepasteurizer’,Int Dairy J, 6, 295–301.
MCMEEKIN T A, OLLEY J N, ROSS TandRATKOWSKY D A (1993),Predictive Microbiology:Theory and Application, John Wiley & Sons, New York.
MCNAB W B (1997), ‘A literature review linking microbial risk assessment, predictivemicrobiology, and dose–response modeling’,Dairy Food Env Sanit, 17, 405–416.
MOATS W A, DABBAH R and EDWARDS V M (1971), ‘Interpretation of nonlogarithmicsurvivor curves of heated bacteria’,J Food Sci, 36, 523–526.
NAUTA M J (2000), ‘Separation of uncertainty and variability in quantitative microbial riskassessment models’,Int J Food Microbiol, 57, 9–18.
NAZAROWEC-WHITE M andFARBER J M (1997a), ‘Enterobacter sakazakii: a review’, Int JFood Microbiol, 34, 103–113.
NAZAROWEC-WHITE M and FARBER J M (1997b), ‘Thermal resistance ofEnterobactersakazakiiin reconstituted dried-infant formula’,Lett Appl Microbiol, 24, 9–13.
NAZAROWEC-WHITE M, MCKELLAR R C and PIYASENA P (1999), ‘Predictive modelling ofEnterobacter sakazakiiinactivation in bovine milk during high-temperature short-time pasteurization’,Food Res Int, 32, 375–379.
NICOLAI B M, VERBOVEN P and SCHEERLINCK N (2001), ‘The modelling of heat and masstransfer’, in Tijsken L M M, Hertog M L A T M and Nicolaı¨ B M, Food ProcessModelling, Woodhead Publishing, Cambridge, 60–86.
NOTERMANS S and JOUVE J L (1995), ‘Quantitative risk analysis and HACCP: someremarks’,Food Microbiol, 12, 425–429.
NOTERMANS S and TEUNIS P (1996), ‘Quantitative risk analysis and the production ofmicrobiologically safe food: an introduction’,Int J Food Microbiol, 30, 3–7.
NOTERMANS S, GALLHOFF G, ZWIETERING M HandMEAD G C (1995), ‘The HACCP concept:specification of criteria using quantitative risk assessment’,Food Microbiol, 12,81–90.
NOTERMANS S, DUFRENNE J, TEUNIS P, BEUMER R, GIFFEL M TandWEEM P P(1997), ‘A riskassessment study ofBacillus cereuspresent in pasteurized milk’,Food Microbiol,
128 Dairy processing

14, 143–151.NUNES R V, SWARTZEL K RandOLLIS D F (1993), ‘Thermal evaluation of food processes: the
role of a reference temperature’,J Food Eng, 20, 1–15.PANISELLO P J and QUANTICK P C (1998), ‘Application of Food MicroModel predictive
software in the development of hazard analysis critical control point (HACCP)systems’,Food Microbiol, 15, 425–439.
PEELER J TandBUNNING V K (1994), ‘Hazard assessment ofListeria monocytogenesin theprocessing of bovine milk’,J Food Protect, 57, 689–697.
PIYASENA P andMCKELLAR R C (1999), ‘Influence of guar gum on the thermal stability ofListeria innocua, Listeria monocytogenes, and -glutamyl transpeptidase duringhigh-temperature short-time pasteurization’,J Food Protect, 62, 861–866.
PIYASENA P, LIOU S and MCKELLAR R C (1998), ‘Predictive modelling of inactivation ofListeria spp. in bovine milk during HTST pasteurization’,Int J Food Microbiol,39, 167–173.
PIYASENA P, MCKELLAR R C and BARTLETT F M (2003), ‘Thermal inactivation ofPediococcussp. in simulated apple cider during high-temperature short-timepasteurization’,Int J Food Microbiol, 82, 25–31.
PRUITT K M andKAMAU D N (1993), ‘Mathematical models of bacterial growth, inhibitionand death under combined stress conditions’,J Ind Microbiol, 12, 221–231.
ROSS W H, COUTURE H, HUGHES A, GLEESON Tand MCKELLAR R C (1998), ‘A non-linearmixed effects model for the destruction ofEnterococcus faeciumin a high-temperature short-time pasteurizer’,Food Microbiol, 15, 567–575.
SCHLUNDT J (2000), ‘Comparison of microbiological risk assessment studies published’,Int J Food Microbiol, 58, 197–202.
STAAL P F J (1986), ‘Legislation/statutory regulations applicable to pasteurized fluid milkin a selected number of countries’, inMonograph on Pasteurized Milk, IDFBulletin 200, International Dairy Federation, Brussels, 71–79.
STRINGER S C, GEORGE S MandPECK M W (2000), ‘Thermal inactivation ofEscherichia coliO157:H7’,J Appl Microbiol, 88, 79S–89S.
VANBOEKEL M A J S (2002), ‘On the use of the Weibull model to describe thermalinactivation of microbial vegetative cells’,Int J Food Microbiol, 74, 139–159.
VANGERWEN S J CandZWIETERING M H (1998), ‘Growth and inactivation models to be usedin quantitative risk assessments’,J Food Protect, 61, 1541–1549.
VAN IMPE J F, BERNAERTS K, GEERAERD A H, POSCHET FandVERSYCK K J (2001), ‘Modellingand prediction in an uncertain environment’, in Tijsken L M M, Hertog M L A T Mand Nicolaı¨ B M, Food Process Modelling, Woodhead Publishing, Cambridge,156–179.
VOSE D (1996), Quantitative Risk Analysis: a Guide to Monte Carlo SimulationModelling, John Wiley & Sons, New York.
WALLS I andSCOTT V N (1997), ‘Use of predictive microbiology in microbial food safetyrisk assessment’,Int J Food Microbiol, 36, 97–102.
WHITING R C (1993), ‘Modeling bacterial survival in unfavorable environments’,J IndMicrobiol, 12, 240–246.
ZEHETNER G, BAREUTHER C, HENLE T and KLOSTERMEYER H (1996), ‘Inactivation ofendogenous enzymes during heat treatment of milk’,Neth Milk Dairy J, 50, 215–226.
ZWIETERING M H, DEWIT J C and NOTERMANS S (1996), ‘Application of predictivemicrobiology to estimate the number ofBacillus cereusin pasteurised milk at thepoint of consumption’,Int J Food Microbiol, 30, 55–70.
Modelling the effectiveness of pasteurisation 129