dairy research booklet - microsoft · 2018-05-17 · milk, a diet containing three portions of...
TRANSCRIPT

1
Dairy Research BookletDiscover, Innovate, Grow

2
ContentsDairy in the diet – effect on nutritional adequacy, environmental impact and cost per nutrient 4Break Free from BVD 5Profit from mastitis control 6Control and prevention of mastitis in dairy herds 7Implementation of vaccination strategies on British dairy farms: Understanding challenges and perspectives 8 Successful management of lameness 9 Effective treatment of claw horn lesions 10Achieving the correct body condition reduces claw horn lesions 11Untreated claw horn lesions leads to abnormal bone growth in the hoof 12Foot trimming claw length: One size doesn’t fit all 13Foot trimming link to spread of Digital Dermatitis 14Managing for optimal lying comfort 15A participatory approach to reducing farm antimicrobial usage 16On-farm strategies to reduce the transmission of Johne’s Disease in British dairy herds 17Colostrum management 18The cost of rearing dairy heifers 19Are calves with friends more content? 20Outwintering replacement dairy heifers 21Outwintering replacement dairy heifers for high input systems 22Mineral requirements of dairy cows 23 Copper status and milk production: Effect of copper antagonists and forage source 24Copper status and milk production: Effect of copper source and antagonist level 25Cobalt and vitamin B12: is supplementation in the transition period necessary? 26Protein nutrition of the contemporary dairy cow 27Control of starlings 28Lucerne as a replacement for grass silage in the diet of the dairy cow 29Effect of Lucerne inclusion level and chop length on performance of dairy cows 30The effect of sample handling and storage on the nutritional value of fresh grass 31Development of reliable NIRS equations for the prediction of grass-clover silages 32Milk production from dairy cows with varying access times to mixed ration and pasture 33Assessing the impact of soil compaction 34Growing grass with nutrients from separated slurry 35Using nitrate soil sensors to increase sustainability 36Making the most of grass and clover 37From root to rumen: Nutrient efficient grass and clover varieties 38Profitable Lifetime Index – £PLI 39£PLI – Frequently asked questions 40Spring Calving Index – £SCI 41£SCI – Frequently asked questions 42Genetic evaluations for TB Advantage 43 Development of TB Advantage 44 Mastitis Index 45Herd Genetic Reports 46 Inbreeding checker 48Phosphorus feeding in dairy cows 50Optimum grazing systems for youngstock 51Whole farm feed efficiency 52Mycoplasma bovis (M.bovis) 53Other current research projects 54Studentship – PhD & MRes' 55Research through Partnership 56Notes 58
3
AHDB Dairy Research and Development: Your levy, your future
Dear Levy Payer, Research and development is crucial to the dairy industry, to help us advance and become more competitive on a global level and to make dairy farming more efficient and increasingly sustainable.Research is conducted by a number of different organisations, including commercial companies, as part of product development and academic institutions, funded, for example, by research councils such as BBSRC (Biotechnology and Biological Sciences Research Council). AHDB Dairy strives to fund unique, practical and applied research which can be applied on your farm. We actively seek to work collaboratively with other funders and sectors of the industry, including our partner divisions in AHDB, to ensure complementary effort and maximum return on your levy. We also have a close collaboration with dairy levy bodies in Europe (within
a European Cattle Innovation Partnership), so that we can avoid duplication and combine knowledge. We cannot cover everything so we have to prioritise. Our strategy is shaped by a Research and Development Advisory Forum, made up predominantely of practicing dairy farmers and independent industry experts. The AHDB Dairy Board continues to value research and development that provides the scientific evidence needed to underpin progress and raise the profile of GB dairy farming. Since June 2011, we have had two five-year Research Partnerships in place – one on Health, Welfare and Nutrition and the second on Soils, Forage and Grassland. In 2016 the Health, Welfare and Nutrition research partnership was extended for a further five years to further build on the research completed and contribute to the success of GB dairy farming. AHDB Dairy supports more than 20 PhD students in dairy-related topics, actively seeking to fund the next generation of scientists,
advisors and technical experts to support the future of the dairy industry.Researchers present their latest findings at farmer-facing events throughout the year, and we had our first AHDB Dairy Research Seminar – Discover, Innovate and Grow in March 2016, attended by over 200 delegates on both days. Please contact your local extension officer to find out about upcoming events, or to discuss other ways in which AHDB Dairy can support you in your business. Within this booklet you will find more information on a selection of the research and AHDB Dairy resources available to you.
Ray Keatinge Head of Animal Science
Ray KeatingeHead of Animal Science

4
0
20
40
60
g C
O2
eqv/
unit
80
Protein
Calcium
Phosp
horus
Sodium
Iodine
0.00
0.05
0.10
0.15
£/un
it
0.20
Protein
Calcium
Phosp
horus
Sodium
Iodine
Low dairy High dairy
Average UK male diet Dairy Free diet
Figure 1. Carbon and financial cost per unit
Background ● Dairy products are a valuable source of dietary protein,
calcium, phosphorous, iodine and vitamin B12
● Diets that are rich in dairy products are often perceived to have a greater environmental impact by increasing greenhouse gas (GHG) emissions
● No published information is currently available to analyse the relationships and trade-offs between the nutritional, environmental and value for money aspects of dairy in the GB diet
Experimental approachInformation on UK dietary patterns for 1,655 males and females (aged 19–64 years old) was obtained from the National Diet and Nutrition Survey (NDNS, 2014).From this data, 58 food groups were identified for inclusion in the analysis.For GHG emissions, published Life Cycle Analysis data (primary production to retail) were used.Financial cost of 3,423 foods (premium and own brand products) were obtained from two multiple retailers, Asda and Waitrose.A predictive model was created to quantify the impact of varying the amount and type of dairy consumed on nutrient composition, financial cost and GHG emissions.
Results – dietary pattern and GHG emissionsGHG emissions, as a percentage of emissions from the average daily male diet (5,261g CO2 eq.), were:
ObjectiveThe overall objective of this desk study was to determine the role of dairy products in sustainable diets, by modelling
● Nutritional adequacy ● Financial cost ● Environmental impact
of diets containing varying amounts of dairy product (milk, cheese, yogurt and ice cream).
Dietary patternsFor men and women, the average diet contained 160 and 136g milk, 17 and 15g cheese and 25 and 31g yogurt, respectively.Comparing high (267–1429g dairy/day) and low (0–99g dairy/day) quartiles for total daily dairy consumption, high dairy pattern cosumers:
● Had significantly higher total energy, fat, saturated fat and sugar intakes
● Were significantly younger, smoked less, consumed less alcohol and ate more fruit
● Had significantly lower Female Body Mass Index ● Met most (but not all) nutrient recommendations
Scenarios were modelled for the average male diet, dairy free, high and low dairy pattern, replacement of milk by soya milk, a diet containing three portions of dairy and a ‘healthy’ diet containing dairy.
Key messagesBased on actual (rather than idealised) dietary patterns, the analysis shows that excluding dairy foods, particularly milk, from the diet has important negative nutritional consequences.Dairy products, milk in particular, can be part of a dietary pattern that does not increase GHG emissions beyond that of the current UK average male and female diets.Dietary patterns that include dairy products provide lower financial cost per nutrient compared with those that are free or low in dairy.
%Dairy free 93High dairy consumption pattern 108Low dairy consumption pattern 93Replacement of milk with soya milk 96Diet containing 3 portions of dairy 112A ‘healthy’ diet containing dairy 90
Dairy in the diet – effect on nutritional adequacy, environmental impact and cost per nutrientFunded by AHDB Dairy in collaboration with The Dairy Council
5
Seek Veterinary Advice
Step 3a: Action plan put in place to control risk of introducing BVD
onto the farm
Step 4: Monitor progress Repeat step 2 to retain BVDFree herd status: • Youngstock blood test every 7-12 months for BVD antibody
OR• Continue to tag and test all calves
ANDTest all bought in animals
Step 1: Assess Herd• Biosecurity / Vaccination • Disease history / Disease risk
Step 2: Define herd StatusYoungstock blood test (For Antibody)• 5-10 unvaccinated animals per management group• At 9-18 months of age OR Tag and test (For Virus)• All calves born (for 2 years minimum)
Step 3b: Action plan for BVDScreen for PIs on farm• Test all animals for PI in the groups which have shown active BVD infection• Cull PIs• Test all calves for 1 year after PIs removed – cull PIs(Tests to be used are antigen ELISA and pooled samples for PCR)
Satisfactory
NotSatisfactory
Active BVD
No PIanimals
ARE YOU TESTING?
Identify PIs using: BLOOD MILK TISSUE
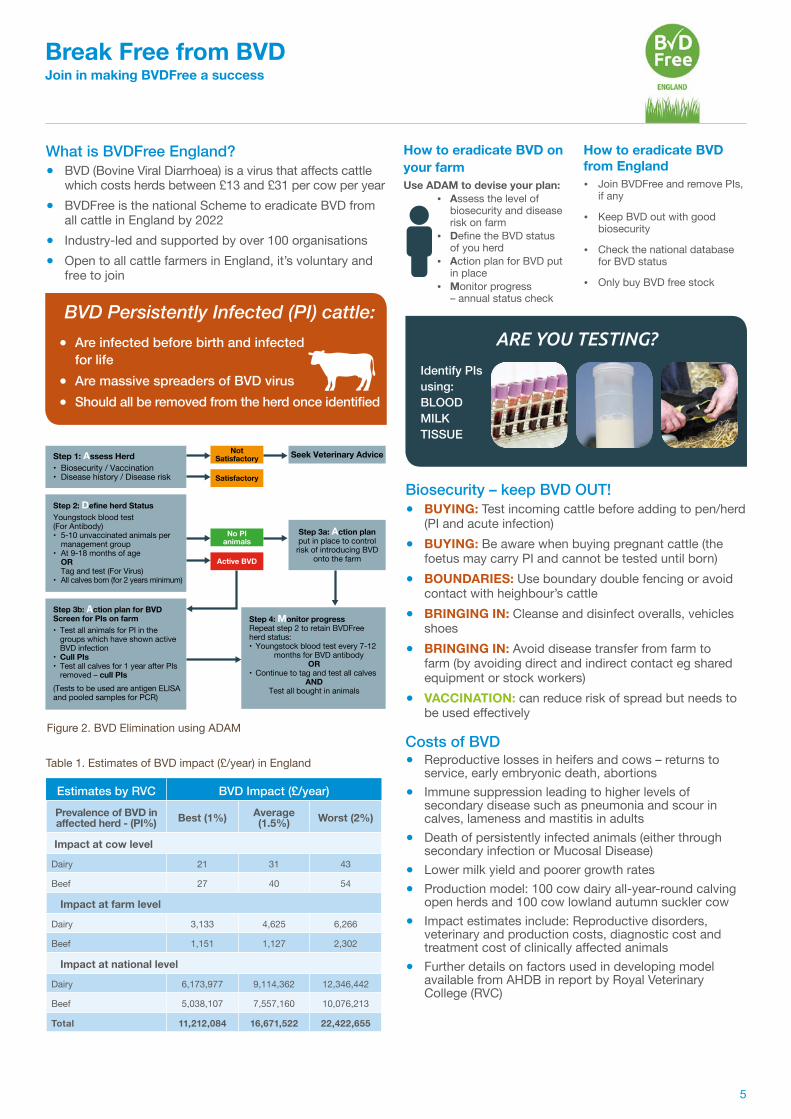
Figure 2. BVD Elimination using ADAM
Estimates by RVC BVD Impact (£/year)Prevalence of BVD in affected herd - (PI%) Best (1%) Average
(1.5%) Worst (2%)
Impact at cow level
Dairy 21 31 43
Beef 27 40 54
Impact at farm level
Dairy 3,133 4,625 6,266
Beef 1,151 1,127 2,302
Impact at national level
Dairy 6,173,977 9,114,362 12,346,442
Beef 5,038,107 7,557,160 10,076,213
Total 11,212,084 16,671,522 22,422,655
Break Free from BVDJoin in making BVDFree a success
Biosecurity – keep BVD OUT! ● BUYING: Test incoming cattle before adding to pen/herd
(PI and acute infection) ● BUYING: Be aware when buying pregnant cattle (the
foetus may carry PI and cannot be tested until born) ● BOUNDARIES: Use boundary double fencing or avoid
contact with heighbour’s cattle ● BRINGING IN: Cleanse and disinfect overalls, vehicles
shoes ● BRINGING IN: Avoid disease transfer from farm to
farm (by avoiding direct and indirect contact eg shared equipment or stock workers)
● VACCINATION: can reduce risk of spread but needs to be used effectively
Costs of BVD ● Reproductive losses in heifers and cows – returns to
service, early embryonic death, abortions ● Immune suppression leading to higher levels of
secondary disease such as pneumonia and scour in calves, lameness and mastitis in adults
● Death of persistently infected animals (either through secondary infection or Mucosal Disease)
● Lower milk yield and poorer growth rates ● Production model: 100 cow dairy all-year-round calving
open herds and 100 cow lowland autumn suckler cow ● Impact estimates include: Reproductive disorders,
veterinary and production costs, diagnostic cost and treatment cost of clinically affected animals
● Further details on factors used in developing model available from AHDB in report by Royal Veterinary College (RVC)
How to eradicate BVD on your farm Use ADAM to devise your plan: • Assess the level of
biosecurity and disease risk on farm
• Define the BVD status of you herd
• Action plan for BVD put in place
• Monitor progress – annual status check
How to eradicate BVD from England• Join BVDFree and remove PIs,
if any
• Keep BVD out with good biosecurity
• Check the national database for BVD status
• Only buy BVD free stock
Table 1. Estimates of BVD impact (£/year) in England
What is BVDFree England? ● BVD (Bovine Viral Diarrhoea) is a virus that affects cattle
which costs herds between £13 and £31 per cow per year ● BVDFree is the national Scheme to eradicate BVD from
all cattle in England by 2022 ● Industry-led and supported by over 100 organisations ● Open to all cattle farmers in England, it’s voluntary and
free to join
BVD Persistently Infected (PI) cattle: ● Are infected before birth and infected
for life ● Are massive spreaders of BVD virus ● Should all be removed from the herd once identified

6
Monitor
Engage withPlan Deliverer
Review ImplementAction
Profit from mastitis control
“Helped us nail mastitis – I’m certain that, without this, we would not have survived financially”Gary Dalton, Bushton Farm
“Over a three month period, prior to using the Plan, we used 360 tubes and 7,800ml of injectable. Now, we use 30 tubes and 600ml of injectable”Henry Freeman, Upper Farm
250+ trained
Plan Deliverers
Up to 20% reduction in clinical mastitis
MASTITIS CONTROL PLAN
Background ● In 2004, an AHDB Dairy-funded study trialed a mastitis
control plan in herds with more than 35 cases of clinical mastitias per 100 cows per year1
● Reduction of 20% in cases of clinical mastitis and somatic cell count after one year and closer to 30% for herds that fully complied with the plan1
● The AHDB Dairy Mastitis Control Plan was launched nationally in 2009
● By 2013, it was estimated that more than 2,000 herds had enrolled in the plan
The AHDB Dairy mastitis control plan ● A proven and cost-effective solution ● Specific to your farm ● A structured approach to tackling mastitis ● Focused on prevention ● A source of practical solutions to your problems
Who deliverers the plan? ● Trained vets and
consultants, known as Plan Deliverers across the country
How does the plan work?Find a Plan Deliverer: dairy.ahdb.org.uk/mastitis1. Plan Deliverer examines farm data: Look for patterns in the data (milk recording, clinical and cell count data). Identify the origin of the infection, eg dry vs. lactation period and how the infection is being spread, eg environmental or contagious2. Farm visit: Conduct on-farm survey. Observe all areas on farm including management practices such as milking routine3. Action plan: Produce a list of achievable action points individual to the farm. Discuss with Plan Deliverer priority action points and how best to implement them on farm4. Review plan: Agree a date for review of action plan, usually three months after the initial visit
What is the cost of mastitis? ● AHDB Dairy Mastitis Control Plan cost calculator will
help to conduct a full assessment of the current costs of mastitis
● Mastitis costs include milk discard, reduced milk yields, drugs, increased culling, labour and vet costs
● The cost of clinical mastitis lies somewhere in the range of 1–6p/litre of total milk produced on farm
Key features and benefits ● Detailed evaluation of herd mastitis patterns ● Identify main source of new infection ● Full assessment of current costs of mastitis ● Thorough farm visit to assess current policies ● Identify areas for improvement ● Estimate of likely return on investment ● Discuss plan and agree on action points together ● Frequently monitor mastitis management ● Continual review of mastitis control measures
What users have said about the plan
Profit from mastitis control today ● Contact a Plan Deliverer, your vet or a Knowledge
Exchange Officer ● The cost of the Plan
is set by your Plan Deliverer
● AHDB Dairy resources are available to support on-farm best practice
References: 1Green et al., 2007 Veterinary Record 160
7
02468
101214161820
Aug-11
Sep-11
Oct-11
Nov-11
Dec-11
Jan-1
2Fe
b-12
Mar-12
Apr-12
May-12
Jun-1
2Ju
l-12
Aug-12
Sep-12
Oct-12
Nov-12
Dec-12
Jan-1
3
Dry Period (1st)
Dry Period (Recurrant)
Lactation Period (1st)
Lactation Period (Recurrant)
Num
ber o
f Cow
Cas
es
0123456789
101112131415161718
0
5
10
15
20
25
18
08-A
ug-1
1
07-S
ep-1
1
10-O
ct-1
1
07-N
ov-1
1
07-D
ec-1
1
10-J
an-1
2
08-F
eb-1
2
08-M
ar-1
2
10-A
pr-1
2
08-M
ay-1
2
08-J
un-1
2
13-J
ul-1
2
08-A
ug-1
2
10-S
ep-1
2
08-O
ct-1
2
06-N
ov-1
2
04-D
ec-1
2
08-J
an-1
3
No.
New
Infe
ctio
ns
% Rolling LMI (3 Mth)
% LMI MAR
% LMI
New Infection
Control and prevention of mastitis in dairy herdsPete Down, James Breen and Martin Green School of Veterinary Medicine and Science, The University of Nottingham
Introduction ● Mastitis control plans aim to implement a small number
of management items that are usually related to the control of persistent ‘contagious’ pathogens
● The assumption that infection is spreading between infected cows ignores the fact that the environment is often more important in GB dairy farms
● AHDB Dairy-funded research has found that individual farm control plans, designed around the specific disease pattern on that farm, can be very effective at reducing mastitis
● This approach has since been made available to all GB dairy farms as the AHDB Dairy Mastitis Control Plan; the main aspects are highlighted on this poster
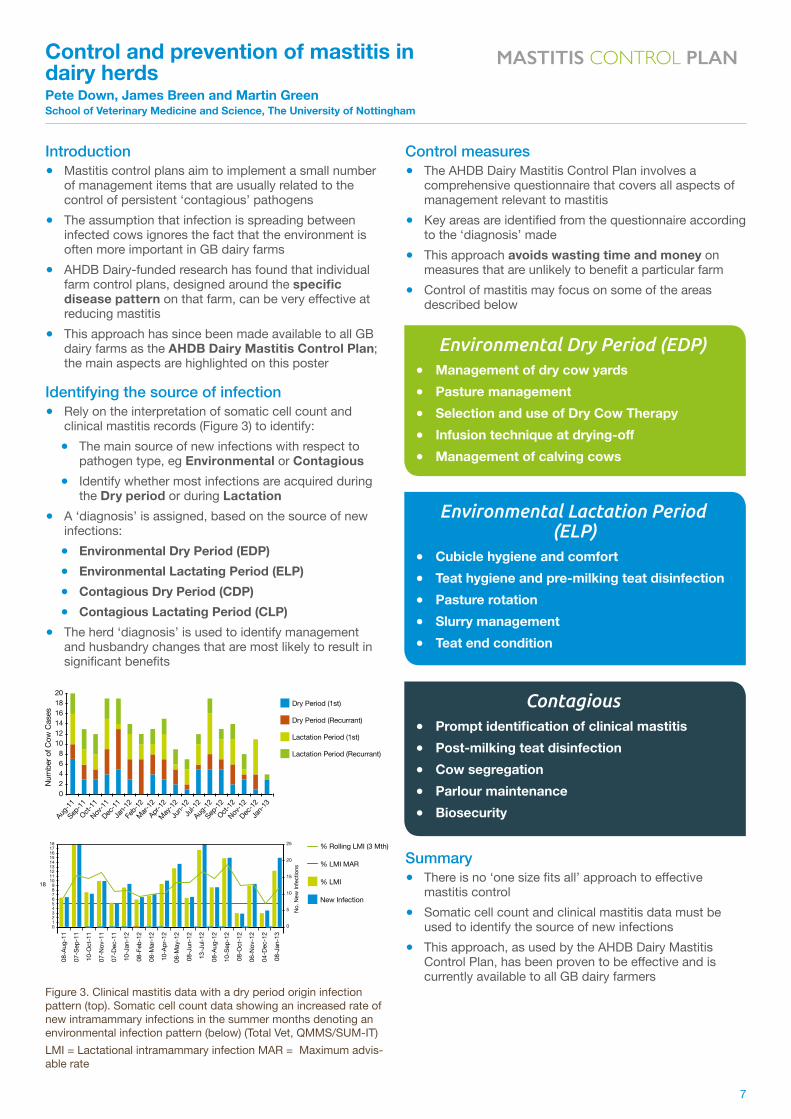
Identifying the source of infection ● Rely on the interpretation of somatic cell count and
clinical mastitis records (Figure 3) to identify: ● The main source of new infections with respect to
pathogen type, eg Environmental or Contagious ● Identify whether most infections are acquired during
the Dry period or during Lactation ● A ‘diagnosis’ is assigned, based on the source of new
infections: ● Environmental Dry Period (EDP) ● Environmental Lactating Period (ELP) ● Contagious Dry Period (CDP) ● Contagious Lactating Period (CLP)
● The herd ‘diagnosis’ is used to identify management and husbandry changes that are most likely to result in significant benefits
Control measures ● The AHDB Dairy Mastitis Control Plan involves a
comprehensive questionnaire that covers all aspects of management relevant to mastitis
● Key areas are identified from the questionnaire according to the ‘diagnosis’ made
● This approach avoids wasting time and money on measures that are unlikely to benefit a particular farm
● Control of mastitis may focus on some of the areas described below
Summary ● There is no ‘one size fits all’ approach to effective
mastitis control ● Somatic cell count and clinical mastitis data must be
used to identify the source of new infections ● This approach, as used by the AHDB Dairy Mastitis
Control Plan, has been proven to be effective and is currently available to all GB dairy farmers
Figure 3. Clinical mastitis data with a dry period origin infection pattern (top). Somatic cell count data showing an increased rate of new intramammary infections in the summer months denoting an environmental infection pattern (below) (Total Vet, QMMS/SUM-IT)LMI = Lactational intramammary infection MAR = Maximum advis-able rate
Environmental Dry Period (EDP) ● Management of dry cow yards ● Pasture management ● Selection and use of Dry Cow Therapy ● Infusion technique at drying-off ● Management of calving cows
Environmental Lactation Period (ELP)
● Cubicle hygiene and comfort ● Teat hygiene and pre-milking teat disinfection ● Pasture rotation ● Slurry management ● Teat end condition
Contagious ● Prompt identification of clinical mastitis ● Post-milking teat disinfection ● Cow segregation ● Parlour maintenance ● Biosecurity
MASTITIS CONTROL PLAN

8
Key messages ● Challenges to cattle vaccination arise from
differences how risk is perceived between vets and farmers in how risk is perceived and farmers’ potential lack of awareness of their herd’s disease status
● There are four main areas which need attention: ● The farmer-vet relationship ● Risk related decision-making behind vaccination ● The issue of compliance ● The use of vaccination guidelines
Understanding and enhancing the relationship between farmers and veterinary surgeons is a crucial step for optimisation of vaccination strategies
Implementation of vaccination strategies on British dairy farms: Understanding challenges and perspectivesImogen Richens, Pru Hobson-West, Marnie Brennan, Wendela Wapenaar School of Veterinary Medicine and Science, The University of Nottingham
Background ● Despite the apparently widespread use of vaccines
there is limited evidence describing the decision-making behind the vaccination of cattle
● There are 38 vaccines currently registered for use in cattle in the UK, offering protection against viral, bacterial and fungal infections
● The aim of this research was to understand what motivates or impedes implementation of vaccination strategies on British dairy farms by farmers and vets
Approach ● 26 farmers and 15 vets were
interviewed ● The farms and veterinary practices
were located throughout England, Scotland and Wales, and included a variety of farm and practice types
Key findings ● Interviews confirmed variability in the use of vaccines; 16
farmers were currently using one or more vaccines, and three farmers had never vaccinated their cattle
● The most commonly used vaccines were BVD, leptospirosis and IBR. This corresponds with what vets perceive to be the ‘core’ vaccines
● Vaccination on British dairy farms is generally implemented in reaction to ‘a problem’ instead of a preventive tool
● Farmers and vets perceive vaccines to be an effective and useful tool to control and prevent disease on British dairy farms
● Vaccination decision-making is a process and not a one-off event, and farmers perceive their vet to have an important role throughout this process
● Local epidemiology is important to vaccination decision-making and vets are often trusted advisers in this area
● Farmers trust their vet’s advice on vaccination, however this does not always mean the advice is followed
● Vets were reluctant to advise against the use of vaccines because of the risk of a subsequent disease outbreak
● There is scope for a more proactive approach from vets regarding vaccination; however, their time and resources are scarce
● Compliance was not a barrier to implementation of vaccination but it was a barrier to effective vaccination
Best practice vaccination ● AHDB Dairy along with the University of Nottingham
have produced a short film for farmers and farm staff to demonstrate the correct technique used to vaccinate cattle safely and effectively
● The film on best practice in safe and efficient vaccination of cattle is available at dairy.ahdb.org.uk/vaccination

9
Implement &monitor
First two visitsof programme
First independent herd mobility score
Independent herd mobility scoring every three months
Farm enrolsWeeks 1 – 3
Weeks 4 – 25
Week 25
Review Agree mobility Contract
Hoof care field guide
HEALTHY FEET PROGRAMME
Background ● On completion of the Healthy Feet Project led by
University of Bristol1,2 its legacy was handed over to the GB dairy industry
● In 2011, the AHDB Dairy Healthy Feet Programme was launched nationally
The AHDB Dairy Healthy Feet ProgrammeA bespoke plan for lameness reduction that will
● Diagnose the lameness problem ● Assess what is causing the problem ● Plan actions to rectify the problem ● Develop skills for long-term lameness control ● Monitor the progress being made
Who delivers the programme?
● Trained vets or licenced foot trimmers known as ‘Mobility Mentors’
● 100+ Mobility Mentors nationally giving professional guidance
How does the plan work?1. Find Mobility Mentor: dairy.ahdb.org.uk/healthyfeet2. Farm visit: Mobility Mentor conducts on-farm survey and
independent herd mobility scoring 3. Mobility contract: Mobility Mentor works with farm team
to produce a list of achievable actions specific to the farm. Discuss with Mobility Mentor priority actions and how best to implement them on your farm
4. Implement and monitor: Mobility Mentor conducts independent herd mobility scoring every three months
5. Review mobility contract: Agree a date for review of actions
Success factors ● AHDB Dairy Healthy Feet Programme focuses on
success factors to reduce lameness ● The ‘four success factors’ for healthy feet are:
Low Infection pressure Good hoof shape and horn quality Low forces on feet (short standing times; good cow
flow; appropriate floor surfaces) Early detection followed by prompt, effective
treatment of lame cows
Key features ● Access to experts and resources ● Thorough farm visit to assess current lameness policies ● Independent mobility scoring of the herd ● Continual review of lameness control
Key benefits ● Identifies areas for improvement ● Increases skills and knowledge of the farm team ● Motivates staff and improves staff morale ● Improves management of cows ● Reduces numbers of lame cows ● Improves milk yield and milk quality ● Reduces veterinary costs
Start to successfully manage lameness ● Contact a Mobility Mentor, vet or Extension Officer ● The cost of the Programme is set by the Mobility Mentor
AHDB Dairy resources ● AHDB Dairy resources are available to help achieve the
‘four success factors’ dairy.ahdb.org.uk/healthyfeet ● AHDB Dairy will continue
to incorporate findings from research studies into the programme
References: 1Main et al., 2012 Journal of Dairy Science, 95, 2946-2952 2Whay et al., 2012 The Veterinary Journal, 193, 617-621
Successful management of lameness HEALTHY FEET PROGRAMME
10
Trim
24
3629
56
85
767269
Perc
entt
age
(%)
Non-lame after 5 wks (Score 0 + 1)
Sound after 5 wks (Score 0 + 1)
Trim + Block Trim + NSAID Trim + Block + NSAID
0
20
40
60
80
100
This work was published open access in Journal of Dairy Science: Thomas et al., 2015, Evaluation of treatments for claw horn lesions in dairy cows in a randomized controlled trial. http://dx.doi.org/10.3168/jds.2014-8982OPEN ACCESS
Effective treatment of claw horn lesionsHeather Thomas and Jon HuxleyUniversity of Nottingham
Key messages ● Lameness cure is maximized by using NSAID
treatment in addition to the common practices of therapeutic trimming and elevating the diseased claw using a block when cows are newly and predominantly mildly lame
● This combined approach helps to reduce trauma to the tissue as it heals, prevents excessive inflammation and physical pressure and reduces pain, allowing the cow to cope better and recover quicker
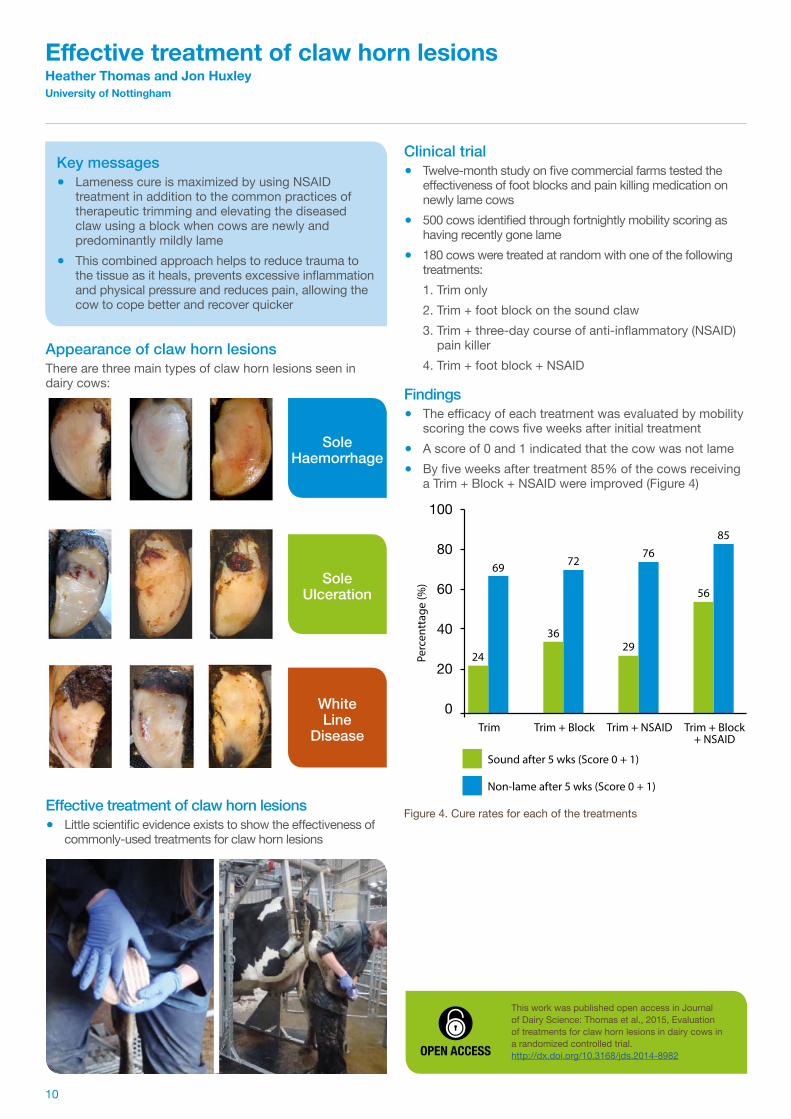
Sole Haemorrhage
Sole Ulceration
White Line
Disease
Appearance of claw horn lesionsThere are three main types of claw horn lesions seen in dairy cows:
Effective treatment of claw horn lesions ● Little scientific evidence exists to show the effectiveness of
commonly-used treatments for claw horn lesions
Clinical trial ● Twelve-month study on five commercial farms tested the
effectiveness of foot blocks and pain killing medication on newly lame cows
● 500 cows identified through fortnightly mobility scoring as having recently gone lame
● 180 cows were treated at random with one of the following treatments: 1. Trim only 2. Trim + foot block on the sound claw3. Trim + three-day course of anti-inflammatory (NSAID)
pain killer4. Trim + foot block + NSAID
Findings ● The efficacy of each treatment was evaluated by mobility
scoring the cows five weeks after initial treatment ● A score of 0 and 1 indicated that the cow was not lame ● By five weeks after treatment 85% of the cows receiving
a Trim + Block + NSAID were improved (Figure 4)
Figure 4. Cure rates for each of the treatments
11
This work was published open access in Journal of Dairy Science: Newsome et al., 2017, A prospective cohort study of digital cushion and corium thickness. Part 1& 2OPEN ACCESS
8 wkspre-calving
17 wkspost-calving
30 wkspost-calvingCalving Peak
Lactation
Achieving the correct body condition reduces claw horn lesionsReuben Newsome and Jon HuxleyUniversity of Nottingham
The study ● Researchers at the University of Nottingham explored if
the thickness of the digital cushion changed with body condition throughout lactation
● 179 cows on two commercial farms were examined at the following time points:
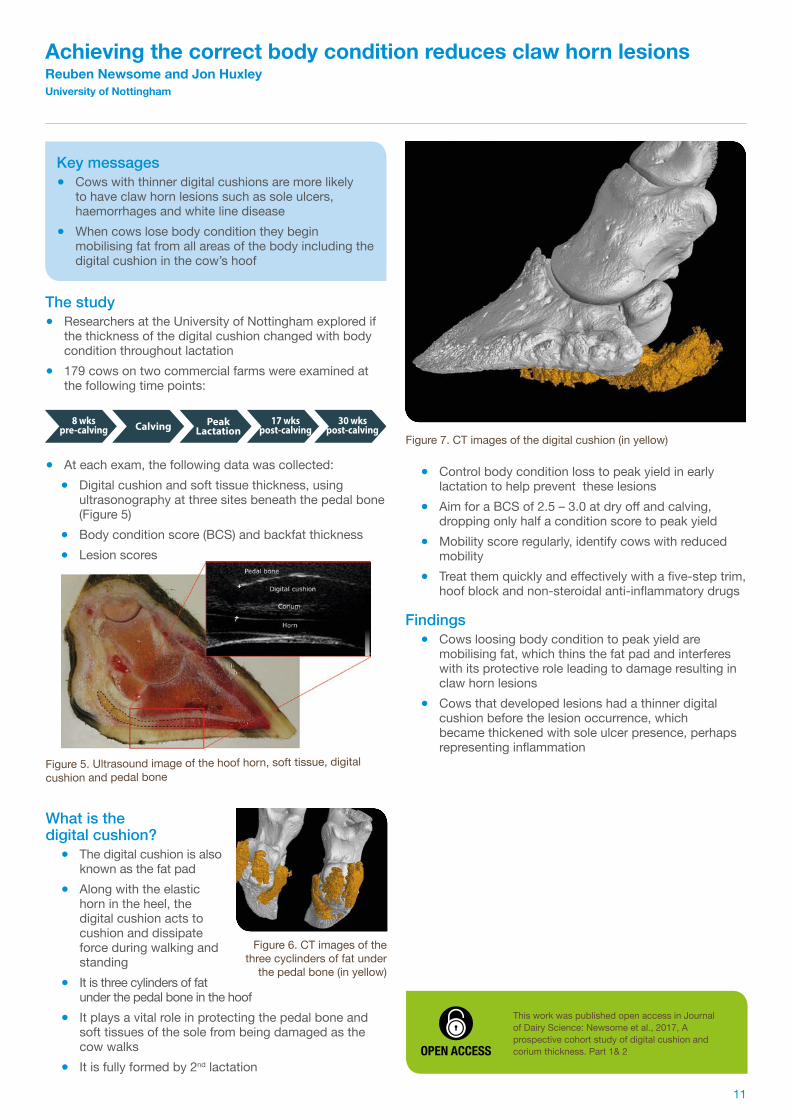
● At each exam, the following data was collected: ● Digital cushion and soft tissue thickness, using
ultrasonography at three sites beneath the pedal bone (Figure 5)
● Body condition score (BCS) and backfat thickness ● Lesion scores
● Control body condition loss to peak yield in early lactation to help prevent these lesions
● Aim for a BCS of 2.5 – 3.0 at dry off and calving, dropping only half a condition score to peak yield
● Mobility score regularly, identify cows with reduced mobility
● Treat them quickly and effectively with a five-step trim, hoof block and non-steroidal anti-inflammatory drugs
Findings ● Cows loosing body condition to peak yield are
mobilising fat, which thins the fat pad and interferes with its protective role leading to damage resulting in claw horn lesions
● Cows that developed lesions had a thinner digital cushion before the lesion occurrence, which became thickened with sole ulcer presence, perhaps representing inflammation
Figure 5. Ultrasound image of the hoof horn, soft tissue, digital cushion and pedal bone
Figure 7. CT images of the digital cushion (in yellow)
What is the digital cushion?
● The digital cushion is also known as the fat pad
● Along with the elastic horn in the heel, the digital cushion acts to cushion and dissipate force during walking and standing
● It is three cylinders of fat under the pedal bone in the hoof
● It plays a vital role in protecting the pedal bone and soft tissues of the sole from being damaged as the cow walks
● It is fully formed by 2nd lactation
Figure 6. CT images of the three cyclinders of fat under
the pedal bone (in yellow)
Key messages ● Cows with thinner digital cushions are more likely
to have claw horn lesions such as sole ulcers, haemorrhages and white line disease
● When cows lose body condition they begin mobilising fat from all areas of the body including the digital cushion in the cow’s hoof
12
Exacerbating environmental risk factors, eg decreased lying time, social competition
Physiological events around parturition, eg weakening of the hoof suspensory apparatus
Fat utilised from
digital cushion as
inflammatory mediators
Hoof overgrowth
BCS loss
Fat mobilised for digital cushion
Poorer shock dissipation
during foot-strike
Inappropriate forces on germinal
epithelium of the sole
Haemorrhage beneath
distal phalanx, active
claw horn lesion
Inflammationand lameness
Cow consigned to a life at greater risk
of lameness
Thinning ofdigital cushion
Scarring andfibrosis of the digital cushion
Bonedevelopment
ondistal phalanx
Body fat mobilisation
in early lactation
Lameness from other causes eg infection, trauma
ReducedDMI
Selfperpetuating
cycle
Selfperpetuating
cycle
Selfperpetuating
cycle
This work was published open access in Journal of Dairy Science: Newsome et al., 2016, Linking bone development on the caudal aspect of the distal phalanx with lameness during life. http://dx.doi.org/10.3168/jds.2015-10202OPEN ACCESS
Untreated claw horn lesions leads to abnormal bone growth in the hoofSimon Archer, Reuben Newsome and Jon Huxley University of Nottingham
Study on bone development, lameness and claw horn lesions
● Researchers at the University of Nottingham assessed whether bone development was associated with lameness and the occurrence of claw horn lesions during a cow’s life
● A total of 282 hind hooves from 72 Holstein-Friesian cull cows from the SRUC research herd were retrieved from the abattoir
● The hooves were imaged using an x-ray micro CT scanner to examine the anatomy of the pedal bones within the hoof
● Extensive historical records were retrieved on these cows including weekly mobility scores from first calving
Findings ● X-raying the hooves of cows identified new bone growth
on the rear end of the pedal bone ● This new bone development was greater in cows with a
history of lameness caused by claw horn lesion ● Cows that had experienced more lameness in the 12
months before slaughter had increased bone growth, therefore the bone growth is likely due to chronic lameness
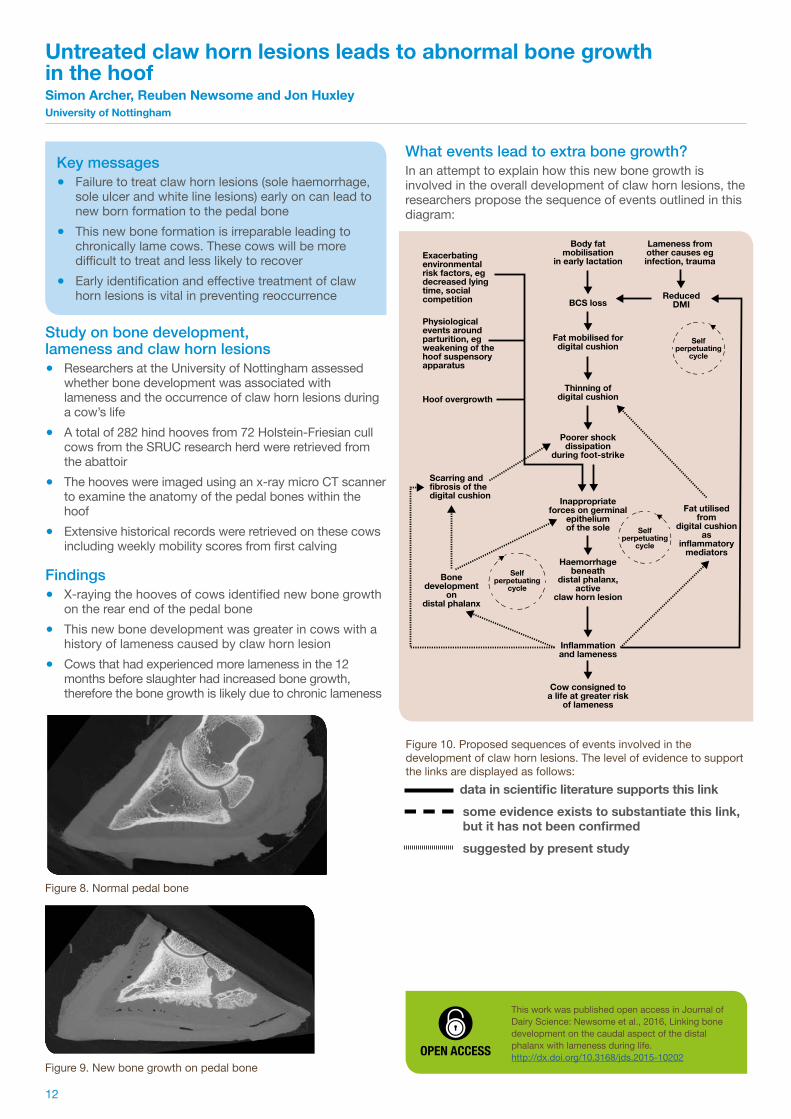
What events lead to extra bone growth? In an attempt to explain how this new bone growth is involved in the overall development of claw horn lesions, the researchers propose the sequence of events outlined in this diagram:
Figure 10. Proposed sequences of events involved in the development of claw horn lesions. The level of evidence to support the links are displayed as follows: data in scientific literature supports this link some evidence exists to substantiate this link,
but it has not been confirmed suggested by present study
Figure 8. Normal pedal bone
Figure 9. New bone growth on pedal bone
Key messages ● Failure to treat claw horn lesions (sole haemorrhage,
sole ulcer and white line lesions) early on can lead to new born formation to the pedal bone
● This new bone formation is irreparable leading to chronically lame cows. These cows will be more difficult to treat and less likely to recover
● Early identification and effective treatment of claw horn lesions is vital in preventing reoccurrence

13
Trimming Length, mm
Cow Age >4yrs
Cow Age ≤4yrs
Perc
enta
ge o
f cla
ws
that
wou
ldno
t be
cut s
hort
0
10
20
30
40
50
60
70
80
90
100
65 70 75 80 85 90 95
This work was published open access in Veterinary Record, in September 2015, titled: “Claw length recommendations for dairy cow foot trimming” Archer, Newsome et al., (2015) DOI: 10.1136/vr.103197OPEN ACCESS
Foot trimming claw length: One size doesn't fit allReuben Newsome1, Simon Archer1, Mizeck Chagunda2, Harry Dibble1, Colin Mason2, Craig Sturrock1 and Jon Huxley1
University of Nottingham1, 2SRUC
Introduction ● Over-trimming can cause thin soles and predispose
cows to toe ulcers and lameness ● Step one of the Dutch Trimming Method (Toussaint-
Raven, 1985) states – trim the medial claw to 75 mm, based on a Friesian cow, but leave it longer for larger cows
● The modern Holstein is a larger cow than the Friesian but the same trimming guidelines are used; 75 mm may be too short
Approach ● The hind feet of 72 Holstein cows were CT scanned ● The minimum safe trimming length for each claw was
deduced (Figures 11 and 12) ● Cows studied were those culled for production reasons
from the SRUC Crichton Herd, Dumfries, UK, between Nov 2013 and Aug 2014
● Age range: 31 to 119 months
ResultsMeasurements are reported as if trimming the toe to a point. If leaving a 5mm step, 7mm can be subtracted.
● The median minimum dorsal wall length was 83mm, and ranged from 66 to 93 (IQR: 80 to 85)
● The lateral claw was 1mm longer than the medial ● The proportion of claws that would have been cut too
short for any trimming length are displayed in Figure 13
● Trimming to 75m and leaving a point at the toe would have been too short for the majority of claws
● Trimming to 75mm and leaving a 5mm step at the toe would have been too short for 55% of claw
Figure 12. A 14mm adjustment was added to leave a minimum sole thickness of 5mm (adjustment of 7mm), and an 8mm wall thickness (another adjustment of 7mm).
Figure 11. CT image displaying the measurement from the top of the wall horn to the tip of the toe. The minimum appropriate trimming length for each claw was calculated
Figure 13. Cumulative frequency plot demonstrating the percentage of claws that would have been cut too short given any trimming length, if trimming the toe to a point. Two age categories are shown. If leaving a 5mm step at the toe, remove 7mm from the trimming length
Key messages ● Trimming length varies with the trimming landmark
used and also varies greatly between cows ● Trimming to 75mm is not safe for all cows,
regardless of which common landmark is used ● One size does not fit all, but 90mm would be
appropriate for 96% of claws studied, if trimming the toe to a point
● 85mm would be suitable for heifers and second lactation cows or if leaving a small step at the toe
● New foot trimming operators should be trained to use a more cautious measure, to reduce the risk of over-trimming.

14
0102030405060708090
100
100
41
After trimming
% bladespositive for Treponemes
After disinfection
Foot trimming link to spread of Digital DermatitisLeigh Sullivan1, Roger Blowey2, Stuart Carter1, and Nicholas Evans1
1Department of Infection Biology, University of Liverpool, 2Wood Veterinary Group, Gloucester
What is Digital Dermatitis? ● Digital dermatitis (DD) is a skin infection found near
the bulb of the heel that affects dairy cattle worldwide (Figure 14)
● DD costs on average approx £82 per case1
● Currently, no single effective treatment or preventive measure for DD exists
Cause of Digital Dermatitis? ● Bacteria called Treponemes are
found in all DD lesions and are thought to be the cause of DD2
● Treponemes are, typically, found in the gut of cows (Figure 15) and do not normally cause disease in the gut3
● Some Treponemes have the potential to feed on secretions from the mucous membrane of the gut which can be passed out in cattle faeces
● The DD Treponemes are the same family as those in the gut but are slightly different in type
● Three different types of Treponeme that cause DD have been identified
How are DD Treponemes transmitted? ● There is evidence that DD is spread in slurry but other
transmission routes require investigation.
Project aim ● Investigate whether DD Treponemes could be detected
on hoof-trimming equipment after trimming the hooves of cattle with DD.
Methods ● Tested trimming equipment used on cattle with digital
dermatitis before and after disinfection.
Results ● After trimming, DD was present on 100% of cattle
blades4. This was reduced to 41% after disinfection (Figure 16)
Conclusion ● It appears that DD Treponemes may be able to adhere to
the blades of trimming knives used to trim cattle hooves ● The high detection rate of DD Treponemes on trimming
blades soon after trimming cattle suggests this may be a significant and worrying route for the transmission of DD between cows and, possibly, between farms
Best practice ● Routine foot bathing is the most effective control of DD ● Monitor cows for DD lesions regularly during housing ● Provide clean and dry environment to optimise hoof
hygiene ● Footbath dry cows and heifers ● Thoroughly disinfect hoof-trimming equipment between
hooves, between animals and between farms
References: 1 Cha et al., 2010 Prev Vet Med 97 : 1–8; 2 Evans et al., 2008 Vet Microbiol 130: 141–150; 3 Evans et al., Appl Environ Microbiol. 2011 Jan;77:138–47; 4 Sullivan et al., Vet Rec. 2014;175: 201
Figure 14. A typical DD lesion
Figure 15. A Treponeme as seen
under an electron microscope
Figure 16. The percentage of trimming blades testing positive for DD Treponeme after trimming and after disinfection
1515
02468
1012
10.5 11.3
Cubicles Straw yard
Averagedaily lying time
(hours)
02468
1012
10.1 11.5
Mat/mattress cubicles Deep sand cubicles
Averagedaily lying
time(hours)
Figure 17. Electronic data loggers for recording lying tmie
Managing for optimal lying comfortSophie Collins1, Nick Bell1, Dan Gammon2 and Jenny Gibbons3
1Royal Veterinary College, 2 EBVC Ltd, 3 AHDB Dairy
Why worry about cow comfort? ● Providing cows with a comfortable lying environment is
important for ensuring good cow health and welfare and optimal milk production
● Stress and risk of lameness increases when lying time is restricted
● Milk production increases as lying comfort and lying time increases
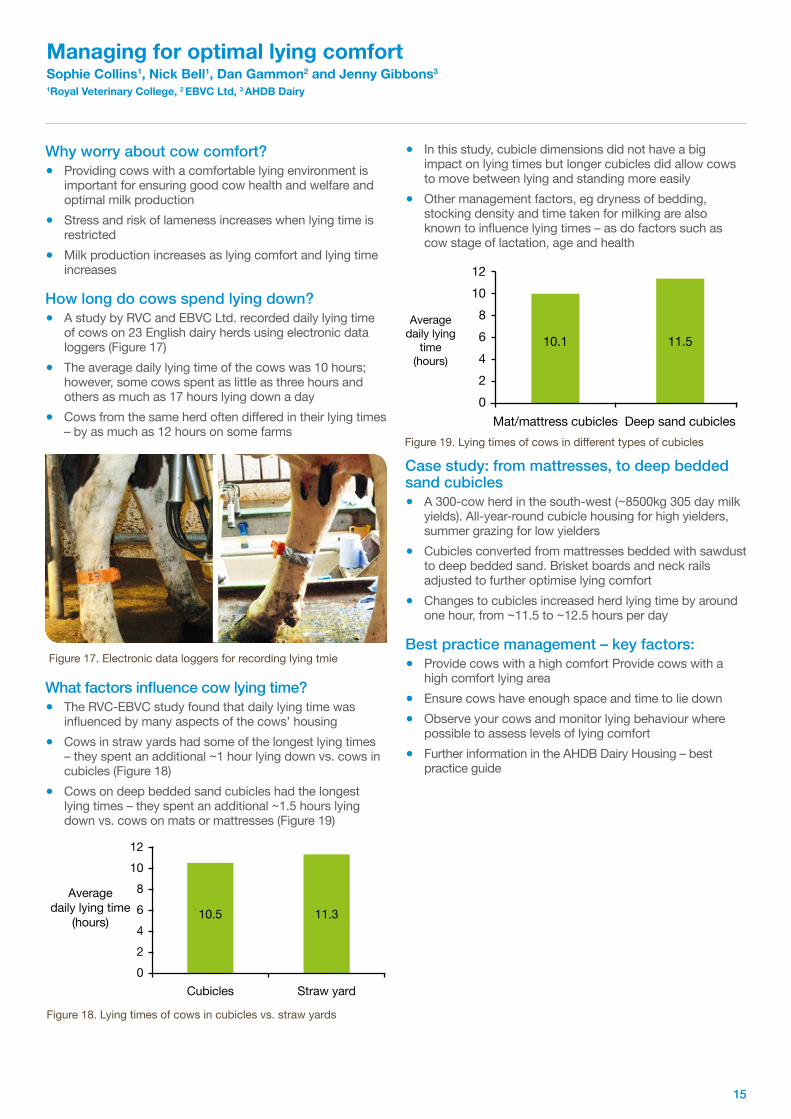
How long do cows spend lying down? ● A study by RVC and EBVC Ltd. recorded daily lying time
of cows on 23 English dairy herds using electronic data loggers (Figure 17)
● The average daily lying time of the cows was 10 hours; however, some cows spent as little as three hours and others as much as 17 hours lying down a day
● Cows from the same herd often differed in their lying times – by as much as 12 hours on some farms
What factors influence cow lying time? ● The RVC-EBVC study found that daily lying time was
influenced by many aspects of the cows’ housing ● Cows in straw yards had some of the longest lying times
– they spent an additional ~1 hour lying down vs. cows in cubicles (Figure 18)
● Cows on deep bedded sand cubicles had the longest lying times – they spent an additional ~1.5 hours lying down vs. cows on mats or mattresses (Figure 19)
● In this study, cubicle dimensions did not have a big impact on lying times but longer cubicles did allow cows to move between lying and standing more easily
● Other management factors, eg dryness of bedding, stocking density and time taken for milking are also known to influence lying times – as do factors such as cow stage of lactation, age and health
Case study: from mattresses, to deep bedded sand cubicles
● A 300-cow herd in the south-west (~8500kg 305 day milk yields). All-year-round cubicle housing for high yielders, summer grazing for low yielders
● Cubicles converted from mattresses bedded with sawdust to deep bedded sand. Brisket boards and neck rails adjusted to further optimise lying comfort
● Changes to cubicles increased herd lying time by around one hour, from ~11.5 to ~12.5 hours per day
Best practice management – key factors: ● Provide cows with a high comfort Provide cows with a
high comfort lying area ● Ensure cows have enough space and time to lie down ● Observe your cows and monitor lying behaviour where
possible to assess levels of lying comfort ● Further information in the AHDB Dairy Housing – best
practice guide
Figure 18. Lying times of cows in cubicles vs. straw yards
Figure 19. Lying times of cows in different types of cubicles
16
A participatory approach to reducing farm antimicrobial usageLisa Morgans1, Sarah Bolt2, Lisa van Dijk1, Henry Buller3, Kristen Reyher1, David C.J. Main1
1University of Bristol 2AHDB Dairy 3University of Exeter
Introduction ● There is increasing pressure for farmers to reduce their
use of antimicrobials, especially Critically Important Antibiotics (CIAs)
● Stable Schools in Denmark have been successful in helping farmers reduce their antimicrobial usage
● Stable Schools allow farmers to share common experiences and learn from each other.
Aims ● To establish and follow five Farmer Action Groups (FAG)
across South West England, based on Stable Schools ● When working together, can dairy farmers reduce the
amount of antimicrobial used on farm? ● How can this approach be adopted into policy on
antimicrobial usage on farm?
Method ● Five Farmer Action Groups established with 5–8 farm
businesses in each ● Meetings held on each others farm every 4–8 weeks
Meeting framework; ● Introduction and ‘around the farm’ discussion – what
has been happening on farm since last time? ● Medicine review – emphasis on areas where usage is
particularly low/high, good practice is shared amongst the group and areas for improvement are considered.
● Facilitated farm walk ● Reflection on farm walk – interactive discussion
● Farmer-led Action Plan created at each meeting with the aim of reducing reliance on antimicrobials
● Once all members of the group have been visited, the second phase of meetings occurs – the review process
● Each farm is visited again to assess and evaluate how the host farm has implemented the Action Plan
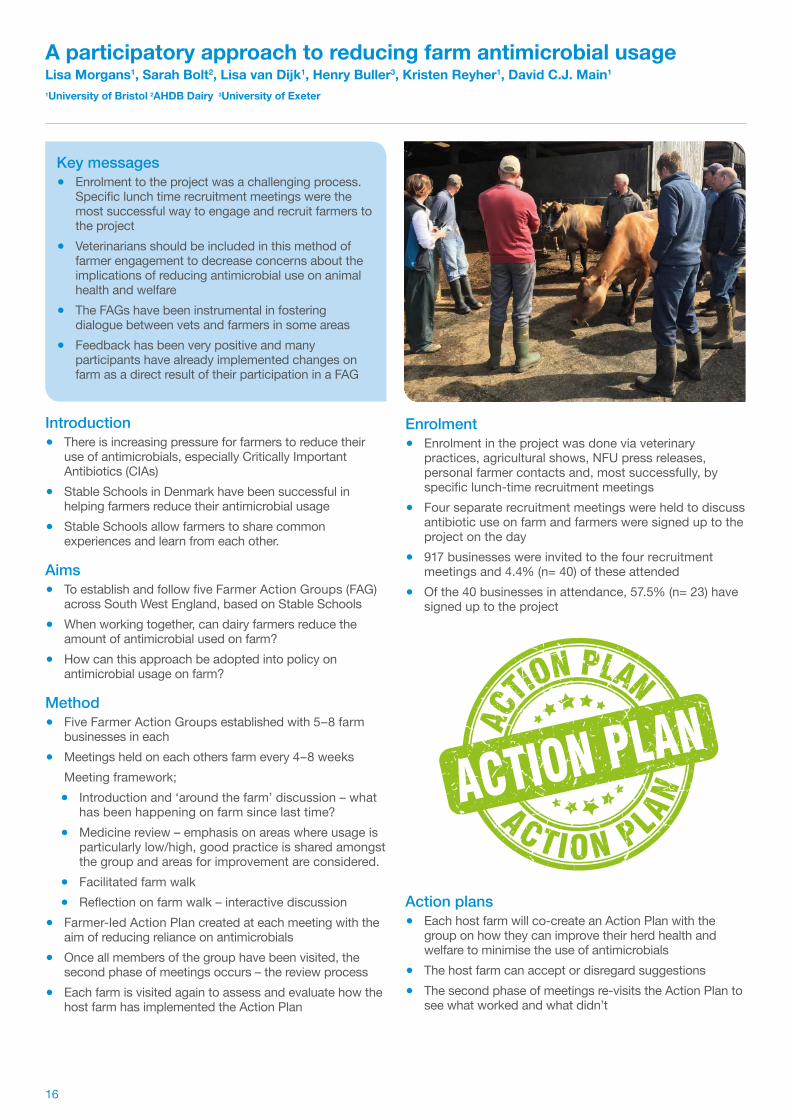
Enrolment ● Enrolment in the project was done via veterinary
practices, agricultural shows, NFU press releases, personal farmer contacts and, most successfully, by specific lunch-time recruitment meetings
● Four separate recruitment meetings were held to discuss antibiotic use on farm and farmers were signed up to the project on the day
● 917 businesses were invited to the four recruitment meetings and 4.4% (n= 40) of these attended
● Of the 40 businesses in attendance, 57.5% (n= 23) have signed up to the project
Action plans ● Each host farm will co-create an Action Plan with the
group on how they can improve their herd health and welfare to minimise the use of antimicrobials
● The host farm can accept or disregard suggestions ● The second phase of meetings re-visits the Action Plan to
see what worked and what didn’t
Key messages ● Enrolment to the project was a challenging process.
Specific lunch time recruitment meetings were the most successful way to engage and recruit farmers to the project
● Veterinarians should be included in this method of farmer engagement to decrease concerns about the implications of reducing antimicrobial use on animal health and welfare
● The FAGs have been instrumental in fostering dialogue between vets and farmers in some areas
● Feedback has been very positive and many participants have already implemented changes on farm as a direct result of their participation in a FAG

17
On-farm strategies to reduce the transmission of Johne’s Disease in British dairy herds Karen Bond and Javier GuitianRoyal Veterinary College
What is Johne’s Disease? ● Chronic bacterial infection affecting the small intestine ● Disease takes years to develop: cattle are usually
infected as calves but do not show clinical signs until adulthood, typically 3–5 years old
● Caused by Mycobacterium avium paratuberculosis and is often referred to as ParaTB, JD or Johne’s
How do calves become infected? ● Calving yards contaminated with MAP bacteria ● Ingestion of MAP via faeces, colostrum or milk ● Udder and coat contamination of cows, calves ingest the
bacteria while suckling
Research outline
Preliminary results ● Strong relationship between dam Johne’s status and the
risk of the calf becoming infected ● Evidence of an interaction between the time spent with
the dam and the cleanliness of the calving yard: a long time spent in the yard increases of infection but if the yard is clean the effect is greatly reduced
● No evidence of any production effects in first lactation in those heifers that are Johne’s positive but some evidence of a decrease in milk production in second lactation (subsequent lactations not studied yet)
Further work ● As the recruited animals get older, more will become
Johne’s positive. This will allow us to refine the results given above as we are able to more accurately classify the animals as truly Johne’s positive or negative
● Re-analysis of existing data as more cows become positive and analysis of lactations three or more to determine production differences between Johne’s positive and negative animals
Farmer engagement Six commercial dairy herds across GB kindly agreed to participate in this project, a huge commitment, for which we are very grateful. Here are some comments from the farmers who are involved.
Farmer A“Although the paperwork felt like a big hassle to begin with, it actually made us think about our calving protocols and how successfully we were managing to stick to them, it made us all more focussed.”
Farmer B“We were quite shocked when we saw our calf passive transfer results, they were very variable and overall not great, a review of our colostrum management and we were able to quickly see the results get better and better”
Farmer C“We knew we had a Johne’s issue, but being involved in this project gave us the kick we needed to really start to address it, and the cameras in the calving area really helped with quick and effective calving management.”
Adult cows screened quarterly for Johne’s antibody using milk
ELISA
Blood samples taken from calves between
three and 10 days of age to assess colostral antibody transfer
All calf treatments recorded up to weaning alongside mortality data
Heifers commence quarterly Johne’s
antibody screening alongside the other
adults
This data is used to identify recruited heifers
that become Johne’s positive and also their
dams who become positive later
All heifer calves born over a 12 month period on the
six project herds recruited to the study
Fixed camera equipment in calving yards, data
collected on: ● Cleanliness of area ● Calving ease ● Timing & source of
colostrum ● Time calf spent with
dam ● Suckling behaviour ● Dam Johne’s status ● Calf chest girth
Production data collected via milk records
● Fertility data ● Number of services ● Age at first calving ● Calving to conception ● Milk yield, fat &
protein ● Somatic cell count ● Culling
Calf recruitment
Subsequent calvingsContinued collection of Johne’s and production
data for further analysis
First calving
18
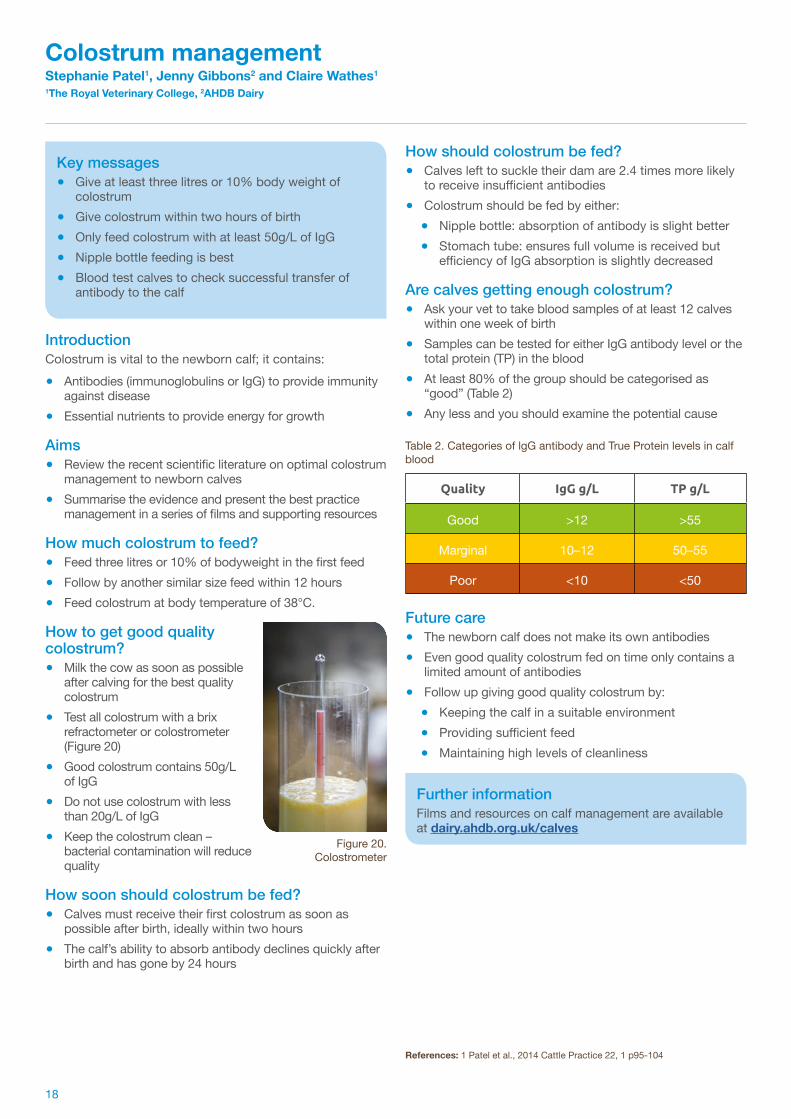
Quality IgG g/L TP g/L
Good >12 >55
Marginal 10–12 50–55
Poor <10 <50
Colostrum managementStephanie Patel1, Jenny Gibbons2 and Claire Wathes1
1The Royal Veterinary College, 2AHDB Dairy
IntroductionColostrum is vital to the newborn calf; it contains:
● Antibodies (immunoglobulins or IgG) to provide immunity against disease
● Essential nutrients to provide energy for growth
Aims ● Review the recent scientific literature on optimal colostrum
management to newborn calves ● Summarise the evidence and present the best practice
management in a series of films and supporting resources
How much colostrum to feed? ● Feed three litres or 10% of bodyweight in the first feed ● Follow by another similar size feed within 12 hours ● Feed colostrum at body temperature of 38°C.
How to get good quality colostrum?
● Milk the cow as soon as possible after calving for the best quality colostrum
● Test all colostrum with a brix refractometer or colostrometer (Figure 20)
● Good colostrum contains 50g/L of IgG
● Do not use colostrum with less than 20g/L of IgG
● Keep the colostrum clean – bacterial contamination will reduce quality
How soon should colostrum be fed? ● Calves must receive their first colostrum as soon as
possible after birth, ideally within two hours ● The calf’s ability to absorb antibody declines quickly after
birth and has gone by 24 hours
How should colostrum be fed? ● Calves left to suckle their dam are 2.4 times more likely
to receive insufficient antibodies ● Colostrum should be fed by either:
● Nipple bottle: absorption of antibody is slight better ● Stomach tube: ensures full volume is received but
efficiency of IgG absorption is slightly decreased
Are calves getting enough colostrum? ● Ask your vet to take blood samples of at least 12 calves
within one week of birth ● Samples can be tested for either IgG antibody level or the
total protein (TP) in the blood ● At least 80% of the group should be categorised as
“good” (Table 2) ● Any less and you should examine the potential cause
Future care ● The newborn calf does not make its own antibodies ● Even good quality colostrum fed on time only contains a
limited amount of antibodies ● Follow up giving good quality colostrum by:
● Keeping the calf in a suitable environment ● Providing sufficient feed ● Maintaining high levels of cleanliness
References: 1 Patel et al., 2014 Cattle Practice 22, 1 p95-104
Figure 20. Colostrometer
Key messages ● Give at least three litres or 10% body weight of
colostrum ● Give colostrum within two hours of birth ● Only feed colostrum with at least 50g/L of IgG ● Nipple bottle feeding is best ● Blood test calves to check successful transfer of
antibody to the calf
Further informationFilms and resources on calf management are available at dairy.ahdb.org.uk/calves
Table 2. Categories of lgG antibody and True Protein levels in calf blood
19
Feed36.8%
Grazing6.9%
Bedding8.7%
Health 4.1%
Labour22.3%
Slurry7.1%
Breeding4.4%
Transport0.3%
Disinfection0.3%
Buildings2.7%
Equipment1.6%
Calving0.6%
Water2.4%
Registration0.2%
Electricity1.6%
Age at first calving (months)
0%
-10%
-20%
10%
20%
30%
40%
23-17.1%
24
-15.7%
25
-3.6%
26
0.0%
27
14.3%
28
9.5%
29
22.7%
30
17.2%
32
41.3%
Perc
enta
ge d
iffer
ence
in to
tal c
ost o
f rea
ring
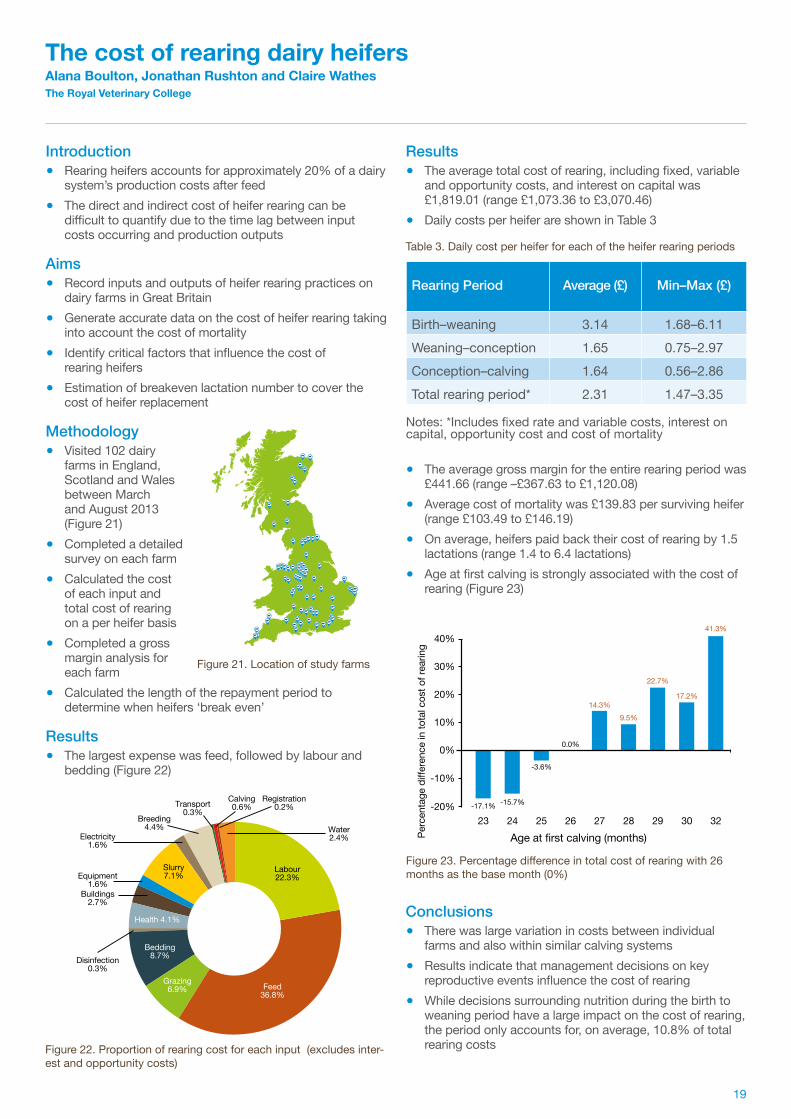
Rearing Period Average (£) Min–Max (£)
Birth–weaning 3.14 1.68–6.11Weaning–conception 1.65 0.75–2.97Conception–calving 1.64 0.56–2.86Total rearing period* 2.31 1.47–3.35
Notes: *Includes fixed rate and variable costs, interest on capital, opportunity cost and cost of mortality
The cost of rearing dairy heifersAlana Boulton, Jonathan Rushton and Claire Wathes The Royal Veterinary College
Introduction ● Rearing heifers accounts for approximately 20% of a dairy
system’s production costs after feed ● The direct and indirect cost of heifer rearing can be
difficult to quantify due to the time lag between input costs occurring and production outputs
Aims ● Record inputs and outputs of heifer rearing practices on
dairy farms in Great Britain ● Generate accurate data on the cost of heifer rearing taking
into account the cost of mortality ● Identify critical factors that influence the cost of
rearing heifers ● Estimation of breakeven lactation number to cover the
cost of heifer replacement
Methodology ● Visited 102 dairy
farms in England, Scotland and Wales between March and August 2013 (Figure 21)
● Completed a detailed survey on each farm
● Calculated the cost of each input and total cost of rearing on a per heifer basis
● Completed a gross margin analysis for each farm
● Calculated the length of the repayment period to determine when heifers ‘break even’
Results ● The largest expense was feed, followed by labour and
bedding (Figure 22)
Results ● The average total cost of rearing, including fixed, variable
and opportunity costs, and interest on capital was £1,819.01 (range £1,073.36 to £3,070.46)
● Daily costs per heifer are shown in Table 3
● The average gross margin for the entire rearing period was £441.66 (range –£367.63 to £1,120.08)
● Average cost of mortality was £139.83 per surviving heifer (range £103.49 to £146.19)
● On average, heifers paid back their cost of rearing by 1.5 lactations (range 1.4 to 6.4 lactations)
● Age at first calving is strongly associated with the cost of rearing (Figure 23)
Conclusions ● There was large variation in costs between individual
farms and also within similar calving systems ● Results indicate that management decisions on key
reproductive events influence the cost of rearing ● While decisions surrounding nutrition during the birth to
weaning period have a large impact on the cost of rearing, the period only accounts for, on average, 10.8% of total rearing costs
Figure 21. Location of study farms
Figure 22. Proportion of rearing cost for each input (excludes inter-est and opportunity costs)
Figure 23. Percentage difference in total cost of rearing with 26 months as the base month (0%)
Table 3. Daily cost per heifer for each of the heifer rearing periods
2020
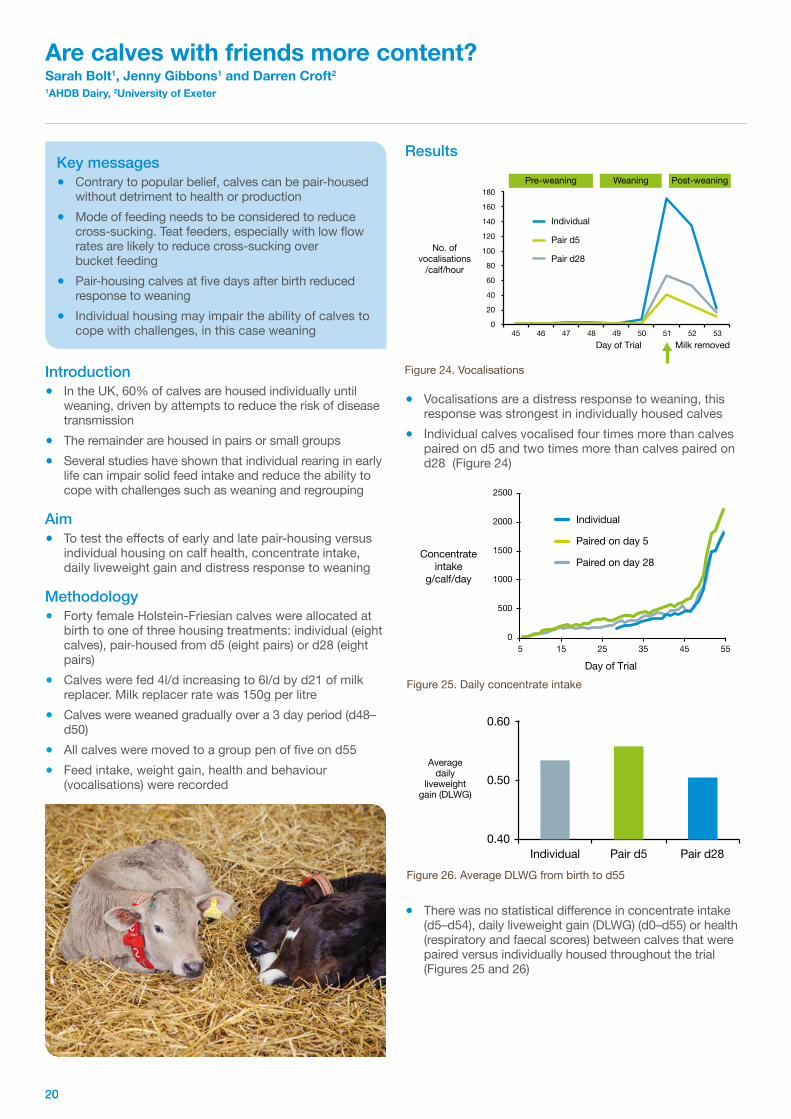
Day of Trial
No. ofvocalisations
/calf/hour
Milk removed
Individual
Pair d5
Pair d28
0
20
40
45 46 47 48 49 50 51 52 53
60
80
100
120
140
160
180Pre-weaning Weaning Post-weaning
Day of Trial
Individual
Paired on day 5
Paired on day 28
0
500
1000
1500
2000
2500
5 15 25 35 45 55
Concentrateintake
g/calf/day
0.40
0.50
0.60
Individual Pair d5 Pair d28
Averagedaily
liveweightgain (DLWG)
Are calves with friends more content?Sarah Bolt1, Jenny Gibbons1 and Darren Croft2 1AHDB Dairy, 2University of Exeter
Introduction ● In the UK, 60% of calves are housed individually until
weaning, driven by attempts to reduce the risk of disease transmission
● The remainder are housed in pairs or small groups ● Several studies have shown that individual rearing in early
life can impair solid feed intake and reduce the ability to cope with challenges such as weaning and regrouping
Aim ● To test the effects of early and late pair-housing versus
individual housing on calf health, concentrate intake, daily liveweight gain and distress response to weaning
Methodology ● Forty female Holstein-Friesian calves were allocated at
birth to one of three housing treatments: individual (eight calves), pair-housed from d5 (eight pairs) or d28 (eight pairs)
● Calves were fed 4l/d increasing to 6l/d by d21 of milk replacer. Milk replacer rate was 150g per litre
● Calves were weaned gradually over a 3 day period (d48–d50)
● All calves were moved to a group pen of five on d55 ● Feed intake, weight gain, health and behaviour
(vocalisations) were recorded
Results
● Vocalisations are a distress response to weaning, this response was strongest in individually housed calves
● Individual calves vocalised four times more than calves paired on d5 and two times more than calves paired on d28 (Figure 24)
● There was no statistical difference in concentrate intake (d5–d54), daily liveweight gain (DLWG) (d0–d55) or health (respiratory and faecal scores) between calves that were paired versus individually housed throughout the trial (Figures 25 and 26)
Figure 25. Daily concentrate intake
Figure 26. Average DLWG from birth to d55
Figure 24. Vocalisations
Key messages ● Contrary to popular belief, calves can be pair-housed
without detriment to health or production ● Mode of feeding needs to be considered to reduce
cross-sucking. Teat feeders, especially with low flow rates are likely to reduce cross-sucking over bucket feeding
● Pair-housing calves at five days after birth reduced response to weaning
● Individual housing may impair the ability of calves to cope with challenges, in this case weaning

21
Average diet of1 to 2-year-old heifers
Average diet of1-year-old heifers
Crop65%
Crop56%
Otherfeed35%
Otherfeed44%
Figure 28. Comparaison of average diet for 1 to 2-year-old heifers and 1-year-old heifers
Outwintering replacement dairy heifersNorton Atkins, Emma Bleach and Liam Sinclair Harper Adams University
Why outwinter heifers?The trend towards expanding herd size creates extra accommodation requirements for youngstock. Options for expanding include:
● Constructing extra buildings (high capital) ● Purchasing in-milk heifers (biosecurity) ● Woodchip pads ● Outwintering replacement heifers
Little is known about the current practices of outwintering or the performance of these animals during the rearing period in comparison with housed heifers
Survey of current practice ● 70 farmers participated in a survey in 2012 ● Participants each had an average of 9.7 years experience
in outwintering heifersThe top four reasons for outwintering heifers were:
1. To reduce the cost of heifer rearing2. To improve animal health and welfare3. To reduce labour input4. To alleviate pressure on buildings
The most popular forages for outwintering heifers were:To reduce the cost of heifer rearing
● The most common supplementary feed was baled silage (80%)
● Supplementary feed was commonly stored in the field (66%)
● Mineral supplementation was commonly via a bolus (49%)
Site selection:Choosing free-draining, dry soils was the primary criteria for selecting a suitable area to outwinter heifers. Field selection and soil type was also key to:
● Avoiding poaching ● Avoiding run-off ● Providing dry lying areas
Animal performance:Over the outwintering period, farmers estimated:
● Live weight gain (LWG) of 0.54kg per day ● 96% of heifers gained (59%) or maintained (37%) BCS
On-farm monitoringOutwintered heifer performance in the winter and first lactation, soil condition and effect of a mineral bolus is being measured on low input, spring calving, cross-bred dairy herds in 2013:
● Nine farms – three grass, three kale, three fodder beet ● 360 heifers – 40 on each farm ● Half of the heifers were given a mineral bolus
Measurements include: forage quality and utilisation, LWG, milk yields, health and fertility.
Outcomes ● Decisions on the most appropriate forage should be
made on soil type and crop yield ● Performance targets are more likely to be met on farms
that weigh and monitor animals regularly ● Supplementing with a mineral bolus has a marginal effect
on BCS prior to calving, and increases milk fat content in early lactation, especially in herds grazing kale
Figure 27. Bales prepared for winter and dairy heifers grazing stubble turnips
1. Grass55% of farms4.4t DM/Ha ave. yield
2. Kale42% of farms10t DM/Ha ave. yield
3. Fodder beet32% of farms21t DM/Ha ave. yield
Check out the Cost effective ways to outwinter heifers information at dairy.ahdb.org.uk
22
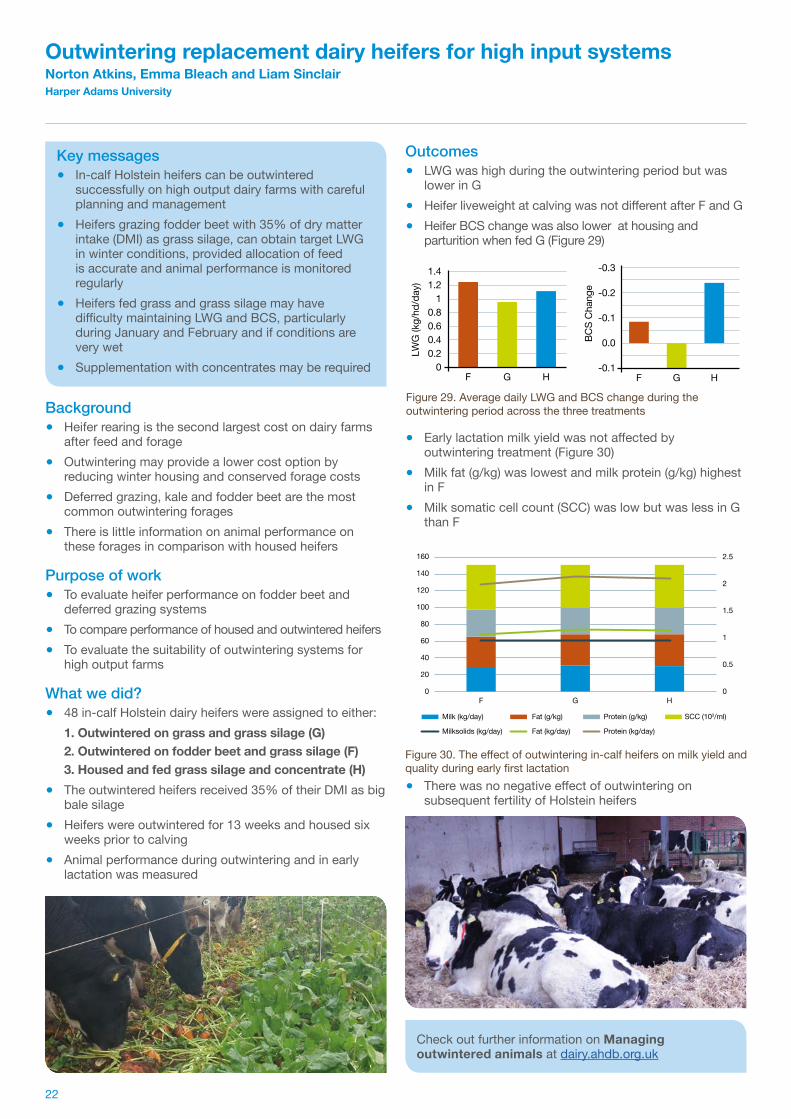
0F
LWG
(kg/
hd/d
ay)
G H
0.20.40.60.8
11.21.4
-0.1
0.0
-0.1
-0.2
-0.3
F G H
BCS
Cha
nge
Outwintering replacement dairy heifers for high input systemsNorton Atkins, Emma Bleach and Liam Sinclair Harper Adams University
Background ● Heifer rearing is the second largest cost on dairy farms
after feed and forage ● Outwintering may provide a lower cost option by
reducing winter housing and conserved forage costs ● Deferred grazing, kale and fodder beet are the most
common outwintering forages ● There is little information on animal performance on
these forages in comparison with housed heifers
Purpose of work ● To evaluate heifer performance on fodder beet and
deferred grazing systems ● To compare performance of housed and outwintered heifers ● To evaluate the suitability of outwintering systems for
high output farms
What we did? ● 48 in-calf Holstein dairy heifers were assigned to either:
1. Outwintered on grass and grass silage (G)2. Outwintered on fodder beet and grass silage (F)3. Housed and fed grass silage and concentrate (H)
● The outwintered heifers received 35% of their DMI as big bale silage
● Heifers were outwintered for 13 weeks and housed six weeks prior to calving
● Animal performance during outwintering and in early lactation was measured
Outcomes ● LWG was high during the outwintering period but was
lower in G ● Heifer liveweight at calving was not different after F and G ● Heifer BCS change was also lower at housing and
parturition when fed G (Figure 29)
● Early lactation milk yield was not affected by outwintering treatment (Figure 30)
● Milk fat (g/kg) was lowest and milk protein (g/kg) highest in F
● Milk somatic cell count (SCC) was low but was less in G than F
● There was no negative effect of outwintering on subsequent fertility of Holstein heifers
Figure 29. Average daily LWG and BCS change during the outwintering period across the three treatments
Key messages ● In-calf Holstein heifers can be outwintered
successfully on high output dairy farms with careful planning and management
● Heifers grazing fodder beet with 35% of dry matter intake (DMI) as grass silage, can obtain target LWG in winter conditions, provided allocation of feed is accurate and animal performance is monitored regularly
● Heifers fed grass and grass silage may have difficulty maintaining LWG and BCS, particularly during January and February and if conditions are very wet
● Supplementation with concentrates may be required
Check out further information on Managing outwintered animals at dairy.ahdb.org.uk
0
20
F
40
60
80
100
120
140
160
0
Milk (kg/day)
Milksolids (kg/day)
Fat (g/kg)
Fat (kg/day)
Protein (g/kg) SCC (103/ml)
Protein (kg/day)
0.5
1
1.5
2
2.5
G H
Figure 30. The effect of outwintering in-calf heifers on milk yield and quality during early first lactation

23
% o
f req
uire
men
ts
Overfeeding
Sodium
Potass
iumCalc
iumMag
nesiu
mPho
spho
rusCop
per
Zinc
0
50
100
150
200
250
300
0Blocks Boluses Mins Drench Injection Water
10
20
30
40
50
60
% F
arm
s
Mineral requirements of dairy cowsLiam Sinclair Harper Adams University
Are GB dairy farms feeding too much minerals?
● Mineral levels being fed on 50 farms in the Midlands and North of England were investigated (Figure 31)
● Samples of TMR, concentrate, forage and water were analysed for the high- and low-yielding groups
● Contributions from additional sources (eg bolus, free access minerals) were calculated (Figure 32)
● On average, cows are fed minerals well above requirements (Figure. 33)
The majority of surveyed farms used supplementary minerals
Too much copper ● Under normal conditions, copper in the total ration
should be formulated to a maximum of 20mg/kg DM ● 62% of farms were feeding above 20mg/kg DM and 8%
above the max. permitted level of 40mg/kg DM ● Feeding too much copper is a risky practice that can
be fatal for dairy cows ● On the other hand, copper deficiency is one of the
most common mineral issues seen at Vet Investigation Centres
● Most of the copper deficiency problems in the UK are due to the effects of mineral antagonists such as molybdenum, sulphur and iron
● The farms who fed high level of copper were not those with high molybdenum levels, so the copper excess was not justified by the presence of antagonists
● Mineral testing of feeds and forages is key to provide a proper supplementation and to avoid serious health consequences
● If excess dietary copper is suspected, biopsies of cull cow livers can be more helpful than blood samples in confirming the diagnosis
Farm location
Figure 32. Average intake of some major and trace minerals on 50 dairy farms, expressed as a percentage of NRC (2001) require-ments
Figure 33. Supplementary sources of minerals in addition to that in the concentrates or TMR on 50 dairy farms
Key messages ● Minerals are a small but key component of the
diet, affecting cow performance, health, fertility and welfare
● Some minerals are required in g/kg and some in mg/kg. The amount needed does not reflect their importance to the cow
● Minerals interact with each other, making correct feeding levels more complex
● Overfeeding minerals is a common practice in Great Britain, but it is unnecessary: it can be also very costly and sometimes even unsafe for the cows and the environment
● Copper can be fatal if fed above requirements ● Farmers, nutritional advisers and vets should all be
involved in mineral nutrition but one person should have overall responsibility
● All sources of mineral supply (eg water, bolus, free access) should be taken into account
● Assessing mineral requirements on a farm should start with a forage analysis

24
MS
Maizesilagebased
Maizesilage +
antagonists(Mo and S)
Grasssilage
56 cows, 35 days in milk, 14 weeks
Grasssilage +
antagonists(Mo and S)
MS+ GS GS+
38.1 40.6 38.9 37.9
05
1015202530354045
MS MS+ GS GS+ MS MS+ GS GS+
23.5 24.0 22.620.5
0
5
10
15
20
25
30
Kg/d
ay
Kg/d
ay
10.0
12.0
14.0
16.0
0 2 4 6 8 10 12 14
GSGS+
MS+MS
Plas
ma
Cu, u
mol
/L
Week of study
Copper status and milk production: Effect of copper antagonists and forage sourceLiam Sinclair, Sandy MacKenzie and Steph Wilson Harper Adams University
How are intake and milk production affected? ● Cows fed MS ate more dry matter than those fed GS ● Milk production was similar among groups ● Adding antagonists reduced intake and milk yield but
only in GS fed cows
How is the animals copper status affected? ● Blood Cu levels were similar for all groups
● High levels of antagonists reduced the liver Cu only in cows fed GS+ (Figure 37)
Figure 35. Effect of diet on milk yield (left) and dry matter intake (right)
Figure 36. Effect of dietary treatment on blood Cu levels over time
300350400450500550600650
Wk 0 Wk 14
Mg
Cu/
kg D
M L
oive
r
GS
GS+
MS+
MS
Figure 37. Effect of diets on liver Cu concentrations at Week 0 and 14Figure 34. Four feeding groups (all received approx. 20mg Cu/kg DM)
Key messages ● Copper (Cu) is an essential trace mineral for normal
animal productivity, health and fertility ● Feeding too little Cu results in symptoms of
deficiency but feeing too much can affect health and in many instances be fatal
● Other minerals in the diet, especially sulphur (S) and molybdenum (Mo), interact strongly with Cu and reduce its availability to the animal (antagonists)
● Forage source in early lactation diets (Grass Silage – GS or Maize Silage – MS) also plays a key role in these interactions
● High dietary S and Mo in GS-based rations can lead to a reduced intake, higher milk cell counts and a lower Cu status
● For dairy cows fed a MS-based ration, high dietary levels of S and Mo have much less of an effect on performance or liver copper levels
● The mechanism for this effect is not clear: AHDB is currently funding other work to understand the reasons and provide practical advice
● When formulating a diet, it is therefore essential to take into account the forage source and the mineral content of all feeds to provide a correct supplementation of Cu
● Blood Cu is often not very useful in determining Cu status unless very deficient: a better practice is measuring liver Cu level in cull cows
25
B
Cu as bolus Cu as bolus +antagonists
Free Cu
56 cows, 35 days in milk, 14 weeks
Free Cu +antagonists
B+ C C+
Cu: 19mg/kg DMS: 2.5g/kg DM
Mo: 3.2mg/kg DM
Cu: 19mg/kg DMS: 3.9g/kg DM
Mo: 10.3mg/kg DM
Cu: 20mg/kg DMS: 2.5g/kg DM
Mo: 3.1mg/kg DM
Cu: 19mg/kg DMS: 3.9g/kg DM
Mo: 10.1mg/kg DM
05
10152025303540
B- B+ C- C+ B-
23.0 22.2 22.821.1
0
5
10
15
20
25
Kg/d
ay
Kg/d
ay
34.3 34.0 33.9 33.9
B+ C- C+
300350400450500550600650
Wk 0 Wk 14
Mg
Cu/
kg D
M L
iver
B+C+
CB
0.00.10.20.30.40.50.00.70.8
0 2 4 6 8 10 12 14
C
C+
B+
BUmol
Mo/
L
Week of experiment
Copper status and milk production: Effect of copper source and antagonist levelLiam Sinclair, Sandy MacKenzie and Steph Wilson Harper Adams University
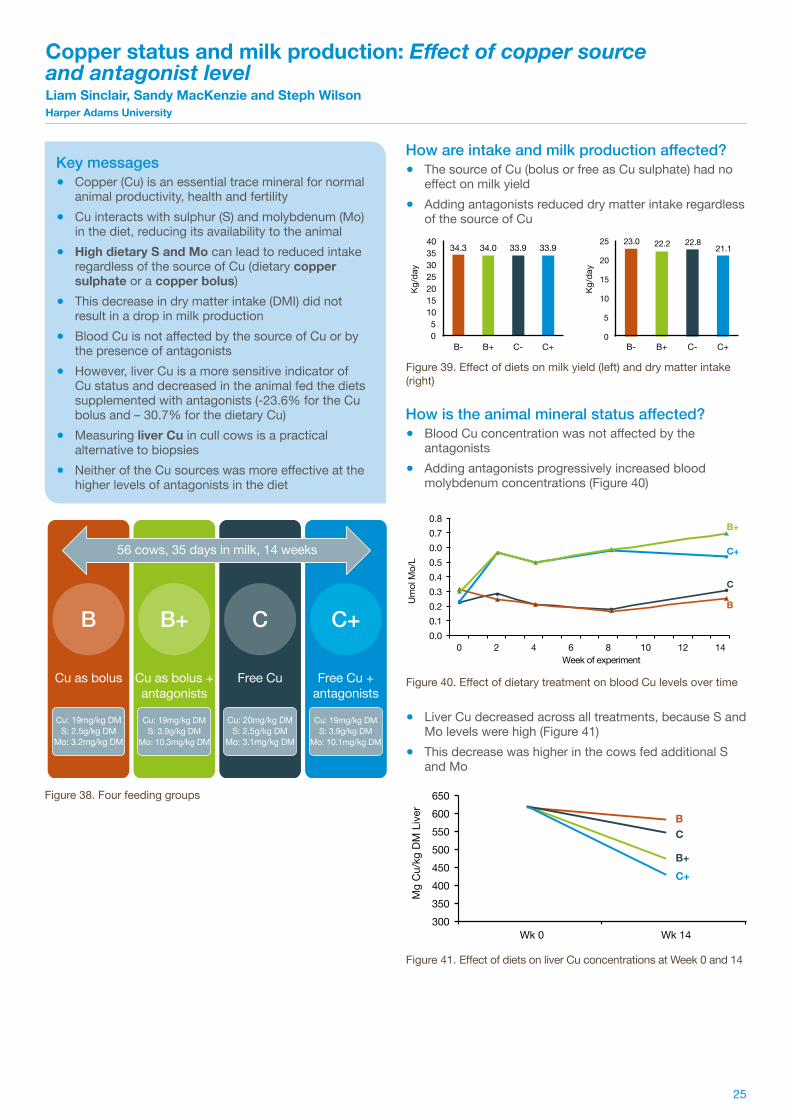
Figure 39. Effect of diets on milk yield (left) and dry matter intake (right)
Figure 40. Effect of dietary treatment on blood Cu levels over time
Figure 41. Effect of diets on liver Cu concentrations at Week 0 and 14
How are intake and milk production affected? ● The source of Cu (bolus or free as Cu sulphate) had no
effect on milk yield ● Adding antagonists reduced dry matter intake regardless
of the source of Cu
How is the animal mineral status affected? ● Blood Cu concentration was not affected by the
antagonists ● Adding antagonists progressively increased blood
molybdenum concentrations (Figure 40)
● Liver Cu decreased across all treatments, because S and Mo levels were high (Figure 41)
● This decrease was higher in the cows fed additional S and Mo
Figure 38. Four feeding groups
Key messages ● Copper (Cu) is an essential trace mineral for normal
animal productivity, health and fertility ● Cu interacts with sulphur (S) and molybdenum (Mo)
in the diet, reducing its availability to the animal ● High dietary S and Mo can lead to reduced intake
regardless of the source of Cu (dietary copper sulphate or a copper bolus)
● This decrease in dry matter intake (DMI) did not result in a drop in milk production
● Blood Cu is not affected by the source of Cu or by the presence of antagonists
● However, liver Cu is a more sensitive indicator of Cu status and decreased in the animal fed the diets supplemented with antagonists (-23.6% for the Cu bolus and – 30.7% for the dietary Cu)
● Measuring liver Cu in cull cows is a practical alternative to biopsies
● Neither of the Cu sources was more effective at the higher levels of antagonists in the diet

26
N Co
VBIVB
No added Co or vitamin B12
Vitamin B12 injection supplying 0.71mg/d pre-partumand 1.42mg/dpost-partum
Co added at0.2mg/kg DMNo vitamin B12
Vitamin B12 addedat 0.68mg/kgDM No Co
38.3 39.5 40.8 39.6
05
1015202530354045
N Co VB IVB N Co VB IVB
21.5 21.3 21.7 21.8
0
5
10
15
20
25
Kg/d
ay
Kg/d
ay
0.480.52 0.51 0.51
0
0.1
0.2
0.3
0.4
0.5
0.6
N Co VB IVB
mm
ol/l
0.40 0.40 0.41 0.44
0
0.1
0.2
0.3
0.4
0.5
0.6
N Co VB IVB
mm
ol/l
Cobalt and vitamin B12: is supplementation in the transition period necessary?Liam Sinclair1, Dammika Achchilage1, Amey Brassington2, Sarah-Jayne Williams1, Wing Yee Kwong2 and Kevin Sinclair2 1Harper Adams University, 2Nottingham University
Figure 44. Effect of supplementation on blood NEFA levels
Figure 43. Effect of diets on milk yield (left) and dry matter intake postpartum (right)
Figure 45. Effect of supplementation on BHBA blood levels
Four feeding groups56 dairy cowsFour different supplementation from eight weeks pre-partum to eight weeks post partum
How are intake and milk production affected? ● Supplementing the transition diet with Co, vitamin B12 or
injecting with vitamin B12 does not affect milk yield or dry matter intake after calving (Figure 43)
● Similarly, milk fat (4.0%) and protein (3.3%) were not different
● Digestibility of fibre and protein were similar across all treatments (data not shown)
Is metabolic status affected? ● Blood concentrations of non-esterified fatty acids
(NEFA, Figure 44) and beta-hydroxybutyric acid (BHBA, Figure 45) were not affected by the Co and vitamin B12 supplementation
● Similarly, supplementation had no effect on body condition score, blood glucose or liver fat content (data not shown)
● The metabolic status was not affected by the addition of Co and vitamin B12 to the diet or by injecting vitamin B12
Figure 42. Four feeding groups
Key messages ● Cobalt (Co) is essential for vitamin B12 synthesis in
the rumen ● Vitamin B12 is required by the cow for energy and
protein metabolism, particularly during the transition period
● Insufficient Co may also reduce diet digestibility and intake
● Co supplementation is now limited to 0.3 mg/kg DM ● This study has shown that supplementing the diet
with Co or vitamin B12 or injecting with vitamin B12 has little effect on intake, performance or diet digestibility
● Providing additional Co or vitamin B12 also had no effect on the incidence of ketosis or fatty liver
● Under normal feeding conditions, background dietary levels of Co are often adequate to meet the needs of rumen microorganisms to synthesise vitamin B12
● The new limit of 0.3mg/kg DM of added Co is unlikely to have a negative effect on dairy cow performance or health

27
Protein nutrition of the contemporary dairy cowKevin Sinclair1, Liam Sinclair2 and Phil Garnsworthy1 1Nottingham University, 2Harper Adams University
Three feeding groups
How are intake and milk production affected? ● MP supply was 1.05, 0.95 and 0.95 of production
requirements for HP, LP and LPHS, respectively ● Intake, milk yield and milk composition were similar for
all diets
How is nitrogen (N) efficiency affected? ● The cows fed HP diets were less efficient in converting
ingested N into milk protein and excreted a higher proportion of N with urine (Figure 48)
Is reproduction affected? ● Decreasing CP levels had no effect on energy balance
and metabolic status ● Reproductive performance was not affected (Figure 49)
High CP – 18%ME: 11.9MJ/kg DM
Low CP – 15%ME: 12.0MJ/kg DM
Low CP – 15%ME: 12.3MJ/kg DM
90 early lactation dairy cows
14 weeks
3 dietsHigh Protein - HP
Low Protein - LP
Low Protein High Starch - LPHS
Figure 46. Three feeding groups
42.8 41.3 42.3
Milk yield
Milk
yie
ld (k
g/da
y)
05
1015202530354045
HP LP LPHS
Figure 47. Effect of diets on milk yield
26
Days
3329
05
101520253035
HP LP LPHS
Days from calving to first oestrus
31%
19%
50%
36%
22%
42%
37%
23%
40%
% o
f ing
este
d N
exc
rete
d
020406080
100
Urine
HP LP LPHS
Faeces Milk
Figure 48. Portion of ingested N excreted in urine, faeces and milk
Key messages ● The level of crude protein (CP) in the diets of dairy
cows in GB is often higher than 18% DM ● However, research has shown no benefit to
production from feeding diets over 16% DM ● Excessive or inadequate levels of dietary protein may
worsen negative energy balance and reduce fertility ● The non-utilised protein is excreted through faeces
and urine and can damage the environment ● Our findings show that dietary CP of 15% DM is
sufficient to meet the requirements of cows producing around 40kg/day
● No detrimental effect on cow health or fertility ● Careful consideration of forage type and its
contribution to MP (metabolisable protein) supply is required
● Diets with high inclusion of maize silage in our study allowed for high levels of concentrate CP and likely promoted intake. Such high inclusions are not always possible on dairy farms
● Alternative forages to maize silage need to be studied further

28
AM Feeding
Farm 1
14% 22%
Farm 2
Feed
Los
ses
(%)
PM Feeding
Key messages ● Starlings consume around half their body weight in
food each day ● Starlings are ‘selective’ feeders, which means they
sort rations, selecting out the parts they want to eat and in doing so, changing the overall nutrient balance of the intended diet
● The daily cost of a starling infestation from feed and milk yield loss averaged £106 per 100 cows in 2012/13
● Starlings can spread bacterial infections ● Legally, only 50 starlings a year can be culled on-
farm Simple changes in daily routine can reduce
the impact of infestations Netting or various scaring tactics have proved
successful when implemented early in the season
What attracts starlings ● Exposed feed (TMR with grain,in particular maize) ● Water sources and open feed stores ● Accessible perching sites such as trees for roosting ● Starlings have also been known to return to the same
farm year after year
Morning vs afternoon feeding
● Simply switching from am to pm feeding lowers the amount of feed losses between 14% and 22%
● Feeding in the afternoon, after the birds have left the farm to roost, means the cows have up to 16 hours access to uncontaminated feed before the birds return the next morning
● Cows will rapidly adapt to any changes in their routine ● A noticeable increase in lying and cudding time was
observed during the day when feeding late afternoon ● Starting this feeding regime early in the autumn before
starlings arrive could reduce the attractiveness of the farm to starlings
● Reducing feed losses can potentially increase milk yield
Control of starlingsJo Shipton, Peter Shipton and Duncan Forbes Kingshay Farming & Conservation Ltd
Most effective control methods:
● Exclusion: using <28mm hole netting, mesh, fitted rolller blinds and doors, ventilated wall cladding ● Disturbance from farm labour, shooting to scare etc, particularly early in the morning and random
gas guns or rockets ● Fly a bird of prey (Harris Hawk or Sparrowhawk)
Most effective control approaches:
● Implement preventative measures completely and persistently before and during the migration period (October/November)
● Use of several methods of mitigation simultaneously or sequentially
Further information: View the 'Management of starling on farm' video on the AHDB Dairy website.
Figure 50. % feed losses between AM and PM feeds across two farms
For more information view the "Management of starling on farm" video which can be viewed on the AHDB Dairy website: dairy.ahdb.org.uk

29
HAU SRUC
Grass Lucerne Maize Grass Lucerne
Control 0.40 0.00 0.60 1.00 0.00
LS 1 0.20 0.20 0.60 0.75 0.25
LS 2 0.00 0.40 0.60 0.50 0.50
LS 3 0.00 0.60 0.40 0.25 0.75
Key messages ● At both sites, the requirement for purchased protein
was reduced when lucerne was included in the diet but purchased energy was required at SRUC
● The effect of including Lucerne silage in the diet is largely dependent on the quality of the forage itself and the quality of the forage it replaces
● Farmers looking to incorporate Lucerne silage in their diet should base their decision on the ability of the farm to grow the crop and likely fertiliser savings rather than improvements in yield or milk quality
Lucerne as a replacement for grass silage in the diet of the dairy cowLiam Sinclair2, Stephanie Wilson2, Dave Roberts1 and Jennifer Flockhart1 1SRUC Dairy Research and Innovation Centre and 2Harper Adams University
Background ● There has been a significant increase in the cost of
protein feeds in recent years ● There is also a move to reduce the reliance of imported
protein feeds into the UK ● The use of home-grown forages like lucerne silage can
help offset both these factors
Purpose of work ● To test the effects of including Lucerne silage (LS) on
animal performance when diets contained either grass (GS) or maize silage (MS) as the forage source
What did we do? ● 20 dairy cows at Harper Adams (HAU) and 16 at
Scoland's Rural College (SRUC) were used ● Cows received various levels of lucerne, grass and maize
silage in the diet (Table 4) ● Animal intake and production were monitored
Outcomes ● Including LS at 0.50 of forage DM or more increased
intake (DMI) by 3.5kg/ day at SRUC (Figure 51) ● LS did not affect DMI at HAU except at the highest level
of inclusion, where it was reduced by 1.2kg/day
● Milk production was not affected by treatment at either site (Figure 52)
● Milk quality yields were also not affected by diet
● Feed costs per kg milk produced increased as LS inclusion increased at SRUC (Figure 53)
● This was due to the higher DMI as LS replaced GS with no improvement in milk production
Table 4. Ratios of Grass, lucerne and maize in the forage DM
HAU SRUC
DMI (
kg/d
ay)
0
5
10
15
20
25
Control LS 1 LS 2 LS 3
24.5 24.9 24.5 23.4 19.8 21.2 23.4 24.6
Figure 51. Dry matter intake at HAU and SRUC
HAU SRUC
Milk
yie
ld (k
g/da
y)
05
1015202530354045
42.2 40.7 40.2 40.5 32.0 32.9 32.7 33.2
Control LS 1 LS 2 LS 3
Figure 52. Milk production at HAU and SRUC for the experiment
HAU SRUCFeed
cos
ts (3
/kg
milk
pro
duce
ed)
00.020.040.060.080.1
0.120.140.16
0.11 0.12 0.12 0.11 0.11 0.12 0.14 0.15
Control LS 1 LS 2 LS 3
Figure 53. Total feed costs (£/kg milk produced) for HAU and SRUC

30
Intake Milk yield
Kg/d
ay
0
5
10
15
20
25
30
35
23.7 22.3 26.4 26 32.5 30.6 35.2 33.9
HLS HLL LLS LLL
Sample time
pH o
f rum
en fl
uid
LLS
5.85.96.06.16.26.36.46.56.66.7
9.30 11.30 13.30 15.30 17.30 19.30 21.30
LLL HLS HLL
Effect of lucerne inclusion level and chop length on performance of dairy cowsAnna Thomson and Chris Reynolds University of Reading
Background ● The use of home-grown forages like Lucerne can help
offset the requirement for the UK to import protein feeds and chemical nitrogen (N) fertiliser
● However, there is little known about how inclusion level or chop length affects milk yield and rumination parameters of dairy cows
Purpose of work ● To test the effect of replacing maize silage with Lucerne
silage on:a. Production (Experiment 1: 16 mid-lactation dairy cows)b. Digestion and rumen function (Experiment 2)
What did we do? ● In both experiments lucerne was harvested at the 10%
flowering stage and cut to two lengths ● These were included either at 25% or 75% of the forage
DM to give four diets:HLS: 75:25 lucerne: maize silage, short chop lengthHLL: 75:25 lucerne: maize silage, long chop lengthLLS: 25:75 lucerne: maize silage, short chop lengthLLL: 25:75 lucerne: maize silage, long chop length
Outcomes ● Intake was lower for cows offered higher levels of
Lucerne and also where chop length was longer ● Milk production followed a similar trend (Figure 55)
● Milk fat (3.76%) was not affected by diet ● Milk protein was higher where Lucerne was included at
0.75 of the forage (3.11 vs. 3.04%)
● Rumen pH and ammonia were higher at higher lucerne inclusion levels with HLL having greatest effect on both (Figures 56 and 57)
● The HLL diet had the lowest VFA concentrations reflecting the level of intake and digestibility of that diets which were also lowest amongst the treatments
● Shortening the chop length (HLS & LLS) improved diet digestibility and VFA concentrations
● Shortening the chop length also reduced diet sorting
Figure 55. Dry matter intake and milk production for Experiment 1
Figure 56. Rumen pH taken during Experiment 2 at various time points
Sample time
Amm
onia
con
cent
ratio
n (m
g/L)
LLS
0.0
50.0
100.0
150.0
200.0
250.0
9.30 11.30 13.30 15.30 17.30 19.30 21.30
LLL HLS HLL
Figure 57. Rumen ammonia concentration during Experiment 2
Figure 54. A. Lucerne B. Penn State Separator C. Cow in feed efficiency trough
Key messages ● The decision to grow Lucerne as a replacement for
grass silage to feed along with maize silage should be based on the suitability to grow the crop and potential savings in fertiliser and feed costs rather than an improvement in milk yield or quality
● Including lucerne in the diet allowed for a reduction in purchased proteins, consistent with other studies within the Research Project
● Where high levels of lucerne need to be included in the diet (0.75 of forage) then short chop lengths are advisable
● In high yielding cows receiving maize silage, inclusion of lucerne at between 20–60% had little benefit in comparison to a good first cut silage
B CA

31
Immediateanalysis
Ambient:air present
Ambient:air excluded
Ambient:breathable
Chilled:air present
Chilled:air excluded
Chilled:breathable
Dry
mat
ter (
g kg
1 )
180
181
182
183
184
185
186
187
188
The effect of sample handling and storage on the nutritional value of fresh grassAndrew Dale, Alan Gordon, John Archer and Conrad Ferris Agri-Food and Biosciences Institute, Northern Ireland
Taking a grass sample for analysis1. Take samples early in the week2. Aim to cut samples immediately
before posting3. Using scissors, cut a large handful
of grass to your target residual at a minimum of six locations across the paddock
4. Place into a bucket and mixed gently5. Take a subsample from the bucket and place into the
sample bag avoiding overfilling the bag
6. Gently squeeze the air out of the bag and seal7. Send to the lab via first class postNB: Samples which are taken more than two hours before posting should be stored in the refrigerator in a sealed bag.
Background ● Fresh grass analysis, by supplying information on grass
dry matter (DM), crude protein (CP), water soluble carbohydrate (WSC) and metabolisable energy (ME) content, can be an important tool in managing grazing cow diets throughout the season
● Near Infrared Reflectance Spectroscopy (NIRS) is a cheap and reliable laboratory technique for analysing the nutritional value of forages
● However, between the time of sampling and analysis in the laboratory, plant degradation processes may take effect, resulting in poor analysis results
Purpose of work ● To examine the effect of
harvesting technique and storage conditions on the nutritional value of fresh grass
What did we do?An established perennial ryegrass sward was managed under a simulated grazing regime during summer 2015Grass quality was analysed at four of the eight grass harvests throughout the season
● At each harvest, 26 treatments were examined: ● Harvesting technique (pluck or cut) ● Storage duration (immediate, 24-hour or 48-hour
analysis) ● Storage temperature (ambient (average, 15.2oC) or
chilled (4oC)) ● Storage conditions (air present, air excluded or
breathable)
● The effect of storage duration, temperature and conditions were also examined for silage sward samples
● All samples were analysed fresh using NIRS for DM, CP, WSC, acid detergent fibre (ADF) and ME
OutcomesFor simulated grazing swards:
● Hand plucked samples tended to have higher CP (8g/kg DM) and ME content than cut samples
● Changes in grass quality due to storage were small however storing samples under ambient temperatures, in breathable bags for 48 hours led to the greatest sample deterioration (Figure 58)
● Samples stored for 48-hours had a lower WSC (9g/kg DM) and ME content (0.12MJ/kg DM)
● Samples stored at ambient temperature had a lower WSC (12g/kg DM) and ME content (0.17MJ/kg DM)
● There was limited effect of sampling or storage on CP content
● Grass from silage swards did not deteriorate if stored for 48 hours but had a higher WSC (18g/kg DM) and ME content (0.26MJ/kg DM) when stored chilled
Figure 58. The impact of storage time, storage temperature and the presence of air during storage on grass dry matter content from grass from simulated grazing swards
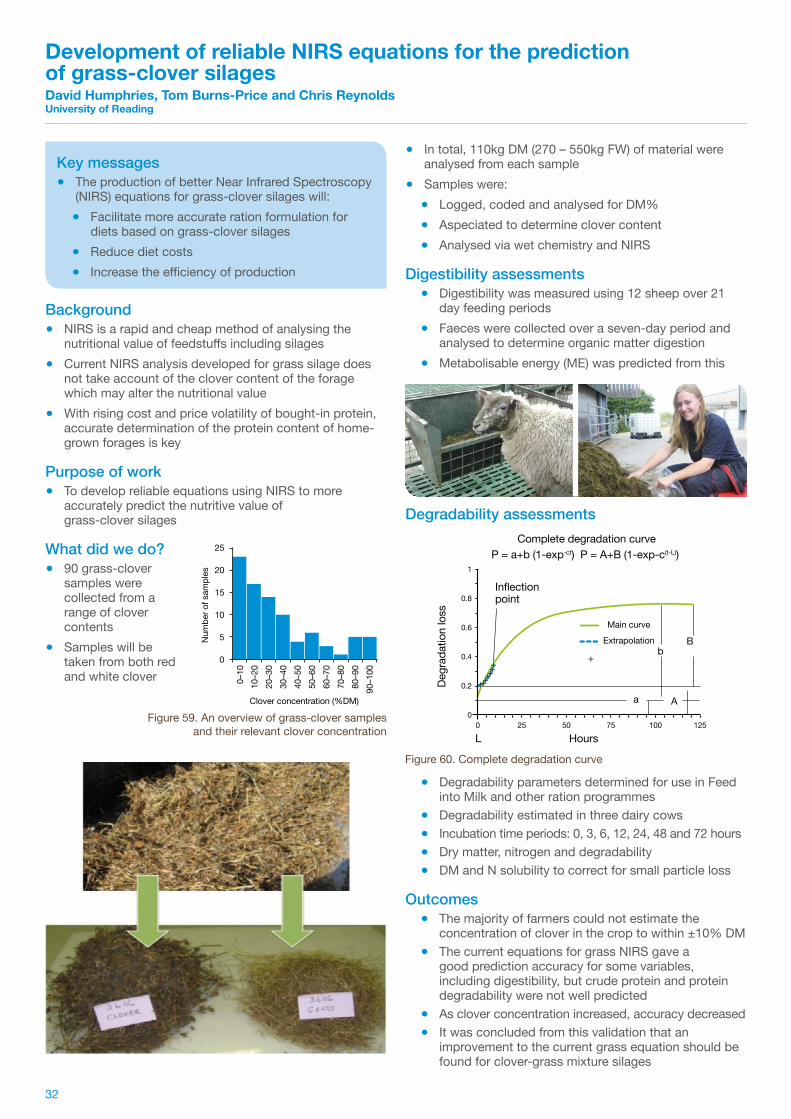
32
Num
ber o
f sam
ples
Clover concentration (%DM)
0
0–10
10–2
020
–30
30–4
040
–50
50–6
060
–70
70–8
080
–90
90–1
00
5
10
15
20
25
Degr
adat
ion
loss
HoursL
Complete degradation curve
Main curve
Extrapolation
Inflectionpoint
P = a+b (1-exp-ct) P = A+B (1-exp-c(t-L))
00 25 50 75 100 125
0.2
0.4
0.6
0.8
1
B
A
b
a
Development of reliable NIRS equations for the prediction of grass-clover silagesDavid Humphries, Tom Burns-Price and Chris Reynolds University of Reading
Background ● NIRS is a rapid and cheap method of analysing the
nutritional value of feedstuffs including silages ● Current NIRS analysis developed for grass silage does
not take account of the clover content of the forage which may alter the nutritional value
● With rising cost and price volatility of bought-in protein, accurate determination of the protein content of home-grown forages is key
Purpose of work ● To develop reliable equations using NIRS to more
accurately predict the nutritive value of grass-clover silages
What did we do? ● 90 grass-clover
samples were collected from a range of clover contents
● Samples will be taken from both red and white clover
● In total, 110kg DM (270 – 550kg FW) of material were analysed from each sample
● Samples were: ● Logged, coded and analysed for DM% ● Aspeciated to determine clover content ● Analysed via wet chemistry and NIRS
Digestibility assessments ● Digestibility was measured using 12 sheep over 21
day feeding periods ● Faeces were collected over a seven-day period and
analysed to determine organic matter digestion ● Metabolisable energy (ME) was predicted from this
Degradability assessments
● Degradability parameters determined for use in Feed into Milk and other ration programmes
● Degradability estimated in three dairy cows ● Incubation time periods: 0, 3, 6, 12, 24, 48 and 72 hours ● Dry matter, nitrogen and degradability ● DM and N solubility to correct for small particle loss
Outcomes ● The majority of farmers could not estimate the
concentration of clover in the crop to within ±10% DM ● The current equations for grass NIRS gave a
good prediction accuracy for some variables, including digestibility, but crude protein and protein degradability were not well predicted
● As clover concentration increased, accuracy decreased ● It was concluded from this validation that an
improvement to the current grass equation should be found for clover-grass mixture silages
Figure 59. An overview of grass-clover samples and their relevant clover concentration
Figure 60. Complete degradation curve
Key messages ● The production of better Near Infrared Spectroscopy
(NIRS) equations for grass-clover silages will: ● Facilitate more accurate ration formulation for
diets based on grass-clover silages ● Reduce diet costs ● Increase the efficiency of production
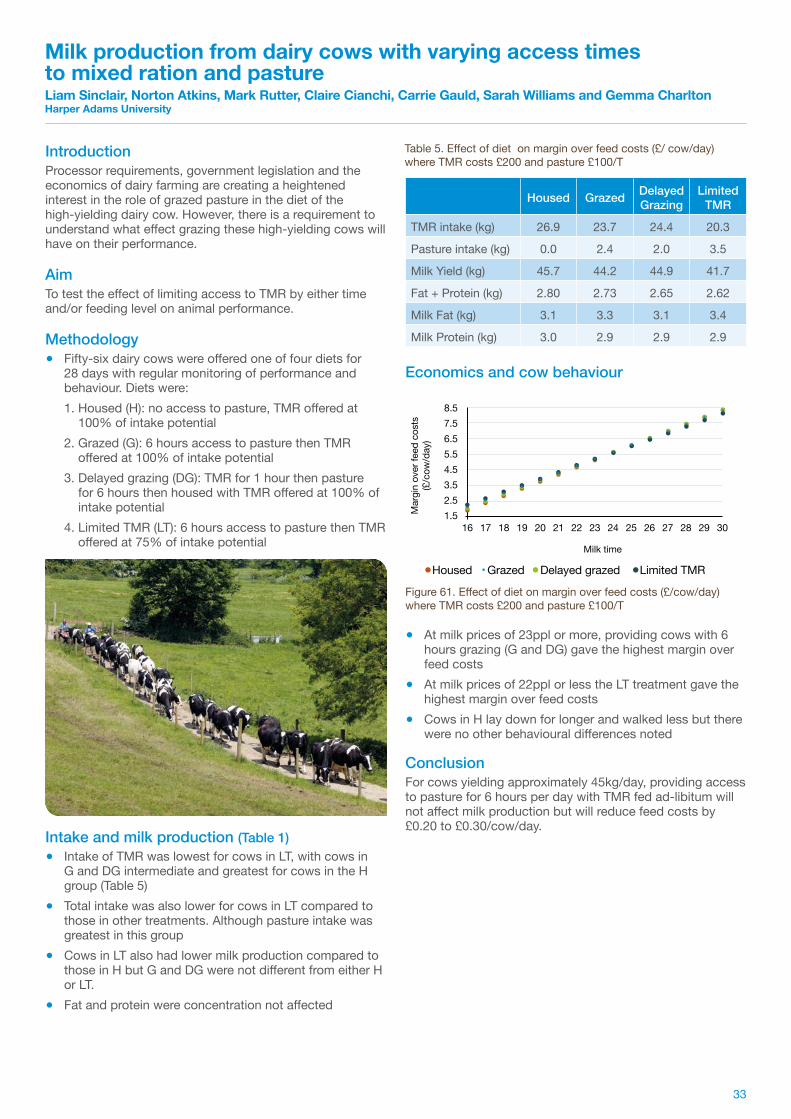
33
Milk time
Housed
Mar
gin
over
feed
cos
ts(£
/cow
/day
)
1.52.53.54.55.56.57.58.5
16 17 18 19 20 21 22 23 24 25 26 27 28 29 30
Grazed Delayed grazed Limited TMR
Housed Grazed Delayed Grazing
Limited TMR
TMR intake (kg) 26.9 23.7 24.4 20.3
Pasture intake (kg) 0.0 2.4 2.0 3.5
Milk Yield (kg) 45.7 44.2 44.9 41.7
Fat + Protein (kg) 2.80 2.73 2.65 2.62
Milk Fat (kg) 3.1 3.3 3.1 3.4
Milk Protein (kg) 3.0 2.9 2.9 2.9
Milk production from dairy cows with varying access times to mixed ration and pastureLiam Sinclair, Norton Atkins, Mark Rutter, Claire Cianchi, Carrie Gauld, Sarah Williams and Gemma Charlton Harper Adams University
IntroductionProcessor requirements, government legislation and the economics of dairy farming are creating a heightened interest in the role of grazed pasture in the diet of the high-yielding dairy cow. However, there is a requirement to understand what effect grazing these high-yielding cows will have on their performance.
AimTo test the effect of limiting access to TMR by either time and/or feeding level on animal performance.
Methodology ● Fifty-six dairy cows were offered one of four diets for
28 days with regular monitoring of performance and behaviour. Diets were:1. Housed (H): no access to pasture, TMR offered at
100% of intake potential2. Grazed (G): 6 hours access to pasture then TMR
offered at 100% of intake potential3. Delayed grazing (DG): TMR for 1 hour then pasture
for 6 hours then housed with TMR offered at 100% of intake potential
4. Limited TMR (LT): 6 hours access to pasture then TMR offered at 75% of intake potential
Intake and milk production (Table 1) ● Intake of TMR was lowest for cows in LT, with cows in
G and DG intermediate and greatest for cows in the H group (Table 5)
● Total intake was also lower for cows in LT compared to those in other treatments. Although pasture intake was greatest in this group
● Cows in LT also had lower milk production compared to those in H but G and DG were not different from either H or LT.
● Fat and protein were concentration not affected
Economics and cow behaviour
● At milk prices of 23ppl or more, providing cows with 6 hours grazing (G and DG) gave the highest margin over feed costs
● At milk prices of 22ppl or less the LT treatment gave the highest margin over feed costs
● Cows in H lay down for longer and walked less but there were no other behavioural differences noted
ConclusionFor cows yielding approximately 45kg/day, providing access to pasture for 6 hours per day with TMR fed ad-libitum will not affect milk production but will reduce feed costs by £0.20 to £0.30/cow/day.
Table 5. Effect of diet on margin over feed costs (£/ cow/day) where TMR costs £200 and pasture £100/T
Figure 61. Effect of diet on margin over feed costs (£/cow/day) where TMR costs £200 and pasture £100/T

34
No compactionTrampledTractor
0-0.02-0.04-0.06-0.08
0.020.040.060.080.100.12
2012 2013
Bulk
den
sity
(g/c
ms)
No compaction
Com
pact
ion
Even
t
Wat
er F
illed
Pore
Spa
ce (%
)
50
60
70
80
90
100
Dec Jan Feb Mar Apr May Jun Jul Aug Sep Oct
Trampled Tractor
No compactionTrampledTractor
Year 10
1000
2000
3000
4000
Year 2
Firs
t cut
yie
ld (k
g DM
/ha)
Assessing the impact of soil compactionPaul Hargreaves, Bruce Ball and Dave Roberts SRUC Dairy Research and Innovation Centre
What is soil compaction? ● Compaction occurs when soil
particles are compressed, reducing pore spaces which carry air and water through the soil
● An estimated 70% of grassland soils in England and Wales exhibit severe or moderate soil compaction (ADAS, 2013)
● Compaction in soil can be identified by large, blocky angular aggregates, mottling, poor smells and restricted root growth
Purpose of work ● To assess the impact of soil compaction on grass yield
and soil health ● To investigate how compaction from animals and
machinery differs
What did we do? ● A grassland field at Harper Adams University (HAU) and
SRUC was subdivided into three treatments: 1. No compaction2. Tractor compaction 3. Animal trampling
● Compaction was applied in spring (SRUC) or autumn (HAU) each year
● Plots were managed as a three cut silage system ● Sward performance, soil health and nutrient efficiency
were measured
Outcomes ● A greater number of large, angular aggregates were
found in the compacted plots ● These extended deeper into the soil profile with the
tractor traffic compared with the animal compaction
● Compaction resulted in an increase in soil bulk density reducing pore spaces for air (Figure 65)
● Compaction also increased water retention in the soil by up to 20% throughout the season (Figure 66)
At first cut: ● Trampling compaction reduced grass DM yield by 14% ● Tractor compaction reduced grass DM yield by 22%
Figure 64. Soil profile following different compaction: A. Trampling compaction, B. Tractor compaction, C. No compaction
Figure 65. Impact of compaction on change in soil bulk density (0–10cm) from pre-treatment reference conditions in October 2011
Figure 66. Impact of compaction on soil water filled pore space (%) at 0-10cm from December 2012 – October 2013 at SRUC
Figure 67. Impact of compaction on first cut grass DM yield at SRUC
Figure 62. Soil compaction: A. Loose, friable soil,
B. Compacted soil
Key messages ● Compaction increases soil bulk density reducing
pores space and impacting on water flow, nutrient efficiency and oxygenation of the soil
● Compaction also increases water retention potentially impacting on soil trafficability
● Grass yield at first cut can be significantly reduced by compaction
A
A
B
A B
B C
Figure 63. Types of compaction: A. Cattle trampling, B. Tractor compaction
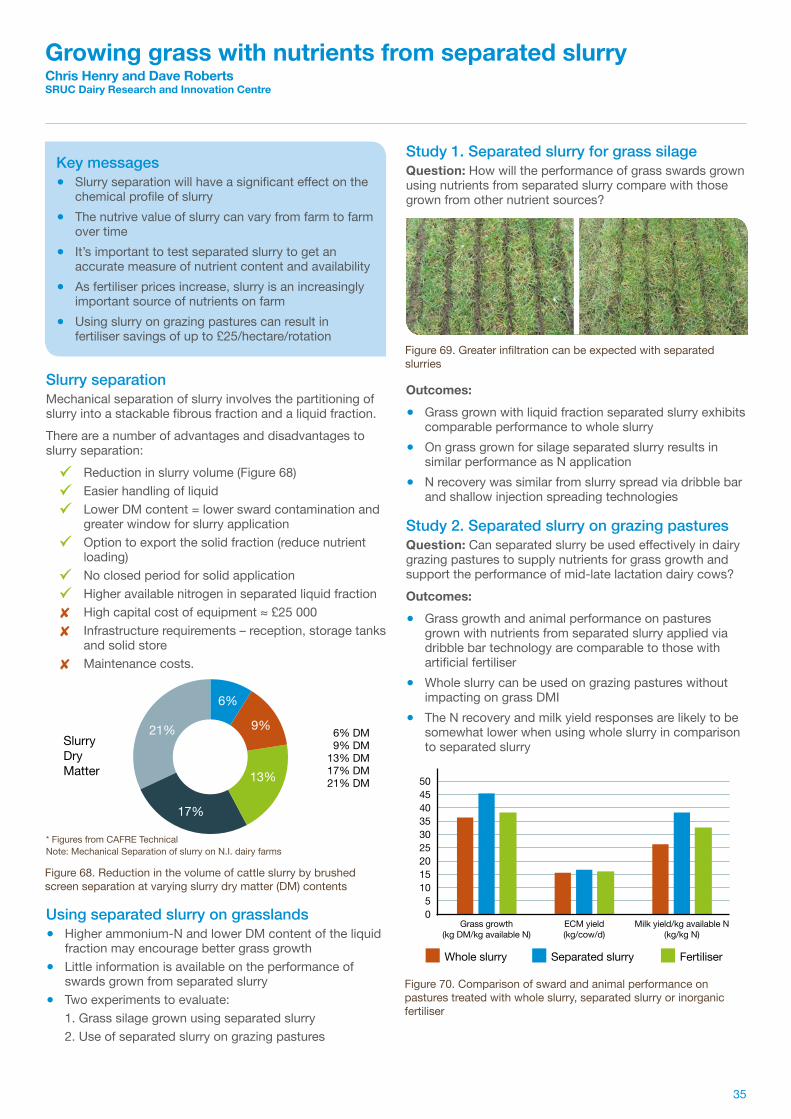
35
Grass growth(kg DM/kg available N)
Milk yield/kg available N(kg/kg N)
ECM yield(kg/cow/d)
05
101520253035404550
Whole slurry Separated slurry Fertiliser
SlurryDryMatter
6% DM9% DM
13% DM17% DM21% DM
21%
6%
9%
13%
17%
Growing grass with nutrients from separated slurryChris Henry and Dave Roberts SRUC Dairy Research and Innovation Centre
Slurry separationMechanical separation of slurry involves the partitioning of slurry into a stackable fibrous fraction and a liquid fraction.There are a number of advantages and disadvantages to slurry separation: Reduction in slurry volume (Figure 68) Easier handling of liquid Lower DM content = lower sward contamination and
greater window for slurry application Option to export the solid fraction (reduce nutrient
loading) No closed period for solid application Higher available nitrogen in separated liquid fraction 8 High capital cost of equipment ≈ £25 000 8 Infrastructure requirements – reception, storage tanks
and solid store 8 Maintenance costs.
* Figures from CAFRE Technical Note: Mechanical Separation of slurry on N.I. dairy farms
Using separated slurry on grasslands ● Higher ammonium-N and lower DM content of the liquid
fraction may encourage better grass growth ● Little information is available on the performance of
swards grown from separated slurry ● Two experiments to evaluate:
1. Grass silage grown using separated slurry2. Use of separated slurry on grazing pastures
Study 1. Separated slurry for grass silageQuestion: How will the performance of grass swards grown using nutrients from separated slurry compare with those grown from other nutrient sources?
Outcomes: ● Grass grown with liquid fraction separated slurry exhibits
comparable performance to whole slurry ● On grass grown for silage separated slurry results in
similar performance as N application ● N recovery was similar from slurry spread via dribble bar
and shallow injection spreading technologies
Study 2. Separated slurry on grazing pasturesQuestion: Can separated slurry be used effectively in dairy grazing pastures to supply nutrients for grass growth and support the performance of mid-late lactation dairy cows?Outcomes:
● Grass growth and animal performance on pastures grown with nutrients from separated slurry applied via dribble bar technology are comparable to those with artificial fertiliser
● Whole slurry can be used on grazing pastures without impacting on grass DMI
● The N recovery and milk yield responses are likely to be somewhat lower when using whole slurry in comparison to separated slurry
Figure 68. Reduction in the volume of cattle slurry by brushed screen separation at varying slurry dry matter (DM) contents
Figure 69. Greater infiltration can be expected with separated slurries
Figure 70. Comparison of sward and animal performance on pastures treated with whole slurry, separated slurry or inorganic fertiliser
Key messages ● Slurry separation will have a significant effect on the
chemical profile of slurry ● The nutrive value of slurry can vary from farm to farm
over time ● It’s important to test separated slurry to get an
accurate measure of nutrient content and availability ● As fertiliser prices increase, slurry is an increasingly
important source of nutrients on farm ● Using slurry on grazing pastures can result in
fertiliser savings of up to £25/hectare/rotation
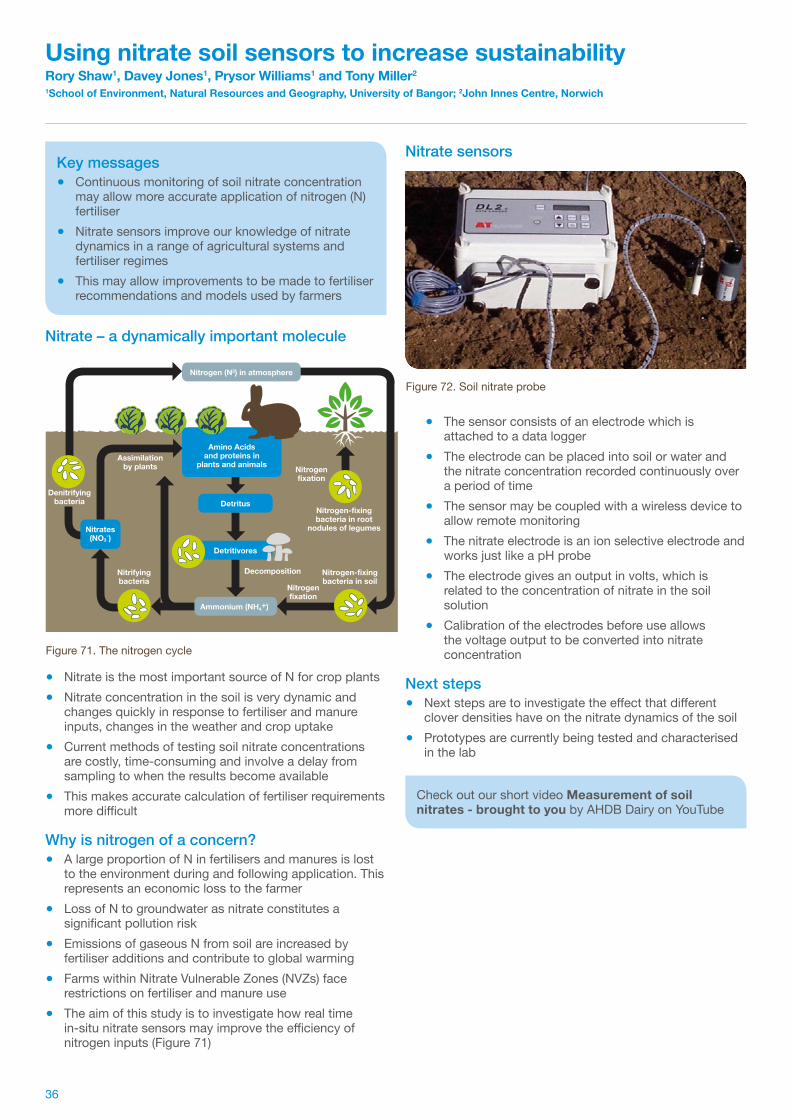
36
Nitrogen (N2) in atmosphere
Detritus
Nitrates(NO3
-)
Nitrogenfixation
Nitrogenfixation
Decomposition
Nitrogen-fixingbacteria in root
nodules of legumes
Nitrogen-fixingbacteria in soil
Assimilationby plants
Denitrifyingbacteria
Detritivores
Nitrifyingbacteria
Amino Acidsand proteins in
plants and animals
Ammonium (NH4+)
Using nitrate soil sensors to increase sustainabilityRory Shaw1, Davey Jones1, Prysor Williams1 and Tony Miller2 1School of Environment, Natural Resources and Geography, University of Bangor; 2John Innes Centre, Norwich
Nitrate – a dynamically important molecule
● Nitrate is the most important source of N for crop plants ● Nitrate concentration in the soil is very dynamic and
changes quickly in response to fertiliser and manure inputs, changes in the weather and crop uptake
● Current methods of testing soil nitrate concentrations are costly, time-consuming and involve a delay from sampling to when the results become available
● This makes accurate calculation of fertiliser requirements more difficult
Why is nitrogen of a concern? ● A large proportion of N in fertilisers and manures is lost
to the environment during and following application. This represents an economic loss to the farmer
● Loss of N to groundwater as nitrate constitutes a significant pollution risk
● Emissions of gaseous N from soil are increased by fertiliser additions and contribute to global warming
● Farms within Nitrate Vulnerable Zones (NVZs) face restrictions on fertiliser and manure use
● The aim of this study is to investigate how real time in-situ nitrate sensors may improve the efficiency of nitrogen inputs (Figure 71)
Nitrate sensors
● The sensor consists of an electrode which is attached to a data logger
● The electrode can be placed into soil or water and the nitrate concentration recorded continuously over a period of time
● The sensor may be coupled with a wireless device to allow remote monitoring
● The nitrate electrode is an ion selective electrode and works just like a pH probe
● The electrode gives an output in volts, which is related to the concentration of nitrate in the soil solution
● Calibration of the electrodes before use allows the voltage output to be converted into nitrate concentration
Next steps ● Next steps are to investigate the effect that different
clover densities have on the nitrate dynamics of the soil ● Prototypes are currently being tested and characterised
in the lab
Figure 71. The nitrogen cycle
Figure 72. Soil nitrate probe
Key messages ● Continuous monitoring of soil nitrate concentration
may allow more accurate application of nitrogen (N) fertiliser
● Nitrate sensors improve our knowledge of nitrate dynamics in a range of agricultural systems and fertiliser regimes
● This may allow improvements to be made to fertiliser recommendations and models used by farmers
Check out our short video Measurement of soil nitrates - brought to you by AHDB Dairy on YouTube

37
Nitrogen application rate (kg/ha)
Annu
al d
ry m
atte
r yie
ld (t
onne
/ha)
SEAGOE (T)
56789
1011121314
100 200 300 400
ABERGREEN AUBISQUE (T)
MONTOVA (T) PREMIUM RODRIGO
Cocksfoot PRG PRG (T) Timothy
DMI (
kg/d
ay)
05
1015202530354045
13.9
4
2.9
13.9 13.9 13.8
5.9 6.4 7.45
4246
Grass + clover yield (t DM/ha) Clover yield (t DM/ha) Clover contribution (%)
N fertilisation regime (kg N per ha)100 200 400
1 Seagoe (T) Seagoe (T) Seagoe (T)
2 Aubisque (T) Aubisque (T) Aubisque (T)
3 Rodrigo Rodrigo Rodrigo
4 Premium Abergreen Abergreen
5 Abergreen Premium Premium
6 Montova (T) Montova (T) Montova (T)(T) = tetraploid cultivar. All others diploid
Key messages ● Using the latest grass
and clover varieties can increase nutrient use efficiency and improve sward quality and yield
● The Recommended Grass and Clover List (RGCL) outlines the top varieties for performance and disease resistance suited to GB conditions
● Select companion grasses carefully, depending on the required clover levels
● The current RGCL protocols are applicability for lower input conditions
● Use the RGCL online tool to identify suitable varieties: dairy.ahdb.org.uk/rgcl
Making the most of grass and cloverJoanna Matthews1, Simon Kerr1, Debbie McConnell2 and Liz Genever2
1National Institute of Agricultural Botany, 2AHDB
Purpose of work ● To evaluate the applicability of the RGCL to lower input
systems ● Currently genetic potential is explored by testing
varieties under high nutrient inputs but little is known about how varieties perform under lower nutrient conditions
● To assess how clovers perform alongside different grass varieties
What did we do? ● Plots were sown at three sites (Devon, Shropshire and
Yorkshire), over three years and managed under silage and simulated grazing protocols
● Trials continued throughout 2015Ryegrass
● Six perennial ryegrasses (Perennial Ryegrass (PRG); three tetraploid, three diploid) were managed under three rates of N application: ● 400kg N/ha ● 200kg N/ha ● 100kg N/ha
Clover ● Two medium leaf white clover varieties were sown in a
mixture with either Perennial Ryegrass (PRG), Cocksfoot or Timothy
● Plots received 200kg N/ha
Outcomes
● Under silage management there was an average 23kg DM grass response to each kilogram of N applied
● Preliminary analysis shows no significant interaction between nitrogen input and varieties
● The findings indicated that the RGCL system is representative for lower fertiliser regimes
Clover ● The contribution of clover varied between grass species
and accounted for 31–58.3% of total annual yield (Table 6) ● Growth habits of different grass species appeared to
dictate clover patterns ● When established with late heading timothy clover
contribution was highest
Figure 73. Annual DM yield of six perennial ryegrass varieties grown under three nitrogen application rates
Table 6. PRG varieties ranked according to total annual silage yield under varying applications of nitrogen
Figure 74. Impact of companion grass on white clover yield and contribution under silage management
Recommended Grass and Clover Lists
2017/18
Handbook

38
Annu
al D
M y
ield
(kg/
ha)
0
2000
4000
6000
8000
4808 5633 6655 6693
890 748 1714 1355
Conventionalclover
Clover Grass
Low Pclover
Conventionalclover
Low Pclover
0kg P/ha/yr 175kg P/ha/yr
From root to rumen: Nutrient efficient grass and clover varietiesAthole Marshall, David Lloyd and Jon Moorby IBERS, Aberystwyth University
Introduction ● With rising fertiliser costs, and greater focus on reducing
losses to the environment, improving nutrient use efficiency is increasingly important in livestock systems
● In addition, changes to rainfall patterns have highlighted the need for deeper rooting, more water efficient varieties
● Development of genomic technologies for plant breeding may help identify genetic markers for improvement including nutrient and water use efficiency
Aim ● To develop new varieties of grass and clover to enhance
beef, sheep and dairy production while reducing the environmental impact of grassland agriculture in the UK
Nitrogen use efficiency ● Approximately 70% of protein consumed by dairy cows
is excreted in faeces and urine ● Supplying higher amounts of rumen degradable energy
can improve nitrogen use in the rumen ● Grasses with high water soluble carbohydrates may
provide a more rapid release of energy in the rumen ● High water soluble carbohydrate varieties have been
developed and are now being tested in national trials to identify their agronomic performance
Clovers ● Nitrate leaching from red
clover is reduced when it is grown with hybrid ryegrass, due to uptake of N by the ryegrass plant
● Red clover contains an enzyme polyphenol oxidase (PPO) that can reduce N losses
● A new variety of red clover with high PPO has been developed and is being tested under field experiments to compare N losses
Phosphorus use efficiency ● Phosphorus (P) is an essential macronutrient for cell
growth and repair, and for root development ● With extensive root nodulation, clovers are thought to
display a high requirement for P ● Clover plants from long-term low input grassland sites
have been gathered and polycrossed to develop plants with a lower P requirement
● These were grown with Perennial Ryegrass (PRG) and their performance compared under restricted and normal P fertiliser application
● Under restricted fertilisation, total DM yield for the low P clover sward was 11% higher than the conventional clover
● Although this process remains poorly understood, it is thought that white clover may be able to mobilise P from the surrounding soil, increasing PRG yield
● Under high P fertilisation there was limited benefit to low P clovers
Water use efficiency ● Rainfall in the UK is now
consistently lower than the 1961–1990 long-term average
● PRG production is reduced by 1t/ha for every 50mm increase in soil water deficit
● Fescue genes have been introduced into Italian and PRG to give more rapid root growth and improved water use efficiency
The Breeding LINK projects were sponsored by Defra through the Sustainable Livestock Production (SLP) LINK programme with support from AHDB, British Grassland Society (BGS), Germinal Holdings Ltd, Hybu Cig Cymru, Livestock and Meat Commission of Northern Ireland LMC(NI) and Quality Meat Scotland (QMS)
Figure 75. Annual DM Yield for conventional and low P clover-PRG swards at two P fertiliser levels
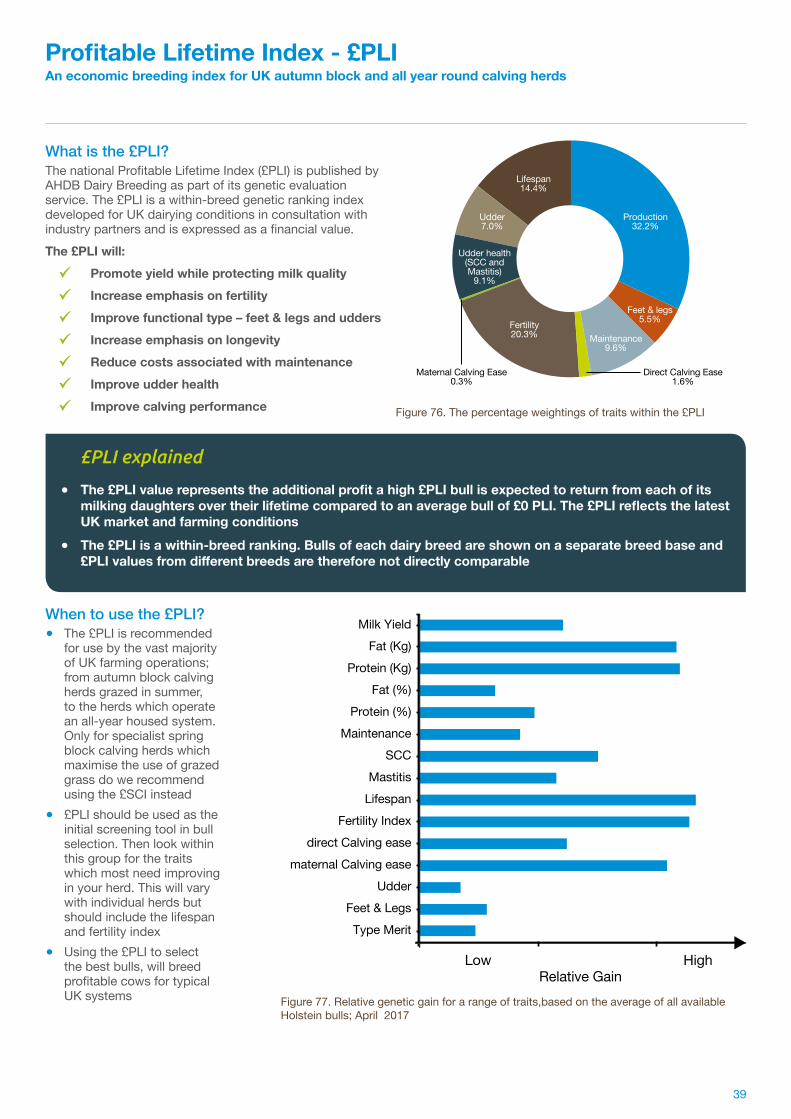
39
When to use the £PLI? ● The £PLI is recommended
for use by the vast majority of UK farming operations; from autumn block calving herds grazed in summer, to the herds which operate an all-year housed system. Only for specialist spring block calving herds which maximise the use of grazed grass do we recommend using the £SCI instead
● £PLI should be used as the initial screening tool in bull selection. Then look within this group for the traits which most need improving in your herd. This will vary with individual herds but should include the lifespan and fertility index
● Using the £PLI to select the best bulls, will breed profitable cows for typical UK systems
Production32.2%
Udder7.0%
Lifespan14.4%
Feet & legs5.5%
Maintenance9.6%
Direct Calving Ease1.6%
Maternal Calving Ease0.3%
Fertility20.3%
Udder health(SCC andMastitis)
9.1%
Type MeritFeet & Legs
Uddermaternal Calving ease
direct Calving easeFertility Index
LifespanMastitis
SCCMaintenance
Protein (%)Fat (%)
Protein (Kg)Fat (Kg)
Milk Yield
LowRelative Gain
High
Profitable Lifetime Index - £PLIAn economic breeding index for UK autumn block and all year round calving herds
What is the £PLI?The national Profitable Lifetime Index (£PLI) is published by AHDB Dairy Breeding as part of its genetic evaluation service. The £PLI is a within-breed genetic ranking index developed for UK dairying conditions in consultation with industry partners and is expressed as a financial value. The £PLI will: Promote yield while protecting milk quality Increase emphasis on fertility Improve functional type – feet & legs and udders Increase emphasis on longevity Reduce costs associated with maintenance Improve udder health Improve calving performance
£PLI explained
● The £PLI value represents the additional profit a high £PLI bull is expected to return from each of its milking daughters over their lifetime compared to an average bull of £0 PLI. The £PLI reflects the latest UK market and farming conditions
● The £PLI is a within-breed ranking. Bulls of each dairy breed are shown on a separate breed base and £PLI values from different breeds are therefore not directly comparable
Figure 76. The percentage weightings of traits within the £PLI
Figure 77. Relative genetic gain for a range of traits, based on the average of all available Holstein bulls; April 2017

40
What are the relative weightings in the £PLI on production and health traits?The £PLI has approximately 32% weighting on production and 68% on health and fitness, placing a particularly strong emphasis on female fertility, longevity, udder health and maintenance cost to reflect the efficiency with which the cow produces milk.
What is the maintenance cost trait?Farmer experience and research indicate the greater cost of feeding a larger cow. If two cows are identical in every other way (production, health, fertility, etc.) smaller cows, which costs less to feed, will be more profitable and have a higher £PLI.
How is the cost of maintenance calculated?The cost of maintaining a cow is related to its weight. As we don’t routinely weigh dairy cattle, we have studied the traits most closely related to the cow’s weight. These traits are stature, chest width, body depth and angularity. These traits are closely correlated to liveweight and are, therefore, used as an indicator of the costs of maintenance.
Have other factors that relate to the cow’s weight been considered, such as calf values?Liveweight as an indicator of maintenance has not been considered in isolation. The value of the heavier cull cow comes into the calculation, as does the higher value calf from a larger dam. The cost of rearing a larger heifer has also been considered in the revised £PLI.
What is the Mastitis index?The Mastitis index allows farmers to breed cows with improved resistance to mastitis, tackling a common issue on farm on both a genetic and management level.
Why has the Mastitis index been included in the £PLI alongside somatic cell count (SCC)?Although there is a strong link between the SCC index and a reduction in mastitis cases there are a small number of bulls who reduce SCC but not necessarily cases of mastitis – this new index will help to identify those bulls and allow farmers to make more informed breeding decisions for their herd. Therefore, as part of the udder health component, we have reduced the weighting given to SCC, as we can now directly select for increased mastitis resistance.
Can £PLI be used to compare cattle of different breeds with one another?£PLI is a breed-specific index with all values and Predicted Transmitting Abilities (PTAs) calculated on each breed’s own base. Anyone wishing to make across-breed comparisons is advised to contact AHDB Dairy for a conversion formula for this purpose.
Which type of herds should use £PLI as their main breeding goal?The index is recommended as the primary selection tool for the majority of UK dairy herds and systems. £PLI should be used as an initial screening tool for bulls and, following this, producers are advised to place emphasis on traits which need improvement in their own herd. The Spring Calving Index (£SCI) is available solely for producers operating a spring block-calving system making extensive use of grass.
£PLI - Frequently asked questions

41
Fertility21.8%
Udder 2.6%
Lifespan13.5%
Production29.3%
Feet & Legs3.7% Maintenance
16.1%
direct Calving Ease2.2%
maternal Calving Ease0.4%
Udder Health(SCC andMastitis)10.4%
UK genetic evaluations are undertaken and published by AHDB Dairy three times a year: April, August and December. For more information, visit the web: dairy.ahdb.org.uk/breeding
Spring Calving Index - £SCIAn economic breeding index for spring block calving systems
£SCI explained
● The £SCI value represents the additional profit a high £SCI bull is expected to return from each of its milking daughters over her lifetime compared to an average bull of £0 SCI. These are specifically calculated for UK markets and farming conditions
● The £SCI will ensure important genetic areas are maintained or improved, eg fertility (calving interval and non-return rate), SCC and milk solids
● Increased emphasis on the maintenance cost by reducing cow liveweight will give the daughters of high £SCI bulls improved efficiency suited to a spring calving, grazing-based system
What is the £SCI?The Spring Calving Index (£SCI) is an across-breed genetic ranking index developed in consultation with industry partners specifically for spring block-calving herds and expressed as a financial value. The £SCI will: Promotes milk quality rather than volume Places strong emphasis on fertility Selects for reduced maintenance cost Improves udder health Places strong emphasis on longevity Promotes easier calving Protects functional type – feet & legs and udders
When to use the £SCI? ● The £SCI has been created specifically for spring block-
calving systems which place a heavy reliance on grazed grass. For autumn calving herds, we recommend using the £PLI
● The £SCI is an across-breed ranking. Bulls of all breeds will be shown on the same base so their £SCI values are directly comparable
● Use the £SCI to select the best bulls to breed profitable cows for a spring block-calving system. £SCI should be used as the initial screening tool in bull selection; then look within this group for the traits which most need improving in your herd
Figure 78. The percentage weightings of traits within the £SCI

42
Why has AHDB Dairy launched the £SCI?The Spring Calving Index (£SCI) has been introduced at the request of farmers to provide them with a genetic index to help breed a cow that suits a spring block-calving system, making extensive use of grazed grass. The index has been developed to breed a cow which produces lower volumes of milk of a higher quality and places a particular emphasis on fertility and calving ease to achieve a tight calving block. The index also favours bulls which will produce a smaller cow with lower maintenance requirements. As with the £PLI, lower SCC and sound legs, feet and udders are all important.
Functional type is important in these systems. Why isn’t there more emphasis on this in £SCI?Functional type forms part of £SCI, just as it does with £PLI. Mammary health and conformation, together with legs and feet, are included, but it is important to note that these traits are also strongly correlated with some of the other components of the index, including lifespan, so they’re more important than would seem at first glance.
Why has £SCI been developed as an across-breed index?£SCI is being presented by AHDB Dairy as an across-breed index because this is considered to be the most useful format for spring block-calving herds. Many of these herds use more than one breed either as pure or cross-bred animals, so it’s important for them to be able to compare the genetic potential of bulls from different breeds against one another.
Can the £PLI and £SCI be compared?No. The indexes have been designed for different farming situations, with the £SCI set on its own unique breeding base.
Why are there minus PTA milk bulls near the top of the £SCI list?Bulls near the top of the £SCI will transmit a range of attributes which make them suitable for spring block-calving herds. Their particular strengths will inevitably be in different areas and producers are advised to choose those which will transmit the characteristics most needed for their own situation.
Can I use £SCI if I block calve at a different time of year?£SCI has been formulated specifically for herds which block calve in spring and place a heavy reliance on summer grazing. It is only suitable for use in these circumstances and not recommended for autumn block-calving herds, which have a higher requirement for winter concentrate feeding.More information on AHDB Dairy Breeding, dairy genetics and how to access your herd genetic report can be found on the AHDB Dairy website: dairy.ahdb.org.uk/breeding
£SCI - Frequently asked questions
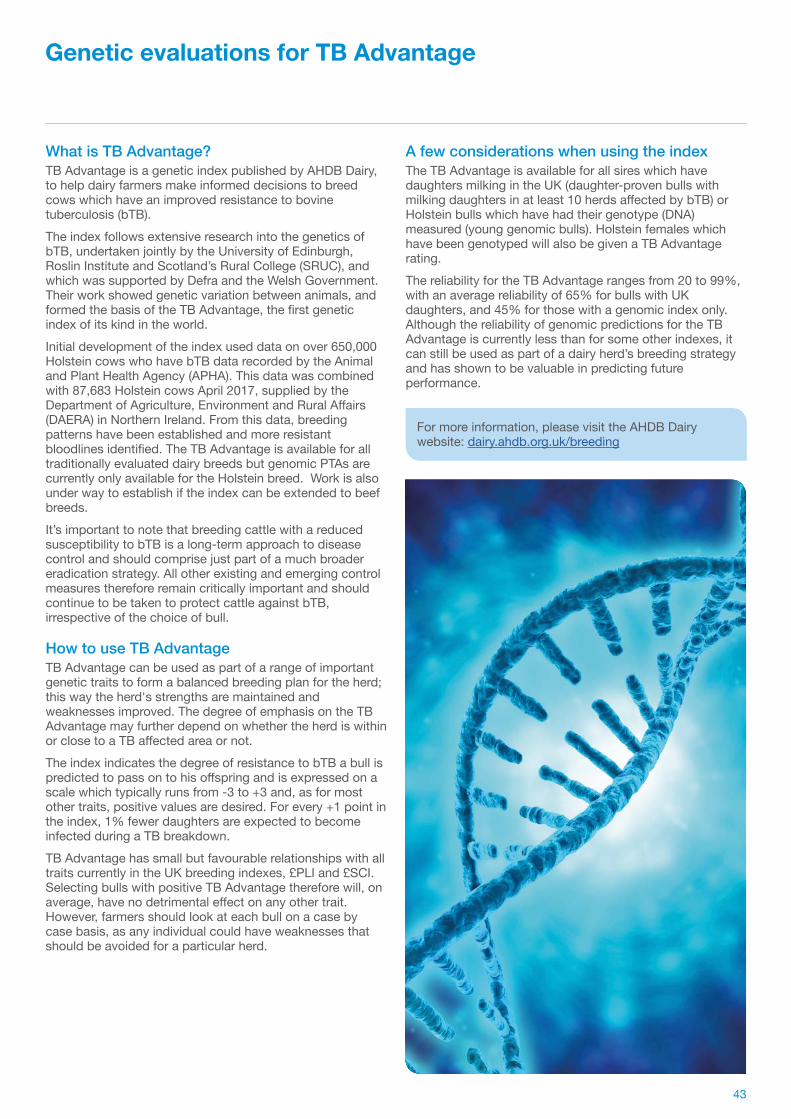
43
Genetic evaluations for TB Advantage
What is TB Advantage?TB Advantage is a genetic index published by AHDB Dairy, to help dairy farmers make informed decisions to breed cows which have an improved resistance to bovine tuberculosis (bTB).The index follows extensive research into the genetics of bTB, undertaken jointly by the University of Edinburgh, Roslin Institute and Scotland’s Rural College (SRUC), and which was supported by Defra and the Welsh Government. Their work showed genetic variation between animals, and formed the basis of the TB Advantage, the first genetic index of its kind in the world.Initial development of the index used data on over 650,000 Holstein cows who have bTB data recorded by the Animal and Plant Health Agency (APHA). This data was combined with 87,683 Holstein cows April 2017, supplied by the Department of Agriculture, Environment and Rural Affairs (DAERA) in Northern Ireland. From this data, breeding patterns have been established and more resistant bloodlines identified. The TB Advantage is available for all traditionally evaluated dairy breeds but genomic PTAs are currently only available for the Holstein breed. Work is also under way to establish if the index can be extended to beef breeds.It’s important to note that breeding cattle with a reduced susceptibility to bTB is a long-term approach to disease control and should comprise just part of a much broader eradication strategy. All other existing and emerging control measures therefore remain critically important and should continue to be taken to protect cattle against bTB, irrespective of the choice of bull.
How to use TB AdvantageTB Advantage can be used as part of a range of important genetic traits to form a balanced breeding plan for the herd; this way the herd's strengths are maintained and weaknesses improved. The degree of emphasis on the TB Advantage may further depend on whether the herd is within or close to a TB affected area or not.The index indicates the degree of resistance to bTB a bull is predicted to pass on to his offspring and is expressed on a scale which typically runs from -3 to +3 and, as for most other traits, positive values are desired. For every +1 point in the index, 1% fewer daughters are expected to become infected during a TB breakdown.TB Advantage has small but favourable relationships with all traits currently in the UK breeding indexes, £PLI and £SCI. Selecting bulls with positive TB Advantage therefore will, on average, have no detrimental effect on any other trait. However, farmers should look at each bull on a case by case basis, as any individual could have weaknesses that should be avoided for a particular herd.
A few considerations when using the indexThe TB Advantage is available for all sires which have daughters milking in the UK (daughter-proven bulls with milking daughters in at least 10 herds affected by bTB) or Holstein bulls which have had their genotype (DNA) measured (young genomic bulls). Holstein females which have been genotyped will also be given a TB Advantage rating.The reliability for the TB Advantage ranges from 20 to 99%, with an average reliability of 65% for bulls with UK daughters, and 45% for those with a genomic index only. Although the reliability of genomic predictions for the TB Advantage is currently less than for some other indexes, it can still be used as part of a dairy herd’s breeding strategy and has shown to be valuable in predicting future performance.
For more information, please visit the AHDB Dairy website: dairy.ahdb.org.uk/breeding

44
Development of TB Advantage
What does this mean for dairy cattle selection?Selecting bulls with high £PLI or £SCI the UK dairy industry has already been, indirectly, selecting for desirable TB Advantage in the national herd. This new genetic index is an additional tool which now allows farmers to directly screen out the most negative TB Advantage bulls from their short list of bulls.Due to the nature of dairy cattle breeding, this is a long term aid to be used in addition to current eradication policies already in place. But, the decision to breed for improved resistance in your herd is a permanent benefit which accumulates with each new generation.
Where to find TB Advantage and further informationPredicted transmitting ability (PTA) for TB Advantage are now available on all bull reports and is part of the national genetic and genomic evaluations provided by AHDB Dairy in April, August and December each year. The PTA and reliability is included in the 'Management Traits' section of the bull factsheets which can be found through the £PLI and £SCI bull reports. Further details on how to prevent the spread of bTB and other management measures you can take on farm can be found on the TB Hub, the home of UK TB information.
TB hub websiteA joint industry online bTB hub was launched in autumn 2015. The website aims to be a one-stop-shop for beef and dairy farmers to find practical advice on bTB, from wildlife and cattle biosecurity to trading rules and guidance on managing a TB breakdown. It has been developed and will be maintained by AHDB, APHA, BCVA, Defra, Landex and the NFU on behalf of the broader cattle industry. Chris Lloyd, AHDB Head of Knowledge Transfer Programme Development, who co-ordinated the development of the hub, said the aim is to provide a comprehensive resource on bTB that is easily navigable for the user to find the information of relevance to them: “It will be responsive to the needs of users and feedback on how its value can be further developed after launch will be welcome.” tbhub.co.uk

45
0
-0.5
-1
-1.5
0.5
1
1.5
2
Years
Inde
x po
ints
1995 1996 1997 1998 1999 2000 2001 2002 2003 2004 2005 2006 2007 2008 2009 2010 2011 2012
-7 -5 -3 -1 10
5
15
20
25
30
35lact1 y = 0.7137x + 9.9344
y = 0.9917x + 14.302
y = 1.1396x + 18.149
y = 1.3706x + 17.833
3 5 7 9
10
lact2
lact3
lact4
Figure 79. Mastitis Trend – Holstein sires
Mastitis Index
From April 2017, a mastitis index has been published for all breeds genetically evaluated in the UK. A genomic evaluation is also available for Holsteins. This index will allow farmers to breed cows with improved resistance to mastitis, tackling a common issue on farm on both a genetic and management level. Although there is a strong link between the Somatic Cell Count (SCC) index and a reduction in mastitis cases, there are a small number of bulls who reduce SCC but not necessarily cases of mastitis – this new index will help to identify those bulls and allow farmers to make more informed breeding decisions for their herd.
Not only is the Mastitis index published alongside SCC, it has also been incorporated into the £Profitable Lifetime Index (£PLI). The process of bull selection will not change; the £PLI should be used as an initial screening tool, and then traits of interest to your herd should be considered to progress your herd genetically.
These specific traits will vary between herds depending upon system, management and breeding goals, but health traits, now including the Mastitis index, should always be taken into consideration when selecting bulls. Health traits may have a low heritability but by including them in your breeding decisions they will have a cumulative effect on your herd.
Development of the Mastitis IndexOver 10 years of animal data was supplied by the major milk recording organisations to develop this index. From this data mastitis was found to be 4% heritable, around the same level as fertility. The resultant index has a strong correlation with SCC and other Mastitis indexes published by other countries of 0.8 and 0.88 respectively, with international correlations validated by Interbull.
How to use the Mastitis IndexThe Mastitis index is published on a scale from -5 to +5 and expressed as a percentage. Similar to SCC, negative values are favourable in the Mastitis index. This means that for every percent decrease in a bull’s index there will be a corresponding one percent decrease in his daughters’ mastitis cases – illustrated in the graph opposite. This translates into, on average, 10 fewer cows with mastitis per year in a herd of 100 cows if a -5 mastitis bull is used instead of a +5 mastitis bull. Figure 80. % Daughters with Mastitis by Sire PTA

46
Line Number Current Lactation Lifespan (LS)
Somatic Cell Counts (SCC) Fertility Index (FI) Reset Show me my results
Compare
Print Download to excel
Line £PLI £PLI Rel Breed Identity Cow PI Curr Lact Inbreeding % Rel% Milk (kg) Bfat (kg) Prot (Kg) BFat (%) Prot (%) LS SCC FI Gen.
Dam
Sire
36 371 30 1 380467703036 1 3.6 41 306 10.6 13.2 -0.02 0.04 0.4 -16 8.81 3804677021401 636351 LAURELHILL CLASSIC
540 319 47 1 380467102540 2 2.9 66 292 19.3 16.4 0.09 0.08 0.2 -11 -1.11 3804673017581 631308 COGENT TWIST
4019 297 32 1 380467403019 1 2.7 42 67 4.7 5.9 0.03 0.05 0.4 -15 9.21 380467601187 1871 636351 LAURELHILL CLASSIC
Predicted Transmitting Ability (PTA 2014) Herd Averages
Lactation Group
Number of Animals £PLI Inbreeding
%Ref %
Milk (kg)
Fat (kg)
Prot (kg)
Fat (%)
Prot (%) Lifespan SCC Fertility
Index3 0-12 Months 85 255 2.2 34 71 10.6 6.1 0.10 0.05 0.25 -8.5 4.23 12-18 Months 46 195 2.2 37 110 9.9 6.3 0.07 0.03 0.19 -5.2 1.73 18-24 Months 33 205 1.5 37 64 7.1 5.4 0.06 0.04 0.19 -6.8 4.03 24+ Months 69 132 2.0 39 13 3.2 3.0 0.03 0.03 0.10 -2.8 3.33 1st Lactation 73 122 1.8 51 10 3.4 2.1 0.04 0.02 0.13 -5.8 2.03 2nd Lactation 57 79 2.0 63 60 4.6 4.2 0.03 0.03 0.08 0.6 -0.33 3rd Lactation 27 56 2.0 66 55 3.6 3.1 0.02 0.02 0.01 -1.9 0.83 4thLactation 34 61 1.8 67 -20 1.6 2.1 0.03 0.03 0.03 -2.6 0.83 5th Lactation 13 -43 2.6 68 -15 -0.2 1.5 0.01 0.03 -0.07 0.1 -3.83 >5th Lactation 21 -19 1.6 68 -252 -5.5 -5.0 0.06 0.04 0.03 -3.1 0.4
Average 458 136 2.0 48 30 5.1 3.6 0.05 0.03 0.13 -4.3 2.0
Herd Genetic Reports
Herd Genetic Reports (HGRs) have been available for a number of years through AHDB Dairy to all UK dairy farmers who milk record. These HGRs allow farmers to see the genetic potential of their herd by providing the following information for the cows registered on their farm: • Profitable Lifetime Index (£PLI) • Spring Calving Index (£SCI) (available since December 2016) • Milk (kg)• Fat and Protein (kg and %) • Inbreeding Level• Management Traits – SCC, Lifespan and FertilityWithin the HGR the data is displayed in four parts – Herd Genetic Report Summary, Individual Milking Cow, Individual Youngstock and Breed Herd Standards.
Herd Genetic Report Summary The Herd Genetic Report Summary allows your herd’s strengths and weaknesses to be identified by age or lactation number, enabling you to monitor the genetic trends of your herd for a variety of traits. In addition, this summary allows genetically weaker traits to be identified and targeted on a whole herd basis.
Individual milking cow The Individual Milking Cow Report can be used to identify the strengths and weaknesses of each cow (highlighted on the example report below); corrective breeding can then be implemented, either on a cow by cow basis or by highlighting the key traits that require improvement when identifying bulls for future breeding.
Table 8 - Milking Herd Report
Table 7. Herd Genetic Report Summary

47
Line Number Lifespan (LS)
Somatic Cell Counts (SCC) Fertility Index (FI) Reset Show me my results
Compare
Print Download to excel
Line £PLI £PLI Rel Breed Identity Cow Inbreeding % Birth Date Rel% Milk (kg) Bfat (kg) Prot (Kg) BFat (%) Prot (%) LS SCC FI Gen.
Dam
Sire
3278 460 30 1 380467403278 1.3 27/09/2014 42 -199 14.8 2.5 0.28 0.11 0.1 -7 13.94 38046760178265 135778023 GRAN-J OMAN MCCORMICK
2985 443 29 1 380467502985 1.0 03/09/2013 41 0 9.4 6.5 0.11 0.08 0.4 -7 11.54 3804673017791 636351 COGENT TWIST
3206 441 30 1 380467203206 0.0 22/08/2014 41 -307 10.2 -0.3 0.28 0.12 0.2 -7 13.94 38046750178165 135778023 GRAN-J OMAN MCCORMICK
Percentile £PLI PTA Milk(kg)
PTA Fat(kg)
PTA Prot(kg)
PTA Fat(%)
PTA Prot(%) Lifespan SCC Fertility
Index1 122 262 7.3 5.9 0.12 0.08 0.27 -5 9.75 81 168 4.2 3.3 0.08 0.05 0.20 -3 5.610 61 121 2.8 2.1 0.06 0.04 0.15 -2 3.515 51 87 1.9 1.4 0.05 0.03 0.13 -2 2.420 42 60 1.2 0.8 0.04 0.03 0.11 -1 1.725 35 37 0.6 0.3 0.03 0.02 0.10 -1 1.230 29 17 0.1 -0.1 0.03 0.02 0.09 -1 0.835 24 -3 -0.5 -0.5 0.02 0.01 0.08 0 0.540 19 -21 -0.9 -0.9 0.02 0.01 0.07 0 0.345 13 -41 -1.4 -1.3 0.01 0.01 0.06 0 0.150 8 -58 -1.9 -1.7 0.01 0.00 0.05 1 -0.255 3 -78 -2.4 -2.1 0.00 0.00 0.05 1 -0.360 -2 -99 -2.9 -2.6 0.00 0.00 0.04 1 -0.565 -8 -124 -3.6 -3.2 -0.01 -0.01 0.03 1 -0.770 -14 -152 -4.3 -3.8 -0.01 -0.01 0.02 2 -0.975 -21 -183 -5.2 -4.5 -0.01 -0.01 0.01 2 -1.280 -29 -224 -6.3 -5.4 -0.02 -0.02 0.00 3 -1.485 -41 -268 -7.8 -6.5 -0.02 -0.02 -0.01 3 -1.790 -57 -336 -9.9 -8.1 -0.03 -0.03 -0.03 4 -2.195 -89 -443 -13.3 -11.2 -0.04 -0.04 -0.06 5 -2.6
Individual youngstock Similar to the individual milking cow report, individual animal strengths and weaknesses can be easily re-ranked and identified. Future breeding policies can then be implemented with youngstock. In addition, if the youngstock have been genomically tested the report will use this more accurate information in the tables. As with the individual cow report, filters have been added to the report, along with a print function, allowing groups of animals due to be mated to be assessed more easily.
Table 9. Youngstock report
Breed herd standardsFinally, a benchmarking report is included to allow each herd to benchmark itself against the breed average by whole herd or lactation group. The report highlights areas where theherd is performing well, but also allows potential goals to be set when making future breeding decisions.
How often is it updated?HGRs are updated at every bull proof run in April, August and December. The updates are based upon new data received about individual cows, progeny (daughters) or relatives.
How do I register for a Herd Genetic Report?Email AHDB Dairy at: [email protected] To register for your login details, we will need your milk recording number, trading name and email address. For the reports to be created you need to be fully milk recording with CIS, NMR or UDF.
Can my vet/consultant be given access to my Herd Genetic Report?Yes. Contact AHDB Dairy by emailing: [email protected] An advisor log-in can be created and your herd will then be added to your vet’s/consultant’s account once the relevant authorisation form has been completed.
Table 10. Herd benchmarking
Herd Genetic Reports
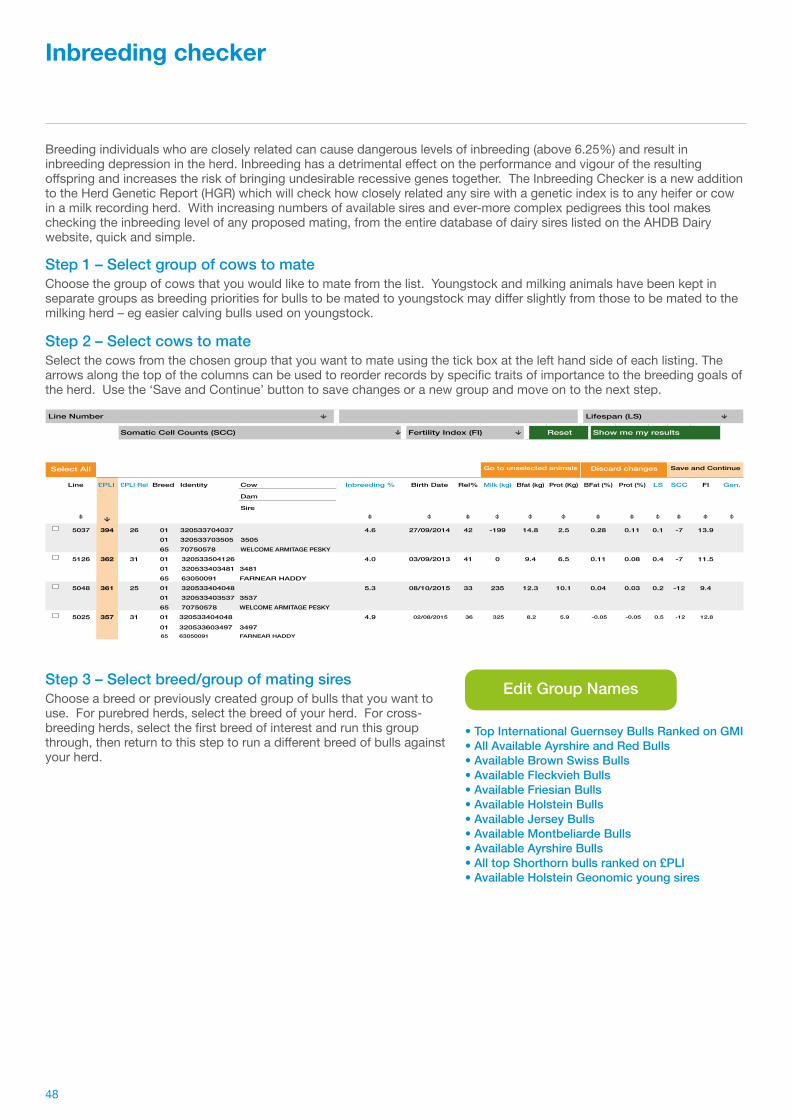
48
Line Number Lifespan (LS)
Somatic Cell Counts (SCC) Fertility Index (FI) Reset Show me my results
Select All Go to unselected animals Discard changes Save and Continue
Line £PLI £PLI Rel Breed Identity Cow Inbreeding % Birth Date Rel% Milk (kg) Bfat (kg) Prot (Kg) BFat (%) Prot (%) LS SCC FI Gen.
Dam
Sire
5037 394 26 01 320533704037 4.6 27/09/2014 42 -199 14.8 2.5 0.28 0.11 0.1 -7 13.901 320533703505 350565 70750578 WELCOME ARMITAGE PESKY
5126 362 31 01 320533504126 4.0 03/09/2013 41 0 9.4 6.5 0.11 0.08 0.4 -7 11.501 320533403481 348165 63050091 FARNEAR HADDY
5048 361 25 01 320533404048 5.3 08/10/2015 33 235 12.3 10.1 0.04 0.03 0.2 -12 9.401 320533403537 353765 70750578 WELCOME ARMITAGE PESKY
5025 357 31 01 320533404048 4.9 02/08/2015 36 325 8.2 5.9 -0.05 -0.05 0.5 -12 12.8
01 320533603497 349765 63050091 FARNEAR HADDY
Inbreeding checker
Breeding individuals who are closely related can cause dangerous levels of inbreeding (above 6.25%) and result in inbreeding depression in the herd. Inbreeding has a detrimental effect on the performance and vigour of the resulting offspring and increases the risk of bringing undesirable recessive genes together. The Inbreeding Checker is a new addition to the Herd Genetic Report (HGR) which will check how closely related any sire with a genetic index is to any heifer or cow in a milk recording herd. With increasing numbers of available sires and ever-more complex pedigrees this tool makes checking the inbreeding level of any proposed mating, from the entire database of dairy sires listed on the AHDB Dairy website, quick and simple.
Step 1 – Select group of cows to mateChoose the group of cows that you would like to mate from the list. Youngstock and milking animals have been kept in separate groups as breeding priorities for bulls to be mated to youngstock may differ slightly from those to be mated to the milking herd – eg easier calving bulls used on youngstock.
Step 2 – Select cows to mateSelect the cows from the chosen group that you want to mate using the tick box at the left hand side of each listing. The arrows along the top of the columns can be used to reorder records by specific traits of importance to the breeding goals of the herd. Use the ‘Save and Continue’ button to save changes or a new group and move on to the next step.
Step 3 – Select breed/group of mating siresChoose a breed or previously created group of bulls that you want to use. For purebred herds, select the breed of your herd. For cross-breeding herds, select the first breed of interest and run this group through, then return to this step to run a different breed of bulls against your herd.
• Top International Guernsey Bulls Ranked on GMI • All Available Ayrshire and Red Bulls • Available Brown Swiss Bulls • Available Fleckvieh Bulls • Available Friesian Bulls • Available Holstein Bulls • Available Jersey Bulls • Available Montbeliarde Bulls • Available Ayrshire Bulls • All top Shorthorn bulls ranked on £PLI • Available Holstein Geonomic young sires
Edit Group Names

49
Bull Search Bull name Bull hbn Search
Reset
£PLI Milk Fat)
Protein (kg) Fat Protein)
Fertility Index (FI) Lifespan) Somatic Cell Count)
TB Adv. Reset Show me my results
Go to unselected animals Discard changes Save and Continue Production Fitness Type Inbreeding
Rank Bull name Sire name
£PLI £PLIRel
Milk (kg)
Fat (kg)
Prot (kg)
Fat (%)
Prot (%)
FI LS SCC Main dCE mCE TB Adv.
Legs Udder TM Available Available NI
Gen. Sexed Number of safe matings
Average expected
inbreeding
1 GEN-I-BEQ LAVAMAN LONG-LANGS OMAN OMAN
626 94 346 22.2 23.4 0.10 0.15 13.5 0.1 -3 -8 1.1 1.6 1.9 1.18 1.14 1.23 SMX SMX
G 92 6.95
2 KINGS-RANSOM ERDMAN CRI ENSENADA TABOO PLANET
622 84 515 24.2 15.6 0.05 -0.01 13.2 0.7 -20 -19 0.6 1.5 0.3 0.37 0.38 0.43 BUL AIS
G S 199 5.34
3 TEEMAR SHAMROCK ALPHABET-ET LADYS-MANOR PL SHAMROCK
591 76 489 18.2 17.8 -0.01 0.02 13.3 0.6 -6 -16 2.3 3.0 2.1 1.11 0.10 0.40 GEN GEN
G 97 6.50
Line Number
Cow Name
Herdbook Number £PLI 626 622 568 565 574 591 560
5005 320533304005 138 5.2 39 13 3.2 3.0 0.03 0.03
3462 320533603462 86 2.8 2.85 3.35 3.1 3.14 3.44 2.69
3498 320533703498 184 7.2 ! 5.65 7.89 ! 6.59 ! 6.52 ! 6.92 ! 6.44 !
3549 320533203549 175 6.81 ! 4.96 7.44 ! 6.31 ! 6.56 ! 6.55 ! 5.5
3556 320533203556 114 4.5 4.21 5.32 7.25 ! 8.69 ! 6.05 4.15
3557 320533303557 104 6.5 ! 4.87 7.74 ! 8.91 ! 10.65 ! 7.23 ! 5.57
3586 320533403586 132 7.13 ! 4.03 4.85 5 5.66 4.58 3.82
3587 320533503587 223 7.07 ! 3.83 4.83 4.89 5.49 4.43 3.7
GEN-I-BEQ LAVAMAN
KINGS-RANSOM ERDMAN CRI
NO-FLA EMULATE 30309
S-S-I BOOKEM MORGAN
S-S-I SHAMROCK MYSTIC-ET
TEEMAR SHAMROCK ALPHABET-ET
UNITED-PRIDE ERDMAN EVAN
Inbreeding checker
Step 4 – Select mating siresChoose the bulls from the available bull or breed list that you want to check for suitability, using the tick box at the left hand side of each listing. Similar to step 2, arrows along the top of the columns can be used to re-rank the bulls by trait.The ‘Average expected inbreeding’ column gives the average expected inbreeding level of the progeny for each bull, when mated to the group of cows selected in step 2. The ‘Number of safe matings’ column indicates the number of cows which can safely be mated to the bull (resulting in less than 6.25% inbreeding). These two columns allow the user to instantly see whether it is acceptable to use a particular bull, and if so, the number of cows in the herd which would be a suitable match. The ability to check the “expected inbreeding” on specific cows against all available bulls, allows famers to consider sires that may previously have been disregarded due to concerns over their relatedness to the herd. Depending on number of records the lists may take a short while to load.The ‘Bull Search’ bar can also be used to search for bulls no longer available or stock bulls with a genetic index. By including historic bulls, users can ensure that excess straws from their last purchase do not go to waste. Again, use the ‘Save and Continue’ button to save changes or a new group and move onto the final step.
Step 5 – ResultsAll inbreeding levels for potential matings are shown with cow IDs down the left and bull IDs along the top. Arrows below each bull name allows the user to reorder the cow IDs by inbreeding level against the bull. Cows and bulls can be selected for printing and downloaded for future reference.! – Unsafe level of inbreeding from this mating (>6.2%). – Limited pedigree available for this calculation (Less than 5 generation pedigree).

50
Phosphorusoverfeeding
Environmentallyunfriendly
NotSustainable
Costly
% o
f req
uire
men
ts
Sodium
Potass
iumCalc
iumMag
nesiu
mPho
spho
rusCop
per
Zinc
0
50
100
150
200
250
300
Phosphorus feeding in dairy cowsPartha Ray1, Chris Reynolds1 and Liam Sinclair2 1University of Reading, 2Harpers Adams University
Phosphorus overfeeding in GB
Eutrophication – too much nutrients (P and N) in the water
● Excessive amounts of nutrients (P and N) into the water can lead to an undesirable overgrowth of algae (also called eutrophication)
● Spreading high amounts of P-rich manure or using too much P-fertiliser increase the P content of soils: erosion and runoff allow this P to reach particular surface waters and cause eutrophication
● Eutrophication is not just damaging for the ecosystems of the aquatic environment; some algae can also be toxic for animals and human beings
● Most drinking water in the UK comes from surface water sources; P pollution can also put at risk the availability of clean drinking water
Future AHDB projects ● AHDB will fund a three year PhD Studentship, starting
from October 2017, at the University of Reading, School of Agriculture, Policy and Development
● The project will aim at identifying barriers to and facilitators for reducing P losses from UK dairy farms
● The results of this project will contribute to the establishment of guidelines for the best management practices to improve on-farm P use efficiency
● These guidelines will be valuable for limiting the avoidable costs associated with overfeeding P and for reducing the environmental impact of this practice
Figure 81. Average intake of some major and trace minerals on 50 dairy farms, expressed as a percentage of NRC (2001) require-ments
The P in excess, which has been paid for, will not be used by the cows but will be eliminated in the dung excess, which has been paid for, will not be used by the cows but will be eliminated in the dung
P is a finite resource: wasting it now will mean less availability and higher costs in the future
Too much P in the manure will
increase the risk of water pollution
Key messages ● Phosphorus (P) is an essential mineral for dairy cows
and for the plants as well ● For this reason, recommended levels have been set
up for matching the requirements of dairy cows in all physiological stages
● The dietary P recommendation for early lactation cows is 0.35% DM; for late lactation cows, the NRC (2001) recommends a dietary P level of 0.32% DM
● A recent survey of UK dairy farms has shown that P overfeeding is a common practice
● On average, P is fed in excess of 20% of the recommended level: early lactation cows were fed in excess of 30% . In some cases, however, P was found to be underfed
● When overfed, the unused P is excreted with the faeces: the application of P-rich manure/slurry on the fields, especially if associated with an inaccurate inorganic fertilisation, is a high-risk practice for the environment
● Assessing mineral requirements on a farm is key in a precision feeding approach: forages are the most variable ingredient in terms of mineral content, so a periodical mineral analysis is necessary to formulate properly
● Mineral soil testing is another key practice to avoid/limit negative impact on environment

51
Optimum grazing systems for youngstockRobert Patterson, Steven Morrison and Katerina Theodoridou Agri-food and Biosciences Institute, Northern Ireland
Importance of optimising rearing practices ● Rearing is the second largest cost to a dairy business ● The average total cost of rearing is £1,819 or >6ppl of
milk produced ● Improving heifer rearing practice will be repaid through
higher milk production and a longer productive life
Grazing systems for youngstock ● Well managed grass is the most cost effective feedstuff
for ruminants ● High youngstock performance levels are possible during
the grazing periodHowever: There is still room for improvement!Underutilisation of grass by youngstock and leads to; 1. Failure to meet target live weight/ages2. Additional costs3. Sward deterioration4. Increased GHG emissions
Purpose of work ● Provide a better understanding of the role and potential of
grazed grass within heifer rearing systems ● Consider the strengths and weaknesses of grazing
systems and practices ● Address the weakness through incorporating precision
technologies eg remote concentrate feeding systems and possibility of weighing remotely (CIEL Investment)
● Establish the optimum pasture allowance for replacement heifers in order to both optimise animal performance and pasture growth and utilisation
● Develop grazing wedges for grazing dairy heifer replacements
● Better understanding of grazing strategies for heifers and how best to meet targets leading to increased efficiencies and profits
● Improving rearing efficiency to enable heifers to fulfil their genetic potential will also directly impact sustainability and profitability
Year one workTo determine the optimum pasture allowance, stocking rate and energy intake:
● 72 heifers ● Pasture allowance will be for three different body weights:
● 1.8 %
● 2.4 %
● 3.0 % ● Pasture will be measured on a complete body weight
basis ● Pasture will be allocated on the basis of 100% utilisation ● Heifers will be weighed every fortnight
Calving heifers over 24 months increases
rearing costs by
That's an EXTRA
£2.87 PER DAY
£344 PER HEIFER Calving at 28 months
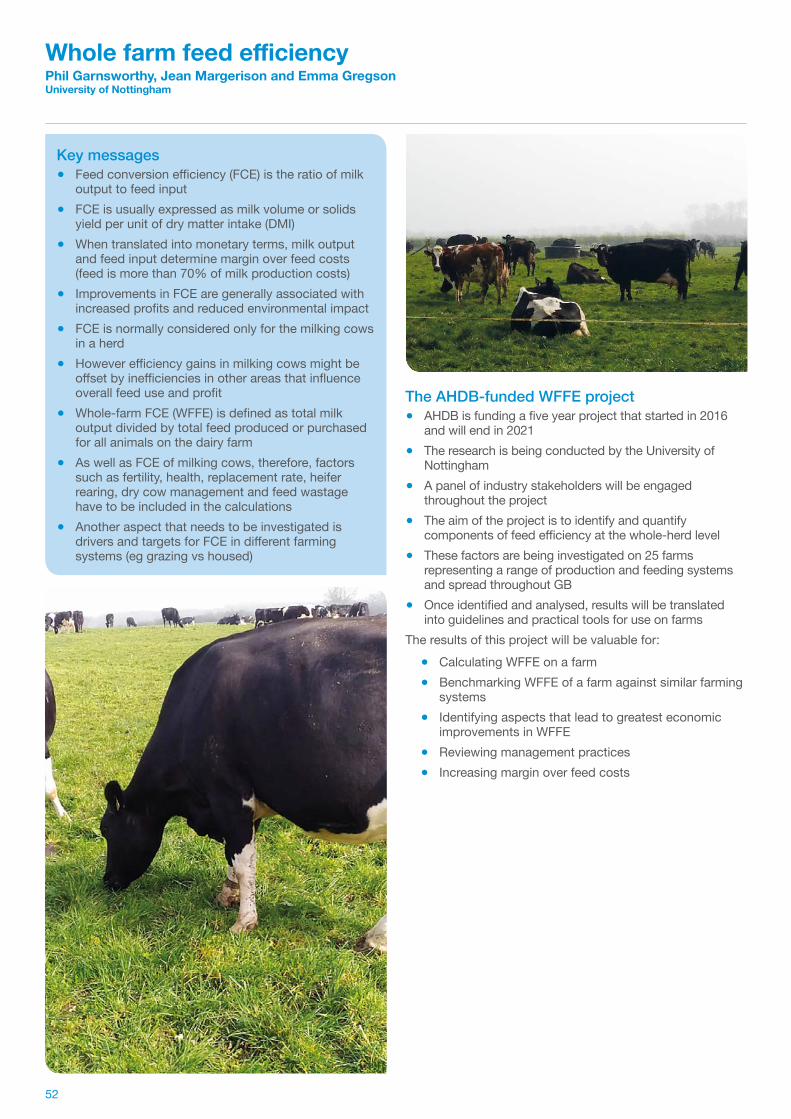
52
Whole farm feed efficiencyPhil Garnsworthy, Jean Margerison and Emma Gregson University of Nottingham
The AHDB-funded WFFE project ● AHDB is funding a five year project that started in 2016
and will end in 2021 ● The research is being conducted by the University of
Nottingham ● A panel of industry stakeholders will be engaged
throughout the project ● The aim of the project is to identify and quantify
components of feed efficiency at the whole-herd level ● These factors are being investigated on 25 farms
representing a range of production and feeding systems and spread throughout GB
● Once identified and analysed, results will be translated into guidelines and practical tools for use on farms
The results of this project will be valuable for: ● Calculating WFFE on a farm ● Benchmarking WFFE of a farm against similar farming
systems ● Identifying aspects that lead to greatest economic
improvements in WFFE ● Reviewing management practices ● Increasing margin over feed costs
Key messages ● Feed conversion efficiency (FCE) is the ratio of milk
output to feed input ● FCE is usually expressed as milk volume or solids
yield per unit of dry matter intake (DMI) ● When translated into monetary terms, milk output
and feed input determine margin over feed costs (feed is more than 70% of milk production costs)
● Improvements in FCE are generally associated with increased profits and reduced environmental impact
● FCE is normally considered only for the milking cows in a herd
● However efficiency gains in milking cows might be offset by inefficiencies in other areas that influence overall feed use and profit
● Whole-farm FCE (WFFE) is defined as total milk output divided by total feed produced or purchased for all animals on the dairy farm
● As well as FCE of milking cows, therefore, factors such as fertility, health, replacement rate, heifer rearing, dry cow management and feed wastage have to be included in the calculations
● Another aspect that needs to be investigated is drivers and targets for FCE in different farming systems (eg grazing vs housed)
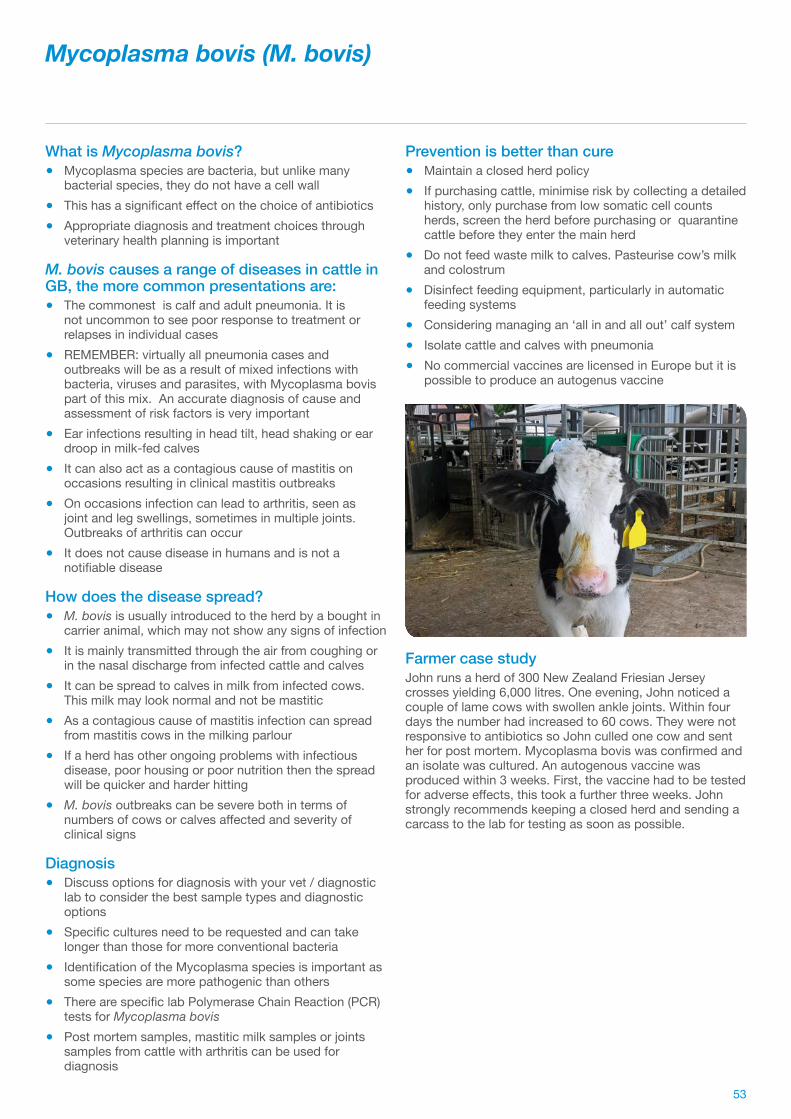
53
Mycoplasma bovis (M. bovis)
What is Mycoplasma bovis? ● Mycoplasma species are bacteria, but unlike many
bacterial species, they do not have a cell wall ● This has a significant effect on the choice of antibiotics ● Appropriate diagnosis and treatment choices through
veterinary health planning is important
M. bovis causes a range of diseases in cattle in GB, the more common presentations are:
● The commonest is calf and adult pneumonia. It is not uncommon to see poor response to treatment or relapses in individual cases
● REMEMBER: virtually all pneumonia cases and outbreaks will be as a result of mixed infections with bacteria, viruses and parasites, with Mycoplasma bovis part of this mix. An accurate diagnosis of cause and assessment of risk factors is very important
● Ear infections resulting in head tilt, head shaking or ear droop in milk-fed calves
● It can also act as a contagious cause of mastitis on occasions resulting in clinical mastitis outbreaks
● On occasions infection can lead to arthritis, seen as joint and leg swellings, sometimes in multiple joints. Outbreaks of arthritis can occur
● It does not cause disease in humans and is not a notifiable disease
How does the disease spread? ● M. bovis is usually introduced to the herd by a bought in
carrier animal, which may not show any signs of infection ● It is mainly transmitted through the air from coughing or
in the nasal discharge from infected cattle and calves ● It can be spread to calves in milk from infected cows.
This milk may look normal and not be mastitic ● As a contagious cause of mastitis infection can spread
from mastitis cows in the milking parlour ● If a herd has other ongoing problems with infectious
disease, poor housing or poor nutrition then the spread will be quicker and harder hitting
● M. bovis outbreaks can be severe both in terms of numbers of cows or calves affected and severity of clinical signs
Diagnosis ● Discuss options for diagnosis with your vet / diagnostic
lab to consider the best sample types and diagnostic options
● Specific cultures need to be requested and can take longer than those for more conventional bacteria
● Identification of the Mycoplasma species is important as some species are more pathogenic than others
● There are specific lab Polymerase Chain Reaction (PCR) tests for Mycoplasma bovis
● Post mortem samples, mastitic milk samples or joints samples from cattle with arthritis can be used for diagnosis
Prevention is better than cure ● Maintain a closed herd policy ● If purchasing cattle, minimise risk by collecting a detailed
history, only purchase from low somatic cell counts herds, screen the herd before purchasing or quarantine cattle before they enter the main herd
● Do not feed waste milk to calves. Pasteurise cow’s milk and colostrum
● Disinfect feeding equipment, particularly in automatic feeding systems
● Considering managing an ‘all in and all out’ calf system ● Isolate cattle and calves with pneumonia ● No commercial vaccines are licensed in Europe but it is
possible to produce an autogenus vaccine
Farmer case studyJohn runs a herd of 300 New Zealand Friesian Jersey crosses yielding 6,000 litres. One evening, John noticed a couple of lame cows with swollen ankle joints. Within four days the number had increased to 60 cows. They were not responsive to antibiotics so John culled one cow and sent her for post mortem. Mycoplasma bovis was confirmed and an isolate was cultured. An autogenous vaccine was produced within 3 weeks. First, the vaccine had to be tested for adverse effects, this took a further three weeks. John strongly recommends keeping a closed herd and sending a carcass to the lab for testing as soon as possible.
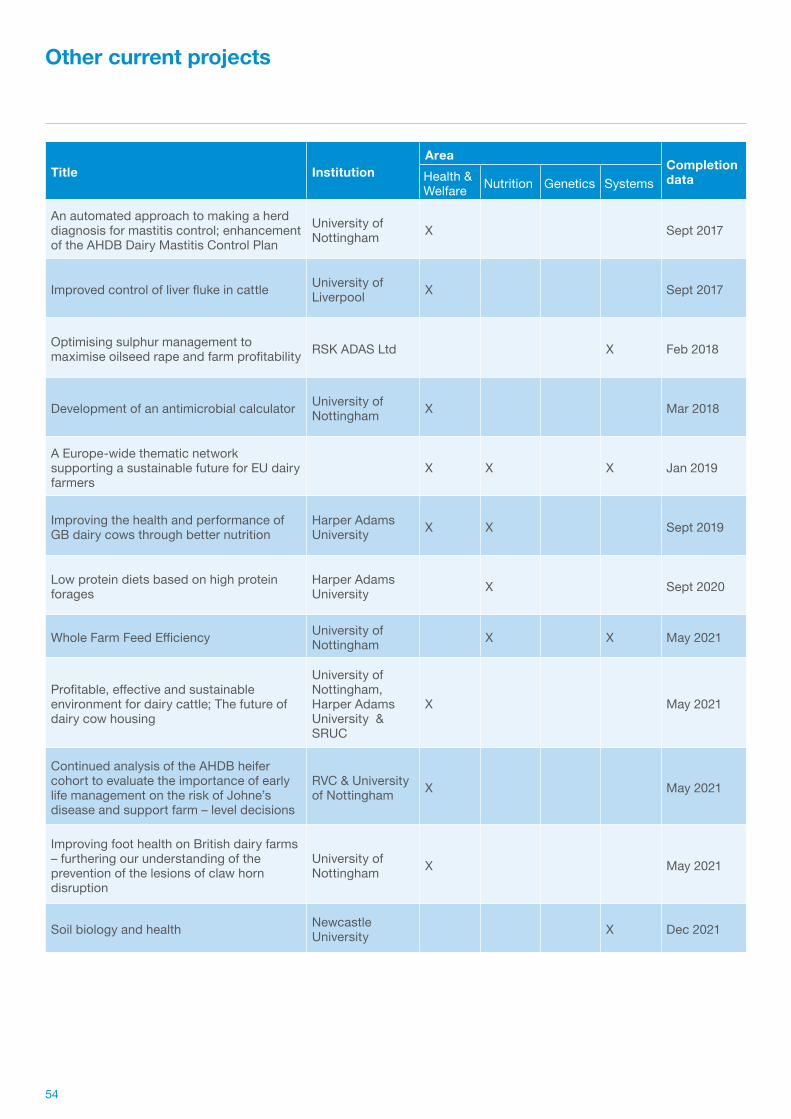
54
Title InstitutionArea
Completion dataHealth &
Welfare Nutrition Genetics Systems
An automated approach to making a herd diagnosis for mastitis control; enhancement of the AHDB Dairy Mastitis Control Plan
University of Nottingham X Sept 2017
Improved control of liver fluke in cattle University of Liverpool X Sept 2017
Optimising sulphur management to maximise oilseed rape and farm profitability RSK ADAS Ltd X Feb 2018
Development of an antimicrobial calculator University of Nottingham X Mar 2018
A Europe-wide thematic network supporting a sustainable future for EU dairy farmers
X X X Jan 2019
Improving the health and performance of GB dairy cows through better nutrition
Harper Adams University X X Sept 2019
Low protein diets based on high protein forages
Harper Adams University X Sept 2020
Whole Farm Feed Efficiency University of Nottingham X X May 2021
Profitable, effective and sustainable environment for dairy cattle; The future of dairy cow housing
University of Nottingham, Harper Adams University & SRUC
X May 2021
Continued analysis of the AHDB heifer cohort to evaluate the importance of early life management on the risk of Johne’s disease and support farm – level decisions
RVC & University of Nottingham X May 2021
Improving foot health on British dairy farms – furthering our understanding of the prevention of the lesions of claw horn disruption
University of Nottingham X May 2021
Soil biology and health Newcastle University X Dec 2021
Other current projects

55
Who What When Where Additional funding
Hannah Shaw Control of Cryptosporidiosis in calves Oct 15–Sept 18 Moredun AHDB Beef & Lamb
Katie FitzgeraldEvaluation of the impact of stocking rate on cow health and welfare
Oct 16–Oct 18 University of Nottingham
Nuwan Muhandiram Evaluation of effectiveness of Festulolium in a ruminant system Dec 15–Nov 18 Aberystwyth
University BBSRC
Lisa MorgansReducing use of veterinary medicines through farmer learning
Feb 16–Dec 18 University of Bristol
Ed Hayes Evidence-based farm decisions to improve dairy herd fertility Sept 15–Sept 19 University of
Nottingham
James McCaughernImproving the health and performance of dairy cows through better copper nutrition
Oct 16–Sept 19 Harper Adams University
Harper Adams University
Robert Patterson Optimum grazing systems for youngstock Oct 16–Sept 19
Agrifood and Biosciences Institute
DARD, AgriSearch
David Bell Preventing respiratory disease in calves Sept 19–Feb 20 SRUC SRUC
Hayley Crosby-Durrani Bovine ischaemic teat necrosis Oct 16–Sept 20 University of Liverpool BBSRC
Laura Shewbridge CarterImproving production efficiency and promoting positive welfare in housed dairy cows by facilitating choice
Oct 17–Sept 20 Harper Adams University
Harper Adams Univeristy & SRUC
Jake ThompsonEvaluation of the impact of loafing space on cow health, welfare, physiology, production and farm economics
Oct 17–Sept 20 University of Nottingham
University of Nottingham
James WilsonUnderstanding the structure and function of the digital cushion and the role of inflammation in the development of lameness
Oct 17–Sept 20 University of Nottingham
Sara Pederson Evaluation of claw trimming practices Jan 17–Dec 20 University of
Nottingham
Amy JacksonEvaluation of public perceptions of dairy cow welfare and the housed environment
Oct 17–Sept 21 University of Nottingham
University of Nottingham
Amy Gillespie Preventing digital dermatitis transmission on farms Oct 17–Sept 21 University of
Liverpool BBSRC
TBC Reduction in diffuse phosphorus loss from dairy farms Oct 17–Sept 20 University of
Reading
Studentship - PhD & MRes
56
The research reported in this booklet would not have been possible with out the collaboration of industry and universities. AHDB Dairy acknowledges the contribution of the following partners to the research programme.
Research through Partnership

57

58
Notes


60
For more information contact:AHDB Dairy Stoneleigh Park Warwickshire CV8 2TL
Tel: 024 7647 8702 Email: [email protected]
dairy.ahdb.org.uk
While the Agriculture and Horticulture Development Board seeks to ensure that the information contained within this document is accurate at the time of printing, no warranty is given in respect thereof and, to the maximum extent permitted by law the Agriculture and Horticulture Development Board accepts no liability for loss, damage or injury howsoever caused (including that caused by negligence) or suffered directly or indirectly in relation to information and opinions contained in or omitted from this document.
AHDB Dairy is part of the Agriculture and Horticulture Development Board (AHDB).
© Agriculture and Horticulture Development Board 2017. All rights reserved.