daito kentaku group strategy 2016 report · hedge against vacancies and the risk of losing rental...
TRANSCRIPT

DAITO KENTAKU GROUP
Strategy Report
2016

01
Since its founding, the Daito Group has been proposing to landowners
how to make the most effective use of their land or engage in leasing, and has been supporting
tenants’ activities ranging from looking for places to live to enabling comfortable lifestyles.
Looking ahead, the Group will strive for further growth by pursuing
and actualizing the value that rental housing can provide.
“Contributing to society by realizing extensive
and effective use of limited land.”Business Philosophy

About this Strategy Report■ Editorial PolicyThis report is for everyone interested in the Daito Group’s value-creating activities. It is an integrated report that covers a range of important information, including our business overview, market environment and growth strategies, financial and non-financial performance data, and value-creating activities in FY2015 (the fiscal year ended March 31, 2016).
■ Target ReadersOur target readers are shareholders and investors, along with financial institutions, Daito Group employees and their families, and all other stakeholders with whom we have a close connection.
■ IndicatorsUnless otherwise indicated, the figures in this report are for FY2015, or are true as of the end of FY2015
■ Report PeriodFY2015 (the fiscal year ended March 31, 2016)
■ PublishedJuly 2016
01 Business Philosophy
03 History
05 Business Model
07 Market Position
08 Market Environment of the Business
11 Performance Highlights
13 Top Message
Strongly Pursuing the Potential of Rental Housing
21 Construction Business
25 Real Estate Business
29 Other Businesses
33 Corporate Governance
39 List of Officers
41 Consolidated Financial Statements
46 Stock Information
Contents
FACT — Business Overview
STRATEGY — Growth Strategy
ACTIVITIES — Value-Creating Activities
FINANCE — Financial Information
■ The Group’s Communication ToolsFinancial information
Non-financial information
CustomersBusiness partners
CSRReport
Shareholders and investorsFinancial institutions
WEBSITE
Environmental Report
Fact Book
Strategy Report (Integrated
Report)
For convenience, corporate names are abbreviated as follows in this document.• Daito Trust Construction Group → Daito Group• Daito Trust Construction Co., Ltd. → Daito Trust• Daito Building Management Co., Ltd. → Daito Building
Note: According to a definition by the Japanese Ministry of Land, Infrastructure, Transport and Tourism (MLIT), “apartment” refers to buildings of two or three stories constructed with iron, concrete, and wood, while “condominium” refers to buildings of three or more stories constructed with iron and concrete or steel-reinforced concrete.
02

Creation of a Business Model Matching the Needs of Property Owners
Stocks Listed to Strengthen and Improve Management
Major Shift to the Rental Housing Business in Step with Changes in Society
1974 1980 1990 19951985
FoundingFY1991
Sales surpass
¥200 billion
FY1989Sales surpass
¥100 billion
Since June 1974, the Daito Group has responded to the changing needs of society and customers by taking on
numerous challenges over the years. We have pursued business expansion by shifting emphasis from commercial
properties to residential properties, and transformed our business model from one based on a mutual aid associa-
tion to a unique, whole-building lease method.
March 1980: Founding of Daito Kyosaikai, the basis of growth
February 1995: Launched the sale of New Crestall 24
Drawing on how a mutual aid society works, Daito Kyosaikai was founded in response to requests from rental property owners, to guarantee them a certain amount of rent when business spaces became vacant. This guarantee was realized through mar-keting based on tenant demand and strong tenant mediation capabilities. The association became a stepping stone for Daito’s nationwide business expansion because there were no other rental property management proposals that provided a hedge against vacancies and the risk of losing rental income.
Following the Revised Productive Green Land Act in 1992, Japan began taxing farmland in the suburbs at about the same rate as building land. This led to a glut in the supply of rental properties, with vacancy rates rising as a consequence. Compounded by a recession triggered by the yen appreciating, Daito was faced with the major challenge of sluggish sales. To overcome this bottleneck, the Company shifted the emphasis of its real estate rental operation from provision of business properties to provision of residential properties. This was followed in February 1995 by the sale of New Crestall 24, an apartment building with an early American design, developed to differentiate Daito from com-petitors. The apartment building turned out to be very popular among property owners and provided the Company with a major turnaround in business momentum.
· All 73 items of Daito’s compliance with Japan’s Corporate Governance Code announced on the first day of the disclosure period
· Appointment of the Company’s first female outside director
· Investment for the first time in a new real estate development business in the U.S.
FY2015 Topics
2015
· Maturity of whole-building leases extended to 35 years
· Online housing search service on LINE Talk launched
· Credit card settlement agency subsidiary, House Payment Co., Ltd. established
· Pal Mail, a service for monitoring gas meters in order to check on the wellbeing of elderly residents, launched
· Subsidiary, HOUSE GUARD SSI, launches the sale of Owner’s Guard insurance policies for property owners
· First Daito Kentaku e-Heya Net Ladies tournament, a professional golf tournament, held
4 5 6 7 8 9
Founding Period
Transformation Period
Growth Period
FACT
History
February 1992: Listed stocks as Daito Trust Construction Co., Ltd. on the First Section of the Tokyo Stock Exchange to better serve the public
Daito began a plan to list its stocks to improve and strengthen its man-agement and become a company capable of better serving the public. The Company’s name recognition rose following the listing on the First Section of the Tokyo Stock Exchange as Daito Trust Construction Co., Ltd. in February 1992, and subsequently became the fountainhead for further growth.
03

Development of New Services in Relentless Pursuit of Uniqueness
2000 2005 2010 (FY)2015
FY2010 Sales surpass
¥1,000 billion
FY2005 Sales surpass
¥500 billion
Units under management as of 1998
200 thousand
Units under management
as of June 2005
400 thousand
Units under management
as of July 2009
600 thousand
Units under management
as of July 2013
800 thousand
July 2006: Lease Management Trust System launched
Continued operation of the Daito Kyosaikai ran into difficulties when the revised Insurance Business Act went into effect in April 2006. After reviewing the sit-uation, Daito decided to change course and adopt a business model based on whole-building leases. To create added value different from its competitors, Daito introduced the Lease Management Trust System to rigorously reduce the risk burden of prop-erty owners, including by assuming the repair and restoration costs of the apartment buildings. The Lease Management Trust System, leveraging the strengths of the Group, continues to drive the growth of Daito to this day.
2016
· Ranked first in “the 2015 Awards for Excellence in Corporate Disclosure” by securities analysts for the seventh time, and for the sixth consecutive year
· D-COMPASS employee attitude survey launched
· Shares in healthcare and nursing care provider, Solasto Corporation, acquired
· DK SELECT, a new rental housing brand, launched
10 11 12 1 2 3· Call center for foreign language speakers launched
Accelerated Growth Period
1,500¥1,411.6 billion
(Result)
1,000
500
FINA
NC
EF
AC
TS
TR
AT
EG
YA
CT
IVIT
IES
See page 13 for details
We will also continue to focus on our core operations as we expand the scope of our business.
Growth strategywith the slogan of
“Strongly Pursuing the Potential of Rental Housing”
Net sales (Billions of yen)
04

Lease Management Trust System
Positioning our own unique Lease Management Trust System in the center of our businesses, the Daito Group
engages in construction, real estate, and other businesses together with Group companies, and provides owners
with the stable operation of our building rental business and tenants with safe and secure dwellings and comfort-
able lifestyles.
Construction Business
Real Estate Business
Other Businesses
Our Group companies possess a variety of specialized customer capabilities, including providing a wide range of responses to land utilization needs, and lifestyle support that delivers security and comfort.
The Lease Management Trust System is the Daito Group’s unique total system that covers the various risks associated with lease management with a sense of security.
● Daito Construction Co., Ltd. [6.58 / 0.13]Constructs mid- to high-rise rental condominiums in urban centers
● Daito Steel Co., Ltd. [4.58 / 0.19]Produces and constructs steel frames and sale of exterior products
● Daito Building Management Co., Ltd. [747.26 / 34.60]Total management of rental buildings and provision of cus-tomer services
● Housecom Co., Ltd. [9.30 / 0.80]Rental building real estate agent in Kanto and Tokai regions
● House Leave Co., Ltd. [6.43 / 5.23]Provides agency guarantee services mainly for tenants’ rent liabilities
● Ju-See Publishing Co., Ltd. [4.61 / 0.18] Produces and publishes rental building information magazines and operation of their websites
¥ 595.3 billionConstruction Business
Construction Business ¥ 90.2 billion
¥ 774.8 billionReal Estate Business
Real Estate Business ¥ 22.5 billion
¥ 41.4 billionOther Businesses
Other Businesses ¥ 8.9 billion
Construction Business
We plan and propose building rental businesses to landowners who are thinking of ways to utilize their inherited assets, and then design and construct the contracted rental buildings.
Net sales¥ 1,411.6 billion
FY2015
Operating income
¥ 101.0 billion*FY2015
Group Companies [FY2015: Net sales and operating income (Billions of yen)]
* Includes expenses that cut across all businesses.
FACT
Business Model
Design and construction
Plans and proposals
78 thousand
Number of owners
As of April, 2016
165 thousand units
Cumulative number of units constructed
As of March 31, 2016
Energy Business
05

Land Inheritance and the Social Role of Rental Housing in Japan
In Japan, a majority of people believe that land is an important hered-itary asset that should be passed on to succeeding generations. At the same time, our customers face the issue of finding measures for dealing with inheritance and landholding taxes. The building rental business is recognized as one of the most effective means of land utilization to solve these issues. By construct-ing a building on vacant land, our customers can reduce both the inheritance tax and the fixed asset tax. The Daito Group’s business model is designed to meet these needs of landowners.
Other Businesses
35-year whole-building leases
● Gaspal Co., Ltd. [25.41 / 3.53]Constructs LP gas facilities and supplies LP gas to rental buildings
● Daito Energy Co., Ltd. [0.003 / (0.007)]Supplies and sells energy such as electric power to rental buildings
● Gaspal Kyushu Co., Ltd. [Started business in June 2016]Constructs LP gas facilities and supplies LP gas to rental buildings in the Kyushu area
● Daito Gas Partner Co., Ltd. [Established in January 2016]Constructs LP gas facilities and supplies LP gas to rental buildings in the Okinawa area
● Care Partner Co., Ltd. [9.71 / 0.18]Operates elderly day-care centers (visiting care) and nurseries
● Daito Asia Development (Malaysia) Sdn. Bhd. [2.55 / 0.25]Conducts overseas hotel business (Malaysia)
● D.T.C. REINSURANCE LIMITED [3.34 / 1.25]A reinsurance company for tenants’ fire insurance
● Daito Finance Co., Ltd. [1.34 / 0.86]Handles financing such as construction funds (for a contract fee)
● Daito Corporate Service Co., Ltd. [0.81 / 0.01]A special subsidiary to employ people with disabilities: document printing, sending, and related services*In April 2016, the Company merged with Daito Business Center Co., Ltd. [0.83 / 0.06]
● HOUSE GUARD S.S. Insurance Co., Ltd. [0.88 / (0.03)]Sells comprehensive insurance to rental housing tenants
● Daito Mirai Trust Co., Ltd. [0.17 / 0.08]Provides services related to real estate management trusts and to asset succession consulting
● House Payment Co., Ltd. [0.009 / (0.01)]Credit card settlement agency business for rental housing tenants
Source: FY2015 data provided by the Daito Group
The main reason our customers want to utilize land
· Tax measures 48.4%Deal with inheritance tax
34.9%
· Unsure about continuing farming 7.4%
· Make effective use of idle land 12.1%
· Secure stable income 25.8%Deal with land ownership tax
13.5%
· Others 6.3%
Real Estate Business
We recruit tenants for constructed rental buildings then provide property management and operation services for the buildings.
● Energy Business ● Care and Nursery School Businesses ● Overseas Business ● Other Businesses (Finance, etc.)
Management and operation
Overseas Business Other Businesses (Finance, etc.)
Tenant recruitment
*EstimatedAs of March 31, 2016
Approx. 1.71million*
Number of actual tenants
As of March 31, 2016
960 thousand units
Number of rental properties under management
FA
CT
ST
RA
TE
GY
AC
TIV
ITIE
SFIN
AN
CE
Care and Nursery School Businesses
06

FACT
Market Position
Rank Company Units supplied
1 Daito Trust Construction Co., Ltd. 66,314
2 Sekisui House, Ltd. 49,975
3 Daiwa House Industry Co., Ltd. 46,651
4 Asahi Kasei Homes Corporation 17,484
5 Sekisui Chemical Co., Ltd. 14,490
Rank Company Units supplied
1 Daito Trust Construction Co., Ltd. 156,151
2 Able Inc. 152,978
3 MiniMini Corporation 148,986
4 Housecom Co., Ltd.* 67,369
5 Token Corporation 65,959
Rank Company Units supplied
1 Daito Group 864,678
2 Leopalace21 Corporation 554,948
3 Sekisui House Group 545,757
4 Daiwa Living Co., Ltd. 428,597
5 Starts Group 400,047
The Daito Group continues to supply added value to meet the needs of the times through the Lease Management
Trust System, the Group’s unique business model, and is building a strong position in the rental housing market.
Housing Supplier Ranking (Excluding condominiums)
Source: Japan Real Estate Institute, August 2015 (Actual result: FY2014)
Rental Brokerage Ranking
Source: Zenkoku Chintai Jutaku Shimbun, January 2016 (Actual result: Oct. 2014 – Sep. 2015)
Company names are as published in the referenced source
Rental Housing Management Ranking
Source: Zenkoku Chintai Jutaku Shimbun, August 2015 (Actual result: As of March 31, 2015)
For 7 Consecutive Years
For 6 Consecutive Years
For 19 Consecutive Years
* Daito’s Group company
07

FACT
Market Environment of the Business (Related business)
Source: Cabinet Office “2016 Annual Report on the Aging Society”
• While the overall population is decreasing, the population aging rate is increasing.
• The elderly population (aged 65 and over) stood at 33.93 million in 2015 and has continued to increase. It is projected to peak at 38.78 million in 2042, before declining; however, the population aging rate will increase.
• By 2060, the population aging rate is projected to reach 39.9%, with 1 person aged 65 or above for every 2.5 people aged under 65.
• Mortality is expected to increase through to 2040, with an associated increase in incidences of inheritance and landholding tax.
• In 2015, the revised Inheritance Tax Act was put into effect. The basic exemption was reduced and the maximum tax rate was increased, thereby changing the structure of the tax rates.
• As a result, the number of people subject to the tax is projected to increase by 1.5 times, with a 25% increase in inheritance tax revenues.
• If rental housing is built on vacant land, a certain portion of the land valuation and building valuation will be exempt. This is expected to prompt increased demand for rental housing construction as a tax-reduction strategy.
Aging of the Japanese population (Construction and Real estate)
Revision to the Inheritance Tax Act (Construction and Real estate)
Aging trends and future projections
0
40
0
140.0
35122.5
30105.0
2587.5
2070.0
1552.5
1035.0
517.5
2015 20202010 20602055205020452040203520302025
127.77 127.11 124.10128.06
86.7491.9397.08
102.21107.28116.62
120.66
Overall population (Millions)
Forecasts
Population aging rate (Ratio of people aged 65 or above)People aged 65 or above (Millions)
112.12
(Millions) (%)
(Year)
25.6733.93 36.12
29.2434.6436.2637.6838.5738.6837.4036.8536.58
2005
20.2
26.729.1
23.0
39.939.438.837.736.1
33.4
31.630.3
• Long-term interest rates (10-year government bond yields) in Japan have steadily declined since 1990 in response to the fiscal easing policy of the Bank of Japan.
• The bank’s adoption of a negative interest rate policy in January 2016 has driven interest rates even lower.
• Since fixed-type home loan interest rates move in line with long-term interest rates, they have now reached an extremely low level, which is providing a tailwind for apartment loans.
Low interest rates due to the fiscal easing policy (Construction)
Long-term interest rates (10-year government bond yields)
0
9
1
8
7
6
5
3
4
2
1989 201520101995 2000 2005
(%)
Source: Ministry of Finance “Statistics and Interest Rate Information”
People subject to inheritance
tax
Tax revenue
1.5 times50,000 people (4%) 75,000 people (6%)
People subject to inheritance tax in 2011(number of deceased persons in 2011:
1.25 million)
People subject to inheritance tax in 2015(estimate; calculated based on 1.25 million
deceased persons in a year)
1.0
1.2
1.4
1.6
1.8
2012
1.3
1.51.4
1.8
2013 2014 2015(estimate)
(Trillions of yen)
Revenue from inheritance tax is estimated to increase 25%
Source: National Tax Agency “Taxation Reform” and “Status of Inheritance Tax Declarations” Ministry of Finance “Proposed Budget”
In this example, the tax rate will rise from 40% to 45%.
Tax rate structure
Basic taxexemption
Taxable value after basic tax exemption Taxable value after basic tax exemption
60%Tax rate
0%
10%
20%
30%
40%
50%
More than300 million yen
300 millionyen or less
100 millionyen or less
100 millionyen or less
50 millionyen or less30 million
yen or less10 millionyen or less
60%Tax rate
0%
10%
20%
30%
40%
50%
8 steps
More than600 million
yen600 millionyen or less300 million
yen or less200 millionyen or less
50 millionyen or less
30 millionyen or less10 million
yen or less
Standard tax deduction:50 million yenProportional tax deduction based on thenumber of legal heirs:10 million yen × number of legal heirs
Standard tax deduction:30 million yenProportional tax deduction based on thenumber of legal heirs:6 million yen × number of legal heirs
Previous taxation(until December 31, 2014)
Current taxation(from January 1, 2015)
6 steps
FA
CT
ST
RA
TE
GY
AC
TIV
ITIE
SFIN
AN
CE
08

FACT
Market Environment of the Business (Related business)
• The number of new rental housing construction starts in Japan has been increasing since FY2011. In particular, the number rebounded in FY2015 after declining in FY2014.
• Market shares of construction industry players have been generally constant.
• Daito Trust retains the top share in the industry.
Number of new rental housing construction starts and market shares of industry players (Construction)
2015201420132012201100
24
21
50 3
400
350
18300
15250
9150
12200
6100
Total number of new rental housing construction starts in Japan (Thousands of units)Daito Trust (%) Company D (%) Company S (%) (%)
289
9.4
9.4
19.2 320
18.5
9.5
8.7
369
8.8
8.2
17.0
358
17.5
10.3
9.7
384
15.5
8.5
10.1
(FY)
(Thousands of units)
• Having peaked at 128.06 million in 2010, Japan’s population is projected to decline 12.4% by 2035 to 112.12 million.
• However, the number of households is projected to increase until 2020, and then begin a gradual decline.
Declining trend in national population and number of households over the medium to long term (Construction and Real estate)
Population and number of households
0
140
0
140
120 120
100 100
80 80
60 60
40 40
20 20
1980 1990 19951985 20352030202520202015201020052000
Population (Millions of people)
Forecasts
Number of households (Millions of households)
(Year)
117.06123.61 125.57121.05
112.12116.62120.66124.10126.60128.06127.77126.93
35.82 40.67 43.9037.98
49.5651.2352.4453.0552.9051.8449.0646.78
(Millions of people) (Millions of households)
Source: National Institute of Population and Social Security Research “Population Projection for Japan” and “Household Projection for Japan”
• The unit labor cost remained at a low level for a long period, but has been rising constantly over the past three years.
• Construction material prices have remained level overall.
Unit labor cost and material price in the Japanese construction market (Construction)
Public sector construction unit labor cost and construction material price index
Number of new rental housing construction starts and shares of industry players
10
12
14
16
18
20
22
0
120
80
100
60
20
40
2005 20062004 201520142013201220112010200920082007
Public sector construction unit labor cost (Thousands of yen) Construction material price index (FY2010 = 100)
90.8 93.598.5
91.1
106.4109.0104.9
99.1100.2100.098.1
111.2
14.1 13.7 13.513.8
16.616.1
15.1
13.013.013.113.313.3
(FY)
(Thousands of yen) (Index)
Source: Ministry of Land, Infrastructure, Transport and Tourism “Public Sector Construction and Design Unit Labor Cost National Average for All Work Types” Economic Research Association “Construction Material Price Index by City (Construction and Civil Engineering Combined)”
Source: Ministry of Land, Infrastructure, Transport and Tourisms “Housing Starts Statistics” and respective company data
09

• In the U.S. real-estate market, the ratio of home-owners has been declining since the financial crisis stemming from the subprime mortgage issue and the Lehman Brothers’ collapse.
• The U.S. population aged 20–34 is increasing, and lifestyle changes are seeing people marry and have children later in life. These changes are driving an increase in people who choose to move into new rental housing.
Increasing demand for rental housing in overseas markets (Other)
70
601965 1970 2010 2015
2000
1975 1980 1985 1990 1995 2000 2005
61
65
64
67
66
69
68
63
62
541980 20101990
56
62
60
66
64
68
58
(Millions)
(Year)
(Year)
70
601965 1970 2010 2015
2000
1975 1980 1985 1990 1995 2000 2005
61
65
64
67
66
69
68
63
62
541980 20101990
56
62
60
66
64
68
58
(Millions)
(Year)
(Year)
Ratio of U.S. homeowners
U.S. population aged 20–34
• The full liberalization of the electricity retail market will open up Japan’s approximately ¥8.0 trillion electricity retail market.
• Approximately 85 million households and small businesses will become potential customers.
• In 2017, the gas retail market will be deregulated, opening the city gas retail market with a scale of around ¥2.4 trillion.
Liberalization of the energy retail markets (Other)
Electricity retail market liberalization from April 2016
Market scale ¥8.0 trillion
Number of subscribers: General household sector 77.95 million
Shops, offices, etc. 7.18 million
Source: Ministry of Economy, Trade and Industry “Outline of Full Liberalization of the Electricity Retail Market”
Source: Census, Urban Institute
Source: Census, Zelman and Associates, Greystar
Source: Ministry of Health, Labour and Welfare “Report on Nursing-Care Insurance Business” and “Summary Report on Situation concerning Nursery Schools”
• The number of people certified as requiring nursing care under the long-term care insurance system has increased steadily over the past 10 years, along with emerging needs for nursing care support. Japan’s nursing care support market is expanding rapidly.
• The number of children waiting for nursery school placements has been constant every year. Expectations are rising for private-sector expertise to resolve the distorted demand-supply gap in the nursery school industry.
Increase in people certified as requiring nursing care and increase in children waiting for nursery school placements (Other)
People certified as requiring nursing care or support and number of children waiting for nursery school placements
201520142013201220112010200920082007200620050
70
0
1 10
7
606
505
303
404
202
(Millions) (Thousands)
(FY)
People certi�ed as requiring nursing care (Millions) Children waiting for nursery school placements (Thousands)
4.40 4.524.32
6.206.055.835.61
5.305.064.844.67
23212224252625
19
(%)
Subprime mortgage issue2007–2009Lehman Brothers’ collapseSeptember 15, 2008
FA
CT
ST
RA
TE
GY
AC
TIV
ITIE
SFIN
AN
CE
10

FACT
Performance Highlights
’06/3 ’07/3 ’08/3 ’09/3 ’10/3 ’11/3 ’12/3 ’13/3 ’14/3 ’15/3 ’16/3 ’17/3 ’18/3 ’19/3 ’20/3 ’21/3Year-on-year
change
( ’16/3 ’15/3 )
Operating results Unit
Net sales Billions of yen 538.6 564.3 641.0 954.8 972.6 1001.1 1,087.1 1,152.4 1,259.6 1,353.1 1,411.6 1,498.0 1,595.0 1,681.2 1,763.7 1,847.8 104.3%
Construction Business Billions of yen 419.8 441.2 439.9 469.6 465.5 430.2 468.6 489.5 545.3 589.1 595.3 623.0 658.4 689.4 715.4 741.4 101.1%
Real Estate Business Billions of yen 89.8 93.8 171.3 464.7 483.5 545.2 589.9 630.4 677.6 723.8 774.8 825.7 872.5 918.2 966.1 1,016.0 107.0%
Other Businesses Billions of yen 28.9 29.1 29.7 20.4 23.4 25.6 28.5 32.4 36.6 40.1 41.4 49.3 64.1 73.6 82.2 90.4 103.2%
Gross profit Billions of yen 172.9 181.0 187.1 181.8 188.7 195.3 214.1 218.4 233.0 238.9 254.4 274.9 287.2 303.6 318.2 333.1 106.5%
Construction Business Billions of yen 130.1 135.4 141.8 150.3 166.4 167.0 175.1 172.1 175.2 172.5 176.2 186.9 197.2 207.1 214.9 222.7 102.2%
Real Estate Business Billions of yen 23.3 25.0 28.0 25.3 14.4 19.2 29.2 35.3 45.3 52.2 62.6 70.4 71.1 76.2 81.5 86.9 119.7%
Other Businesses Billions of yen 19.5 20.5 17.1 6.2 7.8 9.0 9.7 10.9 12.4 14.1 15.5 17.6 18.9 20.3 21.8 23.5 110.0%
Operating income Billions of yen 63.7 72.6 66.2 70.3 71.1 73.7 81.9 82.4 89.7 91.5 101.0 107.0 112.0 118.0 123.0 128.0 110.4%
Operating income margin % 11.8 12.9 10.3 7.4 7.3 7.4 7.5 7.2 7.1 6.8 7.2 7.1 7.0 7.0 7.0 6.9 +0.4P
Net income attributable to owners of the parent Billions of yen 36.8 41.8 44.4 42.1 45.3 43.1 47.1 51.6 55.2 56.1 67.2 74.5 77.9 82.1 85.4 88.8 119.9%
Financial position
Total assets Billions of yen 440.4 473.3 532.1 540.4 558.1 532.9 569.0 617.7 684.4 701.1 728.5 731.7 737.9 754.7 805.0 844.4 103.9%
Shareholders’ equity Billions of yen 242.0 274.6 300.8 295.7 311.5 131.1 158.3 191.2 224.8 240.5 250.1 272.1 291.4 311.8 332.5 344.8 104.0%
Equity ratio % 55.0 58.0 56.5 54.7 55.8 24.6 27.8 31.0 32.9 34.3 34.3 37.2 38.4 40.3 41.3 40.8 +0.0P
ROE % 15.6 16.2 15.5 14.1 14.9 19.5 32.5 29.6 26.6 24.1 27.4 28.5 27.6 27.2 26.5 26.2 +3.3P
Shareholder return
EPS Yen 299 345 367 349 386 384 594 648 693 710 863 953 1,012 1,083 1,144 1,208 121.5%
Cash dividends per share Yen 87 94 232 104 193 229 297 324 347 375 432 477 506 542 572 604 115.2%
Payout ratio % 29.1 27.2 63.2 29.8 49.9 59.6 50.0 50.0 50.0 52.8 50.1 50.0 50.0 50.0 50.0 50.0 −2.7P
Total return ratio (including treasury stock acquisition) % 76.7 74.0 81.7 57.2 79.8 526.0 50.0 50.0 80.0 82.8 80.1 80.0 80.0 80.0 80.0 80.0 −2.7P
Indicators related to the construction business
Value of orders received Billions of yen 414.2 408.6 498.5 437.2 435.2 503.4 611.7 655.1 625.8 660.4 693.0 715.0 737.0 763.0 787.0 812.0 104.9%
Number of construction sales staff People 2,579 2,985 3,087 3,020 2,830 2,981 3,222 3,204 3,325 3,247 3,420 3,500 3,620 3,740 3,860 3,980 105.3%
Net sales from completed construction* Billions of yen 419.8 441.2 439.9 469.6 465.5 430.2 468.6 489.5 545.3 589.1 595.3 623.0 658.4 689.4 715.4 741.4 101.1%
Gross profit margin for completed projects % 31.0 30.7 32.3 32.0 35.8 38.8 37.4 35.2 32.1 29.3 29.6 30.0 30.0 30.0 30.0 30.0 +0.3P
Indicators related to the real estate business
Number of tenant recruitment Thousands 133 146 159 171 180 204 214 220 241 253 267 284 303 321 339 358 105.4%
Rental housing units under management Thousands 404 454 502 552 598 645 694 747 805 864 923 981 1,039 1,099 1,162 1,227 106.8%
Rent-based occupancy rate on a revenue-from-rent basis (March) % 97.0 96.6 96.4 95.6 94.6 96.0 96.8 96.7 96.9 96.7 96.8 96.8 96.8 96.8 96.8 96.8 +0.1P
Cash flows
Cash flows provided by operating activities Billions of yen 66.1 60.3 25.4 30.2 46.0 60.7 77.8 87.8 83.8 59.4 78.8
Cash flows (used in) provided by investing activities Billions of yen (20.0) (13.1) 12.4 (13.4) (26.8) 49.9 (11.3) (10.3) (59.4) 0.9 (93.5)
Cash flows used in financing activities Billions of yen (29.7) (12.1) (10.7) (39.6) (29.8) (94.9) (29.4) (36.2) (39.1) (60.8) (57.9)
Cash and cash equivalents at end of period Billions of yen 146.1 181.2 208.2 181.5 170.7 184.8 221.0 264.1 253.2 255.5 182.6
* In accordance with the revision of the “Accounting Standard for Disclosures about Segments of an Enterprise and Related Information,” from FY2010, the sales from building and repairs of Daito Building that had previously been included under other in net sales–construction contracts were recorded under net sales–real estate.
11

’06/3 ’07/3 ’08/3 ’09/3 ’10/3 ’11/3 ’12/3 ’13/3 ’14/3 ’15/3 ’16/3 ’17/3 ’18/3 ’19/3 ’20/3 ’21/3Year-on-year
change
( ’16/3 ’15/3 )
Operating results Unit
Net sales Billions of yen 538.6 564.3 641.0 954.8 972.6 1001.1 1,087.1 1,152.4 1,259.6 1,353.1 1,411.6 1,498.0 1,595.0 1,681.2 1,763.7 1,847.8 104.3%
Construction Business Billions of yen 419.8 441.2 439.9 469.6 465.5 430.2 468.6 489.5 545.3 589.1 595.3 623.0 658.4 689.4 715.4 741.4 101.1%
Real Estate Business Billions of yen 89.8 93.8 171.3 464.7 483.5 545.2 589.9 630.4 677.6 723.8 774.8 825.7 872.5 918.2 966.1 1,016.0 107.0%
Other Businesses Billions of yen 28.9 29.1 29.7 20.4 23.4 25.6 28.5 32.4 36.6 40.1 41.4 49.3 64.1 73.6 82.2 90.4 103.2%
Gross profit Billions of yen 172.9 181.0 187.1 181.8 188.7 195.3 214.1 218.4 233.0 238.9 254.4 274.9 287.2 303.6 318.2 333.1 106.5%
Construction Business Billions of yen 130.1 135.4 141.8 150.3 166.4 167.0 175.1 172.1 175.2 172.5 176.2 186.9 197.2 207.1 214.9 222.7 102.2%
Real Estate Business Billions of yen 23.3 25.0 28.0 25.3 14.4 19.2 29.2 35.3 45.3 52.2 62.6 70.4 71.1 76.2 81.5 86.9 119.7%
Other Businesses Billions of yen 19.5 20.5 17.1 6.2 7.8 9.0 9.7 10.9 12.4 14.1 15.5 17.6 18.9 20.3 21.8 23.5 110.0%
Operating income Billions of yen 63.7 72.6 66.2 70.3 71.1 73.7 81.9 82.4 89.7 91.5 101.0 107.0 112.0 118.0 123.0 128.0 110.4%
Operating income margin % 11.8 12.9 10.3 7.4 7.3 7.4 7.5 7.2 7.1 6.8 7.2 7.1 7.0 7.0 7.0 6.9 +0.4P
Net income attributable to owners of the parent Billions of yen 36.8 41.8 44.4 42.1 45.3 43.1 47.1 51.6 55.2 56.1 67.2 74.5 77.9 82.1 85.4 88.8 119.9%
Financial position
Total assets Billions of yen 440.4 473.3 532.1 540.4 558.1 532.9 569.0 617.7 684.4 701.1 728.5 731.7 737.9 754.7 805.0 844.4 103.9%
Shareholders’ equity Billions of yen 242.0 274.6 300.8 295.7 311.5 131.1 158.3 191.2 224.8 240.5 250.1 272.1 291.4 311.8 332.5 344.8 104.0%
Equity ratio % 55.0 58.0 56.5 54.7 55.8 24.6 27.8 31.0 32.9 34.3 34.3 37.2 38.4 40.3 41.3 40.8 +0.0P
ROE % 15.6 16.2 15.5 14.1 14.9 19.5 32.5 29.6 26.6 24.1 27.4 28.5 27.6 27.2 26.5 26.2 +3.3P
Shareholder return
EPS Yen 299 345 367 349 386 384 594 648 693 710 863 953 1,012 1,083 1,144 1,208 121.5%
Cash dividends per share Yen 87 94 232 104 193 229 297 324 347 375 432 477 506 542 572 604 115.2%
Payout ratio % 29.1 27.2 63.2 29.8 49.9 59.6 50.0 50.0 50.0 52.8 50.1 50.0 50.0 50.0 50.0 50.0 −2.7P
Total return ratio (including treasury stock acquisition) % 76.7 74.0 81.7 57.2 79.8 526.0 50.0 50.0 80.0 82.8 80.1 80.0 80.0 80.0 80.0 80.0 −2.7P
Indicators related to the construction business
Value of orders received Billions of yen 414.2 408.6 498.5 437.2 435.2 503.4 611.7 655.1 625.8 660.4 693.0 715.0 737.0 763.0 787.0 812.0 104.9%
Number of construction sales staff People 2,579 2,985 3,087 3,020 2,830 2,981 3,222 3,204 3,325 3,247 3,420 3,500 3,620 3,740 3,860 3,980 105.3%
Net sales from completed construction* Billions of yen 419.8 441.2 439.9 469.6 465.5 430.2 468.6 489.5 545.3 589.1 595.3 623.0 658.4 689.4 715.4 741.4 101.1%
Gross profit margin for completed projects % 31.0 30.7 32.3 32.0 35.8 38.8 37.4 35.2 32.1 29.3 29.6 30.0 30.0 30.0 30.0 30.0 +0.3P
Indicators related to the real estate business
Number of tenant recruitment Thousands 133 146 159 171 180 204 214 220 241 253 267 284 303 321 339 358 105.4%
Rental housing units under management Thousands 404 454 502 552 598 645 694 747 805 864 923 981 1,039 1,099 1,162 1,227 106.8%
Rent-based occupancy rate on a revenue-from-rent basis (March) % 97.0 96.6 96.4 95.6 94.6 96.0 96.8 96.7 96.9 96.7 96.8 96.8 96.8 96.8 96.8 96.8 +0.1P
Cash flows
Cash flows provided by operating activities Billions of yen 66.1 60.3 25.4 30.2 46.0 60.7 77.8 87.8 83.8 59.4 78.8
Cash flows (used in) provided by investing activities Billions of yen (20.0) (13.1) 12.4 (13.4) (26.8) 49.9 (11.3) (10.3) (59.4) 0.9 (93.5)
Cash flows used in financing activities Billions of yen (29.7) (12.1) (10.7) (39.6) (29.8) (94.9) (29.4) (36.2) (39.1) (60.8) (57.9)
Cash and cash equivalents at end of period Billions of yen 146.1 181.2 208.2 181.5 170.7 184.8 221.0 264.1 253.2 255.5 182.6
CAGR (10 year period from ’06/3 to ’16/3)
Net sales 10.1% Number of construction sales staff 2.9%
Operating income 4.7% Number of tenant recruitment 7.2%
EPS 11.2% Rental housing units under management 8.6%
Mid-Term Management Plan
FA
CT
ST
RA
TE
GY
AC
TIV
ITIE
SFIN
AN
CE
12

STRATEGY
Top Message
13

To Our Shareholders
The Daito Group is carrying out its medium-term management plan under the
slogan “Strongly Pursing the Potential of Rental Housing.” We do more than just
build rental housing—we pursue greater potential from rental housing, from Daito
Trust and from ourselves as individuals. In doing so, we promote business activities
designed to energize local economies, in order to better serve residents’ daily lives
and their communities.
In the fiscal year ended March 31, 2016 (FY2015), we saw sales and profits
increase for an eighth straight year, with operating income and ordinary income
both surpassing ¥100 billion for the first time since our listing. Our performance
also exceeded targets for both return on equity (ROE), which came in at 27.4%,
and the operating income margin, which was 7.2%.
We paid our shareholders a cash dividend per share of ¥432 for the year, and
in the fiscal year ending March 31, 2017 (FY2016), we are projecting a dividend
increase of ¥45 for an annual cash dividend per share of ¥477.
In the rental housing market, the January 2015 revision of the Inheritance Tax Law
and low interest rates on apartment loans are stimulating further demand for asset
utilization among landowners. We also expect tenant demand for rental housing
to remain firm, partly reflecting the increasing trend in the number of single-person
households. In this promising business environment, we will make a fully focused
effort to recover our share of new rental housing construction starts from a year-
on-year decline in FY2015, and continue to target growth in sales and profits.
Accordingly, under our medium-term management plan, which was formulated
looking ahead to 2020, our policy is to drive growth by drawing on the original busi-
ness model we have cultivated since our foundation, seeking to further consolidate
our position in the domestic construction and real estate markets. In addition, we will
focus our efforts on the new core businesses of energy, care and nursery schools,
and overseas and work to expand our businesses and enhance our earning capabil-
ity. At the same time, we will take our corporate governance a step further to maintain
transparent management. By steadily executing these strategies, we are certain that
we will continue the growth and corporate value enhancement of the Daito Group.
We believe that the only path to sustainable growth is to be a company that is truly
trusted by its customers.
All Group employees will reaffirm the significance of “trust” in being “entrusted
with land that was built on or with land to build on” as we work together as one to
achieve the objectives of the medium-term management plan.
FAC
TS
TR
AT
EG
YA
CT
IVIT
IES
Naomi KumakiriPresident and Representative Director (CEO)
FINA
NC
E
14

STRATEGY
Top Message
In FY2015, the Daito Group achieved new records in net sales and all levels of earnings for an eighth straight year of sales and profit growth, with both operating income and ordinary income surpassing ¥100 billion for the first time. Net sales increased 4.3% year on year to ¥1,411,643 mil-lion, operating income increased 10.4% to ¥101,001 million, ordinary income increased 10.1% to ¥105,558 million, and net income attributable to owners of the parent increased 19.9% to ¥67,279 million. Performance exceeded targets for both ROE, at 27.4% (target: 20.0% or higher), and the operating income margin, at 7.2% (target: 7.0% or higher). FY2015 was an epoch-making year for the Group, particularly with the launch of our new brand, DK SELECT,
The Group delivered record-high profit by achieving increases in sales and earnings for the eighth straight year.
ROE 27.4%
Operating income margin 7.2%
Naomi KumakiriPresident and Representative Director (CEO)In charge of Construction Business Headquarters and Corporate Management Headquarters
Hitoshi KadouchiVice President and Representative Director In charge of Real Estate Business Headquarters and Subsidiary Business Headquarters
We will provide rental housing residents with comfortable lifestyles, while pushing ahead with business activities that energize towns and local communities and the regional economy.
Strongly Pursuing the Potential of Rental Housing
“We will harness changes in the business environment and grasp our unique strengths as a group accurately and objectively, using them to bolster our competitiveness as we aim for sustainable growth.”
“We will take steps to increase our competitive capabilities while deploying our original business model centered on the Lease Management Trust System.”
15

Total return ratio 80.1%
as a coverall term for rental housing. Looking at results by segment, in the construction business segment, Net sales from completed construction rose 1.1% year on year to ¥595.3 billion, reaching an all-time high. The gross profit margin for completed contracts increased by 0.3 of a percentage point year on year to 29.6% with improved profitability on completed construc-tion contracts due to a sales price revision and other fac-tors, despite a continued increase in labor costs. However, the share of rental housing construction starts among con-struction starts in Japan increased by 7.1% year on year, with the Group’s share of these declining 2.0 percentage
points to 15.5%. In the real estate business segment, sales increased 7.0% year on year to ¥774.8 billion, mainly due to an increase in rental revenue at Daito Building, and a con-tribution from the sales of House Leave Co., Ltd. The gross profit margin also increased 0.9 of a percentage point to 8.1%. We also saw steady growth in the other businesses segment as sales increased 3.2% year on year to ¥41.4 billion and the gross profit margin grew 2.3 percentage points to 37.5%. The main factors driving growth were the launch of Group company operations including an LP gas supply business, a day-care service for elderly people, and a small-amount and short-term insurance business.
Net sales Operating income
Cash dividends/Payout ratio/Total return ratio
Within the Daito Group, our basic policy is to maintain sta-ble dividend payments. In specific terms, our dividend pay-ments consist of a base dividend and an additional profit return component that reflects our business performance. We have issued an annual cash dividend payment of ¥432 per share for FY2015. In addition, we plan to spend ¥20.2 billion, or 30% of our consolidated annual net income for the fiscal year under review, for the acquisition of 1.30 million shares of treasury stock and to extinguish these shares in FY2016. As a result, the payout ratio will be 50.1%. Combined with the acquisition and extinguishment of treasury stock worth 30% of annual net income, the total return ratio will be 80.1%. For FY2016, we plan to issue an annual cash dividend of ¥477 per share, an increase of ¥45 year on year. We also plan to continue to acquire and extinguish treasury stock. The total shareholder return over the three-year period from FY2013 to FY2015 was 79.39%. This has even out-performed TOPIX (7.84%) over the same period.
We will maintain a total return ratio of 80% to retun profits to shareholders.
Mid-Term Management Plan
’14/3 ’15/3 ’16/3 ’17/3 ’18/3 ’19/3 ’20/3 ’21/3
347 375506477
542 572 604
432
50.0 52.8 50.050.0 50.0 50.0 50.050.1
80.0 82.8 80.080.0 80.0 80.0 80.080.1
Cash dividends per share (Yen) Payout ratio (%) Total return ratio (%)
00
100
80
1,500
1,200
60
40
20
900
600
300
(Yen) (%)
Total shareholder return
Daito Trust Construction Co., Ltd. TOPIX
Compared to FY2013 (Past 3 years)
79.39% 7.84%
Mid-Term Management Plan
0
2,000
1,600
1,200
800
400
(Billions of yen)
0
140
80
100
120
60
40
20
(Billions of yen)Mid-Term Management Plan
’14/3 ’15/3 ’16/3 ’17/3 ’18/3 ’19/3 ’20/3 ’21/3 ’14/3 ’15/3 ’16/3 ’17/3 ’18/3 ’19/3 ’20/3 ’21/3
1,259.61,353.1
1,498.01,595.0
1,681.21,763.7
1,847.8
1,411.689.7 91.5
107.0 112.0118.0 123.0 128.0
101.0
FAC
TS
TR
AT
EG
YA
CT
IVIT
IES
FINA
NC
E
16

STRATEGY
Top Message
Meanwhile, the Daito Group has been expanding its original business centered on the Lease Management Trust System, while continuously working to hone its competitive edge. Under the Lease Management Trust System, in addition to the complementary construction and real estate businesses, we will focus our effort on other businesses to enhance the level of our total service. Our unique strengths in the construction business include direct sales capabilities offering flexible proposals to meet the demands of individual landowners and construc-tion capabilities boasting the highest number of housing units supplied and product development capabilities that are leading the times. Furthermore, in the real estate business, we will leverage our abundant experience in rental housing management as a strength to expand our Internet sales channel and enhance our services for comfortable and secure living, promoting original initiatives to respond to the needs of our diversifying tenants. In our other businesses, we will leverage our market- leading rental housing stock to capture opportunities afforded by the full-scale deregulation of the electricity and gas retail markets by developing services to meet the needs of our customers. Amid these changes in the business environment, we will grasp our unique strengths as a group accurately and objectively, using them to bolster our competitiveness as we aim for sustainable growth.
In addition to the revisions to the Inheritance Tax Law in January 2015, the Bank of Japan implemented bold fiscal easing measures, resulting in continued low interest rates on apartment loans. This environment has stimulated demand for asset utilization among landowners. In FY2015, the number of rental housing construction starts in Japan grew 7.1% year on year.
Taking an objective view of the business environment and our strengths to create new growth.
➀ Lease Management Trust System covering all stages from planning to management and operation
➁ Business development capabilities using market-leading rental housing stock➂ Speedy management and ability to achieve targets ➃ Management strategy based on focusing on key points➄ Highly transparent corporate governance system➅ Flexible and well-developed education system
➀ Lack of earnings sources outside of core businesses➁ Corporate image and brand value➂ Next generation leader development program not yet finalized➃ Attrition rate of sales personnel
➀ Revision of Inheritance Tax Law (tax increase)➁ Increase in inheritance needs due to an aging population➂ Low interest rates due to the fiscal easing policy➃ Government policies in response to increase in people certified as requiring
long-term care and increase in children waiting for nursery school placements➄ Full deregulation of the electricity and gas retail markets➅ Increasing demand for rental housing in overseas markets
➀ Declining trend in national population and number of households over the medium to long term
➁ Entry of new players in the market➂ Rapid cost increase in materials and labor due to pressures
inside the construction labor market➃ Foreign exchange rate fluctuation risk
SWOT analysis
Strengths
SOpportunities
O
Weaknesses
WThreats
T
17

In FY2016, we will set key objectives in each business field and make an even greater effort to further our progress under the medium-term management plan, which covers the period through to FY2020. In the construction business segment, we are taking steps to enhance the construction system, which is one of our strengths as a group, by stepping up our efforts to build relationships with various regional partners. We also need to boost cost competitiveness, such as reducing sales prices through continued cost-cutting and other means. In boosting our sales capabilities, we will bolster our capabili-ties to respond to landowners’ asset succession needs by creating the strongest sales force in the industry, focusing on recruiting and training of human resources. Progress in this area will be a vital element in ensuring our sustainable growth. Of course, it is also vital to expand our services in response to landowners’ needs. We will bolster our efforts in comprehensive consulting services for full, smooth asset succession in collaboration with our managed trust company, Daito Mirai Trust Co., Ltd. aiming to increase customer satisfaction. In the real estate business segment, we will continue to promote market penetration of our rental brokerage brand e-Heya Net though television commercials and social media, as well as by holding events such as Ladies Professional Golfers’ Association Tour. We will also con-tinue our efforts to enhance tenant convenience, such as accepting payments by credit card and expanding our ser-vices that do not require a guarantor. Furthermore, we will conduct promotions through our new brand, DK SELECT, and establish the Net Store that offers round-the-clock services every day of the year. In the other businesses segment, we will focus our efforts on our new core businesses of energy, care and nursery school, and overseas, and work to expand them. In the energy business, we will enter the electricity retail business and in the care and nursery school business, we will actively promote and expand care and nursery school services in response to the falling birthrate and the aging population. In our overseas business, we are developing and identifying overseas real estate investment projects, including investments into large-scale real estate facilities in the United States. We are also continuing to develop total asset management services here in Japan as we expand peripheral businesses around our core businesses.
Aiming for a ninth straight year of sales and profit growth in FY2016.
Net sales ¥1,498.0 billion
Operating income
Operating income margin
ROE
¥107.0 billion
7.1%
28.5%
FY2016 Plan
FAC
TS
TR
AT
EG
YA
CT
IVIT
IES
FINA
NC
E
18

STRATEGY
Top Message
Roadmap to Realizing the Medium-Term Management Slogan
Energy Business
Other Businesses
Care and Nursery School Business
Overseas Business
7.0 % or higher
Net sales Operating income marginFY2020 Targets
Target Management Indicators
¥1,847.8 billion
Enhance customer satisfaction
Enhance tenant convenience
Enhance and increase recognition
Construction Business
Real Estate Business
Strengthen sales capabilities
Strengthen systems
Strengthen design and construction capabilities
To realize sustainable growth, we will strengthen the foundation of our competitive edge, leveraging our original business model centered on the Lease Management Trust System. As a company with business operations throughout Japan, the revitalization of regional communities is essential for the Daito Group’s sustainable growth. Our business model is not focused only on inner cities, but aims to work together with owners in every part of Japan. We are working to build relationships between local communities, our customers, and ourselves by promoting various activ-ities in collaboration with people in regions nationwide,
participating actively in community events, and holding events of our own for interacting with neighborhood resi-dents near our construction sites. We are also taking action to preserve the global environ-ment. We work proactively to reduce waste from construc-tion sites and use renewable energy such as solar power generated using the rented rooftops of rental housing. We recognize that recruitment and training of human resources is a key element in achieving medium- to long-term growth. In particular, sales personnel have a powerful influence on the Company’s business promotion capa-bilities, and we have established recruitment and training
We will strengthen the foundation of our competitive advantage to achieve sustainable growth.
19

ROE
Target Management Indicators
20.0 % or higher
Payout ratio
Target
Total return ratio
Target
We will provide rental housing residents with comfortable lifestyles,
while pushing ahead with business activities that energize towns and local communities and the regional economy.
50.0% 80.0%
programs designed to help enhance our sales force in terms of ensuring quantity (personnel numbers) and quality (efficiency). In addition, we aim to enable each individual employee to reach their potential effectively by creating working environments that are sensitive to diversity and work-life balance. We are committed to establishing corporate gover-nance that is appropriate for all of our stakeholders, such as shareholders and investors, and to ensuring highly transparent and efficient management. To maximize our corporate value we will assemble a robust system for management decision-making and supervision, and
advance our business swiftly and efficiently. Furthermore, we will proactively appoint outside directors in tune with our corporate philosophy and strategy, using their experience and expertise effectively to strengthen our management capabilities. Looking ahead, the Daito Group will focus on maxi-mizing our corporate value by strengthening our business development and enhancing our corporate foundation. Our goal is to achieve stronger growth, in order to meet the expectations of our stakeholders.
FAC
TS
TR
AT
EG
YA
CT
IVIT
IES
FINA
NC
E
Strongly Pursuing the Potential of Rental Housing
20

Gross profit from completed projects (Billions of yen)
ACTIVITIES
Construction Business
In FY2015, revisions to the Inheritance Tax Act and low interest rates on apartment loans stimulated further demand for asset utilization among landowners. The construction business already had a large orders backlog, and steady work to complete projects allowed the business to record new record high sales of ¥595.3 billion, up 1.1% year on year. The gross profit margin for completed construction contracts improved due to price hikes, rising 0.3 of a percentage point to 29.6%, and gross profit from completed construction rose 2.2% year on year to ¥176.2 billion. The value of orders received also increased 4.9% year on year to ¥693.0 billion as the number of construction sales staff increased by 5.3% to 3,420. The overall market was strong, with new rental housing construction starts rising 7.1% year on year nationwide to 383,678 units. However, Daito Trust’s market share dipped by 2.0 of a percentage point year on year to 15.5%.
The overall business environment is expected to remain buoyant in FY2016, but competition is likely to intensify as rival housing manufacturers focus their efforts on acquiring orders for rental housing. We expect orders to increase 3.2% year on year to ¥715.0 billion, net sales from completed construction contracts are expected to grow 4.6% year on year to ¥623.0 billion, and gross profit from completed construction contracts is forecast to rise 6.0% to ¥186.9 billion.
0 0
800
600
400
200
0
250
150
200
100
50
80
60
40
20
’14/3 ’15/3 ’16/3 ’21/3’20/3’19/3’18/3’17/3 ’14/3 ’15/3 ’16/3 ’21/3’20/3’19/3’18/3’17/3
Mid-Term Management Plan Mid-Term Management Plan
32.1 29.3 29.6 30.0 30.0 30.0 30.0 30.030.0 30.0 30.0 30.0 30.0
545.3589.1 595.3 623.0 658.4 689.4 715.4 741.4
175.2 172.5 176.2186.9 197.2 207.1 214.9 222.7
(Billions of yen) (%) (Billions of yen)
0 0
900
600
300
0
80
60
40
20
9,000
6,000
3,000
0
40
30
20
10
’14/3 ’15/3 ’16/3 ’21/3’20/3’19/3’18/3’17/3 ’14/3 ’15/3 ’16/3 ’21/3’20/3’19/3’18/3’17/3
Mid-Term Management Plan Mid-Term Management Plan
625.8 660.4 693.0 715.0 737.0 763.0 787.0 812.0
3,325 3,247 3,420 3,500 3,620 3,740 3,860 3,980 17.0 17.5 15.5 17.2 18.1 18.8 19.5 20.2
63 62 5966 69 72 75 77
(People) (Thousands of units) (%)(Billions of yen)
Review of Operations in the Construction Business
In FY2015, orders received hit a record high
Net sales from completed construction (Billions of yen)/Operating income margin for completed construction contracts (%)
Value of orders received (Billions of yen)/Number of construction sales staff (People)
Net sales from completed construction
Net sales from completed construction
¥595.3 billion ¥623.0 billion
Operating income Operating income
¥90.2 billion ¥94.0 billion
FY2015 Results FY2016 Plan
Number of new rental housing construction starts of the Company (Thousands of units)/Share of new rental housing construction starts of the Company (%)
Source: Daito Construction Trust data
21

Daito Trust is bolstering its construction sales system to expand the value of orders received. This not only entails hiring more sales personnel, but also giving them the necessary training to succeed. An aggressive recruitment program aims to increase the sales force to 3,500 members. The source of the Group’s success in direct sales is the training program, which gives sales representatives the know-how to propose rental housing management solutions that meet the specific needs of each landowner. New employees spend their first three months at the Company in an intensive training program. Within three years,
Daito Trust has developed a wide range of sales support measures to help maintain the competitiveness of its con-struction sales operations, allowing the sales force to build strong relationships with landowners and maximize the value of orders. The sales structure motivates employees by dividing the market by region and local area, assigning sales represen-tatives responsibility for sales in a given area, and making their remuneration highly proportional to their performance. The Company offers a diverse selection of products and services covering both hard and soft aspects of the busi-ness, and is constantly working to develop new tools to
they will have become trained professionals, able to make effective property management proposals. Improvements to the training program and revisions to the personnel sys-tem provide a working environment that is comfortable for all, and the Company continues to recruit and train women as sales representatives.
allow sales staff to make better proposals. Furthermore, there are rating systems and recognitions that help to motivate each employee, as well as support for those seeking accreditation or career development. Such efforts promote constant increases in sales efficiency and effectiveness.
Growth Drivers in the Construction Business
Driver 1
Driver 2
Construction business income
Order amount
Number of construction sales
staff
Value of orders received per
construction sales staff member
Net sales from completed
construction
Driver 1
Driver 2
Building an industry-leading sales force by focusing on personnel recruitment and training
Maintaining our competitive edge by promoting an organization with high operating efficiency and diverse sales support measures
Number of construction sales staff
Value of orders received per construction sales staff member
FAC
TS
TR
AT
EG
YA
CT
IVIT
IES
FY2015 Results FY2016 Plan
3,420 people 3,500 people
Number of construction sales staff
Value of orders received per construction sales staff member
FINA
NC
E
FY2015 Results FY2016 Plan
¥1,774 ¥1,730 million per month
million per month
22

ACTIVITIES
Construction Business
To meet the targets of its medium-term management plan, Daito Trust has identified three key objectives: enhancing customer satisfaction, strengthening sales capabilities, and strengthening design and construction capabilities. To reflect customers’ needs and increase satisfaction, the Company offers consulting services and information to help property owners, starting with asset management and asset succession. The Company intends to bolster its sales capabilities
by increasing staff levels to 3,500 and focusing on their training, with the goal of creating the industry’s top con-struction sales capabilities. To strengthen the Company’s design and construc-tion capabilities we will pursue product development targeting attractive, comfortable residences that satisfy tenants. We also aim to strengthen our ties to business partners and develop a construction operation that can work effectively in joint development projects.
Initiatives in the Construction Business
In addition to strengthening sales capabilities, the Company strives to enhance customer satisfaction
A variety of seminars offer information to match customers’ needs
The Company offers various seminars as part of its efforts to expand its customer contact points. These cover issues such as asset management making use of property, inheritance strategies, and rental property management. The seminars benefit not only our new and existing clients, but also address a wide range of inheritance issues for the generation that will inherit assets. For example, one seminar entitled “Parents and chil-dren think about inheriting the family home” dealt with the increasingly common issue of a family home left empty when the parents pass away, or cases of secondary inheritance following the death of the first inheritor. Experts on these topics were invited to discuss inheritance options.
During FY2015, the Company held 20 seminars of this type at the head office, with 425 participants, while branch offices held 612 seminars and attracted 17,622 participants.
• Parents and children think about inheriting the family home
• A must see for landlords! Useful empty-home strategies for rental management
• Asset management seminars, etc.
<Main Seminar Themes at the Head Office>
Enhancing customer satisfaction Strengthening sales capabilities Strengthening design and construction capabilities
Hold a variety of seminars ● ●Expand sales to corporate customers ● ●Develop sales staff ● ●Research and develop new products ● ●Collaborate with local partners ●
913:00 16:30
Creating new sales opportunities by expanding sales to corporate clients
Daito Trust is expanding sales efforts targeting corporate clients in order to cultivate new sales opportunities. We aim to increase “tenant set” opportunities, as well as renovation contracts. We will also pursue feedback marketing and referrals to promote property sales or trading opportunities. As one of our “tenant set” services, we operate the “Joint System,” which brings together individual landowners and chain retailers seeking to open stores nationwide. We offer the store developer information on optimal locations, while helping landowners put their land to a productive use by proposing not only rental housing, but also commercial
facilities. In this way, we can leverage our strengths in original solutions to match the needs of both parties, while generating new sales opportunities.
Matsuya Foods opened a restaurant in a property owner’s building through an introduction under the Joint System
FamilyMart opened a store in the sub-urbs of Nagoya under a convenience store contract
23

Initiatives in the Construction Business
Employee training contributes to increased trust as well as sales results
The Company’s construction sales training system is based on a three-month recruit training program (comprising formal training at each business unit and on-the-job training sessions at each branch office and including various other training). It is designed to give every salesperson the skills to offer clients professional proposals for utilizing their prop-erty, within three years of joining the Company. We also supplement training with “e-learning” using tablets, which have been introduced at sales offices. The tablets give each salesperson instructional texts and tests to confirm their progress in order to reinforce knowledge acquisition.
· Texts covering the test material are loaded onto the tablet
· Training period: First to second week
Self-learning during free time
· Test period: Third to fourth week
· Conducted repeatedly until perfect score is attained
Confirmation of under-standing through tests · Confirmation
of test performance
Staff in charge of construction sales
Construction sales department manager
Cooperation with local partners enhances construction capabilities
The Company is taking many steps to enhance its con-struction capabilities. We have a network of local partners—Cooperative Daito Trust Construction—who cooperate with us on design and construction activities. This network provides members with support for benefits packages and technical skills acquisition. We are also expanding our “Partner Program” to further enhance ties to these local partners. In FY2015, for example, we lent support to two 2×4 panel construction companies, allowing them to expand their production lines and increase output.
FY2014 production line expansionFY2015 production line expansionExamination of future production line expansions
Iwaki City, Fukushima Prefecture(July 2015)
Toon City, Ehime Prefecture(July 2015)
Mita City, Hyogo Prefecture(September 2014)
Numazu City, Shizuoka Prefecture(June 2014)
Product R&D from the tenant’s perspective
Daito Trust tries to enhance research and development efforts by thinking about their products from a tenant’s perspective, and considering how to make better places to live. To assist this process, a “test building” has been con-structed in Okayama prefecture. This allows us to test the sound insulation quality—a key factor for lease tenants—as well as air quality environmental factors. The Company con-ducts ongoing tests and analysis, researching new features that will make the next generation of rental housing healthy and enjoyable to live in. The Company’s TOYRO brand of 2×4-type housing products are designed to allow tenants to adjust the layout of rooms based on their lifestyle and life stage. The size of rooms can be reconfigured by moving walls, which employ “Art Panel*” movable fixtures. In this way, tenants can adjust the layout of their home and make it comfortable for living in.* Introduced in the TOYRO LX and EX models
Test building
Construction sales e-learning system
Investigated sound insulation performance
TOYRO LX
Room partitions can be changed using “Art Panel”
FAC
TS
TR
AT
EG
YA
CT
IVIT
IES
FINA
NC
E
Line expansions at the 2×4 panel plant
24

ACTIVITIES
Real Estate Business
Strong results in the construction business provided a large stock of managed buildings and a surge in income from whole-building leases. Revenues from the “Tenant Guarantor Service” increased as well, boosting net sales by 7.0% year on year to ¥774.8 billion. Gross profit rose sharply by 19.7% year on year to ¥62.6 billion. Constant efforts to improve the efficiency of the contract process helped increase the number of tenant recruit by 5.4% year on year to 267,116. Measures to strengthen the Group’s rental brokerage brand, e-Heya Net, and expand the range of methods to search for an apartment, helped increase the rent-based occupancy rate on a reve-nue-from-rent basis a further 0.1 of a percentage point from last year’s healthy 96.8%.
In FY2016, the Daito Group will continue working to strengthen the e-Heya Net brand and try to increase aware-ness of the new DK SELECT brand of rental housing. We will also expand the contract process and continue seeking ways to enhance convenience for our tenants.
0 0
1,200
900
600
300
0
100
60
80
40
20
40
30
20
10
’14/3 ’15/3 ’16/3 ’21/3’20/3’19/3’18/3’17/3 ’14/3 ’15/3 ’16/3 ’21/3’20/3’19/3’18/3’17/3
Mid-Term Management Plan Mid-Term Management Plan
677.6 723.8 774.8825.7
872.5 918.2 966.11,016.0
45.352.2
62.670.4 71.1
76.281.5
86.9
6.7 7.2 8.1 8.5 8.1 8.3 8.4 8.66.7 7.2 8.1 8.5 8.1 8.3 8.4 8.6
(Billions of yen) (Billions of yen)(%)
0
400
300
200
100
0
1,500
900
1,200
600
300
’14/3 ’15/3 ’16/3 ’21/3’20/3’19/3’18/3’17/3 ’14/3 ’15/3 ’16/3 ’21/3’20/3’19/3’18/3’17/30
100
80
60
40
20
Mid-Term Management Plan Mid-Term Management Plan(Thousands of units) (%)(Thousands of units)
241 253 267 284303 321
339358
96.9 96.7 96.8 96.8 96.8 96.8 96.8 96.8
805 864 923 981 1,039 1,099 1,1621,227
Review of Operations in the Real Estate Business
Net sales and operating income increased sharply in FY2015
Net sales (Billions of yen))/Gross profit margin (%)
Number of tenant recruitment (Thousands of units)
Gross profit (Billions of yen)
Rental housing units under management (Thousands of units)/ Rent-based occupancy rate on a revenue-from-rent basis (%)
Net sales Net sales
¥774.8 billion ¥825.7 billion
Operating income Operating income
¥22.5 billion ¥27.2 billion
FY2015 Results FY2016 Plan
Source: Daito Construction Trust data
25

Growth Drivers in the Real Estate Business
Whole-building lease rental
income
Brokerage fee revenue
Tenant Guarantor Service revenue
Number of units under
management Occupancy rate
Number of tenant recruitment
Net sales
Driver 2
Driver 1
Note: The Company has control only over the items marked with this border:
To maintain high occupancy rates at the rental buildings it manages, the Daito Group sets targets for each sales area and each office to better manage tenant recruitment. To meet these targets, it is essential to make rental buildings more appealing. The Group is seeking ways to improve properties in terms of both soft and hard aspects. For example, the Group has introduced the industry’s first credit card settlement service to improve convenience for tenants and proposes comfortable lifestyles. In addition, the Group is also aggressively introducing online services to expand the appeal to prospective tenants,
including the launch of an online housing search service on the LINE social network and the Net Store. Furthermore, we continue our efforts to strengthen the e-Heya Net brand, and make use of other media to increase the Group’s fan appeal, ensuring that occupancy rates remain at high levels.
Driver 2
Maintaining a high occupancy rate at rental buildings managed by the Group by strengthening the brand and improving tenants’ convenience
Occupancy rate
FY2015 Results FY2016 Plan
96.8 % 96.8 %
Rent-based occupancy rate on a revenue-from-rent basis
The Daito Group will bolster its rental sales capabilities even further. We are bolstering our training system by teaching enhanced feedback response skills. Rather than relying on individual initiative to drive sales results, the Group is trying to focus more on team efforts. In its partnerships with real estate companies, the Group will pursue a symbiotic approach, offering new services to partners and building a network that benefits the whole. In-house efforts to attract tenants are also important and we will create and develop plans with strong appeal. Meanwhile, the Group is expanding outlets that market to corporate
customers and reorganizing its network of real estate rental offices to better appeal to customers. Cooperation with Group subsidiary Housecom Co., Ltd. is being broadened, including programs to train personnel at both companies.
Driver 1
Leveraging the power of individuals to benefit the organization as a wholeEnhancing sales capabilities through various measures in cooperation with real estate companies
Number of tenant recruitment
FY2015 Results FY2016 Plan
267 thousand units 284 thousand units
Number of tenant recruitment
FAC
TS
TR
AT
EG
YA
CT
IVIT
IES
FINA
NC
E
26

ACTIVITIES
Real Estate Business
In order to meet the targets of our medium-term manage-ment plan, we will pursue three key objectives: enhance and increase recognition, enhance convenience for customers, and strengthen systems. To enhance recognition of the e-Heya Net brand, the Daito Group has introduced new TV commercials and is sponsoring the Daito Kentaku e-Heya Net Ladies tournament, one of the competitions on the Japan LPGA
(Ladies Professional Golfers’ Association of Japan) Tour. Meanwhile, the Group continues to expand services and features, and the range of methods clients can use to search for rental housing. We are also working to improve the communication skills and responsiveness of employees, aiming to become the rental agent of choice for more customers.
Initiatives in the Real Estate Business
Enhance and increase the Group’s name recognition and enhance convenience for customers
Enhance and increase recognition Enhance tenant convenience Strengthen systems
Penetration of the e-Heya Net brand ●
Expand rental housing search methods ●
Expand tenant services ● ●
Develop human resources for rental housing sales and building management ●
Diverse measures to promote penetration of the e-Heya Net brand
New TV commercials have been created and aired in an effort to increase and enhance recognition of the Group’s housing rental agency brand, e-Heya Net. These were selected as the most favorably received TV commercial campaign out of 125 advertisers in the construction and real estate sector. As a result, the number of Internet searches for the keywords “e-Heya Net” is rising. Unaided recall of the brand has increased, and we will continue to strengthen it going forward. Also, for the first time, the Group sponsored the Daito Kentaku e-Heya Net Ladies tournament, which was a high-profile event generating high TV viewer ratings and attracting over 7,000 spectators. Efforts such as these will continue as the Group seeks to generate PR for e-Heya Net and further enhance brand recognition. Daito Trust holds a regular e-Heya Best Design Contest for tenants in buildings managed by the Group, providing them with an opportunity to display their skill and imagi-nation in using their living space. This not only gives par-ticipants a sense of satisfaction for having chosen one of our properties, but also allows the Group to identify latent customer needs by employing a public judging process. By innovating and sharing ways to make use of the residences, the competition also enhances people’s impression of the value of rental housing.
The first-prize-winning entry of the third e-Heya Best Design Contest “Shabby-Chic French Interior”
e-Heya Net TV commercial
The Company’s affiliated professional golfer, Aya Ezawa
The first queen of the tournament, Erina Hara, and employees of the Company
27

Initiatives in the Real Estate Business
Expanded services offer greater convenience for tenants
Develop human resources for rental housing sales and building management
Responding to diverse needs by expanding rental housing search methods
To expand the range of services available to enhance convenience for tenants, Group subsidiary House Leave Co., Ltd. launched the Tenant Guarantor Service. This year, the new usage rate has increased significantly from the previous year. The service has simplified the contract process and is becoming well established. In addition, the Combined Billing Service allows tenants to make their rent and utility payments all in a single bank transfer, and another subsidiary, House Payment Co., Ltd., enables tenants to settle their accounts using a credit card. We also offer a variety of support services to existing tenants. For example, DK SELECT Good Living Navigator gives tenants useful information on local retailers and other local matters as well as other useful information for living, such as government offices, medical facilities and other services.
The Group is expanding the range of rental housing search methods to respond to a greater diversity of needs. For example, the Daito Trust Rental Housing Search Support Service on the LINE social network lets prospective tenants discuss their needs and get service from specialist operators. We also launched the industry’s first 24-hour/ 365-day online licensed real estate office that provides service to users at any time that suits them. Furthermore, to address new needs, we have strengthened the operation of e-Heya Net and offer support in five major languages, in addition to Japanese, for foreign tenants.
The Group is strengthening the employee training aspect of its organizational foundation to reflect its ongoing value of “communication that demonstrates effort in an environment of objective awareness.” The Group recently held its fourth Hospitality Contest, in which employees are expected to demonstrate politeness and the ability to respond effectively to typical needs or requests. This helps to set an example for the entire company. The Group is also taking steps to promote teamwork in dealing with clients, and through this sort of training exercise, seeking to become the real estate agent of choice for more customers.
Net Store flow
Hospitality ContestVisiting Customer Service Category
Hospitality ContestWinner of the First Prize
Details of Combined Billing Service
Renewed DK SELECT Good Living Navigator website
Tenant
Combine payments into oneBank transfer
Payment at convenience storeCredit card payment
Daito Building Details of Combined Billing Service
Daito Building Rent, etc.
Daito Building Electric power and
water service charges
GaspalGas service charges
➀ Inquiry
Store staff
➂ Store visit
Visiting customer service
Rental housing introduction
Contract
Introduce rental housing
Appointment
Take over at branch
➁ Appointment contact
CustomersNet Store
staff
FAC
TS
TR
AT
EG
YA
CT
IVIT
IES
FINA
NC
E
28

ACTIVITIES
Other Businesses
Net sales in the other businesses segment rose 3.2% year on year to ¥41.4 billion, while gross profit climbed 10% to ¥15.5 billion. The increases reflect growth in the number of houses supplied with LP gas from Gaspal Co., Ltd., an increase in the number of users at the elderly day-care centers operated by Care Partner Co., Ltd., and growth in subscriber numbers for property and casualty insurance services at HOUSE GUARD S.S. Insurance Co., Ltd. The Group’s medium-term management plan identifies three business segments as future core operations: the energy business, the care and nursery school business and the overseas business. In FY2016, subsidiaries like Gaspal, Care Partner and HOUSE GUARD SSI will continue to leverage synergies
with the Daito Group’s core businesses. The Group aims to actively pursue business opportunities in new sectors, as changes such as full liberalization of the electricity and gas retail markets open up new opportunities for growth.
0 0
100
60
40
80
20
0
25
20
15
5
10
50
30
20
40
10
’14/3 ’15/3 ’16/3 ’21/3’20/3’19/3’18/3’17/3 ’14/3 ’15/3 ’16/3 ’21/3’20/3’19/3’18/3’17/3
Mid-Term Management Plan Mid-Term Management Plan
36.6 40.1 41.449.3
64.173.6
82.290.4
12.414.1
15.517.6
18.920.3
21.823.5
34.1 35.237.5 35.7
29.5
27.6 26.5 26.029.5
27.6 26.5 26.0
(Billions of yen) (Billions of yen)(%)
Review of Operations in the Other Businesses
Sales and profit growth, with energy, care and nursery school, and overseas designated as new core businesses
Net sales (Billions of yen)/Gross profit margin (%)
Core businesses operated by group companies
Gross profit (Billions of yen)
Energy Business Care and Nursery School Business Overseas Business Other Businesses
Gaspal Co., Ltd. ●
Daito Energy Co., Ltd. ●
Gaspal Kyushu Co., Ltd. ●
Daito Gas Partner Co., Ltd. ●
Care Partner Co., Ltd. ●
Daito Asia Development (Malaysia) Sdn. Bhd. ●
D.T.C. REINSURANCE LIMITED ●
Daito Finance Co., Ltd. ●
Daito Corporate Service Co., Ltd. ●
HOUSE GUARD S.S. Insurance Co., Ltd. ●
Daito Mirai Trust Co., Ltd. ●
House Payment Co., Ltd. ●
Net sales Net sales
¥41.4 billion ¥49.3 billion
Operating income Operating income
¥8.9 billion ¥9.6 billion
FY2015 Results FY2016 Plan
Source: Daito Construction Trust data
29

Gaspal Co., Ltd. supplies LP gas, primarily to buildings managed by the Daito Group. Gaspal’s measures to improve safety systems, strengthen the security structure, and provide security for facilities earned recognition from the Ministry of Economy, Trade and Industry in 2015, for distinguished service in the promotion of LP gas consump-tion security. This was the third consecutive year that the company has earned the judges award, which is the highest possible rating. In addition, in August 2015, Gaspal launched Pal Mail, a service for elderly persons living alone that notifies relatives by e-mail to inform them of the volume of gas used by the elderly individual. Furthermore, in January 2016, the Group established a new subsidiary, Daito Gas Partner Co., Ltd., to supply LP gas in the Okinawa area. In June of the same year, Gaspal Kyushu Co., Ltd. took over LP gas supply operations in the Kyushu region from Gaspal. In this way, the Group is steadily expanding the reach of its LP gas supply business and keeping close ties to local regions.
Review of Operations
Providing high-value LP gas and other services to tenants
Initiatives
Full liberalization of Japan’s electricity retail market opens the door to new services
In April 2016, Japan fully deregulated its electricity retail market. In response, Daito Energy Co., Ltd. launched a new service called e-Heya Electricity in May. The service is aimed at residents in rental housing managed by the Daito Group and offers users a fixed discount on electric power relative to the metered rate charged by the regional electric power company. The Group also intends to link this with its core busi-nesses to grow its business in the energy field.
Energy Business
Three merits of e-Heya Electricity
Merit 1
Merit 2
Merit 3
Service is only available to residents of buildings managed by the Daito Group
Users receive a discount on metered electric power usage based on the amount used by the rental housing
Service is provided to residences nationwide** Except in areas served by Okinawa Electric Power Company
Number of units with LP gas supply:
250,106 As of March 31, 2016
Gas Safety System Installed in All Housing Boasts Industry’s Highest Standard
Mobile phonecommunication network
Gas leakdetector Main
phoneNCU
Terminalphone
Terminal phone
Hotwaterheater
Cookingstove
Centralized monitoring center
Every customer of Gaspal has this system installed
Security sub-contractor
Gaspal sales office
Information terminal device
METI’s Commerce and Distribution Award
FAC
TS
TR
AT
EG
YA
CT
IVIT
IES
FINA
NC
E
30

ACTIVITIES
Other Businesses
Care Partner Co., Ltd. offers care services, mainly elderly day-care centers, with 73 centers in operation nationwide. The company has a highly trained staff of caregivers who have acquired extensive know-how working in daytime care centers. Their skills are being put to use in a new home vis-it-type care service, launched in March 2015, which offers “bodily care,” “lifestyle support” and other services to clients at their own residences. In addition, the Group launched a nursery school pro-gram in 2013, known as Kids Partner. As of April 2016, the Group operates 11 nursery schools, primarily in Yokohama and Kobe. In the future, elder care and nursery school oper-ations will be strengthened in line with demographic trends such as the low birthrate and the aging of the population.
Review of Operations
Strengthening the framework for elder care and nursery school operations
Initiatives
Care and nursery school services that address societal needs
Care and Nursery School Business
Number of day-care centers73As of March 31, 2016
Number of nursery schools11
As of April 1, 2016
The Daito Group concluded a capital tie-up with Solasto Corporation, a company with expertise in the medical and care sector, and acquired its shares in December 2015. The capital tie-up will allow Care Partner and Solasto to work in concert to expand the care and nursery school business. Care Partner will concentrate on offering day-care services for elderly people and small-scale licensed nursery school services, while Solasto will focus on home visit-type care and large-scale licensed nursery school operations. In this way, both companies can complement one another’s areas of expertise.
In October 2015, Care Partner introduced a new service called Soft-Food, which offers meals that look just like reg-ular food products. This new genre of food prod-uct can be masticated just by the pressure of the tongue against the upper jaw.
In March 2016, the Group opened the Kashiwa Fukushi Yogu Center, which leases and sells equipment for use at care facilities, such as bariatric beds, wheelchairs, walkers, and other items that help elderly people increase their mobility and lead safer, happier lives of better quality. In the future, the Group will seek to develop new products and services that can enhance the lives of elderly individuals.
Soft-Food’s grilled salmon
31

The Daito Group owns Le Méridien Kuala Lumpur, a five-star hotel in the Malaysian capital. The 35-story hotel, located right in front of Kuala Lumpur Sentral Railway Station, has 420 guest rooms and is ideally situated for both business travelers and tourists. Hotel management is contracted out to Méridien SA., which has a well established reputation. At present, the hotel’s guest rooms are being refurbished floor-by-floor, in order to increase reve-nues further.
In October 2015, the Group established House Payment Co., Ltd., a company operating credit card settlement services specializing in rental housing. The service enables rent and other payments to be settled using the customer’s credit card and is provided not only to whole-building leases for buildings managed by the Daito Group, but also proper-ties handled by cooperating real estate agents nationwide. By popularizing credit card settlement options to the rental real estate industry as a whole, the Group aims to increase convenience to a multitude of rental housing residents.
Developing hotel operations in Malaysia
Establishing a credit card settlement agency
Initiatives
Overseas Business
Daito Finance Co., Ltd.’s primary business involves offering short-term loans for contract fees, but also offers services for landowners such as an Inheritance Tax Payment Loan Service to help property owners obtain financing when they inherit real estate. In September 2014, the Group established HOUSE GUARD S.S. Insurance Co., Ltd., which offers an insurance product called Owners Guard, to compensate rental prop-erty owners for unpaid rents, and Live-Up Guard, which covers tenants for liability or property damage claims. Daito Mirai Trust Co., Ltd. provides asset management support services that employ property trusts to facilitate full, smooth asset succession to one’s beneficiaries. The trust structure performs the same function as a will or pre-death transfer of assets to relatives, ensuring that property is transferred to beneficiaries in exactly the way that the owner intended.
Review of Operations
Financial services closely related to core businesses
Other Businesses (Finance, etc.)
Review of Operations
While focusing on Japan’s strong rental housing market, the Daito Group hopes to take the experience and know-how accumulated from this business and develop the business in overseas markets. In November 2013, the Group began investing in U.S.-based real estate funds, and in June 2015, Daito Trust invested US$35.5 million (approximately ¥4.4 billion) in a major real estate business managed by NFL owner company Comstock Partners, LC. The Group has identified the United States as an important market in its efforts to develop an overseas real estate investment business. It will continue to consider business opportunities in countries around the world.
Launching real estate investment operations in the United States
Initiatives
FAC
TS
TR
AT
EG
YA
CT
IVIT
IES
FINA
NC
E
Real estate agents nationwide
Daito Group
Daito Building
HOUSE GUARD
HOUSE PAYMENT
Business alliance
Settlement agency system
Service users Settlement agency company Credit card companies
Le Méridien Kuala Lumpur – a hotel in Malaysia
BLVD | RESTON STATION, which Daito participated in as a joint investment
32

ACTIVITIES
Corporate Governance
Features of the Daito Group’s Corporate Governance
Basic Policy for Corporate Governance
We will strengthen corporate governance, aiming to grow as a company together with our stakeholders
We make it our basic policy to maximize corporate value for all of our stakeholders—including sharehold-
ers—while making our management transparent and efficient. To this end, we have separated decision-mak-
ing functions from business execution functions, established a speedy and efficient management/execution
organization, and appointed outside directors—all in an effort to achieve management with a high level of
transparency.
TOPICS
Ensuring timely and appropriate information disclosure and transparency
The Company recognizes information disclosure as an important management responsibility, and strives to make timely and appro-priate information disclosure to all stakeholders. The Company also actively discloses information other than disclosures based on laws and regulations, if it seems important, through various means such as the corporate website and this integrated report. When disclosing information, we coordinate with relevant departments such as the Audit and Supervisory Board and accounting departments to ensure
the audit schedule and audit structure, and ensure appropriate audits by the external independent auditor. These efforts have been rewarded with the Group’s selection as the top-ranking company in the construction, housing and real estate category in the 2015 Awards for Excellence in Corporate Disclosure for a seventh time (sixth consecutive time) by the Securities Analysts Association of Japan.
Select independent outside directors and Audit and Supervisory Board members of good caliberWe have formulated the appointment guidelines to clarify the qualities specified for outside directors and Audit and Supervisory Board members, and the independence criteria to clarify the criteria for selecting independent directors and Audit and Supervisory Board members. The appoint-ment criteria identify individuals who have the ability to directly supervise the deliberations and decision-making of Board of Directors meetings, for example, as regards issues related to management, corporate law, and governance. Selection of outside directors and Audit and Supervisory Board members also reflects their ability to offer knowledge, expertise, and experience in making proposals regarding strategy, in creating measures related to medium-term plans, and in handling other issues related to company management.
Results-linked incentive compensation aimed at improving medium- and long-term business performanceThe basic compensation of the directors, Audit and Supervisory Board members, and other executives of the Daito Group takes into consid-eration company performance, the compensation of executives in other companies in the industry, employee pay raises, and years worked, as well as the executives’ management skills, successes, and level of contribution to the Company. To boost executives’ desire to contribute to medium- and long-term performance and corporate value and to promote a sense of shared value with shareholders we introduced stock options for executives in FY2011. A lump sum for the bonuses of all executives is calculated based on a fixed rate—which is decided at the Board of Directors meeting—and paid out of the Company’s consolidated net income for the current fiscal year. How much each executive receives in bonuses takes into consideration factors like an executive’s level of contribution to the Company. (Note: Does not apply to outside directors.)
Highly effective and transparent managementThe Board of Directors has three independent outside directors who express their opinions from the viewpoints of shareholders and other stakeholders. This ensures a highly effective framework for the supervision of management. Moreover, all four of our Audit and Supervisory Board members are outside Audit and Supervisory Board members, and they audit the appropriateness of the directors’ work execution from an independent viewpoint.
Appointment and assessment of directors through fair and highly transparent proceduresDirectors perform a mutual quantitative assessment of their business execution and management supervision function each year. Based on the results, the final assessment and proposal for the director candidates for the next fiscal year is made by the Governance Committee, which comprises seven outside directors and Audit and Supervisory Board members (three outside directors and four outside Audit and Supervisory Board members) and is chaired by an outside director.
System that directors should retire at the age of 60Directors retire from the execution of business at the end of March of the fiscal year in which they become 60 years old. At the end of the General Shareholders’ Meeting held in the following June, they retire. After retirement, they may not remain connected with the Daito Group as an advisor or assume similar roles, through a framework designed to encourage the rejuvenation of management.
33

Management Structure
With the aim of improving management efficiency and ensuring transparency by means of a system for rapid business execution, the Daito Group harnesses its outside director system and internal control system to function as the twin wheels of a system of checks and controls. In this manner, the Daito Group carries out objective, prompt, and accurate decision-making. Furthermore, the Daito Group has established the Executive Management Meeting and enabled dynamic decision-making by delegating decision-making authority for business execution as necessary, thereby enabling the Board of Directors to concentrate on deciding important matters regarding management.
Governance Committee (comprised of outside directors and
Audit and Supervisory Board members)
Construction Business Headquarters
Chief Operating Of�cer (director)
Construction Business Executive Planning Meeting
Construction Business General
Managers Meeting
Technological Development
Meeting
Executive Of�cers
Real Estate Business Headquarters
Chief Operating Of�cer (director)
Real Estate Business Executive Planning Meeting
Lease Promotion
Meeting
Area Manager Meeting
Group Synergies Planning Meeting
Executive Of�cers
Corporate Management Headquarters
Chief Operating Of�cer (director)
Executive Of�cers
Subsidiary Business Headquarters
Chief Operating Of�cer (director)
Executive Of�cers
Divisions, Branches and Group Companies
Executive Management Meeting
Board of Directors (representative directors)13 (including 3 outside directors)
Audit and Supervisory Board4 (all outside board members)
Independent Auditors
General Shareholders’ Meeting
Deci
sion
-Mak
ing
and
Ov
ersi
ght o
f Man
agem
ent
Busi
ness
Exe
cutio
n
As of July 2016
Board of Directors
Audit and Supervisory Board
The Board of Directors is responsible for management decision-making and supervision. It conducts discussions with the participation of outside directors and Audit and Supervisory Board members based on the free exchange of opinions regarding the Company’s basic policies such as management strategies and management plans. Furthermore, how to respond to social issues that should be addressed in the implementation of the Company’s business is also studied. The Company has introduced an executive officer system for the purpose of separating the Board of Directors as the management decision-making and supervision organization and the business execution function based on this decision-making. In addition, the Company has enabled flexible decision-making by dividing its business areas into the Construction Business Headquarters, the Real Estate Business Headquarters, the Corporate Management Headquarters, and the Subsidiary Business Headquarters and assigning the Chief Operating Officer with the highest level of authority in each business area from among the Board of Directors, by entrusting the Executive Management Meeting with decision-making authority over business execution as necessary, and by having the Board of Directors decide on important management issues.
The Company has adopted the Audit and Supervisory Board system to audit the appropriateness of the directors’ execution of business. The standing Audit and Supervisory Board member attends all manner of meetings regarding business execution as necessary, exceeding the level of attendance mandated under the Companies Act and aiming to understand the status of business execution for the entire Company from a perspective that is closer to the front lines. The Audit and Supervisory Board members all select the outside Audit and Supervisory Board members to construct a highly independent auditing system for the directors’ execution of business.
FAC
TS
TR
AT
EG
YA
CT
IVIT
IES
FINA
NC
E
34

ACTIVITIES
Corporate Governance
History of Daito Trust’s Corporate Governance Structure
Director Evaluation System (Governance Committee)
1974 Foundation of the Company
1989 Listed on the Second Section of the Nagoya Stock Exchange, introduced mandatory retirement age of 60 for directors
1999 Changed to a system with all four Audit and Supervisory Board members as outside members
2000 Introduced the executive officer system to separate decision- making from business execution
2005 Appointed an outside director to add a multifaceted perspective to management and to strengthen oversight of management
2011 Acquired and cancelled the shares held by the founder in a TOB
2011 Appointed two outside directors
2012 Introduced the Evaluation Committee System by outside directors and outside Audit and Supervisory Board members
2013 Introduced a dual management structure to achieve flexible management suited to varying company operations and types of business
2013 Appointed three outside directors
2015 Appointed a female outside director
2016 Reorganized from Evaluation Committee to Governance Committee
Evaluation of executive directors and nomination of candidates for executive directors is carried out mainly by the Governance Committee, which comprises outside directors and outside Audit and Supervisory Board members and is chaired by an outside director, based on the results of mutual evaluation by executive directors.
Governance Committee System Structure
1. Business execution report Directors report on the status of business execution in their assigned areas to the Board of Directors.
2. Mutual assessment Directors assess one another’s business execution and management supervision function.
3. Tallying and interviewsThe Governance Committee chairperson (an outside director) tallies up the mutual assessment results and holds individual interviews, then reports the results to the representative directors.
4. Formulate proposal for board organization for next term
Based on the results of the mutual assessments, the representative directors create a proposal for board organization for next term and conduct a prior consultation with the Governance Committee.
5. Agreement on proposal for board organization for next term
The Governance Committee agrees on the proposal for board organization for next term after confirming there are no inconsistencies with the mutual assessment results.
6. Resolution on board organization for next term The Board of Directors passes a resolution on the board organization for next term.
7. Disclosure of assessment results /reflection in compensation The assessment results are disclosed to the executive directors and reflected in their compensation.
Board of Directors
2. Mutual assessment of directors 3. Tallying of mutual assessments and interviews
Representative directors
6. Board of Directors resolution on proposal for board organization for next term
7. Disclosure of assessment results /reflection in compensation
Directors
1 Submission
6 Notification
5 Presentation
4 Agreement
2 Report results
3 Prior consultation
Governance Committee(Outside directors and outside Audit and Supervisory Board members)
1. Business execution report by directors regarding their assigned domain
5. Agreement on proposal for board organization for next term
4. Formulate proposal for board organization for next term
35

Compensation System
The Company conducts mutual assessments each year of the business execution and management supervision of its directors mainly through the Governance Committee, which comprises all outside directors and Audit and Supervisory Board members. The results of these assessments are reflected in the management structure and the basic compensation, bonuses and stock options as stock-linked compensation of the directors (excluding outside directors) for the following fiscal year.
A. Basic compensationBasic compensation shall be determined in consideration of quanti-tative factors such as company performance, the compensation of executives in other companies in the industry, the rate of employee pay raises, and years of employment, as well as qualitative factors such as management capability, achievement, and contribution of each director and Audit and Supervisory Board member. The amount of basic compensation is ¥1.0 billion per year (of which, up to ¥50 million per year for outside directors). B. Stock optionsAt the 37th Ordinary General Shareholders Meeting held on June 28, 2011, the Company introduced stock-linked compensation for the purpose of raising directors’ willingness to contribute to the medium- to long-term improvement in the financial performance and enhancement of the corporate value of the Company by clarifying the link between the financial performance and the value of shares of the Company and sharing a common value with shareholders.a. Plan A, which serves as a substitute for retirement benefit plans
and aims to improve financial performance of the Company during the term of office of directors
b. Plan B, which aims to improve medium-term financial perfor-mance of the Company The Plan B is subject to separate performance achievement criteria. The amount for stock option plans is up to ¥530.0 million per year.
C. BonusesBonuses shall be determined in consideration of the achievement during the fiscal year, contribution, etc., of each director and be paid from the total amount of bonuses which is determined by multiplying consolidated profit attributable to owners of the parent by a cer-tain ratio determined by the Board of Directors. However, outside directors are not entitled to receive any bonuses. The amount for bonuses shall be up to an amount equivalent to the consolidated profit attributable to owners of the parent for the current fiscal year multiplied by 1.5% (up to ¥1.0 billion, not paid if the consolidated profit attributable to owners of the parent for the current fiscal year is ¥20.0 billion or less).D. Method of determining specific amounts of
compensationThe total amount of directors’ compensation shall be limited to the aggregate amount of directors’ compensation approved by the General Shareholders Meeting and specific amounts of compensation for each director shall be determined by allocating the aggregate amount pursuant to the resolution of the Board of Directors. The total amount of Audit and Supervisory Board mem-bers’ compensation shall be limited to the aggregate amount of Audit and Supervisory Board members’ compensation approved by the General Shareholders Meeting and specific amounts of compensation for each Audit and Supervisory Board member shall be determined by allocating the aggregate amount based on con-sultation among Audit and Supervisory Board members.
Breakdown of Executive Compensation(For FY2015, the fiscal year from April 1, 2015 to March 31, 2016)
Category Number of personsTotal amount of compensation by type (Millions of yen) Total amount of
compensation (Millions of yen)Basic compensation Stock options Bonuses
Directors (not including outside directors) 10 391 135 703 1,230Outside directors and Audit and Supervisory Board members 8 87 − 45 132Total 18 478 135 748 1,362
Monitoring Effectiveness and Efficiency of Internal Controls
Evaluation Standard for Outside Independent Auditors
Business Risks
As regards the execution of business, the Internal Auditing Office conducts work audits and reports the audit results to top management. At the same time, in addition to providing guidance and instruction, it interviews employees of the departments audited, and through such interviews, confirms the details of business execution and achieves understanding of any problems and conducts highly effective audits. Furthermore, within the Internal Auditing Office we have established the Compliance Promotion Department to conduct compliance-related risk management of our business activities, and the J-SOX Promotion Office to help ensure the reliability of our financial reporting of organizations.
In regard to proper evaluation and appropriate selection of outside independent auditor candidates, the implementation status of duties is assessed and evaluated through the implementation status of audits by the outside independent auditors, audits reports, etc.
The following are factors that could have a major impact on the decisions that investors make with regard to the Daito Group’s performance in terms of its management results, financial situation, and cash flow. (As of March 31, 2016)
◆ Rise in unit cost and drop in profit ratio due to sharp rise in raw material costs◆ Effect on performance due to tax law amendment◆ Sudden cancellations due to sharp rises in interest rates
◆ Increased expenses due to new laws and law amendment◆ Risk of personal information leaks◆ Risk of natural disasters
FAC
TS
TR
AT
EG
YA
CT
IVIT
IES
FINA
NC
E
36

ACTIVITIES
Corporate Governance
Appointment Guidelines for Outside Directors and Audit and Supervisory Board Members
Standards for the Independence of Outside Directors and Audit and Supervisory Board Members
Daito Group’s outside directors and Audit and Supervisory Board members, and candidates for those positions, shall satisfy the following criteria:
1. Be able to directly supervise the deliberations and decision-making of the Board of Directors on key issues—for example, issues related to management, corporate law, and governance.
2. Be able to reflect their own knowledge and expertise to formulate growth strategies, determine management strategies, and achieve medium-term management plans.
3. Be able to offer advice and leadership based on their own knowledge, expertise and experience as regards other issues related to corporate management.
To ensure the independence of outside directors and Audit and Supervisory Board members (or candidates for those positions), those persons must not fall under any of the following categories. The periods for which these criteria apply are: 1) from the unlimited past to the present for Category 1 and 2) from the past 10 years to the present for Categories 2 to 5.
The individual is not a director (unless an outside director), a member of the Audit and Supervisory Board (unless an outside board member), an accounting advisor, an executive officer, or an employee of Daito Trust, one of its subsidiaries, or an affiliated company.
1) The individual is not a major shareholder (holding a 10% or greater share) of Daito Trust or an executive or employee of any of its major shareholders. 2) The individual is not an executive or employee of a company for which the Daito Group is a major shareholder (holding a 10% or greater share).
1) The individual is not an executive or employee of a business partner whose transactions with the Daito Group account for 2% or more of consolidated net sales.
2) The individual is not an executive or employee of a financial institution from which the Daito Group borrows capital amounting to 2% or more of Daito Trust’s consolidated gross assets.
3) The individual is not an executive or employee of the Daito Group’s main securities company.
1) The individual is not an employee or a partner of the Daito Group’s certified public accountant’s firm or of an auditing firm that acts as the independent auditor.
2) The individual does not receive ¥10 million or more a year from the Daito Group (apart from director or board member compensation) for his/her services as a lawyer, certified public accountant, tax accountant, or consultant.
1) The individual is not a relative within two degrees of kinship of persons falling under the Categories 1 to 4 above.2) The individual is not an executive or employee of a company that has one or more directors holding a post in the Daito Group.3) The individual is not an executive or employee of a company that holds shares in the Daito Group.
1 Daito Group affiliate
2 Holder of voting shares
3 Business partner affiliate
4 Provider of specialized services (lawyer, certified public accountant, consultant, etc.)
5 Others
Outside DirectorsName Expected role Activities (fiscal year ended March 2016)
Yujiro SasamotoMr. Sasamoto is expected to offer opinions and supervise from the standpoint of an expert in compliance, internal control, and CSR. Board of Directors meetings: 100% (Attended 14 times/14 meetings)
Toshiaki YamaguchiMr. Yamaguchi is expected to offer opinions and supervise from the standpoint of a lawyer with expertise in corporate legal affairs, compliance, and internal control.
Board of Directors meetings: 92.9% (Attended 13 times/14 meetings)
Mami SasakiMs. Sasaki is expected to supervise management from the standpoint of a globally experienced woman, and offer opinions and supervise the promotion of diversity management.
Board of Directors meetings: 90.9% (Attended 10 times/11 meetings)
Outside Audit and Supervisory Board MembersName Expected role Activities (fiscal year ended March 2016)
Masayasu Uno
Mr. Uno is expected to audit Daito’s management from the standpoint as an expert in finance and accounting through his work as a certified public accountant, together with his experience in running his own business.
Board of Directors meetings: 100% (Attended 14 times/14 meetings)Audit and Supervisory Board meeting: 100%
(Attended 13 times/13 meetings)
Hideo HachiyaMr. Hachiya is expected to audit Daito’s management from the standpoint as an expert who has a wealth of experience as a lawyer together with being an expert in corporate legal affairs.
Board of Directors meetings: 92.9% (Attended 13 times/14 meetings)Audit and Supervisory Board meeting: 100%
(Attended 13 times/13 meetings)
Kazumitsu FutamiMr. Futami is expected to audit Daito’s management from the standpoint of having a wealth of knowledge and experience in rental housing management and in the loan guarantee business.
Board of Directors meetings: 100% (Attended 14 times/14 meetings)Audit and Supervisory Board meeting: 100%
(Attended 13 times/13 meetings)
Kazuo Fujimaki
Mr. Fujimaki is expected to audit Daito’s management from the stand-point as an expert in specialized knowledge of international accounting through his work as a U.S. CPA together with his experience in management.
Board of Directors meetings: 100% (Attended 14 times/14 meetings)Audit and Supervisory Board meeting: 100%
(Attended 13 times/13 meetings)
37
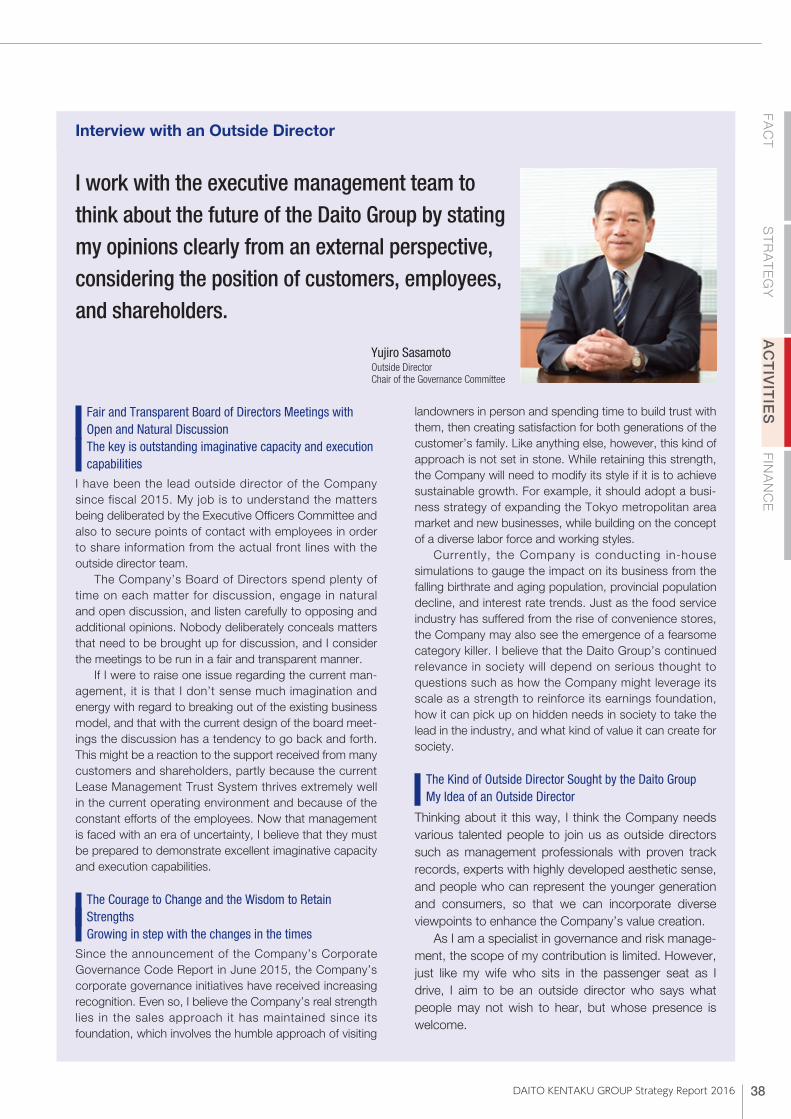
Interview with an Outside Director
Fair and Transparent Board of Directors Meetings with Open and Natural DiscussionThe key is outstanding imaginative capacity and execution capabilities
I have been the lead outside director of the Company since fiscal 2015. My job is to understand the matters being deliberated by the Executive Officers Committee and also to secure points of contact with employees in order to share information from the actual front lines with the outside director team. The Company’s Board of Directors spend plenty of time on each matter for discussion, engage in natural and open discussion, and listen carefully to opposing and additional opinions. Nobody deliberately conceals matters that need to be brought up for discussion, and I consider the meetings to be run in a fair and transparent manner. If I were to raise one issue regarding the current man-agement, it is that I don’t sense much imagination and energy with regard to breaking out of the existing business model, and that with the current design of the board meet-ings the discussion has a tendency to go back and forth. This might be a reaction to the support received from many customers and shareholders, partly because the current Lease Management Trust System thrives extremely well in the current operating environment and because of the constant efforts of the employees. Now that management is faced with an era of uncertainty, I believe that they must be prepared to demonstrate excellent imaginative capacity and execution capabilities.
The Courage to Change and the Wisdom to Retain StrengthsGrowing in step with the changes in the times
Since the announcement of the Company’s Corporate Governance Code Report in June 2015, the Company’s corporate governance initiatives have received increasing recognition. Even so, I believe the Company’s real strength lies in the sales approach it has maintained since its foundation, which involves the humble approach of visiting
landowners in person and spending time to build trust with them, then creating satisfaction for both generations of the customer’s family. Like anything else, however, this kind of approach is not set in stone. While retaining this strength, the Company will need to modify its style if it is to achieve sustainable growth. For example, it should adopt a busi-ness strategy of expanding the Tokyo metropolitan area market and new businesses, while building on the concept of a diverse labor force and working styles. Currently, the Company is conducting in-house simulations to gauge the impact on its business from the falling birthrate and aging population, provincial population decline, and interest rate trends. Just as the food service industry has suffered from the rise of convenience stores, the Company may also see the emergence of a fearsome category killer. I believe that the Daito Group’s continued relevance in society will depend on serious thought to questions such as how the Company might leverage its scale as a strength to reinforce its earnings foundation, how it can pick up on hidden needs in society to take the lead in the industry, and what kind of value it can create for society.
The Kind of Outside Director Sought by the Daito GroupMy Idea of an Outside Director
Thinking about it this way, I think the Company needs various talented people to join us as outside directors such as management professionals with proven track records, experts with highly developed aesthetic sense, and people who can represent the younger generation and consumers, so that we can incorporate diverse viewpoints to enhance the Company’s value creation. As I am a specialist in governance and risk manage-ment, the scope of my contribution is limited. However, just like my wife who sits in the passenger seat as I drive, I aim to be an outside director who says what people may not wish to hear, but whose presence is welcome.
I work with the executive management team to think about the future of the Daito Group by stating my opinions clearly from an external perspective, considering the position of customers, employees, and shareholders.
Yujiro SasamotoOutside DirectorChair of the Governance Committee
FAC
TS
TR
AT
EG
YA
CT
IVIT
IES
FINA
NC
E
38

ACTIVITIES
List of Officers
Naomi KumakiriPresident and Representative Director (CEO) In charge of Construction Business Headquarters and Corporate Management HeadquartersApr. 1984 Joined the CompanyApr. 2001 Executive Officer, General Manager of Housing Sales DepartmentJun. 2004 Director, General Manager of Tenant Recruiting Management
HeadquartersApr. 2006 Managing Director, General Manager of Administration Headquarters,
General Manager of Legal Affairs HeadquartersApr. 2011 Senior Managing Director, Executive Officer,
General Manager of East Japan Construction Sales HeadquartersApr. 2013 Representative Director and Chief Executive Officer,
in charge of Construction Business Headquarters and Corporate Management Headquarters
Apr. 2016 President and Representative Director (CEO) in charge of Construction Business Headquarters and Corporate Management Headquarters (current position)
Hitoshi KadouchiVice President and Representative Director In charge of Real Estate Business Headquarters and Subsidiary Business Headquarters, Representative Director and President of Daito Building Management Co., Ltd.Sep. 1980 Joined the CompanyApr. 2001 Executive Officer, General Manager of Subsidiary Business
HeadquartersJun. 2009 Director, General Manager of Corporate Management DepartmentApr. 2011 Director, Executive Officer, General Manager of Building Management
Department, Representative Director and President of Daito Building Management Co., Ltd. (current position)
Apr. 2012 Senior Managing Director, General Manager of Management Service Department
Apr. 2013 Representative Director and Executive Vice President, General Manager of Management Service Department
Apr. 2014 Representative Director, Executive Vice President, in charge of Real Estate Business Headquarters and Subsidiary Business Headquarters
Apr. 2016 Vice President and Representative Director, in charge of Real Estate Business Headquarters and Subsidiary Business Headquarters (current position)
Katsuma KobayashiManaging Director General Manager of Sales Management DepartmentFeb. 1986 Joined the CompanyApr. 2011 Executive Officer, General Manager of Sales Management DepartmentApr. 2012 Managing Executive Officer, General Manager of Sales Management
DepartmentJun. 2012 Director, Managing Executive Officer, General Manager of Sales
Management DepartmentApr. 2016 Managing Director, General Manager of Sales Management
Department (current position)
Shuji KawaiManaging Director General Manager of Corporate Management HeadquartersApr. 1989 Joined the CompanyApr. 2012 Executive Officer, General Manager of Corporate Planning DivisionJun. 2012 Director, Executive Officer, General Manager of Corporate Planning
DivisionApr. 2013 Director, Executive Officer, General Manager of Subsidiaries Business
Headquarters, General Manager of Corporate Planning DivisionApr. 2014 Director, Managing Executive Officer, General Manager of Corporate
Management HeadquartersApr. 2016 Managing Director, General Manager of Corporate Management
Headquarters (current position)
Kanitsu UchidaDirector General Manager of Design Management DepartmentAug. 1987 Joined the CompanyApr. 2011 General Manager of Management Strategy Division and Administration
DepartmentApr. 2012 Executive Officer, General Manager of Cost Management DepartmentApr. 2013 Executive Officer, General Manager of Design Management DepartmentJun. 2014 Director, Executive Officer, General Manager of Design Management
DepartmentApr. 2016 Director, General Manager of Design Management Department (current
position)
Kei TakeuchiDirector General Manager of Central Japan Construction Business HeadquartersApr. 1989 Joined the CompanyApr. 2007 General Manager of Metropolitan Area Construction Sales DepartmentApr. 2010 General Manager of Tokai Construction Sales DepartmentApr. 2012 Executive Officer, General Manager of Tenant Recruiting Management
DepartmentJun. 2014 Director, Executive Officer, General Manager of Tenant Recruiting
Management DepartmentApr. 2015 Director, Executive Officer, General Manager of Central Japan
Construction Business HeadquartersApr. 2016 Director, General Manager of Central Japan Construction Business
Headquarters (current position)
Yukio DaimonDirector General Manager of Construction Management Department Mar. 1984 Joined the CompanyApr. 2003 Representative Director and President of Daito Steel Co., Ltd.Apr. 2009 General Manager of Technological Development DepartmentApr. 2011 Executive Officer, General Manager of Construction Management
DepartmentJun. 2015 Director, Executive Officer, General Manager of Construction
Management Department Apr. 2016 Director, General Manager of Construction Management Department
(current position)
Kazuhiko SaitoDirector General Manager of East Japan Construction Business HeadquartersMar. 1992 Joined the CompanyApr. 2009 Executive Officer, General Manager of Chu-Shikoku Construction Sales
DepartmentApr. 2011 General Manager of Tohoku Construction Sales DepartmentApr. 2013 Executive Officer, General Manager of Tohoku Construction Business
Department, Officer Responsible for Local Post-Quake RestorationApr. 2015 Executive Officer, General Manager of East Japan Construction Sales
Headquarters, Officer Responsible for Post-Quake Restoration CompanyJun. 2015 Director, Executive Officer, General Manager of East Japan
Construction Business HeadquartersApr. 2016 Director, General Manager of East Japan Construction Business
Headquarters (current position)
Shinichi MarukawaDirector General Manager of Leasing and Sales DepartmentJul. 1992 Joined the CompanySep. 2011 General Manager of Planning and Management DepartmentApr. 2014 Executive Officer, General Manager of Tenant Recruiting Planning and
Management DepartmentApr. 2015 Executive Officer, General Manager of Tenant Recruiting Management
DepartmentJun. 2015 Director, Executive Officer, General Manager of Tenant Recruiting
Management DepartmentApr. 2016 Director, General Manager of Leasing and Sales Department (current
position)
Takeshi NakagawaDirector Representative Director and President of Gaspal Co., Ltd.Nov. 1989 Joined the CompanyNov. 2002 Director of Daito Building Management Co., Ltd.Apr. 2006 Senior Managing Director of Gaspal Co., Ltd.Apr. 2009 Representative Director and President of Gaspal Co., Ltd.
(curent position)Apr. 2010 Executive OfficerApr. 2013 Managing Executive OfficerApr. 2016 Senior Executive Officer, General Manager of Subsidiary Business
HeadquartersJun. 2016 Director (current position)
Directors
39

Shuichi Ogawa Senior Executive Officer, General Manager of West Japan Construction Business Headquarters
Takuya Ishii Senior Executive Officer, General Manager of Chugoku Construction Business Department
Shoji Yamada Senior Executive Officer, General Manager of North Metropolitan Area Construction Business Department
Masayoshi Tanaka Executive Officer, General Manager of Information Technology Department
Hiromichi Ono Executive Officer, General Manager of Asset Succession Consulting Department
Sachio Washi Executive Officer, General Manager of Human Resources Department
Takashi Suzuki Executive Officer, General Manager of Central Metropolitan Area Construction Business Department
Eiji Okamoto Executive Officer, General Manager of Minami Kansai Construction Business Department
Kazunori Fukuda Executive Officer, General Manager of Corporate Planning Division
Fumiaki Nakagami Executive Officer, General Manager of Safety and Quality Control Department
Yoshihiro Mori Executive Officer, Managing Director, General Manager of Screening Department, Daito Building Management Co., Ltd.
Eiji Kawahara Executive Officer, General Manager of Tenant Recruiting Development Department
Masafumi Tate Executive Officer, General Manager of Design Department
Masayuki Koishikawa Executive Officer, General Manager of Construction Sales Management Department
Kouichi Nakamura Executive Officer, General Manager of Technological Development Department, in charge of Central Japan Region
Yujiro SasamotoOutside DirectorChairman of the Company’s Governance CommitteeApr. 1984 Joined Fuji Xerox Co., LtdMar. 2005 Established Makoru Co., Ltd., Director of Makoru Co., Ltd. (current
position)Apr. 2006 Part-time lecturer of Department of Humanities and Social Sciences,
Jissen Women’s University (current position)Apr. 2008 Part-time lecturer of Graduate School of Law, Aoyama Gakuin
University (current position)Apr. 2011 Director of Japan CSR Promotion Association (current position)Jun. 2011 Outside Director of the Company (current position)
Toshiaki YamaguchiOutside DirectorMember of the Company’s Governance CommitteeMar. 1990 Registered with the Osaka Bar Association, joined Takeuchi and Inoue
Law OfficeApr. 1995 Established Yamaguchi Law Office, Representative Attorney at
Yamaguchi Law Office (current position)Apr. 2008 Elected Member of the Legal Practice Reform Committee,
Osaka Bar Association (current position)Jul. 2008 Head of the Corporate Compliance Project Team of the Legal Practice
Innovation Committee, Japan Federation of Bar Associations (current position)
Oct. 2008 Director of Japan Internal Control Association (current position)Jul. 2010 Director of Association of Certified Fraud Examiners (current position)Jul. 2012 Leader of Outside Director Guidelines Study Team of the Judicial
System Research Board, Japan Federation of Bar Associations (current position)
Mar. 2013 Outside Director of Nissen Holdings Co., Ltd. (current position)Jun. 2013 Outside Director of the Company (current position)Aug. 2014 Director of Japan Corporate Governance Network (current position)Dec. 2014 Outside Audit & Supervisory Board Member of Osaka University Venture
Capital Co., Ltd. (current position)Feb. 2015 Audit & Supervisory Board Member of Osaka Municipal Transportation
Bureau (current position)Jun. 2015 Elected Member of the Committee on Whistleblower Protection System,
Consumer Affairs Agency (current position)
Mami SasakiOutside DirectorMember of the Company’s Governance CommitteeApr. 1983 Joined The Fuji Bank, Limited (currently Mizuho Bank, Ltd.)Mar. 1985 Joined Morgan Stanley Securities Co., Ltd. (currently Mitsubishi UFJ
Morgan Stanley Securities Co., Ltd.)Jan. 1991 Vice President of the companyFeb. 1994 Executive Director of the companyDec. 2000 Managing Director of the companyApr. 2004 Managing Director and Head of Sales of Fixed Income Division of Credit
Suisse First Boston Securities (Japan) Ltd. (currently Credit Suisse Securities (Japan) Limited)
Jun. 2015 Outside Director of the Company (current position)
Masayasu UnoStanding Audit and Supervisory Board Member (Outside)Member of the Company’s Governance CommitteeAug. 1981 Joined Chuo Accounting OfficeSep. 1984 Joined Integran, Inc.Oct. 1996 Representative Director and President of US Robotics Co., Ltd.Nov. 1997 Representative Director and Vice President of 3COM JapanOct. 1998 Director and General Manager of Sales Division of Lucent
Technologies, Japan Oct. 2000 Representative Director and President of Avaya Japan, Ltd.Mar. 2005 Representative Director and President of NetIndex Inc.Nov. 2007 Director of Index Holdings Jun. 2009 Audit & Supervisory Board Member of the Company (current position)
Hideo HachiyaAudit and Supervisory Board Member (Outside)Member of the Company’s Governance CommitteeApr. 1968 Joined Honda Motor Co., Ltd.Apr. 1981 Registered as an attorney with the Daini Tokyo Bar Association,
established Hachiya Law Office, Representative Attorney of Hachiya Law Office (current position)
Jun. 1991 Audit & Supervisory Board Member of the CompanyJun. 1995 Resigned as Audit & Supervisory Board MemberJun. 1999 Audit & Supervisory Board Member of the Company (current position)
Kazumitsu FutamiAudit and Supervisory Board Member (Outside)Member of the Company’s Governance CommitteeApr. 1964 Joined the Ministry of Construction (currently the Ministry of Land,
Infrastructure, Transport and Tourism)May 1998 General Manager of Land Department, Chugoku Region Construction
Bureau, Ministry of ConstructionJun. 1999 General Manager of Loan Guarantee Department 1, Incorporated
Foundation of Housing Improvement Development Public Corporation (currently General Incorporated Foundation of Housing Improvement Development Public Corporation)
Dec. 2003 Director of Incorporated Foundation of Housing Improvement Development Public Corporation
Jul. 2009 Representative Director and President of Jei Kei Kikaku Co., Ltd. (current position)
Jun. 2012 Audit & Supervisory Board Member of the Company (current position)
Kazuo FujimakiAudit and Supervisory Board Member (Outside)Member of the Company’s Governance CommitteeApr. 1976 Joined Hazama Corporation (currently Hazama Ando Corporation)Apr. 1979 Joined Mitsubishi Motors CorporationNov. 1989 Joined Nikko Securities Inc. (currently SMBC Nikko Securities Inc.)Apr. 1999 Joined Ohta Showa Audit Corporation (currently Ernst & Young
ShinNihon LLC)Apr. 2002 Established Fujimaki Sogo Consulting, Representative of Fujimaki Sogo
Consulting (current position)Dec. 2006 Outside Audit & Supervisory Board Member, Yumeshin Holdings Co.,
Ltd.Jun. 2013 Audit & Supervisory Board Member of the Company (current position)
Executive Officers
Audit and Supervisory Board Members
FAC
TS
TR
AT
EG
YA
CT
IVIT
IES
FINA
NC
E
40

FINANCE
Consolidated Financial Statements
Consolidated Balance Sheet (Millions of yen)Year Ended
March 31, 2015Year Ended
March 31, 2016Assets
Current assetsCash and deposits 255,551 233,631Money held in trust 32,505 26,505Notes and accounts receivable from completed construction contracts and other 36,643 38,627Short-term investment securities 7,001 9,617Costs on uncompleted construction contracts 13,420 13,328Other inventories 4,893 4,768Prepaid expenses 57,197 59,688Deferred tax assets 19,235 19,955Operating loans 54,671 60,489Other 13,577 13,262Allowance for doubtful accounts (305) (253)Total current assets 494,393 479,621
Non-current assetsProperty, plant and equipment
Buildings and structures 35,051 34,302Machinery and equipment 20,648 32,520Tools, furniture and fixtures 1,535 1,772Land 42,451 43,169Lease assets 1,490 1,308Other 440 883Total buildings and structures 101,618 113,957
Intangible assets 5,257 10,664Investments and other assets
Investment securities 27,311 45,509Subordinated bonds and subordinated trust beneficiary rights 12,865 12,857Deferred tax assets 20,345 26,030Other 42,191 42,922Allowance for doubtful accounts (2,862) (3,014)Total investments and other assets 99,851 124,304
Total non-current assets 206,726 248,927Total assets 701,119 728,548
LiabilitiesCurrent liabilities
Accounts payable for construction contracts 42,242 37,509Current portion of long-term loans payable 16,690 16,690Lease obligations 271 241Income taxes payable 23,216 25,671Advances received on uncompleted construction contracts 49,411 47,274Advances received 64,482 68,922Provision for bonuses 20,532 21,586Provision for warranties for completed construction 1,080 1,136Deposits received 6,879 7,631Other 42,624 55,216Total current liabilities 267,432 281,883
Non-current liabilitiesLong-term loans payable 63,278 54,942Lease liabilities 1,008 907Deferred tax liabilities — 84Provision for repairs on whole-building leases 65,154 80,704Net defined benefit liability 9,518 10,698Long-term guarantee deposits 51,309 45,183Other 6,622 5,620Total non-current liabilities 196,892 198,143
Total liabilities 464,325 480,026Net assets
Shareholders’ equityCapital stock 29,060 29,060Capital surplus 34,540 34,540Retained earnings 184,661 206,509Treasury stock (13,485) (16,857)Total shareholders’ equity 234,777 253,254
Accumulated other comprehensive incomeValuation difference on available-for-sale securities 6,156 3,202Deferred gains or losses on hedges 603 (943)Revaluation reserve for land (7,584) (7,584)Foreign currency translation adjustment 1,278 (229)Remeasurements of defined benefit plans (599) (1,596)Total accumulated other comprehensive income (145) (7,151)
Subscription rights to shares 312 353Non-controlling interests 1,850 2,065Total net assets 236,794 248,522
Total liabilities and net assets 701,119 728,548
41

FAC
TS
TR
AT
EG
YA
CT
IVIT
IES
FIN
AN
CE
Consolidated Statement of Income and Consolidated Statement of Comprehensive IncomeConsolidated Statement of Income (Millions of yen)
Year Ended March 31, 2015
Year Ended March 31, 2016
Net salesNet sales of completed construction contracts 589,170 595,364Sales on real estate business 723,817 774,807Sales on other business revenue 40,167 41,471Total net sales 1,353,155 1,411,643
Cost of salesCost of sales of completed construction contracts 416,636 419,094Cost of sales on real estate business 671,531 712,196Cost of sales on other business 26,041 25,925Total cost of sales 1,114,209 1,157,216
Gross profitGross profit on completed construction contracts 172,533 176,269Gross profit – real estate business 52,286 62,611Gross profit – other business 14,126 15,545Total gross profit 238,946 254,427
Selling, general and administrative expenses 147,425 153,426Operating income 91,520 101,001Non-operating income
Interest income 601 589Dividends income 176 192Commission fee 3,653 3,656Miscellaneous income 1,161 1,241Total non-operating income 5,592 5,680
Non-operating expensesInterest expenses 709 573Provision of allowance for doubtful accounts 87 48Miscellaneous expenses 427 500Total non-operating expenses 1,225 1,122
Ordinary income 95,887 105,558Extraordinary income
Gain on sales of non-current assets 5 3Gain on sales of investment securities — 151Total extraordinary income 5 154
Extraordinary lossLoss on sales and retirement of non-current assets 199 354Impairment loss 145 92Total extraordinary loss 345 447
Income before income taxes and non-controlling interests 95,547 105,266Income taxes – current 40,583 41,335Income taxes – deferred (1,374) (3,654)Total income taxes 39,208 37,680Net income 56,339 67,585Profit attributable to non-controlling interests 229 305Profit attributable to owners of the parent 56,109 67,279
Consolidated Statement of Comprehensive Income (Millions of yen)Year Ended
March 31, 2015Year Ended
March 31, 2016
Net income 56,339 67,585Other comprehensive income
Valuation difference on available-for-sale securities 1,467 (2,953)Deferred gains or losses on hedges 553 (1,546)Revaluation reserve for land (2,703) —Foreign currency translation adjustment 3,243 (1,507)Remeasurements of defined benefit plans (41) (998)Total other comprehensive income 2,520 (7,007)
Comprehensive Income 58,859 60,578(Breakdown)
Profit attributable to owners of the parent 58,649 60,273Profit attributable to non-controlling interests 209 304
42

Consolidated Statement of Changes in EquityYear ended March 31, 2015
(Millions of yen)
Shareholders’ equity
Capital stockCapital surplus
Retained earnings
Treasury stock
Total shareholders’
equity
BALANCE, APRIL 1, 2014 29,060 34,549 169,293 (10,124) 222,779
Cumulative effect of accounting change (247) (247)
Restated balance 29,060 34,549 169,046 (10,124) 222,532
Change in the year
Cash dividends (28,638) (28,638)
Profit attributable to owners of the parent 56,109 56,109
Purchase of treasury stock (19,145) (19,145)
Disposal of treasury stock 1,316 2,603 3,919
Retirement of treasury stock (1,325) (11,856) 13,181 —
Change in treasury shares of the parent arising from transactions with non-controlling shareholders —
Net changes of items other than shareholders’ equity
Net change in the year — (8) 15,614 (3,361) 12,244
BALANCE, MARCH 31, 2015 29,060 34,540 184,661 (13,485) 234,777
Accumulated other comprehensive income
Valuation difference
on available-for-sale
securities
Deferred gains
or losses on hedges
Revaluation reserve for land
Foreign currency
translation adjustment
Remeasure-ments of defined
benefit plans
Total accumulated other com-prehensive
income
Subscription rights
to shares
Non-controlling interests
Total net assets
BALANCE, APRIL 1, 2014 4,688 49 (4,881) (1,965) (577) (2,685) 186 1,724 222,005Cumulative effect of accounting change (2) (249)
Restated balance 4,688 49 (4,881) (1,965) (577) (2,685) 186 1,721 221,755
Change in the year
Cash dividends (28,638)Profit attributable to owners of the parent 56,109
Purchase of treasury stock (19,145)
Disposal of treasury stock 3,919
Retirement of treasury stock —Change in treasury shares of the parent arising from transactions with non-controlling shareholders —Net changes of items other than shareholders’ equity 1,467 553 (2,703) 3,243 (22) 2,540 125 128 2,794
Net change in the year 1,467 553 (2,703) 3,243 (22) 2,540 125 128 15,038
BALANCE, MARCH 31, 2015 6,156 603 (7,584) 1,278 (599) (145) 312 1,850 236,794
FINANCE
Consolidated Financial Statements
43

Year ended March 31, 2016
(Millions of yen)
Shareholders’ equity
Capital stockCapital surplus
Retained earnings
Treasury stock
Total shareholders’
equity
BALANCE, APRIL 1, 2015 29,060 34,540 184,661 (13,485) 234,777
Cumulative effect of accounting change —
Restated balance 29,060 34,540 184,661 (13,485) 234,777
Change in the year
Cash dividends (30,439) (30,439)
Profit attributable to owners of the parent 67,279 67,279
Purchase of treasury stock (25,758) (25,758)
Disposal of treasury stock 480 6,917 7,397
Retirement of treasury stock (480) (14,990) 15,470 —
Change in treasury shares of the parent arising from transactions with non-controlling shareholders (1) (1)
Net changes of items other than shareholders’ equity
Net change in the year — — 21,848 (3,371) 18,476
BALANCE, MARCH 31, 2016 29,060 34,540 206,509 (16,857) 253,254
Accumulated other comprehensive income
Valuation difference
on available-for-sale
securities
Deferred gains
or losses on hedges
Revaluation reserve for land
Foreign currency
translation adjustment
Remeasure-ments of defined
benefit plans
Total accumulated other com-prehensive
income
Subscription rights
to shares
Non-controlling interests
Total net assets
BALANCE, APRIL 1, 2015 6,156 603 (7,584) 1,278 (599) (145) 312 1,850 236,794
Cumulative effect of accounting change —
Restated balance 6,156 603 (7,584) 1,278 (599) (145) 312 1,850 236,794
Change in the year
Cash dividends (30,439)
Profit attributable to owners of the parent 67,279
Purchase of treasury stock (25,758)
Disposal of treasury stock 7,397
Retirement of treasury stock —
Change in treasury shares of the parent arising from transactions with non-controlling shareholders (1)
Net changes of items other than shareholders’ equity (2,953) (1,546) — (1,507) (997) (7,005) 41 215 (6,749)
Net change in the year (2,953) (1,546) — (1,507) (997) (7,005) 41 215 11,727
BALANCE, MARCH 31, 2016 3,202 (943) (7,584) (229) (1,596) (7,151) 353 2,065 248,522
FAC
TS
TR
AT
EG
YA
CT
IVIT
IES
FIN
AN
CE
44

FINANCE
Consolidated Financial Statements
Consolidated Statement of Cash Flows (Millions of yen)Year Ended
March 31, 2015Year Ended
March 31, 2016
Cash flows from operating activities
Income before income taxes and minority interests 95,547 105,266
Depreciation and amortization 4,851 6,026
Impairment loss 145 92
Increase (decrease) in allowance for doubtful accounts 87 100
Increase (decrease) in provision for bonuses 311 1,054
Increase (decrease) in provision for repairs on whole-building leases 15,448 15,550
Increase (decrease) in net defined benefit liability (843) (237)
Interest and dividends income (777) (782)
Interest expenses 709 573
Loss (gain) on sales of short-term and long-term investment securities — (151)
Decrease (increase) in notes and accounts receivable – trade (2,157) (2,005)
Decrease (increase) in costs on uncompleted construction contracts (1,820) 91
Decrease (increase) in other inventories 457 117
Decrease (increase) in prepaid expenses (3,106) (695)
Decrease (increase) in operating loans (9,510) (5,818)
Increase (decrease) in notes and accounts payable – trade (1,756) (4,709)
Increase (decrease) in accounts payable – other 237 2,413
Increase (decrease) in advances received 7,311 4,440
Increase (decrease) in advances received on uncompleted construction contracts 5,206 (2,136)
Increase (decrease) in long-term guarantee deposits (8,343) (6,125)
Other 1,645 7,250
Subtotal 103,646 120,314
Interest and dividend income received 781 636
Interest expenses paid (710) (573)
Income taxes paid (44,316) (41,554)
Net cash provided by (used in) operating activities 59,401 78,822
Cash flows from investing activities
Payments into time deposits — (51,000)
Proceeds from decrease in money held in trust 8,500 6,000
Purchase of securities (4,200) (4,500)
Proceeds from sales and redemption of securities 10,530 8,000
Purchase of property, plant and equipment (14,690) (18,346)
Purchase of intangible assets (2,294) (6,241)
Purchase of investment securities (1,862) (25,474)
Other 4,948 (1,993)
Net cash provided by (used in) investing activities 930 (93,555)
Cash flows from financing activities
Decrease in short-term loans payable (300) —
Proceeds from long-term loans payable — 9,000
Repayments of long-term loans payable (16,690) (17,335)
Repayments of lease liabilities (281) (325)
Cash dividends paid (28,638) (30,439)
Purchase of treasury stock (19,145) (25,758)
Disposal of treasury stock 4,330 7,026
Dividends paid to non-controlling interests (66) (80)
Other (16) (10)
Net cash provided by (used in) financing activities (60,808) (57,923)
Effect of exchange rate change on cash and cash equivalents 2,791 (263)
Net increase (decrease) in cash and cash equivalents 2,314 (72,920)
Cash and cash equivalents at beginning of period 253,236 255,551
Cash and cash equivalents at end of period 255,551 182,631
45

Stock Data
Stock Price Trend
Shareholder Composition
Number of shares
Number of shares authorized 329,541,100 shares
Number of shares outstanding 78,094,379 shares
Number of shareholders 15,230
Information for shareholders
Share unit 100 shares
Fiscal year April 1 to March 31
Record dates Voting at general shareholders’ meeting March 31
Year-end dividend March 31
Interim dividend September 30
Transfer agentMitsubishi UFJ Trust and Banking Corporation1-4-5 Marunouchi, Chiyoda-ku, Tokyo, Japan
Transfer agent contact information
Stock Transfer Agency Division, Mitsubishi UFJ Trust and Banking Corporation 7-10-11 Higashisuna, Koto-ku, Tokyo 137-8081, JapanTel: 0120-232-711 (toll-free number in Japan only)
Method of public notice
Public notices shall be posted on the Company’s website.http://www.kentaku.co.jp/e/ir/index.htmlHowever, in the event that an electronic public notice is impracticable as a result of an accident or for other unavoidable reasons, the Company shall post its public notices in the Nihon Keizai Shimbun newspaper.
Stock exchange listingTokyo Stock Exchange (Firet Section) Nagoya Stock Exchange (First Section)Code: 1878
Foreign corporations
Financial institutions
Individuals and others
Domestic corporations
Financial instruments �rms
Daito Trust
44,122,539 shares (56.50%)
21,653,009 shares (27.73%)
6,471,262 shares ( 8.29%)
4,201,608 shares ( 5.38%)
1,290,376 shares ( 1.65%)
355,585 shares ( 0.46%)
44,466,955 Xxxx (56.05%)
31,156,111 Xxxx (39.28%)
1,368,870 Xxxx ( 1.73%)
1,323,117 Xxxx ( 1.67%)
397,235 Xxxx ( 0.50%)
246,213 Xxxx ( 0.31%)
164,858 Xxxx ( 0.21%)
127,075 Xxxx ( 0.16%)
73,945 Xxxx ( 0.09%)
Xxxxx
Xxxxx
Xxxxx
Xxxxx
Xxxxx
Xxxxx
Xxxxx
Xxxxx
Xxxxx
Number of shareholders 15,508
Breakdown of shareholders Xxxxx xxxxxx
0
50
100
150
200
250
300
2007/3
(Index)
2008/3
Daito Trust
2009/3 2010/3 2011/3 2012/3 2013/3 2014/3 2015/3 2016/3
TOPIX
FINANCE
Stock Information
Total shareholder returnCompared with
FY2013(Past 3 years)
Compared with FY2011
(Past 5 years)
Compared with FY2006
(Past 10 years)
Daito Trust 79.39% 138.96% 235.26%
TOPIX 7.84% 86.25% 0.62%
Source: Tokyo Stock Exchange
* Index created taking the closing price on March 31, 2007 as 100.* Total Shareholder return holding period based on the closing price on March 31, 2016.
(As of March 31, 2016)
FAC
TS
TR
AT
EG
YA
CT
IVIT
IES
FIN
AN
CE
46

Daito Trust Construction Co., Ltd.2-16-1, Konan, Minato-ku, Tokyo 108-8211 Japan
http://www.kentaku.co.jp/e/index.html
Capital: ¥29,060 million
Stock: Listed on the First Sections of the Tokyo Stock Exchange and Nagoya Stock Exchange (Code: 1878)
[Editing] Public Information & CSR Division
Notes: All information shown in this report is protected by the Copyright Act and other relevant laws.
Unauthorized use, redistribution, or reproduction is prohibited.
Integrated Report 2016 July 2016 — 1/300

Consolidated Financial Section 2016
Contents
Consolidated Balance Sheet P. 1
Consolidated Statement of Income P. 3
Consolidated Statement of Comprehensive Income P. 4
Consolidated Statement of Changes in Equity P. 5
Consolidated Statement of Cash Flows P. 6
Notes to Consolidated Financial Statements P. 7
Note:Consolidated Financial Section contains audited English-language financial statements in which certain items have been changed for the convenience of overseas readers.

Consolidated Balance Sheet
1
Daito Trust Construction Co., Ltd. and Consolidated SubsidiariesMarch 31, 2016
Millions of yenThousands of
U.S. dollars (Note 1)
2016 2015 2016
ASSETS
CURRENT ASSETS:
Cash and cash equivalents (Note 17) ¥233,631 ¥255,552 $2,073,403
Money held in Trust (Note 17) 26,506 32,505 235,233
Marketable securities (Notes 3, 5 and 17) 9,617 7,002 85,348
Notes and accounts receivable (Note 17):
Construction contracts 27,412 25,774 243,273
Other 11,215 10,870 99,530
Total receivables 38,627 36,644 342,803
Operating loans (Note 17) 60,490 54,672 536,830
Inventories (Note 6) 18,098 18,314 160,614
Prepaid expenses—whole-building lease and other 59,688 57,197 529,712
Deferred tax assets (Note 12) 19,955 19,235 177,094
Other current assets 13,263 13,577 117,704
Allowance for doubtful accounts (253) (305) (2,245)
Total current assets 479,622 494,393 4,256,496
PROPERTY, PLANT AND EQUIPMENT (Notes 7 and 16):
Land 43,169 42,452 383,111
Buildings and structures 61,842 61,594 548,829
Machinery and equipment 35,576 21,885 315,726
Furniture and fixture 7,547 6,795 66,977
Lease assets (Note 16) 3,639 3,744 32,295
Total 151,773 136,470 1,346,938
Accumulated depreciation (37,815) (34,851) (335,596)
Net property, plant and equipment 113,958 101,619 1,011,342
INVESTMENTS AND OTHER ASSETS:
Investment securities (Notes 3, 5 and 17) 26,610 27,199 236,155
Subordinated bonds and subordinated trust beneficiary right (Notes 4 and 17) 12,857 12,865 114,102
Investment in associated companies 18,900 113 167,732
Intangible assets 10,665 5,257 94,649
Guarantee deposit (Note 5) 24,118 21,537 214,040
Deferred tax assets (Note 12) 26,031 20,345 231,017
Other assets 18,803 20,655 166,870
Allowance for doubtful accounts (Note 4) (3,015) (2,863) (26,757)
Total investment and other assets 134,969 105,108 1,197,808
TOTAL ¥728,549 ¥701,120 $6,465,646

2
Millions of yenThousands of
U.S. dollars (Note 1)
2016 2015 2016
LIABILITIES AND EQUITY
CURRENT LIABILITIES:
Current portion of long-term lease obligations (Note 16) ¥ 241 ¥ 271 $ 2,139
Current portion of long-term bank loans (Notes 8 and 17) 16,691 16,691 148,127
Accounts payable (Note 17) 37,510 42,242 332,890
Advances received—construction contracts 47,274 49,411 419,542
Income taxes payable (Notes 12 and 17) 25,672 23,217 227,831
Advances received—whole-building lease and other 68,923 64,482 611,670
Accrued employees’ bonuses 21,587 20,532 191,578
Deposits received (Note 17) 7,632 6,880 67,732
Other current liabilities 56,353 43,706 500,115
Total current liabilities 281,883 267,432 2,501,624
LONG-TERM LIABILITIES:
Long-term bank loans (Notes 8 and 17) 54,943 63,279 487,602
Long-term lease obligations (Note 16) 908 1,009 8,058
Liability for retirement benefit (Note 9) 10,699 9,519 94,950
Provision for repair of whole-building lease system 80,705 65,154 716,232
Deposits received for guarantee (Note 17) 45,184 51,309 400,994
Other long-term liabilities 5,705 6,623 50,631
Total long-term liabilities 198,144 196,893 1,758,467
EQUITY (Note 10):
Common stock—authorized: 329,541 thousand shares; issued, 78,094 thousand shares in 2016 and 79,324 thousand shares in 2015 29,061 29,061 257,907
Capital surplus 34,541 34,541 306,541
Stock acquisition rights (Note 11) 354 312 3,142
Retained earnings 206,510 184,662 1,832,712
Treasury stock—at cost, 978 thousand shares in 2016 and 740 thousand shares in 2015 (16,857) (13,486) (149,601)
Accumulated other comprehensive income:
Unrealized gain on available-for-sale securities 3,203 6,157 28,426
Deferred gain (loss) on derivatives under hedge accounting (944) 603 (8,378)
Land revaluation surplus (7,584) (7,584) (67,306)
Foreign currency translation adjustments (230) 1,278 (2,041)
Defined retirement benefit plans (1,597) (599) (14,173)
Total 246,457 234,945 2,187,229
Noncontrolling interests 2,065 1,850 18,326
Total equity 248,522 236,795 2,205,555
TOTAL ¥728,549 ¥701,120 $6,465,646
See notes to consolidated financial statements.

3
Daito Trust Construction Co., Ltd. and Consolidated SubsidiariesYear Ended March 31, 2016
Consolidated Statement of Income
Millions of yenThousands of
U.S. dollars (Note 1)
2016 2015 2016
NET SALES:
Construction contracts (Note 13) ¥ 595,365 ¥ 589,171 $ 5,283,679
Real estate 774,808 723,817 6,876,180
Other 41,471 40,168 368,043
Total net sales 1,411,644 1,353,156 12,527,902
COST OF SALES:
Construction contracts 419,095 416,637 3,719,338
Real estate 712,197 671,531 6,320,527
Other 25,925 26,042 230,076
Total cost of sales 1,157,217 1,114,210 10,269,941
Gross profit 254,427 238,946 2,257,961
SELLING, GENERAL AND ADMINISTRATIVE EXPENSES (Note 14) 153,426 147,426 1,361,608
Operating income 101,001 91,520 896,353
OTHER INCOME (EXPENSES):
Interest and dividend income 783 777 6,949
Interest expense (Note 8) (573) (710) (5,085)
Other—net (Note 15) 4,055 3,961 35,986
Other income (expenses)—net 4,265 4,028 37,850
INCOME BEFORE INCOME TAXES 105,266 95,548 934,203
INCOME TAXES (Note 12):
Current 41,335 40,583 366,835
Deferred (3,654) (1,374) (32,428)
Total income taxes 37,681 39,209 334,407
NET INCOME 67,585 56,339 599,796
NET INCOME ATTRIBUTABLE TO NONCONTROLLING INTERESTS 305 230 2,707
NET INCOME ATTRIBUTABLE TO OWNERS OF THE PARENT ¥ 67,280 ¥ 56,109 $ 597,089
Yen U.S. dollars
PER SHARE OF COMMON STOCK (Note 20):
Basic net income ¥ 863.11 ¥ 710.19 $ 7.66
Diluted net income 862.52 709.73 7.65
Cash dividends applicable to the year 432.00 375.00 3.83
See notes to consolidated financial statements.

4
Daito Trust Construction Co., Ltd. and Consolidated SubsidiariesYear Ended March 31, 2016
Consolidated Statement of Comprehensive Income
Millions of yenThousands of
U.S. dollars (Note 1)
2016 2015 2016
NET INCOME ¥67,585 ¥56,339 $599,796
OTHER COMPREHENSIVE INCOME (Note 19):
Unrealized gain on available-for-sale securities (2,954) 1,468 (26,216)
Deferred gain (loss) on derivatives under hedge accounting (1,547) 553 (13,729)
Land revaluation surplus — (2,703) —
Foreign currency translation adjustments (1,508) 3,244 (13,383)
Defined retirement benefit plans (998) (42) (8,857)
Total other comprehensive income (7,007) 2,520 (62,185)
COMPREHENSIVE INCOME ¥60,578 ¥58,859 $537,611
TOTAL COMPREHENSIVE INCOME ATTRIBUTABLE TO:
Owners of the parent ¥60,274 ¥58,650 $534,913
Noncontrolling interests 304 209 2,698
See notes to consolidated financial statements.

5
Consolidated Statement of Changes in EquityDaito Trust Construction Co., Ltd. and Consolidated SubsidiariesYear Ended March 31, 2016
Millions of yen
Accumulated other comprehensive income
Number of Shares of Common
Stock Outstanding
CommonStock
CapitalSurplus
Stock Acquisition
RightsRetained Earnings
Treasury Stock
Unrealized Gain on
Available-for-Sale
Securities
Deferred Gain (Loss)
on Derivatives
under Hedge Accounting
Land Revaluation
Surplus
Foreign Currency
Translation Adjustments
Defined Retirement
Benefit Plans Total
Noncontrolling Interests Total Equity
BALANCE, APRIL 1, 2014 (as previously reported) 80,610,279 ¥29,061 ¥34,550 ¥187 ¥169,294 ¥(10,124) ¥4,689 ¥ 50 ¥(4,881) ¥(1,966) ¥ (577) ¥220,283 ¥1,724 ¥222,007
Cumulative effect of accounting change (247) (247) (3) (250)
BALANCE, APRIL 1, 2014 (as restated) 80,610,279 29,061 34,550 187 169,047 (10,124) 4,689 50 (4,881) (1,966) (577) 220,036 1,721 221,757
Net income attributable to owners of the parent 56,109 56,109 56,109
Cash dividends, ¥362 per share (28,638) (28,638) (28,638)
Purchase of treasury stock (19,146) (19,146) (19,146)
Disposal of treasury stock (1,285,900) 1,316 2,603 3,919 3,919
Retirement of treasury stock (1,325) (11,856) 13,181 — —
Net change in the year 125 1,468 553 (2,703) 3,244 (22) 2,665 129 2,794
BALANCE, MARCH 31, 2015 79,324,379 29,061 34,541 312 184,662 (13,486) 6,157 603 (7,584) 1,278 (599) 234,945 1,850 236,795
Net income attributable to owners of the parent 67,280 67,280 67,280
Cash dividends, ¥389 per share (30,439) (30,439) (30,439)
Purchase of treasury stock (25,759) (25,759) (25,759)
Disposal of treasury stock (1,230,000) 480 6,917 7,397 7,397
Retirement of treasury stock (480) (14,991) 15,471 — —
Changes in the parent’s ownership interest due to transactions with noncontrolling interests (2) (2) (2)
Net change in the year 42 (2,954) (1,547) (1,508) (998) (6,965) 215 (6,750)
BALANCE, MARCH 31, 2016 78,094,379 ¥29,061 ¥34,541 ¥354 ¥206,510 ¥(16,857) ¥3,203 ¥ (944) ¥(7,584) ¥ (230) ¥(1,597) ¥246,457 ¥2,065 ¥248,522
Thousands of U.S. dollars (Note 1)
Accumulated other comprehensive income
CommonStock
CapitalSurplus
Stock Acquisition
RightsRetained Earnings
Treasury Stock
Unrealized Gain on
Available-for-Sale
Securities
Deferred Gain (Loss)
on Derivatives
under Hedge Accounting
Land Revaluation
Surplus
Foreign Currency
Translation Adjustments
Defined Retirement
Benefit Plans Total
Noncontrolling Interests Total Equity
BALANCE, MARCH 31, 2015 $257,907 $306,541 $2,769 $1,638,818 $(119,684) $ 54,642 $ 5,351 $(67,306) $ 11,342 $ (5,316) $2,085,064 $16,418 $2,101,482
Net income attributable to owners of the parent 597,089 597,089 597,089
Cash dividends, $3.45 per share (270,137) (270,137) (270,137)
Purchase of treasury stock (228,603) (228,603) (228,603)
Disposal of treasury stock 4,260 61,386 65,646 65,646
Retirement of treasury stock (4,260) (133,040) 137,300 — —
Changes in the parent’s ownership interest due to transactions with noncontrolling interests (18) (18) (18)
Net change in the year 373 (26,216) (13,729) (13,383) (8,857) (61,812) 1,908 (59,904)
BALANCE, MARCH 31, 2016 $257,907 $306,541 $3,142 $1,832,712 $(149,601) $ 28,426 $ (8,378) $(67,306) $ (2,041) $(14,173) $2,187,229 $18,326 $2,205,555
See notes to consolidated financial statements.

6
Consolidated Statement of Cash FlowsDaito Trust Construction Co., Ltd. and Consolidated SubsidiariesYear Ended March 31, 2016
Millions of yenThousands of
U.S. dollars (Note 1)
2016 2015 2016OPERATING ACTIVITIES:
Income before income taxes ¥105,266 ¥ 95,548 $ 934,203 Adjustments for:
Income taxes—paid (41,555) (44,317) (368,788)Depreciation and amortization 6,026 4,851 53,479 Impairment loss 92 145 816 Changes in operating assets and liabilities:
Decrease (increase) in notes and accounts receivable (2,006) (2,158) (17,803)Decrease (increase) in inventories 210 (1,363) 1,864 Decrease (increase) in prepaid expenses— whole-building lease and other (695) (3,106) (6,168)Decrease (increase) in operating loans (5,818) (9,510) (51,633)Increase (decrease) in accounts payables (4,710) (1,756) (41,800)Increase (decrease) in advances received— whole-building lease and other 4,441 7,312 39,412 Increase (decrease) in advances received— construction contracts (2,137) 5,206 (18,965)Increase (decrease) in deposits received for guarantee (6,126) (8,343) (54,366)Increase (decrease) in deposits received 763 (145) 6,771 Increase (decrease) in allowance for doubtful accounts 101 87 896 Increase (decrease) in accrued employees’ bonuses 1,054 312 9,354 Increase (decrease) in liability for retirement benefits (238) (843) (2,112)Increase (decrease) in provision for repair of whole-building lease system 15,550 15,449 138,001
Other—net 8,604 2,032 76,360 Total adjustments (26,444) (36,147) (234,682)Net cash provided by operating activities 78,822 59,401 699,521
INVESTING ACTIVITIES:Payments for time deposits (51,000) — (452,609)Proceeds from money held in trust 6,000 8,500 53,248 Purchases of marketable and investment securities (29,974) (6,062) (266,010)Proceeds from sales and redemption of marketable and investment securities 8,000 10,530 70,998 Payments for purchase of property, plant and equipment (18,347) (14,691) (162,824)Payments for purchase of intangible assets (6,241) (2,295) (55,387)Other—net (1,994) 4,949 (17,696)
Net cash provided by (used in) investing activities (93,556) 931 (830,280)FINANCING ACTIVITIES:
Repayment of short-term bank loan — (300) —Proceeds from long-term bank loan 9,000 — 79,872 Repayment of long-term bank loan (17,336) (16,691) (153,852)Dividends paid (30,439) (28,638) (270,137)Repurchase of treasury stock (25,759) (19,146) (228,603)Proceeds from disposal of treasury stock 7,026 4,330 62,354 Dividends paid to noncontrolling interests (81) (66) (719)Other—net (335) (298) (2,973)
Net cash used in financing activities (57,924) (60,809) (514,058)FOREIGN CURRENCY TRANSLATION ADJUSTMENTS ON CASH AND CASH EQUIVALENTS (263) 2,792 (2,334)NET INCREASE (DECREASE) IN CASH AND CASH EQUIVALENTS (72,921) 2,315 (647,151)CASH AND CASH EQUIVALENTS, BEGINNING OF YEAR 255,552 253,237 2,267,945 CASH AND CASH EQUIVALENTS, END OF YEAR ¥182,631 ¥255,552 $1,620,794
See notes to consolidated financial statements.

7
Daito Trust Construction Co., Ltd. and Consolidated SubsidiariesYear Ended March 31, 2016
Notes to Consolidated Financial Statements
1. BASIS OF PRESENTING CONSOLIDATED FINANCIAL STATEMENTS
The accompanying consolidated financial statements have been prepared in accordance with the provisions
set forth in the Japanese Financial Instruments and Exchange Act and its related accounting regulations and in
accordance with accounting principles generally accepted in Japan, which are different in certain respects as to
application and disclosure requirements of International Financial Reporting Standards.
In preparing these consolidated financial statements, certain reclassifications and rearrangements have been made
to the consolidated financial statements issued domestically in order to present them in a form which is more
familiar to readers outside Japan. In addition, certain reclassifications have been made in the 2015 consolidated
financial statements to conform them to the classifications used in 2016.
The consolidated financial statements are stated in Japanese yen, the currency of the country in which Daito Trust
Construction Co., Ltd. (the “Company”) is incorporated and operates. The translations of Japanese yen amounts
into U.S. dollar amounts are included solely for the convenience of readers outside Japan and have been made at
the rate of ¥112.68 to $1, the approximate rate of exchange at March 31, 2016. Such translations should not be
construed as representations that the Japanese yen amounts could be converted into U.S. dollars at that or any
other rate.
2. SUMMARY OF SIGNIFICANT ACCOUNTING POLICIES
a. Consolidation—The consolidated financial statements as of March 31, 2016, include the accounts of the
Company and its 24 significant (21 in 2015) subsidiaries (together, the “Group”).
Under the control and influence concepts, those companies in which the Company, directly or indirectly, is able
to exercise control over operations are fully consolidated.
Investments in 2 (— in 2015) associated companies are accounted for by the equity method, and those
companies over which the Group has the ability to exercise significant influence are accounted for by the equity
method.
Investment in an associated company is stated at cost. If the equity method of accounting had been applied to
the investment in this company, the effect on the accompanying consolidated financial statements would not be
material.
All significant intercompany balances and transactions have been eliminated in consolidation. All material
unrealized profit included in assets resulting from transactions within the Group is also eliminated.
b. Cash Equivalents—Cash equivalents are short-term investments that are readily convertible into cash and that
are exposed to insignificant risk of changes in value.
Cash equivalents include time deposits and certificates of deposit, both of which mature within three months of
the date of acquisition.
c. Inventories—Construction projects in progress are stated at cost determined on the specific project basis.
Materials and other inventories are mainly stated at the lower of cost determined by the moving-average
method, or net selling value.

8
d. Marketable and Investment Securities—Marketable and investment securities are classified and accounted for,
depending on management’s intent, as follows:
(1) held-to-maturity debt securities, for which there is the positive intent and ability to hold to maturity are
reported at amortized cost; and (2) available-for-sale securities, which are not classified as the aforementioned
securities, are reported at fair value, with unrealized gains and losses, net of applicable taxes, reported in a
separate component of equity.
Nonmarketable available-for-sale securities are stated at cost determined by the moving-average method. For
other-than-temporary declines in fair value, investment securities are reduced to net realizable value by a charge
to income.
e. Property, Plant and Equipment—Property, plant and equipment are stated at cost. Depreciation of property,
plant and equipment of the Company and its consolidated domestic subsidiaries is computed substantially by
the declining-balance method based on the estimated useful lives of the assets, while the straight-line method
is applied to buildings acquired after April 1, 1998, and all property and equipment of consolidated foreign
subsidiaries. The range of useful lives is principally from 10 to 60 years for buildings and structures, from 3 to 22
years for machinery and equipment, and from 2 to 20 years for furniture and fixture. Lease assets are depreci-
ated using the straight-line method over the estimated useful lives of assets which are the term of the respective
leases.
f. Long-Lived Assets—The Group reviews its long-lived assets for impairment whenever events or changes in
circumstance indicate the carrying amount of an asset or asset group may not be recoverable. An impairment
loss is recognized if the carrying amount of an asset or asset group exceeds the sum of the undiscounted future
cash flows expected to result from the continued use and eventual disposition of the asset or asset group. The
impairment loss would be measured as the amount by which the carrying amount of the asset exceeds its recov-
erable amount, which is the higher of the discounted cash flows from the continued use and eventual disposition
of the asset or the net selling price at disposition.
g. Land Revaluation—Under the “Law of Land Revaluation,” the Company elected a one-time revaluation of its
own-use land to a value based on real estate appraisal information as of March 31, 2002. The resulting land
revaluation difference represents the unrealized decline in value of land and is stated as a component of equity.
There was no effect on the consolidated statement of income. Continuous readjustment is not permitted unless
the land value subsequently declines significantly. The amount of the decline in value would be added to the land
revaluation difference account.
h. Allowance for Doubtful Accounts—The allowance for doubtful accounts is stated at amounts considered to be
appropriate based on the Group’s past credit loss experience and an evaluation of potential losses in the receiv-
ables outstanding. The allowance for doubtful accounts related to the subordinated bonds and subordinated
trust beneficiary right issued by special-purpose entities (SPEs) is stated based on an evaluation of potential
losses due to the worsening fiscal condition of the SPEs.
i. Accrued Employees’ Bonuses—The Company and certain consolidated subsidiaries have provided for employ-
ees’ bonuses to state the liability at the estimated amount payable to employees.

9
j. Retirement and Pension Plans—The Company and certain consolidated subsidiaries have contributory funded
defined benefit pension plans and unfunded retirement benefit plans for employees. Other consolidated domestic
subsidiaries have unfunded retirement benefit plans for their employees.
Expected benefits are attributed to periods on a benefit formula basis.
Unrecognized prior service liabilities are amortized over a certain period (mainly 8 years) using the straight-line
method within the average remaining service period, commencing from the date on which they are incurred.
Unrecognized actuarial net gains or losses are amortized over a certain period (mainly 6 years and 8 years) using
the declining-balance method within the average remaining service period, commencing from the date on which
they are incurred. Certain consolidated subsidiaries are amortized from the following year in which they arise.
k. Provision for Repair of Whole-Building Lease System—Certain consolidated subsidiaries have provided for
a provision for repair of whole-building lease systems to cover probable costs of restoration and repairs being
borne in the future based on the whole-building lease contracts.
l. Stock Options—The accounting standard for stock options requires companies to measure the cost of
employee stock options based on the fair value at the date of grant and recognize compensation expense over
the vesting period as consideration for receiving goods or services. The standard also requires companies to
account for stock options granted to non-employees based on the fair value of either the stock option or the
goods or services received. In the balance sheet, the stock option is presented as a stock acquisition right as a
separate component of equity until exercised. The standard covers equity-settled, share-based payment trans-
actions, but does not cover cash-settled, share-based payment transactions. In addition, the standard allows
unlisted companies to measure options at their intrinsic value if they cannot reliably estimate fair value.
m. Employee Stockownership Plan—In December 2013, the ASBJ issued Practical Issues Task Force (PITF) No.
30, “Practical Solution on Transactions of Delivering the Company’s Own Stock to Employees etc. through
Trusts.” This PITF is effective for the beginning of annual periods beginning on or after April 1, 2014, with earlier
application permitted from the beginning of annual periods first ending after the date of issuance of this PITF,
and applied retrospectively.
In accordance with the PITF, upon the transfer of treasury stock to the employee stockownership trust (the
“Trust”) by the entity, any difference between the book value and fair value of the treasury stock shall be
recorded in capital surplus. At year end, the entity shall record (1) the entity stock held by the Trust as treasury
stock in equity, (2) all other assets and liabilities of the Trust on a line-by-line basis, and (3) a liability/asset for
the net of (i) any gain or loss on delivery of the stock by the Trust to the employee shareholding association, (ii)
dividends received from the entity for the stock held by the Trust, and (iii) any expenses relating to the Trust.
The Company applied this PITF effective April 1, 2014. As for the trust contracts concluded before April 1,
2014, the Company applied transitional accounting (as stipulated in this PITF) and continued the previous
accounting treatment.
n. Research and Development Costs—Research and development costs are charged to income as incurred.

10
o. Construction Contracts—Under the accounting standard for construction contracts, construction revenue and
construction costs should be recognized by the percentage-of-completion method if the outcome of a construc-
tion contract can be estimated reliably. When total construction revenue, total construction costs and the stage
of completion of the contract at the balance sheet date can be reliably measured, the outcome of a construction
contract is deemed to be estimated reliably. If the outcome of a construction contract cannot be reliably esti-
mated, the completed-contract method should be applied. When it is probable that the total construction costs
will exceed total construction revenue, an estimated loss on the contract should be immediately recognized by
providing for a loss on construction contracts.
p. Income Taxes—The provision for income taxes is computed based on the pretax income included in the
consolidated statement of income. The asset and liability approach is used to recognize deferred tax assets and
liabilities for the expected future tax consequences of temporary differences between the carrying amounts and
the tax bases of assets and liabilities. Deferred taxes are measured by applying currently enacted tax laws to the
temporary differences.
q. Foreign Currency Transactions—All short-term and long-term monetary receivables and payables denominated
in foreign currencies are translated into Japanese yen at the exchange rates at the balance sheet date. The
foreign exchange gains and losses from translation are recognized in the consolidated statement of income to
the extent that they are not hedged by forward exchange contracts.
r. Foreign Currency Financial Statements—The balance sheet accounts, revenue and expense accounts of the
consolidated foreign subsidiaries are translated into Japanese yen at the current exchange rate as of the balance
sheet date except for equity, which is translated at the historical rate. Differences arising from such translation
are shown as “Foreign currency translation adjustments” under accumulated other comprehensive income in a
separate component of equity.
s. Derivatives and Hedging Activities—The Group uses derivative financial instruments to manage its exposure
to fluctuations in foreign exchange. Foreign exchange forward contracts, currency options, and currency swaps
are utilized by the Group to reduce foreign currency exchange risk. The Group does not enter into derivatives for
trading or speculative purposes.
Derivative financial instruments and foreign currency transactions are classified and accounted for as follows:
(1) all derivatives are recognized as either assets or liabilities and measured at fair value, and gains or losses on
derivative transactions are recognized in the consolidated statement of income and (2) for derivatives used for
hedging purposes, if such derivatives qualify for hedge accounting because of high correlation and effectiveness
between the hedging instruments and the hedged items, gains or losses on derivatives are deferred until maturity
of the hedged transactions.
The foreign currency forward contracts, currency options, and currency swaps employed to hedge foreign
exchange exposure for imports are measured at fair value and the unrealized gains/losses are recognized in
income. Forward contracts applied for forecasted (or committed) transactions are also measured at fair value but
the unrealized gains/losses are deferred until the underlying transactions are completed.
Accounts payable denominated in foreign currencies for which foreign exchange forward contracts are used to
hedge the foreign currency fluctuations are translated at the contracted rate if the forward contracts, currency
option, and currency swaps qualify for hedge accounting.

11
t. Consumption Tax—Consumption tax is accounted for by the tax exclusion method.
u. Per Share Information—Basic net income per share is computed by dividing net income available to common
shareholders by the weighted-average number of common shares outstanding for the period, retroactively
adjusted for stock splits.
Diluted net income per share reflects the potential dilution that could occur if securities were exercised or
converted into common stock. Diluted net income per share of common stock assumes full conversion of the
outstanding warrants at the beginning of the year (or at the time of issuance).
Cash dividends per share presented in the accompanying consolidated statement of income are dividends
applicable to the respective years, including dividends to be paid after the end of the year.
3. MARKETABLE AND INVESTMENT SECURITIES
Marketable and investment securities as of March 31, 2016 and 2015, consisted of the following:
Millions of yenThousands ofU.S. dollars
2016 2015 2016
Current:Government and corporate bonds ¥ 8,316 ¥ 5,803 $ 73,802Other 1,301 1,199 11,546
Total ¥ 9,617 ¥ 7,002 $ 85,348Non-current:
Marketable equity securities ¥17,730 ¥22,303 $157,348Government and corporate bonds 7,946 4,866 70,518Capital investment in LLC 904 — 8,023Trust fund investments and other 30 30 266
Total ¥26,610 ¥27,199 $236,155
The carrying amounts and aggregate fair values of marketable and investment securities at March 31, 2016 and
2015, were as follows:Millions of yen
March 31, 2016 CostUnrealized
GainsUnrealized
Losses Fair Value
Securities classified as: Available-for-sale:
Equity securities ¥13,115 ¥4,667 ¥52 ¥17,730Government and corporate bonds 16,165 12 45 16,132Other 1,300 1 — 1,301
Held-to-maturity 130 4 — 134
March 31, 2015
Securities classified as:Available-for-sale
Equity securities ¥13,199 ¥9,104 ¥— ¥22,303Government and corporate bonds 10,443 6 11 10,438Other 1,200 — 1 1,199
Held-to-maturity 230 6 — 236

12
Thousands of U.S. dollars
March 31, 2016 CostUnrealized
GainsUnrealized
Losses Fair Value
Securities classified as: Available-for-sale:
Equity securities $ 116,391 $41,418 $461 $157,348Government and corporate bonds 143,459 106 399 143,166Other 11,537 9 — 11,546
Held-to-maturity 1,154 35 — 1,189
4. SUBORDINATED BONDS AND SUBORDINATED TRUST BENEFICIARY RIGHT
The Company mediates the extension of apartment loans to customers who order construction of rental housing.
As for these loans, financial institutions establish SPEs and the loans are securitized by SPEs.
When the customers use these loans, the Company is required to buy the subordinated bonds or subordinated
trust beneficiary rights issued by the SPEs according to the agreement with certain financial institutions.
Details of the subordinated bonds and subordinated trust beneficiary right are as follows:
Millions of yenThousands ofU.S. dollars
2016 2015 2016
Subordinated bonds and subordinated trust beneficiary rights ¥12,857 ¥12,865 $114,102Allowance for doubtful accounts ¥ (476) ¥ (650) $ (4,224)Possession ratio of subordinated bonds and subordinated trust beneficiary rights 6.17% 6.17% 6.17%Date of maturity November
2034 – February
2043
November 2034 –
February 2043
November 2034 –
February 2043
Loan balance of SPEs ¥67,381 ¥81,083 $597,985Outstanding bonds of SPEs ¥68,375 ¥81,723 $606,807Number of SPEs 10 10 10
The possession ratio of the subordinated bonds and subordinated trust beneficiary rights is the ratio of the subordi-
nated bonds and subordinated trust beneficiary rights balance of the Company to the total amount of bonds when
issued.
5. PLEDGED ASSETS
The carrying amounts of assets pledged as collateral required by the Building Lots and Buildings Transaction
Business Law, the Act for Secure Execution of Defect Warranty Liability and for the purpose of extending payment
due dates for customs and consumption tax, the Trust Business Act and the Insurance Business Act and
Settlement of Electricity Transaction at March 31, 2016 and 2015, were as follows:
Millions of yenThousands ofU.S. dollars
2016 2015 2016
Investment securities ¥3,877 ¥6,553 $34,407Other 3,865 530 34,301Total ¥7,742 ¥7,083 $68,708

13
6. INVENTORIES
Inventories at March 31, 2016 and 2015, consisted of the following:
Millions of yenThousands ofU.S. dollars
2016 2015 2016
Construction projects in progress ¥13,224 ¥12,148 $117,359Materials 4,545 4,699 40,335Real estate held for sale 105 1,273 932Merchandise 224 194 1,988Total ¥18,098 ¥18,314 $160,614
7. INVESTMENT PROPERTY
The Group owns certain rental properties such as office buildings, apartments and car parking spaces. The net
of rental income and operating expenses for those rental properties was ¥3,542 million ($31,434 thousand) and
¥3,270 million for the fiscal years ended March 31, 2016 and 2015, respectively.
In addition, the carrying amounts, changes in such balances and market prices of such properties are as follows:
Millions of yen
Carrying Amount Fair Value
April 1, 2015 Increase March 31, 2016 March 31, 2016
¥56,997 ¥107 ¥57,104 ¥121,556
Millions of yen
Carrying Amount Fair Value
April 1, 2014 Decrease March 31, 2015 March 31, 2015
¥57,704 ¥707 ¥56,997 ¥116,775
Thousands of U.S. dollars
Carrying Amount Fair Value
April 1, 2015 Increase March 31, 2016 March 31, 2016
$505,831 $949 $506,780 $1,078,772
Notes:1. Carrying amount recognized in the consolidated balance sheet is net of accumulated depreciation and accumulated impair-
ment losses, if any.2. Increase during the fiscal year ended March 31, 2016, primarily represents the acquisition of certain properties of ¥891 million
($7,907 thousand), and decrease primarily represents the recognition of depreciation of ¥776 million ($6,887 thousand).3. Increase during the fiscal year ended March 31, 2015, primarily represents the acquisition of certain properties of ¥84 million,
and decrease primarily represents the recognition of depreciation of ¥796 million.4. Fair value of properties is measured by the Group in accordance with its Real-Estate Appraisal Standard.

14
8. LONG-TERM BANK LOANS
Long-term bank loans at March 31, 2016 and 2015, consisted of the following:
Millions of yenThousands ofU.S. dollars
2016 2015 2016
Loans from banks due on various dates through 2020 with interest rates ranging from 0.37% to 0.80% (2016) and from 0.38% to 0.87% (2015) ¥ 71,634 ¥ 79,970 $ 635,729
Total 71,634 79,970 635,729Less current portion (16,691) (16,691) (148,127)Long-term bank loans, less current portion ¥ 54,943 ¥ 63,279 $ 487,602
Annual maturities of long-term bank loans, excluding finance leases (see Note 16), at March 31, 2016, were as
follows:
Year Ending March 31 Millions of yenThousands ofU.S. dollars
2017 ¥16,691 $148,1272018 44,075 391,1522019 6,352 56,3722020 1,816 16,1162021 2,700 23,962Total ¥71,634 $635,729
As is customary in Japan, the Company maintains substantial deposit balances with banks with which it has
borrowings. Such deposit balances are not legally or contractually restricted as to withdrawal.
General agreements with respective banks provide, as is customary in Japan, that additional collateral must be
provided under certain circumstances if requested by such banks and that certain banks have the right to offset
cash deposited with them against any long-term or short-term debt or obligation that becomes due and, in case
of default and certain other specified events, against all other debt payable to the banks. The Company has never
been requested to provide any additional collateral.
In addition, the Company entered into committed loan facility agreements aggregating ¥99,025 million ($878,816
thousand) with 12 Japanese banks. There was no balance under the committed loan facility agreements as of
March 31, 2016.

15
9. RETIREMENT AND PENSION PLANS
The Company and certain consolidated subsidiaries have severance payment plans for employees. Under most
circumstances, employees terminating their employment are entitled to retirement benefits determined based on
the rate of pay at the time of termination, years of service and certain other factors. Such retirement benefits are
made in the form of a lump-sum severance payment from the Company or from certain consolidated subsidiaries
and annuity payments from a trustee. Employees are entitled to larger payments if the termination is involuntary, by
retirement at the mandatory retirement age, by death, or by voluntary retirement at certain specific ages prior to the
mandatory retirement age.
The liability for employees’ retirement benefits at March 31, 2016 and 2015, consisted of the following:
1. The changes in defined benefit obligation for the years ended March 2016 and 2015, were as follows:
Millions of yenThousands ofU.S. dollars
2016 2015 2016
Balance at beginning of year (as previously reported) ¥29,171 ¥26,699 $258,884Cumulative effect of accounting change — 388 —
Balance at beginning of year (as restated) 29,171 27,087 258,884Current service cost 2,429 2,218 21,557Interest cost 47 69 417Actuarial gains and losses 1,953 1,127 17,332Benefits paid (1,901) (1,330) (16,871)
Balance at end of year ¥31,699 ¥29,171 $281,319
2. The changes in plan assets for the years ended March 2016 and 2015, were as follows:
Millions of yenThousands ofU.S. dollars
2016 2015 2016
Balance at beginning of year ¥19,652 ¥16,745 $174,405Expected return on plan assets 294 251 2,609Actuarial gains and losses (378) 767 (3,355)Contributions from the employer 2,771 2,747 24,592Benefits paid (1,339) (858) (11,883)
Balance at end of year ¥21,000 ¥19,652 $186,368
3. Reconciliation between the liability recorded in the consolidated balance sheet and the balances of defined
benefit obligation and plan assets for the years ended March 31,2016 and 2015, was as follows:
Millions of yenThousands ofU.S. dollars
2016 2015 2016
Funded defined benefit obligation ¥23,039 ¥21,138 $204,463Plan assets 21,000 19,652 186,368
2,039 1,486 18,095Unfunded defined benefit obligation 8,660 8,033 76,855Net liability arising from benefit obligation ¥10,699 ¥ 9,519 $ 94,950
Millions of yenThousands ofU.S. dollars
2016 2015 2016
Liability for retirement benefits ¥10,699 ¥9,519 $94,950Asset for retirement benefits — — —Net liability arising from benefit obligation ¥10,699 ¥9,519 $94,950

16
4. The components of net periodic benefit costs for the years ended March 31, 2016 and 2015, were as follows:
Millions of yenThousands ofU.S. dollars
2016 2015 2016
Service cost ¥2,429 ¥2,218 $21,557Interest cost 47 69 417Expected return on plan assets (294) (251) (2,609)Amortization of prior service cost 7 7 62Recognized actuarial gains and losses 906 335 8,040Net periodic benefit costs ¥3,095 ¥2,378 $27,467
5. Amounts recognized in other comprehensive income (before income tax effect) in respect of defined retirement
benefit plans for the years ended March 31, 2016 and 2015.
Millions of yenThousands ofU.S. dollars
2016 2015 2016
Prior service cost ¥ 7 ¥ 7 $ 63Actuarial gains and losses (1,424) (27) (12,638)Total ¥(1,417) ¥(20) $(12,576)
6. Amounts recognized in accumulated other comprehensive income (before income tax effect) in respect of
defined retirement benefit plans as of March 31, 2016 and 2015.
Millions of yenThousands ofU.S. dollars
2016 2015 2016
Unrecognized prior service cost ¥ (75) ¥ (82) $ (666)Unrecognized actuarial gains and losses (2,224) (800) (19,737)Total ¥(2,299) ¥(882) $(20,403)
7. Plan assets
(1) Components of plan assets
Plan assets as of March 31, 2016 and 2015, consisted of the following:
2016 2015
Debt investments 29.2% 17.3%Equity investments 13.7% 18.6%Cash and cash equivalents 6.1% 2.0%General accounts 50.7% 61.3%Others 0.3% 0.8%Total 100.0% 100.0%
(2) Method of determining the expected rate of return on plan assets
The expected rate of return on plan assets is determined considering the long-term rates of return which are
expected currently and in the future from the various components of the plan assets.
8. Assumptions used for the years ended March 31, 2016 and 2015, were set forth as follows:
2016 2015
Discount rate 0.0% 0.2% Expected rate of return on plan assets 1.5% 1.5% Expected rate of future salary increases 1.5% 2.1%

17
10. EQUITY
Japanese companies are subject to the Companies Act of Japan (the “Companies Act”). The significant provisions
in the Companies Act that affect financial and accounting matters are summarized below:
a. Dividends
Under the Companies Act, companies can pay dividends at any time during the fiscal year in addition to the year-
end dividend upon resolution at the shareholders’ meeting. Additionally, for companies that meet certain criteria
including (1) having a Board of Directors, (2) having independent auditors, (3) having an Audit & Supervisory Board,
and (4) the term of service of the directors being prescribed as one year rather than the normal two-years term
by its articles of incorporation, the Board of Directors may declare dividends (except for dividends-in-kind) at any
time during the fiscal year if the company has prescribed so in its articles of incorporation. However, the Company
cannot do so because it does not meet all the above criteria.
The Companies Act permits companies to distribute dividends-in-kind (noncash assets) to shareholders subject to
a certain limitation and additional requirements.
Semiannual interim dividends may also be paid once a year upon resolution by the Board of Directors if the articles
of incorporation of the company so stipulate. The Companies Act provides certain limitations on the amounts
available for dividends or the purchase of treasury stock. The limitation is defined as the amount available for
distribution to the shareholders, but the amount of net assets after dividends must be maintained at no less than
¥3 million.
b. Increases/Decreases and Transfer of Common Stock, Reserve and Surplus
The Companies Act requires that an amount equal to 10% of dividends must be appropriated as a legal reserve
(a component of retained earnings) or as additional paid-in capital (a component of capital surplus) depending
on the equity account charged upon the payment of such dividends, until the aggregate amount of legal reserve
and additional paid-in capital equals 25% of the common stock. Under the Companies Act, the total amount of
additional paid-in capital and legal reserve may be reversed without limitation. The Companies Act also provides
that common stock, legal reserve, additional paid-in capital, other capital surplus, and retained earnings can be
transferred among the accounts under certain conditions upon resolution of the shareholders.
c. Treasury Stock and Treasury Stock Acquisition Rights
The Companies Act also provides for companies to purchase treasury stock and dispose of such treasury stock
by resolution of the Board of Directors. The amount of treasury stock purchased cannot exceed the amount
available for distribution to the shareholders which is determined by a specific formula. Under the Companies Act,
stock acquisition rights are presented as a separate component of equity. The Companies Act also provides that
companies can purchase both treasury stock acquisition rights and treasury stock. Such treasury stock acquisition
rights are presented as a separate component of equity or deducted directly from stock acquisition rights.
The Company has set up a “Trust under Employee Stock Ownership Plan” (the “ESOP trust”) and “Trust for
employees receiving in-kind benefit by stock”(the “J-ESOP”) to improve employees’ benefit program, increase
the corporate value by enhancing awareness of the Company’s results and stock price, and enhance employees’
motivation and morale.

18
The Trust Contracts Concluded Before April 1, 2014
ESOP trust
The implementation of an employee incentive plan ESOP trust was resolved at the board of directors’ meeting
held on June 17, 2011, aiming to increase the Company’s corporate value over the medium- to long-term. The
Company has set up a trust for employees that are members of “Daito Trust Construction Co., Ltd. Employee
Stock Ownership” who are eligible under certain requirements to be beneficiaries. The ESOP trust acquired the
number of shares of the Company’s stock expected to be acquired by the Daito Trust Construction Co., Ltd.
Employee Stock Ownership Plan over five years after its establishment during the designated acquisition period,
July 1, 2011 to September 22, 2011. Since the acquisition, the ESOP trust has sold shares of the Company’s
stock to Daito Trust Construction Co., Ltd. Employee Stock Ownership on a certain day every month. As for the
termination of the ESOP trust, where an increase in the stock price will have generated trust earnings, money held
in trust will be distributed to the employees as beneficiaries based on their contribution ratio. When a decrease in
the stock price will have caused losses on transfer and obligations related to trust assets remain, the employees
will not be obligated to make additional contributions because the Company will settle those obligations in a lump
sum with the bank in accordance with a guarantee clause in the loan agreement. The ESOP trust was terminated
in November 2015.
J-ESOP
The implementation of a new employee incentive plan J-ESOP was resolved at the board of directors’ meeting held
on July 4, 2011. Under the J-ESOP, employees are granted shares of the Company’s stock when they become
vested in accordance with the Share-based Benefits Regulations established by the Company. The Company
grants points to selected employees based on their performance and achievements. Employees who have met
certain requirements will receive the number of shares of the Company’ stock corresponding to their points
obtained (one share to one point). Shares to be granted to employees are acquired for both current and future
benefits with the money held in trust and separately managed as trust assets.
With the J-ESOP, the Company expects to enhance employees’ morale and motivation to dedicate themselves to
improving the Company’s business performance and corporate value over the medium-term.
The Company’s stock held by the above trusts at March 31, 2016 and 2015, was as follows:
Millions of yenThousands ofU.S. dollars
2016 2015 2016
ESOP trust ¥ — ¥ 839 $ —J-ESOP 4,059 5,064 36,022Total ¥4,059 ¥5,903 $36,022
Thousands of Shares
2016 2015
ESOP trust — 117J-ESOP 429 570Total 429 687
The Company’s stock held by the trusts is therefore presented as “Treasury Stock” and as a deduction to share-
holders’ equity in the consolidated balance sheet and consolidated shareholders’ equity (or statement of changes
in equity).
However, such Company’s stock is excluded from treasury stock in calculating net income per share of common
stock and fully diluted net income per share of common stock.

19
The Trust Contracts Concluded On or After April 1, 2014
ESOP trust
The implementation of an employee incentive plan ESOP trust was resolved at the board of directors’ meeting
held on November 24, 2015, aiming to increase the Company’s corporate value over the medium- to long-term.
The Company has set up a trust for employees that are members of “Daito Trust Construction Co., Ltd. Employee
Stock Ownership” who are eligible under certain requirements to be beneficiaries. The ESOP trust acquired the
number of shares of the Company’s stock expected to be acquired by the Daito Trust Construction Co., Ltd.
Employee Stock Ownership Plan over five years after its establishment during the designated acquisition period,
December 16, 2015 to January 29, 2016. Since the acquisition, the ESOP trust has sold shares of the Company’s
stock to Daito Trust Construction Co., Ltd. Employee Stock Ownership on a certain day every month. As for the
termination of the ESOP trust, where an increase in the stock price will have generated trust earnings, money held
in trust will be distributed to the employees as beneficiaries based on their contribution ratio. When a decrease in
the stock price will have caused losses on transfer and obligations related to trust assets remain, the employees
will not be obligated to make additional contributions because the Company will settle those obligations in a lump
sum with the bank in accordance with a guarantee clause in the loan agreement.
The Company’s stock held by the above trust at March 31, 2016 and 2015, was as follows:
Millions of yenThousands ofU.S. dollars
2016 2015 2016
ESOP trust ¥8,326 ¥— $73,891
Thousands of Shares
2016 2015
ESOP trust 623 —
Millions of yenThousands ofU.S. dollars
2016 2015 2016
Long-term debt ¥9,000 ¥— $79,872
The Company’s stock held by the above trusts also has the same rights as normal stock, e.g., voting and dividend
claim rights, because the stock does not meet the definition of treasury stock under the Companies Act. To
calculate the available amounts of dividends as stipulated under Clause 2 of Article 461 of the Companies Act, the
Company’s stock held by the trusts is not deducted because of the same reason.

20
11. STOCK OPTIONS
The Company
The stock options outstanding as of March 31, 2016, are as follows:
Stock Option Persons GrantedNumber of
Options Granted Date of Grant Exercise Price Exercise Period
2012 Stock Option (A) 10 directors 7,600 shares 2012.6.14 ¥ 1($0.01)
From June 15, 2012to June 14, 2042
2012 Stock Option (B) 10 directors 17,500 shares 2012.6.14 ¥ 1($0.01)
From June 15, 2015to June 14, 2020
2013 Stock Option (A) 11 directors 7,900 shares 2013.6.17 ¥ 1($0.01)
From June 18, 2013to June 17, 2043
2013 Stock Option (B) 11 directors 14,300 shares 2013.6.17 ¥ 1($0.01)
From June 18, 2016to June 17, 2021
2014 Stock Option (A) 6 directors 5,200 shares 2014.6.17 ¥ 1($0.01)
From June 18, 2014to June 17, 2044
2014 Stock Option (B) 6 directors 11,600 shares 2014.6.17 ¥ 1($0.01)
From June 18, 2017to June 17, 2022
2015 Stock Option (A) 7 directors 4,200 shares 2015.6.16 ¥ 1($0.01)
From June 17, 2015to June 16, 2045
2015 Stock Option (B) 7 directors 8,200 shares 2015.6.16 ¥ 1($0.01)
From June 17, 2018to June 16, 2023
The stock option activity for the years ended March 31, 2016 and 2015, is as follows:2012 StockOption (A)
2012 StockOption (B)
2013 StockOption (A)
2013 StockOption (B)
2014 StockOption (A)
2014 StockOption (B)
Year Ended March 31, 2016 (Shares)
Non-vestedMarch 31, 2015—Outstanding — 17,500 — 14,300 — 11,600
Granted — — — — — —Canceled — — — — — —Vested — — — — — —
March 31, 2016—Outstanding — 17,500 — 14,300 — 11,600
VestedMarch 31, 2015—Outstanding 2,300 — 3,200 — 4,600 —
Vested — 17,500 — — — —Exercised (1,000) (13,600) (900) — (800) —Canceled — — — — — —
March 31, 2016—Outstanding 1,300 3,900 2,300 — 3,800 —
Exercise price ¥ 1 ¥ 1 ¥ 1 ¥ 1 ¥ 1 ¥ 1($ 0.01) ($ 0.01) ($ 0.01) ($ 0.01) ($ 0.01) ($ 0.01)
Average stock price at exercise ¥13,481 ¥13,400 ¥13,481 ¥ — ¥13,481 ¥ —($119.64) ($118.92) ($119.63) ($ —) ($119.64) ($ —)
Fair value price at grant date ¥ 5,821 ¥5,474 ¥ 7,444 ¥7,304 ¥ 9,361 ¥9,741($ 51.66) ($ 48.58) ($ 66.06) ($64.82) ($ 83.08) ($86.45)

21
2015 StockOption (A)
2015 StockOption (B)
Year Ended March 31, 2016 (Shares)
Non-vestedMarch 31, 2015—Outstanding — —
Granted 4,200 8,200Canceled — —Vested (4,200) —
March 31, 2016—Outstanding — 8,200
VestedMarch 31, 2015—Outstanding — —
Vested 4,200 —Exercised (700) —Canceled — —
March 31, 2016—Outstanding 3,500 —
Exercise price ¥ 1 ¥ 1($ 0.01) ($ 0.01)
Average stock price at exercise ¥12,578 ¥ —($111.63) ($ —)
Fair value price at grant date ¥10,328 ¥10,667($ 91.66) ($ 94.67)
2012 StockOption (A)
2012 StockOption (B)
2013 StockOption (A)
2013 StockOption (B)
2014 StockOption (A)
2014 StockOption (B)
Year Ended March 31, 2015 (Shares)
Non-vestedMarch 31, 2014—Outstanding — 17,500 — 14,300 — —
Granted — — — — 5,200 11,600Canceled — — — — — —Vested — — — — (5,200) —
March 31, 2015—Outstanding — 17,500 — 14,300 — 11,600
VestedMarch 31, 2014—Outstanding 2,600 — 3,800 — — —
Vested — — — — 5,200 —Exercised (300) — (600) — (600) —Canceled — — — — — —
March 31, 2015—Outstanding 2,300 — 3,200 — 4,600 —
The Assumptions Used to Measure the Fair Value of the 2015 Stock Option (A)
Estimate method: Black-Scholes option pricing model
Volatility of stock price: 27.15%
Estimated remaining outstanding period: 6.64 years
Estimated dividend: ¥355 per share
Risk free interest rate: 0.217%
The Assumptions Used to Measure the Fair Value of the 2015 Stock Option (B)
Estimate method: Black-Scholes option pricing model
Volatility of stock price: 24.42%
Estimated remaining outstanding period: 5.50 years
Estimated dividend: ¥355 per share
Risk free interest rate: 0.143%

22
Consolidated subsidiary
The Housecom Corporation
The stock options outstanding as of March 31, 2016, are as follows:
Stock Option Persons GrantedNumber of
Options Granted Date of Grant Exercise Price Exercise Period
2014 Stock Option 1 director 15,500 shares 2014.5.30 ¥ 1($0.01)
From May 31, 2015to May 30, 2044
2015 Stock Option 2 directors 5,600 shares 2015.6.5 ¥ 1($0.01)
From June 6, 2015to June 5, 2045
The stock option activity for the years ended March 31 2016 and 2015, is as follows:2014 Stock
Option 2015 Stock
Option
Year Ended March 31, 2016 (Shares)
Non-vestedMarch 31, 2015—Outstanding — —
Granted — 5,600Canceled — —Vested — (5,600)
March 31, 2016—Outstanding — —
VestedMarch 31, 2015—Outstanding 15,500 —
Vested — 5,600Exercised — —Canceled — —
March 31, 2016—Outstanding 15,500 5,600
Exercise price ¥ 1 ¥ 1($0.01) ($ 0.01)
Average stock price at exercise ¥ — ¥ —($ —) ($ —)
Fair value price at grant date ¥ 540 ¥1,311($4.79) ($11.63)
2014 StockOption
Year Ended March 31, 2015 (Shares)
Non-vestedMarch 31, 2014—Outstanding —
Granted —Canceled —Vested —
March 31, 2015—Outstanding —
VestedMarch 31, 2014—Outstanding 15,500
Vested —Exercised —Canceled —
March 31, 2015—Outstanding 15,500

23
The Assumptions Used to Measure the Fair Value of the 2015 Stock Option
Estimate method: Black-Scholes option pricing model
Volatility of stock price: 29.35%
Estimated remaining outstanding period: 11.29 years
Estimated dividend: ¥37 per share
Risk free interest rate: 0.544%
12. INCOME TAXES
The Company and its domestic subsidiaries are subject to Japanese national and local income taxes which, in the
aggregate, resulted in normal effective statutory tax rates of approximately 33.1% and 35.6% for the years ended
March 31, 2016 and 2015, respectively.
The tax effects of significant temporary differences and tax loss carryforwards which resulted in deferred tax assets
and liabilities at March 31, 2016 and 2015, are as follows:
Millions of yenThousands ofU.S. dollars
2016 2015 2016
Deferred tax assets:Loss on devaluation of investment securities ¥ 312 ¥ 254 $ 2,769Allowance for doubtful accounts 1,002 1,007 8,892Unrealized profit of assets 4,373 4,169 38,809Accrued expenses 2,458 2,318 21,814Accrued enterprise taxes 1,626 1,743 14,430Accrued employees’ bonuses 6,644 6,798 58,963Provision for warranties for completed construction 351 358 3,115Retirement benefit for employees 3,260 3,050 28,931Provision for repair of whole-building lease system 24,743 21,141 219,586Deferred cleaning revenue 3,390 3,185 30,085Tax loss carryforwards 176 202 1,562Others 5,344 5,179 47,428Less valuation allowance (627) (1,119) (5,564)
Total 53,052 48,285 470,820
Deferred tax liabilities:Reserve for special depreciation 5,645 5,464 50,098Unrealized gain on available-for-sale securities 1,414 2,943 12,549Deferred gain (loss) on derivatives under accounting — 298 —Others 91 — 808
Total 7,150 8,705 63,455Net deferred tax assets ¥45,902 ¥39,580 $407,365
Deferred tax assets and liabilities were included in the consolidated balance sheets as of March 31, 2016 and 2015
as follows:
Millions of yenThousands ofU.S. dollars
2016 2015 2016
Current assets—Deferred tax assets ¥19,955 ¥19,235 $177,094Non-current assets—Deferred tax assets 26,031 20,345 231,017Current liabilities—Other (84) — (746)

24
A reconciliation between the normal effective statutory tax rates and the actual effective tax rates reflected in the
accompanying consolidated statement of income for the year ended March 31, 2016, with the corresponding
figures for 2015, is as follows:
2016 2015
Normal effective statutory tax rate 33.1% 35.6%Expenses not deductible for income tax purposes 1.3 1.4Inhabitant tax on per capita basis 0.5 0.1Valuation allowance (0.4) 0.6Decrease in deferred tax assets by change of tax rate 2.5 3.7Others—net (1.2) (0.4)Actual effective tax rate 35.8% 41.0%
New tax reform laws enacted in 2016 in Japan changed the normal effective statutory tax rate for the fiscal year
beginning on or after April 1, 2016, to approximately 30.9% and for the fiscal year beginning on or after April 1,
2018, to approximately 30.6%. The effect of these changes was to decrease deferred tax assets, net of deferred
tax liabilities, by ¥2,604 million ($23,110 thousand) and increase accumulated other comprehensive income for
unrealized gain on available-for-sale securities by ¥79 million ($701 thousand) and decrease accumulated other
comprehensive income for deferred gain (loss) on derivatives under hedge accounting by ¥20 million ($177 thou-
sand), and defined retirement benefit plan by ¥40 million ($355 thousand), in the consolidated balance sheet as of
March 31, 2016, and to increase income taxes-deferred in the consolidated statement of income for the year then
ended by ¥2,623 million ($23,278 thousand).
At March 31, 2016, certain subsidiaries have tax loss carryforwards aggregating to approximately ¥557 million
($4,943 thousand), which are available to be offset against taxable income of such subsidiaries in future years.
These tax loss carryforwards, if not utilized, will expire as follows:
Year Ending March 31 Millions of yenThousands ofU.S. dollars
2017 ¥ — $ —2018 — —2019 25 2222020 140 1,2422021 39 3462022 29 2572023 64 5682024 149 1,3222025 111 986Total ¥557 $4,943
13. CONSTRUCTION CONTRACTS
Revenue recognized with respect to construction contracts, which is accounted for by the percentage-of-completion
method at March 31, 2016 and 2015, is as follows:
Millions of yenThousands ofU.S. dollars
2016 2015 2016
Revenue ¥589,827 ¥582,596 $5,234,531

25
14. RESEARCH AND DEVELOPMENT COSTS
Research and development costs charged to income for the years ended March 31, 2016 and 2015, were as
follows:
Millions of yenThousands ofU.S. dollars
2016 2015 2016
Research and development costs ¥1,387 ¥1,448 $12,309
15. OTHER INCOME—NET
Other income—net for the years ended March 31, 2016 and 2015, consisted of the following:
Millions of yenThousands ofU.S. dollars
2016 2015 2016
Commission fee ¥3,656 ¥3,653 $32,446Other 399 308 3,540Other income—net ¥4,055 ¥3,961 $35,986
16. LEASES
Lessee
The minimum rental commitments under noncancelable operating leases at March 31, 2016 and 2015, were as
follows:
Millions of yenThousands ofU.S. dollars
2016 2015 2016
Due within one year ¥ 394,575 ¥ 357,314 $ 3,501,731Due after one year 1,632,365 1,576,542 14,486,732Total ¥2,026,940 ¥1,933,856 $17,988,463
Lease payments fixed by contract with regard to the whole-building lease system are included in the above-men-
tioned minimum rental commitments at March 31, 2016 and 2015, as follows:
Millions of yenThousands ofU.S. dollars
2016 2015 2016
Due within one year ¥ 388,796 ¥ 351,018 $ 3,450,444Due after one year 1,610,274 1,553,388 14,290,682Total ¥1,999,070 ¥1,904,406 $17,741,126
Lessor
The minimum rental commitments under noncancelable operating leases at March 31, 2016 and 2015, were as
follows:
Millions of yenThousands ofU.S. dollars
2016 2015 2016
Due within one year ¥ 621 ¥ 621 $ 5,511Due after one year 3,727 4,349 33,076Total ¥4,348 ¥4,970 $38,587

26
17. FINANCIAL INSTRUMENTS AND RELATED DISCLOSURES
(1) Group Policy for Financial Instruments
The Group uses financial instruments, mainly loans from banks, based on its capital financing plan for construction
business. As a matter of policy, the Group only uses derivatives for actual operating requirements, not for specula-
tive purposes.
(2) Nature and Extent of Risks Arising from Financial Instruments and the Risk Management for Financial
Instruments
Money held in trust has been set up to separately manage tenancy deposits. The Group manages such trust
assets as short-term deposits and highly secured securities. These are exposed to variable risks, including issuers’
credit, interest rate, and market. However, the Group periodically monitors the financial condition of issuers and the
market value of debt securities.
Receivables such as trade notes and accounts receivable are exposed to customer credit risk. The Group
decreases the risk by starting construction after customer financing is fixed.
Marketable and investment securities, mainly held-to-maturity securities and equity instruments, are exposed to
variable risks, including issuers’ credit, interest rate, and market. The Group periodically monitors the financial
condition of the issuers for marketable investment securities. An ongoing review of securities held, other than
held-to-maturity securities, is performed by taking into consideration the market as well as the relationship with the
trading counterparties.
Operating loans, mainly loans for customers’ construction finance (i.e., bridge loans until financial institutions
execute a long-term loan) are exposed to customer credit risk. The Group thoroughly enforces credit risk manage-
ment, which includes periodic monitoring of the financial condition of customers to mitigate the risk of uncollectible
loans.
Subordinated bonds and subordinated trust beneficiary rights are financial instruments issued by an SPE estab-
lished by a financial institution. The financial institution securitized the apartment loans of customers who order the
Company to construct an apartment building for rent using the SPE. Subordinated bonds and subordinated trust
beneficiary rights are exposed to credit risk of the debtor of the apartment loan. The Group manages the credit risk
by monitoring repayments of the loan.
Payment terms of payables, such as accounts payable, income taxes payable, and deposits received, are generally
less than one year.
Loans from banks are exposed to market risk from changes in interest rates. The Group performs continuous
monitoring of market fluctuations.
Long-term deposits received for guarantee are received from tenants in the real estate rental business by the
whole-building lease system.
Derivatives are forward foreign currency contracts, which are used to manage exposure to market risks from
changes in foreign currency exchange rate payables.

27
(3) Fair Values of Financial Instruments
Fair values of financial instruments are based on quoted prices in active markets. If a quoted price is not available,
another rational valuation technique is used instead.
(a) Fair value of financial instrumentsMillions of yen
March 31, 2016Carrying Amount Fair Value
Unrealized Gain/Loss
Cash and cash equivalents ¥233,631 ¥233,631 ¥ —Money held in trust 26,506 26,506 —Notes and accounts receivable 38,627Allowance for doubtful accounts (30)
38,597 38,597 —Marketable and investment securities:
Held-to-maturity securities 130 134 4Available-for-sale securities 35,163 35,163 —
Operating loans 60,490Allowance for doubtful accounts (122)
60,368 61,158 790Total ¥394,395 ¥395,189 ¥794
Accounts payable ¥ 37,510 ¥ 37,510 ¥ —Income taxes payable 25,672 25,672 —Deposit received 7,632 7,632 —Current portion of long-term bank loans and long-term bank loans 71,634 71,634 —Deposits received for guarantee 45,184 45,091 (93)Total ¥187,632 ¥187,539 ¥ (93)
Millions of yen
March 31, 2015CarryingAmount Fair Value
UnrealizedGain/Loss
Cash and cash equivalents ¥255,552 ¥255,552 ¥ —Money held in trust 32,505 32,505 —Notes and accounts receivable 36,644Allowance for doubtful accounts (43)
36,601 36,601 —Marketable and investment securities:
Held-to-maturity securities 230 236 6Available-for-sale securities 33,941 33,941 —
Operating loans 54,672Allowance for doubtful accounts (145)
54,527 54,756 229Total ¥413,356 ¥413,591 ¥ 235
Accounts payable ¥ 42,242 ¥ 42,242 ¥ —Income taxes payable 23,217 23,217 —Deposit received 6,880 6,880 —Current portion of long-term bank loans and long-term bank loans 79,970 79,970 —Deposits received for guarantee 51,309 51,057 (252)Total ¥203,618 ¥203,366 ¥(252)

28
Thousands of U.S. dollars
March 31, 2016CarryingAmount Fair Value
UnrealizedGain/Loss
Cash and cash equivalents $2,073,403 $2,073,403 $ —Money held in trust 235,233 235,233 —Notes and accounts receivable 342,803Allowance for doubtful accounts (267)
342,536 342,536 —Marketable and investment securities:
Held-to-maturity securities 1,154 1,189 35Available-for-sale securities 312,060 312,060 —
Operating loans 536,830Allowance for doubtful accounts (1,083)
535,747 542,758 7,011Total $3,500,133 $3,507,179 $7,046
Accounts payable $ 332,890 $ 332,890 $ —Income taxes payable 227,831 227,831 —Deposit received 67,732 67,732 —Current portion of long-term bank loans and long-term bank loans 635,729 635,729 —Deposits received for guarantee 400,994 400,169 (825)Total $1,665,176 $1,664,351 $ (825)
Cash and Cash Equivalents, Notes and Accounts Receivable
The carrying amount of the accounts mentioned above approximate fair value because of their short maturities.
Money Held in Trust
The fair value of money held in trust is measured based on financial instruments comprising the money held in
trust. At the end of the fiscal year ended March 31, 2015, the financial instruments comprised of money held in
trust were all deposits and since the carrying amount of such account approximates fair value, the carrying amount
is treated as its fair value.
Marketable and Investment Securities
The fair values of marketable and investment securities are measured at the quoted market price of the stock
exchange for the equity instruments, and at the quoted price obtained from the financial institution for certain debt
instruments. Fair value information for marketable and investment securities by classification is included in Note 3.
Operating Loans
The fair value of operating loans with floating-rates approximates carrying amount because the rate reflects market
interest rates within a short period of time except for significant changes in credit conditions of debtors.
Loans with fixed rates consist of short-term bridge loans and long-term loans. The fair value of operating loans
approximates carrying amount because the rate reflects market interest rates. The fair value of long-term loans is
determined based on the present value calculated by using discount rates corresponding to the remaining period
of the loan and credit risk.
Accounts Payable, Income Taxes Payable, and Deposits Received
The carrying amount of the accounts mentioned above approximate fair value because of their short maturities.

29
Current Portion of Long-Term Bank Loan and Long-Term Bank Loan
For the current portion of long-term bank loans and for long-term bank loans that have floating interest rates, the
fair values approximate the carrying amount because the rates reflect market interest rates within a short period of
time.
Deposits Received for Guarantee
The fair value of deposits received for guarantee is determined based on the present value calculated by using
discount rates corresponding to credit risk and the remaining period of deposits received for guarantee.
(b) Carrying amount of financial instruments whose fair value cannot be reliably determined
Millions of yenThousands ofU.S. dollars
2016 2015 2016
Subordinated bonds and subordinated trust beneficiary right ¥12,857 ¥12,865 $114,102Capital investments in LLC ¥ 5,258 ¥ — $ 46,663Stocks of associated companies ¥14,546 ¥ — $129 091
(4) Maturity Analysis for Financial Assets and Securities with Contractual Maturities
Millions of yen
March 31, 2016
Due in 1 Year or
Less
Due after 1 Year through 2 Years
Due after 2 Years through 3 Years
Due after 3 Years through 4 Years
Due after 4 Years through 5 Years
Due after 5 Years
Cash and cash equivalents ¥233,631 ¥ — ¥ — ¥ — ¥ — ¥ —Money held in trust 26,506Notes and accounts receivable 38,627 — — — — —Investment securities:
Held-to-maturity securities 40 45 5 10 30 —Available-for-sales securities with contractual maturities 9,570 7,860 — — — —
Operating loans 28,698 3,859 3,369 2,875 2,521 19,164Subordinated bonds and subordinated trust beneficiary right — — — — — 13,091Total ¥337,072 ¥11,764 ¥3,374 ¥2,885 ¥2,551 ¥32,255
Thousands of U.S. dollars
March 31, 2016
Due in 1 Year or
Less
Due after 1 Year through 2 Years
Due after 2 Years through 3 Years
Due after 3 Years through 4 Years
Due after 4 Years through 5 Years
Due after 5 Years
Cash and cash equivalents $2,073,403 $ — $ — $ — $ — $ —Money held in trust 235,233Notes and accounts receivable 342,803 — — — — —Investment securities:
Held-to-maturity securities 355 400 44 89 266 —Available-for-sales securities with contractual maturities 84,930 69,755 — — — —
Operating loans 254,685 34,247 29,899 25,514 22,373 170,075Subordinated bonds and subordinated trust beneficiary right — — — — — 116,178Total $2,991,409 $104,402 $29,943 $25,603 $22,639 $286,253
Please see Note 8 for annual maturities of long-term bank loans.

30
18. DERIVATIVES
Derivative transactions to which hedge accounting is appliedMillions of yen
March 31, 2016 Hedged Item Contract AmountContract Amount due
after One Year Fair Value
Foreign currency forward contract:Buying U.S.$ Forecasted
transactions ¥ 19,948 ¥15,003 ¥(1,365)March 31, 2015
Foreign currency forward contract:Buying U.S.$ Forecasted
transactions ¥17,231 ¥3,110 ¥ 901
Thousands of U.S. dollars
March 31, 2016 Hedged Item Contract AmountContract Amount due
after One Year Fair Value
Foreign currency forward contract:Buying U.S.$ Forecasted
transactions $177,032 $133,147 $(12,114)
The fair value of derivative transactions is measured at the quoted price obtained from the financial institution.

31
19. OTHER COMPREHENSIVE INCOME
The components of other comprehensive income for the years ended March 31, 2016 and 2015, were as follows:
Millions of yenThousands ofU.S. dollars
2016 2015 2016
Unrealized gain on available-for-sale securities:Gains arising during the year ¥(4,331) ¥ 1,814 $(38,436)Reclassification adjustments to profit or loss (152) — (1,349)Amount before income tax effect (4,483) 1,814 (39,785)Income tax effect 1,529 (346) 13,569Total ¥(2,954) ¥ 1,468 $(26,216)
Deferred gain (loss) on derivatives under hedge accounting:Gains (losses) arising during the year ¥(2,266) ¥ 824 $(20,110)Reclassification adjustments to profit or loss — — —Amount before income tax effect (2,266) 824 (20,110)Income tax effect 719 (271) 6,381Total ¥(1,547) ¥ 553 $(13,729)
Land revaluation surplus:Reclassification adjustments to profit or loss ¥ — ¥ — $ —Amount before income tax effect — — —Income tax effect — (2,703) —Total ¥ — ¥(2,703) $ —
Foreign currency translation adjustments:Adjustments arising during the year ¥(1,508) ¥ 3,244 $(13,383)Reclassification adjustments to profit or loss — — —Amount before income tax effect (1,508) 3,244 (13,383)Income tax effect — — —Total ¥(1,508) ¥ 3,244 $(13,383)
Remeasurements of defined benefit plans:Adjustments arising during the year ¥(2,330) ¥ (362) $(20,678)Reclassification adjustments to profit or loss 913 342 8,103Amount before income tax effect (1,417) (20) (12,575)Income tax effect 419 (22) 3,718Total ¥ (998) ¥ (42) $ (8,857)
Total other comprehensive income ¥(7,007) ¥ 2,520 $(62,185)

32
20. NET INCOME PER SHARE
Reconciliation of the differences between basic and diluted net income per share (“EPS”) for the years ended
March 31, 2016 and 2015, is as follows:
Millions of yenThousands of Shares Yen U.S. dollars
Year Ended March 31, 2016
Net IncomeAttributable to
Owners of the Parent
Weighted-Average Shares EPS
Basic EPS—Net income available to common shareholders ¥67,280 77,950 ¥863.11 $7.66Effect of dilutive securities—Warrants 52Diluted EPS—Net income for computation ¥67,280 78,002 ¥862.52 $7.65
Millions of yenThousands of Shares Yen U.S. dollars
Year Ended March 31, 2015
Net IncomeAttributable to
Owners of the Parent
Weighted-Average Shares EPS
Basic EPS—Net income available to common shareholders ¥56,109 79,006 ¥710.19 $6.30Effect of dilutive securities—Warrants 50Diluted EPS—Net income for computation ¥56,109 79,056 ¥709.73 $6.30
21. SUBSEQUENT EVENTS
(1) Purchase of Treasury Stock
At the board meeting held on April 28, 2016, a plan was approved to repurchase up to 1,300,000 shares of the
Company’s common stock (aggregated amount up to a ceiling of ¥20,200 million ($179,269 thousand)) during May
2, 2016 through March 30, 2017 on the Tokyo Stock Exchange and retire the shares.
(2) Appropriations of Retained Earnings
The following appropriation of retained earnings at March 31, 2016, was approved at the Company’s shareholders’
meeting held on June 28, 2016:
Millions of yenThousands ofU.S. dollars
Year-end cash dividends, ¥233 ($2.07) per share ¥18,113 $160,747

33
22. SEGMENT INFORMATION
Under the Accounting Standard for Segment Information Disclosures, an entity is required to report financial
and descriptive information about its reportable segments. Reportable segments are operating segments or
aggregations of operating segments that meet specified criteria. Operating segments are components of an entity
about which separate financial information is available and such information is evaluated regularly by the chief
operating decision maker in deciding how to allocate resources and in assessing performance. Generally, segment
information is required to be reported on the same basis as is used internally for evaluating operating segment
performance and deciding how to allocate resources to operating segments.
(1) Description of Reportable Segments
The Group’s reportable segments are those for which separate financial information is available and regular evalua-
tion by the Company’s management is being performed in order to decide how resources are allocated among the
Group.
The Company is engaged in the construction of apartments with the proposal of effective utilization of land by
customers. Daito Building Management Co., Ltd., a consolidated subsidiary, enters into whole-building leases as a
“Lease management trust system” whereby its subsidiary rents all apartments and subleases them to tenants. The
Company plans strategies mainly for the business and develops business activities.
Therefore, the Group consists of three reportable segments as follows:
Construction: civil engineering, construction, and other related business
Real estate: whole-building lease, rent, agency, guarantee of tenant and management business
Finance: construction finance business for owner until financial institution executes long-term loan
(2) Methods of Measurement for the Amounts of Sales, Profit (Loss), Assets and Other Items for Each
Reportable Segment
The accounting policies of each reportable segment are consistent with those disclosed in Note 2, “Summary of
Significant Accounting Policies.”

34
(3) Information about Sales, Profit (Loss), Assets and Other Items
Millions of yen
2016Reportable Segment
Construction Real Estate Finance Total Other Total Reconciliations Consolidated
Sales:Sales to external customers ¥595,365 ¥774,808 ¥ 5,579 ¥1,375,752 ¥35,892 ¥1,411,644 ¥ — ¥1,411,644Intersegment sales or transfers 27 1,239 179 1,445 5,852 7,297 (7,297) —
Total ¥595,392 ¥776,047 ¥ 5,758 ¥1,377,197 ¥41,744 ¥1,418,941 ¥ (7,297) ¥1,411,644
Segment profit (loss) ¥ 90,248 ¥ 22,528 ¥ 2,148 ¥ 114,924 ¥ 6,832 ¥ 121,756 ¥ (20,755) ¥ 101,001Segment assets 105,611 266,560 65,233 437,404 54,699 492,103 236,446 728,549Other:
Depreciation 2,425 2,958 44 5,427 596 6,023 3 6,026Impairment losses of assets — 92 — 92 — 92 — 92
Increase in property, plant and equipment and intangible assets 6,972 17,208 241 24,421 1,988 26,409 6 26,415
Millions of yen
2015Reportable Segment
Construction Real Estate Finance Total Other Total Reconciliations Consolidated
Sales:Sales to external customers ¥589,171 ¥723,817 ¥ 4,755 ¥1,317,743 ¥35,413 ¥1,353,156 ¥ — ¥1,353,156Intersegment sales or transfers 1,484 1,069 13 2,566 6,360 8,926 (8,926) —
Total ¥590,655 ¥724,886 ¥ 4,768 ¥1,320,309 ¥41,773 ¥1,362,082 ¥ (8,926) ¥1,353,156Segment profit (loss) ¥ 85,305 ¥ 15,552 ¥ 1,957 ¥ 102,814 ¥ 6,389 ¥ 109,203 ¥ (17,683) ¥ 91,520Segment assets 103,611 253,903 59,080 416,594 40,683 457,277 243,843 701,120Other:
Depreciation 1,053 3,244 12 4,309 540 4,849 2 4,851Impairment losses of assets — 145 - 145 - 145 — 145
Increase in property, plant and equipment and intangible assets 3,160 13,815 128 17,103 734 17,837 9 17,846

35
Thousands of U.S. dollars
2016Reportable Segment
Construction Real Estate Finance Total Other Total Reconciliations Consolidated
Sales:Sales to external customers $5,283,679 $6,876,180 $ 49,513 $12,209,372 $318,530 $12,527,902 $ — $12,527,902Intersegment sales or transfers 240 10,996 1,588 12,824 51,935 64,759 (64,759) —
Total $5,283,919 $6,687,176 $ 51,101 $12,222,196 $370,465 $12,592,661 $ (64,759) $12,527,902Segment profit (loss) $ 800,923 $ 199,929 $ 19,063 $ 1,019,915 $ 60,632 $ 1,080,547 $ (184,194) $ 896,353Segment assets 937,265 2,365,637 578,923 3,881,825 485,436 4,367,261 2,098,385 6,465,646Other:
Depreciation 21,521 26,251 391 48,163 5,289 53,452 27 53,479Impairment losses of assets — 816 — 816 — 816 — 816
Increase in property, plant and equipment and intangible assets 61,874 152,716 2,139 216,729 17,643 234,372 53 234,425
Notes for the year ended March 31, 2016(1) The reconciliations in segment profit include elimination of intersegment trades of ¥338 million ($3,000 thousand) and corpo-
rate expenses not allocated to a reportable segment of ¥21,093 million ($187,194 thousand). Corporate expenses are mainly the Company’s general administration expenses.
(2) The reconciliations in segment assets include elimination of intersegment trades of ¥1,427 million ($12,664 thousand) and cor-porate assets not allocated to a reportable segment of ¥237,872 million ($2,111,040 thousand). Corporate assets are mainly short-term investments and investment securities held by the Company and other assets of administrative departments.
(3) Consolidated segment profit is equal to operating income in the consolidated statement of income.
Notes for the year ended March 31, 2015(4) The reconciliations in segment profit include elimination of intersegment trades of ¥402 million and corporate expenses not
allocated to a reportable segment of ¥18,085 million. Corporate expenses are mainly the Company’s general administration expenses.
(5) The reconciliations in segment assets include elimination of intersegment trades of ¥1,281 million and corporate assets not allocated to a reportable segment of ¥245,124 million. Corporate assets are mainly short-term investments and investment securities held by the Company and other assets of administrative departments.
(6) Consolidated segment profit is equal to operating income in the consolidated statement of income.

