daleel: simplifying cloud instance selection using … · daleel: simplifying cloud instance...
TRANSCRIPT

Daleel: Simplifying Cloud Instance Selection
Using Machine Learning
Faiza Samreen, Yehia Elkhatib, Matthew Rowe, Gordon S. BlairSchool of Computing & Communications, Lancaster University, UK
Email: {i.lastname}@lancaster.ac.ukThis is a pre-print.
The final version is available on IEEEXplore(ISBN 978-1-5090-0223-8)
February 9, 2016
Abstract
Decision making in cloud environments is quite challenging due to thediversity in service offerings and pricing models, especially consideringthat the cloud market is an incredibly fast moving one. In addition, thereare no hard and fast rules; each customer has a specific set of constraints(e.g. budget) and application requirements (e.g. minimum computationalresources). Machine learning can help address some of the complicated de-cisions by carrying out customer-specific analytics to determine the mostsuitable instance type(s) and the most opportune time for starting or mi-grating instances. We employ machine learning techniques to develop anadaptive deployment policy, providing an optimal match between the cus-tomer demands and the available cloud service offerings. We provide anexperimental study based on extensive set of job executions over a majorpublic cloud infrastructure.
Keywords: Cloud computing, Machine learning
1 Introduction
Users of Infrastructure-as-a-Service (IaaS) provisions are faced with a compositedecision:
• Which provider should she choose?
• What instance type(s) would provide her with the cost:performance ratiothat suits her needs?
• Does the time or day at which she requests these resources affect how herapplication runs?
1
arX
iv:1
602.
0215
9v1
[cs
.DC
] 5
Feb
201
6
Amazon EC2
Joyent Compute
RackSpace
Microsoft Azure
Google Compute Engine
HP Cloud Compute
DigitalOcean
0 10 20 30
Number of Instance Types
IaaS
Pro
vide
r
Instance_TypeGeneral PurposeMemory IntensiveCPU IntensiveI/O OptimisedOther Types
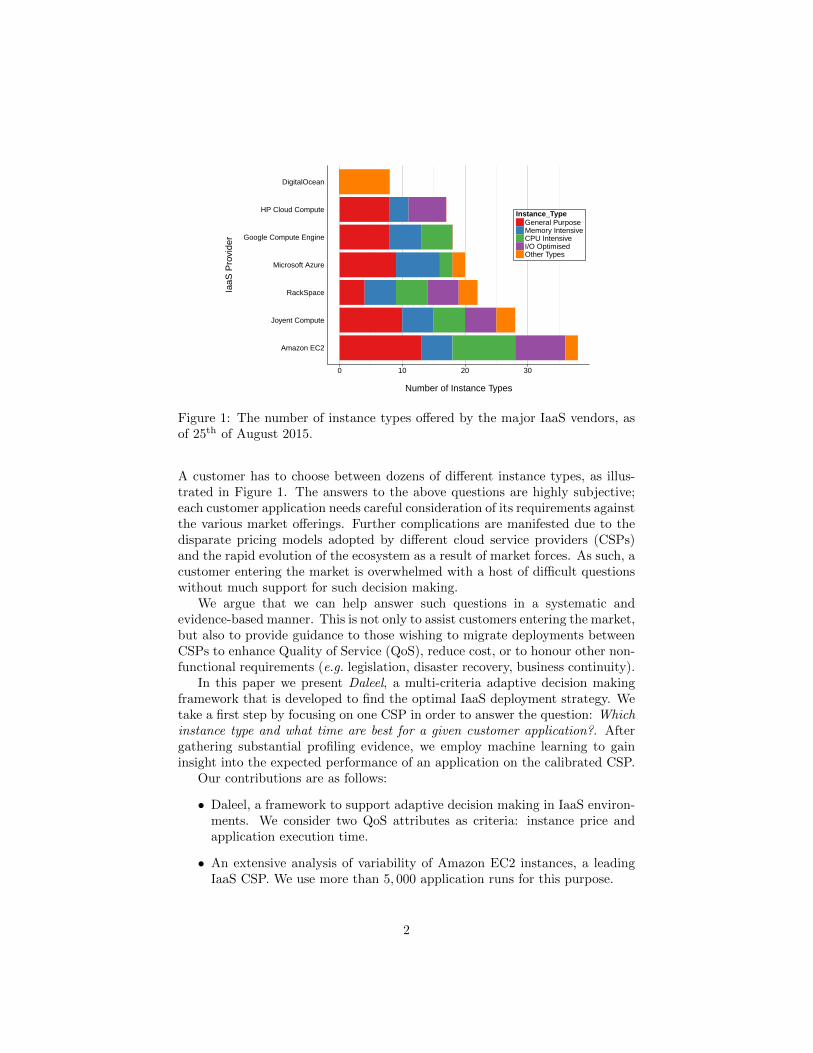
Figure 1: The number of instance types offered by the major IaaS vendors, asof 25th of August 2015.
A customer has to choose between dozens of different instance types, as illus-trated in Figure 1. The answers to the above questions are highly subjective;each customer application needs careful consideration of its requirements againstthe various market offerings. Further complications are manifested due to thedisparate pricing models adopted by different cloud service providers (CSPs)and the rapid evolution of the ecosystem as a result of market forces. As such, acustomer entering the market is overwhelmed with a host of difficult questionswithout much support for such decision making.
We argue that we can help answer such questions in a systematic andevidence-based manner. This is not only to assist customers entering the market,but also to provide guidance to those wishing to migrate deployments betweenCSPs to enhance Quality of Service (QoS), reduce cost, or to honour other non-functional requirements (e.g. legislation, disaster recovery, business continuity).
In this paper we present Daleel, a multi-criteria adaptive decision makingframework that is developed to find the optimal IaaS deployment strategy. Wetake a first step by focusing on one CSP in order to answer the question: Whichinstance type and what time are best for a given customer application?. Aftergathering substantial profiling evidence, we employ machine learning to gaininsight into the expected performance of an application on the calibrated CSP.
Our contributions are as follows:
• Daleel, a framework to support adaptive decision making in IaaS environ-ments. We consider two QoS attributes as criteria: instance price andapplication execution time.
• An extensive analysis of variability of Amazon EC2 instances, a leadingIaaS CSP. We use more than 5, 000 application runs for this purpose.
2
• Using multivariate polynomial regression (i.e. with multiple predictors)to evaluate Daleel’s ability to predict application execution time on EC2configurations.
2 Related Work
2.1 Application Management Frameworks
A number of cloud brokering frameworks have been developed by industryand open source communities to intermediate between cloud customers andproviders [2]. These carry out some tasks on behalf of the customer such asarbitrage, aggregation and integration. We classify such solutions as eitherhosted or deployable. Hosted services are externally managed by third-partystakeholders and do not provide information about how the application is be-ing provisioned. Examples include RightScale Cloud Portfolio Management,enStratus, xStream, and CliQr. In contrast, deployable services rely on opensource software that could be operated either internally by a corporation orexternally as a grey-box service. Apache Brooklyn, Scalr, Standing Cloud, andAelous are a few examples.
The solutions mentioned thus far tackle interoperability to reduce applica-tion deployment friction, but do not support adaptive decision making. Thisfeature is still largely lacking from cloud brokerage solutions [26], althoughsome efforts have started to surface, e.g. STRATOS [23], MODACloud [10],Cloud4SOA [15], mOSAIC [24], ARTIST [20], Broker@Cloud [22], and [6]. Weconjecture that there is still a long way to go in terms of providing dynamic de-cision making that can effectively optimise deployment to the specific functionaland non-functional requirements on a per-application basis. Specifically, whichresource type is most cost effective while considering the good performance formy application? This is the potential domain for machine learning that cancontribute for enhancement of multi-cloud management by taking appropriatedecisions to cater the application and application owner requirement.
2.2 Machine Learning
Machine learning can contribute immensely by taking appropriate decisions tocater to specific application requirements. Machine Learning has proved itspotential for producing prediction and optimisation solutions in various fields.It has been applied in cloud computing towards resource scaling [16], forecast-ing [5], and dynamic resource provisioning [13, 1, 9]. We aim to apply a similarmethodology but for the benefit of customers selecting between IaaS resources.
3 Daleel
Daleel (meaning ‘guide’ in Urdu) is a multi-criteria adaptive decision makingframework. It equips a cloud customer with evidence-based knowledge of the
3

IaaS setup specification that is optimal for their particular application.
3.1 Architecture
Knowledge Base
Actuator
CloudInfrastructure
Met
rics C
SP
Po
rtfo
lio
Application Performance
Dec
isio
n
Sup
po
rt
Ap
plic
atio
n
Vig
net
te
Cu
sto
mer
C
on
stra
ints
Learning
Analysis Planning
Customer
Trigger
DALEEL
Figure 2: The Daleel Architecture.
Daleel’s architecture (depicted in Fig. 2) consists of three main modules: De-cision Support, Actuator, and Knowledge Base. At the heart of the architectureis the Decision Support module which relies on a three phase process thatcontinuously operates throughout the application life cycle to predict applica-tion performance. These phases are: Analysis, Learning, and Planning. Theycarry out different but complimentary operations to acquire deep knowledge ofthe available cloud deployment options and how suitable they are to a given ap-plication. The Actuator triggers the Decision Support module into operationbased on application performance. The Knowledge Base holds data collectedby the Decision Support module as well as CSP portfolios. The latter containsdata obtained through APIs and web scraping on CSP resource provisioninglevels, resource metadata, and pricing models.
The customer provides an application vignette which is a high level descrip-tion of the application computational requirements in the form of a short set ofkey-value pairs. The customer also indicates their constraints such as minimumQoS, availability, location, and budget.
4

We now describe how the three Decision Support phases and the Actuatormodule work.
3.2 Analysis Phase
The first stage comprises of a profiling procedure that is based on time seriesanalysis. Application profiling is an effective way of tracking application be-haviour under different deployment setups. This can be carried out live onshared cloud infrastructures (whether public or private), or offline in a com-pletely controlled and isolated virtual environment. The obtained traces recorddifferent metrics such as CPU and memory utilisation, paging and caching in-formation, etc. Together these constitute the application profile that can beused to predict deployment options that can suit the application and customerrequirements.
Aggregating different application profiles builds up the Knowledge Base withinformation about application descriptions and their behaviour on different de-ployment setups. This is used to infer performance of a not-yet-profiled appli-cation based on its vignette (i.e. general description).
3.3 Learning Phase
This second phase comprises of a learning procedure that receives the follow-ing information from the Analysis phase: performance traces, cloud resourcesportfolio, and the application vignette. A critical task is to derive a predictionmodel for the cloud provider in question, which shows the QoS variations andoffered services in order to help the following phase (i.e. Planning) in achievingoptimal deployment that caters to the customer constraints.
The Learning phase aims to learn the prediction model to accurately predictthe cost of application execution in terms of performance and virtual machine(VM) price. It also aims to achieve a better understanding of the correlationbetween the predictors and the response in order to infer some relationship forfuture prediction. These are quite difficult aims for which different machinelearning techniques are explored as no one technique is considered to be thebest for all data sets. We employed different regression methods as a predictionfunction. The response variable in our case study is application execution timethat involves a continuous quantitative output value. This is often referred toas a regression problem.
3.4 Planning Phase
The third phase takes input from the Learning phase in the form of a predictionmodel which can generate a vector output based on the input requirements ofthe customer. The Planning logic is designed to support a multi-criteria deci-sion making problem where a set of vectors describing the performance is theLearning outcome. For the purposes of this study, we are targeting two QoS
5

attributes as our criteria, namely VM price and application execution time. Var-ious methods are being used by multi-criteria decision making such as weightedsum [18], weighted product [19], VIKOR [17], and PROMETHEE [4] (see [26]for more details). We intend for our decision making support to include suchmulti-criteria techniques while considering more than two QoS attributes (i.e.more than one customer-dictated objective).
3.5 The Actuator
The Actuator triggers the Decision Support module into operation at differenttimes. This could be based on thresholds set according to the customer con-straints on application QoS, application load, or Knowledge Base information(e.g. change in a provider’s portfolio). Such triggers will launch new Analysisand Learning cycles, or will activate the Planning logic to begin migration toa new cloud infrastructure. Migration between different cloud infrastructuresis a big challenge in its own right and is outside the boundaries of this work.However, the Planning logic could easily be extended to incorporate migrationmethods, e.g. [11].
4 Analysis of Variability in IaaS Offerings
Selecting specifications of a cloud-based infrastructure is not an easy or straight-forward task, especially due to the fact that there is considerable amount ofperformance variability at any service provisioning tier. Our initial step is togather enough information to analyse such variability. We achieve this throughextensive experiments over the Amazon Elastic Cloud Compute (EC2) IaaSofferings. In this section we explain the experimental setup, profiling procedure,and performance variability analysis. §5 will detail model development andlearning evaluation based on the profiled data.
4.1 Methodology
The overall objective of conducting this evaluation is to find the performancevariations on different node configurations at different times of the day. Thisexperiment is conducted on EC2, the leading IaaS provider with a 57% marketshare [25]. We run over different instance types and throughout the seven daysof the week to investigate temporal variations.
4.1.1 Infrastructure
All instances used were 64-bit Ubuntu Linux of different capacities as detailedin Table 1. Note that ‘vCPU’ indicates the number of virtual cores assignedto a VM. An ‘ECU’ refers to an EC2 Compute Unit ; Amazon does not adviseabout how an ECU relates to physical processing speed; it only assures that it
6

is a standard unit across its IaaS offerings1. ‘Price’ refers to the hourly chargefor running a VM of the referenced instance type.
Table 1: The computational specification of EC2 instances.
Series Node vCPU ECU RAM Storage Price
(GB) (GB) ($/h)
T2 (General t2.small 1 Var. 2 20 0.026
Purpose) t2.medium 2 Var. 4 20 0.052
M3 (General m3.medium 1 3 3.75 4(S) 0.070
Purpose) m3.large 2 6.5 7.5 32(S) 0.140
C4 (Compute c4.large 2 8 3.75 20 0.116
Optimised) c4.xlarge 4 16 7.5 20 0.232
Amazon provides differentiated series of instance types, catering to vari-ous application needs (e.g. compute-intensive, memory intensive, I/O-intensive,etc.). Each series contains a number of instance types with different setups ofcomputational resources. We targeted the General Purpose series T2 and M3as well as the Compute Optimised series C4 in order to evaluate varying combi-nations of resource capacity over a relatively wide price range. Only on-demandinstances were used for this experiment. These have no long term commitmentand are charged on a pay-as-you-go basis at an hourly rate. All instances werechosen to be located in the eu-west-1 availability zone, hosted in Ireland.
We are not aware of how EC2 virtual cores are pinned to physical cores.Amazon EC2 uses the Xen hypervisor to host the VM instances but do not pro-vide the details of scheduling algorithms used by the hypervisor. From runningour experiments, we could not find any firm details for parallel workload and soare not aware of the interference effects. This, however, is not our focus.
4.1.2 Application & Execution
Our use case application was VARD [3], a tool designed to detect and tag spellingvariations in historical texts, particularly in Early Modern English. The outputis aimed to improve the accuracy of other corpus analysis solutions. VARD is asingle threaded application that is highly memory intensive. It holds in memorya representation of the full text, as well as various dictionaries that are used fornormalising spelling variations. Experiments were continuously repeated usinga fixed set of input texts over a period of seven days with a delay of ten minutesbetween each pair of runs. The Linux tools vmstat, glances and sysstat wereused to continuously monitor resource utilisation.
7

c4.large
c4.xlarge
m3.large
m3.medium
t2.medium
t2.small
50 100 150 200 250 300
Execution Time (seconds)
Inst
ance
Typ
e
Figure 3: Application execution time over different cloud instance types.
4.2 Variation Due to Instance Type
We investigate the performance of running VARD on VMs of different instancetypes. The results are summarised in Fig. 3 where every dot represents theexecution time of one run. Shorter execution times reflect a lower hourly rateover a full workload. There are several striking observations.
First, contrary to intuition, m3.medium (a memory-rich instance) is of con-sistently poor performance. We also observe that c4.large surpasses both m3.mediumand m3.large in performance. In fact it is on par with c4.xlarge, which is twiceboth in specification and cost.
Overall, the T2 series offers by far the best value for money. A possibleexplanation is the CPU Credits scheme, offered only on the T2 series, whichenables customers to collect credits for idle instances and later spend them whenfull CPU utilisation is needed. T2 instances are thus good for applications thatdo not consistently fully use the CPU, accumulating CPU credits at a steadyrate. but it also means that there is a degree of uncertainty associated with anapplication’s performance that depends on its idle time.
4.3 Variation Due to Time
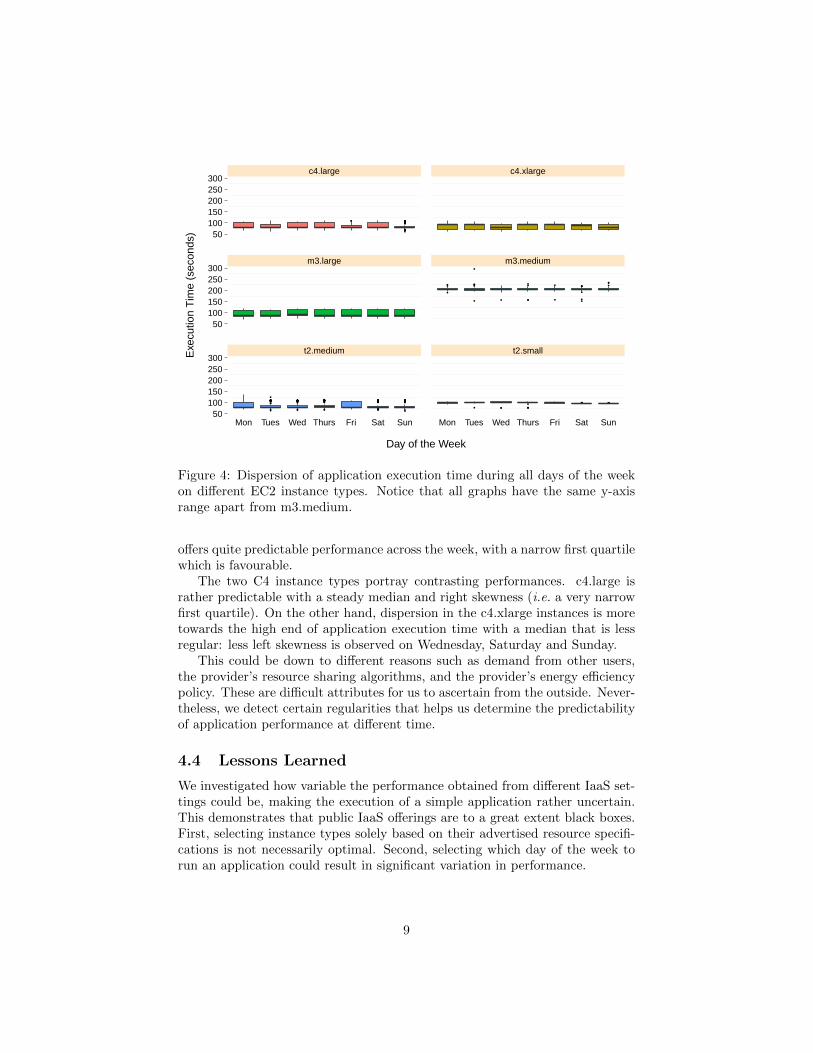
We now turn our attention to uncertainty in application performance due to thetime at which they are executed. This is depicted by the box-plots in Fig. 4.
The T2 series offers the least RAM but exhibits the least variance in perfor-mance between the different days of the week. m3.medium VMs display appli-cation execution times that are fairly high albeit predictable: the median andquartiles show very little variation across the days of the week. m3.large also
1http://aws.amazon.com/ec2/faqs/
8
●● ●
●
●
●
●●●●●●●●●●
●
●
●●
●
●●
●
●
●
●
●●
●
●●
●
●●●●●
●●
●
●
●
●●
●
●
●●●●
● ● ●●
●●
●
●
●
●
●
●●●
●
●
●●
●
●●●●●●●●
●
●●●●●●●●
●
●●
●
●●●●●
●
● ●
●
●●●●●
●
●●●●●●●●●●●●●●●●●●●●●●
●
●●●●●●●●●●
●
●●●●●●●●●●●●●●●●●●
●
●
●●●
●
●●
●●●
●●●
●●●
●●●●●
●●
●
●●
●●
●●
●●
●
●
●●
●●●●●●●
●
●
●
●●●●●●●●●●●●●●●
●
●●●
● ●● ●
●
●●
●●●●●●●●●● ●●●●●●●●
c4.large c4.xlarge
m3.large m3.medium
t2.medium t2.small
50100150200250300
50100150200250300
50100150200250300
Mon Tues Wed Thurs Fri Sat Sun Mon Tues Wed Thurs Fri Sat Sun
Day of the Week
Exe
cutio
n T
ime
(sec
onds
)
Figure 4: Dispersion of application execution time during all days of the weekon different EC2 instance types. Notice that all graphs have the same y-axisrange apart from m3.medium.
offers quite predictable performance across the week, with a narrow first quartilewhich is favourable.
The two C4 instance types portray contrasting performances. c4.large israther predictable with a steady median and right skewness (i.e. a very narrowfirst quartile). On the other hand, dispersion in the c4.xlarge instances is moretowards the high end of application execution time with a median that is lessregular: less left skewness is observed on Wednesday, Saturday and Sunday.
This could be down to different reasons such as demand from other users,the provider’s resource sharing algorithms, and the provider’s energy efficiencypolicy. These are difficult attributes for us to ascertain from the outside. Never-theless, we detect certain regularities that helps us determine the predictabilityof application performance at different time.
4.4 Lessons Learned
We investigated how variable the performance obtained from different IaaS set-tings could be, making the execution of a simple application rather uncertain.This demonstrates that public IaaS offerings are to a great extent black boxes.First, selecting instance types solely based on their advertised resource specifi-cations is not necessarily optimal. Second, selecting which day of the week torun an application could result in significant variation in performance.
9

5 Learning Evaluation
The confirmed performance variability serves as our motivation to equip userswith some certainty when consuming IaaS resources. We apply different machinelearning algorithms to be able to predict the best IaaS deployment setup for acertain application. We again use the VARD application (see Section 4.1.2) asa use case, with a goal to predict the optimal resources and most opportunetime for starting an EC2 instance to execute VARD. We first describe how welook for and assess the best models, then we detail the outcomes of our learninginvestigation.
5.1 Model Development and Evaluation Method
The core technique of our methodology that can effectively predict executiontime is based on polynomial regression. Polynomial regression is an approachof non-linear fit to data [12]. It extends the linear model by adding additionalpredictors that are obtained by raising each of the original predictors to a power.We take application execution time as a response variable, whilst a list of othervariables as candidate predictors: RAM, vCPU, processor speed, hypervisor,storage, day, time, application input parameters, etc.
Considering both prediction and inference based learning techniques, wefollow the procedure outlined below in order to get a robust model that canaccurately predict the response using the predictors.
1. Split the data into two sets: a training set to be used for learning, and atest sample for assessment and model evaluation. For current evaluationwe split the data set into training and test set with a ratio of 57% and43% respectively.
2. Train the model on the training set.
3. Assess the accuracy of the model using resampling (e.g. cross validationand bootstrapping), on the training set. Resampling methods repeatedlydraw samples and refit the model on each sample to get additional infor-mation about the fitted model’s performance such as variability estimatesof regression fit. Cross validation is one of the widely used resamplingmethods for model selection. We used k-fold cross validation computedby averaging the Mean Squared Error (MSE) for k-folds over the trainingsample. The MSE serves as a risk function for an estimator to measurethe difference between the estimator and estimated value.
4. Check goodness of model fit using statistical tests like p-value, R2, RSE,and F-statistics. R2 measures the proportion of variability in the responsevariable that is explainable by the predictors. The Residual StandardError (RSE) shows the actual deviation of the response from predicted,and measures the lack of fit for a model. F-statistics (also referred to asfixation indices) is a measure to reject a null hypothesis and to show theoverall significance of a model.
10
5.1.1 Polynomial Fit
The multivariate polynomial model is a special case of a basis function approachthat we used in our learning model. The idea of using a basis function is to havea transformation that can be applied to a variable X: b1(X), b2(X), . . . bk(X).
Basis functions are fixed and known, hence the least square approach canbe used to estimate the unknown regression coefficients in the model above.A robust polynomial model is build using profiling results. This model is anattempt to predict execution time using two significant predictors RAM andvCPU as well as an additional one: day of the week. This third predictor cannotdescribe the underlying distribution function on its own; instead it presents ameaningful outcome in a combinatorial way. This polynomial regression basedformula takes the following form:
F (x) = β01 + β11x1 + β21x21+
β02 + β12x2 + β22x22 + β32x
32+
β03 + β13x3 + β23x23 + β33x
33
This model is considered a successful attempt towards prediction at a finegrained level. It has the lowest MSE compared to other models evaluated in nextsection. The planning phase takes this model as an input along with substantialdetails of customer constrains and outputs the suitable configuration based onthe metric calculated by the planner.
5.2 Model Accuracy Analysis
To evaluate the accuracy of our model we compared it with different learningmodels using the standard methods described in subsection 5.1. Due to the lackof previous models, we used other learning techniques as baseline for comparison,namely linear regression, ridge regression and Lasso. The same dataset andmethodology were used to extract and evaluate the results.
5.2.1 Baseline Models
Linear models are relatively simple to implement and can provide good interpre-tation and inference. For accurate coefficient estimates, it uses the least squarecriteria [21].
In extension to our assumption about linear regression we tried to fit themodel containing all variables using a technique that shrinks the coefficient es-timates towards zero. We used the two well-known regularisation techniques forshrinking regression coefficients: ridge regression (also known as Tikhonov regu-larisation [28]) and Least Absolute Shrinkage and Selection Operator (Lasso) [27].
Ridge regression is similar to least squares but minimises the coefficientestimates with a slightly different quantity of the tuning parameter λ [14]. Whenλ = 0, the penalty term has no effect and estimates are least square. As λ→∞the shrinkage penalty grows and the coefficient estimates approaches zero.
11

Ridge regression includes all the variables as P predictors in the final model.Highest value of λ can reduce the coefficient value but cannot exclude anyvariable from the resulting model. On the other hand, Lasso overcomes thisdisadvantage by forcing some of the coefficient estimates to be equal to zeroespecially when the λ value is large enough [14].
In statistical terms, Lasso uses an l1 penalty while ridge uses an l2 penalty.For both these model fits, we chose a range of λ values from λ = 1010 to λ = 10−2
in order to evaluate all scenarios starting from the null hypothesis (that containsonly the intercept term) to the least square fit, respectively.
5.2.2 Diagnostic Assessment
We now asses the accuracy of the models, as summarised in Table 2.The norm values assessment for Lasso and ridge regression models indicate
that none of the λ values reduced the MSE. In fact, the best λ values (i.e.the ones that have minimum MSE, namely λ = 2.30 for ridge and λ = 0.03 forLasso) have even higher MSE than that when the function is derived to the leastsquare fit. The best λ value was figured out using cross validation technique.
Moving on to the other regression diagnostics (not suitable for ridge orLasso), the R2 statistic provides the proportion of variance explained usingthe predictor X and so it always takes a value between 0 and 1. The low R2
value for linear regression indicates that this model did not explain much of thevariability in the response; much less than half of it, in fact. On the other hand,the polynomial model captures more than 93% of data variability in terms ofresponse prediction.
The high F-statistics value for the polynomial model indicates the signifi-cance of selected predictors and their relationship with the response variable.The validation set error rate is usually assessed using MSE especially in the caseof quantitative response. The MSE values for ridge and Lasso are higher thanthat of the linear model. However, the same validation set MSE for polynomialfit is considerably smaller than the linear model. As with R2, we observe agross reduction for RSE in polynomial fit that estimates the standard deviationof error term which means there is less deviation of predicted response from thetrue regression line.
Table 2: Model assessment over the training dataset.
DiagnosticModel
Linear Ridge Lasso Polynomial
MSE (10-fold CV) 1159.00 2312.69 2476.65 131.27
R2 0.3741 – – 0.9307
F-Statistics 298 – – 5024
RSE 33.77 – – 11.55
Furthermore, we can check the model visually by plotting the actual response
12
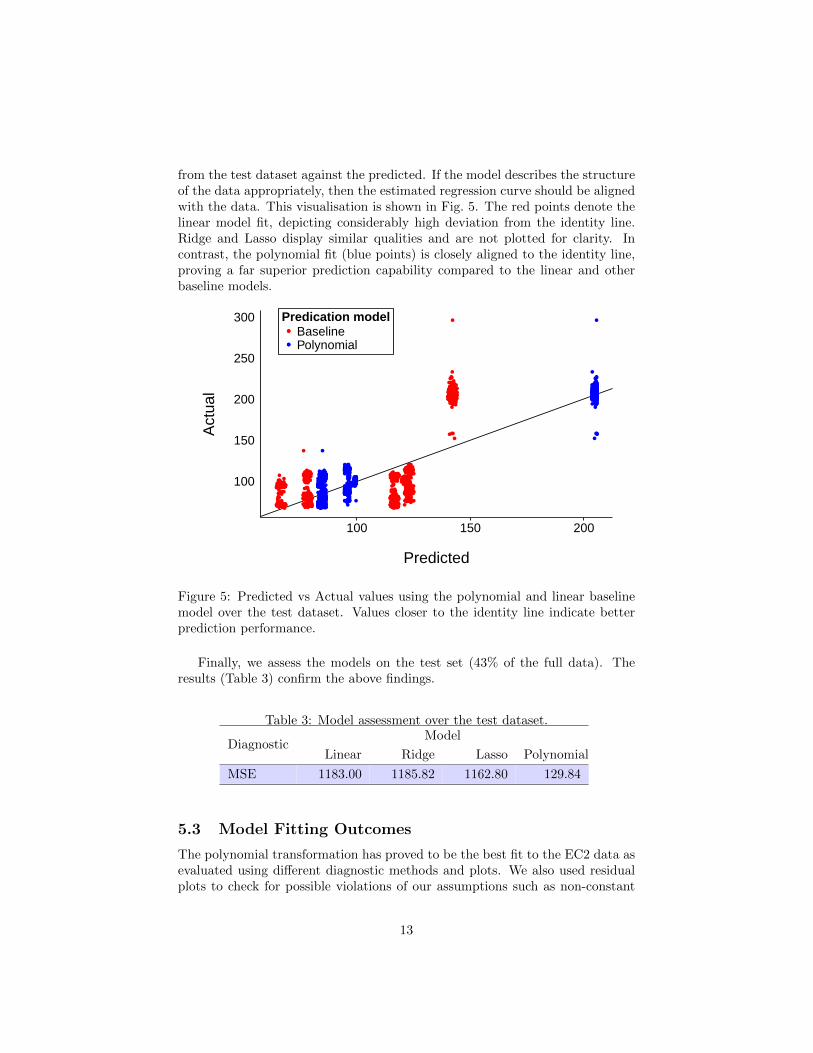
from the test dataset against the predicted. If the model describes the structureof the data appropriately, then the estimated regression curve should be alignedwith the data. This visualisation is shown in Fig. 5. The red points denote thelinear model fit, depicting considerably high deviation from the identity line.Ridge and Lasso display similar qualities and are not plotted for clarity. Incontrast, the polynomial fit (blue points) is closely aligned to the identity line,proving a far superior prediction capability compared to the linear and otherbaseline models.
●●●●●●●●●●●●●●●●●●●●●●●●●●● ●●●●●●●●
●●●●●●●●●●●●●●●●●●●●●●●●●●●●●●●●●●●●●●●●●●● ●●●●●●●
●●●●●●●●●●●●●●●●●●●●●●●●●●●●●●●●●●●●●●●●●●●●●●●●●●●●
●
●●●●●●●●●●●●●●●●●●●●●●●●●●●●●●●●●●●●●●●●●●●●●●
●●●●●● ●●●●●●●●●●●●●●●●●●●●●●●●●●●●●●●●●●●●●●●●●●●●●●●●
●●●●●
●●●●●●●●●●●●●●●●●●●●●●●●●●●●●●●●●●●●●●●●●●●● ●●●●●●●●●●●●●●●●●●●●●●●●●●●●●●●●●●●●●●●●●●●●●●●●●●●●●●●●●●●●●●●●●●●●●●●●●●●●●●●●●●●●
●
●
●
●
●●
●●
●●
●
●
●●
●
●●
●
●
●
●
●●●
●●
●
●
●
●
●
●●●●
●
●●
●●
●
●
●
●
●●
●
●
●●●
●●●●●●●
●
●●●●
●●
●
●
●●●
●
●●●●
●
●●
●
●●●
●
●●●
●●●
●
●
●●
●
●●
●●
●
●●
●●
●●●
●
●
●●●
●●
●
●
●
●
●
●●●
●
●
●●
●●
●●
●
●●
●
●●●●●●
●
●
●●
●
●
●●●●
●
●●
●
●●●
●
●
●
●●●
●
●●
●
●●●
●
●●●●
●●
●●
●
●●●●
●●
●
●
●●●
●●
●
●●
●●
●
●
●
●
●●
●●
●
●
●
●●
●
●
●
●●●
●
●
●●
●
●
●
●
● ●●
●
●
●●●●●●
●●●
●
●
●
●●
●
●●●●
●
●●●●
●
●
●●
●
●●
●
●●●
●
●
●●●●●●
●
●
●
●
●●●●
●
●●●
●
●
●
●
●●●
●●●●●●●●●●●●
●
●●
●●
●
●●●●●●
●
●
●
●●
●●
●●
●
●
●
●
●●●●●●●●●●●
●●●
●●
●
●
●●
●●●●
●
●●●●●
●
●●●●●●
●
●
●
●
●
●
●●
●
●●●
●
●●
●
●●●●
●
●●
●
●●●●●
●
●●●
●
●●●●●●●
●●
●
●
●●
●
●
●
●
●
●
●
●●●●●
●
●
●
●●●
●●
●
●●●●●●●●
●
●●●
● ●●●
●●
●●●
●●●●
●●
●●●●●●
●
●
●●●●
●●●●●
●●
●
●
●
●●
●
●●●
●●●●●●●
●
●●
●●
●
●
●●
●●
●●
●
●●●●●●●
●●
●
●
●
●
●
●●
●
●●●
●
●
●●
●
●
●●●●
●
●
●
●●
●
●●●
●
●●●
●
●●●●
●●●
●
●
●●
●
●
●●●
●●
●●●
●●●
●
●●●●
●
●●●●●●●●●●●
●
●
●●●
●
●
●
●●
●●●
●
●●●●●●
●
●●●●●
●
●●●●●
●
●
●●
●●
●●●
●●●
●
●
●●
●●●
●
●●
●●●●●●●●●
●
●●
●
●●
●
●●●●●●●
●
●
●
●
●●●●●●
●
●●●●●●●
●
●
●
●●
●
●●
●
●
●●●
●
●●●
●
●●●●
●
●●
●
●●●
●●●
●
●●●●
●
●
●
●
●●●
●●
●●●●
●
●
●●
●
●
●
●
●
●
●
●
●●
●
●
●
●
●●
●
●
●
●●●●
●●●●
●
●
●●
●
●●
●
●●●
●
●●
●
●
●
●●
●
●●●●
●●
●
●
●
●●
●
●
●●●
●●
●
●
●●●●
●
●●●●●●
●●
●
●
●●
●●●●
●●●●●
●
●●●●●●
●
●●●
●
●
●
●
●
●
●
●
●●
●
●
●●
●●
●
●
●●
●
●
●
●
●
●
●●●●
●
●●●●●●●
●
●
●
●●
●
●
●●●●
●
●
●
● ●
●
●
●●
●
●
●
●
●●
●●●
●
●
●
●●
●
●●
●●●
●
●●●
●
●
●●
●
●
●
●●
●●
●
●●●
●
●●
●
●
●●
●●
●
●
●
●●
●●
●
●●●●
●●●
●
●
●
●
●●
●
●
●●
●
●
●
●
●●
●
●
●
●
●
●●
●●
●
●
●
●●●
●
●
●
●
●
●
●●●
●
●
●
●
●
●●
●●
●●
●
●
●
●●●●●
●●●●
●●●
●
●●●
●
●
●
●
●●
●
●●●●
●●●
●●
●
●
●●
●●
●
●
●
●●
●
●●
●
●
●
●
●●
●●
●
●●
●
●
●
●
●
●
●
●
●●●
●
●
●
●●
●
●
●
●
●●
●
●●●●
●
●
●
●●
●●●●●●●
●●
●●
●
●●
●
●
●●
●
●
●
●●●●●●
●●
●
●
●
●●
●
●
●
●
●
●
●
●●
●
●
●
●●
●
●
●
●
●
●
●
●
●
●
●●●●
●●
●●
●
●
●●●● ●●●●●●●
●
●
●●
●
●
●
●
●
●
●●●
●●
●
●●
●●
●
●
●
●
●●●●
●
●
●●●●
●
●
●
●●●
●
●●●●●●●
●
●●
●●
●●●
●
●●
●
●●●
●●●
●●●●●●
●
●
●●●
●
●●
●
●
●
●
●
●
●
●
●
●
●●
●●●●
●●●
●●●
●
●
●
●
●●●
●
●
●
●●●●
●
●●●●●
●●●
●●
●●●
●●
●
●
●●●●●
●
●
●
●
●
●●●
●
●●●
●
●
●
●
●
●
●
●
●
●●●●●
●●
●
●
●●
●●●●
●
●●●●●●
●
●●●
●
●
●
●
●
●
●●●●●
●
●●
●
●●
●●
●
●
●
●●●●
●
●
●
●
●●●
●
●
●
●
●
●
●
●
●
●●●
●
●●●●●
●
●●●●●●
●
●
●
●
●
●●
●
●
●
●●●●●
●
●
●●
●
●
●
●
●
●
●
●
●
●●●●●●●
●
●
●
●
●
●
●
●
●●
●
●
●●
●●
●
●●●●
●
●●●
●●●
●●
● ●●●●
●●
●
●
●
●●
●
●●
●●
●
●
●●●
●
●●●
●
●
●
●
●
●●
●
●
●
●●
●
●●●
●
●● ●●●●●
●
●●●
●
●●●●
●●
●●
●●●
●●
●●●
●●●
●
●●●●
●●●●
●
●
●●
●
●
●●●●●
●
●●●●●●●
●
●
●
●
●●
●●
●●
●●
●●
●
●●
●
●●
●
●●●
●●
●
●
●
●●
●●
●●
●
●●●●
●
●●●●
●
●●
●
●
●
●
●●
●●
●
●
●
●●
●
●●●●●
●
●
●●
●
●
●●
●●
●
●●
●
●●
●
●
●●●●
●
●●●●
●●
●
●●●
●
●●●
●
●●●
●
●●
●
●
●
●
●
●
●●●
●
●
●
●
●
●
●
●●●●●
●●
●●
●●●
●●
●●
●●
●●●●●
●
●
● ●
●
●
●●
●
●●
●
●
●
●●
●
●
●●
●
●
●●
●
●
●
●●
●
●
●●●
●
●●
●
●
●
●●●●●
●
●●●●●●
●●
●
●
●●
●●
●
●
●
●●
●●
●●
●●
●
●
●
●●
●●
●●●
●●
●●●●●
●
●●
●●●●●●
●
●
●●●●●●
●●●●●●●●●●●●●●●●●●●●●●●●●●●●●●●●●●●●●●●●●●●●●●●●●●●●●●●●●●●●●●●●●●●●●●●●●●●●●●●●●●●●●●●●●●●●●●●●●●●●●●●●●●●●●●●●●●●●●●●●●●●●●●●●●●●●●●●●●
●
●●●●●●●●●●●●●●●●●●●●●●●●●●●●●●●●●●●●●●●●●●●●●●●●●●●●●●●●●●●●●●●●●●●●●●●●●●●●●●●●●●●●●●●●●●●●●●●●●●●●●●●●●
●●●●●●●●●●●●●●●●●●●●●●●●●●●●●●●●●●●●●●●●●●●●●●●●●●●●●●●●
●●●●●●●●●●●●●●●●●●●●●●●●●●●●●●●●●●●●●●●●●●●
●●●●●●●●●●●●●●●●●●●●●●●●●●●●●
●
●
●
●
●●
●●
●●
●
●
●●
●
●●
●
●
●
●
●●●
●●
●
●
●
●
●
●●●●
●
●●
●●
●
●
●
●
●●
●
●
●●●
●●●●●●●
●
●●●●
●●
●
●
●●●
●
●●●●
●
●●
●
●●●
●
●●●
●●●
●
●
●●
●
●●
●●
●
●●
●●
●●●
●
●
●●●
●●
●
●
●
●
●
●●●
●
●
●●
●●
●●
●
●●
●
●●●●●●
●
●
●●
●
●
●●●●
●
●●
●
●●●
●
●
●
●●●
●
●●
●
●●●
●
●●●●
●●
●●
●
●●●●
●●
●
●
●●●
●●
●
●●
●●
●
●
●
●
●●
●●
●
●
●
●●
●
●
●
●●●
●
●
●●
●
●
●
●
●●●
●
●
●●●●●●
●●●
●
●
●
●●
●
●●●●
●
●●●●
●
●
●●
●
●●
●
●●●
●
●
●●●●●●
●
●
●
●
●●●●
●
●●●
●
●
●
●
●●●
●●●●●●●●●●●●
●
●●
●●
●
●●●●●●
●
●
●
●●
●●
●●
●
●
●
●
●●●●●●●●●
●●
●●●
●●
●
●
●●
●●●●
●
●●●●●
●
●●●●●●
●
●
●
●
●
●
●●
●
●●●
●
●●
●
●●●●
●
●●
●
●●●●●
●
●●●●
●●●●●●●
●●
●
●
●●
●
●
●
●
●
●
●
●●●●●
●
●
●
●●●
●●
●
●●●●●●●●
●
●●●
●●●●
●●
●●●
●●●●
●●
●●●●●●
●
●
●●●●
●●●●●
●●
●
●
●
●●
●
●●●
●●●●●●●
●
●●
●●
●
●
●●
●●
●●
●
●●●●●●●
●●
●
●
●
●
●
●●
●
●●●
●
●
●●
●
●
●●●●
●
●
●
●●
●
●●●
●
●●●
●
●●●●
●●●
●
●
●●
●
●
●●●
●●
●●●
●●●
●
●●●●
●
●●●●●●●●●●●
●
●
●●●
●
●
●
●●
●●●
●
●●●●●●
●
●●●●●
●
●●●●●
●
●
●●
●●
●●●
●●●
●
●
●●
●●●
●
●●
●●●●●●●●●
●
●●
●
●●
●
●●●●●●●
●
●
●
●
●●●●●●
●
●●
●●●●●
●
●
●
●●
●
●●
●
●
●●●
●
●●●
●
●●●●
●
●●
●
●●●
●●●
●
●●●●
●
●
●
●
●●●
●●
●●●●
●
●
●●
●
●
●
●
●
●
●
●
●●
●
●
●
●
●●
●
●
●
●●●●
●●●●
●
●
●●
●
●●
●
●●●
●
●●
●
●
●
●●
●
●●●●
●●
●
●
●
●●
●
●
●●●
●●
●
●
●●●●
●
●●●●●●
●●
●
●
●●
●●●●
●●●●●
●
●●●●●●
●
●●●
●
●
●
●
●
●
●
●
●●
●
●
●●
●●
●
●
●●
●
●
●
●
●
●
●●●●
●
●●●●●●●
●
●
●
●●
●
●
●●●●
●
●
●
●●
●
●
●●
●
●
●
●
●●
●●●
●
●
●
●●
●
●●
●●●
●
●●●
●
●
●●
●
●
●
●●
●●
●
●●●
●
●●
●
●
●●
●●
●
●
●
●●
●●
●
●●●●
●●●
●
●
●
●
●●
●
●
●●
●
●
●
●
●●
●
●
●
●
●
●●
●●
●
●
●
●●●
●
●
●
●
●
●
●●●
●
●
●
●
●
●●
●●
●●
●
●
●
●●●●●
●●●●
●●●
●
●●●
●
●
●
●
●●
●
●●●●
●●●
●●
●
●
●●
●●
●
●
●
●●
●
●●
●
●
●
●
●●
●●
●
●●
●
●
●
●
●
●
●
●
●●●
●
●
●
●●
●
●
●
●
●●
●
●●●●
●
●
●
●●
●●●●●●●
●●
●●
●
●●
●
●
●●
●
●
●
●●●●●●
●●
●
●
●
●●
●
●
●
●
●
●
●
●●
●
●
●
●●
●
●
●
●
●
●
●
●
●
●
●●●●
●●
●●
●
●
●●●●●●●●●●●
●
●
●●
●
●
●
●
●
●
●●●
●●
●
●●
●●
●
●
●
●
●●●●
●
●
●●●●
●
●
●
●●●
●
●●●●●●●
●
●●
●●
●●●
●
●●
●
●●●
●●●
●●●●●●
●
●
●●●
●
●●
●
●
●
●
●
●
●
●
●
●
●●
●●●●
●●●
●●●
●
●
●
●
●●●
●
●
●
●●●●
●
●●●●●
●●●
●●
●●●
●●
●
●
●●●●●
●
●
●
●
●
●●●
●
●●●
●
●
●
●
●
●
●
●
●
●●●●●
●●
●
●
●●
●●●●
●
●●●●●●
●
●●●
●
●
●
●
●
●
●●●●●
●
●●
●
●●
●●
●
●
●
●●●●
●
●
●
●
●●●
●
●
●
●
●
●
●
●
●
●●●
●
●●●●●
●
●●●●●●
●
●
●
●
●
●●
●
●
●
●●●●●
●
●
●●
●
●
●
●
●
●
●
●
●
●●●●●●●
●
●
●
●
●
●
●
●
●●
●
●
●●
●●
●
●●●●
●
●●●
●●●
●●
●●●●●
●●
●
●
●
●●
●
●●
●●
●
●
●●●
●
●●●
●
●
●
●
●
●●
●
●
●
●●
●
●●●
●
●●●●●●●
●
●●●
●
●●●●
●●
●●
●●●
●●
●●●
●●●
●
●●●●
●●●●
●
●
●●
●
●
●●●●●
●
●●●●●●●
●
●
●
●
●●
●●
●●
●●
●●
●
●●
●
●●
●
●●●
●●
●
●
●
●●
●●
●●
●
●●●●
●
●●●●
●
●●
●
●
●
●
●●
●●
●
●
●
●●
●
●●●●●
●
●
●●
●
●
●●
●●
●
●●
●
●●
●
●
●●●●
●
●●●●
●●
●
●●●
●
●●●
●
●●●
●
●●
●
●
●
●
●
●
●●●
●
●
●
●
●
●
●
●●●●●
●●
●●
●●●
●●
●●
●●
●●●●●
●
●
●●
●
●
●●
●
●●
●
●
●
●●
●
●
●●
●
●
●●
●
●
●
●●
●
●
●●●
●
●●
●
●
●
●●●●●
●
●●●●●●
●●
●
●
●●
●●
●
●
●
●●
●●
●●
●●
●
●
●
●●
●●
●●●
●●
●●●●●
●
●●
●●●●●●
●
●
●●●●●●100
150
200
250
300
100 150 200
Predicted
Act
ual
Predication model●●
●●
BaselinePolynomial
Figure 5: Predicted vs Actual values using the polynomial and linear baselinemodel over the test dataset. Values closer to the identity line indicate betterprediction performance.
Finally, we assess the models on the test set (43% of the full data). Theresults (Table 3) confirm the above findings.
Table 3: Model assessment over the test dataset.
DiagnosticModel
Linear Ridge Lasso Polynomial
MSE 1183.00 1185.82 1162.80 129.84
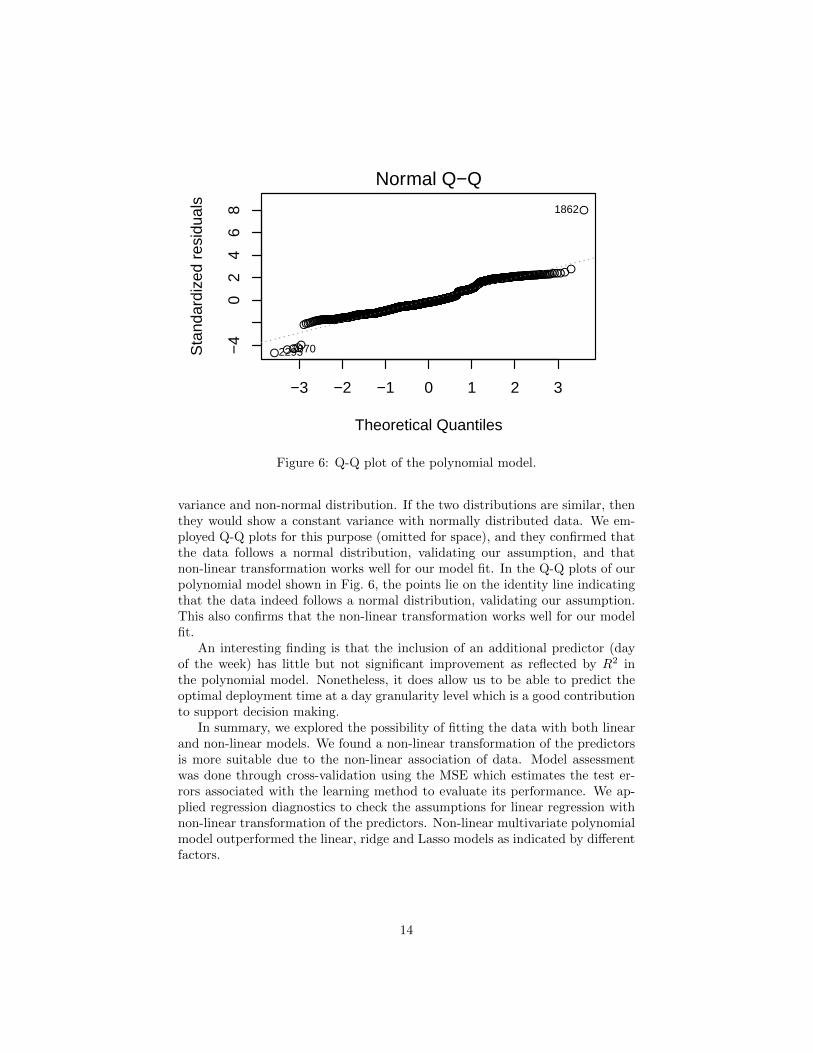
5.3 Model Fitting Outcomes
The polynomial transformation has proved to be the best fit to the EC2 data asevaluated using different diagnostic methods and plots. We also used residualplots to check for possible violations of our assumptions such as non-constant
13
80 100 120 140 160 180 200
−50
050
100
Fitted values
Res
idua
ls
●
●●●
●●●
●
●
●
●●●●
●
●● ●
● ●●
●
●
●●
●
●
●
●●●
●
●● ● ●●
● ●
●●
●●●● ●●
●
●●
●
●
●●
●
●
●●●
●
●●●
●●
●●
●●●
●
●●●
●
●●●
●●●●
● ●●●●● ●
● ●●
●
●
●
●●●
●●
●
●●●● ●
●●●
●●
●●●
●●
●
●
●●
●
●
● ●
●
●
●
●●
●
●●
●●
●●●
●
●
●
●
● ●●●
●●●
●●
●●
●
●●
●
●●
●●
●●
● ●●
●
●
●●
●
● ●
●
●● ●●
●●
●●●
●●
●
●●
●● ●
●
● ●●
●● ●● ●
●●
●
●● ●●●●
●
●
●
●●
●● ●
●●●●●
●
●●
●● ●●
●●●● ●
●
●● ●
●●
●
●● ●●●
● ●
●
●
●●●
●●
●●
●● ●●
●●●
●● ●●
●●
● ●
●
●
●
● ●●●●●● ●●●
●●
●●
●● ●
●●
●●
●
● ●
●●
● ●●
●●
●
●●
●●
●●
●●
●
●
●●
●
●
●●●
● ●●
●
●●●●
●●
●
●
●●
●●●
●●●●
●
●
●
●●●●
●
●●●
●
●
●●
●●
●
●●
● ●
●●●●
●
●
●●
●
●
●
●●● ●●●●●●●●●
●
●●
●●
●
●●
●
●
●
●
●
●
●●
●
●
●●●●
●●
●●●●
●●
●
●●
● ●●
●
●●
● ● ●●
●
●
● ●●●
●
●●
●
● ●●● ● ●●
●●
● ●
●
●
●●
●
●
●●●●
●
●
●●●●
●●●
●
●●
●
●●
●●
●●
● ●
●
●
●
●
●●
●
●
●●
●
●
●●
●●
●●●●
●●●
●
●●
●●
●
●
●●●
●
●
●
●●
● ●●
●
●●
●●
●
●●
●
●
●
●
●
●●
●
●
●
●● ●●
●●
●●
●
●●●●
●
●●
● ●●●●●
●
●●
●●
●●●
●● ●
●
●
●●
●● ●
●●
● ●●
●
●
●
●
●●
●
●
●
●
● ●
●
● ●● ●●
●
● ●●● ●●
●
●●●●
●●● ●●
●
●
● ●
●
●● ●
●● ●
●
●●
●
●
● ●●●●●
●●
●
●
●● ●●●
●●
●
●●●
●
●
●
●●●
●
●●●
●●
●●
●
●●● ●●
●●
●
●
●
●
●
●●●●
●
●●
●●
●●●●
●●
●
●
●
●
●●●
●●
●●● ●●
●
●●●
●●●
●●●●
●●●●●
●
●●● ●
●●
●●
●●
●●
●
●
●●
●●●
●●●
●●●●● ●●
●●● ●
● ●
●●
●
●●●
●●● ● ●●●
●
●
●●●●
●
●
●●
●
●
●●●●● ●
●●
●
●● ●●●●●
●
●●
● ●● ●●●
●●●●●
●
●
●
●
●●●●
●
●●
●● ●
● ●
●
●●
●●
●
●●●
●
●● ●
●
●●●
●●
●
● ●●●
●●
●●
●
●●
●● ●
●●
●
●●
●●
●●
●●●●●
●●●●
●
●●
●●
●●●
●●
●
●
●●
●
●
●
●
●●
●
●
●
●●●●
●
●
●●●
●
●●●
●● ●
●●
●●
●
●
●●
●
●●●
●●
●●●
●●●
●
●●
●●●
●●
●●● ●●
●
●● ●●●
●
●
●●●
●
●
●●
●●
●
●●●
●●● ●
●●
● ●●●●
●●
●
●
●
●
●●
●
● ●
●●
●●
●
● ●
●
● ●●
●
●●
●
●
●
● ●
● ●●●
● ●
●
● ●●
●
● ●●
●
●●
●●
●●●
●●
●●
●
●●
●●
●●●
● ●●●
●
●●
●
●
●
●●
● ●
●
●
●
●
●
●
●●
●
●
●
●
●●
●●●
●●
●
●●
●●
●
●
●
●●●●
●●
●●●
●
●●
●
●●
●
●
●
●●●
●
●
● ●● ●
●●●
●●● ●
●
●●●
●
● ●
●
●●
●●
●
●●
●
●●
●
●●●●●●●
●●●●
●●
●
●
●
●
●
● ●●
●
●
●●●
●●
●
●
●●●
●●●
●
●
●●●● ●●●
●
●●
●●●●
●
●
●● ●●●
●
●●
●●●
●
●
●●
●●
●●
●
●
●●
●
●
●●●●
●
●●
●●
●●●
●
●●●
●●
●
●●
●
●●
●● ●●
●●
●●●●●
●
●
●
●
●
●●
●●
●
●●●
●
●
●
●
●● ●●
●●
●
●●●
●
●●
● ●●
●●●
●●
●
●●
●●
●●●●
●
●
●
●●●●
●
●● ●●
●●
●
●
●●●●
●●
●
●●
●●●●●
●
●
●● ● ●●
●
●
● ●●●●●
●
●
●
●
●
●●●
●
●●●
●
●●●●
●●●
●
●
●
●●●●
●
●
●●
●
● ●●●
●●
●●
●
●
●●●
●●●
●●●
●
●●
●●●
●
●●
●
●●●●●
●●
●
●
●●● ●
●
●
●
●●●●●●●
●
●
●
●
●
●●
●●
●
●●●
●
●● ●●
●
●●●
●●
●
●●
●● ●
●●
●●
●● ●
● ●●●●●●●●●●
●
●
●●
●
●●●●
● ●
●
●
●●
●●
● ●●
●
●●
●●
●●
●●
●●
●
●●● ●●
●●
●
●●
●
●
●● ●
●
●●● ●● ●●●
●
●●●
●
●
●
●
●●
●
●●
●
●●
●
●●●●
●
●●●
●
●●
●
●
●●
● ●●
●●
●●
●
●●
●●
●
●
●●
●●
●
●
●●
●●
● ●●
● ●●
●
●
●●●
●
●
●
● ●● ●
● ●●
●●●● ●●●
●●
●
●●
●
●
●●●●
●
●●●
●●
●●●
●
●●
●
● ●●●●
●●
●
●
●● ●
●
●●●●● ●
● ●● ●●●
●●
●
●● ●●
●●
●●
● ●
●●
●●●●
●●
●
●
●●
● ●●●●●
●
●
●●
●
●●
●●
●●
●● ●
●●●●●
●●
●
●●
●● ●●● ●
●●
●
● ●
●
●●
●
●●
● ●
●●● ●
●
●
●
●
●
●●●
● ●●
●
●
●
●
●●
●
●
●●
●
●●●●
●●
●●● ●
●●●● ●●●
● ●●●●●
●●
●●●
●
●
●●●
●● ●●●
●
●●●●
●●●
●
●
●●
●●
●
●●
●●
●● ●●
●
●
●●
●●
●● ●
●●
●●
●●●●
●●
●
●●
●● ●●
● ●●●●
●●●
●● ●●●
●●
●●
●
●●
●●
●● ●
●●
●●●●●
●
●
●●●●
●●●
●●
● ●●
●●●●
●
●
●●
●
●●
●●●● ●●
●
●●
●
●
●
● ●
●●●
●
●
●
●
●
●
●
●
●
●●
●●
●●●
●●
●●●●
●
● ●●
●●
●
●●
●●
●●
●
●●
●
●●
●● ●●
●
●
●
● ●●●
●●●● ●● ●●●
●
●●●●●
●●
●
●
●●● ●●●
●
●●
●
●●
●●
●●●● ●
●
●●●●
●
●●
●
●
●
●●●
●
● ●●
●●
●
● ●●● ●
●
●●● ●●
●●
●●●
●●●● ●
●● ●● ●●
●●
●
●● ●
●● ●●●●●● ●●●
●
●●●●
●
●
●
●●
●
●
●
●●●
●
●●
●●
●●
●
●●●
●
●●
●
●●●●●
●●● ●
●
●● ●●
●●
●
●
●●●
●●●
●●
●
●
● ●●●
● ●●
●
●●●
●●
●●● ●
●
●
●●●
● ●
●
●
●
● ●●
●●●● ●
●●
●● ●
●●
●●●
●
●●
●●
●●
●●
● ●
●
●●
●
●● ●●●
●
●
●●● ●●
●
●
●●
●
●
●●
●
●●●
●●
●
●
●●● ●
●
●
●
● ●●●●●
●
●●●
●
● ●
●●
●●
●
●
●●
●●
●
●●
●
●
●
●●
●
●
●●
●
● ●
●
●●
●●
●●
●●
●●
●
●●
●
●
●
●●
●
●●●●
●
●
●●●
●
●●●
●
●
●●
●
●●
●
●
●
●●●
●
●●
●
●
●●● ●●● ●
●●
●
●
●●
●● ●
●
●●●
●
●
● ●
●●
●●
●●●
●
●
●●
●
●●●
●
●
●● ●
●
●
●●
●●
●
●●
●●●
●●
●
●●
●●●●
●●
●●●●
●●●
●
●●●●
● ●●
●● ●●
●●●
●
● ●
●●
●●● ●●●
●
●●●●
●
●●●●
●● ●●
● ●
●● ●●
●
●
●●
●
●●●●●●
●
●●● ●●
●
●●●
●●
●
●●
●
●●●
●●
●
● ●●●
●●
●
●
●
●
●
●
● ●
●
●
●
●●
●
●
●
●●●
●●
● ●
●
●
●
●
●
●
●● ●
●●●●
●●
●
●
●
●●●
● ●
●
●●
●●
●
●
●●●●●●●
●
●
●
●●
●●●
●●●
●●●●●
●
●
●●
●● ●
●●●●
●
●●
●
●●
●●
● ●
●●
●
●●
●●●
●
● ●
●●●
●●● ●●●●
●
●●
●
●
●
●●
●
●●
●●
●●
●●
●● ●●●
●●
●●
●●
●
●
●● ●●
●
●
● ●●
●
●
●
●
●●
●●●●●
●
●
●
●●
●●
●
●●●●
●
●
●●
●●
●●
●●
●
●
●
●●●
●
●
●
● ●
●●●●●●●
●●
●●
●●
●●●
●
●● ●
●●
●●
● ●●●
● ●●●
●
●●
●
●
●●
●
●●
●● ●●
●●
●
●
●
●●
●●●●
●●●
●●
●●
●
●
●●
●●●●● ●●
●
●●
●●●●
●●
●
●
●●
●
●
● ●● ● ●●●●
●
●
●●
●●
●
● ●●●
●
●●●●
●
●●●●
●●
●●
●
●●●●● ● ●
●
●●
●●● ●●
●●
●
●
●
●
●
●●●
●●
●●
● ●
●
●
●●
●
●
●●
●●●
●
●●●●
●●
●
●
●
●
●●
●
●●
●●
●●●
●●
●● ●●
●●
●
●●
● ●●
●
●
●
●●
●●
●
● ●●
●
●●
●●
●●
●●
●●
●●
●
●●
●
●●●●
● ●
●
●●●● ●●●
●
●●
●●
●
●
●
●●
● ●●●
●
●
●●
●●
●●
●
●●
●●
●
●
●
●●
●
●
●●
●●
●●
●●
●
●
●●
●
●● ●●
●
●
●
●
●●
●
Residuals vs Fitted
1862
22952070
●
●●●
●
● ●
●
●
●
●●●
●
●
●
●●
●●●
●
●
●●
●
●
●
●●
●
●
●● ● ●●
●●
●
●●● ●● ●
●
●
●●
●
●
●●
●
●
● ●●
●
●
●●●
●
●●
●● ●
●
●●●
●
●●●
●●●
●
● ●● ●●●●
● ● ●
●
●
●
●●●
●●
●
●●● ●●
●
●●
● ●
● ●
●
●●
●
●
●●
●
●
●●
●
●
●
●●
●
●●
●●
●●●
●
●
●
●
●●●●
●●●
●●
●
●●
●●
●
●●
●●
●●
●●
●
●
●
●●
●
●●
●
●●●●
●●
● ●●
●●
●
●●
●●●
●
●●●
● ●●●●
●●
●
●●●●●●
●
●
●
●●
●● ●
●●●
● ●
●
●●
●● ●●
●●●● ●
●
●● ●
●●
●
● ●●●●
●●
●
●
● ●●
●●
●●
● ●●●
●●
●
●● ●●
●●
●●
●
●
●
●●●●● ●●●
●●●
●
●●
●●●
●●
●●
●
●●
●●
●●●
●●
●
●●
● ●
●●
●●
●
●
●
●
●
●
● ●●
● ●●
●
●●
●●
● ●
●
●
●●
●●
●
●●
●
●
●
●
●
●●●●
●
●●●
●
●
●●
●●
●
● ●
●●
●●
●●●
●
●●
●
●
●
●●●
●●●●
●●
●●●
●
●●
●●
●
●●
●
●
●
●
●
●
●●
●
●
● ●●●
●●
●●
●●
●
●
●
●●
● ●
●
●
●●
● ● ●●
●
●
● ●● ●
●
●●
●
● ● ●●● ● ●
●●
●●
●
●
●●
●
●
●●●
●
●
●
●●●●
●●●
●
●●
●
●●
●●
●●
●●
●
●
●
●
●●
●
●
●●
●
●
●●
●●
● ● ●●
●●
●
●
●●
●●
●
●
●●
●●
●
●
●●
● ●●
●
●●
●●
●
●●
●
●
●
●
●
●●
●
●
●
●●●●
●●
●●
●
● ●● ●
●
●●
● ●●●
●●
●
●●
●●
●●
●
●● ●
●
●
●●
●●
●
●●
● ●●
●
●
●
●
●●
●
●
●
●
● ●
●
●●●
●●
●
● ●●
●●●
●
●●●●
● ●●●
●
●
●
●●
●
●●●
●● ●
●
●●
●
●
● ●●● ●
●●
●
●
●
●●●●
●●●
●
●●●
●
●
●
●● ●
●
●● ●
●●
●●
●
● ●●● ● ●
●●
●
●
●
●
●●●
●●
●
●●
●● ●
●●
●●
●
●
●
●
●●●
●●
●●● ●
●
●
●●
●
●●●
●●●
●●●
●●●
●
●●●●
●●
●●
●●
●●
●
●
●●
●●●
●●●
● ● ● ●● ●●
●● ●●
●●
●●
●
● ●●
●● ●●● ●●
●
●
●●●●
●
●
●●
●
●
●●●●●●
●●
●
●● ●● ●●●
●
●●
●●●●●●
●●●●●
●
●
●
●
●●
●●
●
●●
●● ●
● ●
●
●
●
●●
●
●●●
●
●●●
●
●
●●●
●
●
● ●●●
●●
●●
●
● ●
●●●
●●
●
●●
●●
●●
●●●
●●
●●●●
●
●●
● ●
●●●
●●
●
●
●●
●
●
●
●
●●
●
●
●
●
●● ●
●
●
●●●
●
●●●
●●●
●●
●●
●
●
● ●
●
●●●
●●
● ●●
●●●
●
●●
●●●
●●
● ●●●●
●
●●●●
●
●
●
●
●●
●
●
●●
●●
●
● ●●
● ●●
●
●●
●●●● ●
●●
●
●
●
●
●●
●
●●
●●
●●
●
●●
●
● ●●
●
●●
●
●
●
●●
●●●●
●●
●
●●●
●
●●●
●
●●
●●
●●●
●●
●●
●
●●
●●
●●●
● ● ●●
●
●●
●
●
●
●●
●●
●
●
●
●
●
●
●●
●
●
●
●
●
●●●
●●
●●
●●
●●
●
●
●
●●●●
●●
●●●
●
●●
●
●●
●
●
●
● ●
●●
●
●●●●
● ●
●●
●●●
●
●●●
●
●●
●
●●
●●
●
●●
●
● ●
●
●● ●●●
● ●● ● ●
●
●●
●
●
●
●
●
●● ●
●
●
●●●
●●
●
●
●●●
●●●
●
●
●●●● ● ●●
●
●●
●●● ● ●
●
●● ●● ●
●
●●
●●●
●
●
●●
●●
●●
●
●
●●
●
●
●●●
●
●
●●
●●
●
● ●
●
●●●
●●
●
●●
●
●●
●● ● ●
●●
●● ●●
●●
●
●
●
●
●●
●●
●
●●
●
●
●
●
●
●●●
●●
●●
●● ●
●
●●
●●●
●●
●
●●
●
●●
●●
●●
●●
●
●
●
●●●
●
●
●●●●
●●
●
●
●● ●●
●●
●
●●
●●●
●●
●
●
●●●
●●
●
●
● ●● ●●
●●
●
●
●
●
●●
●
●
●●
●
●
●●
●●●●●
●
●
●
●●●
●
●
●
●
●
●
●●●●
●●
●●
●
●
●●●
●●●
●●●
●
●●
●●●
●
●●
●
● ●●●●
●
●
●
●
●●
●●●
●
●
● ●●●●●
●
●
●
●
●
●
●●
●●
●
● ●●
●
●
●●●
●
●●
●● ●
●
●●
● ● ●
●●
●●
●●●
● ● ●●●●● ●●●●
●
●
●●
●
● ●●
●●●
●
●
●
●
●●
●●
●●
●
●●
●
●●
●●
●●
●
●●●●●
●●
●
●●
●
●
● ●●
●
●
●
● ●●●
●●
●
●●●
●
●
●
●
●●
●
●●
●
●●
●
●●●
●
●
●●●
●
●
●
●
●
●●
●●●
●●
●
●
●
●●
●●
●
●
●●
●●
●
●
●●
●●
●●●
●●●
●
●
●●●
●
●
●
● ●●
●
●●
●
●●●● ●● ●
●●
●
●●
●
●
●●●
●
●
● ● ●
●●
●●●
●
●●
●
● ●●●●
●●
●
●
●●●
●
● ●●
●●
●● ●
●●●●●●
●
●●●●
●●
●●
●●
●●
●●
●●●
●
●
●
●●
● ●●● ●●
●
●
●
●
●
●●
●●
● ●
●● ●
●● ●
●●●●
●
●●
●●●
● ● ●
●●
●
●●
●
●●
●
●●
●●
● ●●●
●
●
●
●
●
●●
●
● ●●
●
●
●
●
●●
●
●
●●
●
●●●
●●●
●●
● ●
●
●●●●●●●●
● ●●●
●●
●●●
●
●
●●
●
●● ●● ●
●
●●●●
●●
●●
●
●●
●●
●
●●
●●
●●●
●●
●
●●
●●
●●●
●●
●●
●●●●
●●
●
●●
●●●●
● ●●●
●
●●●
●● ●
●●
●●
●●
●
●●
●●
●● ●
●
●
● ●●
●●
●
●
●●●●
● ●●
● ●
●●
●●
●● ●●
●
●●
●
●●
●●
●●●●
●
●●
●
●
●
●●
●●●
●
●
●
●
●
●
●
●
●
●●
●●
●●●
●●
●●●●
●
● ●●
●
●
●
●●
●●
●●
●
●●
●
●●
●●●●
●
●
●
●● ●●
●●●●● ● ●●
●
●
●●●
●●
●●
●
●
●● ●●●●
●
●●
●
●●
●
●
●●●
●●
●
●●●●
●
●●
●
●
●
● ●●
●
●●
●
●●
●
● ●●● ●
●
● ●●●●
●●
●●●
●●●● ●
●●● ●●
●
●●
●
●● ●
●●●
●●●
●● ●●●
●
●●● ●
●
●
●
●●
●
●
●
●●●
●
●●
●●
●●
●
●●
●
●
●●
●
●●●●●
●●● ●
●
●● ●
●
●
●●
●
●● ●
● ●●
●●
●
●
● ●●●
● ●●
●
●●
●●
●
●●●●
●
●
●●●
●●
●
●
●
●●●
●●●●●
●●
●●●
●●
● ●●
●
●●
●●
●●
●●
● ●
●
●●
●
●●
●● ●
●
●
●●●●●
●
●
●●
●
●
●●
●
● ●●
●●
●
●
●●●●
●
●
●
●●● ●●●
●
●●●
●
●●
●●
●●
●
●
●●
●●
●
●●
●
●
●
●●
●
●
●●
●
●●
●
●●
●●
●●
●●
●●
●
●●
●
●
●
●●
●
●●●●
●
●
●●●
●
● ●●
●
●
●●
●
●●
●
●
●
●●●
●
●●
●
●
●●●●●● ●
●●
●
●
●●
●●●
●
● ●
●●
●
●●
●●
●●
● ●●
●
●
●●
●
●●
●
●
●
● ●●
●
●
●●
●●
●
●●
●●
●●
●
●
●●
●●● ●
●●
●●●●
●●●
●
●●●●
●●●
●●●●
●●●
●
●●
●●
●●●●●●
●
● ●●●
●
●
●●●
●●●●
●●
●● ●●
●
●
●●
●
●●●
● ●●
●
●●●
●●●
●●●
●●
●
●●
●
●●
●●●
●
● ● ●●
●●
●
●
●
●
●
●
● ●
●
●
●
●●
●
●
●
●●●
●●
●●
●
●
●
●
●
●
●●●
●●
●●
● ●
●
●
●
●● ●
● ●
●
●●
●●
●
●
● ●●●●●
●
●
●
●
●●
● ●●
●●●
●●
●● ●
●
●
●●
●● ●
●●●●
●
●●
●
●●
●●
●●
●●
●
●●
●●●
●
●●
●●●
●●●●●●●
●
● ●
●
●
●
●●
●
●●
●●
●●
●●
●●●
●●
●●
●●
●●
●
●
●●●●
●
●
●●●
●
●
●
●
●●
●●●
●●●
●
●
●●
●●
●
●●●
●●
●
●●
●●
●
●●
●●
●
●
●●
●
●
●
●
● ●
●●●●●●●
●●
●
●●●
●●●
●
●
● ●
●●
●●
● ●●●
● ●●●
●
●●
●
●
●●
●
●●
●
●● ●●●
●
●
●
●●
●●●●
●●●
●●
●●
●
●
●●
●●● ●● ● ●
●
●●
●●●●
●●
●
●
●
●
●
●
●●●
●●● ●●
●
●
●●
●●
●
●●
● ●●
●●●●
●
●●●
●
●●
●●
●
●●●● ●●●
●
●●
●●●●●
● ●
●
●
●
●
●
●●
●
●●
●●
●●
●
●
●●
●
●
●●
●● ●
●
●●
●●
●●
●
●
●
●
●●
●
●●
● ●
●●●
●●
●●●●
●●
●
●●
●●●
●
●
●
●●
●●
●
●●●
●
●●
●●
●●
● ●
●
●
●●
●
● ●
●
● ●●●
● ●
●
●●●●●● ●
●
●●
●●
●
●
●
●●
● ● ●●
●
●
●●
●
●
●●
●
●●
●●
●
●
●
●●
●
●
●●
●●
●●
● ●
●
●
● ●
●
●●●●
●
●
●
●
●●
●
−3 −2 −1 0 1 2 3
−4
02
46
8
Theoretical Quantiles
Sta
ndar
dize
d re
sidu
als
Normal Q−Q
1862
22952070
80 100 120 140 160 180 200
0.0
1.0
2.0
Fitted values
Sta
ndar
dize
d re
sidu
als
●
●
●● ●
●●
●
●
●
●
●●
●
●
●
● ●
●●●
●●
●
●
●
●●
●
●
●
●
●
●
●
●●
● ●
●
●
●●
●●
●
●
●
●
●●
●
●
●●●
●●
●
●●
●●
●
●●
●
●
●●
●
●●●
●●
●●
●●●
●●
●●
●●
●●
●●
●
●●
●●
●●
●
●
●
●
●●
●●
●
●
●
●●
●
●
●
●
●
●
●
●
●
●
●
●
●
●●●
●●
●
●●
●●
●
●● ●
●●
●
●●
●●
●●●
●
●
●
●
●
●
●●
●
●
●
●
●
●
●
●●
●
●
●
●
●
●
●
●
●
●●
●
●
●●●
●
●
●
●
●
●
●
●●
●
● ●●
●
● ●
● ●
●
●
●
●●
●●
●
●
●●
●
●
●●
●● ●●●
●
●
●
●
●
●
●
●●
●
●●●
●
●
●
●
●●
●●
●● ●● ●● ●
●
●
●●
●
●
●
●
●
●●
●
●
●
●
●
●
●
●●
●
●
● ●
●
●●
● ●●●●
●
●●
●●
●
●
●
●
●●●
●
●
●●
●
●
●
●●
● ●
●
●
●
●●
●
●●
●
●●●●
●
●
●
●
●
●●●
● ●●
●●
●●●
●●
●
●
●
●
●
●
●
●
●
●
●●
●
●
●●●
●
●
●
●●
●
●
●
●
●
●
●
●●
● ●
●
●
●●
●
●
●●
●
●
●
●
●●
●●●
●
●
●
●
●●
●
●●
●●●
● ●
●
●
●
●●●
●
●
●
●
●●
●●
●
●
●●
●●
●
●
●
●
●
●
●
●●
●
●
●
●
●
●
●●
●
●
●●
●
●●
●
●
●●
●●
●
●
●
●
●
●
●
●
●
●●
●
●
●●
●●●
●●
●
●●
●●
●●
●
●
●
●●●●
●
●
●
●●●●●
●●
●
●
●
●
●
●
●
●●
●●●
●●
●
●
●
●
●
●●●
●
●
●
●
●●●
●●●
●
●●
●●
●
●
●●● ●
●
●●●●●
●
●●
●●
●
●
●●
●
●
●●●
●
●
●
●
●
●
●
●●
●
●
●
●
●
●
●
●
●●
●
●●
●
●
●●
●●
●
●
●
●
●
●
●
●●
●
●
●
●
●
●
●
●●
●
●
●
●
●
●
●● ●
●
●
●
●
●
●
●
●●
●
●
● ●
●
●
●
● ●
●
●
●●
●
●
●
●
●
●
●
●
●●●
●●
●
●●
●
●
●●●
●
● ●
●
●●●
●●●
●
●
●
●
●
●●
●
●
● ●
●
●●
●
●●
●
●
●
●
●●
●
●
●●
●●
●
●
●
●●
●●
●●
●
●
●
●
●●
●
●
●
●
●
●●
●
●
●●
●●
●
●
●●
● ●●
●
●●
●●●
●
●
●●
●
●
●
●
●
●
●
●
●
●
●
●
●
●●
●●●
●
●●●
●
●
●
●
●
●● ●●
●
●
●
●●
●
●
●
●
●●
●●
●
●
●
●●●●
●
●
●
●
●
●
●●●
●●
●
●●
●
●
●●●
●
●●
●
●●
●●
●●
●●●●
●●
●
●●
●● ●
●
●
●
●
●
●
●●
●
●
●
●
●
●
●●
●
●
●●
●
●●
●
●●
●●
●
●
●
●●
●●
●
●
●
●●
●●
●
●●
●●
●
●●
●
●
●●●●
●
●
●
●
●●
●
●
●
●●●●
●●
●●
●
●
●
●
●
●
●
●
●
●
●●
●
●
●
●●
●●
●
●●
●
●●
●
●
● ●●
●●●
●
●●
●
●
●●
●●
●
●●
●
●
●●
●
●
●●●
●
●●
●●
● ●●
●
●
●●
●
●●
●
●
●
●
●●
●
●
●●
●
●●
●
●●
●
●
●
●
● ●●
●
●
●
●
●
●
●
●
●●
●
●●
●
●
●
●
●
● ●
●
●●●
●
●
●
●●
●
●●●
●
●
●
●●
●
●●
●
●
● ●●
●
●
●
●
●
● ●
●
●●
●
●
●
●
●
●
●
●●
●
●
●●
●
● ●
●
●
●●
●
●
●
●
●●
●
●
●
●●●
●
●
●●
●
●
●●
●
●
●
●
● ●
●
●
●
●
●
●●
●
●
●
●
●●●
●●
●
●
●●
●●
●
●●
●
●
●
● ●
●
●
●●
●
●
●
●●
●
●●
●
●
● ●
●
●
●
●
●
●
●●
●
●
●
●
●●●●●
●●
●●
●
●●
●
●●
●
●
●
●●
●
●
●
●
●●
●
●
●●
●●
●
●
●
●
●
●
●
●●●
●●
●
●
●
●
●●
●
●
●
●
●
●
●●
●
●
●
●
●●●
●●●
●
●●
●
●
●
●
●
●
●
●
●
●●
●
●
●●
●
●
●
●
●
●●
●●
●
●
●
●
●
●
●●
●●
●●
●
●
●
●●●
●
●
●●
●
●
●
●●●
●
●
●
●
●
●
●
●
●
●●
●
●
●
●●
●
●
●●
●
●●
●
●
● ●
●
●
●
●
●
●
●
●●
●
●●●
●
●
●●
●
●
●● ●
●
●
●
●●
●●●
●
●
●
●
●●
●●
●
●●
●
●●
●●
●
●
●●
●●
●●
●
● ●
●
●
●
●
●
●
●●
●
●
●
●
●
●
●●
●●
●
●
● ●
●
●●
●
●●
●
●
●
●●
●●
●●
●●
●
●
●●●
●●●●●●
●
●
●
●
●●
●
●
●
●
●
●
●●
●
●
●
●
●
●●
● ●
●●
●
●●●
●
●●
●
●
●
●
●
●
●
●
●
●●
●
●
●●●
●
●●
●●
●
●
●
●
● ●● ●●
●
●●
●
●
●●●
●
●●
●
●●●●●
●●
●
●
●
●
●
●●
●
●
● ●
●●
●
●
●
●
● ●
●
●
●
●
●
●
●
●
●●
●●
●
●●● ●
●
●
●
●
●●
●
●
●●
●
●
●
●
●
●
● ●
●●●
●
●●
●
●
●
●
●●
●
●●
●
●●
●
●
●●
●
●
●
●●
●
●
●
●
●
●
●
●
●
●
●●●
●
●
●
●●
●
●
●
●●
●●
●
●
●
●
●
●
●●
●
● ●
●●●
●
●●
●
●
●
●●
●
●
●●
●●
●
●
●●
●●
●
●
●
●
●●●●
●
●
●
●
●●
●
●●
●
●
●
●
●●
●
●
●
●●
●
●
●●
●●
●●
●
●
●
●
●
●
●
●●
●●
●
●
●●●
●●●
●
●
●
●
●
●●
●●
●
●
●●
●
● ●●
●●
● ●
●●●●
●
●
●
●
●
●●
●
●
●●
●
●
●
●
●●
●●
●
●
●
●
●●
● ●
●●
●
●
●
●
●
●
●●
●
●
● ●
● ●●
●
●
●
●
●
●
●●
●
●
●
●●
●●
●
●
●
●●●
●
●
●
●
●
●●●
●●
●
●
●
●
●
●●
●●●●● ●
●●●
●
●
●
●
●
●
●
●
●●
●
●
●●
●
●
●●
●●●
●
●●
●
●
●
●●●
●
● ●●
●
●
●●
●
●●
●
●
●
●
●
●●
●
●
●●
●
●●●
●
●
●
●
●
●●
●
●●
●
●
●
●
●●
●
●● ●
●●
●
● ●
●
●
●
●
●●
●●
●●
●
●●●
●
●
●
● ●
●●●
●●
●
●●
●
●
●
●
●●●
●
●
●
● ●
●●
●
●
●
●
●●
● ●
●
●
●
●
●●●
●
●
●●
●
●
●
●
●
●
●
●
●●
●
●
●●
●●
●
●●●
●
●
●●
●
●
●
●
●
●
●
●
●
●
●
●
●
●
●
●
● ●
●
●
●
●
●●
●
●
●●
●●
●●
●
●
●●
●●
●
●●
●
●
●
●
●
●● ●
●●
●
●
●
●
●●
●
●
●●
●
●
●
●
●●
●
●
●
●
●
●
●
●
●●
●
●
●
●
●
●
●
●
●●
●● ●
● ●●
●
●●
●
●
●●
●
●●
●
●
●
●
●
●
●●
●
●
●
●●
●
●
●
●
●
●
●●
●
●
●●
●●
●●
●●
●
●
●
●●
●●
●
●● ●
●
●●
●
●
●
●
●
●
●
●
●
●
●
●
●
●●
●●
●
●●
●
●
●
●●
●
●
●
● ●
●
●●
●
●
●
●
●
●
●
●●●
●
●●●
●●
●
●
●
●
●
●
● ●
●●
●●
●
●
●
●●●
●●
●●●
●
●●
●
●●
●
●
●
●
●
●
●
●
●
●
●
●
●
●●
●
●
●
●
●
●
●
●
●
●
●● ●
●●
●● ●
●
●
●
●●
●
●
●●
●●●
●
●
●
●
●
●
●● ●
●
●
●
●●●
●
●●
●
●
●●
●
● ●
●
●
●●
●
●
●●
●●●
●
●
●●●
●
●
●
●
●
●
●
● ●
●
●●●
●
●●
●
●
●
●
●●
●
●
●
●
●
●●●●
●
●
●
●
●●
●
●
●●●
●●
●●●
●●
●
●
●
●
●
●
●
●
●
●●●
●
●
●●●
●
●
●
●●
●
●
●● ●
●
●
●
●
●
●●●
●●
●●●●
●●
●
●●
●
●
●
● ●
●
●
●
●
●●
●
●
●●
●
●
●
●
●●
●
●
●
●●
●●
●●
●
●
●●●
●
●
●●
●
●
●●●
●
●
●
●
● ●● ●
●
●
●● ●
●
●
●
●● ●●●
●
●
●
●●
●
●
●●
●
●● ●
●
●●
●●
●
● ●
●●
●
●
●
●●
●
●
●
●
●●
●
●●
●
●
●● ●●
●
●
●
●
●
●
●
●●
●
●●
●
●
●
●
●
●
●
●
●
●
●
●
●
●
●
●
●
●
●
●
●●●
●●
●
●
●
●
●
●●
●
●●
●
●●
●●
●●
●●
●
●
●●
● ●
●
●
●
●
●
●
●
●
●
●
●
●●
●
●
●
●●●
●●
●
●●
●
●
●
●
●●●
●
●●
●
●●●●
●● ●
●
●
●
●●
●
●● ●●●
●
●
●
●
●●
●
●
●
●
●●●
●
●●
●●
●
●
●
●
●
●●
●
●
●
●
●
●
●
●●
●●
●
●
●
●
●
●
●
●●
●●
●
●
●● ●
●●
●
●
●
●
●
●
●
●●
●
●
●●
●●
●●●
●
●
●
●
●
●●
●
●
●
●
●
●
●
●
●
●
●
●
●
●
●
●
●
●
●
●
●
● ●
●
●●●●
●
●●
●
●
●
●● ●●
●
●
●
●●
●
●
●
●
●●
●●
●●
●
●●
●
●
●
●
●
●
●
●●
●● ●
●
●●●
●●
●
●
●
●
●
●
●●
● ●
●
●
●
●
●
●
●
●●
●
●
●
●●
●
●
●
●
●●●
●
●
●
●
●
●●
●
●
●●
●●
●●●
●
●
●●
●●
●
●
●●
●
●●●
●
●
●
●●
●
●●
●●
●
●
●
●●
●● ● ●
●●●
●●
● ●●●●
●
●●
●
●
●
●
●
●
●
●
●
●●
●
●
●●
●
●
●
●
●
●●
●
●
●●●
●
●
●
●
●
●
●
●
●
●
●
●●●
●●
●
●
●
●●●
●●●
●
●
● ●
●●●
●
●
●
●
●
●
● ●
●●
●● ●
●
●
●
●●
●
●
●
●●
●●
●
●
●
●●
●
●
●
●●
●●
●●●
●
●
●
●
●
●
●
●
●●
●●
●●
●
●
●●
●
●
●●
●
●
●
●
●
● ●
●
●●
●
●●
●
●
●
●
●
●●
●
●
●●
●●●
●●
●
●
●
●
●
●●
Scale−Location1862
22952070
0.000 0.001 0.002 0.003 0.004
−5
05
Leverage
Sta
ndar
dize
d re
sidu
als
●
●●●
●●●
●
●
●
●●●
●
●
●● ●
● ●●
●
●
●●
●
●
●
●●●
●
●●●
●●
● ●
●●
●●● ●●●
●
●●●
●
●●
●
●
● ●●
●
●●●
●●
●●
●●●
●
● ●●
●
●●●
●●●
●
●● ●● ●● ●●●●
●
●
●
●●●
●●
●
●●● ●●
●● ●
●●
●●●
●●●
●
●●
●
●
● ●
●
●
●
●●
●
●●
●●
●●●
●
●
●
●
● ●● ●
●●●
●●
●●
●
●●
●
●●
●●
●●●●●
●
●
●●
●
●●
●
●●●●
●●
● ●●●●
●
●●
●●●
●
●●●
●● ●●●●
●
●
●●●● ●●
●
●
●
●●
●● ●
●●●●
●
●
●●●
● ● ●●
●●● ●
●
●● ●●●
●
●● ●●●
● ●
●
●
●●●
●●
●●
●● ●●
●●●
●● ● ●
●●
●●
●
●
●
● ●●● ● ●● ●● ●
●●
●●
●● ●
●●
●●
●
● ●
●●
● ●●●●
●
●●
●●
●●
●●
●
●
●●
●
●
● ●●
●●●
●
●●
● ●
●●
●
●
●●●
●●
●●
●●
●
●
●
●● ●●
●
●●●
●
●
●●
●●
●
●●
●●
●●●●
●
●
●●
●
●
●
●●●●●●
●●
●●
●●●
●●
●●
●
●●
●
●
●
●
●
●
●●
●
●
●●●●
●●
● ●●●
●●
●
●●
●●●
●
●●
●●●
●
●
●
●● ●●
●
●●
●
●●●● ● ●●
●●
●●
●
●
●●
●
●
●● ●●
●
●
●●●●
●●●
●
●●
●
●●
●●
●●
●●
●
●
●
●
●●
●
●
●●
●
●
●●
● ●
●● ●●
●●●
●
●●
● ●
●
●
●●●
●
●
●
●●
●●●
●
●●
●●
●
●●
●
●
●
●
●
● ●
●
●
●
●● ●●
●●
●●
●
● ●● ●
●
●●
●● ● ●●
●
●
●●
●●
●●●
●●●
●
●
●●
●●●
●●
● ●●
●
●
●
●
●●
●
●
●
●
● ●
●
● ●● ●●
●
● ●●
●●●
●
●●●●
●●● ●●
●
●
●●
●
●● ●
●●●
●
●●
●
●
●●●●●●
●●
●
●
●●●●●
●●
●
● ●●
●
●
●
●● ●
●
●●●
●●
●●
●
●●●●●
●●
●
●
●
●
●
●●●
●●
●●
●●
●●●●
●●
●
●
●
●
●● ●
●●
● ●●●
●
●
●●●
●●●●
●●●
●●●●
●●
●●●●
●●
●●
●●
●●
●
●
●●●●
●●●
●●●●
● ●●●
●●● ●
● ●
●●
●
●●●
●● ● ●●●●
●
●
●● ●●
●
●
●●
●
●
●●●●● ●● ●
●
●● ●●●● ●
●
●●
●●●●● ●
●●●● ●
●
●
●
●
●●●
●
●
●●
● ●●
● ●
●
●●
● ●
●
●●●
●
●● ●
●
●● ●
●●
●
● ●●●
●●
●●
●
● ●
●●●
●●
●
●●
●●
●●
●●●●
●●
● ●●
●
●●
●●
●● ●
● ●
●
●
●●
●
●
●
●
●●
●
●
●
●●● ●
●
●
●●●
●
●●●
●● ●
●●●●
●
●
●●
●
● ●●
●●
●●●
●● ●
●
●●
● ●●
●●
●●● ●●
●
●●● ●
●
●
●
●●
●
●
●
●●
●●
●
● ●●
●●● ●
●●
●● ●●●
●●
●
●
●
●
●●
●
● ●
●●
●●
●
● ●
●
● ●●
●
●●
●
●
●
● ●
● ●●●● ●
●
●●●
●
●●●
●
●●
●●
●●●
●●
●●
●
●●
●●
●●●
●●●
●
●
●●
●
●
●
●●
● ●
●
●
●
●
●
●
●●
●
●
●
●
●●
●●●
●●
●
●●●
●
●
●
●
●● ●●
●●
●●●
●
●●
●
●●
●
●
●
●●●
●
●
●●●●
●●●
●●●●
●
●●●
●
● ●
●
●●
●●
●
●●
●
●●
●
●●● ●●
●●●●
●●
●●
●
●
●
●
●
● ●●
●
●
●● ●
●●
●
●
● ●●
●●●
●
●
●●●●●
● ●●
● ●
●●● ●●
●
●●●●●
●
●●
●●●
●
●
●●
● ●
●●
●
●
●●
●
●
●●●●
●
●●
●●●
● ●
●
●●●
●●
●
●●
●
●●
●● ●●
●●
●●● ●
●●
●
●
●
●
●●
●●
●
●●●
●
●
●
●
●● ●
●●●●
●●●●
●●
● ●●●●●
●●
●
●●
●●
●●● ●
●
●
●
●●●
●
●
● ●●●
●●
●
●
● ●●●
●●
●
●●
●●●●●
●
●
●● ●●
●●
●
● ●●●●
●●
●
●
●
●
●●●
●
●●●
●
●●● ●
●●●
●
●
●
●●●
●
●
●
●●
●
● ● ●●
●●
●●
●
●
●●●
●●●
● ●●
●
●●
●●●
●
● ●
●
● ●●●●●●
●
●
●●●●
●
●
●
●●●●●●
●
●
●
●
●
●
●●
●●
●
● ● ●
●
●● ● ●
●
●●
●●●
●
● ●
●●●
●●
●●
●● ●
● ●● ● ●●●●●●●
●
●
●●
●
●●●●●●
●
●
●●
●●
●●●
●
●●
●●
●●
●●
●●
●
●● ● ●●
●●
●
●●
●
●
● ●●
●
●●
●●●●
● ●
●
●●●
●
●
●
●
●●
●
●●
●
●●
●
●● ●
●
●
●●●
●
●●
●
●
●●
● ●●
●●
●●
●
●●
●●
●
●
● ●
●●
●
●
●●
●●
● ●●
●●●
●
●
●●●
●
●
●
● ●●●
●●●
●● ●●● ●●
●●
●
●●
●
●
●●●
●●
●●●
●●
●● ●
●
●●
●
● ●● ●●
●●
●
●
●● ●●
●● ●●
● ●●●
●●● ●●●
●
●●●●
●●
●●
●●
●●
● ●●●
●●
●
●
●●
●●●● ●●
●
●
●●
●
●●
●●
●●
●● ●
●●●
●●● ●
●
●●
●● ●● ●●
●●
●
●●
●
●●
●
●●
●●
●●● ●
●
●
●
●
●
●●●
● ●●
●
●
●
●
● ●
●
●
●●
●
●●● ●●●
●●● ●
●●● ●●● ●● ●
● ●●●
●●
●●●●
●
●●●● ● ●
●●●
●●● ●
●●●●
●
●●
●●
●
●●
●●●
●●●
●
●
●●
●●
●● ●
●●
●●
●●●●
●●
●
●●
●●●●
●●●●
●
● ●●
●● ●● ●
●●
●●
●
●●
●●
●● ●
●●
●●●●
●●
●
●● ●●
●●●
●●
●●●
●●●●
●
●
●●
●
●●
●●
●● ●●
●
●●
●
●
●
●●
●●●
●
●
●
●
●
●
●
●
●
●●
●●
●●●
● ●
●●● ●
●
● ●●
●●
●
●●
●●
●●
●
●●●
●●
●●● ●
●
●
●
●● ●●●●●● ●● ●●
●
●
●●●
●●
●●●
●
●●● ●●●
●
●●
●
●●●
●
●●●● ●
●
●●●●
●
●●
●
●
●
●●●
●
● ●●
●●
●
●●● ●●
●
●●●●●
●●
●●●
● ●● ●●
●●●●●●
●●●
●● ●
●●●●
●●●
● ●●●●
●●●●
●
●
●
●●
●
●
●
●●●
●
●●
●●
●●
●
●● ●
●
●●
●
●●●●●
●●●●
●
●● ●●
●●●
●
●● ●
●●●
●●
●
●
● ●●●● ●●
●
●●
●●●
●●● ●
●
●
●●●
● ●
●
●
●
● ●●
● ●●● ●
●●
●● ●
●●
●● ●
●
●●●
●
●●
●●
●●
●
●●
●
●● ● ● ●
●
●
●●● ●●
●
●
● ●
●
●
●●
●
●●●
●●●
●
●●● ●
●
●
●
● ●●●● ●
●
●●●
●
● ●
●●
●●
●
●
●●
●●
●
●●
●
●
●
●●
●
●
●●
●
● ●
●
● ●
●●
●●
●●
●●
●
●●
●
●
●
●●
●
●●●●
●
●
●●●
●
●● ●
●
●
● ●
●
●●
●
●
●
● ●●
●
●●
●
●
●●● ●● ●●
●●
●
●
●●
●● ●
●
●●●
●
●
●●
●●
● ●
●●●
●
●
● ●
●
● ●●
●
●
●● ●
●
●
●●
●●
●
●●
●●
●●●
●
●●
● ●●●
●●
●● ●●
●● ●
●
●●●●
● ●●
●● ●●
●●●
●
● ●
●●
●● ●● ●●
●
● ●●●
●
●●●●
●●●●
●●
●● ●●
●
●
●●
●
●● ●
●●●
●
●●● ● ●
●
●●●
●●
●
●●
●
●●●●●
●
● ●●●
●●
●
●
●
●
●
●
● ●
●
●
●
●●
●
●
●
●●●
●●
● ●
●
●
●
●
●
●
●●●
● ●●●
●●
●
●
●
●●●●●
●
●●
●●
●
●
●● ●●● ●●
●
●
●
●●
●●●
● ●●
●●
●●●
●
●
●●
●●●
●●●●
●
●●
●
●●
●●
● ●
●●
●
●●
● ●●
●
●●
●●●
●●● ●●●●
●
●●
●
●
●
●●
●
●●
●●
● ●
● ●
●● ●
●●
●●
●●
●●
●
●
●● ●●
●
●
● ●●●
●
●
●
●●
●●●●●
●
●
●
●●
●●
●
●● ●●
●
●
●●
●●
●●
●●
●
●
●
●●
●
●
●
●
●●
●● ●●● ●●
●●
●●●●
●●●
●
●●●
●●
●●● ●●●
● ●●●
●
●●●
●
●●
●
●●
●● ●●● ●
●
●
●
●●
●●●●
●●●
●●
●●
●
●
●●
●●● ●● ●●
●
●●
●●● ●
●●
●
●
●●
●
●
● ●●● ●●● ●
●
●
●●
●●
●
● ●● ●●
●● ●●
●
●●●●
●●
●●
●
●● ●● ● ●●
●
●●
● ●● ●●
● ●
●
●
●
●
●
●● ●
●●
●●
● ●
●
●
●●
●
●
●●
●●●
●
●●●●
●●
●
●
●
●
●●
●
●●
●●
●●●
●●
●● ●●
●●
●
●●
● ●●
●
●
●
●●
●●
●
●● ●
●
●●
●●
●●
●●
●●
●●
●
● ●
●
●●●●
●●
●
● ●●●● ●●
●
●●
●●
●
●
●
●●
● ●●●
●
●
●●
●●
●●
●
●●●●●
●
●
●●
●
●
●●
●●
●●
● ●
●
●
●●
●
●●● ●
●
●
●
●
●●
●
Cook's distance
Residuals vs Leverage
1862
22952035
Figure 6: Q-Q plot of the polynomial model.
variance and non-normal distribution. If the two distributions are similar, thenthey would show a constant variance with normally distributed data. We em-ployed Q-Q plots for this purpose (omitted for space), and they confirmed thatthe data follows a normal distribution, validating our assumption, and thatnon-linear transformation works well for our model fit. In the Q-Q plots of ourpolynomial model shown in Fig. 6, the points lie on the identity line indicatingthat the data indeed follows a normal distribution, validating our assumption.This also confirms that the non-linear transformation works well for our modelfit.
An interesting finding is that the inclusion of an additional predictor (dayof the week) has little but not significant improvement as reflected by R2 inthe polynomial model. Nonetheless, it does allow us to be able to predict theoptimal deployment time at a day granularity level which is a good contributionto support decision making.
In summary, we explored the possibility of fitting the data with both linearand non-linear models. We found a non-linear transformation of the predictorsis more suitable due to the non-linear association of data. Model assessmentwas done through cross-validation using the MSE which estimates the test er-rors associated with the learning method to evaluate its performance. We ap-plied regression diagnostics to check the assumptions for linear regression withnon-linear transformation of the predictors. Non-linear multivariate polynomialmodel outperformed the linear, ridge and Lasso models as indicated by differentfactors.
14

6 Conclusion
Customers are faced with a myriad of choices for deploying applications in thecloud. Supporting the customer decision making is an under-researched area.Furthermore, there is little understanding of how to implement adaptive decisionmaking that can react to changes in context.
In this paper, we explored the role of machine learning to provide such adap-tive decision making. An overall architecture, called Daleel, was proposed (§3)and an empirical evaluation carried out to investigate how to support the keyphases of analysis and learning in preparation for the subsequent planning. Theanalysis focuses on decision making around executing a particular applicationin a given cloud provider. Specifically, our empirical study focused on decisionmaking around the selection of instance types for the execution of VARD, anapplication from the field of computational linguistics. The results show that:
a. The performance of instance types can vary significantly over time and isoften counter-intuitive (§4).
b. Machine learning can be highly effective in making performance predictionsbut care is required to select the right approach (§5).
Looking at the latter aspect in more detail, we explored the possibility offitting the data with both linear and non-linear models. We found that a non-linear transformation of the predictors to be much more suitable. This is dueto the inherent non-linear association of the data; we found, through extensiveexperimentation, significant skewness in the performance of different AmazonEC2 instances.
The results from this initial study are encouraging and we are convincedthat machine earning has a central role to play in optimising cloud deploy-ments. Our first avenue of future work is to consider other application types,such as memory-intensive, processor-intensive, data-intensive and combinationsthereof. The Knowledge Base in our Daleel architecture will be used for fur-ther investigation of application behaviour and resource utilisation patterns inorder to predict based on different clusters of application types. Second, weplan to incorporate enhanced decision making methods, including considera-tion of multi-criteria decision making. Finally, extending the work to considerthe management of cross-cloud environments including consideration of policiessuch as cloud-bursting in hybrid cloud infrastructures [8]. Cloud brokerage isthe key application area here, but it still is in its infancy especially in terms ofpractical experience [7].
References
[1] A. A. Bankole and S. A. Ajila. Predicting cloud resource provisioningusing machine learning techniques. In Canadian Conference on Electricaland Computer Engineering (CCECE), pages 1–4. IEEE, May 2013.
15
[2] A. Barker, B. Varghese, and L. Thai. Cloud services brokerage: A surveyand research roadmap. CoRR, abs/1506.00485, 2015.
[3] A. Baron and P. Rayson. VARD2: A tool for dealing with spelling variationin historical corpora. In Postgraduate conference in corpus linguistics, May2008.
[4] J.-P. Brans and B. Mareschal. PROMETHEE methods. In Multiple Crite-ria Decision Analysis: State of the Art Surveys, volume 78 of InternationalSeries in Operations Research & Management Science, chapter 5, pages163–186. Springer, 2005.
[5] E. Caron, F. Desprez, and A. Muresan. Forecasting for grid and cloudcomputing on-demand resources based on pattern matching. In Conferenceon Cloud Computing Technology and Science (CloudCom), pages 456–463.IEEE, 2010.
[6] D. Duplyakin, P. Marshall, K. Keahey, H. Tufo, and A. Alzabarah. Rebal-ancing in a multi-cloud environment. In 4th Workshop on Scientific CloudComputing, pages 21–28. ACM, 2013.
[7] Y. Elkhatib. Building cloud applications for challenged networks. InR. Horne, editor, Embracing Global Computing in Emerging Economies,volume 514 of Communications in Computer and Information Science,pages 1–10. Springer, 2015.
[8] Y. Elkhatib, G. S. Blair, and B. Surajbali. Experiences of using a hybridcloud to construct an environmental virtual observatory. In Proceedings ofthe 3rd Workshop on Cloud Data and Platforms (a EuroSys 2013 work-shop), pages 13–18, April 2013.
[9] J. Gao. Machine learning application for data center optimization. Tech-nical report, Google, 2013.
[10] S. Gupta, V. Muntes-Mulero, P. Matthews, J. Dominiak, A. Omerovic,J. Aranda, and S. Seycek. Risk-driven framework for decision support incloud service selection. In International Symposium on Cluster, Cloud andGrid Computing (CCGrid), pages 545–554. IEEE/ACM, May 2015.
[11] J. Hadley, Y. Elkhatib, G. Blair, and U. Roedig. Multibox: Lightweightcontainers for vendor-independent multi-cloud deployments. In R. Horne,editor, Embracing Global Computing in Emerging Economies, volume 514of Communications in Computer and Information Science, pages 79–90.Springer, 2015.
[12] T. Hastie, R. Tibshirani, and J. Friedman. The elements of statisticallearning. Springer, seventh edition, 2013.
16
[13] S. Islam, J. Keung, K. Lee, and A. Liu. Empirical prediction models foradaptive resource provisioning in the cloud. Future Generation ComputerSystems, 28(1):155–162, 2012.
[14] G. James, D. Witten, T. Hastie, and R. Tibshirani. An Introduction toStatistical Learning: With Applications in R. Springer, fourth edition,2014.
[15] E. Kamateri, N. Loutas, D. Zeginis, J. Ahtes, F. D’Andria, S. Boc-coni, P. Gouvas, G. Ledakis, F. Ravagli, O. Lobunets, and K. Taraba-nis. Cloud4SOA: A Semantic-Interoperability PaaS Solution for Multi-cloudPlatform Management and Portability, volume 8135 of LNCS, chapter 6,pages 64–78. Springer, 2013.
[16] J. Kupferman, J. Silverman, P. Jara, and J. Browne. Scaling into the cloud.Technical report, University of California, Santa Barbara, 2009.
[17] H. Liao and Z. Xu. A VIKOR-based method for hesitant fuzzy multi-criteriadecision making. Fuzzy Optimization and Decision Making, 12(4):373–392,2013.
[18] R. T. Marler and J. Arora. The weighted sum method for multi-objectiveoptimization: new insights. Structural and Multidisciplinary Optimization,41(6):853–862, 2010.
[19] J. R. S. C. Mateo. Weighted Sum Method and Weighted Product Method,chapter 4, pages 19–22. Green Energy and Technology. Springer London,2012.
[20] A. Menychtas, K. Konstanteli, J. Alonso, L. Orue-Echevarria, J. Gorrono-goitia, G. Kousiouris, C. Santzaridou, H. Bruneliere, B. Pellens, P. Stuer,et al. Software modernization and cloudification using the ARTIST mi-gration methodology and framework. Scalable Computing: Practice andExperience, 15(2):131–152, 2014.
[21] T. Mitchell. Machine Learning. McGraw Hill, 1997.
[22] I. Patiniotakis, Y. Verginadis, and G. Mentzas. Preference-based cloud ser-vice recommendation as a brokerage service. In 2nd International Workshopon CrossCloud Systems, pages 5:1–5:6. ACM, 2014.
[23] P. Pawluk, B. Simmons, M. Smit, M. Litoiu, and S. Mankovski. IntroducingSTRATOS: A cloud broker service. In Conference on Cloud Computing(CLOUD), pages 891–898. IEEE, 2012.
[24] D. Petcu, G. Macariu, S. Panica, and C. Craciun. Portable cloudapplications–From theory to practice. Future Generation Computer Sys-tems, 29(6):1417–1430, 2013.
[25] RightScale. 2015 state of the cloud survey. Technical report, 2015.
17
[26] F. Samreen, G. S. Blair, and M. Rowe. Adaptive decision making in multi-cloud management. In 2nd International Workshop on CrossCloud Systems,pages 4:1–4:6. ACM, Dec. 2014.
[27] R. Tibshirani. Regression shrinkage and selection via the lasso. Journalof the Royal Statistical Society. Series B (Methodological), 58(1):267–288,1996.
[28] A. N. Tikhonov and V. Y. Arsenin. Solutions of ill-posed problems. WHWinston, 330, 1977.
18