dalit children in rural india: issuesdalitstudies.org.in/wp/0905.pdfdalit children in rural india:...
TRANSCRIPT


Dalit Children in Rural India: IssuesRelated to Exclusion and Deprivation
Nidhi Sadana
Working Paper Series
Indian Institute of Dalit Studies
New Delhi
Foreword
Indian Institute of Dalit Studies (IIDS) has been amongst the firstresearch organisations in India to focus on development concerns ofthe marginalised groups and socially excluded communities. Over thelast six years, IIDS has carried-out several studies on different aspectsof social exclusion and discrimination of the historically marginalisedsocial groups, such as the Scheduled Caste, Scheduled Tribes andReligious Minorities in India and other parts of the sub-continent. TheWorking Paper Series disseminates empirical findings of the ongoingresearch and conceptual development on issues pertaining to the formsand nature of social exclusion and discrimination. Some of our paperscritically examine inclusive policies for the marginalised social groupsin Indian society as well as in other countries.
This Working Paper “Dalit Children in Rural India: Issues Related toExclusion and Deprivation” draws evidence of the economic and socialexclusion faced by the Dalit population in rural India from the officialdata sets of NSS and NFHS. The disaggregated data across social groupspresented in the paper reveals the extent of disparities between Dalitand non-Dalit children in India with regard to their access to educationand health services. The paper shows that rates of school drop out,lower access to health services and incidence of child labour are highamong Dalits as compared to non-SCs/STs. The paper further suggeststhat efforts need to be focused on addressing the specific issues relatedto social exclusion and deprivation of Dalit children in the spheres ofeducation and health services, so that they will have better access tothese services.
Indian Institute of Dalit Studies gratefully acknowledges UNICEF forfunding this study and Christian Aid (India) for funding the publicationof the Working Paper series. We hope our Working Papers will be helpfulto academics, students, activists, civil society organisations andpolicymaking bodies.
Surinder S. Jodhka Director, IIDS

Contents
1. Introduction 1
2. Discrimination Faced by Dalit Children 3
3. Inequality and Social Exclusion Faced by Dalit Children 4
3.1 Literacy and Level of Education 5
3.2 Poverty Level and School Attendance 6
4. State of Health and Nutrition of Dalit Children 8
4.1 Mortality Rates 9
4.2 Place of Delivery and Type of Assistance Provided 9
4.3 Child Morbidity and Treatment 11
4.4 Access to Health Facilities for Dalit Childrenwith ARI Symptoms 12
4.5 Access to Health Facilities for Dalit ChildrenSuffering from Fever & Diarrhoea 13
4.6 Awareness Level of Treatment across Social Groups 14
4.7 Access to Health Facilities in Case of Diarrhoea 15
5. Child Immunisation 16
6. Nutritional Deficiency 18
7. Conclusion 18
Endnotes 21
Annexure I 25
Annexure II 33
References 39

Dalit Children in Rural India:Issues Related to Exclusion and Deprivation
Nidhi Sadana
1. Introduction
The Dalit population constitutes India’s most vulnerable group, estimated at138 million people. Dalits are also referred to sometimes as Scheduled Castes(SCs) after a schedule drawn up by the Government of India, and are placed atthe bottom of the social and economic hierarchy of the caste system1. Due totheir place within the caste system, this group has suffered discriminationand exclusion in all its dimensions for centuries. This group has been historicallydeprived access and entitlements not only to economic rights but also to socialneeds such as education, health and housing. Discrimination and exclusion inaccess to sources of income (land, capital and education) has led to high levelsof economic deprivation and poverty among SCs.
Dalits experience an exceptionally high dependence on manual wage labour fortheir source of income due to restriction in access to fixed capital assets, lowlevel of skill due to restrictive access to education and high unemployment,underemployment and low wage rates due to discrimination in the labourmarket2. Research indicates that in the post-liberalisation period (1999-2000),35 per cent of Dalits in India were living below the poverty line, as comparedwith 21 per cent among the non-SCs/STs, termed in the data as ‘Others’.
Empirical evidence indicates that children from the SCs social group sufferfrom exclusion and discrimination as well in terms of education and access tohealth services. A child’s well being with respect to her health, nutrition andeducation is a consequence of complex interactions of multiple determinants.With respect to health and nutrition, ‘dietary intake and infection’3 are somecrucial determinants. These two, in turn, are governed by the level of foodsecurity in the household, access to health resources and the adoption of‘appropriate child care behaviour’4. One of the basic aspects that govern thelevel of households’ food security is the economic capacity of the household.

2
Indian Institute of Dalit StudiesVolume III, Number 05
However, in India, the position of a family within the social/caste hierarchyalso determines its access to capital assets, income, employment, educationand health services. In the present time, “caste-based customary laws relatingto property rights, employment, wage, education has been replaced by a moreegalitarian legal framework, under which the untouchables have an equal access.However, despite this change in property rights the access of untouchables tothe income earning assets, such as agricultural land and other capital assetshas not improved much”.5
This study sets out to examine and provide evidence of the economic andsocial exclusion and inequalities faced by the Dalit population in rural India. Itanalysis disaggregated data based on social groups that highlight the extentof disparities prevalent among Dalit children in India with particular emphasison access to education and health services. With the help of the disaggregateddata, this study aims to develop focused strategies for intervention. In specificterm, empirical evidence is provided to the following indicators of discriminationand exclusion in economic and civil spheres that Dalits and their children sufferin rural areas of India. They are:
· access to capital assets like agricultural land;
· nature of occupation;
· level of employment;
· level of poverty;
· level of literacy and education of Dalit parents and their children;
· relationship between poverty and status of school attendance(attending, drop-out and never attended);
· health and nutritional status of Dalit children and mothers;
· level of access to health services and programme initiated by thegovernment/public institutions;
· level of basic amenities, e.g. housing and drinking water.
The analysis is based on two official sources, namely National Sample Survey(NSS) and National Family Health Survey (NFHS). The evidence on economicdiscrimination that Dalits suffer is largely derived from the NSS data whileNFHS gives data on exclusion in health services.

3
Dalit Children in Rural India: Issues Related to Exclusion and DeprivationNidhi Sadana
2. Discrimination Faced by Dalit Children
The SCs constitute about 17 per cent of India’s population as per the Census2001, and almost 80 per cent live in the rural areas spread all over the country.With respect to the occupation pattern, NSS provides data by household typewhich gives information on the nature of work which fetched maximum incometo the household during the reference period of 365 days preceding the date ofsurvey. In this context, NSS divides the households into two broad categories:self-employed and wage labour households. While the former is a measure ofaccess to capital assets like agricultural land and non-land capital assets (fromwhich historically Dalits have been debarred), the latter indicate continuingdependence on the traditional occupation of wage labour.
According to the data (see Annexure II A), in 2000, of the total SCs householdsabout 17 per cent pursued cultivation as a self-employed occupation while 12per cent were employed in some kind of non-farm self-employment activities(or business). In rural areas thus, about 28 per cent of SCs households hadacquired some access to fixed capital assets. This was still very low in proportionwhen compared to households belonging to ‘other’ social group while 56 percent of the ‘other’ households were self-employed in agriculture and non-agricultural activities.
Limited access to fixed capital assets for the SCs population has led to aexceptionally high dependence on manual wage labour for their source of income.As the Figure 1 indicates, in 2000, the wage labour households (agriculturaland non-agricultural labourer) accounted for 61 per cent of all SCs householdsin rural areas compared to 25 per cent for ‘other’ households.
Figure 1: Occupational Pattern across Social Groups
0
10
20
30
40
50
60
Self-Employed inAgriculture
Self-Employed inNon-Agriculture
Agricultural Labourer Other Labourer Others
Economic Activities
Pro
por
tio
n o
f H
ou
seh
old
s (%
)
SC
ST
OBC
Others

4
Indian Institute of Dalit StudiesVolume III, Number 05
With respect to employment and unemployment rates, the SCs workers notonly suffer from low level of employment but also face underemployment.Table III A in Annexure 1 indicates that in 2000, the current daily status6
employment rate in rural areas was 46 per cent for SCs male workers, comparedwith 48 per cent for ‘other male workers’.
Similarly, unemployment rates based on current daily status is higher for SCsmale workers (5 per cent) as compared to ‘other’ male workers (3.5 per cent).Further, data on wage earnings reveals disparities between SCs wage labourand ‘other’ labour7; in 2000, the average weekly wage earnings of an SCsworker was Rs. 174.50 as compared to Rs. 197.05 for ‘other’ workers. Highincidence of wage labour coupled with high rate of under-employment and lowwage earnings results in high poverty rates. In 2000, about 35.43 per cent ofthe SCs were below poverty line in rural areas as compared to 21 per centamong ‘others’ (see Table VI A in Annexure I) .
In education, SCs have suffered from exclusion and discrimination which hasresulted in wide gaps in literacy rates and level of education between themand the ‘others’. Data in Table VII A (see Annexure I) indicates that in 2000,literacy rates among the male SCs was 52 per cent compared to 76 per centamong the ‘others’ social group. The literacy rates were particularly low amongthe females (24 per cent), two times less as compared to women from ‘other’social group. The general level of education is also lower among the SCs ascompared to ‘others’. For instance, in 2000, among the SCs the proportion ofilliterate and literate up to primary level together constitute 73 per cent andonly one-third of them possess education beyond the middle school level.Further, 15 per cent of the SCs were educated up to middle level while thisproportion was higher (21 per cent) for the ‘others’. Similarly, as we go up theeducation ladder, at each level, the percentage of educated among the SCs islower as compared to the non-SCs/STs Table VII A (see Annexure I). Additionally,it is also observed that the disparity between SCs and others in the educationalbackground is the highest at the higher level of education. The low educationlevel among the SCs obviously affects their capacity to participate in bettereconomic activities such as regular salaried jobs8.
3. Inequality and Social Exclusion Faced by Dalit Children
Discussion in the preceding section provides empirical evidence on caste- basedexclusion and discrimination faced by Dalit Children in multiple realms of theIndian society. The evidence revealed significant disparities across social groups

5
Dalit Children in Rural India: Issues Related to Exclusion and DeprivationNidhi Sadana
in the level of deprivation in terms of poverty and its factors like access tocapital assets, employment, wage earnings and education as estimate in theyear 2000. Dalits were the disadvantageous group in each factor that determinesthe level of poverty. For instance, access to capital assets like land is particularlylow among the SCs due to their traditional exclusion from ownership of property.This feature in turn determines the ‘kind’ of occupation that is pursued: limitedaccess to fixed capital assets for this social group has led to a exceptionallyhigh dependence on manual wage labour for their source of income.
Moreover, SCs also suffers from high rate of under-employment and low wageearnings; hence the cumulative impact of these handicaps is reflected in highdegree of poverty. Historically, Dalits have also faced restrictions in attainingeducation which is reflected in their low literacy rates and level of education.Low level of human capital among the SCs affects their capacity to participatein better economic activities such as regular salaried jobs and leads todependence on irregular daily wage employment. Empirical evidence indicatesthat children from the SCs social group suffer from exclusion and discriminationin terms of education, incidence of child labour, good health and access tohealth services.
3.1 Literacy and Level of Education
With respect to education, data indicates a wide gap between the Dalits andnon-SCs/STs in terms of school attendance. At the aggregated level in 2000,70 per cent of children in the age group of 5-14 were enrolled in school in ruralIndia. The drop-out rate, though, was about 4.5 per cent an alarming 26 percent of the children never attended school. The school drop-out rate is relativelyhigh (5.2 per cent) among the SCs and the proportion of children who havenever attended school (36 per cent) is also relatively higher. The ratio of school-drop out, as well as, the ratio of those who have never attended school in ruralIndia for the other backward caste is lower than the SCs social group.
As against this, the ratio of OBCs children who attend school (70 per cent) ishigher than the SCs social group. With respect to the ‘others’ social group,Table VIII A in Annexure 1 clearly indicates that the school attendance rate isthe highest (78 per cent) for this social group as compared to the SCs and theOBCs. As a result, the drop-out rate is also lower (4 per cent) among them ascompared to the SCs and the OBCs social group.
Thus, the data suggest that at the aggregated level the school attendancerates in rural India are relatively higher than the drop-out rates. A comparison

6
Indian Institute of Dalit StudiesVolume III, Number 05
of the data across social groups clearly indicates that the ‘others’ social grouphas the highest school attendance rates and the lowest drop-out rates ascompared to the SCs and the OBCs. Conversely, the SCs segment has the highestdrop-out rates and the lowest enrollment ratio as compared to the OBCs andthe ‘others’ group. The SCs also has the highest proportion of children whohave never attended school. A relatively high drop-out rate and non-enrollmentamong the SCs indicates that ‘economic deprivation and poor social conditionscoupled with inadequate support from the government and agencies at theschool level has created extremely unfavourable conditions for children fromthese sections of the society to continue studies at the school level(Thorat1999, p167).
3.2 Poverty Level and School Attendance
The inter-linkage between economic deprivation and poverty and non-attendance/drop-out ratio is more directly confirmed by the data presented inTable IX A in Annexure I. It shows the distribution of children attending school,drop-outs and never attended by Monthly Per Capita Expenditure class (MPCE)in rural areas. It reveals that with an increase in the MPCE class from Rs.225to Rs.950 and above, the proportion of those attending school from 65 percent to 92 per cent, and the proportion of those never attended school declinedquite systematically from 30 per cent to 5 per cent. Among the relatively lowerMPCE classes the drop-out rate as well as the proportion of children neverattended school were generally of high order. In fact, little less than 60 percent (see Table XI A) in Annexure I) of the total drop-outs in rural areas comefrom the MPCE category of less than Rs.340, which also happens to be therange closer to the poverty line limit of Rs 327 MPCE in 1999-2000.
With respect to comparative analysis across social groups, the ratio of drop-outs among those living below the poverty line is higher (60 per cent) for SCsas compared to their counter parts from the non-SCs/STs social group (37 percent). Similarly, the proportion of children who have never attended schoolliving below the poverty line is higher for the SCs as compared to their counter-parts from the non-SCs/STs (see Table IX A (iii) and IX A (vi) in Annexure I).The overall pattern, thus, is of higher drop-out and non-attendance rates forthe schedule caste social group as compared to non-SCs/STs social group withthe gap being especially wide in the lower MPCE categories. The data in theTables 1 and 2 and Tables IX A (vii) to IX A (Vii) - in Annexure I provides evidenceof exclusion that Dalit children face as a higher proportion of these childrendrop-out or never attend school as compared to the children of non-SCs/STs

7
Dalit Children in Rural India: Issues Related to Exclusion and DeprivationNidhi Sadana
social groups from similar economic background, i.e. poor and agriculturallabour households.
A further search for the reason for not attending school shows that 87 per centof the children in rural areas indicated non-economic reasons such as meetingthe labour shortage in the household, acquiring skills, lack of school facilities,meeting own expenses for not currently attending school etc. On the otherhand, only 13 per cent of the children reported economic reason, i.e. lack ofaffordability as the main cause for not attending school. Across social groupsas well non-economic reasons were stated to be more important for non-attendance in schools. The reasons cited in the surveys conducted by the NSSOare not comprehensive and they need to be further researched through theprimary surveys.
Table 1: Status Of School Attendance by Poverty Level: SCs
Poverty Level School Attendance Attending School Dropped-Out Never Attended Poor 48.89 56.54 69.71 Non-Poor 51.11 43.46 30.29 Total 100.00 100.00 100.00 Source: Employment and Unemployment Situation of Social groups in India, 1999-
2000
Table 2: Status Of School Attendance by Poverty : Others
Poverty Level School Attendance Attending School Dropped-Out Never Attended Poor 23.78 32.11 47.22 Non-Poor 76.22 67.89 52.78 Total 100.00 100.00 100.00
Source: Employment and Unemployment Situation of Social groups in India, 1999-2000
It was further observed the incidence of child labour was much higher amongSCs followed by OBCs social group. At the all-India level, of the total populationof children in the age-group 5-9 years, about 0.6 per cent were working. Acrosssocial groups, the incidence of child labour was 1.6 per cent for SCs, 0.37 percent for Sts, 0.57 per cent for OBCs and 0.36 per cent for ‘others’. Similarly, inthe age-group of 10-14 years, the incidence of child labour was the higheste.g.15 per cent for the SCs followed by the STs (8.5 per cent), OBCs (8 percent), and others (5 per cent).

8
Indian Institute of Dalit StudiesVolume III, Number 05
With respect to gender differences, incidence of child labour in both the age-groups is higher for girls than for boys. This is true for all the social groups.Moreover, girls not only are employed as labourers but they also work inhousehold chores (Table XI(ii) in Annexure 1).9 In rural India, close to 13 percent of the children in the age-group 10-14 years were engaged in the householdchores at the aggregated level (Table XII (ii) in Annexure 1). Among the socialgroups it is observed that the STs has the highest incidence of child work (16per cent), followed by SCs (13.5 per cent). Comparatively, the least incidenceof child work is observed in the ‘others’ social group where about 9 per cent ofthe girls were engaged in household chores.
It is further observed incidence of children who are neither studying nor working(‘nowhere’ children) is higher for girls (17 per cent) than for boys (14 percent). Across social groups, a higher proportion of girls as compared to boysare neither studying nor working in rural India. In the literature10 ‘nowhere’children in the rural setting are assumed to be working in some form, especially,if they are girls. In fact, the data indicate that two-fifth of the SCs girls workin some form if the proportion of child labour and child work is added up with‘nowhere’ children category.
4. State of Health and Nutrition of Dalit Children
As the saying goes “Health is Wealth” and rightly so as ill health may lead toloss of income especially to poor families living on daily income. Importance ofhealth cannot be over stated especially for children as it leads to betterattendance in school and to higher level of knowledge attainment, which leadsto better paid jobs and larger benefits to future generations. The WHO hasdefined health as ‘a state of complete physical, mental, and social well beingand not merely absence of disease or infirmity’. This definition was acceptedin the Alma Ata Declaration of Health by the 31st World Health Assembly in1978, according to which primary healthcare is a key to attaining ‘Health forall by 2000’.
Has that happened for Dalits and their children? What is the health status ofDalits in comparison to that of non-Dalits? Do Dalits have equal access to thehealthcare facilities as non-Dalits do? Do Dalit children under the age of 3 havean equal access to life saving vaccinations as non-Dalit children do? These area few questions that this section attempts to examine with a special focus onchildren especially girls in the rural areas of India.

9
Dalit Children in Rural India: Issues Related to Exclusion and DeprivationNidhi Sadana
4.1 Mortality Rates
Studies on nature of exclusion and discrimination faced by Dalit children inusing public health services in rural areas are very limited; however there isindirect evidence which is reflected in indicators related to health. Mortality,for example, is an important indicator of health status and it is seen in India,infant mortality rate for Dalit children is as high as 88 per 1000 as compared tochildren from the ‘other’ social group (69 per 1000). Moreover, a higher numberof Dalit children died in the first month of life and after the first month of lifebut before their first birthday when compared to children from the ‘other’social group (see Table 3).
Table 3 : Health Status Indicator for Children in Rural Indian(1998-99)
Health Status Indicators Dalits Tribes OBC Others All Infant Mortality Rate (IMR) 88.1 86.9 82.2 69.3 73 Neo-Natal Mortality 56.2 55.1 54.7 45.1 NA Post Neo-Natal Mortality Rates 31.9 31.8 27.6 24.2 NA Child Mortality Rate 43 48.8 32.7 25.6 31 Under Five Mortality Rate 127.3 131.4 112.2 93.1 101
Source: NFHS-2, 1998-1999
Infant Mortality Rate (IMR) for Dalits is higher than that of the STs and OBCswhile the ‘others’ have the least IMR. Similarly, a higher number (43 per 1000)of one year old Dalit children died before completing their 5th birthday ascompared to 25 children from the ‘other’ social group. High infant/childrenmortality levels in Dalit population indicate low infant survival which isdependent on factors related to care at birth some of which are place of delivery,type of assistance provided, major illnesses like pneumonia, fever, diarrhoeaand the most important of all access to immunisation. These importantindicators are examined in subsequent sections.
4.2 Place of Delivery and Type of Assistance Provided
Among the factors relating to care at birth which affects the chances of survivalof the new born, place of delivery and the type of assistance provided assumeutmost importance. About 81 per cent of the births occurring to Dalit womenand 86 per cent of births occurring to tribal women takes place at home whilethe corresponding figure for the ‘other’ social group is 70 per cent. Conversely,only 20 per cent of Dalit women and 14 per cent of the tribal women gave birthin a medical institution (see Table 4)

10
Indian Institute of Dalit StudiesVolume III, Number 05
Table 4: Place of Delivery by Social Groups in Rural AreasSocial Groups Delivery at home Delivery in the hospital Total Scheduled caste 80.61 19.39 100.00 Scheduled tribe 86.47 13.53 100.00 Other backward caste 72.95 27.05 100.00 'Others' 69.74 30.26 100.00 All 75.60 24.40 100.00
Source: NFHS-2, 1998-1999
Likewise, there are disparities in the assistance received at the time of birthby the Dalit and tribal women. Of the total deliveries of Dalit and tribal womenthat take place at home, a high proportion (47 per cent) are assisted by Daistraditional birth midwires attendents or while those attended by trainedprofessionals like doctors and nurses are low. On the other hand, for the womenfrom the ‘other’ social group, it is the reverse (see Table 5), data indicatesthat higher proportion of women delivering at home are assisted by doctorsand nurses than by traditional bais.
Similar disparities are observed in the case of tetanus vaccination received bywomen before the delivery that can save the child at the time of delivery frominfections. About 75 per cent of Dalit mothers and 61 per cent of tribal mothersreceived vaccination. These ratios are low as compared to 82 per cent forwomen from the ‘other’ social group (see Table 6).
Table 5 : Type of Assistance Given during delivery
Social groups Doctor(%) Nurse (%) Dai (%) Total Scheduled caste 24.35 29.02 46.63 100.00 Scheduled tribe 20.50 32.11 47.39 100.00 Other backward caste 29.24 33.52 37.24 100.00 'Others' 34.28 35.64 30.09 100.00 All 29.62 33.51 36.87 100.00 Source: NFHS-2, 1998-1999
Table 6: Proportion Tetanus Vacination Delivery
Social groups Yes No Total Scheduled caste 24.94 75.06 100.00 Scheduled tribe 38.54 61.46 100.00 Other backward caste 23.63 76.37 100.00 'Others' 18.12 81.88 100.00 All 23.98 76.02 100.00
Source: NFHS-2, 1998-1999

11
Dalit Children in Rural India: Issues Related to Exclusion and DeprivationNidhi Sadana
4.3 Child Morbidity and Treatment
This section discusses the prevalence and treatment of acute respiratoryinfection (ARI), fever and diarrhoea. ARI, primarily pneumonia, is a majorcause of illness among infants and children and the leading cause of childhoodmortality throughout the world11. It is observed that a higher proportion (56per cent) of Dalit children suffer from ARI as compared to non-Dalit children(52.2 per cent) though the difference is small. Similarly, there is a small genderdifference with ARI being somewhat common among boys than girls (see Table7). Among other factors, clean drinking water is an important measure inprevention of ARI. Proportion of SCs households that use drinking water frompublic hand pump12 is higher while the non-SCs households mainly use pipeddrinking water (see Table I A in Annexure II).
Table 7: Prevalence of ARI Children under Age 3
Cough accompanied by fast breathing (ARI)
No Yes, last two weeks Don't know
Total
Scheduled caste Male 42.91 56.64 0.45 100.00 Female 44.76 54.90 0.35 100.00 Total 43.72 55.88 0.41 100.00 Scheduled tribe Male 42.09 56.57 1.34 100.00 Female 41.73 57.07 1.20 100.00 Total 41.92 56.81 1.27 100.00 Other backward caste Male 43.38 56.50 0.12 100.00 Female 45.01 54.40 0.59 100.00 Total 44.13 55.54 0.33 100.00 'Others' Male 45.66 53.85 0.49 100.00 Female 47.80 51.33 0.87 100.00 Total 46.62 52.72 0.66 100.00
Source: NFHS-2, 1998-1999
Further, it is observed that Dalit children living in households that use waterfrom hand pump13 for drinking have a higher prevalence of ARI (see Table II Ain Annexure II) Thus, a small variation in the prevalence of ARI indicates thatrespiratory infection affects children from all strata of society in Indiairrespective of their social group though children from the SCs social group aremore susceptible to catching ARI symptoms as they are dependent ongroundwater for drinking water14 which, as the data suggests, is contaminatedby overuse of fertilisers and pesticides.

12
Indian Institute of Dalit StudiesVolume III, Number 05
4.4 Access to Health Facilities for Dalit Children with ARI Symptoms
Table 5 shows the percentage of children suffering from ARI symptoms in thetwo weeks before the survey who were taken to a health facility or provider. 60per cent of children received some advice or treatment from a health facilityor provider when ill with ARI. This percentage is relatively low for children whobelong to SCs/STs households while evidence of gender bias is observed in thetreatment across social groups. About 59 per cent of Dalits and 43 per cent ofthe STs children with ARI symptom received any medical treatment. Theseratios are low as compared to 65 per cent for the children from the ‘other’social group. Further, disparities are observed across social group in theproportion of children treated for ARI by place of treatment. Data indicates alower proportion of Dalit children got treated in places funded by government/public15 as compared to children from ‘other’ social group.
Similarly, children who were treated through private sources16 for ARI mostlybelonged to the ‘other’ social group (see Table 9).
Table 8 : Percentage of Children under Age 3 with ARI WhoReceived Any Medical Treatment by Social Groups
Social Groups Fever/cough: medical treatment Total No Yes
Scheduled caste 40.87 59.13 100.00 Scheduled tribe 56.29 43.71 100.00 Other backward caste 37.33 62.67 100.00 'Others' 34.78 65.22 100.00 All 40.06 59.94 100.00
Source: NFHS-2, 1998-1999
Table 9: Treatment of Children under Age 3 throughGovt/Private Sources
Social Groups Percentage of children treated through govt.
sources
Percentage of children treated through private
sources Male Female Total Male Female Total Scheduled caste 16.76 17.61 17.12 19.37 17.10 18.37 Scheduled tribe 16.85 18.19 17.41 10.01 11.03 10.46 Other backward caste 25.86 26.64 26.19 29.54 29.50 29.52 'Others' 40.52 37.56 39.28 41.08 42.37 41.65 All 100.00 100.00 100.00 100.00 100.00 100.00

13
Dalit Children in Rural India: Issues Related to Exclusion and DeprivationNidhi Sadana
4.5 Access to Health Facilities for Dalit Children Suffering from Fever &Diarrhoea
Figure 2 indicates that fever is the second most common of the three conditionsexamined with close to 30 per cent of children suffering from it fever duringthe two weeks before the survey. In general, the prevalence of fever does notvary widely with most of the demographic and social characteristics (see TableIII A in Annexure II). As with ARI, disparities are faced by Dalit children when itcomes to being treated. A lower proportion of Dalit children and children fromSTs received treatment as compared to non-Dalit children (see Table III A inAnnexure II).
Diarrhoea is the second most deadly killer of children under age five worldwidefollowing ARI.Figure 2 shows that close to 19 per cent of the children under age3 suffered from diarrhoea. Differentials by sex of the child and social groupare small (see Table VI A in Annexure II). Children from SCs social groups aremore susceptible to suffer from diarrhoea than children from ‘other’ socialgroup. This is because SCs households are dependent on ground water fordrinking by a higher proportion than the households from the ‘other’ socialgroup (see Table I A in Annexure II). NFHS-2 found that children living inhouseholds that use ground water for drinking are more vulnerable to diarrhoeathan children living in households that use other sources of drinking water.Consistent to the survey’s finding this study finds the same in rural areas ofIndia (see Table VII A in Annexure II).
Figure 2: Children under Age 3 Suffering from ARI, Fever and Diarrhea
0%
20%
40%
60%
80%
100%
Percentage of Children
Scheduledcaste
Scheduledtribe
Otherbackward
caste
Other' All
Social Groups
Diarrehea
Cough
Fever
It is also observed that children of mothers with high school or more educationare somewhat less likely to suffer from both ARI and diarrhoea. Thus a hygiene

14
Indian Institute of Dalit StudiesVolume III, Number 05
education programme which focuses on women, the main users and managersof household water, and children, who are the most receptive to behaviouralchange is important in preventing these two ailments.
4.6 Awareness Level of Treatment across Social Groups
Awarness level across social groups about treatment that deaths from diarrhoeaare most often caused by dehydration due to loss of water and electrolytes islow. Nearly all dehydration related deaths can be prevented by promptadministration of rehydration solutions. Because deaths from diarrhoea aresignificant proportions of child deaths, the Government of India has launchedthe Oral Rehydration Therapy (ORT) Programme as one of its priority activitiesfor child survival. One major goal of this programme is to increase awarenessamong mothers and communities about the causes and treatment of diarrhoea.Oral rehydration salts (ORS) packets are made widely available and mothersare taught how to use them17.
Table 10 indicates 65 per cent of mothers with births during the 3 years precedingthe survey knew about ORS packets. However, there is disparity in the knowledgeof ORS packets across social groups. About 61 per cent of SCs mothers and 59per cent of the STs mothers knew about ORS but the corresponding figure forthe ‘other’ social group was 70 per cent. Conversely, close to 40 per cent ofthe mothers from SCs and STs had no knowledge of ORS packets indicating aweakness in the ORT programme.
Table 10: Knowledge of ORS among MothersSocial Groups Heard of oral rehydration salts Never heard of ORS Have knowledge of ORS Total Scheduled caste 38.49 61.51 100.00 Scheduled tribe 41.07 58.93 100.00 Other backward caste 36.25 63.75 100.00 Others 30.40 69.60 100.00 Total 35.15 64.85 100.00
Source: NFHS-2, 1998-99
Similarly, a lower proportion of mothers from SCs (30 per cent) and STs (29 percent) reported that children should be given more to drink than usual during anepisode of diarrhoea while the corresponding figure for ‘other’ group washigher (39 per cent). This suggests that the ORT programme has not beenable to reach lower proportions of mothers from the SCs and STs as they arenot well informed of simple rehydration solutions for prevention of deathsfrom acute diarrhoea as compared to the mothers from the ‘other’ socialgroup.

15
Dalit Children in Rural India: Issues Related to Exclusion and DeprivationNidhi Sadana
Table 11: Knowledge of Drinking Pattern during DiarrhoeaSocial Groups Drinking pattern with diarrhoea Less to
drink Same amount
to drink More to drink
DK Total
Scheduled caste 33.32 29.14 30.57 6.96 100.00 Scheduled tribe 27.29 35.62 28.97 8.12 100.00 Other backward caste 30.98 29.92 32.34 6.76 100.00 Others 28.66 26.11 38.87 6.36 100.00 Total 29.99 29.16 34.00 6.85 100.00
Source: NFHS-2, 1998-99
4.7 Access to Health Facilities in Case of Diarrhoea
Data also suggests of disparities across social groups in the medical treatmentreceived by the children with diarrhoea (see Figure 3). A higher proportion ofchildren with diarrhoea from ‘other’ social group were taken to a health facilityor provider than children from the SCs/STs. This was the case as well for thechildren from the SCs/STs who had ARI symptoms. Table VIII A in Annexure IIshows the percent distribution of children who were treated with ORS fordiarrhoea by the source of the ORS packets. Data in Table 11 suggests: a)more than half (55 per cent) of the children with diarrhoea from the SCs socialgroup had to go to private sector medical sources for ORS packets which mostoften involve fee; of the doctor18 and b) only 40 per cent of the children fromthe SCs social group had the access to subsidised/free19 ORS packets frompublic medical sources.
Figure 3: Percentage of Children with Diarrhoea whoReceived Medical Treatment
0.00
20.00
40.00
60.00
80.00
100.00
120.00
Scheduled caste Scheduled tribe Other backwardcaste
Others Total
Social Groups
Per
cen
tag
e o
f ch
ildre
n w
ith
dia
rrh
oea
Yes: medical treatm.
No

16
Indian Institute of Dalit StudiesVolume III, Number 05
Among these sources, government or municipal hospitals are mentioned mostoften, followed by community health centre (CHC), rural hospitals, or PrimaryHealth Centers (PHC), sub-centres, and government dispensaries. Less than 1per cent were obtained from an NGO or a trust while the rest were obtainedfrom shops and traditional doctors (Vaidya and Hakim).
5. Child Immunisation
“The vaccination of children against 6 serious but preventable diseases(tuberculosis, diphtheria, pertussis, tetanus, poliomyelitis, and measles) hasbeen a cornerstone of child healthcare system in India. As part of the NationalHealth Policy, the National Immunisation Programme has been implemented ona priority basis. The Expanded Programme on Immunisation (EPI) was initiatedby the Government of India in 1978 with the objective of reducing morbidity,mortality and disabilities from 6 diseases by making free vaccination serviceseasily available to all eligible children. The Universal Immunisation Programme(UPI) was introduced in 1985-86 with the objective to cover at least 85 percent of all infants against the 6 vaccine-preventable diseases by 1990”20.
According to the data collected by the NFHS-2 in 1998-99 these targets havenot been achieved across social groups with children from the SCs and STssocial group fairing the worst.
Table 12: Access to Health Facilities by Standard ofLiving Index across Social GroupsSchedule Caste Others Standard
of Living Index
Did Not Have Vaccination
Did Not Receive Medical
Treatment for ARI
Did Not Receive Medical
Treatment for
Diarrhoea
Did Not Have Vaccination
Did Not Receive Medical
Treatment for ARI
Did Not Receive Medical
Treatment for
Diarrhoea Low 55.99 58.87 57.36 39.42 32.26 30.76 Medium 41.22 36.86 38.76 48.34 48.56 50.28 High 2.79 4.28 3.88 12.24 19.18 18.96 Total 100.00 100.00 100.00 100.00 100.00 100.00
Source: NFHS-2, 1998-99
Table 12 provides evidence even among households of equal standard of living,of lower access to health facilities like immunisation and medical treatmentfor ARI and diarrhoea among Dalits as compared with the non-SCs/STs socialgroup. About 56 per cent of the SCs children from households with low standardof living index were not immunised against any preventable diseases like
17
Dalit Children in Rural India: Issues Related to Exclusion and DeprivationNidhi Sadana
tetanus, compared to 35 per cent of the children from the ‘other’ social groupwith a similar standard of living index. Similarly, lower proportion of SCs childrenreceived any medical treatment compared to non SCs/STs children even thoughboth belong to households with low standard of living index21.
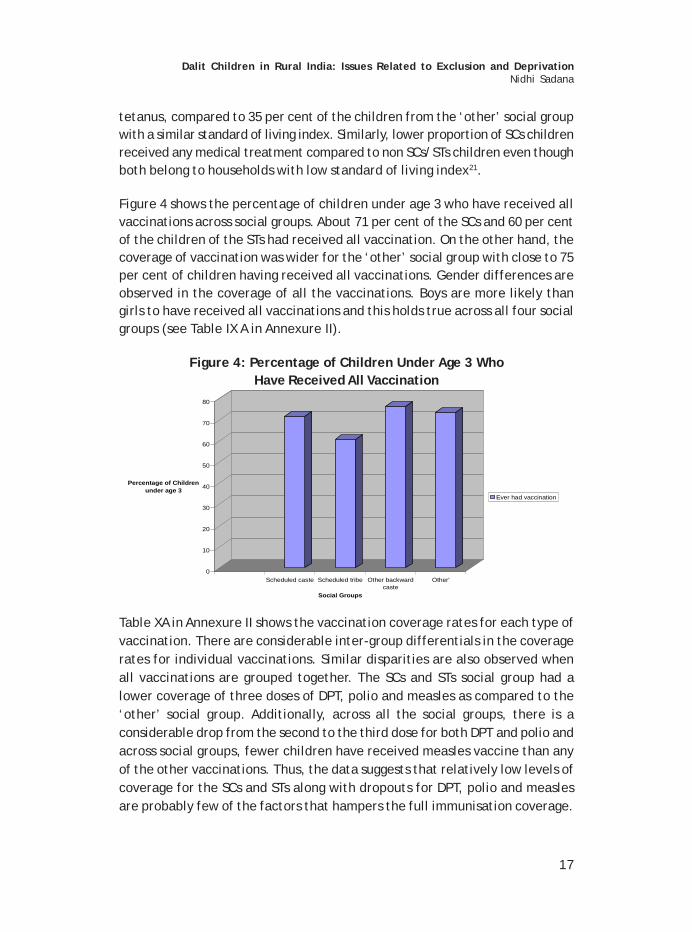
Figure 4 shows the percentage of children under age 3 who have received allvaccinations across social groups. About 71 per cent of the SCs and 60 per centof the children of the STs had received all vaccination. On the other hand, thecoverage of vaccination was wider for the ‘other’ social group with close to 75per cent of children having received all vaccinations. Gender differences areobserved in the coverage of all the vaccinations. Boys are more likely thangirls to have received all vaccinations and this holds true across all four socialgroups (see Table IX A in Annexure II).
Figure 4: Percentage of Children Under Age 3 WhoHave Received All Vaccination
0
10
20
30
40
50
60
70
80
Percentage of Children under age 3
Scheduled caste Scheduled tribe Other backwardcaste
Other'
Social Groups
Ever had vaccination
Table XA in Annexure II shows the vaccination coverage rates for each type ofvaccination. There are considerable inter-group differentials in the coveragerates for individual vaccinations. Similar disparities are also observed whenall vaccinations are grouped together. The SCs and STs social group had alower coverage of three doses of DPT, polio and measles as compared to the‘other’ social group. Additionally, across all the social groups, there is aconsiderable drop from the second to the third dose for both DPT and polio andacross social groups, fewer children have received measles vaccine than anyof the other vaccinations. Thus, the data suggests that relatively low levels ofcoverage for the SCs and STs along with dropouts for DPT, polio and measlesare probably few of the factors that hampers the full immunisation coverage.

18
Indian Institute of Dalit StudiesVolume III, Number 05
6. Nutritional Deficiency
“Vitamin A deficiency is one of the most common nutritional deficiencydisorders, affecting more than 250 million children worldwide. The NationalProgramme on Prevention of Blindness targets children under age 5 years andadministers oral doses of Vitamin A every 6 months starting at age 9 months22.Data collected by NFHS-2 indicate that a large majority of children in ruralIndia have not received vitamin A supplementation at all. In rural India only 1out of 4 children age 12-35 months received at least one dose of vitamin A(see Table XI A in Annexure II) 23. Figure 5 indicate gender biases in the coveragewith boys more likely to be given the Vitamin A dose than girls.
With respect to a comparative scenario across social groups, it is observedthat the proportion of children who received Vitamin A dose was far lower (21per cent) for the SCs and STs (20 per cent) social groups as compared to thechildren from the ‘other’ (28 per cent) social group indicating social disparitiesas well in the coverage of this programme.
Figure 5: Percentage of Children 12-36 Months Who received Vitamin A
0
5
10
15
20
25
30
Percentage of Children 12-35 Months
Scheduledcaste
Scheduledtribe
Otherbackward
caste
Other' All
Social Groups
%age who received Vit.A
7. Conclusion
The evidence in this study indicates that Dalits in rural India are economicallyand socially depressed group, with most of the developmental indicators likenature of occupation/livelihood, employment rates, poverty rates and literacyrates being worse off than for the non-SCs/STs social group. Children of theschedule caste social group face a similar situation, including:

19
Dalit Children in Rural India: Issues Related to Exclusion and DeprivationNidhi Sadana
• they are excluded from essential health services;
• they are denied protection: the incidence of child labour is exceptionallyhigh, especially among Dalit girls; and
• they are denied participation in the education system.
In fact, the data provides evidence, even among families of equal economicstanding, of higher school drop-out rates and lower access to health facilitiesamong Dalits as compared with the non-SCs/STs. The reasons for non-attendance at school are not clear from the official sources of data like theNSS. Thus, there is a need to explore these reasons further, possibly throughthe primary survey.
With respect to health, the IMR is higher for children belonging to SCs and STsas compared to ‘others’. This also means that children who die before theycomplete their first birthday are far more likely to be from SCs and STs. Thereason for higher infant/children mortality levels in these two social groups islack of access to “skilled birth attendants and quality obstetric care”24. Thisaccess is far lesser for women belonging to the SCs and women in tribal regions.In addition, similar disparities are observed in the administration of the tetanusvaccine received by women before child birth. A lower proportion of womenfrom the SCs and STs social group receive this vaccination as compared to thewomen from ‘others’ social group. This has a negative effect on the chancesof survival of newborn children of the former social group, while a higherproportion of newborn from the ‘other’ social group survive.
Further, a higher number of one-year-old Dalit and tribal children die beforecompleting their 5th birthday as compared to children from the ‘other’ socialgroup. ARI, fever, diarrhoea and vaccine-preventable diseases such as tetanus,polio and measles are some of the illnesses among infants and children whichlead to childhood mortality. It is observed that respiratory infection and feveraffect children from all strata in India irrespective of their social group thoughchildren from the SCs social group are more susceptible to catching ARI symptomsas they are dependent on groundwater for drinking water which, as the datasuggests, is contaminated by overuse of fertilisers and pesticides. Additionally,data also indicate that Dalit children and those from the STs have limitedaccess to health facilities. It is observed that a lower proportion of childrenfrom these two social groups received medical treatment in both governmentand private hospitals/sources when ill with ARI and fever, as compared to thechildren from the ‘other’ social group.

20
Indian Institute of Dalit StudiesVolume III, Number 05
With respect to diarrhoea, children from SCs social groups are more susceptiblethan children from ‘other’ social group. This is because SCs households aredependent on unhygienic sources of water for drinking by a higher proportionthan the households from the ‘other’ social group. Disparities emerge in thecoverage of ORTprogramme whose main aim has been to increase awarenessamong mothers and communities about the causes and treatment of diarrhoea.Close to 40 per cent of the mothers from SCs and STs had no knowledge of ORSpackets, whereas the corresponding figure was 30 per cent for the ‘other’social group.
Similarly, a lower proportion of mothers from SCs and STs are informed thatchildren should be given more to drink than usual during an episode of diarrhoeawhile the corresponding figure for ‘other’ group was higher. This suggeststhat the ORT programme has been unable to reach the same proportion ofmothers from the schedules caste and STs as those from the “others” socialgroup, since they are as not well informed of simple rehydration solutions forprevention of deaths from diarrhoea. Additionally, data also suggest there aredisparities across social groups in the medical treatment received by the childrenwith diarrhoea. A higher proportion of children with diarrhoea from ‘other’social group were taken to a health facility than children from the SCs/STs.
In respect of access to immunization, children from the SCs and tribe socialgroup had a limited access. A lower proportion of children from the SCs and STsreceived vaccination against serious but preventable diseases as compared tochildren from ‘other’ social group. Likewise, there are considerable inter-group differentials in the coverage rates for individual vaccinations. The SCsand tribe’s social group had a lower coverage of three doses of DPT, polio andmeasles as compared to the ‘other’ social group. Likewise, a lower proportionof children from SCs/STs social group received a dose of Vitamin A as comparedto children from ‘other’ social group.
Along with caste, gender is another factor of social exclusion and results insignificant disparities in access to: health and nutrition; education and personaldevelopment. Evidence of gender bias is observed in the medical treatmentprovided for ARI, fever and diarrhoea across social groups. Boys are morelikely to receive medical treatment than girls if they fall ill with ARI, fever ordiarrhoea. Further, gender differences are observed in the coverage of all thevaccinations as well. Boys are more likely than girls to have received allvaccinations and this holds true across all social groups. Similarly, lower

21
Dalit Children in Rural India: Issues Related to Exclusion and DeprivationNidhi Sadana
proportions of girls have received any dose of vitamin A and hence are moresusceptible to “night blindness”. More importantly, the health condition of aDalit girl child is the worst as she is not only a Dalit but is also a girl.
The level of education among mothers plays an important in the prevention ofthese life threatening but preventable diseases that cause childhood mortality.It is observed from the data that children of mothers with higher level ofeducation are somewhat less likely to suffer from both ARI and diarrhoea (seeTable XIII A in Annexure II). Similarly, literate mothers are more aware oftreatment of these diseases, especially the ORS packets and simple re-hydrationsolutions in preventing deaths from acute diarrhoea (see Table XIV A in AnnexureII). But, as the data indicate there are disparities in the levels of educationbetween SCs/STs and ‘other’ social group, which makes children from theformer social groups vulnerable (see Table XII A in Annexure II). Thus, a hygieneeducation programme that focuses on women and children, who are the mostreceptive to behavioural change, is important in prevention of these lifethreatening ailments. More importantly, effort has to be focused especially ongirls with respect to their formal education, hygiene education, health andwell being as they are going to be mothers in future.
Endnotes
1 “The organisation of caste system is based on the division of people intosocial groups, in which the civil, cultural and economic rights of eachindividual caste are pre-determined or ascribed by birth and are madehereditary. The caste system’s fundamental characteristics of fixed civil,cultural and economic rights for each caste with restrictions on changeimplies “forced exclusion” of one caste from the rights of other caste.However, not every caste suffered in the same degree from the schemeof economic distribution involved in the caste system”.
Thorat S.K. “Caste System and Economic Discrimination: Lessons fromTheories”, in Thorat, Aryama& Negi (ed.), Reservation and Private Sector:Quest for Equal Opportunity and Growth, IIDS, 2005,pp 66-67
2. Action aid (2000), Untouchability in rural India, (by Shah et.al).
3. http://www.unicef.org/eapro/Strategy_to_reduce_maternal_and_child_undernutrition.pdf
4. Appropriate child care behaviour are measures that promote childnutritional well-being. Some of these measures are: adequate care during

22
Indian Institute of Dalit StudiesVolume III, Number 05
pregnancy in order to reduce the incidence of maternal death,miscarriage, stillbirth and low birth weight among infants, adequate breastfeeding of young children which is critical to child’s growth, caregiver’stime, their knowledge and educational status and their capacity to makeappropriate caring decisions that determine how children are cared for.http://www.unicef.org/eapro/Strategy_to_reduce_maternal_and_child_undernutrition.pdf
5. Thorat S.K.(2001), Caste and Economic Discrimination: Theory and Evidenceon rural Labour Market, Artha Vijnana, Vol.XLIII, Nos 1-2, March_June2001, p124
6. Concept of current daily/weekly status measures the employment timeof the employed worker on weekly and daily basis and captures the full/or underemployment of the worker.
7. A primary level study conducted by Action Aid of about 555 villages ineleven states in India found discrimination in labour markets that operatedthrough exclusion in hiring of SCs labour and wage payments. In 36 percent of the villages, the SCs were denied casual employment in agriculture.In about 25 per cent of the villages, the scheduled caste’s faceddiscrimination in terms of wage payment.
8. A research article by Thorat and Sadana on linkage between educationand rural non-farm employment observed that , in 2000, of the total numberof illiterate rural non-farm workers among the SCs, about half was self-employed, 40.9 per cent follow this was casual labourers while 8.91 percent was regular salaried workers. On the other hand, illiterate workersfrom non SCs/STs background, 62.43 per cent was in self-employment,9.65 per cent in regular salaried jobs and 28 per cent was casual labourers.Thus, a majority of the non SCs/STs illiterates were engaged in self-employment while a larger proportion of illiterates among the SCs werecasual labour. Similarly, in the literate population of workers, a largerproportion of non-SCs/STs were self-employed as compared to that ofSCs. The proportion of SCs wage labourer with secondary or highersecondary education was 19.34 per cent in comparison with 7 per centfor non-SCs/STs.
9. As can be seen in the NSSO concept, central to the concept of identifyinga worker is the engagement in any economic activity. Thus children whoare engaged in any economic activity that are marketable in nature i.e.those activities that involve remuneration are identified as workers. Butthere is a huge chunk of children who are engaged in household choreswhich are non-market and non-remunerated activities. These activitiesindirectly contribute significantly to the economic welfare of the

23
Dalit Children in Rural India: Issues Related to Exclusion and DeprivationNidhi Sadana
household. In fact, as the data in the table 12ii in appendix 1 indicatesthe proportion of children engaged in unpaid household chores (incidenceof child work) is as much (6.5 per cent) as those engaged in paid work(incidence of child labour).
10. Children who neither work as labour nor go to school are known as‘nowhere’ children. One school of thought believes that in a rural contextall out of school children are working somehow or other and hence, canbe considered as child workers. According to Neera Burra (1995), a workingchild is ‘basically a child who is deprived of the right to education and allout of school children are child labourers in one way or the other’ (Burra1995, p8) and considers ‘nowhere’ children to be a potential pool ofchild labourers. Mahendra Dev and C. Ravi (2002) are also of the view thatthe definition of child labour should be widened and include all the childrenwho are deprived of their right to education and childhood.
11. International Institute of Population Studies: NFHS-2 (1998-99), p 216.
12. According to the guidelines for safe drinking water stated by the WHO,to prevent reduce or eliminate contamination, “the plinth surrounding ahand pump should be complete and not damaged, the turbidity of waterfollowing filtration is below a certain value or the chlorine residual afterdisinfection plants or at the far point of the distribution system is abovean agreed value”. http://www.who.int/water_sanitation_health/dwq/gdwq3_2.pdf
13. A study by ‘Water For People’ in West Bengal found that “arsenic mobilizationin the water is speculated to have been caused by over withdrawal ofgroundwater during cultivation, application of arsenic pesticides followedby phosphate fertilizers, or both” 13http://www.waterforpeople.org/asiaIndia.html
14. According to the Ministry of Water Resources, “Unsystematic use ofsynthetic fertilizers couple with improper water management practiceshave resulted in deterioration of ground water quality in many parts ofthe country”. http://wrmin.nic.in/problems/default11.htm
15. Government/public sources include government hospitals, health centers,health post, mobile clinic, community health worker, public sectordispensary, public sub-centre, camp, other public centre.
16. Private sources include private hospital, private pharmacy, private doctor,private mobile clinic, other medical private sector.
17. International Institute of Population Studies: NFHS-2 (1998-99), p 220.

24
Indian Institute of Dalit StudiesVolume III, Number 05
18. ‘A study by NCAER conducted in 1994 on utilization of health care facilitiesin Gujarat found that the people depended more on private facilities inrural areas. Long waiting, non-availability of medical staff on time and nonavailability of quick treatment in government hospitals and dispensariesdiscourage people from using public facilities. They, therefore, turn tothe private sector’ (Hirway and Mahadevia), p23
19. health.nic.in/dofw per cent20website/draft per cent20strategy/draft percent20frame.htm
20. International Institute of Population Studies: NFHS-2 (1998-99), p 203
21. NFHS calculates standard of living index by scoring the following economicindicators on a scale of 0 to 4: House type (pucca-4, semi-pucca-2 andkuccha-0), toilet facility (own flush toilet-4,public/shared/pit toilet-2,shared/public pit toilet-1, no facility-0), source of lighting(electricity-2,kerosene/gas/oil-1,others-0, main fuel for cooking (electricity/ liquid/petroleum/biogas/gas-2,coal, charcoal,kerosene-1, other fuel-0), sourceof drinking water (pipe/hand pump/well in own yard/plot/residence-2,public tap/handpump/well-1, others-0, separate room for cooking (yes-1,no-0), ownership of house (yes-2,no-0), ownership of agricultural land (5acres or more-4, 2.0 to 4.9 acres-3, less than 2 acres-2, no agriculturalland-0), ownership of irrigated land (household owns at least some irrigatedland-2, no irrigated land-0), ownership of livestock (own livestock-2, doesnot own livestock-0), ownership of durable goods. Index scores rangefrom 0-14 for a low SLI to 15-24 for a medium and 25-67 for a high SLI.
22. International Institute of Population Studies: NFHS-2 (1998-99), p 213
23. “The main objective of National Programme for Control of Blindness is toreduce the prevalence of blindness in the country from 14 per 1000 to 3per 1000 population”. http://www.tnhealth.org/tsbcs.htm
24. http://www.unicef.org/india/health.html

25
Dalit Children in Rural India: Issues Related to Exclusion and DeprivationNidhi Sadana
Annexure I
Table I: Land owned by size class across Social Groupsin Rural India (per cent)-1999/2000
Size class of Land Owned ST SC OBC Others Landless 7.20 10.00 6.50 5.80 Marginal (0.01 - 0.40) 39.10 6.50 50.00 46.30 Small (1.01-1.00) 24.30 14.70 20.20 19.10 Medium (1.01 -2.00) 16.50 6.50 12.00 12.80 Large (2.01 - 4.00) 9.90 2.80 7.50 9.30 Very Large (4.01 and above) 3.00 1.10 3.80 6.70
Source: Employment and Unemployment Situation among Social Groups
Table IIA: Occupation Pattern (Household type) acrossSocial Groups in Rural India (per cent)-1999/2000
Household Type SC ST OBC Others Self-Employed in Agriculture 16.40 36.20 34.70 41.10 Self-Employed in Non-Agriculture 12.00 5.20 15.50 14.80 Agricultural Labourer 51.40 34.70 29.20 19.00 Other Labourer 10.00 8.90 7.90 6.30 Others 10.20 10.2010 12.70 18.70
Source: Employment and Unemployment Situation among Social Groups in India,NSS 55th Round, 1999-2000
Table IIIA: Employment Rates across Social Groups inRural India (per cent)- 1999/2000
Work Status ST SC OBC Others Male Female Male Female Male Female Male Female
Usual Principal Status 55.30 37.70 52.40 25.20 52.40 23.70 50.90 1 Usual Principal and Subsidiary Status
55.80 43.80 53.10 32.50 52.0 2052.0 52.00 2
Current Weekly Status 53.90 38.10 5050 27.00 5050 25.50 50.10 1 Current Daily Status 50.50 32.20 46.20 21.20 48.40 21.10 47.60 1
Source: Employment and Unemployment Situation among Social Groups in India,NSS 55th Round, 1999-2000

26
Indian Institute of Dalit StudiesVolume III, Number 05
Table IVA: Unemployment rates across Social Groups inRural India (per cent)-1999/2000
Work Status ST SC OBC Others Male Female Male Female Male Female Male Female Usual Principal Status 0.70 0.20 1.20 01.60 0.30 01.60 1.60 0.50 Usual Principal and Subsidiary Status
0.60 01.20 1.00 01.20 0.30 0.30 1.20 0.50
Current Weekly Status 1.50 0.80 2.50 1.500 1.60 0.80 2.50 1.20 Current Daily Status 3.00 1.50 5.00 2.10 1.40 1.40 3.50 1.40
Source: Employment and Unemployment Situation among Social Groups in India,NSS 55th Round, 1999-2000.
Table VA: Average Weekly Wages of the Workers inRupees at 1993-94 prices (1999-2000)
Social Groups Wages ST 160.68 SC 171.5 Others 197.05 Source: Thorat S.K. “ Combating social exclusion,discrimination and inequality: Towards
a socially inclusive approach to children”.Draft paper prepared for UNICEF, p30
Table VIA: Incidence of Poverty (HCR) by Social Groups: (1999-2000)
Social groups Incidence of poverty ST 44.33 SC 35.43 OBC Others 21.14
Source: Thorat S.K. “Combating social exclusion, discrimination and inequality:Draftpaper prepared for UNICEF, p31
Table VIIA: Literacy Rates and Level of Education bySocial Groups-1999/2000
Literacy Level ST SC OBC Others Male Female Male Female Male Female Male Female
Illiterate 52.30 77.10 47.50 75.50 47.50 67.50 24.00 50.60 Literate upto Primary 23.90 13.30 25.00 13.50 27.10 16.90 26.10 22.40 Middle 12.90 5.40 14.80 6.80 18.10 9.20 21.20 13.80 Secondary 6.00 2.40 7.30 7.30 10.30 4.30 15.20 8.20 Higher Secondary 3.4 1.3 3.3 1 4.6 1.5 7.5 3.3 Graduate and Above 5.1 0.3 2 0.4 2.4 0.7 5.9 1.7 Source: Employment and Unemployment Situation among Social Groups in India,
NSS 55th Round, 1999-2000

27
Dalit Children in Rural India: Issues Related to Exclusion and DeprivationNidhi Sadana
Table VIIIA(i): Percentage Distribution of Children Age 5-14 Years byStatus of School Attendance-1999/2000 (Aggregated)
School Attendance Male Female Total Attending School 74.57 64.06 69.64 Dropped-Out 3.78 5.02 4.36 Never Attended 21.65 30.92 26.00 Total 100.00 100.00 100.00 Source: Employment and Unemployment Situation among Social Groups in India,
NSS 55th Round, 1999-2000
Table VIIIA (ii): Percentage Distribution of Children Age 5-14 Years byStatus of School Attendance-1999/2000 (SCs)
School Attendance Male Female Total Attending School 64.00 53.25 58.90 Dropped-Out 4.65 5.84 5.21 Never Attended 31.35 40.91 35.89 Total 100.00 100.00 100.00
Source: Employment and Unemployment Situation among Social Groups in India,NSS 55th Round, 1999-2000
Table VIIIA (iii): Percentage Distribution of Children Age 5-14 Years byStatus of School Attendance-1999/2000 (STs)
School Attendance Male Female Total
Attending School 70.84 59.34 65.44
Dropped-Out 3.78 5.47 4.57
Never Attended 25.38 35.19 29.98
Total 100.00 100.00 100.00
Source: Employment and Unemployment Situation among Social Groups in India,NSS 55th Round, 1999-2000
Table VIIIA (iv): Percentage Distribution of Children Age 5-14 Years byStatus of School Attendance-1999/2000 (Other Backward Caste)School Attendance Male Female Total
Attending School 75.04 62.71 69.32
Dropped-Out 3.59 4.51 4.02
Never Attended 21.37 32.79 26.67
Total 100.00 100.00 100.00
Source: Employment and Unemployment Situation among Social Groups in India,NSS 55th Round, 1999-2000

28
Indian Institute of Dalit StudiesVolume III, Number 05
Table VIIIA (v): Percentage Distribution of Children Age 5-14 Years byStatus of School Attendance-1999/2000 (Others)
School Attendance Male Female Total
Attending School 80.96 74.36 77.80
Dropped-Out 3.48 4.56 4.00
Never Attended 15.55 21.09 18.20
Total 100.00 100.00 100.00
Source: Employment and Unemployment Situation among Social Groups in India,NSS 55th Round, 1999-2000
Table IXA(i): Percentage Distribution of Children (Age 5-14) by Status ofSchool Attendance for each MPCE Class-1999/2000 (Total)
Categories of MPCE (Rs) School Attendance
Attending School
Dropped-Out
Never Attended
Total
0-225 65.50 4.57 29.93 100.00
225-255 56.41 4.21 39.38 100.00
255-300 61.70 4.28 34.02 100.00
300-340 66.99 4.87 28.15 100.00
340-380 69.05 4.42 26.53 100.00
380-420 73.51 4.35 22.14 100.00
420-470 74.92 4.62 20.46 100.00
470-525 79.99 4.14 15.87 100.00
525-615 81.61 3.96 14.44 100.00
615-775 85.63 3.59 10.79 100.00
775-950 91.15 2.30 6.55 100.00
950 or more 91.49 2.95 5.56 100.00
Total 69.64 4.36 26.00 100.00
Source: Employment and Unemployment Situation among Social Groups in India,NSS 55th Round, 1999-2000

29
Dalit Children in Rural India: Issues Related to Exclusion and DeprivationNidhi Sadana
Table IXA(ii): Percentage Distribution of Children (Age 5-14) whodropped out and never attended school for each MPCE
Class-1999/2000 (TotalCategories of MPCE School Attendance Dropped-Out Never Attended 0-225 36.30 39.88 225-255 5.28 8.28 255-300 9.68 12.90 300-340 10.36 10.05 340-380 8.56 8.61 380-420 7.10 6.07 420-470 7.21 5.36 470-525 5.00 3.21 525-615 5.05 3.09 615-775 3.56 1.80 775-950 0.94 0.45 950 or more 0.96 0.30 Total 100.00 100.00
Source: Employment and Unemployment Situation among Social Groups in India,NSS 55th Round, 1999-2000
Table IXA(iii): Percentage Distribution of Children (Age 5-14) who droppedout and never attended school for each MPCE Class-1999/2000 (SCs)
Categories of MPCE School Attendance
Dropped-Out Never Attended 0-225 20.03 28.46
225-255 13.01 15.02
255-300 15.24 16.79
300-340 11.91 11.98
340-380 9.95 9.66
380-420 9.26 6.23
420-470 7.84 5.29
470-525 5.64 2.18
525-615 4.60 2.49
615-775 1.76 1.34
775-950 0.53 0.39
950 or more 0.25 0.15
Total 100.00 100.00
Source: Employment and Unemployment Situation among Social Groups in India,NSS 55th Round, 1999-2000

30
Indian Institute of Dalit StudiesVolume III, Number 05
Table IXA (iv): Percentage Distribution of Children (Age 5-14) who droppedout and never attended school for each MPCE Class-1999/2000 (STs)
Categories of MPCE School Attendance Dropped-Out Never Attended 0-225 11.49 19.12 225-255 8.13 12.86 255-300 14.18 20.39 300-340 17.60 13.84 340-380 11.95 10.38 380-420 8.84 7.87 420-470 10.00 6.63 470-525 6.23 3.40 525-615 6.85 3.58 615-775 3.41 1.31 775-950 0.69 0.40 950 or more 0.62 0.21 Total 100.00 100.00
Source: Employment and Unemployment Situation among Social Groups in India,NSS 55th Round, 1999-2000
Table IXA (v): Percentage Distribution of Children (Age 5-14) whodropped out and never attended school for each MPCE Class-1999/2000
(OBCs)
Categories of MPCE School Attendance Dropped-Out Never Attended 0-225 9.36 12.60 225-255 5.48 10.49 255-300 12.71 17.65 300-340 16.68 15.13 340-380 11.35 13.38 380-420 10.87 9.04 420-470 10.98 8.25 470-525 7.40 5.00 525-615 6.19 4.60 615-775 5.69 2.98 775-950 1.49 0.53 950 or more 1.81 0.34 Total 100.00 100.00
Source: Employment and Unemployment Situation among Social Groups in India,NSS 55th Round, 1999-2000

31
Dalit Children in Rural India: Issues Related to Exclusion and DeprivationNidhi Sadana
Table IXA (vi): Percentage Distribution of Children (Age 5-14) whodropped out and never attended school for each MPCE Class-1999/2000
(Others)Categories of MPCE School Attendance Dropped-Out Never Attended 0-225 6.10 13.92 225-255 6.65 8.87 255-300 13.52 15.78 300-340 10.66 13.06 340-380 13.98 12.61 380-420 10.20 9.34 420-470 10.31 8.33 470-525 7.92 6.28 525-615 9.69 5.79 615-775 7.03 3.79 775-950 2.03 1.21 950 or more 1.91 1.02 Total 100.00 100.00 Source: Employment and Unemployment Situation among Social Groups h India,
NSS 55th Round, 1999-2000
Table IXA (vii): Social Gaps amongst Children (Age 5-14) who droppedout and never attended school for each MPCE Class-1999/2000
Categories of MPCE
School Attendance (SC
School Attendance (Others)
Percentage Point Difference Bet SC &
Others Droppe
d-Out Never
Attended Dropped-
Out Never
Attended Dropped-
Out Never
Attended 0-225 20.03 28.46 6.10 13.92 13.93 14.54 225-255 13.01 15.02 6.65 8.87 6.36 6.16 255-300 15.24 16.79 13.52 15.78 1.72 1.01 300-340 11.91 11.98 10.66 13.06 1.24 -1.07 340-380 9.95 9.66 13.98 12.61 -4.03 -2.95 380-420 9.26 6.23 10.20 9.34 -0.93 -3.11 420-470 7.84 5.29 10.31 8.33 -2.48 -3.04 470-525 5.64 2.18 7.92 6.28 -2.28 -4.10 525-615 4.60 2.49 9.69 5.79 -5.09 -3.30 615-775 1.76 1.34 7.03 3.79 -5.28 -2.45 775-950 0.53 0.39 2.03 1.21 -1.50 -0.81 950 or more 0.25 0.15 1.91 1.02 -1.66 -0.87 Total 100.00 100.00 100.00 100.00 0.00 0.00 Source: Employment and Unemployment Situation among Social Groups in India.
NSS 55th Round, 1999-2000.

32
Indian Institute of Dalit StudiesVolume III, Number 05
Table XA: Reason for Currently Not Attending School byChidren in the age 5-14
Social Groups Reason for No School Economic Reasons Non-Economic Reasons Total Scheduled Caste 13.15 86.85 100.00 Scheduled Tribes 13.05 86.95 100.00 Other Backward Caste 12.25 87.75 100.00 Others 14.11 85.89 100.00 Total 12.99 87.01 100.00
Source: Employment and Unemployment Situation among Social Groups in India,NSS 55th Round, 1999-2000.

33
Dalit Children in Rural India: Issues Related to Exclusion and DeprivationNidhi Sadana
Annexure II
Table IA: Sources of Drinking water by Social Groups in Rural areasSource of Drinking Water
Scheduled caste
Scheduled tribe
Other backward caste
Other All
Piped water 7.80 8.45 11.08 16.85 12.18 Handpump 50.47 29.61 41.78 41.19 41.38 Public tap 16.65 16.53 16.68 12.80 15.25 Well water 20.59 29.93 26.37 22.31 24.36 Surface water 4.49 15.48 4.10 6.85 6.83 100.00 100.00 100.00 100.00 100.00 Source:NFHS-2, 1998-99
Table IIA : Dalit children with ARI symptoms by source of drinking waterSource of Drinking Water Scheduled caste Piped water 13.64 Handpump 47.67 Public tap 16.75 Well water 18.79 Surface water 3.15 100.00 Source:NFHS-2, 1998-99
Table IIIA : Percentage of Children under age 3 who where illwith fever two weeks preceding the survey
Social groups Had fever recently
No Yes, last
two weeks Don't know
Total
Scheduled caste Male 69.87 30.03 0.10 100.00 Female 69.83 29.94 0.23 100.00 Total 69.85 29.99 0.16 100.00 Scheduled tribe Male 66.56 33.13 0.31 100.00 Female 68.50 31.23 0.27 100.00 Total 67.52 32.20 0.29 100.00 Other backward caste Male 70.69 29.11 0100 100.00 Female 73.18 26.51 0.31 100.00 Total 71.89 27.86 0.25 100.00 'Others' Male 68.83 31.07 0.10 100.00 Female 70.77 28.92 0.30 100.00 Total 69.75 30.06 0.19 100.00
Source:NFHS-2, 1998-99

34
Indian Institute of Dalit StudiesVolume III, Number 05
Table IVA: Percentage of children under age 3 who received anytreatment for fever/cough in the Government hospital
Social Groups Percentage of children under age 3 with fever/ cough who were taken
to :Govt. Hospital Sex of the Child No Govt. Hospital Total
Male 92.52 7.48 100.00 Female 93.81 6.19 100.00
Scheduled caste
Total 93.08 6.92 100.00 Male 93.88 6.12 100.00 Female 93.65 6.35 100.00
Scheduled tribe
Total 93.76 6.24 100.00 Male 91.61 8.39 100.00 Female 93.10 6.90 100.00
Other backward caste
Total 92.29 7.71 100.00 Male 89.79 10.21 100.00 Female 92.72 7.28 100.00
'Others'
Total 91.11 8.89 100.00 Source: NFHS-2, 1998-99
Table VA : Percentage of Children with ARI symptomstaken to health facility/provider
Social Groups Sex of the Child No Yes: Health Facility Male 10.03 10.47
Female 8.57 7.52
Scheduled caste
Total 18.61 17.99 Male 11.33 6.33
Female 11.26 5.39
Scheduled tribe
Total 22.59 11.72 Male 12.93 16.63
Female 12.97 12.43
Other backward caste
Total 25.90 29.06 Male 16.91 23.42
Female 15.99 17.80
'Others'
Total 32.90 41.23 Male 51.20 56.85
Female 48.80 43.15
All
Total 40.10 59.99
Source: NFHS-2, 1998-99

35
Dalit Children in Rural India: Issues Related to Exclusion and DeprivationNidhi Sadana
Table VIA: Percentage of Children under age 3 who where ill withdiarrhea two weeks preceding the survey
Social Groups Had diarrhea recently
No Yes, last two weeks
Don't know
Total
Male 79.61 20.22 0.17 100.00
Female 79.19 20.58 0.23 100.00
Scheduled caste
Total 79.42 20.39 0.19 100.00
Male 77.58 22.33 0.09 100.00
Female 79.21 20.52 0.27 100.00
Scheduled tribe
Total 78.38 21.44 0.18 100.00
Male 80.24 19.49 0.27 100.00
Female 81.43 18.23 0.33 100.00
Other backward caste
Total 80.82 18.89 0.30 100.00
Male 80.25 19.63 0.13 100.00
Female 80.96 18.66 0.38 100.00
Other
Total 80.58 19.17 0.24 100.00
Source: NFHS-2, 1998-99
Table VIIA : Prevalence of Diarrhoea in Childrenunder age 3 by source of drinking water
Source of Drinking Water Yes (All) Yes (SC) Yes (ST) Yes (OBC) Yes (Other)
Piped water 21.83 15.45 12.41 18.48 31.50
Handpump 34.72 43.75 23.16 38.48 32.34
Public tap 17.49 18.58 20.37 17.69 15.57
Well water 18.50 17.53 25.96 20.55 14.34
Surface water 7.45 4.69 18.10 4.80 6.25
100.00 100.00 100.00 100.00 100.00
Source: NFHS-2, 1998-99

36
Indian Institute of Dalit StudiesVolume III, Number 05
Table VIIIA: Percentage of children with diarrhoea who received ORSpackets from various sources
Source of ORS packets
All Scheduled Caste
Scheduled Tribes
Other backward
Caste
Other
Government hosp. 16.72 15.16 15.02 18.54 17.13 CHC/rural hospital/PHC 12.00 13.23 24.11 8.01 9.81 Govt health post 0.75 1.61 0.40 1.14 0.28 Mobile clinic 0.00 0.00 0.00 0.00 0.00 Comm.health worker 0.35 0.32 0.40 0.69 0.14 Government dispensary 3.58 6.13 1.19 3.89 3.18 Sub-centre 3.23 2.90 5.53 2.97 2.76 Other public sector 0.87 0.00 0.00 0.46 0.14 Comm.health worker 0.75 0.65 0.79 0.69 1.10 Total 38.24 40.00 47.43 36.38 34.53 Private hosp/clin. 21.86 21.61 17.79 27.00 20.58 Private pharmacy 2.08 2.26 3.56 1.60 1.80 Private doctor 32.41 30.65 23.32 29.06 38.81 Private mobile cln 0.06 0.00 0.00 0.23 0.00 Other med.priv sect. 0.35 0.32 0.79 0.00 0.41 Total 56.75 54.84 45.45 57.89 61.60 NGO/trust hospital/clinic 0.81 0.65 3.16 0.69 0.14 NGO worker 0.12 0.00 0.40 0.00 0.14 Total 0.92 0.65 3.56 0.69 0.28 Vaidya /hakim/homeopath 1.50 1.61 0.79 1.60 1.66 Shop 2.60 2.90 2.77 3.43 1.93 Total 4.09 4.52 3.56 5.03 3.59 100.00 100.00 100.00 100.00 100.00 Source: NFHS-2, 1998-99
Table IXA: Percentage of Children age under age of 3 yearswho have ever been vaccinated
Social Groups Ever had vaccination Sex of the Child No Yes Don't Know Total
Male 26.87 72.94 0.19 100.00 Female 29.71 69.92 0.37 100.00
Scheduled caste
Total 28.21 71.51 0.28 100.00 Male 38.07 61.12 0.80 100.00 Female 39.57 59.95 0.47 100.00
Scheduled tribe
Total 38.81 60.55 0.64 100.00 Male 23.22 76.54 0.23 100.00 Female 23.76 75.90 0.34 100.00
Other backward caste
Total 23.49 76.23 0.29 100.00 Male 24.67 74.89 0.44 100.00 Female 27.95 71.77 0.28 100.00
Others
Total 26.24 73.40 0.37 100.00
Source: NFHS-2, 1998-99

37
Dalit Children in Rural India: Issues Related to Exclusion and DeprivationNidhi Sadana
Table XA: Percentage of Children under age of 3 years who have notbeen vaccinated by specific type of vaccination
Social Groups DPT Polio Measles
Sex of the Child 1 2 3 1 2 3
Male 35.42 43.27 55.20 22.93 31.44 50.42 60.31
Female 37.66 46.14 56.50 24.60 34.01 51.83 62.03
Scheduled caste
Total 36.47 44.61 55.81 23.71 32.65 51.08 61.12
Male 45.48 52.75 64.20 33.64 43.77 60.94 69.20
Female 47.57 55.34 67.40 .4034 44.24 61.48 72.40
Scheduled tribe
Total 46.51 54.03 65.78 33.98 44.00 61.21 70.78
Male 32.13 39.57 50.08 19.69 28.38 46.52 57.02
Female 35.83 43.13 53.30 20.78 29.81 48.61 60.00
Other backward caste
Total 33.91 41.29 51.63 20.21 29.07 47.53 58.45
Male 25.86 33.49 44.02 19.52 27.30 44.58 51.96
Female 29.15 36.37 47.26 21.45 29.78 46.31 53.48
Others
Total 27.41 34.85 45.55 20.43 28.47 45.39 52.67
Source: NFHS-2, 1998-99
Table XIA: Percentage of Children12-35 Months who havereceived dose of Vitamin A.
Social Groups Percentage who received Vitamin
Sex of the Child No Yes Don’t Known Total
Male 73.91 21.59 4.50 100.00
Female 73.39 21.33 5.28 100.00
Scheduled caste
Total 73.66 21.47 4.87 100.00
Male 74.99 21.43 3.59 100.00
Female 76.72 19.99 3.29 100.00
Scheduled tribe
Total 75.84 20.72 3.44 100.00
Male 73.97 22.11 3.92 100.00
Female 75.93 19.92 4.15 100.00
Other backward caste
Total 74.91 21.06 4.03 100.00
Male 65.53 28.60 5.87 100.00
Female 67.34 27.19 5.46 100.00
Others
Total 66.39 27.94 5.68 100.00
Male 70.87 24.35 4.77 100.00
Female 72.38 22.84 4.78 100.00
All
Total 71.59 23.63 4.78 100.00 Source: NFHS-2, 1998-99

38
Indian Institute of Dalit StudiesVolume III, Number 05
Table XIIA: Educational Level Across Social GroupsSocial Groups Highest educational level No education Primary Secondary Higher Total Scheduled caste 65.75 15.66 15.47 3.12 100.00 Scheduled tribe 60.33 16.53 19.69 3.45 100.00 Other backward caste 53.75 17.53 22.54 6.19 100.00 'Others' 37.18 17.47 29.61 15.74 100.00 49.67 17.07 23.94 9.33 100.00
Source: NFHS-2, 1998-99
Table XIIIA: Level of Education of Mothers whose Children had diarrhoeaand ARI in the last two week of the survey period
Level of Education Had diarrhea recently ARI No education 51.52 53.65 Primary 17.64 17.19 Secondary 24.14 23.02 Higher 6.69 6.14 100.00 100.00
Source: NFHS-2, 1998-99
Table XIVA: Percentage of Mothers who did not give their children ORSpackets by Level of Education
Level of Education Scheduled caste
Scheduled tribe
Other backward caste
Others
No education 68.82 60.55 57.71 45.19 Primary 14.23 19.73 17.24 19.16 Secondary 13.71 17.50 21.42 26.68 Higher 3.23 2.23 3.63 8.97 Total 100.00 100.00 100.00 100.00
Source: NFHS-2, 1998-99
Table XVA: Percentage of Mothers who had Health Card for theirchildren by Level of Education
Level of Education
Scheduled caste
Scheduled tribe
Other backward caste
Others
No education 81.53 71.21 76.62 64.75 Primary 9.55 15.10 11.87 15.62 Secondary 7.78 12.79 10.24 15.93 Higher 1.14 0.89 1.27 3.70 Total 100.00 100.00 100.00 100.00
Source: NFHS-2, 1998-99

39
Dalit Children in Rural India: Issues Related to Exclusion and DeprivationNidhi Sadana
References
1. Action aid (2000), Untouchability in rural India, (by Shah et.al) Ongoingstudy.
2. Barik Vijay k & Kulkarni P.(2004), Health Status and Access to Health Services:Disparities among Social groups in India, IIDS, New Delhi.
3. Duraisamy, Malathy (2000), ‘Child Schooling and Child Work in India’, Paperpresented for the Programme of Research on Human Development., NCAER-UNDP, Delhi, December.
4. http://www.unicef.org/eapro/Strategy_to_reduce_maternal_and_child_undernutrition.pdf
5. http://www.who.int/water_sanitation_health/dwq/gdwq3_2.pdf
6. http://www.waterforpeople.org/asiaIndia.html
7. http://wrmin.nic.in/problems/default11.htm
8. Hirway and Mahadevia (2004), Gujarat Human Development Report, 2004.M.G. Labour Institute, Ahmedabad.
9. National Sample Survey (1999-2000): Employment and Unemployment Survey,1999-2000, 55th Round, NSSO, New Delhi.
10. National Family Health Survey (1998-1999):
11. Roy T.K., Kulkarni, Sumati, Vaidehi Y (2004), “Social Inequalities in Healthand Nutrition in Selected States”, Economic and Political Weekly, February14, 2004.
12. Sinha Shanta (1996), ‘Child Labour and Education Policy in India’, TheAdministrator, Special Issues on Child Labour and Education, vol. 66, no.3,July-September
13. Sinha S.(2005), Reaching out to Undernourished Children: Social Inequalitiesand Policy Perspective, Journal of Health and Development, Vol 1, No. 3-4, Oct-Dec 2005.
14. Thorat S.K.(2001), Caste and Economic Discrimination: Theory and Evidenceon rural Labour Market, Artha Vijnana, Vol.XLIII, Nos 1-2, March_June2001.
15. Thorat, S.K. & Sadana, Nidhi (2004), ‘Magnitude, Determinants, andActivities of Child Labour in Rural India’, in G.K. Lieten, R. Srivastava & S.

40
Indian Institute of Dalit StudiesVolume III, Number 05
K. Thorat (eds), Small Hands in South Asia, Child Labour in Perspective,Manohar Publishers & Distributors, New Delhi.
16. Thorat S.K.& Sadana Nidhi: “Rural Non-Farm Employment and SCs: Activities,Education and Poverty Inter-Linkages” in Nayyar R.& Sharma A.N.(eds),Rural Transformation in India: The Role of Rural Non-Farm Sector, IHD,New Delhi.
Books
1. Thorat S.K. “Caste System and Economic Discrimination: Lessons fromTheories”, in Thorat, Aryama& Negi (ed.), Reservation and Private Sector:Quest for Equal Opportunity and Growth, IIDS, 2005.
2. Ramchandran N. and L. Massum (eds.) (2000), Coming to Grips with RuralChild Work: A Food Security Approach, IHD, New Delhi
3. Lieten G.K., R. Srivastava and S.K. Thorat (eds.) (2004), Small Hands inSouth Asia, Child Labour in Persepective, Manohar, New Delhi.

