daljeet kaur, ashok kumar, ankit gaur, purnendu …characterization of 3 mm glass electrodes and...
TRANSCRIPT
Characterization of 3 mm Glass Electrodes and Development of
RPC Detectors for INO − ICAL Experiment
Daljeet Kaur, Ashok Kumar, Ankit Gaur, Purnendu Kumar,Md. Hasbuddin, Swati Mishra, Praveen Kumar, Md. Naimuddin∗
Department of Physics and Astrophysics, University of Delhi,Delhi 110007, India.
October 16, 2018
Abstract
India-based Neutrino Observatory (INO) is a multi-institutional facility, planned to be built up inSouth India. The INO facility will host a 51 kton magnetized Iron CALorimeter (ICAL) detector tostudy atmospheric muon neutrinos. Iron plates have been chosen as the target material whereas ResistivePlate Chambers (RPCs) have been chosen as the active detector element for the ICAL experiment. Dueto the large number of RPCs needed (∼ 28,000 of 2 m×2 m in size) for ICAL experiment and for the longlifetime of the experiment, it is necessary to perform a detailed R&D such that each and every parameterof the detector performance can be optimized to improve the physics output. In this paper, we reporton the detailed material and electrical properties studies for various types of glass electrodes availablelocally. We also report on the performance studies carried out on the RPCs made with these electrodesas well as the effect of gas composition and environmental temperature on the detector performance. Wealso lay emphasis on the usage of materials for RPC electrodes and the suitable enviormental conditionsapplicable for operating the RPC detector for optimal physics output at INO-ICAL experiment.
Keywords: INO, ICAL, RPC, GLASS
∗Corresponding author: [email protected]
1
arX
iv:1
412.
4998
v1 [
phys
ics.
ins-
det]
16
Dec
201
4
1 Introduction
The India-based Neutrino Observatory (INO) [1] is a multi-institutional collaboration aimed at building aworld-class underground laboratory with an all around rock cover of approximately 1 km for non-acceleratorbased high energy and nuclear physics experiments. It will be a multi-experiment facility and one of theexperiments will be Iron CALorimeter (ICAL). The ICAL detector will have modular structure having threemodules with each module weighing about 17 ktons and 16 m × 16 m × 14.5 m in dimension. The entiredetector will be magnetized using a magnetic field of around 1.5 Tesla to detect the charge and momenta ofparticles passing through it. The primary goal of INO-ICAL is to study the atmospheric muon neutrinos.Neutrinos are fundamental particles belonging to the lepton family in the standard model of particle physics.They come in three flavours, one associated with electrons and the others with their heavier partners, themuons and the taus. According to standard model of particle physics neutrinos are massless. However, recentexperiments [2]-[26] indicate that neutrinos have finite but small masses that are yet to be precisely measured.Their flavours also changes as they travel, which is known as flavour oscillation. Determination of neutrinomasses and mixing parameters is one of the unresolved problems in physics today. The INO-ICAL experimentwith its massive magnetized detector will be able to shed light on this issue by measuring the atmosphericoscillation parameters and neutrino mass hierarchy. In order to make these measurements, INO-ICAL needsa robust detector system through which the muons generated due to the interaction of neutrinos with thetarget material in ICAL can be detected easily. The Resistive Plate Chamber (RPC) detectors are one suchdetector which can be used as an active detector element in INO-ICAL experiment.
2 Resistive Plate Chamber Detector
The high energy and astroparticle physics experiments generally require detectors which are stable, havinglong lifetime and cover large detection area. The RPC detector [27, 28], is one such gaseous detector whichwas pioneered during 1980s. The RPCs detectors are made up from two high resistive parallel plates withuniform graphite coating on opposite sides, generating a uniform electric field when a bias voltage is appliedon the two plates. These are rugged, low cost and highly efficient detectors which have their usage in varioushigh energy, nuclear and astroparticle physics experiments as well as applications in imaging and otherfields. The main features of RPC detectors are their large pulse heights, excellent timing resolution betterthan few nanoseconds, high detection efficiency for minimum ionising particles and low cost per unit area.Their excellent time resolution, possibility of high granularity readout and good detection efficiency makethem ideal for the development of fast, efficient and robust triggering system for muons over large areas inhybrid detectors [29]. These detectors are also used for time of flight measurements [28, 30] and for trackingin multilayer configurations in BELLE [31], BaBar [32], L3 [33], OPERA [34], and the LHC experiments(ALICE, ATLAS and CMS) [35] - [37]. RPC detectors has the ability to provide two dimensional readout ata time. These are also very simple to construct and are almost free from damaging discharges.
In INO-ICAL experiment, RPCs are proposed to be used as active detector element. Their high gain,simple design and affordable cost makes it favourite to construct about 28,000 detectors of dimension, 2 m× 2 m, that INO-ICAL need. The experiment is planned to operate at least for 20 years and may also beupgraded to 100 kton in later phases. Because of the huge number of detectors required for INO-ICAL andkeeping in mind the long life span of the experiment, it is pertinent to perform a vigorous R&D to carefullyoptimize the various detector design and operational parameters like the electrode material, gas composition,operational conditions, etc. to exploit fully all the advantages of the RPC detectors. Keeping in view thehuge quantity of glasses required and the complexity involved in its long distance transportation, we decidedto pursue our R&D on the glasses available locally. The earlier R&D performed for INO-ICAL glass RPCswere for 2 mm thick glasses only and was also limited in its scope [38, 39]. Due to handling issues and shearstress problems involved in the large size detectors, INO-ICAL collaboration has decided to use 3 mm thickglasses for constructing the RPCs, therefore, all the results reported in this paper are for 3 mm thick glasses.
2.1 Electrodes choice for RPC
In RPC detectors, material properties of electrodes and environmental factors play a significant role indetector working. The electrodes are usually made up of float glass or bakelite and the choice of it dependson the expected event rate. Electrode material plays an important role in the functioning of the RPCdetectors, so its selection must be done carefully. Typically, the electrodes should have high resistivity to
2
control counting rate and preventing spread of discharge throughout the entire gas volume [27, 40, 41]. Itmust also have uniform surface to avoid localization of excess charge and to prevent alternating leakage pathduring the avalanche process.
Since INO-ICAL experiment is going to construct huge number of RPCs which in turn requires a largeamount of the electrode’s material, therefore, one factor that also becomes very important in the selection ofelectrodes is the ease of availability of it at a reasonable cost. We selected three types of glasses viz., SaintGobain, Asahi and Modi which are easily and readily available in the local market at a reasonable price forour R&D.
We performed the bulk resistivity and surface resistivity measurements of the electrodes to determinetheir electrical properties. The uneven surface texture of electrodes surface properties gives a profound effecton the detector performance because of the increase in dark current, counting rate and thus influencing theefficiency of the detector. For the purpose of determining the surface properties we performed ScanningElectron Microscopy (SEM) and Atomic Force Microscopy (AFM) analysis.
2.1.1 Bulk and Surface Resistivity
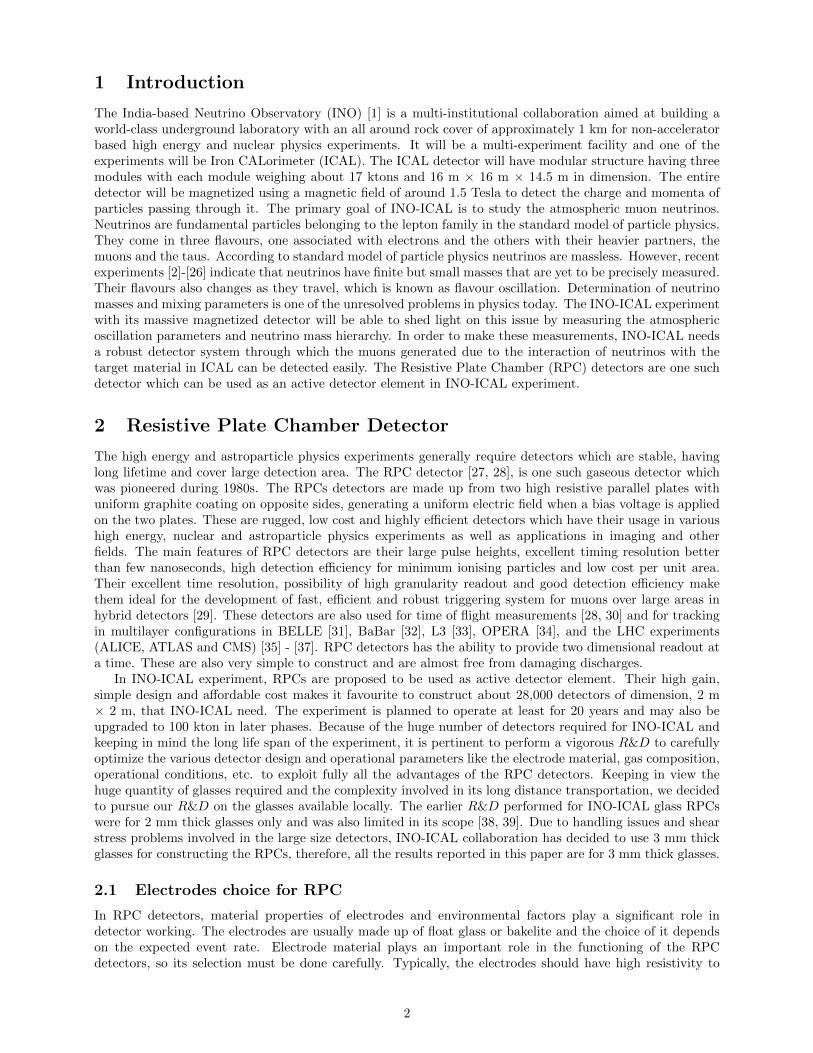
The bulk resistivity of the electrode material of the RPC was determined through the measurement of currentthrough the glass for a given bias voltage. The bulk resistivity has been measured using the glass samplescut into 3 cm × 3 cm of size. Two cables were soldered on two different copper plates which are connectedto the CAEN N471A high voltage power supply. The copper plates were placed on the adjacent flat surfacesof the glass sample and a bias voltage was applied across it. The current measured by the inbuilt ammeterinside CAEN N471A was noted down as a function of the applied voltage. Fig. 1 shows the bulk resistivityof the three types of glasses as a function of the applied bias voltage. The Saint Gobain glass was found tohave the maximum bulk resistivity among all the three samples. In the operating region of around 6 kV, theSaint Gobain bulk resistivity is of the order 5 × 10¹² Ω-cm on average. Asahi and Modi were found to behaving similar bulk resistivity and is approximately 1.5 × 10¹² Ω-cm in the operating region around 5 kV.The bulk resistivity measurements were repeated many times and the results varied within less than 5% fromits mean value.
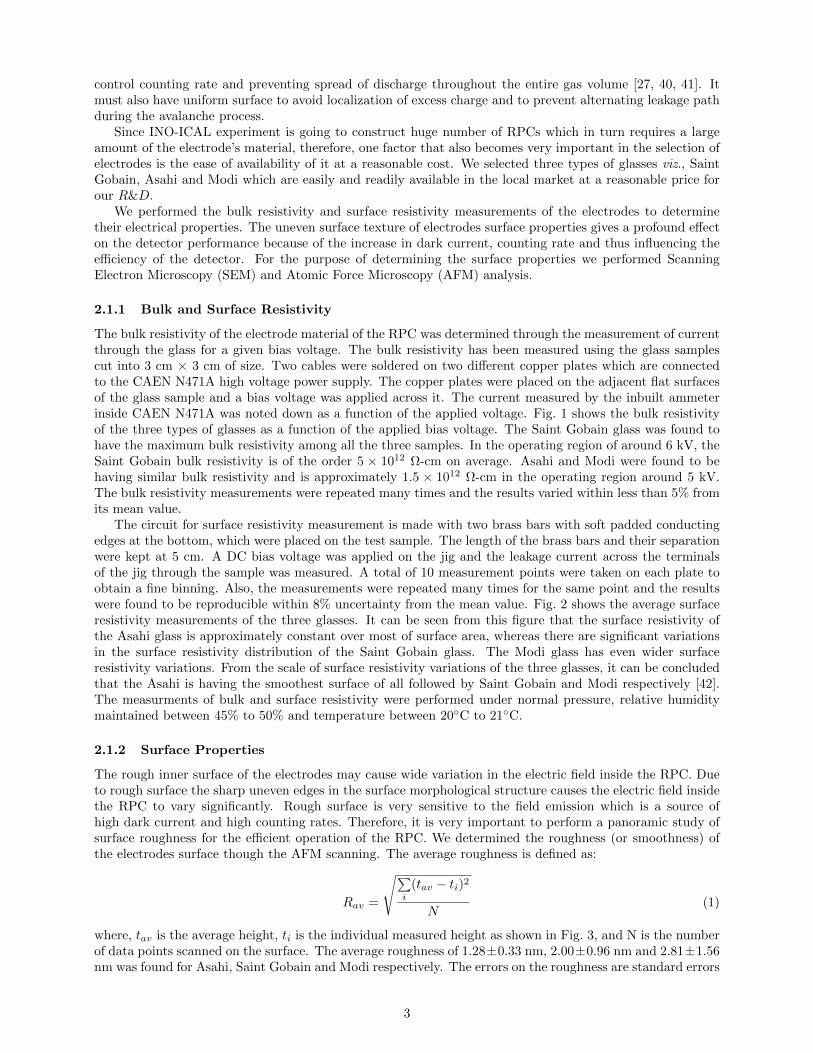
The circuit for surface resistivity measurement is made with two brass bars with soft padded conductingedges at the bottom, which were placed on the test sample. The length of the brass bars and their separationwere kept at 5 cm. A DC bias voltage was applied on the jig and the leakage current across the terminalsof the jig through the sample was measured. A total of 10 measurement points were taken on each plate toobtain a fine binning. Also, the measurements were repeated many times for the same point and the resultswere found to be reproducible within 8% uncertainty from the mean value. Fig. 2 shows the average surfaceresistivity measurements of the three glasses. It can be seen from this figure that the surface resistivity ofthe Asahi glass is approximately constant over most of surface area, whereas there are significant variationsin the surface resistivity distribution of the Saint Gobain glass. The Modi glass has even wider surfaceresistivity variations. From the scale of surface resistivity variations of the three glasses, it can be concludedthat the Asahi is having the smoothest surface of all followed by Saint Gobain and Modi respectively [42].The measurments of bulk and surface resistivity were performed under normal pressure, relative humiditymaintained between 45% to 50% and temperature between 20C to 21C.
2.1.2 Surface Properties
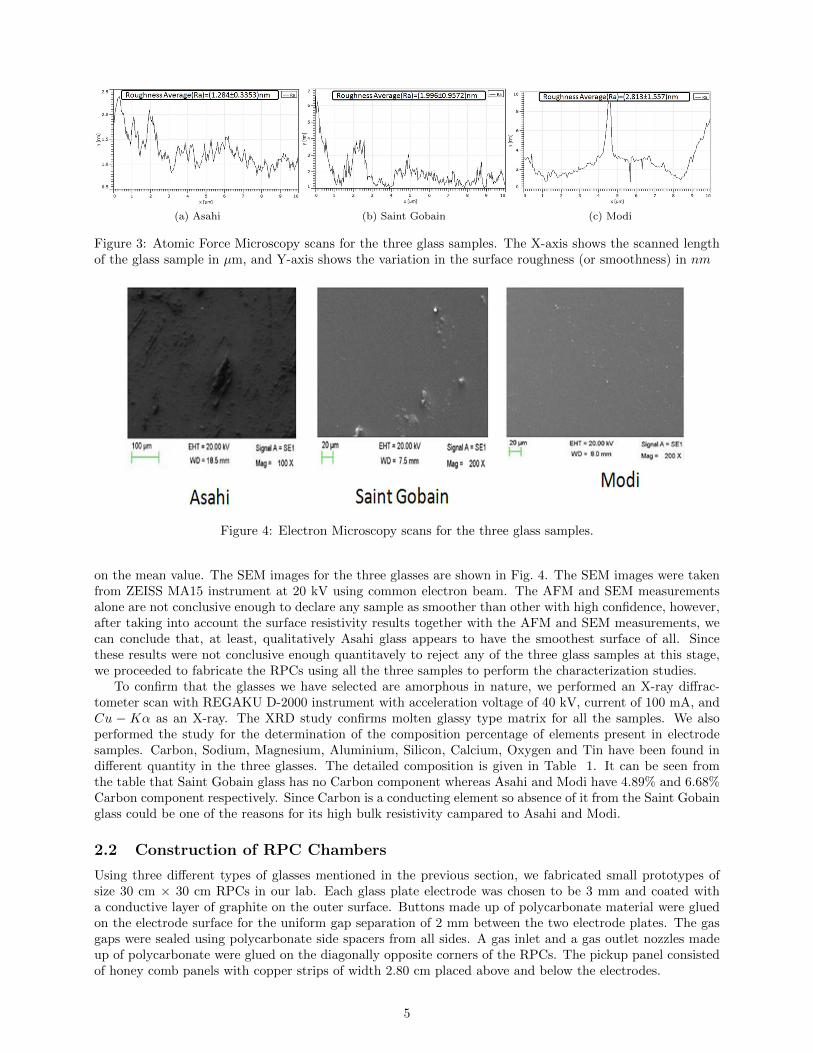
The rough inner surface of the electrodes may cause wide variation in the electric field inside the RPC. Dueto rough surface the sharp uneven edges in the surface morphological structure causes the electric field insidethe RPC to vary significantly. Rough surface is very sensitive to the field emission which is a source ofhigh dark current and high counting rates. Therefore, it is very important to perform a panoramic study ofsurface roughness for the efficient operation of the RPC. We determined the roughness (or smoothness) ofthe electrodes surface though the AFM scanning. The average roughness is defined as:
Rav =
√∑i
(tav − ti)2
N(1)
where, tav is the average height, ti is the individual measured height as shown in Fig. 3, and N is the numberof data points scanned on the surface. The average roughness of 1.28±0.33 nm, 2.00±0.96 nm and 2.81±1.56nm was found for Asahi, Saint Gobain and Modi respectively. The errors on the roughness are standard errors
3
Voltage(kV)
2000 3000 4000 5000 6000
Bulk
Resitiv
ity(O
hm
cm
)
0
5
10
15
20
25
30
1210×
Asahi
Saint Gobain
Modi
Figure 1: Bulk Resistivity of all the three types of glasses in Ω-cm as a function of the applied voltage.
Xaxis (cm)4 6 8 10 12 14 16 18 20
Ya
xis
(c
m)
4
6
8
10
12
14
16
18
20
22
1.65
1.7
1.75
1.8
1.85
1.9
1.95
2
(a) Asahi
Xaxis (cm)4 6 8 10 12 14 16 18 20
Ya
xis
(c
m)
4
6
8
10
12
14
16
18
20
22
1.2
1.3
1.4
1.5
1.6
1.7
1.8
1.9
2
(b) Saint Gobain
Xaxis (cm)4 6 8 10 12 14 16 18 20
Ya
xis
(c
m)
4
6
8
10
12
14
16
18
20
22
0.4
0.5
0.6
0.7
0.8
0.9
1
1.1
1.2
(c) Modi
Figure 2: Surface Resistivity for all the three glasses. The X and Y axes are the length and breadth incentimeters of the glass plates whose surface resistivity was measured. The intensity of the colours indicatesthe value of the surface resisitivity in 1011Ω/ and the variation in colours represents the variation in thesurface resistivity at different points across the glass plate.
4
(a) Asahi (b) Saint Gobain (c) Modi
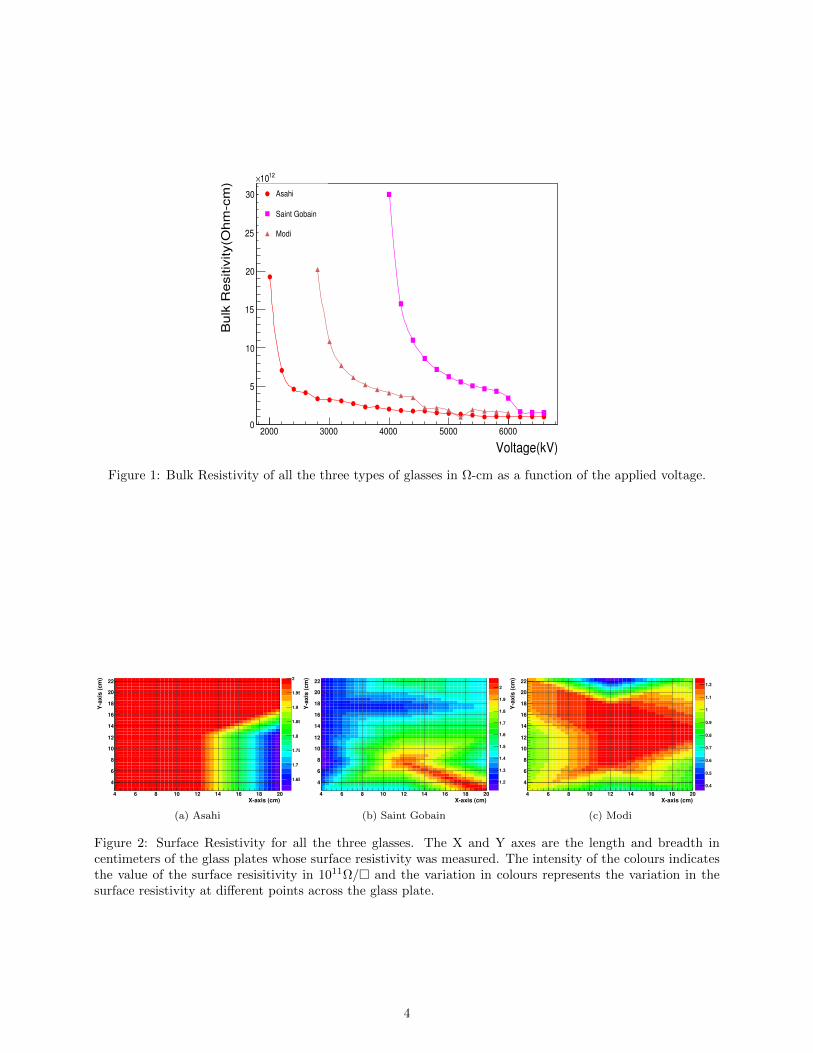
Figure 3: Atomic Force Microscopy scans for the three glass samples. The X-axis shows the scanned lengthof the glass sample in µm, and Y-axis shows the variation in the surface roughness (or smoothness) in nm
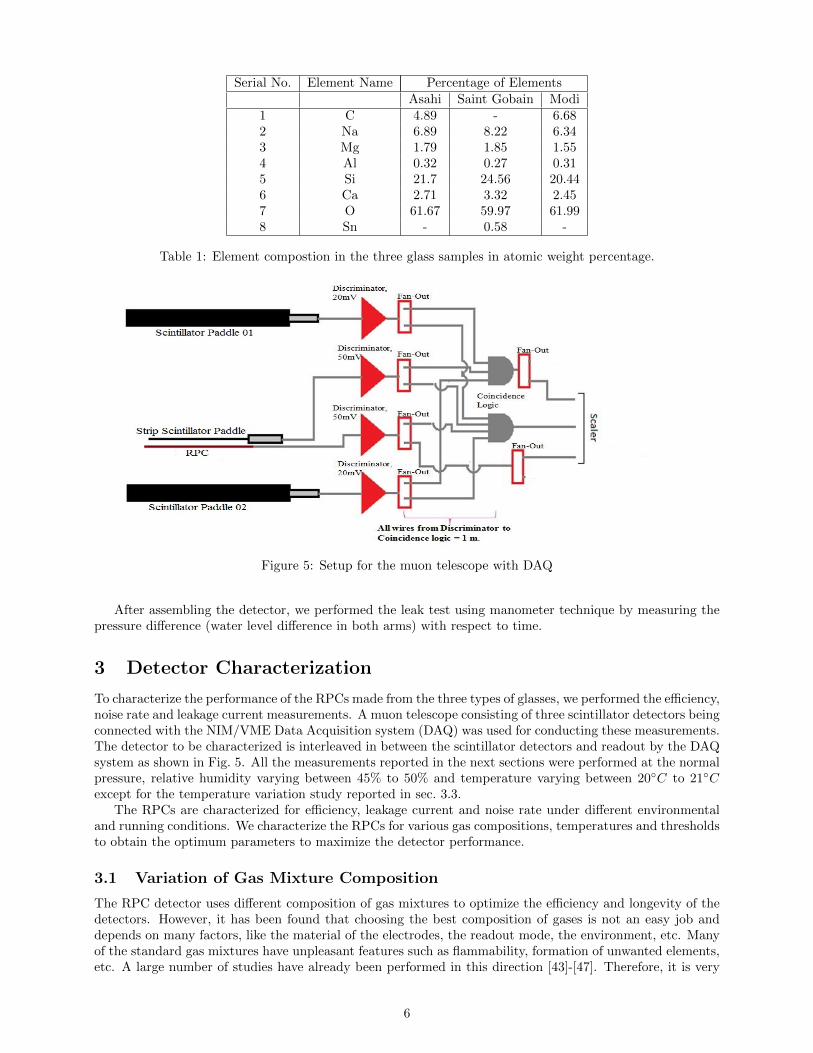
Figure 4: Electron Microscopy scans for the three glass samples.
on the mean value. The SEM images for the three glasses are shown in Fig. 4. The SEM images were takenfrom ZEISS MA15 instrument at 20 kV using common electron beam. The AFM and SEM measurementsalone are not conclusive enough to declare any sample as smoother than other with high confidence, however,after taking into account the surface resistivity results together with the AFM and SEM measurements, wecan conclude that, at least, qualitatively Asahi glass appears to have the smoothest surface of all. Sincethese results were not conclusive enough quantitavely to reject any of the three glass samples at this stage,we proceeded to fabricate the RPCs using all the three samples to perform the characterization studies.
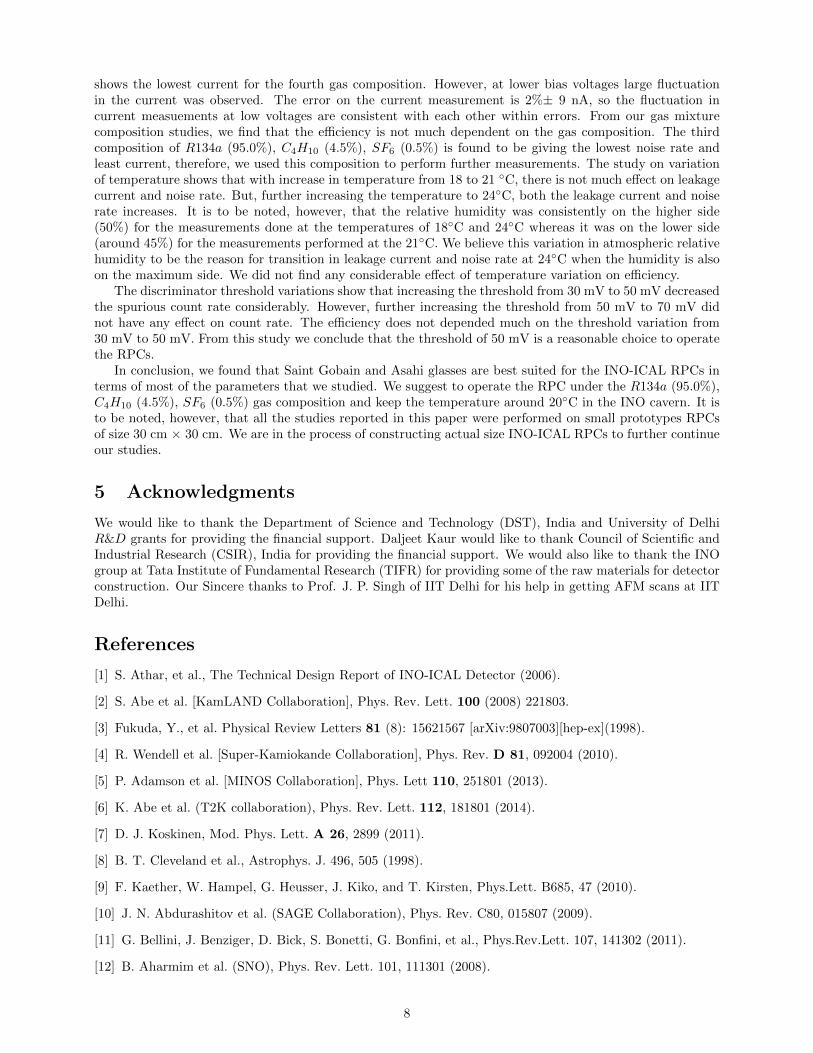
To confirm that the glasses we have selected are amorphous in nature, we performed an X-ray diffrac-tometer scan with REGAKU D-2000 instrument with acceleration voltage of 40 kV, current of 100 mA, andCu − Kα as an X-ray. The XRD study confirms molten glassy type matrix for all the samples. We alsoperformed the study for the determination of the composition percentage of elements present in electrodesamples. Carbon, Sodium, Magnesium, Aluminium, Silicon, Calcium, Oxygen and Tin have been found indifferent quantity in the three glasses. The detailed composition is given in Table 1. It can be seen fromthe table that Saint Gobain glass has no Carbon component whereas Asahi and Modi have 4.89% and 6.68%Carbon component respectively. Since Carbon is a conducting element so absence of it from the Saint Gobainglass could be one of the reasons for its high bulk resistivity campared to Asahi and Modi.
2.2 Construction of RPC Chambers
Using three different types of glasses mentioned in the previous section, we fabricated small prototypes ofsize 30 cm × 30 cm RPCs in our lab. Each glass plate electrode was chosen to be 3 mm and coated witha conductive layer of graphite on the outer surface. Buttons made up of polycarbonate material were gluedon the electrode surface for the uniform gap separation of 2 mm between the two electrode plates. The gasgaps were sealed using polycarbonate side spacers from all sides. A gas inlet and a gas outlet nozzles madeup of polycarbonate were glued on the diagonally opposite corners of the RPCs. The pickup panel consistedof honey comb panels with copper strips of width 2.80 cm placed above and below the electrodes.
5
Serial No. Element Name Percentage of ElementsAsahi Saint Gobain Modi
1 C 4.89 - 6.682 Na 6.89 8.22 6.343 Mg 1.79 1.85 1.554 Al 0.32 0.27 0.315 Si 21.7 24.56 20.446 Ca 2.71 3.32 2.457 O 61.67 59.97 61.998 Sn - 0.58 -
Table 1: Element compostion in the three glass samples in atomic weight percentage.
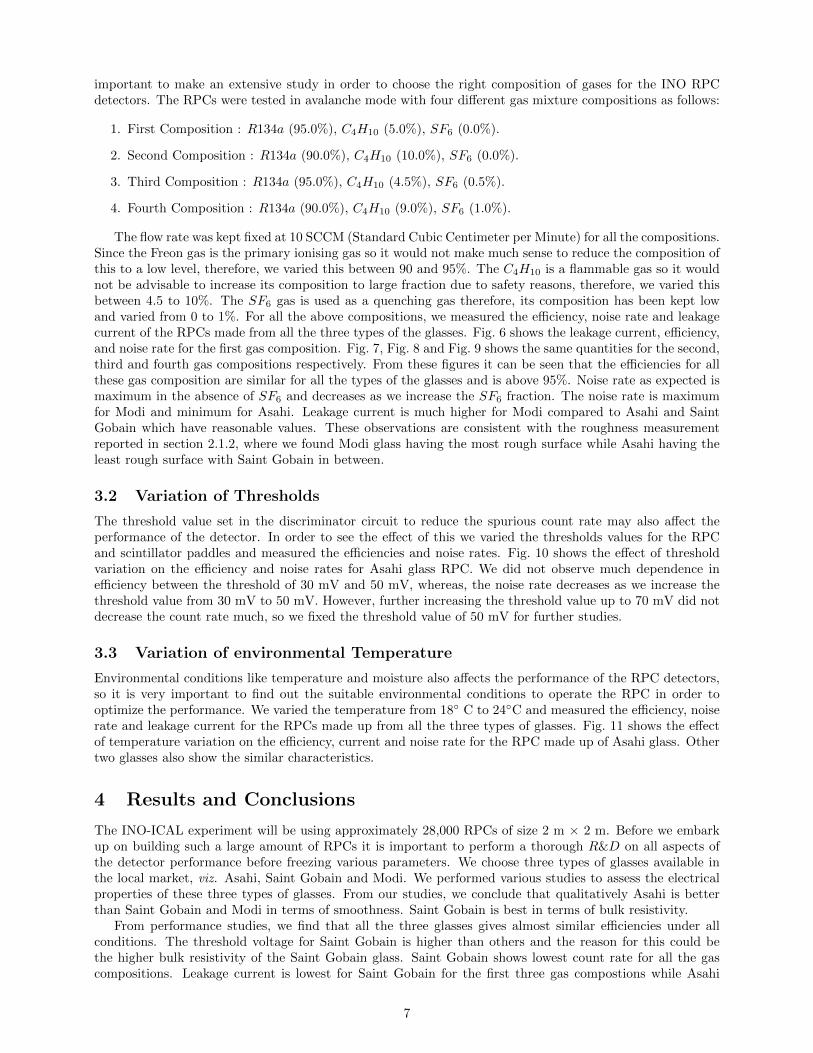
Figure 5: Setup for the muon telescope with DAQ
After assembling the detector, we performed the leak test using manometer technique by measuring thepressure difference (water level difference in both arms) with respect to time.
3 Detector Characterization
To characterize the performance of the RPCs made from the three types of glasses, we performed the efficiency,noise rate and leakage current measurements. A muon telescope consisting of three scintillator detectors beingconnected with the NIM/VME Data Acquisition system (DAQ) was used for conducting these measurements.The detector to be characterized is interleaved in between the scintillator detectors and readout by the DAQsystem as shown in Fig. 5. All the measurements reported in the next sections were performed at the normalpressure, relative humidity varying between 45% to 50% and temperature varying between 20C to 21Cexcept for the temperature variation study reported in sec. 3.3.
The RPCs are characterized for efficiency, leakage current and noise rate under different environmentaland running conditions. We characterize the RPCs for various gas compositions, temperatures and thresholdsto obtain the optimum parameters to maximize the detector performance.
3.1 Variation of Gas Mixture Composition
The RPC detector uses different composition of gas mixtures to optimize the efficiency and longevity of thedetectors. However, it has been found that choosing the best composition of gases is not an easy job anddepends on many factors, like the material of the electrodes, the readout mode, the environment, etc. Manyof the standard gas mixtures have unpleasant features such as flammability, formation of unwanted elements,etc. A large number of studies have already been performed in this direction [43]-[47]. Therefore, it is very
6
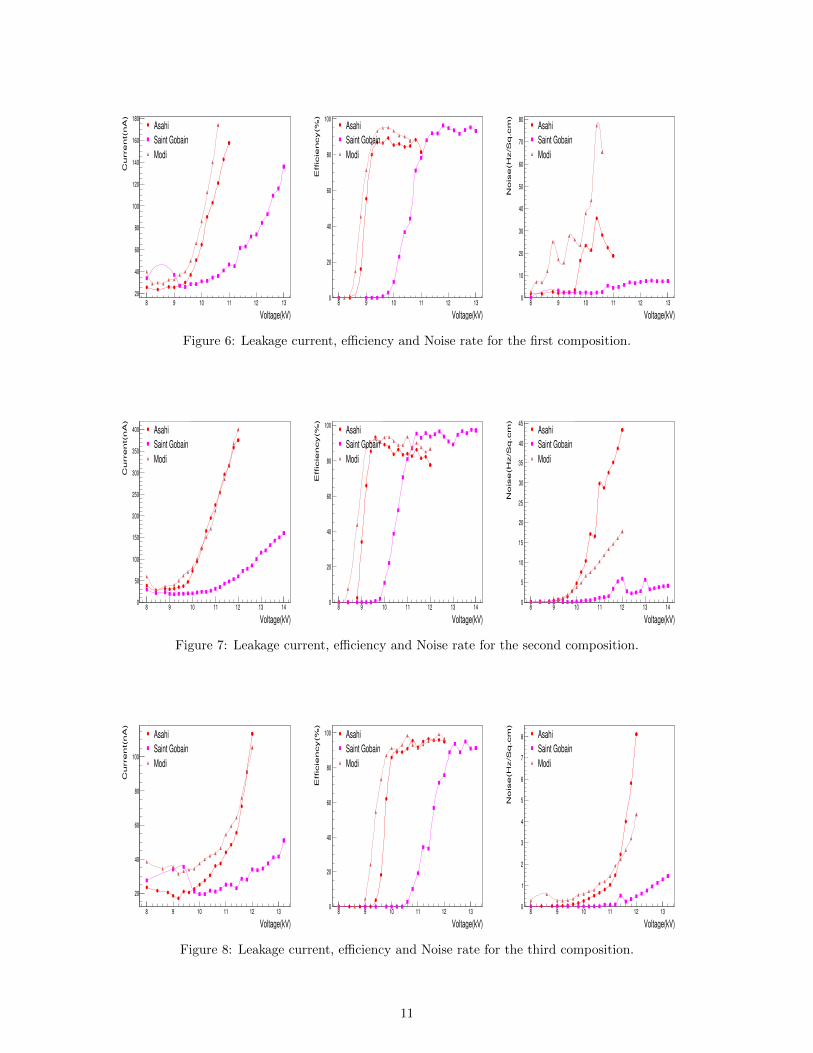
important to make an extensive study in order to choose the right composition of gases for the INO RPCdetectors. The RPCs were tested in avalanche mode with four different gas mixture compositions as follows:
1. First Composition : R134a (95.0%), C4H10 (5.0%), SF6 (0.0%).
2. Second Composition : R134a (90.0%), C4H10 (10.0%), SF6 (0.0%).
3. Third Composition : R134a (95.0%), C4H10 (4.5%), SF6 (0.5%).
4. Fourth Composition : R134a (90.0%), C4H10 (9.0%), SF6 (1.0%).
The flow rate was kept fixed at 10 SCCM (Standard Cubic Centimeter per Minute) for all the compositions.Since the Freon gas is the primary ionising gas so it would not make much sense to reduce the composition ofthis to a low level, therefore, we varied this between 90 and 95%. The C4H10 is a flammable gas so it wouldnot be advisable to increase its composition to large fraction due to safety reasons, therefore, we varied thisbetween 4.5 to 10%. The SF6 gas is used as a quenching gas therefore, its composition has been kept lowand varied from 0 to 1%. For all the above compositions, we measured the efficiency, noise rate and leakagecurrent of the RPCs made from all the three types of the glasses. Fig. 6 shows the leakage current, efficiency,and noise rate for the first gas composition. Fig. 7, Fig. 8 and Fig. 9 shows the same quantities for the second,third and fourth gas compositions respectively. From these figures it can be seen that the efficiencies for allthese gas composition are similar for all the types of the glasses and is above 95%. Noise rate as expected ismaximum in the absence of SF6 and decreases as we increase the SF6 fraction. The noise rate is maximumfor Modi and minimum for Asahi. Leakage current is much higher for Modi compared to Asahi and SaintGobain which have reasonable values. These observations are consistent with the roughness measurementreported in section 2.1.2, where we found Modi glass having the most rough surface while Asahi having theleast rough surface with Saint Gobain in between.
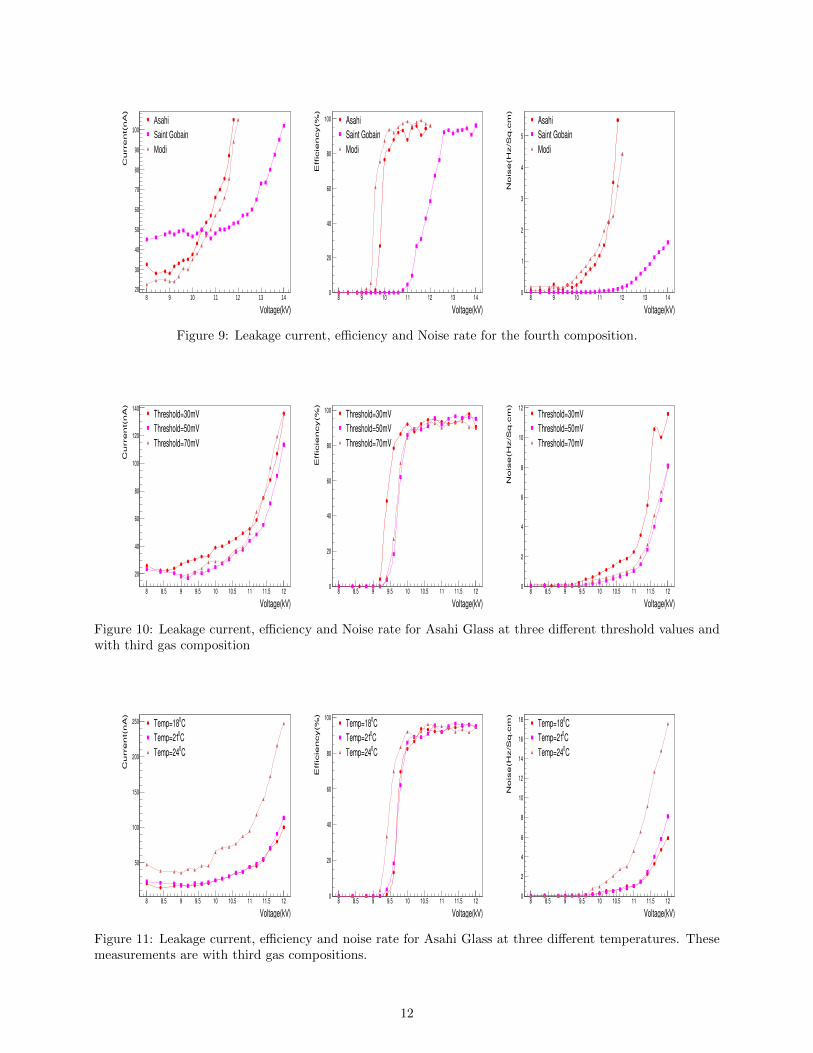
3.2 Variation of Thresholds
The threshold value set in the discriminator circuit to reduce the spurious count rate may also affect theperformance of the detector. In order to see the effect of this we varied the thresholds values for the RPCand scintillator paddles and measured the efficiencies and noise rates. Fig. 10 shows the effect of thresholdvariation on the efficiency and noise rates for Asahi glass RPC. We did not observe much dependence inefficiency between the threshold of 30 mV and 50 mV, whereas, the noise rate decreases as we increase thethreshold value from 30 mV to 50 mV. However, further increasing the threshold value up to 70 mV did notdecrease the count rate much, so we fixed the threshold value of 50 mV for further studies.
3.3 Variation of environmental Temperature
Environmental conditions like temperature and moisture also affects the performance of the RPC detectors,so it is very important to find out the suitable environmental conditions to operate the RPC in order tooptimize the performance. We varied the temperature from 18 C to 24C and measured the efficiency, noiserate and leakage current for the RPCs made up from all the three types of glasses. Fig. 11 shows the effectof temperature variation on the efficiency, current and noise rate for the RPC made up of Asahi glass. Othertwo glasses also show the similar characteristics.
4 Results and Conclusions
The INO-ICAL experiment will be using approximately 28,000 RPCs of size 2 m × 2 m. Before we embarkup on building such a large amount of RPCs it is important to perform a thorough R&D on all aspects ofthe detector performance before freezing various parameters. We choose three types of glasses available inthe local market, viz. Asahi, Saint Gobain and Modi. We performed various studies to assess the electricalproperties of these three types of glasses. From our studies, we conclude that qualitatively Asahi is betterthan Saint Gobain and Modi in terms of smoothness. Saint Gobain is best in terms of bulk resistivity.
From performance studies, we find that all the three glasses gives almost similar efficiencies under allconditions. The threshold voltage for Saint Gobain is higher than others and the reason for this could bethe higher bulk resistivity of the Saint Gobain glass. Saint Gobain shows lowest count rate for all the gascompositions. Leakage current is lowest for Saint Gobain for the first three gas compostions while Asahi
7
shows the lowest current for the fourth gas composition. However, at lower bias voltages large fluctuationin the current was observed. The error on the current measurement is 2%± 9 nA, so the fluctuation incurrent measuements at low voltages are consistent with each other within errors. From our gas mixturecomposition studies, we find that the efficiency is not much dependent on the gas composition. The thirdcomposition of R134a (95.0%), C4H10 (4.5%), SF6 (0.5%) is found to be giving the lowest noise rate andleast current, therefore, we used this composition to perform further measurements. The study on variationof temperature shows that with increase in temperature from 18 to 21 C, there is not much effect on leakagecurrent and noise rate. But, further increasing the temperature to 24C, both the leakage current and noiserate increases. It is to be noted, however, that the relative humidity was consistently on the higher side(50%) for the measurements done at the temperatures of 18C and 24C whereas it was on the lower side(around 45%) for the measurements performed at the 21C. We believe this variation in atmospheric relativehumidity to be the reason for transition in leakage current and noise rate at 24C when the humidity is alsoon the maximum side. We did not find any considerable effect of temperature variation on efficiency.
The discriminator threshold variations show that increasing the threshold from 30 mV to 50 mV decreasedthe spurious count rate considerably. However, further increasing the threshold from 50 mV to 70 mV didnot have any effect on count rate. The efficiency does not depended much on the threshold variation from30 mV to 50 mV. From this study we conclude that the threshold of 50 mV is a reasonable choice to operatethe RPCs.
In conclusion, we found that Saint Gobain and Asahi glasses are best suited for the INO-ICAL RPCs interms of most of the parameters that we studied. We suggest to operate the RPC under the R134a (95.0%),C4H10 (4.5%), SF6 (0.5%) gas composition and keep the temperature around 20C in the INO cavern. It isto be noted, however, that all the studies reported in this paper were performed on small prototypes RPCsof size 30 cm × 30 cm. We are in the process of constructing actual size INO-ICAL RPCs to further continueour studies.
5 Acknowledgments
We would like to thank the Department of Science and Technology (DST), India and University of DelhiR&D grants for providing the financial support. Daljeet Kaur would like to thank Council of Scientific andIndustrial Research (CSIR), India for providing the financial support. We would also like to thank the INOgroup at Tata Institute of Fundamental Research (TIFR) for providing some of the raw materials for detectorconstruction. Our Sincere thanks to Prof. J. P. Singh of IIT Delhi for his help in getting AFM scans at IITDelhi.
References
[1] S. Athar, et al., The Technical Design Report of INO-ICAL Detector (2006).
[2] S. Abe et al. [KamLAND Collaboration], Phys. Rev. Lett. 100 (2008) 221803.
[3] Fukuda, Y., et al. Physical Review Letters 81 (8): 15621567 [arXiv:9807003][hep-ex](1998).
[4] R. Wendell et al. [Super-Kamiokande Collaboration], Phys. Rev. D 81, 092004 (2010).
[5] P. Adamson et al. [MINOS Collaboration], Phys. Lett 110, 251801 (2013).
[6] K. Abe et al. (T2K collaboration), Phys. Rev. Lett. 112, 181801 (2014).
[7] D. J. Koskinen, Mod. Phys. Lett. A 26, 2899 (2011).
[8] B. T. Cleveland et al., Astrophys. J. 496, 505 (1998).
[9] F. Kaether, W. Hampel, G. Heusser, J. Kiko, and T. Kirsten, Phys.Lett. B685, 47 (2010).
[10] J. N. Abdurashitov et al. (SAGE Collaboration), Phys. Rev. C80, 015807 (2009).
[11] G. Bellini, J. Benziger, D. Bick, S. Bonetti, G. Bonfini, et al., Phys.Rev.Lett. 107, 141302 (2011).
[12] B. Aharmim et al. (SNO), Phys. Rev. Lett. 101, 111301 (2008).
8
[13] B. Aharmim et al. (SNO), Phys. Rev. C81, 055504 (2010).
[14] J. Hosaka et al. (Super-Kamkiokande), Phys. Rev. D73, 112001 (2006), [arXiv:0508053][hep-ex].
[15] J. Cravens et al. (Super-Kamiokande Collaboration), Phys.Rev. D78, 032002 (2008).
[16] K. Abe et al. (Super-Kamiokande Collaboration), Phys.Rev. D83, 052010 (2011).
[17] Renshaw (Super-Kamiokande Collaboration) (2014), 1403.4575.
[18] The Super-Kamiokande Collaboration, Phys. Rev. Lett. 112, 091805(2014), [arXiv:1312.5176]
[19] [KamlLAND Collaboration] ”Precision Measurement of Neutrino Oscillation Parameters with Kam-LAND”, Phys. Rev. Lett. 100(22) 221803 [arXiv:0801.4589].
[20] Y. Abe et al. [Double Chooz Collaboration], Phys. Rev.D 86, 052008 (2012).
[21] DAYA-BAY Collaboration, F. An et al., Phys. Rev. Lett. 108, 171803 (2012), [arXiv:1203.1669].
[22] RENO collaboration, J. Ahn et al., Phys. Rev. Lett. 108, 191802 (2012),[arXiv:1204.0626].
[23] P. Adamson et al., Phys.Rev.Lett. 110, 171801 (2013)
[24] P. Adamson et al. [MINOS Collaboration], Phys. Lett 110 (2013) 251801.
[25] K. Abe et al.(T2K collaboration), Phys. Rev. Lett. 112 (2014) 181801.
[26] F.Capozzi et al., Phys. Rev.D 89 093018.
[27] R. Santonico, R. Cardarelli, Nucl. Instr. and Meth. A 187 (1981) 377.
[28] R. Santonico, R. Cardarelli, Nucl. Instr. and Meth. A 263 (1988) 20.
[29] G. Bencze et al., Nucl. Instr. and Meth. A 340 (1994) 466.
[30] A. Blanco et al., Nucl. Instr. and Meth. A 513 (2003) 8.
[31] A. Abashian et al., The Belle Detector, Nucl. Instr. and Meth. A 479 (2002)
[32] BaBar Collaboration, BaBar Technical Design Report, SLAC Report SLAC-R-95-457 (1995).
[33] L3 Collaboration, B. Adeva, et al., The construction of L3 experiment, Nucl. Instr. Meth. A 289 (1990)35.
[34] OPERA Collaboration, M. Guler et al., An appearance experiment to search for νmu-νtau oscillationsin the CNGS beam: experimental proposal, CERN/SPSC 2000-028 (2000).
[35] ALICE Collaboration, ALICE Technical Design Report of the time-of-flight system (TOF), CERN-LHCC 2000-12 (2000).
[36] ATLAS Collaboration, ATLAS muon spectrometer: Technical Design Report, CERN-LHCC 97-22(1997).
[37] CMS Collabration, Technical Proposal, CERN-LHCC-94-38 (1994); CMS Collaboration JINST, 3 (2008)S08004.
[38] Sarika Bhide, V.M. Datar, Satyajit Jena, S.D. Kalmani, N.K. Mondal, G.K. Padmashree, B. Satya-narayan, R.R. Shinde, P. Verma, Pramana, Journal of Physics 69(6) (2007) 1015-1023.
[39] V.M. Datar, Satyajit Jena, S.D. Kalmani, N.K. Mondal, P. Nagaraj, L.V. Reddy, M.Saraf, B. Satya-narayan, R.R. Shinde, P. Verma, Nucl. Instr. and Meth. 602 (2009) 744-748.
[40] H. Czyrkowski, et al., Nucl. Instr. Meth. A 419 (1998).
[41] R. Cardarelli, A. Di Ciaccio and R. Santonico, Nucl. Instr. Meth. A 333 (1993).
[42] K. K. Meghna, et al., JINST 7 P10003 (2012).
9
[43] A. Mengucci, A. Paoloni, M. Spinetti, L. Votano, Nucl. Instr. Meth. A 583 (2007) 264-269.
[44] M. Cwoik, W. Dominik, M. Gorski, J. Krolikowski, Nucl. Instr. Meth. A 508 (2003) 38-43.
[45] MA Lie-Hua, et al., Chinese Physics C 34(8) 2010, 1116-1121.
[46] M. Salim, R. Hasan, N. Majumdar, S. Mukhopadhayay, B. Satyanarayana, JINST 7 P11019 (2012).
[47] K. Abe, et al., Nucl. Instr. Meth. A 455 (2000) 397-404.
10
Voltage(kV)
8 9 10 11 12 13
Cu
rre
nt(n
A)
20
40
60
80
100
120
140
160
180Asahi
Saint Gobain
Modi
Voltage(kV)
8 9 10 11 12 13
Effic
ien
cy(%
)
0
20
40
60
80
100Asahi
Saint Gobain
Modi
Voltage(kV)
8 9 10 11 12 13
No
ise
(H
z/S
q.cm
)
0
10
20
30
40
50
60
70
80Asahi
Saint Gobain
Modi
Figure 6: Leakage current, efficiency and Noise rate for the first composition.
Voltage(kV)
8 9 10 11 12 13 14
Cu
rre
nt(n
A)
0
50
100
150
200
250
300
350
400 Asahi
Saint Gobain
Modi
Voltage(kV)
8 9 10 11 12 13 14
Effic
ien
cy(%
)
0
20
40
60
80
100Asahi
Saint Gobain
Modi
Voltage(kV)
8 9 10 11 12 13 14
No
ise
(H
z/S
q.cm
)
0
5
10
15
20
25
30
35
40
45Asahi
Saint Gobain
Modi
Figure 7: Leakage current, efficiency and Noise rate for the second composition.
Voltage(kV)
8 9 10 11 12 13
Cu
rre
nt(n
A)
20
40
60
80
100
Asahi
Saint Gobain
Modi
Voltage(kV)
8 9 10 11 12 13
Effic
ien
cy(%
)
0
20
40
60
80
100 Asahi
Saint Gobain
Modi
Voltage(kV)
8 9 10 11 12 13
No
ise
(H
z/S
q.cm
)
0
1
2
3
4
5
6
7
8 Asahi
Saint Gobain
Modi
Figure 8: Leakage current, efficiency and Noise rate for the third composition.
11
Voltage(kV)8 9 10 11 12 13 14
Cu
rre
nt(
nA
)
20
30
40
50
60
70
80
90
100AsahiSaint GobainModi
Voltage(kV)
8 9 10 11 12 13 14
Effic
ien
cy(%
)
0
20
40
60
80
100 Asahi
Saint Gobain
Modi
Voltage(kV)
8 9 10 11 12 13 14
No
ise
(H
z/S
q.cm
)
0
1
2
3
4
5
Asahi
Saint Gobain
Modi
Figure 9: Leakage current, efficiency and Noise rate for the fourth composition.
Voltage(kV)
8 8.5 9 9.5 10 10.5 11 11.5 12
Cu
rre
nt(n
A)
20
40
60
80
100
120
140Threshold=30mV
Threshold=50mV
Threshold=70mV
Voltage(kV)
8 8.5 9 9.5 10 10.5 11 11.5 12
Effic
ien
cy(%
)
0
20
40
60
80
100 Threshold=30mV
Threshold=50mV
Threshold=70mV
Voltage(kV)
8 8.5 9 9.5 10 10.5 11 11.5 12
No
ise
(H
z/S
q.cm
)
0
2
4
6
8
10
12Threshold=30mV
Threshold=50mV
Threshold=70mV
Figure 10: Leakage current, efficiency and Noise rate for Asahi Glass at three different threshold values andwith third gas composition
Voltage(kV)
8 8.5 9 9.5 10 10.5 11 11.5 12
Cu
rre
nt(n
A)
50
100
150
200
250 C0
Temp=18
C0
Temp=21
C0
Temp=24
Voltage(kV)
8 8.5 9 9.5 10 10.5 11 11.5 12
Effic
ien
cy(%
)
0
20
40
60
80
100C
0Temp=18
C0
Temp=21
C0
Temp=24
Voltage(kV)
8 8.5 9 9.5 10 10.5 11 11.5 12
No
ise
(H
z/S
q.cm
)
0
2
4
6
8
10
12
14
16
18 C0
Temp=18
C0
Temp=21
C0
Temp=24
Figure 11: Leakage current, efficiency and noise rate for Asahi Glass at three different temperatures. Thesemeasurements are with third gas compositions.
12