dallas county - irving isd - 2010 pride survey
TRANSCRIPT

8/7/2019 DALLAS COUNTY - Irving ISD - 2010 Pride Survey
http://slidepdf.com/reader/full/dallas-county-irving-isd-2010-pride-survey 1/239
PRIDESurveys
Questionnaire Report for Grades 6 to 12
2009-10 Irving Independent Schools
Irving, TX
April 15, 2010

8/7/2019 DALLAS COUNTY - Irving ISD - 2010 Pride Survey
http://slidepdf.com/reader/full/dallas-county-irving-isd-2010-pride-survey 2/239
Contents
1 Introduction 15
1.1 How To Use Your Data . . . . . . . . . . . . . . . . . . . . . . . . . . . . . . . . . . . . . . . . . . . . . . . . . . . . . . . . . . . . . . . . . . 15
1.2 Local Use vs. National Use . . . . . . . . . . . . . . . . . . . . . . . . . . . . . . . . . . . . . . . . . . . . . . . . . . . . . . . . . . . . . . . 16
1.2.1 Annual Use . . . . . . . . . . . . . . . . . . . . . . . . . . . . . . . . . . . . . . . . . . . . . . . . . . . . . . . . . . . . . . . . . . . . 16
1.2.2 Monthly Use . . . . . . . . . . . . . . . . . . . . . . . . . . . . . . . . . . . . . . . . . . . . . . . . . . . . . . . . . . . . . . . . . . . 18
2 Summary 21
2.1 Core Measures . . . . . . . . . . . . . . . . . . . . . . . . . . . . . . . . . . . . . . . . . . . . . . . . . . . . . . . . . . . . . . . . . . . . . . 22
2.2 Annual and Monthly Use . . . . . . . . . . . . . . . . . . . . . . . . . . . . . . . . . . . . . . . . . . . . . . . . . . . . . . . . . . . . . . . . . 22
2.3 Where Students Use . . . . . . . . . . . . . . . . . . . . . . . . . . . . . . . . . . . . . . . . . . . . . . . . . . . . . . . . . . . . . . . . . . . 23
2.4 When Students Use . . . . . . . . . . . . . . . . . . . . . . . . . . . . . . . . . . . . . . . . . . . . . . . . . . . . . . . . . . . . . . . . . . . 23
2.5 Risk Factors . . . . . . . . . . . . . . . . . . . . . . . . . . . . . . . . . . . . . . . . . . . . . . . . . . . . . . . . . . . . . . . . . . . . . . . 23
2.6 Protective Factors . . . . . . . . . . . . . . . . . . . . . . . . . . . . . . . . . . . . . . . . . . . . . . . . . . . . . . . . . . . . . . . . . . . . 23
3 Graphics 24
3.1 Frequency of Use . . . . . . . . . . . . . . . . . . . . . . . . . . . . . . . . . . . . . . . . . . . . . . . . . . . . . . . . . . . . . . . . . . . . 25
3.1.1 Annual Use . . . . . . . . . . . . . . . . . . . . . . . . . . . . . . . . . . . . . . . . . . . . . . . . . . . . . . . . . . . . . . . . . . . . 253.1.2 30-Day Use . . . . . . . . . . . . . . . . . . . . . . . . . . . . . . . . . . . . . . . . . . . . . . . . . . . . . . . . . . . . . . . . . . . . 33
3.2 Perception of Risk . . . . . . . . . . . . . . . . . . . . . . . . . . . . . . . . . . . . . . . . . . . . . . . . . . . . . . . . . . . . . . . . . . . . 41
3.3 Perception of Parental Disapproval . . . . . . . . . . . . . . . . . . . . . . . . . . . . . . . . . . . . . . . . . . . . . . . . . . . . . . . . . . . 51
3.4 Perception of Friends’ Disapproval . . . . . . . . . . . . . . . . . . . . . . . . . . . . . . . . . . . . . . . . . . . . . . . . . . . . . . . . . . . 55
3.5 Average Age of Onset of Use . . . . . . . . . . . . . . . . . . . . . . . . . . . . . . . . . . . . . . . . . . . . . . . . . . . . . . . . . . . . . . 59
3.6 Student Information . . . . . . . . . . . . . . . . . . . . . . . . . . . . . . . . . . . . . . . . . . . . . . . . . . . . . . . . . . . . . . . . . . . 75
3.7 Availability . . . . . . . . . . . . . . . . . . . . . . . . . . . . . . . . . . . . . . . . . . . . . . . . . . . . . . . . . . . . . . . . . . . . . . . . 86
3.8 Where Do You Use . . . . . . . . . . . . . . . . . . . . . . . . . . . . . . . . . . . . . . . . . . . . . . . . . . . . . . . . . . . . . . . . . . . . 90
3.9 When Do You Use . . . . . . . . . . . . . . . . . . . . . . . . . . . . . . . . . . . . . . . . . . . . . . . . . . . . . . . . . . . . . . . . . . . . 100
2

8/7/2019 DALLAS COUNTY - Irving ISD - 2010 Pride Survey
http://slidepdf.com/reader/full/dallas-county-irving-isd-2010-pride-survey 3/239
3.10 Drug Use by Gender . . . . . . . . . . . . . . . . . . . . . . . . . . . . . . . . . . . . . . . . . . . . . . . . . . . . . . . . . . . . . . . . . . . 110
3.11 Risk and Protective Factors – Cross Tabulations . . . . . . . . . . . . . . . . . . . . . . . . . . . . . . . . . . . . . . . . . . . . . . . . . . . . 131
3.11.1 Attend Church or Synagogue . . . . . . . . . . . . . . . . . . . . . . . . . . . . . . . . . . . . . . . . . . . . . . . . . . . . . . . . . . 132
3.11.2 Take Part in Community Activities . . . . . . . . . . . . . . . . . . . . . . . . . . . . . . . . . . . . . . . . . . . . . . . . . . . . . . . . 133
3.11.3 Make Good Grades . . . . . . . . . . . . . . . . . . . . . . . . . . . . . . . . . . . . . . . . . . . . . . . . . . . . . . . . . . . . . . . 134
3.11.4 Take Part in Sports Teams . . . . . . . . . . . . . . . . . . . . . . . . . . . . . . . . . . . . . . . . . . . . . . . . . . . . . . . . . . . . 135
3.11.5 Take Part in School Activities . . . . . . . . . . . . . . . . . . . . . . . . . . . . . . . . . . . . . . . . . . . . . . . . . . . . . . . . . . 136
3.11.6 Get Into Trouble at School . . . . . . . . . . . . . . . . . . . . . . . . . . . . . . . . . . . . . . . . . . . . . . . . . . . . . . . . . . . . 137
3.11.7 Teachers Talk About Dangers of Drugs . . . . . . . . . . . . . . . . . . . . . . . . . . . . . . . . . . . . . . . . . . . . . . . . . . . . . 138
3.11.8 Parents Talk About Dangers of Drugs . . . . . . . . . . . . . . . . . . . . . . . . . . . . . . . . . . . . . . . . . . . . . . . . . . . . . . 139
3.11.9 Parents Set Clear Rules . . . . . . . . . . . . . . . . . . . . . . . . . . . . . . . . . . . . . . . . . . . . . . . . . . . . . . . . . . . . . 140
3.11.10Parents Punish for Breaking Rules . . . . . . . . . . . . . . . . . . . . . . . . . . . . . . . . . . . . . . . . . . . . . . . . . . . . . . . 141
3.12 Safety and Health – Cross Tabulations . . . . . . . . . . . . . . . . . . . . . . . . . . . . . . . . . . . . . . . . . . . . . . . . . . . . . . . . . 142
3.13 Carrying a Gun to School . . . . . . . . . . . . . . . . . . . . . . . . . . . . . . . . . . . . . . . . . . . . . . . . . . . . . . . . . . . . . . . . 143
3.14 Involvement in Gangs . . . . . . . . . . . . . . . . . . . . . . . . . . . . . . . . . . . . . . . . . . . . . . . . . . . . . . . . . . . . . . . . . . 144
3.15 Thinking About Suicide . . . . . . . . . . . . . . . . . . . . . . . . . . . . . . . . . . . . . . . . . . . . . . . . . . . . . . . . . . . . . . . . . 145
3.16 Being Overweight . . . . . . . . . . . . . . . . . . . . . . . . . . . . . . . . . . . . . . . . . . . . . . . . . . . . . . . . . . . . . . . . . . . . 1463.17 Threatening/Harmful Behaviors . . . . . . . . . . . . . . . . . . . . . . . . . . . . . . . . . . . . . . . . . . . . . . . . . . . . . . . . . . . . . 147
3.18 Trouble with Police . . . . . . . . . . . . . . . . . . . . . . . . . . . . . . . . . . . . . . . . . . . . . . . . . . . . . . . . . . . . . . . . . . . . 148
3.19 Personal Safety . . . . . . . . . . . . . . . . . . . . . . . . . . . . . . . . . . . . . . . . . . . . . . . . . . . . . . . . . . . . . . . . . . . . . 149
4 Percentage Tables 150
4.1 Personal & Family Information . . . . . . . . . . . . . . . . . . . . . . . . . . . . . . . . . . . . . . . . . . . . . . . . . . . . . . . . . . . . . . 151
4.2 Student Information . . . . . . . . . . . . . . . . . . . . . . . . . . . . . . . . . . . . . . . . . . . . . . . . . . . . . . . . . . . . . . . . . . . 155
4.3 Within The Past Year How Often Have You... . . . . . . . . . . . . . . . . . . . . . . . . . . . . . . . . . . . . . . . . . . . . . . . . . . . . . . 164
4.4 What Effect Do You Most Often Get When You Use . . . . . . . . . . . . . . . . . . . . . . . . . . . . . . . . . . . . . . . . . . . . . . . . . . 175
4.5 Do You Feel The Following Are Harmful To Your Health? . . . . . . . . . . . . . . . . . . . . . . . . . . . . . . . . . . . . . . . . . . . . . . . . 177
4.6 At What Age Did You First... . . . . . . . . . . . . . . . . . . . . . . . . . . . . . . . . . . . . . . . . . . . . . . . . . . . . . . . . . . . . . . . 180
4.7 Where Do You Usually Use... . . . . . . . . . . . . . . . . . . . . . . . . . . . . . . . . . . . . . . . . . . . . . . . . . . . . . . . . . . . . . . 190
4.8 When Do You Usually Use... . . . . . . . . . . . . . . . . . . . . . . . . . . . . . . . . . . . . . . . . . . . . . . . . . . . . . . . . . . . . . . . 194
4.9 How Wrong Would Your Parents Feel It Would Be For You To... . . . . . . . . . . . . . . . . . . . . . . . . . . . . . . . . . . . . . . . . . . . . 198
4.10 How Wrong Would Your Friends Feel It Would Be For You To... . . . . . . . . . . . . . . . . . . . . . . . . . . . . . . . . . . . . . . . . . . . . 199
4.11 How Easy Is It To Get... . . . . . . . . . . . . . . . . . . . . . . . . . . . . . . . . . . . . . . . . . . . . . . . . . . . . . . . . . . . . . . . . . 200
4.12 Vehicle Safety . . . . . . . . . . . . . . . . . . . . . . . . . . . . . . . . . . . . . . . . . . . . . . . . . . . . . . . . . . . . . . . . . . . . . . 201
4.13 While At School Have You... . . . . . . . . . . . . . . . . . . . . . . . . . . . . . . . . . . . . . . . . . . . . . . . . . . . . . . . . . . . . . . . 203
4.14 In My School, I Feel Safe... . . . . . . . . . . . . . . . . . . . . . . . . . . . . . . . . . . . . . . . . . . . . . . . . . . . . . . . . . . . . . . . 207
4.15 Frequency of Use . . . . . . . . . . . . . . . . . . . . . . . . . . . . . . . . . . . . . . . . . . . . . . . . . . . . . . . . . . . . . . . . . . . . 210
3

8/7/2019 DALLAS COUNTY - Irving ISD - 2010 Pride Survey
http://slidepdf.com/reader/full/dallas-county-irving-isd-2010-pride-survey 4/239
5 Narrative Report 218
5.1 Introduction . . . . . . . . . . . . . . . . . . . . . . . . . . . . . . . . . . . . . . . . . . . . . . . . . . . . . . . . . . . . . . . . . . . . . . . . 218
5.1.1 The Pride Surveys Questionnaire . . . . . . . . . . . . . . . . . . . . . . . . . . . . . . . . . . . . . . . . . . . . . . . . . . . . . . . . 218
5.1.2 The Report . . . . . . . . . . . . . . . . . . . . . . . . . . . . . . . . . . . . . . . . . . . . . . . . . . . . . . . . . . . . . . . . . . . . 219
5.2 Gateway Drugs . . . . . . . . . . . . . . . . . . . . . . . . . . . . . . . . . . . . . . . . . . . . . . . . . . . . . . . . . . . . . . . . . . . . . . 219
5.2.1 Tobacco . . . . . . . . . . . . . . . . . . . . . . . . . . . . . . . . . . . . . . . . . . . . . . . . . . . . . . . . . . . . . . . . . . . . . 220
5.2.2 Alcohol . . . . . . . . . . . . . . . . . . . . . . . . . . . . . . . . . . . . . . . . . . . . . . . . . . . . . . . . . . . . . . . . . . . . . . 221
5.2.3 Marijuana . . . . . . . . . . . . . . . . . . . . . . . . . . . . . . . . . . . . . . . . . . . . . . . . . . . . . . . . . . . . . . . . . . . . . 224
5.3 Other Illicit Drugs . . . . . . . . . . . . . . . . . . . . . . . . . . . . . . . . . . . . . . . . . . . . . . . . . . . . . . . . . . . . . . . . . . . . . 226
5.3.1 Cocaine, Uppers, and Downers . . . . . . . . . . . . . . . . . . . . . . . . . . . . . . . . . . . . . . . . . . . . . . . . . . . . . . . . . 226
5.4 The Media and Data Presentation . . . . . . . . . . . . . . . . . . . . . . . . . . . . . . . . . . . . . . . . . . . . . . . . . . . . . . . . . . . . 228
5.4.1 Community Awareness . . . . . . . . . . . . . . . . . . . . . . . . . . . . . . . . . . . . . . . . . . . . . . . . . . . . . . . . . . . . . . 228
5.4.2 The Media . . . . . . . . . . . . . . . . . . . . . . . . . . . . . . . . . . . . . . . . . . . . . . . . . . . . . . . . . . . . . . . . . . . . 229
5.4.3 Presentations to School/Community Groups . . . . . . . . . . . . . . . . . . . . . . . . . . . . . . . . . . . . . . . . . . . . . . . . . . 231
5.4.4 Sample Press Release . . . . . . . . . . . . . . . . . . . . . . . . . . . . . . . . . . . . . . . . . . . . . . . . . . . . . . . . . . . . . . 234
6 Drug-Free Communities Support Program Core Measures 236
4

8/7/2019 DALLAS COUNTY - Irving ISD - 2010 Pride Survey
http://slidepdf.com/reader/full/dallas-county-irving-isd-2010-pride-survey 5/239
List of Tables
1.1 Number of Students Surveyed . . . . . . . . . . . . . . . . . . . . . . . . . . . . . . . . . . . . . . . . . . . . . . . . . . . . . . . . . . . 16
1.2 Annual Use – Local vs National – Tobacco . . . . . . . . . . . . . . . . . . . . . . . . . . . . . . . . . . . . . . . . . . . . . . . . . . . . 16
1.3 Annual Use – Local vs National – Alcohol . . . . . . . . . . . . . . . . . . . . . . . . . . . . . . . . . . . . . . . . . . . . . . . . . . . . . 17
1.4 Annual Use – Local vs National – Illicit Drugs 1 . . . . . . . . . . . . . . . . . . . . . . . . . . . . . . . . . . . . . . . . . . . . . . . . . . 17
1.5 Annual Use – Local vs National – Illicit Drugs 2 . . . . . . . . . . . . . . . . . . . . . . . . . . . . . . . . . . . . . . . . . . . . . . . . . . 18
1.6 Monthly Use – Local vs National – Tobacco . . . . . . . . . . . . . . . . . . . . . . . . . . . . . . . . . . . . . . . . . . . . . . . . . . . . 18
1.7 Monthly Use – Local vs National – Alcohol . . . . . . . . . . . . . . . . . . . . . . . . . . . . . . . . . . . . . . . . . . . . . . . . . . . . 19
1.8 Monthly Use – Local vs National – Illicit Drugs 1 . . . . . . . . . . . . . . . . . . . . . . . . . . . . . . . . . . . . . . . . . . . . . . . . . 19
1.9 Monthly Use – Local vs National – Illicit Drugs 2 . . . . . . . . . . . . . . . . . . . . . . . . . . . . . . . . . . . . . . . . . . . . . . . . . 20
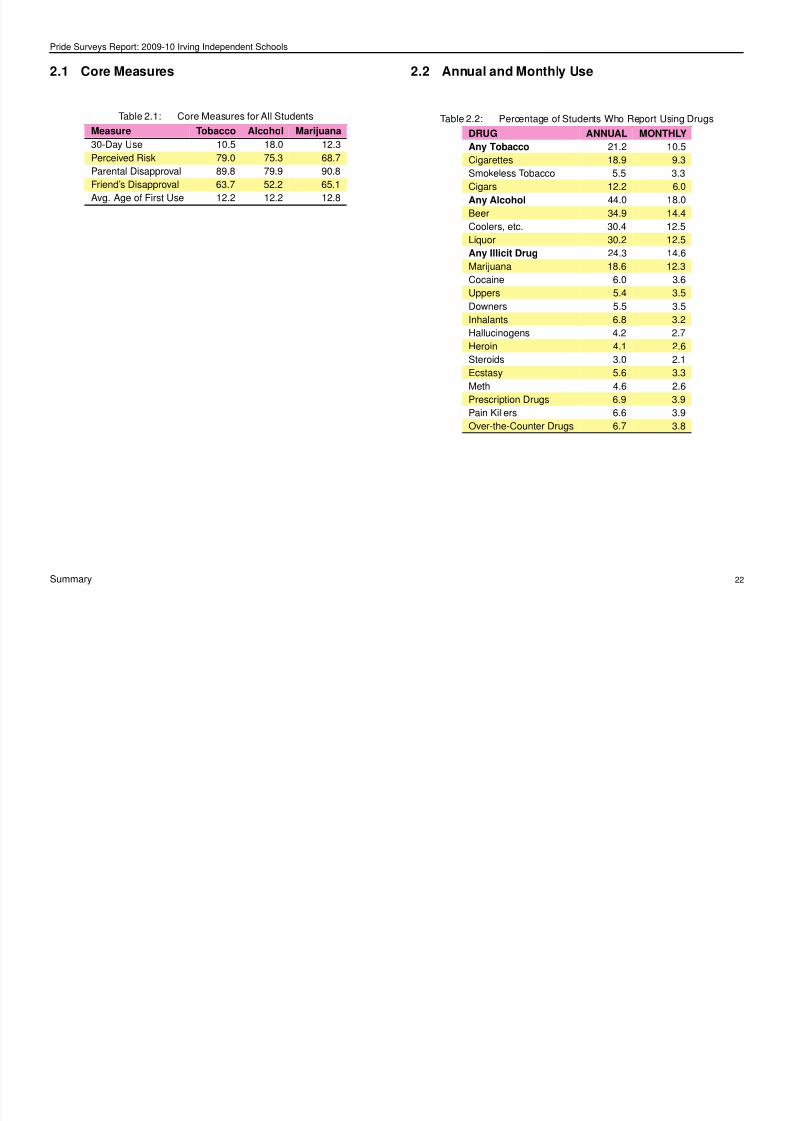
2.1 Core Measures for All Students . . . . . . . . . . . . . . . . . . . . . . . . . . . . . . . . . . . . . . . . . . . . . . . . . . . . . . . . . . 22
2.2 Percentage of Students Who Report Using Drugs . . . . . . . . . . . . . . . . . . . . . . . . . . . . . . . . . . . . . . . . . . . . . . . . 22
2.3 Where Do Students Report Using . . . . . . . . . . . . . . . . . . . . . . . . . . . . . . . . . . . . . . . . . . . . . . . . . . . . . . . . . 23
2.4 When Do Students Report Using . . . . . . . . . . . . . . . . . . . . . . . . . . . . . . . . . . . . . . . . . . . . . . . . . . . . . . . . . 23
2.5 Percentage Of Students At Risk . . . . . . . . . . . . . . . . . . . . . . . . . . . . . . . . . . . . . . . . . . . . . . . . . . . . . . . . . . 23
2.6 Percentage Of Students Protected . . . . . . . . . . . . . . . . . . . . . . . . . . . . . . . . . . . . . . . . . . . . . . . . . . . . . . . . . 23
3.1 Attend Church or Synagogue . . . . . . . . . . . . . . . . . . . . . . . . . . . . . . . . . . . . . . . . . . . . . . . . . . . . . . . . . . . 132
3.2 Take Part in Community Activities . . . . . . . . . . . . . . . . . . . . . . . . . . . . . . . . . . . . . . . . . . . . . . . . . . . . . . . . . 133
3.3 Make Good G rades . . . . . . . . . . . . . . . . . . . . . . . . . . . . . . . . . . . . . . . . . . . . . . . . . . . . . . . . . . . . . . . . 134
3.4 Take Part in Sports Teams . . . . . . . . . . . . . . . . . . . . . . . . . . . . . . . . . . . . . . . . . . . . . . . . . . . . . . . . . . . . . 135
3.5 Take Part in School Activities . . . . . . . . . . . . . . . . . . . . . . . . . . . . . . . . . . . . . . . . . . . . . . . . . . . . . . . . . . . 136
3.6 Get Into Trouble at School . . . . . . . . . . . . . . . . . . . . . . . . . . . . . . . . . . . . . . . . . . . . . . . . . . . . . . . . . . . . . 137
3.7 Teachers Talk About Dangers of Drugs . . . . . . . . . . . . . . . . . . . . . . . . . . . . . . . . . . . . . . . . . . . . . . . . . . . . . . 138
3.8 Parents Talk About Dangers of Drugs . . . . . . . . . . . . . . . . . . . . . . . . . . . . . . . . . . . . . . . . . . . . . . . . . . . . . . . 139
3.9 Parents Set Clear Rules . . . . . . . . . . . . . . . . . . . . . . . . . . . . . . . . . . . . . . . . . . . . . . . . . . . . . . . . . . . . . . 140
5

8/7/2019 DALLAS COUNTY - Irving ISD - 2010 Pride Survey
http://slidepdf.com/reader/full/dallas-county-irving-isd-2010-pride-survey 6/239
3.10 Parents Punish for Breaking Rules . . . . . . . . . . . . . . . . . . . . . . . . . . . . . . . . . . . . . . . . . . . . . . . . . . . . . . . . . 141
4.1 Ethnic Or igin . . . . . . . . . . . . . . . . . . . . . . . . . . . . . . . . . . . . . . . . . . . . . . . . . . . . . . . . . . . . . . . . . . . . 151
4.2 Sex . . . . . . . . . . . . . . . . . . . . . . . . . . . . . . . . . . . . . . . . . . . . . . . . . . . . . . . . . . . . . . . . . . . . . . . . . 151
4.3 Age . . . . . . . . . . . . . . . . . . . . . . . . . . . . . . . . . . . . . . . . . . . . . . . . . . . . . . . . . . . . . . . . . . . . . . . . . 152
4.4 Do you l ive with... . . . . . . . . . . . . . . . . . . . . . . . . . . . . . . . . . . . . . . . . . . . . . . . . . . . . . . . . . . . . . . . . . . 152
4.5 D o you have a job? . . . . . . . . . . . . . . . . . . . . . . . . . . . . . . . . . . . . . . . . . . . . . . . . . . . . . . . . . . . . . . . . . 1534.6 Does your father have a job? . . . . . . . . . . . . . . . . . . . . . . . . . . . . . . . . . . . . . . . . . . . . . . . . . . . . . . . . . . . . 153
4.7 Does your mother have a job? . . . . . . . . . . . . . . . . . . . . . . . . . . . . . . . . . . . . . . . . . . . . . . . . . . . . . . . . . . . 153
4.8 What is the educational level of your father? . . . . . . . . . . . . . . . . . . . . . . . . . . . . . . . . . . . . . . . . . . . . . . . . . . . . 154
4.9 What is the educational level of your mother? . . . . . . . . . . . . . . . . . . . . . . . . . . . . . . . . . . . . . . . . . . . . . . . . . . . 154
4.10 Do you make good grades? . . . . . . . . . . . . . . . . . . . . . . . . . . . . . . . . . . . . . . . . . . . . . . . . . . . . . . . . . . . . 155
4.11 Do you get into trouble at school? . . . . . . . . . . . . . . . . . . . . . . . . . . . . . . . . . . . . . . . . . . . . . . . . . . . . . . . . . 155
4.12 Do you take part in school sports teams? . . . . . . . . . . . . . . . . . . . . . . . . . . . . . . . . . . . . . . . . . . . . . . . . . . . . . 155
4.13 Do you take part in school activities such as band, clubs, etc.? . . . . . . . . . . . . . . . . . . . . . . . . . . . . . . . . . . . . . . . . . . 156
4.14 Do you take part in community activities such as scouts, rec. teams, youth clubs, etc.? . . . . . . . . . . . . . . . . . . . . . . . . . . . . . 156
4.15 Do you attend church, synagogue, etc.? . . . . . . . . . . . . . . . . . . . . . . . . . . . . . . . . . . . . . . . . . . . . . . . . . . . . . . 1564.16 Do your parents talk with you about the problems of tobacco, alcohol and drug use? . . . . . . . . . . . . . . . . . . . . . . . . . . . . . . 157
4.17 Do your teachers talk with you about the problems of tobacco, alcohol and drug use? . . . . . . . . . . . . . . . . . . . . . . . . . . . . . . 157
4.18 Have you skipped school without your parents’ permission in the past year? . . . . . . . . . . . . . . . . . . . . . . . . . . . . . . . . . . . 157
4.19 Does your school set clear rules on using drugs at school? . . . . . . . . . . . . . . . . . . . . . . . . . . . . . . . . . . . . . . . . . . . . 158
4.20 Does your school set clear rules on bullying or threatening other students at school? . . . . . . . . . . . . . . . . . . . . . . . . . . . . . . 158
4.21 Do your parents set clear rules for you? . . . . . . . . . . . . . . . . . . . . . . . . . . . . . . . . . . . . . . . . . . . . . . . . . . . . . . 158
4.22 Do your parents punish you when you break the rules? . . . . . . . . . . . . . . . . . . . . . . . . . . . . . . . . . . . . . . . . . . . . . . 159
4.23 Have you been in trouble with the police? . . . . . . . . . . . . . . . . . . . . . . . . . . . . . . . . . . . . . . . . . . . . . . . . . . . . . 159
4.24 Do you take part in gang activities? . . . . . . . . . . . . . . . . . . . . . . . . . . . . . . . . . . . . . . . . . . . . . . . . . . . . . . . . 159
4.25 Have you thought about committing suicide? . . . . . . . . . . . . . . . . . . . . . . . . . . . . . . . . . . . . . . . . . . . . . . . . . . . 160
4.26 Do your friends use tobacco (cigarettes, etc.)? . . . . . . . . . . . . . . . . . . . . . . . . . . . . . . . . . . . . . . . . . . . . . . . . . . 160
4.27 Do your friends use alcohol (beer, liquor, etc.)? . . . . . . . . . . . . . . . . . . . . . . . . . . . . . . . . . . . . . . . . . . . . . . . . . . 160
4.28 Do your friends use marijuana (pot, hash, etc.)? . . . . . . . . . . . . . . . . . . . . . . . . . . . . . . . . . . . . . . . . . . . . . . . . . 161
4.29 Have you had 5 or more glasses of beer, coolers, breezers or liquor within a few hours? . . . . . . . . . . . . . . . . . . . . . . . . . . . . 161
4.30 Does your school ask any students to take a drug test? . . . . . . . . . . . . . . . . . . . . . . . . . . . . . . . . . . . . . . . . . . . . . 161
4.31 Do you think that you are overweight? . . . . . . . . . . . . . . . . . . . . . . . . . . . . . . . . . . . . . . . . . . . . . . . . . . . . . . . 162
4.32 Has a doctor told you that you are overweight? . . . . . . . . . . . . . . . . . . . . . . . . . . . . . . . . . . . . . . . . . . . . . . . . . . 162
4.33 Have you bought or sold drugs AT school? . . . . . . . . . . . . . . . . . . . . . . . . . . . . . . . . . . . . . . . . . . . . . . . . . . . . 162
4.34 Have you bought or sold drugs when NOT at school? . . . . . . . . . . . . . . . . . . . . . . . . . . . . . . . . . . . . . . . . . . . . . . . 162
4.35 Have you carried a gun for protection or as a weapon when NOT at school in the past year? . . . . . . . . . . . . . . . . . . . . . . . . . . 163
6

8/7/2019 DALLAS COUNTY - Irving ISD - 2010 Pride Survey
http://slidepdf.com/reader/full/dallas-county-irving-isd-2010-pride-survey 7/239
4.36 Within the past year how often have you smoked cigarettes? . . . . . . . . . . . . . . . . . . . . . . . . . . . . . . . . . . . . . . . . . . . 164
4.37 Within the past year how often have you used smokeless tobacco? . . . . . . . . . . . . . . . . . . . . . . . . . . . . . . . . . . . . . . . 164
4.38 Within the past year how often have you smoked cigars? . . . . . . . . . . . . . . . . . . . . . . . . . . . . . . . . . . . . . . . . . . . . . 165
4.39 Within the past year how often have you drunk beer? . . . . . . . . . . . . . . . . . . . . . . . . . . . . . . . . . . . . . . . . . . . . . . . 165
4.40 Within the past year how often have you drunk coolers, breezers, etc.? . . . . . . . . . . . . . . . . . . . . . . . . . . . . . . . . . . . . . 166
4.41 Within the past year how often have you drunk liquor? . . . . . . . . . . . . . . . . . . . . . . . . . . . . . . . . . . . . . . . . . . . . . . 166
4.42 Within the past year how often have you smoked marijuana? . . . . . . . . . . . . . . . . . . . . . . . . . . . . . . . . . . . . . . . . . . . 167
4.43 Within the past year how often have you used cocaine? . . . . . . . . . . . . . . . . . . . . . . . . . . . . . . . . . . . . . . . . . . . . . 167
4.44 Within the past year how often have you used uppers? . . . . . . . . . . . . . . . . . . . . . . . . . . . . . . . . . . . . . . . . . . . . . . 168
4.45 Within the past year how often have you used downers? . . . . . . . . . . . . . . . . . . . . . . . . . . . . . . . . . . . . . . . . . . . . . 168
4.46 Within the past year how often have you used inhalants? . . . . . . . . . . . . . . . . . . . . . . . . . . . . . . . . . . . . . . . . . . . . . 169
4.47 Within the past year how often have you used hallucinogens? . . . . . . . . . . . . . . . . . . . . . . . . . . . . . . . . . . . . . . . . . . 169
4.48 Within the past year how often have you used heroin? . . . . . . . . . . . . . . . . . . . . . . . . . . . . . . . . . . . . . . . . . . . . . . 170
4.49 Within the past year how often have you used anabolic steroids? . . . . . . . . . . . . . . . . . . . . . . . . . . . . . . . . . . . . . . . . 170
4.50 Within the past year how often have you used ecstasy? . . . . . . . . . . . . . . . . . . . . . . . . . . . . . . . . . . . . . . . . . . . . . 171
4.51 Within the past year how often have you used meth? . . . . . . . . . . . . . . . . . . . . . . . . . . . . . . . . . . . . . . . . . . . . . . . 171
4.52 Within the past year how often have you used prescription drugs? . . . . . . . . . . . . . . . . . . . . . . . . . . . . . . . . . . . . . . . . 1724.53 Within the past year how often have you used pain killers? . . . . . . . . . . . . . . . . . . . . . . . . . . . . . . . . . . . . . . . . . . . . 172
4.54 Within the past year how often have you used over-the-counter drugs? . . . . . . . . . . . . . . . . . . . . . . . . . . . . . . . . . . . . . 173
4.55 Within the past year how often have you used any tobacco? . . . . . . . . . . . . . . . . . . . . . . . . . . . . . . . . . . . . . . . . . . . 173
4.56 Within the past year how often have you used any alcohol? . . . . . . . . . . . . . . . . . . . . . . . . . . . . . . . . . . . . . . . . . . . 174
4.57 Within the past year how often have you used any illicit drug? . . . . . . . . . . . . . . . . . . . . . . . . . . . . . . . . . . . . . . . . . . 174
4.58 What effect do you most often get when you drink beer? . . . . . . . . . . . . . . . . . . . . . . . . . . . . . . . . . . . . . . . . . . . . . 175
4.59 What effect do you most often get when you drink wine coolers? . . . . . . . . . . . . . . . . . . . . . . . . . . . . . . . . . . . . . . . . . 175
4.60 What effect do you most often get when you drink liquor? . . . . . . . . . . . . . . . . . . . . . . . . . . . . . . . . . . . . . . . . . . . . 175
4.61 What effect do you most often get when you smoke marijuana? . . . . . . . . . . . . . . . . . . . . . . . . . . . . . . . . . . . . . . . . . 176
4.62 Do you feel that using cigarettes is harmful to your health? . . . . . . . . . . . . . . . . . . . . . . . . . . . . . . . . . . . . . . . . . . . . 1774.63 Do you feel that using smokeless tobacco is harmful to your health? . . . . . . . . . . . . . . . . . . . . . . . . . . . . . . . . . . . . . . . 177
4.64 Do you feel that using cigars is harmful to your health? . . . . . . . . . . . . . . . . . . . . . . . . . . . . . . . . . . . . . . . . . . . . . . 177
4.65 Do you feel that using beer is harmful to your health? . . . . . . . . . . . . . . . . . . . . . . . . . . . . . . . . . . . . . . . . . . . . . . . 178
4.66 Do you feel that using coolers, breezers, etc. is harmful to your health? . . . . . . . . . . . . . . . . . . . . . . . . . . . . . . . . . . . . . 178
4.67 Do you feel that using liquor is harmful to your health? . . . . . . . . . . . . . . . . . . . . . . . . . . . . . . . . . . . . . . . . . . . . . . 178
4.68 Do you feel that using marijuana is harmful to your health? . . . . . . . . . . . . . . . . . . . . . . . . . . . . . . . . . . . . . . . . . . . . 179
4.69 Do you feel that using any tobacco is harmful to your health? . . . . . . . . . . . . . . . . . . . . . . . . . . . . . . . . . . . . . . . . . . 179
4.70 How much do you think people risk harming themselves (physically or in other ways) if they take one or two drinks of an alcoholic beverage
(beer, wine, liquor) nearly every day? . . . . . . . . . . . . . . . . . . . . . . . . . . . . . . . . . . . . . . . . . . . . . . . . . . . . . . . . . . 179
7

8/7/2019 DALLAS COUNTY - Irving ISD - 2010 Pride Survey
http://slidepdf.com/reader/full/dallas-county-irving-isd-2010-pride-survey 8/239
4.71 At what age did you first smoke cigarettes? . . . . . . . . . . . . . . . . . . . . . . . . . . . . . . . . . . . . . . . . . . . . . . . . . . . . 180
4.72 At what age did you first use smokeless tobacco? . . . . . . . . . . . . . . . . . . . . . . . . . . . . . . . . . . . . . . . . . . . . . . . . 180
4.73 At what age did you first smoke cigars? . . . . . . . . . . . . . . . . . . . . . . . . . . . . . . . . . . . . . . . . . . . . . . . . . . . . . . 181
4.74 At what age did you first drink beer? . . . . . . . . . . . . . . . . . . . . . . . . . . . . . . . . . . . . . . . . . . . . . . . . . . . . . . . . 181
4.75 At what age did you first drink coolers, breezers, etc.? . . . . . . . . . . . . . . . . . . . . . . . . . . . . . . . . . . . . . . . . . . . . . . 182
4.76 At what age did you first drink liquor? . . . . . . . . . . . . . . . . . . . . . . . . . . . . . . . . . . . . . . . . . . . . . . . . . . . . . . . 182
4.77 At what age did you first smoke marijuana? . . . . . . . . . . . . . . . . . . . . . . . . . . . . . . . . . . . . . . . . . . . . . . . . . . . . 183
4.78 At what age did you first use cocaine? . . . . . . . . . . . . . . . . . . . . . . . . . . . . . . . . . . . . . . . . . . . . . . . . . . . . . . . 183
4.79 At what age did you first use uppers? . . . . . . . . . . . . . . . . . . . . . . . . . . . . . . . . . . . . . . . . . . . . . . . . . . . . . . . 184
4.80 At what age did you first use downers? . . . . . . . . . . . . . . . . . . . . . . . . . . . . . . . . . . . . . . . . . . . . . . . . . . . . . . 184
4.81 At what age did you first use inhalants? . . . . . . . . . . . . . . . . . . . . . . . . . . . . . . . . . . . . . . . . . . . . . . . . . . . . . . 185
4.82 At what age did you first use hallucinogens? . . . . . . . . . . . . . . . . . . . . . . . . . . . . . . . . . . . . . . . . . . . . . . . . . . . 185
4.83 At what age did you first use heroin? . . . . . . . . . . . . . . . . . . . . . . . . . . . . . . . . . . . . . . . . . . . . . . . . . . . . . . . 186
4.84 At what age did you first use anabolic steroids? . . . . . . . . . . . . . . . . . . . . . . . . . . . . . . . . . . . . . . . . . . . . . . . . . . 186
4.85 At what age did you first use ecstasy? . . . . . . . . . . . . . . . . . . . . . . . . . . . . . . . . . . . . . . . . . . . . . . . . . . . . . . . 187
4.86 At what age did you first use meth? . . . . . . . . . . . . . . . . . . . . . . . . . . . . . . . . . . . . . . . . . . . . . . . . . . . . . . . . 187
4.87 At what age did you first use prescription drugs? . . . . . . . . . . . . . . . . . . . . . . . . . . . . . . . . . . . . . . . . . . . . . . . . . 1884.88 At what age did you first use pain killers? . . . . . . . . . . . . . . . . . . . . . . . . . . . . . . . . . . . . . . . . . . . . . . . . . . . . . 188
4.89 At what age did you first use over-the-counter drugs? . . . . . . . . . . . . . . . . . . . . . . . . . . . . . . . . . . . . . . . . . . . . . . . 189
4.90 Where do you usually smoke cigarettes? . . . . . . . . . . . . . . . . . . . . . . . . . . . . . . . . . . . . . . . . . . . . . . . . . . . . . 190
4.91 Where do you usually use smokeless tobacco? . . . . . . . . . . . . . . . . . . . . . . . . . . . . . . . . . . . . . . . . . . . . . . . . . . 190
4.92 Where do you usually smoke cigars? . . . . . . . . . . . . . . . . . . . . . . . . . . . . . . . . . . . . . . . . . . . . . . . . . . . . . . . 191
4.93 Where do you usually drink beer? . . . . . . . . . . . . . . . . . . . . . . . . . . . . . . . . . . . . . . . . . . . . . . . . . . . . . . . . . 191
4.94 Where do you usually drink coolers, breezers, etc.? . . . . . . . . . . . . . . . . . . . . . . . . . . . . . . . . . . . . . . . . . . . . . . . 191
4.95 Where do you usually drink liquor? . . . . . . . . . . . . . . . . . . . . . . . . . . . . . . . . . . . . . . . . . . . . . . . . . . . . . . . . 192
4.96 Where do you usually smoke marijuana? . . . . . . . . . . . . . . . . . . . . . . . . . . . . . . . . . . . . . . . . . . . . . . . . . . . . . 192
4.97 Where do you usually use tobacco? . . . . . . . . . . . . . . . . . . . . . . . . . . . . . . . . . . . . . . . . . . . . . . . . . . . . . . . . 1924.98 Where do you usually use alcohol? . . . . . . . . . . . . . . . . . . . . . . . . . . . . . . . . . . . . . . . . . . . . . . . . . . . . . . . . 193
4.99 When do you usually smoke cigarettes? . . . . . . . . . . . . . . . . . . . . . . . . . . . . . . . . . . . . . . . . . . . . . . . . . . . . . . 194
4.100 When do you usually use smokeless tobacco? . . . . . . . . . . . . . . . . . . . . . . . . . . . . . . . . . . . . . . . . . . . . . . . . . . 194
4.101 When do you usually smoke cigars? . . . . . . . . . . . . . . . . . . . . . . . . . . . . . . . . . . . . . . . . . . . . . . . . . . . . . . . . 195
4.102 When do you usually drink beer? . . . . . . . . . . . . . . . . . . . . . . . . . . . . . . . . . . . . . . . . . . . . . . . . . . . . . . . . . 195
4.103 When do you usually drink coolers, breezers, etc.? . . . . . . . . . . . . . . . . . . . . . . . . . . . . . . . . . . . . . . . . . . . . . . . . 195
4.104 When do you usually drink liquor? . . . . . . . . . . . . . . . . . . . . . . . . . . . . . . . . . . . . . . . . . . . . . . . . . . . . . . . . . 196
4.105 When do you usually smoke marijuana? . . . . . . . . . . . . . . . . . . . . . . . . . . . . . . . . . . . . . . . . . . . . . . . . . . . . . . 196
4.106 When do you usually use tobacco? . . . . . . . . . . . . . . . . . . . . . . . . . . . . . . . . . . . . . . . . . . . . . . . . . . . . . . . . 196
8

8/7/2019 DALLAS COUNTY - Irving ISD - 2010 Pride Survey
http://slidepdf.com/reader/full/dallas-county-irving-isd-2010-pride-survey 9/239
4.107 When do you usually use alcohol? . . . . . . . . . . . . . . . . . . . . . . . . . . . . . . . . . . . . . . . . . . . . . . . . . . . . . . . . . 197
4.108 How wrong would your parents feel it would be for you to use tobacco? . . . . . . . . . . . . . . . . . . . . . . . . . . . . . . . . . . . . . 198
4.109 How wrong would your parents feel it would be for you to use alcohol? . . . . . . . . . . . . . . . . . . . . . . . . . . . . . . . . . . . . . 198
4.110 How wrong would your parents feel it would be for you to use marijuana? . . . . . . . . . . . . . . . . . . . . . . . . . . . . . . . . . . . . 198
4.111 How wrong would your friends feel it would be for you to use tobacco? . . . . . . . . . . . . . . . . . . . . . . . . . . . . . . . . . . . . . 199
4.112 How wrong would your friends feel it would be for you to use alcohol? . . . . . . . . . . . . . . . . . . . . . . . . . . . . . . . . . . . . . . 199
4.113 How wrong would your friends feel it would be for you to use marijuana? . . . . . . . . . . . . . . . . . . . . . . . . . . . . . . . . . . . . 199
4.114 How easy is it to get cigarettes, smokeless tobacco, cigars, etc.? . . . . . . . . . . . . . . . . . . . . . . . . . . . . . . . . . . . . . . . . 200
4.115 How easy is it to get beer, wine, liquor and other alcohol products? . . . . . . . . . . . . . . . . . . . . . . . . . . . . . . . . . . . . . . . 200
4.116 How easy is it to get marijuana? . . . . . . . . . . . . . . . . . . . . . . . . . . . . . . . . . . . . . . . . . . . . . . . . . . . . . . . . . . 200
4.117 During the past 30 days, how many times did you drive a car or other vehicle when you had been drinking alcohol? . . . . . . . . . . . . . . 201
4.118 During the past 30 days, how many times did you ride in a car or other vehicle driven by someone how had been drinking? . . . . . . . . . 201
4.119 How often do you wear a seatbelt when driving a car? . . . . . . . . . . . . . . . . . . . . . . . . . . . . . . . . . . . . . . . . . . . . . . 201
4.120 How often do you wear a seatbelt when riding in a car driven by someone else? . . . . . . . . . . . . . . . . . . . . . . . . . . . . . . . . 202
4.121 Carried a handgun? . . . . . . . . . . . . . . . . . . . . . . . . . . . . . . . . . . . . . . . . . . . . . . . . . . . . . . . . . . . . . . . . 203
4.122 Carried a knife, club or other weapon? . . . . . . . . . . . . . . . . . . . . . . . . . . . . . . . . . . . . . . . . . . . . . . . . . . . . . . 203
4.123 Threatened a student with a handgun, knife or club? . . . . . . . . . . . . . . . . . . . . . . . . . . . . . . . . . . . . . . . . . . . . . . . 2034.124 Threatened to hurt a student by hitting, slapping or kicking? . . . . . . . . . . . . . . . . . . . . . . . . . . . . . . . . . . . . . . . . . . . 204
4.125 Hurt a student by using a handgun, knife or club? . . . . . . . . . . . . . . . . . . . . . . . . . . . . . . . . . . . . . . . . . . . . . . . . . 204
4.126 Hurt a student by hitting, slapping or kicking? . . . . . . . . . . . . . . . . . . . . . . . . . . . . . . . . . . . . . . . . . . . . . . . . . . . 204
4.127 Been threatened with a handgun, knife or club by a student? . . . . . . . . . . . . . . . . . . . . . . . . . . . . . . . . . . . . . . . . . . . 205
4.128 Had a student threaten to hit, slap or kick you? . . . . . . . . . . . . . . . . . . . . . . . . . . . . . . . . . . . . . . . . . . . . . . . . . . 205
4.129 Been afraid a student may hurt you? . . . . . . . . . . . . . . . . . . . . . . . . . . . . . . . . . . . . . . . . . . . . . . . . . . . . . . . 205
4.130 Been hurt by a student using a handgun, knife or club? . . . . . . . . . . . . . . . . . . . . . . . . . . . . . . . . . . . . . . . . . . . . . . 206
4.131 Been hurt by a student who hit, slapped or kicked you? . . . . . . . . . . . . . . . . . . . . . . . . . . . . . . . . . . . . . . . . . . . . . . 206
4.132 In my school, I feel safe in the classroom. . . . . . . . . . . . . . . . . . . . . . . . . . . . . . . . . . . . . . . . . . . . . . . . . . . . . . 207
4.133 In my school, I feel safe in the cafeteria. . . . . . . . . . . . . . . . . . . . . . . . . . . . . . . . . . . . . . . . . . . . . . . . . . . . . . . 2074.134 In my school, I feel safe in the halls. . . . . . . . . . . . . . . . . . . . . . . . . . . . . . . . . . . . . . . . . . . . . . . . . . . . . . . . . 207
4.135 In my school, I feel safe in the bathroom. . . . . . . . . . . . . . . . . . . . . . . . . . . . . . . . . . . . . . . . . . . . . . . . . . . . . . 208
4.136 In my school, I feel safe in the gym. . . . . . . . . . . . . . . . . . . . . . . . . . . . . . . . . . . . . . . . . . . . . . . . . . . . . . . . . 208
4.137 In my school, I feel safe on the school bus. . . . . . . . . . . . . . . . . . . . . . . . . . . . . . . . . . . . . . . . . . . . . . . . . . . . . 208
4.138 In my school, I feel safe at school events. . . . . . . . . . . . . . . . . . . . . . . . . . . . . . . . . . . . . . . . . . . . . . . . . . . . . . 209
4.139 In my school, I feel safe on the playground. . . . . . . . . . . . . . . . . . . . . . . . . . . . . . . . . . . . . . . . . . . . . . . . . . . . . 209
4.140 In my school, I feel safe in the parking lot. . . . . . . . . . . . . . . . . . . . . . . . . . . . . . . . . . . . . . . . . . . . . . . . . . . . . . 209
4.141 Frequency of use of cigarettes? . . . . . . . . . . . . . . . . . . . . . . . . . . . . . . . . . . . . . . . . . . . . . . . . . . . . . . . . . . 210
4.142 Frequency of use of smokeless tobacco? . . . . . . . . . . . . . . . . . . . . . . . . . . . . . . . . . . . . . . . . . . . . . . . . . . . . . 210
9

8/7/2019 DALLAS COUNTY - Irving ISD - 2010 Pride Survey
http://slidepdf.com/reader/full/dallas-county-irving-isd-2010-pride-survey 10/239
4.143 Frequency of use of cigars? . . . . . . . . . . . . . . . . . . . . . . . . . . . . . . . . . . . . . . . . . . . . . . . . . . . . . . . . . . . . 210
4.144 Frequency of use of beer? . . . . . . . . . . . . . . . . . . . . . . . . . . . . . . . . . . . . . . . . . . . . . . . . . . . . . . . . . . . . . 211
4.145 Frequency of use of coolers, breezers, etc.? . . . . . . . . . . . . . . . . . . . . . . . . . . . . . . . . . . . . . . . . . . . . . . . . . . . 211
4.146 Frequency of use of liquor? . . . . . . . . . . . . . . . . . . . . . . . . . . . . . . . . . . . . . . . . . . . . . . . . . . . . . . . . . . . . 211
4.147 Frequency of use of marijuana? . . . . . . . . . . . . . . . . . . . . . . . . . . . . . . . . . . . . . . . . . . . . . . . . . . . . . . . . . . 212
4.148 Frequency of use of cocaine? . . . . . . . . . . . . . . . . . . . . . . . . . . . . . . . . . . . . . . . . . . . . . . . . . . . . . . . . . . . 212
4.149 Frequency of use of uppers? . . . . . . . . . . . . . . . . . . . . . . . . . . . . . . . . . . . . . . . . . . . . . . . . . . . . . . . . . . . . 212
4.150 Frequency of use of downers? . . . . . . . . . . . . . . . . . . . . . . . . . . . . . . . . . . . . . . . . . . . . . . . . . . . . . . . . . . . 213
4.151 Frequency of use of inhalants? . . . . . . . . . . . . . . . . . . . . . . . . . . . . . . . . . . . . . . . . . . . . . . . . . . . . . . . . . . 213
4.152 Frequency of use of hallucinogens? . . . . . . . . . . . . . . . . . . . . . . . . . . . . . . . . . . . . . . . . . . . . . . . . . . . . . . . . 213
4.153 Frequency of use of heroin? . . . . . . . . . . . . . . . . . . . . . . . . . . . . . . . . . . . . . . . . . . . . . . . . . . . . . . . . . . . . 214
4.154 Frequency of use of steroids? . . . . . . . . . . . . . . . . . . . . . . . . . . . . . . . . . . . . . . . . . . . . . . . . . . . . . . . . . . . 214
4.155 Frequency of use of ecstasy? . . . . . . . . . . . . . . . . . . . . . . . . . . . . . . . . . . . . . . . . . . . . . . . . . . . . . . . . . . . 214
4.156 Frequency of use of meth? . . . . . . . . . . . . . . . . . . . . . . . . . . . . . . . . . . . . . . . . . . . . . . . . . . . . . . . . . . . . . 215
4.157 Frequency of use of prescriptions drugs? . . . . . . . . . . . . . . . . . . . . . . . . . . . . . . . . . . . . . . . . . . . . . . . . . . . . . 215
4.158 Frequency of use of pain killers? . . . . . . . . . . . . . . . . . . . . . . . . . . . . . . . . . . . . . . . . . . . . . . . . . . . . . . . . . . 215
4.159 Frequency of use of over-the-counter drugs? . . . . . . . . . . . . . . . . . . . . . . . . . . . . . . . . . . . . . . . . . . . . . . . . . . . 2164.160 Frequency of use of any tobacco? . . . . . . . . . . . . . . . . . . . . . . . . . . . . . . . . . . . . . . . . . . . . . . . . . . . . . . . . . 216
4.161 Frequency of use of any alcohol? . . . . . . . . . . . . . . . . . . . . . . . . . . . . . . . . . . . . . . . . . . . . . . . . . . . . . . . . . 217
4.162 Frequency of use of any illicit drug? . . . . . . . . . . . . . . . . . . . . . . . . . . . . . . . . . . . . . . . . . . . . . . . . . . . . . . . . 217
5.1 30-Day Use of Tobacco . . . . . . . . . . . . . . . . . . . . . . . . . . . . . . . . . . . . . . . . . . . . . . . . . . . . . . . . . . . . . . 220
5.2 Reported Location of Any Tobacco Use For Your Students . . . . . . . . . . . . . . . . . . . . . . . . . . . . . . . . . . . . . . . . . . . . 221
5.3 Reported Times of Any Tobacco Use For Your Students . . . . . . . . . . . . . . . . . . . . . . . . . . . . . . . . . . . . . . . . . . . . . 221
5.4 30-Day Use of Alcohol . . . . . . . . . . . . . . . . . . . . . . . . . . . . . . . . . . . . . . . . . . . . . . . . . . . . . . . . . . . . . . . 221
5.5 Pct of Students Reporting Fairly Easy or Very Easy to Get Tobacco and Alcohol . . . . . . . . . . . . . . . . . . . . . . . . . . . . . . . . 223
6.1 Core Measure for 30 Day Use by Grade . . . . . . . . . . . . . . . . . . . . . . . . . . . . . . . . . . . . . . . . . . . . . . . . . . . . . . . . 2376.2 Core Measure of Perception of Risk by Grade . . . . . . . . . . . . . . . . . . . . . . . . . . . . . . . . . . . . . . . . . . . . . . . . . . . . . 237
6.3 Core Measure of Parental Disapproval by Grade . . . . . . . . . . . . . . . . . . . . . . . . . . . . . . . . . . . . . . . . . . . . . . . . . . . . 238
6.4 Core Measure of Age of Onset by Grade . . . . . . . . . . . . . . . . . . . . . . . . . . . . . . . . . . . . . . . . . . . . . . . . . . . . . . . . 238
6.5 Core Measure for 30 Day Use by Sex . . . . . . . . . . . . . . . . . . . . . . . . . . . . . . . . . . . . . . . . . . . . . . . . . . . . . . . . . . 238
6.6 Core Measure of Perception of Risk by Sex . . . . . . . . . . . . . . . . . . . . . . . . . . . . . . . . . . . . . . . . . . . . . . . . . . . . . . . 239
6.7 Core Measure of Parental Disapproval by Sex . . . . . . . . . . . . . . . . . . . . . . . . . . . . . . . . . . . . . . . . . . . . . . . . . . . . . 239
6.8 Core Measure of Age of Onset by Sex . . . . . . . . . . . . . . . . . . . . . . . . . . . . . . . . . . . . . . . . . . . . . . . . . . . . . . . . . 239
10

8/7/2019 DALLAS COUNTY - Irving ISD - 2010 Pride Survey
http://slidepdf.com/reader/full/dallas-county-irving-isd-2010-pride-survey 11/239
List of Figures
3.1 Annual Use of Any Tobacco, Any Alcohol and Any Illicit Drug . . . . . . . . . . . . . . . . . . . . . . . . . . . . . . . . . . . . . . . . . . . . 26
3.2 Annual Use of Cigarettes, Smokeless Tobacco and Cigars . . . . . . . . . . . . . . . . . . . . . . . . . . . . . . . . . . . . . . . . . . . . . 27
3.3 Annual Use of Beer, Coolers and Liquor . . . . . . . . . . . . . . . . . . . . . . . . . . . . . . . . . . . . . . . . . . . . . . . . . . . . . . . 28
3.4 Annual Use of Marijuana, Cocaine, Uppers and Downers . . . . . . . . . . . . . . . . . . . . . . . . . . . . . . . . . . . . . . . . . . . . . . 29
3.5 Annual Use of Inhalants, Hallucinogens, Heroin and Steroids . . . . . . . . . . . . . . . . . . . . . . . . . . . . . . . . . . . . . . . . . . . . 30
3.6 Annual Use of Ecstasy and Meth . . . . . . . . . . . . . . . . . . . . . . . . . . . . . . . . . . . . . . . . . . . . . . . . . . . . . . . . . . . 31
3.7 Annual Use of Prescription Drugs, Pain Killers and Over-The-Counter Drugs . . . . . . . . . . . . . . . . . . . . . . . . . . . . . . . . . . . . 32
3.8 30-Day Use of Any Tobacco, Any Alcohol and Any Illicit Drug . . . . . . . . . . . . . . . . . . . . . . . . . . . . . . . . . . . . . . . . . . . . 34
3.9 30-Day Use of Cigarettes, Smokeless Tobacco and Cigars . . . . . . . . . . . . . . . . . . . . . . . . . . . . . . . . . . . . . . . . . . . . . 35
3.10 30-Day Use of Beer, Coolers and Liquor . . . . . . . . . . . . . . . . . . . . . . . . . . . . . . . . . . . . . . . . . . . . . . . . . . . . . . . 36
3.11 30-Day Use of Marijuana, Cocaine, Uppers and Downers . . . . . . . . . . . . . . . . . . . . . . . . . . . . . . . . . . . . . . . . . . . . . . 37
3.12 30-Day Use of Inhalants, Hallucinogens, Heroin and Steroids . . . . . . . . . . . . . . . . . . . . . . . . . . . . . . . . . . . . . . . . . . . . 38
3.13 30-Day Use of Ecstasy and Meth . . . . . . . . . . . . . . . . . . . . . . . . . . . . . . . . . . . . . . . . . . . . . . . . . . . . . . . . . . . 39
3.14 30-Day Use of Prescription Drugs, Pain Killers and Over-The-Counter Drugs . . . . . . . . . . . . . . . . . . . . . . . . . . . . . . . . . . . . 40
3.15 Perception of Risk – Any Tobacco . . . . . . . . . . . . . . . . . . . . . . . . . . . . . . . . . . . . . . . . . . . . . . . . . . . . . . . . . . 42
3.16 Perception of Risk – Regular Alcohol Use . . . . . . . . . . . . . . . . . . . . . . . . . . . . . . . . . . . . . . . . . . . . . . . . . . . . . . 43
3.17 Perception of Risk – Cigarettes . . . . . . . . . . . . . . . . . . . . . . . . . . . . . . . . . . . . . . . . . . . . . . . . . . . . . . . . . . . . 44
3.18 Perception of Risk – Smokeless Tobacco . . . . . . . . . . . . . . . . . . . . . . . . . . . . . . . . . . . . . . . . . . . . . . . . . . . . . . . 45
3.19 Perception of Risk – Cigars . . . . . . . . . . . . . . . . . . . . . . . . . . . . . . . . . . . . . . . . . . . . . . . . . . . . . . . . . . . . . . 46
3.20 Perception of Risk – Beer . . . . . . . . . . . . . . . . . . . . . . . . . . . . . . . . . . . . . . . . . . . . . . . . . . . . . . . . . . . . . . . 47
3.21 Perception of Risk – Coolers, Breezers, etc. . . . . . . . . . . . . . . . . . . . . . . . . . . . . . . . . . . . . . . . . . . . . . . . . . . . . . 48
3.22 Perception of Risk – Liquor . . . . . . . . . . . . . . . . . . . . . . . . . . . . . . . . . . . . . . . . . . . . . . . . . . . . . . . . . . . . . . 49
3.23 Perception of Risk – Marijuana . . . . . . . . . . . . . . . . . . . . . . . . . . . . . . . . . . . . . . . . . . . . . . . . . . . . . . . . . . . . 50
3.24 Perception of Parental Disapproval – Use Tobacco . . . . . . . . . . . . . . . . . . . . . . . . . . . . . . . . . . . . . . . . . . . . . . . . . . 52
3.25 Perception of Parental Disapproval – Use Alcohol . . . . . . . . . . . . . . . . . . . . . . . . . . . . . . . . . . . . . . . . . . . . . . . . . . 53
3.26 Perception of Parental Disapproval – Use Marijuana . . . . . . . . . . . . . . . . . . . . . . . . . . . . . . . . . . . . . . . . . . . . . . . . . 54
11

8/7/2019 DALLAS COUNTY - Irving ISD - 2010 Pride Survey
http://slidepdf.com/reader/full/dallas-county-irving-isd-2010-pride-survey 12/239
3.27 Perception of Friends’ Disapproval – Use Tobacco . . . . . . . . . . . . . . . . . . . . . . . . . . . . . . . . . . . . . . . . . . . . . . . . . . 56
3.28 Perception of Friends’ Disapproval – Use Alcohol . . . . . . . . . . . . . . . . . . . . . . . . . . . . . . . . . . . . . . . . . . . . . . . . . . 57
3.29 Perception of Friends’ Disapproval – Use Marijuana . . . . . . . . . . . . . . . . . . . . . . . . . . . . . . . . . . . . . . . . . . . . . . . . . 58
3.30 Average Age of Onset of Use of Any Tobacco . . . . . . . . . . . . . . . . . . . . . . . . . . . . . . . . . . . . . . . . . . . . . . . . . . . . 60
3.31 Average Age of Onset of Use of Any Alcohol . . . . . . . . . . . . . . . . . . . . . . . . . . . . . . . . . . . . . . . . . . . . . . . . . . . . . 61
3.32 Average Age of Onset of Use of Any Illicit Drug . . . . . . . . . . . . . . . . . . . . . . . . . . . . . . . . . . . . . . . . . . . . . . . . . . . 62
3.33 Average Age of Onset of Use of Cigarettes . . . . . . . . . . . . . . . . . . . . . . . . . . . . . . . . . . . . . . . . . . . . . . . . . . . . . . 63
3.34 Average Age of Onset of Use of Smokeless Tobacco . . . . . . . . . . . . . . . . . . . . . . . . . . . . . . . . . . . . . . . . . . . . . . . . 64
3.35 Average Age of Onset of Use of Cigars . . . . . . . . . . . . . . . . . . . . . . . . . . . . . . . . . . . . . . . . . . . . . . . . . . . . . . . . 65
3.36 Average Age of Onset of Use of Beer . . . . . . . . . . . . . . . . . . . . . . . . . . . . . . . . . . . . . . . . . . . . . . . . . . . . . . . . . 66
3.37 Average Age of Onset of Use of Coolers, Breezers, etc. . . . . . . . . . . . . . . . . . . . . . . . . . . . . . . . . . . . . . . . . . . . . . . . 67
3.38 Average Age of Onset of Use of Liquor . . . . . . . . . . . . . . . . . . . . . . . . . . . . . . . . . . . . . . . . . . . . . . . . . . . . . . . . 68
3.39 Average Age of Onset of Use of Marijuana . . . . . . . . . . . . . . . . . . . . . . . . . . . . . . . . . . . . . . . . . . . . . . . . . . . . . . 69
3.40 Average Age of Onset of Use of Cocaine . . . . . . . . . . . . . . . . . . . . . . . . . . . . . . . . . . . . . . . . . . . . . . . . . . . . . . . 70
3.41 Average Age of Onset of Use of Meth . . . . . . . . . . . . . . . . . . . . . . . . . . . . . . . . . . . . . . . . . . . . . . . . . . . . . . . . 71
3.42 Average Age of Onset of Use of Prescription Drugs . . . . . . . . . . . . . . . . . . . . . . . . . . . . . . . . . . . . . . . . . . . . . . . . . 72
3.43 Average Age of Onset of Use of Pain Killers . . . . . . . . . . . . . . . . . . . . . . . . . . . . . . . . . . . . . . . . . . . . . . . . . . . . . 733.44 Average Age of Onset of Use of Over-the-Counter Drugs . . . . . . . . . . . . . . . . . . . . . . . . . . . . . . . . . . . . . . . . . . . . . . 74
3.45 Attend Church or Synagogue . . . . . . . . . . . . . . . . . . . . . . . . . . . . . . . . . . . . . . . . . . . . . . . . . . . . . . . . . . . . . 76
3.46 Take Part in Community Activities . . . . . . . . . . . . . . . . . . . . . . . . . . . . . . . . . . . . . . . . . . . . . . . . . . . . . . . . . . . 77
3.47 Make Good Grades . . . . . . . . . . . . . . . . . . . . . . . . . . . . . . . . . . . . . . . . . . . . . . . . . . . . . . . . . . . . . . . . . . 78
3.48 Take Part in Sports Teams . . . . . . . . . . . . . . . . . . . . . . . . . . . . . . . . . . . . . . . . . . . . . . . . . . . . . . . . . . . . . . 79
3.49 Take Part in School Activities . . . . . . . . . . . . . . . . . . . . . . . . . . . . . . . . . . . . . . . . . . . . . . . . . . . . . . . . . . . . . 80
3.50 Get in Trouble at School . . . . . . . . . . . . . . . . . . . . . . . . . . . . . . . . . . . . . . . . . . . . . . . . . . . . . . . . . . . . . . . . 81
3.51 Teachers Talk About the Dangers of Drugs . . . . . . . . . . . . . . . . . . . . . . . . . . . . . . . . . . . . . . . . . . . . . . . . . . . . . . 82
3.52 Parents Talk About the Dangers of Drugs . . . . . . . . . . . . . . . . . . . . . . . . . . . . . . . . . . . . . . . . . . . . . . . . . . . . . . . 83
3.53 Parents Set Clear Rules . . . . . . . . . . . . . . . . . . . . . . . . . . . . . . . . . . . . . . . . . . . . . . . . . . . . . . . . . . . . . . . . 843.54 Parents Punish for Breaking Rules . . . . . . . . . . . . . . . . . . . . . . . . . . . . . . . . . . . . . . . . . . . . . . . . . . . . . . . . . . 85
3.55 Availability – Any Tobacco . . . . . . . . . . . . . . . . . . . . . . . . . . . . . . . . . . . . . . . . . . . . . . . . . . . . . . . . . . . . . . . 87
3.56 Availability – Any Alcohol . . . . . . . . . . . . . . . . . . . . . . . . . . . . . . . . . . . . . . . . . . . . . . . . . . . . . . . . . . . . . . . 88
3.57 Availability – Marijuana . . . . . . . . . . . . . . . . . . . . . . . . . . . . . . . . . . . . . . . . . . . . . . . . . . . . . . . . . . . . . . . . 89
3.58 Where Do You Use Any Tobacco . . . . . . . . . . . . . . . . . . . . . . . . . . . . . . . . . . . . . . . . . . . . . . . . . . . . . . . . . . . 91
3.59 Where Do You Use Any Alcohol . . . . . . . . . . . . . . . . . . . . . . . . . . . . . . . . . . . . . . . . . . . . . . . . . . . . . . . . . . . . 92
3.60 Where Do You Use Cigarettes . . . . . . . . . . . . . . . . . . . . . . . . . . . . . . . . . . . . . . . . . . . . . . . . . . . . . . . . . . . . 93
3.61 Where Do You Use Smokeless Tobacco . . . . . . . . . . . . . . . . . . . . . . . . . . . . . . . . . . . . . . . . . . . . . . . . . . . . . . . 94
3.62 Where Do You Use Cigars . . . . . . . . . . . . . . . . . . . . . . . . . . . . . . . . . . . . . . . . . . . . . . . . . . . . . . . . . . . . . . 95
12

8/7/2019 DALLAS COUNTY - Irving ISD - 2010 Pride Survey
http://slidepdf.com/reader/full/dallas-county-irving-isd-2010-pride-survey 13/239
3.63 Where Do You Use Beer . . . . . . . . . . . . . . . . . . . . . . . . . . . . . . . . . . . . . . . . . . . . . . . . . . . . . . . . . . . . . . . 96
3.64 Where Do You Use Coolers, Breezers, etc. . . . . . . . . . . . . . . . . . . . . . . . . . . . . . . . . . . . . . . . . . . . . . . . . . . . . . . 97
3.65 Where Do You Use Liquor . . . . . . . . . . . . . . . . . . . . . . . . . . . . . . . . . . . . . . . . . . . . . . . . . . . . . . . . . . . . . . . 98
3.66 Where Do You Use Marijuana . . . . . . . . . . . . . . . . . . . . . . . . . . . . . . . . . . . . . . . . . . . . . . . . . . . . . . . . . . . . . 99
3.67 When Do You Use Any Tobacco . . . . . . . . . . . . . . . . . . . . . . . . . . . . . . . . . . . . . . . . . . . . . . . . . . . . . . . . . . . 101
3.68 When Do You Use Any Alcohol . . . . . . . . . . . . . . . . . . . . . . . . . . . . . . . . . . . . . . . . . . . . . . . . . . . . . . . . . . . . 102
3.69 When Do You Use Cigarettes . . . . . . . . . . . . . . . . . . . . . . . . . . . . . . . . . . . . . . . . . . . . . . . . . . . . . . . . . . . . . 1033.70 When Do You Use Smokeless Tobacco . . . . . . . . . . . . . . . . . . . . . . . . . . . . . . . . . . . . . . . . . . . . . . . . . . . . . . . . 104
3.71 When Do You Use Cigars . . . . . . . . . . . . . . . . . . . . . . . . . . . . . . . . . . . . . . . . . . . . . . . . . . . . . . . . . . . . . . . 105
3.72 When Do You Use Beer . . . . . . . . . . . . . . . . . . . . . . . . . . . . . . . . . . . . . . . . . . . . . . . . . . . . . . . . . . . . . . . . 106
3.73 When Do You Use Coolers, Breezers, etc. . . . . . . . . . . . . . . . . . . . . . . . . . . . . . . . . . . . . . . . . . . . . . . . . . . . . . . 107
3.74 When Do You Use Liquor . . . . . . . . . . . . . . . . . . . . . . . . . . . . . . . . . . . . . . . . . . . . . . . . . . . . . . . . . . . . . . . 108
3.75 When Do You Use Marijuana . . . . . . . . . . . . . . . . . . . . . . . . . . . . . . . . . . . . . . . . . . . . . . . . . . . . . . . . . . . . . 109
3.76 Use of Any Tobacco by Gender . . . . . . . . . . . . . . . . . . . . . . . . . . . . . . . . . . . . . . . . . . . . . . . . . . . . . . . . . . . . 111
3.77 Use of Any Alcohol by Gender . . . . . . . . . . . . . . . . . . . . . . . . . . . . . . . . . . . . . . . . . . . . . . . . . . . . . . . . . . . . 112
3.78 Use of Any Illicit Drug by Gender . . . . . . . . . . . . . . . . . . . . . . . . . . . . . . . . . . . . . . . . . . . . . . . . . . . . . . . . . . . 113
3.79 Use of Cigarettes by Gender . . . . . . . . . . . . . . . . . . . . . . . . . . . . . . . . . . . . . . . . . . . . . . . . . . . . . . . . . . . . . 1143.80 Use of Smokeless Tobacco by Gender . . . . . . . . . . . . . . . . . . . . . . . . . . . . . . . . . . . . . . . . . . . . . . . . . . . . . . . . 115
3.81 Use of Cigars by Gender . . . . . . . . . . . . . . . . . . . . . . . . . . . . . . . . . . . . . . . . . . . . . . . . . . . . . . . . . . . . . . . 116
3.82 Use of Beer by Gender . . . . . . . . . . . . . . . . . . . . . . . . . . . . . . . . . . . . . . . . . . . . . . . . . . . . . . . . . . . . . . . . 117
3.83 Use of Coolers, Breezers, etc. by Gender . . . . . . . . . . . . . . . . . . . . . . . . . . . . . . . . . . . . . . . . . . . . . . . . . . . . . . 118
3.84 Use of Liquor by Gender . . . . . . . . . . . . . . . . . . . . . . . . . . . . . . . . . . . . . . . . . . . . . . . . . . . . . . . . . . . . . . . 119
3.85 Use of Marijuana by Gender . . . . . . . . . . . . . . . . . . . . . . . . . . . . . . . . . . . . . . . . . . . . . . . . . . . . . . . . . . . . . 120
3.86 Use of Cocaine by Gender . . . . . . . . . . . . . . . . . . . . . . . . . . . . . . . . . . . . . . . . . . . . . . . . . . . . . . . . . . . . . . 121
3.87 Use of Uppers by Gender . . . . . . . . . . . . . . . . . . . . . . . . . . . . . . . . . . . . . . . . . . . . . . . . . . . . . . . . . . . . . . . 122
3.88 Use of Downers by Gender . . . . . . . . . . . . . . . . . . . . . . . . . . . . . . . . . . . . . . . . . . . . . . . . . . . . . . . . . . . . . . 123
3.89 Use of Inhalants by Gender . . . . . . . . . . . . . . . . . . . . . . . . . . . . . . . . . . . . . . . . . . . . . . . . . . . . . . . . . . . . . . 1243.90 Use of Hallucinogens by Gender . . . . . . . . . . . . . . . . . . . . . . . . . . . . . . . . . . . . . . . . . . . . . . . . . . . . . . . . . . . 125
3.91 Use of Heroin by Gender . . . . . . . . . . . . . . . . . . . . . . . . . . . . . . . . . . . . . . . . . . . . . . . . . . . . . . . . . . . . . . . 126
3.92 Use of Steroids by Gender . . . . . . . . . . . . . . . . . . . . . . . . . . . . . . . . . . . . . . . . . . . . . . . . . . . . . . . . . . . . . . 127
3.93 Use of Ecstasy by Gender . . . . . . . . . . . . . . . . . . . . . . . . . . . . . . . . . . . . . . . . . . . . . . . . . . . . . . . . . . . . . . 128
3.94 Use of Meth by Gender . . . . . . . . . . . . . . . . . . . . . . . . . . . . . . . . . . . . . . . . . . . . . . . . . . . . . . . . . . . . . . . . 129
3.95 Use of Prescription Drugs by Gender . . . . . . . . . . . . . . . . . . . . . . . . . . . . . . . . . . . . . . . . . . . . . . . . . . . . . . . . . 130
3.96 Attend Church or Synagogue . . . . . . . . . . . . . . . . . . . . . . . . . . . . . . . . . . . . . . . . . . . . . . . . . . . . . . . . . . . . . 132
3.97 Take Part in Community Activities . . . . . . . . . . . . . . . . . . . . . . . . . . . . . . . . . . . . . . . . . . . . . . . . . . . . . . . . . . . 133
3.98 Make Good Grades . . . . . . . . . . . . . . . . . . . . . . . . . . . . . . . . . . . . . . . . . . . . . . . . . . . . . . . . . . . . . . . . . . 134
13

8/7/2019 DALLAS COUNTY - Irving ISD - 2010 Pride Survey
http://slidepdf.com/reader/full/dallas-county-irving-isd-2010-pride-survey 14/239
3.99 Take Part in Sports Teams . . . . . . . . . . . . . . . . . . . . . . . . . . . . . . . . . . . . . . . . . . . . . . . . . . . . . . . . . . . . . . 135
3.100 Take Part in School Activities . . . . . . . . . . . . . . . . . . . . . . . . . . . . . . . . . . . . . . . . . . . . . . . . . . . . . . . . . . . . . 136
3.101 Get Into Trouble at School . . . . . . . . . . . . . . . . . . . . . . . . . . . . . . . . . . . . . . . . . . . . . . . . . . . . . . . . . . . . . . . 137
3.102 Teachers Talk About Dangers of Drugs . . . . . . . . . . . . . . . . . . . . . . . . . . . . . . . . . . . . . . . . . . . . . . . . . . . . . . . . 138
3.103 Parents Talk About Dangers of Drugs . . . . . . . . . . . . . . . . . . . . . . . . . . . . . . . . . . . . . . . . . . . . . . . . . . . . . . . . . 139
3.104 Parents Set Clear Rules . . . . . . . . . . . . . . . . . . . . . . . . . . . . . . . . . . . . . . . . . . . . . . . . . . . . . . . . . . . . . . . . 140
3.105 Parents Punish for Breaking Rules . . . . . . . . . . . . . . . . . . . . . . . . . . . . . . . . . . . . . . . . . . . . . . . . . . . . . . . . . . 1413.106 Drug Use of Students Who Reported Carrying a Gun to School . . . . . . . . . . . . . . . . . . . . . . . . . . . . . . . . . . . . . . . . . . . 143
3.107 Drug Use of Students Who Reported Involvement in Gangs . . . . . . . . . . . . . . . . . . . . . . . . . . . . . . . . . . . . . . . . . . . . . 144
3.108 Drug Use of Students Who Reported Thinking About Suicide . . . . . . . . . . . . . . . . . . . . . . . . . . . . . . . . . . . . . . . . . . . . 145
3.109 Drug Use of Students Who Reported Being Overweight . . . . . . . . . . . . . . . . . . . . . . . . . . . . . . . . . . . . . . . . . . . . . . . 146
3.110 Drug Use of Students Who Reported Threatening/Harmful Behaviors . . . . . . . . . . . . . . . . . . . . . . . . . . . . . . . . . . . . . . . . 147
3.111 Drug Use of Students Who Reported Trouble with Police . . . . . . . . . . . . . . . . . . . . . . . . . . . . . . . . . . . . . . . . . . . . . . 148
5.112 30-Day Use of Any Alcohol, Beer, Coolers and Liquor . . . . . . . . . . . . . . . . . . . . . . . . . . . . . . . . . . . . . . . . . . . . . . . . 222
5.113 Location of Any Alcohol Use . . . . . . . . . . . . . . . . . . . . . . . . . . . . . . . . . . . . . . . . . . . . . . . . . . . . . . . . . . . . . 222
5.114 Time of Any Alcohol Use . . . . . . . . . . . . . . . . . . . . . . . . . . . . . . . . . . . . . . . . . . . . . . . . . . . . . . . . . . . . . . . 2225.115 Monthly Use of Marijuana . . . . . . . . . . . . . . . . . . . . . . . . . . . . . . . . . . . . . . . . . . . . . . . . . . . . . . . . . . . . . . . 224
5.116 Location of Marijuana Use . . . . . . . . . . . . . . . . . . . . . . . . . . . . . . . . . . . . . . . . . . . . . . . . . . . . . . . . . . . . . . 225
5.117 Time of Any Marijuana Use . . . . . . . . . . . . . . . . . . . . . . . . . . . . . . . . . . . . . . . . . . . . . . . . . . . . . . . . . . . . . . 225
5.118 Friends’ Use of Marijauna . . . . . . . . . . . . . . . . . . . . . . . . . . . . . . . . . . . . . . . . . . . . . . . . . . . . . . . . . . . . . . . 225
5.119 Monthly Use of Cocaine, Uppers and Downers . . . . . . . . . . . . . . . . . . . . . . . . . . . . . . . . . . . . . . . . . . . . . . . . . . . . 228
14

8/7/2019 DALLAS COUNTY - Irving ISD - 2010 Pride Survey
http://slidepdf.com/reader/full/dallas-county-irving-isd-2010-pride-survey 15/239
Chapter 1
Introduction
This report contains the data collected in your school(s) using the Pride
Surveys Questionnaire . The report is organized as follows:
1. A Summary that provides you with the fundamental findings in an ab-
breviated and easy to read fashion.
2. Color Graphs that provide more expansive results from the survey in
pictorial fashion.
3. A List of Tables which contains the complete findings of the survey. This
section itemizes student responses by each grade level and each item
scale (for example: never, seldom, sometimes, often and a lot).
4. A Narrative Report which includes both text and graphic images. This
section also includes a sample news release.
Additionally, the report contains a special section entitled Drug Free Com-
munities Support Program . This section was developed to provide the data
needed to satisfy core measures required by the Drug Free Communities
Support Program, administered by the Substance Abuse and Mental Health
Services Administration.
1.1 How To Use Your Data
• Meet the accountability requirements of federal and state agencies that
your programs be evidence-based.
• Establish a needs assessment to design and secure funding for newprograms.
• Conduct periodic performance evaluations for continuing programs.
• Encourage community-wide support for your programs.
• Determine why negative student behaviors occur by examining risk and
protective factors.
15

8/7/2019 DALLAS COUNTY - Irving ISD - 2010 Pride Survey
http://slidepdf.com/reader/full/dallas-county-irving-isd-2010-pride-survey 16/239
Pride Surveys Report: 2009-10 Irving Independent Schools
Table 1.1: Number of Students Surveyed
Grade Grade Total Male Female
6 2179 1009 1054
7 2081 992 987
8 2084 955 974
9 2076 918 93910 1499 641 702
11 1398 612 618
12 0 0 0
6-8 6344 2956 3015
9-12 4973 2171 2259
Total 11317 5127 5274
1.2 Local Use vs. National Use
1.2.1 Annual Use
The following tables compare local annual use figures to the 2008-09 PrideSummary for all schools. A negative figure in the diff row indicates that local
percentages for annual use are below national percentages and a positive
figure in the diff row indicates that local percentages for annual use are above
national percentages. NA means that percentage figures for this particular
drug are not available.
Table 1.2: Annual Use – Local vs National – Tobacco
DRUG/Location 6th 7th 8th 9th 10th 11th
Cigarettes
Local 8.3 15.1 22.6 22.0 25.5 24.6National 6.0 10.0 15.1 22.7 25.6 31.0
diff 2.3 5.1 7.5 -0.7 -0.1 -6.4
Smokeless Tobacco
Local 2.9 4.0 5.6 6.6 9.0 6.5
National 3.5 5.1 6.6 11.5 12.9 14.7
diff -0.6 -1.1 -1.0 -4.9 -3.9 -8.2
Cigars
Local 5.7 9.5 14.5 15.1 17.1 13.7
National 3.4 5.0 7.7 13.1 16.7 21.5
diff 2.3 4.5 6.8 2.0 0.4 -7.8Any Tobacco
Local 9.5 17.7 24.4 25.1 28.5 26.8
National 7.7 12.8 18.6 28.3 32.1 38.5
diff 1.8 4.9 5.8 -3.2 -3.6 -11.7
Introduction 16

8/7/2019 DALLAS COUNTY - Irving ISD - 2010 Pride Survey
http://slidepdf.com/reader/full/dallas-county-irving-isd-2010-pride-survey 17/239
Pride Surveys Report: 2009-10 Irving Independent Schools
Table 1.3: Annual Use – Local vs National – Alcohol
DRUG/Location 6th 7th 8th 9th 10th 11th
Beer
Local 19.3 27.3 40.3 39.9 44.2 45.6
National 11.4 17.5 26.3 35.1 43.3 47.7diff 7.9 9.8 14.0 4.8 0.9 -2.1
Coolers, Breezers, etc.
Local 13.8 23.3 34.8 34.9 40.6 43.2
National 9.8 16.4 26.8 35.7 42.5 47.1
diff 4.0 6.9 8.0 -0.8 -1.9 -3.9
Liquor
Local 12.1 21.0 33.7 35.4 43.5 45.8
National 7.6 13.8 23.5 35.9 44.9 51.7
diff 4.5 7.2 10.2 -0.5 -1.4 -5.9
Any Alcohol
Local 25.0 36.0 49.6 49.5 55.2 57.6
National 15.9 24.7 36.5 47.8 55.7 61.5
diff 9.1 11.3 13.1 1.7 -0.5 -3.9
Table 1.4: Annual Use – Local vs National – Illicit Drugs 1
DRUG/Location 6th 7th 8th 9th 10th 11th
Marijuana
Local 6.0 11.2 20.4 24.7 29.2 26.7
National 3.3 5.6 10.8 18.9 23.6 28.4diff 2.7 5.6 9.6 5.8 5.6 -1.7
Cocaine
Local 3.1 3.6 5.8 7.6 10.3 7.9
National 1.7 1.6 2.4 4.7 5.2 6.8
diff 1.4 2.0 3.4 2.9 5.1 1.1
Uppers
Local 2.4 3.1 4.9 7.1 9.9 7.4
National 1.9 2.1 3.0 6.2 7.9 9.2
diff 0.5 1.0 1.9 0.9 2.0 -1.8
Downers
Local 2.6 3.1 4.4 7.4 9.6 7.9
National 2.0 2.0 3.1 6.3 7.5 8.9
diff 0.6 1.1 1.3 1.1 2.1 -1.0
Inhalants
Local 6.9 6.6 7.4 6.4 8.2 4.7
National 4.1 5.0 5.5 6.4 6.1 5.7
diff 2.8 1.6 1.9 0.0 2.1 -1.0
Hallucinogens
Local 2.2 2.1 3.2 5.2 8.2 6.1
National 1.6 1.3 2.1 4.4 5.4 6.3
diff 0.6 0.8 1.1 0.8 2.8 -0.2
Heroin
Local 2.6 2.4 4.0 5.1 7.4 4.5
National 1.6 1.2 1.7 3.3 3.2 3.8
diff 1.0 1.2 2.3 1.8 4.2 0.7
Any Illicit Drug
Local 13.8 18.8 26.5 29.0 32.6 30.3
National 7.2 10.9 15.6 22.8 27.5 31.6
diff 6.6 7.9 10.9 6.2 5.1 -1.3
Introduction 17

8/7/2019 DALLAS COUNTY - Irving ISD - 2010 Pride Survey
http://slidepdf.com/reader/full/dallas-county-irving-isd-2010-pride-survey 18/239
Pride Surveys Report: 2009-10 Irving Independent Schools
Table 1.5: Annual Use – Local vs National – Illicit Drugs 2
DRUG/Location 6th 7th 8th 9th 10th 11th
Steroids
Local 2.7 1.8 2.5 3.1 5.2 3.4
National 2.1 1.9 2.0 3.4 3.5 3.7diff 0.6 -0.1 0.5 -0.3 1.7 -0.3
Ecstasy
Local 2.0 2.3 4.9 7.4 11.0 8.9
National 1.6 1.3 2.2 4.5 5.1 6.0
diff 0.4 1.0 2.7 2.9 5.9 2.9
Meth
Local 3.6 3.5 4.8 5.0 6.3 4.7
National 2.0 1.8 2.0 3.5 3.4 4.0
diff 1.6 1.7 2.8 1.5 2.9 0.7
Prescription Drugs
Local 4.1 4.6 6.1 8.0 11.1 9.5
National NA NA NA NA NA NA
diff NA NA NA NA NA NA
Pain Killers
Local 3.5 3.4 5.7 8.6 11.4 9.9
National NA NA NA NA NA NA
diff NA NA NA NA NA NA
Over-the-Counter Drugs
Local 4.2 5.1 6.6 7.7 10.1 8.3
National NA NA NA NA NA NA
diff NA NA NA NA NA NA
Any Illicit Drug
Local 13.8 18.8 26.5 29.0 32.6 30.3
National 7.2 10.9 15.6 22.8 27.5 31.6
diff 6.6 7.9 10.9 6.2 5.1 -1.3
1.2.2 Monthly Use
The following tables compare local monthly use figures to the 2008-09 Pride
Summary for all schools. A negative figure in the diff row indicates that lo-
cal percentages for monthly use are below national percentages and a pos-
itive figure in the diff row indicates that local percentages for monthly use
are above national percentages. NA means that percentage figures for this
particular drug are not available.
Table 1.6: Monthly Use – Local vs National – Tobacco
DRUG/Location 6th 7th 8th 9th 10th 11th
Cigarettes
Local 3.9 5.5 10.2 11.7 14.9 12.5
National 2.9 4.7 7.9 14.0 16.3 20.4
diff 1.0 0.8 2.3 -2.3 -1.4 -7.9Smokeless Tobacco
Local 2.0 2.0 3.1 4.0 5.8 4.3
National 1.9 2.5 3.6 7.2 7.8 9.3
diff 0.1 -0.5 -0.5 -3.2 -2.0 -5.0
Cigars
Local 2.8 3.2 6.9 8.1 9.5 6.8
National 1.7 1.9 3.3 6.7 8.0 10.3
diff 1.1 1.3 3.6 1.4 1.5 -3.5
Any Tobacco
Local 4.3 6.6 11.3 13.7 16.5 13.9National 3.5 6.1 9.9 17.8 20.3 25.4
diff 0.8 0.5 1.4 -4.1 -3.8 -11.5
Introduction 18

8/7/2019 DALLAS COUNTY - Irving ISD - 2010 Pride Survey
http://slidepdf.com/reader/full/dallas-county-irving-isd-2010-pride-survey 19/239
Pride Surveys Report: 2009-10 Irving Independent Schools
Table 1.7: Monthly Use – Local vs National – Alcohol
DRUG/Location 6th 7th 8th 9th 10th 11th
Beer
Local 4.6 8.5 16.2 18.0 22.7 22.3
National 3.4 5.5 9.6 17.1 22.2 26.7diff 1.2 3.0 6.6 0.9 0.5 -4.4
Coolers, Breezers, etc.
Local 4.3 7.2 13.9 15.4 18.7 19.9
National 3.3 5.2 9.7 15.9 19.6 22.6
diff 1.0 2.0 4.2 -0.5 -0.9 -2.7
Liquor
Local 3.6 5.7 12.2 16.2 22.3 21.3
National 2.6 4.5 9.0 17.2 22.8 27.6
diff 1.0 1.2 3.2 -1.0 -0.5 -6.3
Any Alcohol
Local 6.3 11.1 20.1 22.1 27.7 27.8
National 4.6 7.5 13.4 22.2 28.0 33.0
diff 1.7 3.6 6.7 -0.1 -0.3 -5.2
Table 1.8: Monthly Use – Local vs National – Illicit Drugs 1
DRUG/Location 6th 7th 8th 9th 10th 11th
Marijuana
Local 3.3 7.2 13.2 16.8 20.9 16.8
National 2.1 3.1 6.2 12.3 14.5 17.5diff 1.2 4.1 7.0 4.5 6.4 -0.7
Cocaine
Local 1.6 1.7 3.1 4.9 7.0 4.8
National 1.4 0.9 1.4 3.1 3.3 3.9
diff 0.2 0.8 1.7 1.8 3.7 0.9
Uppers
Local 1.4 1.7 2.6 4.9 6.6 5.3
National 1.5 1.2 1.8 4.0 5.1 6.1
diff -0.1 0.5 0.8 0.9 1.5 -0.8
Downers
Local 1.4 1.8 2.5 5.2 6.5 5.1
National 1.4 1.1 1.7 4.0 4.7 5.7
diff 0.0 0.7 0.8 1.2 1.8 -0.6
Inhalants
Local 2.6 2.5 3.4 3.1 5.1 2.8
National 2.2 2.0 2.3 3.4 3.2 3.3
diff 0.4 0.5 1.1 -0.3 1.9 -0.5
Hallucinogens
Local 1.4 1.1 2.0 3.4 5.8 4.1
National 1.3 0.9 1.3 3.0 3.2 3.8
diff 0.1 0.2 0.7 0.4 2.6 0.3
Heroin
Local 1.6 1.1 2.5 3.5 5.1 2.9
National 1.3 0.7 1.1 2.3 2.3 2.8
diff 0.3 0.4 1.4 1.2 2.8 0.1
Any Illicit Drug
Local 5.6 9.7 15.6 19.0 23.4 19.2
National 3.6 5.2 8.3 14.4 17.2 20.0
diff 2.0 4.5 7.3 4.6 6.2 -0.8
Introduction 19

8/7/2019 DALLAS COUNTY - Irving ISD - 2010 Pride Survey
http://slidepdf.com/reader/full/dallas-county-irving-isd-2010-pride-survey 20/239
Pride Surveys Report: 2009-10 Irving Independent Schools
Table 1.9: Monthly Use – Local vs National – Illicit Drugs 2
DRUG/Location 6th 7th 8th 9th 10th 11th
Steroids
Local 1.6 0.8 1.7 2.4 3.7 3.0
National 1.3 0.9 1.2 2.3 2.5 2.7diff 0.3 -0.1 0.5 0.1 1.2 0.3
Ecstasy
Local 1.5 1.2 2.5 4.4 6.8 5.3
National 1.3 0.7 1.3 2.7 3.0 3.5
diff 0.2 0.5 1.2 1.7 3.8 1.8
Meth
Local 1.8 1.2 2.4 3.2 4.4 3.0
National 1.4 1.0 1.2 2.4 2.5 2.8
diff 0.4 0.2 1.2 0.8 1.9 0.2
Prescription Drugs
Local 2.3 2.3 3.3 4.8 6.9 5.6
National 0.0 0.0 0.0 0.0 0.0 0.0
diff 2.3 2.3 3.3 4.8 6.9 5.6
Pain Killers
Local 2.0 1.9 3.2 5.4 6.7 6.2
National 0.0 0.0 0.0 0.0 0.0 0.0
diff 2.0 1.9 3.2 5.4 6.7 6.2
Over-the-Counter Drugs
Local 2.2 2.4 3.5 4.6 6.3 5.2
National 0.0 0.0 0.0 0.0 0.0 0.0
diff 2.2 2.4 3.5 4.6 6.3 5.2
Any Illicit Drug
Local 5.6 9.7 15.6 19.0 23.4 19.2
National 3.6 5.2 8.3 14.4 17.2 20.0
diff 2.0 4.5 7.3 4.6 6.2 -0.8
We recommend that you share the findings of your survey with staff/faculty,
administration, boards of education, elected officials, parents, community or-
ganizations and the news media.
While the findings are likely to show that certain problems exist within
your student population, the overriding message will be that you are taking afact-based approach to understand and solve these problems
If you have questions about this report or if you wish to have information
on other Pride Surveys services and products, please contact:
Pride Surveys
c/o Janie Pitcock
160 Vanderbilt Court
Bowling Green, KY 42103
1-800-279-6361
1-270-746-9596
The following information is for Pride Surveys internal use only.
• Data Files:u s 0 9 0 2 5 7 - 2 6 8
• Filter:( g r a d e = = 1 | | g r a d e = = 2 | | g r a d e = = 3 | | g r a d e = =
4 | | g r a d e = = 5 | | g r a d e = = 6 )
Introduction 20

8/7/2019 DALLAS COUNTY - Irving ISD - 2010 Pride Survey
http://slidepdf.com/reader/full/dallas-county-irving-isd-2010-pride-survey 21/239
Chapter 2
Summary
Many federal agencies have identified certain data that are most impor-
tant in measuring drug use and perceptions among youth. These data are
often referred to as the Core Measures and consist of:
• Reported 30-day Use - the percentage of students who have re-
ported use in the last 30 days,
• Perception of Risk - the percentage of students who reported that
a drug was harmful or very harmful ,
• Perception of Parental Disapproval of Use - the percentage of stu-
dents who reported that their parents would feel if was Wrong or
Very Wrong to use,
• Perception of friend’s Disapproval of Use - the percentage of stu-dents who reported that their friendswould feel if was Wrong or
Very Wrong to use,
• Age of Onset of Use - average age of first use
for the drug categories of tobacco, alcohol and marijuana. The chapter
entitled Drug Free Communitites Support Program Core Measures will delve
into these measures in detail. This section will briefly summarize these data.
(Note: In order to comply with federal guidlines an additional question was
added to the questionnaire regarding use of alcohol on a regular basis as
opposed to any use of alcohol at all. Respones to this question are analogous
with the other harm questions and include No Risk, Slight Risk, Moderate
Risk and Great Risk. Perception of risk results regarding alcohol are based
on thenew question and report thepercentage of students whoregardregular
alcohol use as Moderate Risk or Great Risk.
21
8/7/2019 DALLAS COUNTY - Irving ISD - 2010 Pride Survey
http://slidepdf.com/reader/full/dallas-county-irving-isd-2010-pride-survey 22/239
Pride Surveys Report: 2009-10 Irving Independent Schools
2.1 Core Measures
Table 2.1: Core Measures for All Students
Measure Tobacco Alcohol Marijuana
30-Day Use 10.5 18.0 12.3
Perceived Risk 79.0 75.3 68.7
Parental Disapproval 89.8 79.9 90.8
Friend’s Disapproval 63.7 52.2 65.1
Avg. Age of First Use 12.2 12.2 12.8
2.2 Annual and Monthly Use
Table 2.2: Percentage of Students Who Report Using Drugs
DRUG ANNUAL MONTHLY
Any Tobacco 21.2 10.5
Cigarettes 18.9 9.3
Smokeless Tobacco 5.5 3.3
Cigars 12.2 6.0
Any Alcohol 44.0 18.0
Beer 34.9 14.4
Coolers, etc. 30.4 12.5
Liquor 30.2 12.5
Any Illicit Drug 24.3 14.6
Marijuana 18.6 12.3
Cocaine 6.0 3.6
Uppers 5.4 3.5
Downers 5.5 3.5
Inhalants 6.8 3.2
Hallucinogens 4.2 2.7
Heroin 4.1 2.6
Steroids 3.0 2.1
Ecstasy 5.6 3.3
Meth 4.6 2.6
Prescription Drugs 6.9 3.9
Pain Killers 6.6 3.9Over-the-Counter Drugs 6.7 3.8
Summary 22

8/7/2019 DALLAS COUNTY - Irving ISD - 2010 Pride Survey
http://slidepdf.com/reader/full/dallas-county-irving-isd-2010-pride-survey 23/239
Pride Surveys Report: 2009-10 Irving Independent Schools
2.3 Where Students Use
Table 2.3: Where Do Students Report Using
AT AT IN A FRIENDS’
DRUG HOME S CHOOL C AR HOUSE OTHER
Tobacco 6.7 2.6 4.0 9.8 10.1
Alcohol 19.1 2.4 3.9 17.5 17.1
Marijuana 4.4 2.6 4.3 10.1 9.1
2.4 When Students Use
Table 2.4: When Do Students Report UsingBEFORE DURING AFTER WEEK WEEK
DRUG SCHOOL SCHOOL SCHOOL NIGHT END
Tobacco 3.3 2.0 6.8 5.8 12.7
Alcohol 2.0 1.8 4.7 8.2 30.1
Marijuana 3.6 2.0 6.0 5.8 12.2
2.5 Risk Factors
Table 2.5: Percentage Of Students At Risk
FACTOR PCT AT RISK
Guns NOT at School 10.2
Guns AT School 5.0
Gang Activity 4.3
Contemplate Suicide 6.9
Trouble With Police 35.4
Threaten A Student With a Gun, Knife or Club 5.6
Threaten To Hurt A Student By Hitting, Slapping or Kicking 31.6
Hurt A Student With A Gun, Knife or Club 3.9
Hur t A Student By Hitting, Slapping or Kicking 30.7
Been Threatened With a Gun, Knife or Club 9.1
Had A Student Threaten To Hit, Slap or Kick 31.1Been Afraid A Student May Hurt You 19.7
Been Hur t By A Student With A Gun, Knife or Club 3.9
Been Hurt By A Student By Hitting, Slapping or Kicking 21.5
2.6 Protective Factors
Table 2.6: Percentage Of Students ProtectedFACTOR PCT PROTECTED
Make Good Grades 65.9
Attend Church or Synagogue 43.8
Take Part in Community Activities 17.6
Take Part in School Activities 33.8
Teachers Talk About the Dangers of Dr ugs 27.2
Parents Talk A bout the Dangers of D rugs 38.9
Summary 23

8/7/2019 DALLAS COUNTY - Irving ISD - 2010 Pride Survey
http://slidepdf.com/reader/full/dallas-county-irving-isd-2010-pride-survey 24/239
Chapter 3
Graphics
The following graphs will assist you in understanding the relationship of
student behavior to alcohol and other drug usage. You are encouraged to
make overheads or slides from the graphs for presentations to school faculty,
parents, media, and other audiences in the community.
The Location and Time of drug use graphs will be helpful in understanding
the need for a commitment to drug abuse prevention by parents and the larger
community - not just by schools. Student alcohol and other drug use occurs
most often outside the school and at times when school is not in session.
The Perceived Harm of alcohol and other drugs will assist with under-
standing how the false assumptions concerning harm are related to drug use.
When drugs are perceived as harmless, the probability of use increases.
Research indicates that easy access, Availability , to drugs increases theprobability of use. Availability of alcohol and other drugs normally increases
at higher grade levels.
24

8/7/2019 DALLAS COUNTY - Irving ISD - 2010 Pride Survey
http://slidepdf.com/reader/full/dallas-county-irving-isd-2010-pride-survey 25/239
Pride Surveys Report: 2009-10 Irving Independent Schools
3.1 Frequency of Use
3.1.1 Annual Use
Graphics 25

8/7/2019 DALLAS COUNTY - Irving ISD - 2010 Pride Survey
http://slidepdf.com/reader/full/dallas-county-irving-isd-2010-pride-survey 26/239
Pride Surveys Report: 2009-10 Irving Independent Schools
Annual Use of Any Tobacco, Any Alcohol and Any Illicit Drug
Source: Pride Surveys
Any Tobacco Any Alcohol Any Illicit Drug
6th 7th 8th 9th 10th 11th
9 . 5
1 7 . 7
2 4 . 4
2 5 .
1 2 8 . 5
2 6 . 8
2 5 .
0
3 6 . 0
4 9 . 6
4 9 . 5
5 5 .
2 5 7 .
6
1 3 . 8
1 8 . 8
2 6 . 5 2
9 . 0
3 2 . 6
3 0 . 3
Graphics 26

8/7/2019 DALLAS COUNTY - Irving ISD - 2010 Pride Survey
http://slidepdf.com/reader/full/dallas-county-irving-isd-2010-pride-survey 27/239
Pride Surveys Report: 2009-10 Irving Independent Schools
Annual Use of Cigarettes, Smokeless Tobacco and Cigars
Source: Pride Surveys
Cigarettes Smokeless Tobacco Cigars
6th 7th 8th 9th 10th 11th
8 . 3
1 5 . 1
2 2 . 6
2 2 . 0
2 5 . 5
2 4 . 6
2 . 9 4
. 0
5 . 6
6 . 6
9 . 0
6 . 5
5 . 7
9 . 5
1 4 . 5 1 5
. 1
1 7 .
1
1 3 . 7
Graphics 27

8/7/2019 DALLAS COUNTY - Irving ISD - 2010 Pride Survey
http://slidepdf.com/reader/full/dallas-county-irving-isd-2010-pride-survey 28/239
Pride Surveys Report: 2009-10 Irving Independent Schools
Annual Use of Beer, Coolers and Liquor
Source: Pride Surveys
Beer Coolers Liquor
6th 7th 8th 9th 10th 11th
1 9 . 3
2 7 . 3
4 0 . 3
3 9 . 9
4 4 . 2 4
5 . 6
1 3 . 8
2 3 . 3
3 4 . 8
3 4 . 9
4 0 . 6
4 3 . 2
1 2 . 1
2 1 . 0
3 3 . 7 3
5 . 4
4 3 . 5
4 5 .
8
Graphics 28

8/7/2019 DALLAS COUNTY - Irving ISD - 2010 Pride Survey
http://slidepdf.com/reader/full/dallas-county-irving-isd-2010-pride-survey 29/239
Pride Surveys Report: 2009-10 Irving Independent Schools
Annual Use of Marijuana, Cocaine, Uppers and Downers
Source: Pride Surveys
Marijuana Cocaine Uppers Downers
6th 7th 8th 9th 10th 11th
6 . 0
1 1 . 2
2 0 . 4
2 4 . 7
2 9 . 2
2 6 . 7
3 . 1 3
. 6
5 . 8
7 . 6
1 0 . 3
7 . 9
2 . 4 3
. 1
4 . 9
7 . 1
9 . 9
7 . 4
2 . 6 3
. 1 4 . 4
7 . 4
9 . 6
7 . 9
Graphics 29

8/7/2019 DALLAS COUNTY - Irving ISD - 2010 Pride Survey
http://slidepdf.com/reader/full/dallas-county-irving-isd-2010-pride-survey 30/239
Pride Surveys Report: 2009-10 Irving Independent Schools
Annual Use of Inhalants, Hallucinogens, Heroin and Steroids
Source: Pride Surveys
Inhalants Hallucinogens Heroin Steroids
6th 7th 8th 9th 10th 11th
6 . 9
6 . 6
7 . 4
6 . 4
8 . 2
4 . 7
2 . 2
2 . 1
3 . 2
5 . 2
8 . 2
6 . 1
2 . 6
2 . 4
4 . 0
5
. 1
7 . 4
4 . 5
2 . 7
1 . 8
2 . 5
3 . 1
5 . 2
3 . 4
Graphics 30

8/7/2019 DALLAS COUNTY - Irving ISD - 2010 Pride Survey
http://slidepdf.com/reader/full/dallas-county-irving-isd-2010-pride-survey 31/239
Pride Surveys Report: 2009-10 Irving Independent Schools
Annual Use of Ecstasy and Meth
Source: Pride Surveys
Ecstasy Meth
6th 7th 8th 9th 10th 11th
2 . 0 2
. 3
4 . 9
7 . 4
1 1 . 0
8 . 9
3 . 6
3 . 5
4 . 8 5
. 0
6 . 3
4 . 7
Graphics 31

8/7/2019 DALLAS COUNTY - Irving ISD - 2010 Pride Survey
http://slidepdf.com/reader/full/dallas-county-irving-isd-2010-pride-survey 32/239
Pride Surveys Report: 2009-10 Irving Independent Schools
Annual Use of Prescription Drugs, Pain Killers and Over-The-Counter Drugs
Source: Pride Surveys
Presc Drugs Pain Killers OTC Drugs
6th 7th 8th 9th 10th 11th
4 . 1
4 . 6
6 . 1
8 . 0
1 1 . 1
9 . 5
4 . 1
4 . 6
6 . 1
8 . 0
1 1 . 1
9 . 5
4 . 2
5 . 1
6
. 6
7 . 7
1 0 . 1
8 . 3
Graphics 32

8/7/2019 DALLAS COUNTY - Irving ISD - 2010 Pride Survey
http://slidepdf.com/reader/full/dallas-county-irving-isd-2010-pride-survey 33/239
Pride Surveys Report: 2009-10 Irving Independent Schools
3.1.2 30-Day Use
Graphics 33

8/7/2019 DALLAS COUNTY - Irving ISD - 2010 Pride Survey
http://slidepdf.com/reader/full/dallas-county-irving-isd-2010-pride-survey 34/239
Pride Surveys Report: 2009-10 Irving Independent Schools
30-Day Use of Any Tobacco, Any Alcohol and Any Illicit Drug
Source: Pride Surveys
Any Tobacco Any Alcohol Any Illicit Drug
6th 7th 8th 9th 10th 11th
4
. 3
6 . 6
1 1 . 3
1 3 . 7
1 6 . 5
1 3 . 9
6 . 3
1 1 . 1
2 0 . 1
2 2 . 1
2 7 . 7
2 7 .
8
5 . 6
9 . 7
1 5 .
6
1 9 . 0
2 3 . 4
1 9 . 2
Graphics 34

8/7/2019 DALLAS COUNTY - Irving ISD - 2010 Pride Survey
http://slidepdf.com/reader/full/dallas-county-irving-isd-2010-pride-survey 35/239
Pride Surveys Report: 2009-10 Irving Independent Schools
30-Day Use of Cigarettes, Smokeless Tobacco and Cigars
Source: Pride Surveys
Cigarettes Smokeless Tobacco Cigars
6th 7th 8th 9th 10th 11th
3 . 9
5 . 5
1 0 . 2
1 1 . 7
1 4 . 9
1 2 . 5
2 . 0 2 . 0
3 . 1
4 . 0
5 . 8
4 . 3
2 . 8 3
. 2
6 . 9
8 . 1
9 . 5
6 . 8
Graphics 35

8/7/2019 DALLAS COUNTY - Irving ISD - 2010 Pride Survey
http://slidepdf.com/reader/full/dallas-county-irving-isd-2010-pride-survey 36/239
Pride Surveys Report: 2009-10 Irving Independent Schools
30-Day Use of Beer, Coolers and Liquor
Source: Pride Surveys
Beer Coolers Liquor
6th 7th 8th 9th 10th 11th
4 . 6
8 . 5
1 6 . 2
1 8 . 0
2 2 . 7
2 2 . 3
4 . 3
7 . 2
1
3 . 9
1 5 .
4
1 8 . 7
1 9 . 9
3 . 6
5 . 7
1 2 . 2
1 6 . 2
2 2 . 3
2 1 . 3
Graphics 36

8/7/2019 DALLAS COUNTY - Irving ISD - 2010 Pride Survey
http://slidepdf.com/reader/full/dallas-county-irving-isd-2010-pride-survey 37/239
Pride Surveys Report: 2009-10 Irving Independent Schools
30-Day Use of Marijuana, Cocaine, Uppers and Downers
Source: Pride Surveys
Marijuana Cocaine Uppers Downers
6th 7th 8th 9th 10th 11th
3 . 3
7 . 2
1 3 . 2
1 6 . 8
2 0 . 9
1 6 . 8
1 . 6
1 . 7
3 . 1
4 . 9
7 . 0
4 . 8
1 . 4 1
. 7 2 . 6
4 . 9
6 . 6
5 . 3
1 . 4 1
. 8 2 . 5
5 . 2
6 . 5
5 . 1
Graphics 37

8/7/2019 DALLAS COUNTY - Irving ISD - 2010 Pride Survey
http://slidepdf.com/reader/full/dallas-county-irving-isd-2010-pride-survey 38/239
Pride Surveys Report: 2009-10 Irving Independent Schools
30-Day Use of Inhalants, Hallucinogens, Heroin and Steroids
Source: Pride Surveys
Inhalants Hallucinogens Heroin Steroids
6th 7th 8th 9th 10th 11th
2 . 6
2 . 5
3 . 4
3 . 1
5 . 1
2 . 8
1 . 4
1 . 1
2 . 0
3 . 4
5 . 8
4 . 1
1 . 6
1 . 1
2 . 5
3 . 5
5 . 1
2 . 9
1 . 6
0 . 8
1 . 7
2 . 4
3 . 7
3 . 0
Graphics 38

8/7/2019 DALLAS COUNTY - Irving ISD - 2010 Pride Survey
http://slidepdf.com/reader/full/dallas-county-irving-isd-2010-pride-survey 39/239
Pride Surveys Report: 2009-10 Irving Independent Schools
30-Day Use of Ecstasy and Meth
Source: Pride Surveys
Ecstasy Meth
6th 7th 8th 9th 10th 11th
1 . 5
1 . 2
2 . 5
4 . 4
6 . 8
5 . 3
1 . 8
1 . 2
2 . 4
3 . 2
4 . 4
3 . 0
Graphics 39

8/7/2019 DALLAS COUNTY - Irving ISD - 2010 Pride Survey
http://slidepdf.com/reader/full/dallas-county-irving-isd-2010-pride-survey 40/239
Pride Surveys Report: 2009-10 Irving Independent Schools
30-Day Use of Prescription Drugs, Pain Killers and Over-The-Counter Drugs
Source: Pride Surveys
Presc Drugs Pain Killers OTC Drugs
6th 7th 8th 9th 10th 11th
2 . 3
2 . 3
3 . 3
4 . 8
6 . 9
5 . 6
2 . 0
1 . 9
3 . 2
5 . 4
6 . 7
6 . 2
2 . 2 2
. 4
3 . 5
4 . 6
6 . 3
5 . 2
Graphics 40

8/7/2019 DALLAS COUNTY - Irving ISD - 2010 Pride Survey
http://slidepdf.com/reader/full/dallas-county-irving-isd-2010-pride-survey 41/239
Pride Surveys Report: 2009-10 Irving Independent Schools
3.2 Perception of Risk
Graphics 41

8/7/2019 DALLAS COUNTY - Irving ISD - 2010 Pride Survey
http://slidepdf.com/reader/full/dallas-county-irving-isd-2010-pride-survey 42/239
Pride Surveys Report: 2009-10 Irving Independent Schools
Perception of Risk -- Any Tobacco
Source: Pride Surveys
No Harm Some Harm Harmful Very Harmful
6 7 8 9 10 11
1 6 . 8
1 3 . 0
1 1 . 5 1
3 . 0
1 2 . 9
9 . 9
5 . 8
8 . 2 9
. 7
8 . 4
8 . 3
7 . 1
1 8 . 7
1 9 . 8
2 3 . 6
2 1 . 0
2 0 . 8 2
3 . 2
5 8 . 8
5 9 . 1
5 5 .
3 5 7 .
6 5 8 . 0 5
9 . 9
Graphics 42

8/7/2019 DALLAS COUNTY - Irving ISD - 2010 Pride Survey
http://slidepdf.com/reader/full/dallas-county-irving-isd-2010-pride-survey 43/239
Pride Surveys Report: 2009-10 Irving Independent Schools
Perception of Risk -- Regular Alcohol Use
Source: Pride Surveys
No Risk Slight Risk Moderate Risk Great Risk
6 7 8 9 10 11
7 . 8
8 . 1
7
. 1 9 . 0 1
0 . 1
7
. 2
1 6 . 5
1 6 . 9 1
8 . 2
1 5 .
1 1 7 .
0
1 5 .
4
2 6 . 9
3 0 . 6
3 4 . 4
3 3 . 1
3 3 . 9
3 2 . 8
4 8 . 8
4 4 . 4
4 0 . 3
4 2 . 8
3 9 . 0
4 4 . 6
Graphics 43

8/7/2019 DALLAS COUNTY - Irving ISD - 2010 Pride Survey
http://slidepdf.com/reader/full/dallas-county-irving-isd-2010-pride-survey 44/239
Pride Surveys Report: 2009-10 Irving Independent Schools
Perception of Risk -- Cigarettes
Source: Pride Surveys
No Harm Some Harm Harmful Very Harmful
6 7 8 9 10 11
1 8 . 2
1 5 .
0
1 3 . 4 1
4 . 8
1 5 .
0
1 1 . 3
1 0 . 0
1 2 . 6
1 5 .
2
1 3 . 1
1 2 . 7
1 0 . 7
2 2 . 5
2 2 . 4
2 6 . 4
2 2 . 8
2 1 . 6
2 4 . 9
4 9 . 4
5 0 . 1
4 5 .
0
4 9 . 4 5
0 . 7 5
3 . 1
Graphics 44

8/7/2019 DALLAS COUNTY - Irving ISD - 2010 Pride Survey
http://slidepdf.com/reader/full/dallas-county-irving-isd-2010-pride-survey 45/239
Pride Surveys Report: 2009-10 Irving Independent Schools
Perception of Risk -- Smokeless Tobacco
Source: Pride Surveys
No Harm Some Harm Harmful Very Harmful
6 7 8 9 10 11
2 0 . 0
1 6 . 4
1 4 . 2
1 5 .
3
1 5 .
2
1 2 . 0
1 0 . 6 1
2 . 1
1 3 . 1
1 1 . 3
1 1 . 8
1 0 . 5
2 0 . 2
2 0 . 8
2 4 . 7
2 2 . 4
2 3 . 2 2
5 . 4
4 9 . 2 5
0 . 8
4 7 .
9 5 0 . 9
4 9 . 8 5
2 . 1
Graphics 45

8/7/2019 DALLAS COUNTY - Irving ISD - 2010 Pride Survey
http://slidepdf.com/reader/full/dallas-county-irving-isd-2010-pride-survey 46/239
Pride Surveys Report: 2009-10 Irving Independent Schools
Perception of Risk -- Cigars
Source: Pride Surveys
No Harm Some Harm Harmful Very Harmful
6 7 8 9 10 11
1 8 . 1
1 5 .
8
1 4 . 5 1
6 . 0
1 5 .
4
1 1 . 7
1 1 . 2
1 4 . 3
1 7 .
8
1 4 . 5
1 4 . 0
1 3 . 3
2 2 . 2
2 2 . 0
2 5 .
1
2 3 . 1 2 4
. 8 2 6 . 2
4 8 . 6
4 7 .
9
4 2 . 7
4 6 . 4
4 5 .
9 4 8 . 9
Graphics 46

8/7/2019 DALLAS COUNTY - Irving ISD - 2010 Pride Survey
http://slidepdf.com/reader/full/dallas-county-irving-isd-2010-pride-survey 47/239
Pride Surveys Report: 2009-10 Irving Independent Schools
Perception of Risk -- Beer
Source: Pride Surveys
No Harm Some Harm Harmful Very Harmful
6 7 8 9 10 11
2 1 . 8
2 1
. 1
2 0 . 0
1 8 . 3
2
0 . 9
1 3 . 5
2 2 . 9
2 7 .
1
3 4 . 1
3 0 . 5
3 1 . 2
3 4 . 7
2 0 . 3
2 0 . 0
1 9 . 2
2 1 . 9
2 1 . 8
2 3 . 9
3 5 . 1
3 1 . 8
2 6 . 7
2 9 . 3
2 6 . 0
2 7 .
8
Graphics 47

8/7/2019 DALLAS COUNTY - Irving ISD - 2010 Pride Survey
http://slidepdf.com/reader/full/dallas-county-irving-isd-2010-pride-survey 48/239
Pride Surveys Report: 2009-10 Irving Independent Schools
Perception of Risk -- Coolers, Breezers, etc.
Source: Pride Surveys
No Harm Some Harm Harmful Very Harmful
6 7 8 9 10 11
2 2
. 9
2 1 . 7 2 2
. 7
2 2 . 6
2 4 . 9
2 1 . 2
1 7 . 7
2 5 .
2
3 0 . 1
3 0 . 0 3
1 . 3
3 1 . 3
2 0 . 3
1 8 . 4
1 8 . 2
1 8 . 4 1
9 . 8
2 2 . 3
3 9 . 2
3 4 . 6
2 9 . 1
2 9 . 1
2 4 . 0 2
5 . 1
Graphics 48

8/7/2019 DALLAS COUNTY - Irving ISD - 2010 Pride Survey
http://slidepdf.com/reader/full/dallas-county-irving-isd-2010-pride-survey 49/239
Pride Surveys Report: 2009-10 Irving Independent Schools
Perception of Risk -- Liquor
Source: Pride Surveys
No Harm Some Harm Harmful Very Harmful
6 7 8 9 10 11
2 0 . 1
1 7 .
4 1 7 . 7
1 6 . 9 1
8 . 6
1 2 . 3
1 2 . 7
1 9 . 4
2 5 . 4
2 4 . 1 2 5 .
8 2 6
. 2
2 2 . 3 2
3 . 5
2 3 . 9
2 3 . 0
2 3 . 6
2 8 . 4
4 5 . 0
3 9 . 8
3 3 . 1
3 5 .
9
3 1 . 9 3
3 . 0
Graphics 49

8/7/2019 DALLAS COUNTY - Irving ISD - 2010 Pride Survey
http://slidepdf.com/reader/full/dallas-county-irving-isd-2010-pride-survey 50/239
Pride Surveys Report: 2009-10 Irving Independent Schools
Perception of Risk -- Marijuana
Source: Pride Surveys
No Harm Some Harm Harmful Very Harmful
6 7 8 9 10 11
1 8 . 7
1 6 . 7 1
8 . 7
2 2 . 1
2 7 .
0
2 2 . 5
3 . 5
6 . 7
1 1 . 2
1 4 . 8
1 5 .
2 1 6 . 7
9 . 6 1
1 . 2
1 4 . 8
1 5 .
2 1 6 . 0
1 7 .
0
6 8 . 2
6 5 . 5
5 5 .
4
4 7 .
9
4 1 . 9 4
3 . 9
Graphics 50

8/7/2019 DALLAS COUNTY - Irving ISD - 2010 Pride Survey
http://slidepdf.com/reader/full/dallas-county-irving-isd-2010-pride-survey 51/239
Pride Surveys Report: 2009-10 Irving Independent Schools
3.3 Perception of Parental Disapproval
Graphics 51

8/7/2019 DALLAS COUNTY - Irving ISD - 2010 Pride Survey
http://slidepdf.com/reader/full/dallas-county-irving-isd-2010-pride-survey 52/239
Pride Surveys Report: 2009-10 Irving Independent Schools
Perception of Parental Disapproval -- Use Tobacco
Source: Pride Surveys
Not Wrong At All A Little Bit Wrong Wrong Very Wrong
6 7 8 9 10 11
7 . 1
3 . 9 5
. 0 6 . 8 9
. 0
6 . 8
2 . 1
2 . 7
3 . 2 5
. 4 5 . 7
5 . 8
6 . 0 8
. 8 1 0 . 8 1
3 . 7
1
2 . 9 1
5 . 0
8 4 . 8
8 4 . 6
8 1 . 2
7 4 . 1
7 2 . 3
7 2 . 4
Graphics 52

8/7/2019 DALLAS COUNTY - Irving ISD - 2010 Pride Survey
http://slidepdf.com/reader/full/dallas-county-irving-isd-2010-pride-survey 53/239

8/7/2019 DALLAS COUNTY - Irving ISD - 2010 Pride Survey
http://slidepdf.com/reader/full/dallas-county-irving-isd-2010-pride-survey 54/239

8/7/2019 DALLAS COUNTY - Irving ISD - 2010 Pride Survey
http://slidepdf.com/reader/full/dallas-county-irving-isd-2010-pride-survey 55/239
Pride Surveys Report: 2009-10 Irving Independent Schools
3.4 Perception of Friends’ Disapproval
Graphics 55

8/7/2019 DALLAS COUNTY - Irving ISD - 2010 Pride Survey
http://slidepdf.com/reader/full/dallas-county-irving-isd-2010-pride-survey 56/239
Pride Surveys Report: 2009-10 Irving Independent Schools
Perception of Friends' Disapproval -- Use Tobacco
Source: Pride Surveys
Not Wrong At All A Little Bit Wrong Wrong Very Wrong
6 7 8 9 10 11
1 1 . 0 1
3 . 6
1 7 . 7 1
9 . 6
2 5 .
0
2 2 . 2
1 1 . 2
1 7 .
0 1 9 . 9 2
1 . 6
2 1 . 0
2 3 . 8
1 9 . 8
2 2 . 9 2
4 . 4
2 4 . 2
2 5 .
0
2 3 . 4
5 8 . 0
4 6 . 5
3 8 . 0
3 4
. 7
2 9 . 0 3
0 . 5
Graphics 56
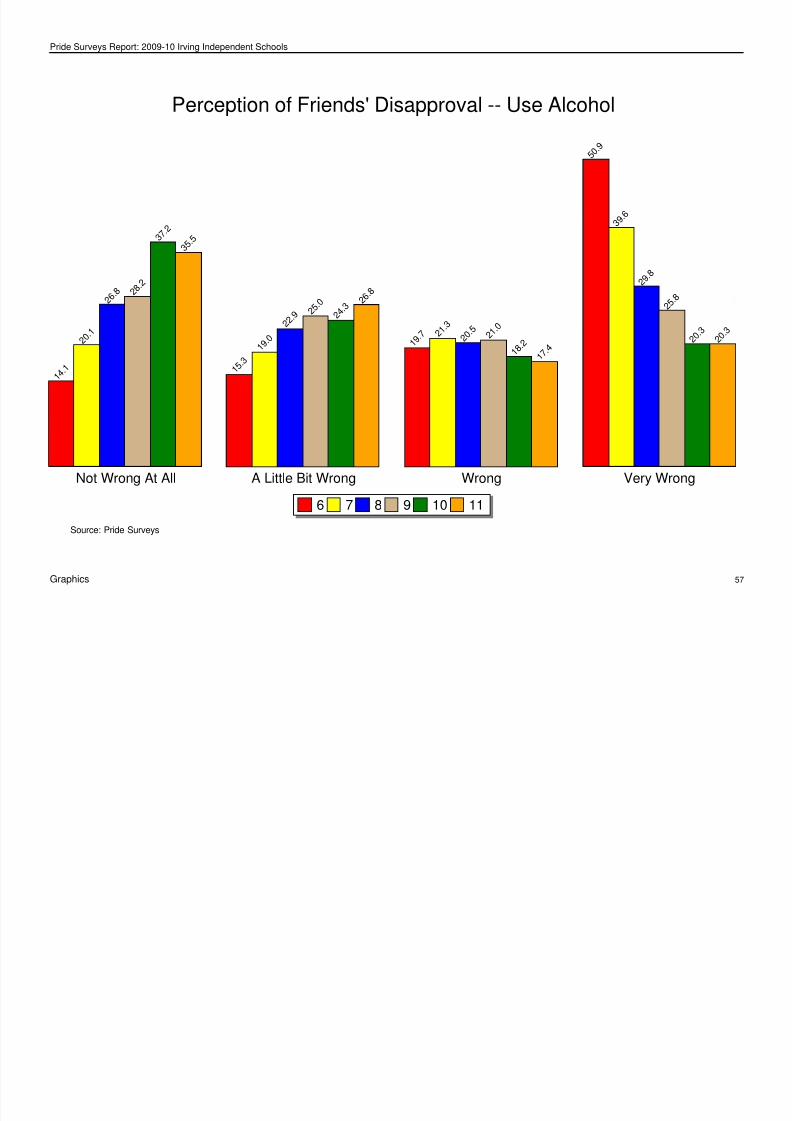
8/7/2019 DALLAS COUNTY - Irving ISD - 2010 Pride Survey
http://slidepdf.com/reader/full/dallas-county-irving-isd-2010-pride-survey 57/239
Pride Surveys Report: 2009-10 Irving Independent Schools
Perception of Friends' Disapproval -- Use Alcohol
Source: Pride Surveys
Not Wrong At All A Little Bit Wrong Wrong Very Wrong
6 7 8 9 10 11
1 4 . 1
2 0 . 1
2 6 . 8 2
8 . 2
3 7 .
2
3 5 . 5
1 5 .
3
1 9 . 0
2 2 . 9 2
5 . 0
2 4 . 3
2 6 . 8
1 9 . 7 2
1 . 3
2 0 . 5
2 1 . 0
1 8 . 2
1 7 .
4
5 0 . 9
3 9 . 6
2 9 . 8
2 5 .
8
2 0 . 3
2 0 . 3
Graphics 57

8/7/2019 DALLAS COUNTY - Irving ISD - 2010 Pride Survey
http://slidepdf.com/reader/full/dallas-county-irving-isd-2010-pride-survey 58/239
Pride Surveys Report: 2009-10 Irving Independent Schools
Perception of Friends' Disapproval -- Use Marijuana
Source: Pride Surveys
Not Wrong At All A Little Bit Wrong Wrong Very Wrong
6 7 8 9 10 11
1 0 . 9
1 4 . 8
2 0 . 4 2
3 . 3
2 9 . 1
2 7 . 5
7 . 8
1 1 . 4
1 5 .
3 1 8 . 5
1 7 .
8 1 9 . 7
1 6 . 2 1
8 . 4
1 9 . 1
1 9 . 7
2 0 . 3
1 8 . 7
6 5 . 1
5 5 . 5
4 5 .
2
3 8 . 6
3 2 . 8 3
4 . 2
Graphics 58

8/7/2019 DALLAS COUNTY - Irving ISD - 2010 Pride Survey
http://slidepdf.com/reader/full/dallas-county-irving-isd-2010-pride-survey 59/239
Pride Surveys Report: 2009-10 Irving Independent Schools
3.5 Average Age of Onset of Use
Graphics 59
P id S R I i I d d S h l

8/7/2019 DALLAS COUNTY - Irving ISD - 2010 Pride Survey
http://slidepdf.com/reader/full/dallas-county-irving-isd-2010-pride-survey 60/239
Pride Surveys Report: 2009-10 Irving Independent Schools
Average Age of Onset of Use of Any Tobacco
Source: Pride Surveys
6 7 8 9 10 11
Average Age of Onset of Use
1 0 . 8 1
1 . 3 1
1 . 8 1
2 . 3 1
2 . 8
1 3 . 5
Graphics 60
P id S R t 2009 10 I i I d d t S h l

8/7/2019 DALLAS COUNTY - Irving ISD - 2010 Pride Survey
http://slidepdf.com/reader/full/dallas-county-irving-isd-2010-pride-survey 61/239
Pride Surveys Report: 2009-10 Irving Independent Schools
Average Age of Onset of Use of Any Alcohol
Source: Pride Surveys
6 7 8 9 10 11
Average Age of Onset of Use
1 0 . 7 1
1 . 1 1
1 . 8
1 2 . 4 1
2 . 9
1 3 . 6
Graphics 61

8/7/2019 DALLAS COUNTY - Irving ISD - 2010 Pride Survey
http://slidepdf.com/reader/full/dallas-county-irving-isd-2010-pride-survey 62/239
Pride Surveys Report: 2009 10 Irving Independent Schools

8/7/2019 DALLAS COUNTY - Irving ISD - 2010 Pride Survey
http://slidepdf.com/reader/full/dallas-county-irving-isd-2010-pride-survey 63/239
Pride Surveys Report: 2009-10 Irving Independent Schools
Average Age of Onset of Use of Cigarettes
Source: Pride Surveys
6 7 8 9 10 11
Average Age of Onset of Use
1 0 . 9 1
1 . 3 1
1 . 8 1
2 . 4 1
2 . 8
1 3 . 6
Graphics 63

8/7/2019 DALLAS COUNTY - Irving ISD - 2010 Pride Survey
http://slidepdf.com/reader/full/dallas-county-irving-isd-2010-pride-survey 64/239
Pride Surveys Report: 2009-10 Irving Independent Schools

8/7/2019 DALLAS COUNTY - Irving ISD - 2010 Pride Survey
http://slidepdf.com/reader/full/dallas-county-irving-isd-2010-pride-survey 65/239
Pride Surveys Report: 2009-10 Irving Independent Schools
Average Age of Onset of Use of Cigars
Source: Pride Surveys
6 7 8 9 10 11
Average Age of Onset of Use
1 1 . 1 1
1 . 5 1
1 . 9
1 2 . 6 1
3 . 0
1 3 . 8
Graphics 65
Pride Surveys Report: 2009-10 Irving Independent Schools

8/7/2019 DALLAS COUNTY - Irving ISD - 2010 Pride Survey
http://slidepdf.com/reader/full/dallas-county-irving-isd-2010-pride-survey 66/239
Pride Surveys Report: 2009 10 Irving Independent Schools
Average Age of Onset of Use of Beer
Source: Pride Surveys
6 7 8 9 10 11
Average Age of Onset of Use
1 0 . 7 1
1 . 1 1
1 . 8
1 2 . 4 1
3 . 0
1 3 . 7
Graphics 66

8/7/2019 DALLAS COUNTY - Irving ISD - 2010 Pride Survey
http://slidepdf.com/reader/full/dallas-county-irving-isd-2010-pride-survey 67/239

8/7/2019 DALLAS COUNTY - Irving ISD - 2010 Pride Survey
http://slidepdf.com/reader/full/dallas-county-irving-isd-2010-pride-survey 68/239
Pride Surveys Report: 2009-10 Irving Independent Schools

8/7/2019 DALLAS COUNTY - Irving ISD - 2010 Pride Survey
http://slidepdf.com/reader/full/dallas-county-irving-isd-2010-pride-survey 69/239
de Su eys epo t 009 0 g depe de t Sc oo s
Average Age of Onset of Use of Marijuana
Source: Pride Surveys
6 7 8 9 10 11
Average Age of Onset of Use
1 1 . 1 1 1
. 6 1 2 . 3 1
2 . 8 1
3 . 4
1 4 . 2
Graphics 69
Pride Surveys Report: 2009-10 Irving Independent Schools

8/7/2019 DALLAS COUNTY - Irving ISD - 2010 Pride Survey
http://slidepdf.com/reader/full/dallas-county-irving-isd-2010-pride-survey 70/239
y p g p
Average Age of Onset of Use of Cocaine
Source: Pride Surveys
6 7 8 9 10 11
Average Age of Onset of Use
1 1 . 4 1
1 . 9 1
2 . 5 1
3 . 1
1 3 . 0
1 4 . 1
Graphics 70
Pride Surveys Report: 2009-10 Irving Independent Schools

8/7/2019 DALLAS COUNTY - Irving ISD - 2010 Pride Survey
http://slidepdf.com/reader/full/dallas-county-irving-isd-2010-pride-survey 71/239
y p g p
Average Age of Onset of Use of Meth
Source: Pride Surveys
6 7 8 9 10 11
Average Age of Onset of Use
1 1 . 3 1
1 . 7
1 2 . 4 1 2 . 8
1 2 . 4 1 2
. 9
Graphics 71
Pride Surveys Report: 2009-10 Irving Independent Schools

8/7/2019 DALLAS COUNTY - Irving ISD - 2010 Pride Survey
http://slidepdf.com/reader/full/dallas-county-irving-isd-2010-pride-survey 72/239
Average Age of Onset of Use of Prescription Drugs
Source: Pride Surveys
6 7 8 9 10 11
Average Age of Onset of Use
1 1 . 3 1
2 . 0 1
2 . 4
1 3 . 3
1 2 . 9
1 3 . 9
Graphics 72
Pride Surveys Report: 2009-10 Irving Independent Schools

8/7/2019 DALLAS COUNTY - Irving ISD - 2010 Pride Survey
http://slidepdf.com/reader/full/dallas-county-irving-isd-2010-pride-survey 73/239
Average Age of Onset of Use of Pain Killers
Source: Pride Surveys
6 7 8 9 10 11
Average Age of Onset of Use
1 1 . 4 1
1 . 7
1 2 . 5
1 3 . 2
1 3 . 1 1
3 . 9
Graphics 73
Pride Surveys Report: 2009-10 Irving Independent Schools

8/7/2019 DALLAS COUNTY - Irving ISD - 2010 Pride Survey
http://slidepdf.com/reader/full/dallas-county-irving-isd-2010-pride-survey 74/239
Average Age of Onset of Use of Over-the-Counter Drugs
Source: Pride Surveys
6 7 8 9 10 11
Average Age of Onset of Use
1 1 . 4
1 1 . 7
1 2 . 4
1 3 . 1
1 2 . 9
1 3 . 8
Graphics 74
Pride Surveys Report: 2009-10 Irving Independent Schools

8/7/2019 DALLAS COUNTY - Irving ISD - 2010 Pride Survey
http://slidepdf.com/reader/full/dallas-county-irving-isd-2010-pride-survey 75/239
3.6 Student Information
Graphics 75
Pride Surveys Report: 2009-10 Irving Independent Schools

8/7/2019 DALLAS COUNTY - Irving ISD - 2010 Pride Survey
http://slidepdf.com/reader/full/dallas-county-irving-isd-2010-pride-survey 76/239
Attend Church or Synagogue
Source: Pride Surveys
Never Seldom Sometimes Often A Lot
6 7 8 9 10 11
1 5 .
6
1 3 . 8
1 6 . 8
1 8 . 5
2 1 . 4
1 9 . 7
1 0 . 5
1 3 . 8
1 5 .
9 1 6 . 9
1 6 . 1
1 8 . 0
2 4 . 7
2 4 . 0
2 3 . 7 2
4 . 6
2 2 . 9 2
3 . 7
1 9 . 4
1 9 . 6
1 8 . 7
1 7 .
9
1 7 .
2
1 4 . 7
2 9 . 8
2 8 . 8
2 4 . 9
2 2 . 2
2 2 . 3
2 3 . 8
Graphics 76
Pride Surveys Report: 2009-10 Irving Independent Schools

8/7/2019 DALLAS COUNTY - Irving ISD - 2010 Pride Survey
http://slidepdf.com/reader/full/dallas-county-irving-isd-2010-pride-survey 77/239
Take Part in Community Activities
Source: Pride Surveys
Never Seldom Sometimes Often A Lot
6 7 8 9 10 11
6 2 . 7
6 0 . 4
5 8 . 6
5 4 . 5
5 3 . 8
5 0 . 7
8 . 4
1 1 . 8 1
3 . 7 1
5 . 3
1 4 . 2
1 5 .
2
1 0 . 1
1 1 . 1
1 2 . 1
1 2 . 5 1
4 . 1
1 4 . 9
6 . 7 6 . 7 7 . 2
7 . 9
8 . 7
8 . 6
1 2 . 2
1 0 . 0
8 . 4 9
. 8
9 . 3 1
0 . 6
Graphics 77

8/7/2019 DALLAS COUNTY - Irving ISD - 2010 Pride Survey
http://slidepdf.com/reader/full/dallas-county-irving-isd-2010-pride-survey 78/239

8/7/2019 DALLAS COUNTY - Irving ISD - 2010 Pride Survey
http://slidepdf.com/reader/full/dallas-county-irving-isd-2010-pride-survey 79/239
Pride Surveys Report: 2009-10 Irving Independent Schools

8/7/2019 DALLAS COUNTY - Irving ISD - 2010 Pride Survey
http://slidepdf.com/reader/full/dallas-county-irving-isd-2010-pride-survey 80/239
Take Part in School Activities
Source: Pride Surveys
Never Seldom Sometimes Often A Lot
6 7 8 9 10 11
2 8 . 4
3 3 . 6
4 2 . 2
4 6 . 2
4 5 . 9
4 6 . 2
6 . 7
1 0 . 3
1 5 .
1 1 7 .
1
1 4 . 5
1 2 . 2
1 2 . 4 1
4 . 5
1 2 . 6
1 5 .
2
1 4 . 6
1 5 .
4
1 4 . 6
1 3 . 5
1 2 . 1
8 . 1
1 0 . 6
9 . 5
3 8 . 0
2 8 . 1
1 8 . 0
1 3 . 5
1 4 . 4
1 6 . 8
Graphics 80

8/7/2019 DALLAS COUNTY - Irving ISD - 2010 Pride Survey
http://slidepdf.com/reader/full/dallas-county-irving-isd-2010-pride-survey 81/239

8/7/2019 DALLAS COUNTY - Irving ISD - 2010 Pride Survey
http://slidepdf.com/reader/full/dallas-county-irving-isd-2010-pride-survey 82/239
Pride Surveys Report: 2009-10 Irving Independent Schools

8/7/2019 DALLAS COUNTY - Irving ISD - 2010 Pride Survey
http://slidepdf.com/reader/full/dallas-county-irving-isd-2010-pride-survey 83/239
Parents Talk About the Dangers of Drugs
Source: Pride Surveys
Never Seldom Sometimes Often A Lot
6 7 8 9 10 11
1 6
. 9
1 4 . 9 1
6 . 5
1 8 . 0
2 1 . 6
1 9 . 6
1 0 . 7
1 4 . 9
1 8 . 1 1 9
. 1 1 9 . 9
1 8 . 9
2 5 . 7
2 5 . 5
2 8 . 7
2 7 .
6
2 6 . 4
2 6 . 9
2 0 . 1
1 9 . 4
1 7 .
3 1 8 . 0
1 6
. 4 1 8 . 1
2 6 . 5
2 5 .
3
1 9 . 3
1 7 .
2
1 5 . 7 1
6 . 5
Graphics 83

8/7/2019 DALLAS COUNTY - Irving ISD - 2010 Pride Survey
http://slidepdf.com/reader/full/dallas-county-irving-isd-2010-pride-survey 84/239
Pride Surveys Report: 2009-10 Irving Independent Schools

8/7/2019 DALLAS COUNTY - Irving ISD - 2010 Pride Survey
http://slidepdf.com/reader/full/dallas-county-irving-isd-2010-pride-survey 85/239
Parents Punish for Breaking Rules
Source: Pride Surveys
Never Seldom Sometimes Often A Lot
6 7 8 9 10 11
8 . 8
8 . 5
1 0 . 9 1
2 . 3
1 4 . 5
1 1 . 4 1
2 . 6
1 5 .
0 1 6 . 7
1 8 . 3
1 5 .
9 1 7 . 5
3 2 . 8
3 1 . 3
3 1 . 4
2 9 . 5
2 9 . 1
3 0 . 8
2 1 . 7
2 3 . 9
2 1 . 3
2 3 . 6
2 3 . 3
2 3 . 5
2 4 . 1
2 1 . 3
1 9 . 7
1 6 . 2 1
7 . 3
1 6 . 8
Graphics 85
Pride Surveys Report: 2009-10 Irving Independent Schools
8/7/2019 DALLAS COUNTY - Irving ISD - 2010 Pride Survey
http://slidepdf.com/reader/full/dallas-county-irving-isd-2010-pride-survey 86/239
3.7 Availability
Graphics 86
Pride Surveys Report: 2009-10 Irving Independent Schools

8/7/2019 DALLAS COUNTY - Irving ISD - 2010 Pride Survey
http://slidepdf.com/reader/full/dallas-county-irving-isd-2010-pride-survey 87/239
Availability -- Any Tobacco
Source: Pride Surveys
Don't Know Very Difficult to Get Fairly Difficult to Get Fairly Easy to Get Very Easy to Get
6 7 8 9 10 11
7 4 . 1
6 2 . 2
5 2 . 1
4 9 . 3
4 2 . 3
3 7 . 7
3 . 9
4 . 0
2 . 7
1 . 6
1 . 9
1 . 5
4 . 2 6
. 7 6 . 2
6 . 0
5 . 3
5 . 5 6
. 4
1 1 . 4
1 5 . 5
1 6 . 2 1
7 . 9
1 8 . 6
1 1 . 5
1 5 .
6
2 3 . 6 2
7 . 0
3 2 . 6
3 6 . 6
Graphics 87
Pride Surveys Report: 2009-10 Irving Independent Schools
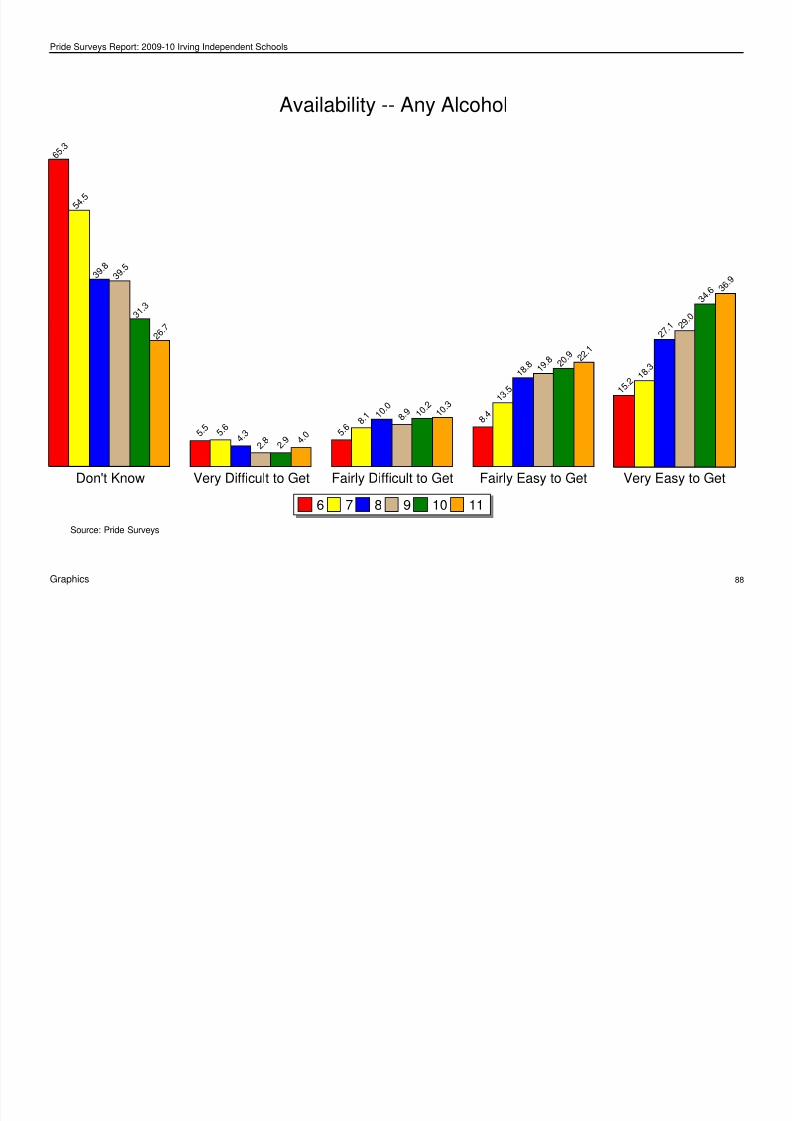
8/7/2019 DALLAS COUNTY - Irving ISD - 2010 Pride Survey
http://slidepdf.com/reader/full/dallas-county-irving-isd-2010-pride-survey 88/239
Availability -- Any Alcohol
Source: Pride Surveys
Don't Know Very Difficult to Get Fairly Difficult to Get Fairly Easy to Get Very Easy to Get
6 7 8 9 10 11
6 5 . 3
5 4 . 5
3 9 . 8
3 9 . 5
3 1 . 3
2 6 . 7
5 . 5
5 . 6
4 . 3
2 . 8
2 . 9 4
. 0 5 . 6 8
. 1 1 0 . 0
8 . 9 1
0 . 2
1 0 . 3
8 . 4
1 3 . 5
1 8 . 8
1 9 . 8
2 0 . 9
2 2 . 1
1 5 .
2 1 8 . 3
2 7 .
1 2 9 . 0
3 4 . 6 3 6
. 9
Graphics 88
Pride Surveys Report: 2009-10 Irving Independent Schools

8/7/2019 DALLAS COUNTY - Irving ISD - 2010 Pride Survey
http://slidepdf.com/reader/full/dallas-county-irving-isd-2010-pride-survey 89/239
Availability -- Marijuana
Source: Pride Surveys
Don't Know Very Difficult to Get Fairly Difficult to Get Fairly Easy to Get Very Easy to Get
6 7 8 9 10 11
7 8 . 9
6 8 . 4
5 4 . 4
4 8 . 8
4 1 . 9
3 8 . 0
6 . 0
5 . 4
4 . 1
2 . 4
2 . 0
2 . 0 3
. 9 5 . 6
6 . 4
5 . 7
4 . 5 6
. 0
3 . 8
7 . 4
1 1 . 8
1 3 . 2
1 4 . 4
1 4 . 8
7 . 5
1 3 . 2
2 3 . 3
3 0 . 0
3 7 .
2 3 9 . 1
Graphics 89
Pride Surveys Report: 2009-10 Irving Independent Schools

8/7/2019 DALLAS COUNTY - Irving ISD - 2010 Pride Survey
http://slidepdf.com/reader/full/dallas-county-irving-isd-2010-pride-survey 90/239
3.8 Where Do You Use
Graphics 90
Pride Surveys Report: 2009-10 Irving Independent Schools

8/7/2019 DALLAS COUNTY - Irving ISD - 2010 Pride Survey
http://slidepdf.com/reader/full/dallas-county-irving-isd-2010-pride-survey 91/239
Where Do You Use Any Tobacco
Source: Pride Surveys
At Home At School In a Car Friend's House Other
6 7 8 9 10 11 6 7 8 9 10 11 6 7 8 9 10 11 6 7 8 9 10 11 6 7 8 9 10 11
3 . 3
4 . 8
7 . 0
8 . 4
1 0 . 3
8 . 2
1 . 4
1 . 0
1 . 7
3 . 6
5 . 5
4 . 0
1 . 0 1 . 4
3 . 6
5 . 0
7
. 7
7 . 3
3 . 8
8 . 4
1 2 . 4
1 1 . 1
1 3 . 2
1 2 . 2
5 . 1
9 . 7
1 3 . 0
1 0 . 5
1 1 . 9
1 1 . 9
Graphics 91
Pride Surveys Report: 2009-10 Irving Independent Schools

8/7/2019 DALLAS COUNTY - Irving ISD - 2010 Pride Survey
http://slidepdf.com/reader/full/dallas-county-irving-isd-2010-pride-survey 92/239
Where Do You Use Any Alcohol
Source: Pride Surveys
At Home At School In a Car Friend's House Other
6 7 8 9 10 11 6 7 8 9 10 11 6 7 8 9 10 11 6 7 8 9 10 11 6 7 8 9 10 11
1 2 . 0
1 6 . 8
2 2 . 2
2 0 . 1
2 3 . 7
2 2 . 4
1 . 6
0 . 7
2 . 0 2
. 6
4 . 9
3
. 3
1 . 5 2
. 4
4 . 0 4
. 6
7 . 5
4 . 4
5 . 4
1 2 . 0
2 0 . 4
1 9 . 6
2 6 . 9 2 7
. 4
8 . 9
1 4 . 8
2 0 . 9
1 8 . 6 1
9 . 9
2 2 . 1
Graphics 92
Pride Surveys Report: 2009-10 Irving Independent Schools

8/7/2019 DALLAS COUNTY - Irving ISD - 2010 Pride Survey
http://slidepdf.com/reader/full/dallas-county-irving-isd-2010-pride-survey 93/239
Where Do You Use Cigarettes
Source: Pride Surveys
At Home At School In a Car Friend's House Other
6 7 8 9 10 11 6 7 8 9 10 11 6 7 8 9 10 11 6 7 8 9 10 11 6 7 8 9 10 11
2 . 0
3 . 4
5 . 9 6
. 2
7 . 9
6 . 9
1 . 2
0 . 7
1
. 3
2 . 4
3 . 9
3 . 1
0 . 7 0
. 9
2 . 8
4 . 3
5 . 5
6 . 2
3 . 2
7 . 1
1 0 . 6
8 . 8
1 0 . 5
1 0 . 2
4 . 5
8 . 1
1 1 . 2
9 . 0
1 0 . 1
9 . 7
Graphics 93
Pride Surveys Report: 2009-10 Irving Independent Schools

8/7/2019 DALLAS COUNTY - Irving ISD - 2010 Pride Survey
http://slidepdf.com/reader/full/dallas-county-irving-isd-2010-pride-survey 94/239
Where Do You Use Smokeless Tobacco
Source: Pride Surveys
At Home At School In a Car Friend's House Other
6 7 8 9 10 11 6 7 8 9 10 11 6 7 8 9 10 11 6 7 8 9 10 11 6 7 8 9 10 11
1 . 1
0 . 9 1
. 0
1 . 5
3 . 2
2 . 4
1 . 0
0
. 6 0 . 8
1 . 1
3 . 0
1 . 8
0 . 5 0 . 7
0 . 7
1 . 0
2 . 5
1 . 5
1 . 2
2 . 0
2 . 4
1 . 9
3 . 7
1 . 9
1 . 5
2 . 5
2 . 5
3 . 1
2 . 9
2 . 6
Graphics 94
Pride Surveys Report: 2009-10 Irving Independent Schools

8/7/2019 DALLAS COUNTY - Irving ISD - 2010 Pride Survey
http://slidepdf.com/reader/full/dallas-county-irving-isd-2010-pride-survey 95/239
Where Do You Use Cigars
Source: Pride Surveys
At Home At School In a Car Friend's House Other
6 7 8 9 10 11 6 7 8 9 10 11 6 7 8 9 10 11 6 7 8 9 10 11 6 7 8 9 10 11
1 . 8
2 . 4
3 . 6
4 . 2
5 . 2
3 . 2
0 . 9
0 . 4
0 . 9
2 . 1
2 . 9
1 . 9
0 . 6 0
. 8
1 . 8
2 . 3
3 . 8
3 . 1
2 . 1
4 . 0
6 . 5
5 . 9
6 . 6
6 . 0
2 . 7
4 . 6
6 . 8
5 . 7
6 . 1
5 . 7
Graphics 95

8/7/2019 DALLAS COUNTY - Irving ISD - 2010 Pride Survey
http://slidepdf.com/reader/full/dallas-county-irving-isd-2010-pride-survey 96/239
Pride Surveys Report: 2009-10 Irving Independent Schools

8/7/2019 DALLAS COUNTY - Irving ISD - 2010 Pride Survey
http://slidepdf.com/reader/full/dallas-county-irving-isd-2010-pride-survey 97/239
Where Do You Use Coolers, Breezers, etc.
Source: Pride Surveys
At Home At School In a Car Friend's House Other
6 7 8 9 10 11 6 7 8 9 10 11 6 7 8 9 10 11 6 7 8 9 10 11 6 7 8 9 10 11
5 . 0
8 . 7
1 2 . 9
1 3 . 2
1 6 . 2
1 5 . 7
0 . 9
0 . 4
1 . 2 1
. 4
3 . 2
2 . 1
0 . 8
0 . 9
2 . 4
2 . 5
4 . 4
2 . 6
3 . 3
7 . 2
1 2 . 5
1 2 . 4
1 8
. 8
1 8 . 7
4 . 3
8 . 4
1 2 . 7
1 1 . 6
1 3 . 5
1 4 . 6
Graphics 97

8/7/2019 DALLAS COUNTY - Irving ISD - 2010 Pride Survey
http://slidepdf.com/reader/full/dallas-county-irving-isd-2010-pride-survey 98/239
Pride Surveys Report: 2009-10 Irving Independent Schools

8/7/2019 DALLAS COUNTY - Irving ISD - 2010 Pride Survey
http://slidepdf.com/reader/full/dallas-county-irving-isd-2010-pride-survey 99/239
Where Do You Use Marijuana
Source: Pride Surveys
At Home At School In a Car Friend's House Other
6 7 8 9 10 11 6 7 8 9 10 11 6 7 8 9 10 11 6 7 8 9 10 11 6 7 8 9 10 11
0 . 9
1 . 9
4 . 5
6 . 3
7 . 9
6 . 9
1 . 1
0 . 7
2 . 0
3 . 7
5 . 3
3 . 9
0 . 6
1 . 3
3 . 8
6 . 0
8 . 3 8 . 5
2 . 4
6 . 2
1 1 . 6
1 3 . 2
1 5 . 1 1
5 . 5
3 . 5
5 . 3
1 1 . 1 1
1 . 6
1 3 . 5
1 2 . 0
Graphics 99
Pride Surveys Report: 2009-10 Irving Independent Schools
3 9 When Do You Use

8/7/2019 DALLAS COUNTY - Irving ISD - 2010 Pride Survey
http://slidepdf.com/reader/full/dallas-county-irving-isd-2010-pride-survey 100/239
3.9 When Do You Use
Graphics 100

8/7/2019 DALLAS COUNTY - Irving ISD - 2010 Pride Survey
http://slidepdf.com/reader/full/dallas-county-irving-isd-2010-pride-survey 101/239

8/7/2019 DALLAS COUNTY - Irving ISD - 2010 Pride Survey
http://slidepdf.com/reader/full/dallas-county-irving-isd-2010-pride-survey 102/239

8/7/2019 DALLAS COUNTY - Irving ISD - 2010 Pride Survey
http://slidepdf.com/reader/full/dallas-county-irving-isd-2010-pride-survey 103/239
Pride Surveys Report: 2009-10 Irving Independent Schools

8/7/2019 DALLAS COUNTY - Irving ISD - 2010 Pride Survey
http://slidepdf.com/reader/full/dallas-county-irving-isd-2010-pride-survey 104/239
When Do You Use Smokeless Tobacco
Source: Pride Surveys
Before School During School After School Week Night Weekend
6 7 8 9 10 11 6 7 8 9 10 11 6 7 8 9 10 11 6 7 8 9 10 11 6 7 8 9 10 11
0 . 7
0 . 6
1 . 0
1 . 2
2 . 3
1 . 1
0 . 9
0 . 3
0 . 5
1 . 3
2 . 7
1 . 2
1 . 1 1
. 2 1 . 5 1
. 6
2 . 8
1 . 7
1 . 1
1 . 1
2 . 1
1 . 5
2 . 6
1 . 6
1 . 5
2 . 3
3 . 1
3 . 0
3 . 6
3 . 1
Graphics 104
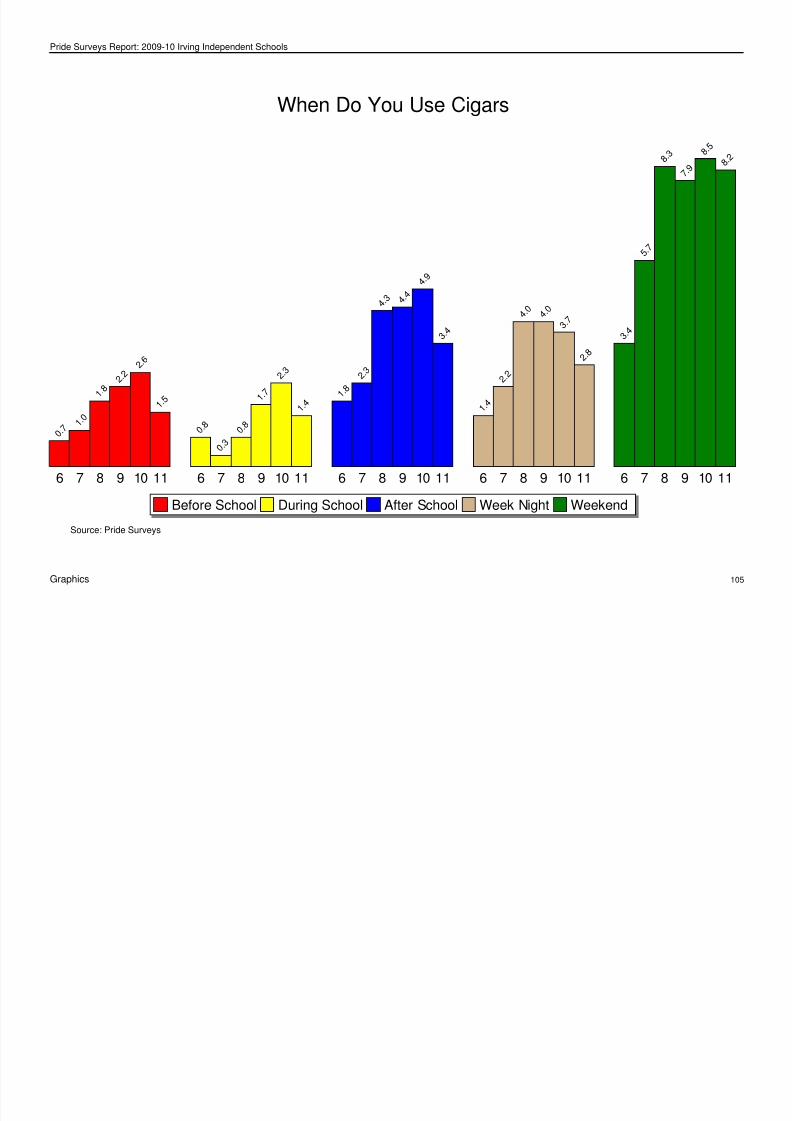
8/7/2019 DALLAS COUNTY - Irving ISD - 2010 Pride Survey
http://slidepdf.com/reader/full/dallas-county-irving-isd-2010-pride-survey 105/239

8/7/2019 DALLAS COUNTY - Irving ISD - 2010 Pride Survey
http://slidepdf.com/reader/full/dallas-county-irving-isd-2010-pride-survey 106/239
Pride Surveys Report: 2009-10 Irving Independent Schools

8/7/2019 DALLAS COUNTY - Irving ISD - 2010 Pride Survey
http://slidepdf.com/reader/full/dallas-county-irving-isd-2010-pride-survey 107/239
When Do You Use Coolers, Breezers, etc.
Source: Pride Surveys
Before School During School After School Week Night Weekend
6 7 8 9 10 11 6 7 8 9 10 11 6 7 8 9 10 11 6 7 8 9 10 11 6 7 8 9 10 11
1 . 1
0 . 7 1
. 2 1 . 4 2
. 3
1 . 3
0 . 7
0 . 5
0 . 7 1
. 3 2 . 6
1 . 4
1 . 6 2
. 4
4 . 0
3 . 3
3 . 4
2 . 0
2 . 0
3 . 7
6 . 0
6 . 1 6
. 6
4 . 9
7 . 7
1 4 . 9
2 4 . 1
2 3 . 0
2 9 . 0
3 1 . 9
Graphics 107
Pride Surveys Report: 2009-10 Irving Independent Schools

8/7/2019 DALLAS COUNTY - Irving ISD - 2010 Pride Survey
http://slidepdf.com/reader/full/dallas-county-irving-isd-2010-pride-survey 108/239
When Do You Use Liquor
Source: Pride Surveys
Before School During School After School Week Night Weekend
6 7 8 9 10 11 6 7 8 9 10 11 6 7 8 9 10 11 6 7 8 9 10 11 6 7 8 9 10 11
0 . 8
0 . 9
1 . 0 1
. 5 2 . 5
1 . 1
0 . 9
0 . 4 0
. 8 1 . 8 2
. 9
1 . 8
1 . 5 2
. 1 3 . 2 3 . 2 3 . 7
2 . 1
2 . 3 3 .
4
6 . 2
6 . 0 7
. 2
4 . 9
6 . 4
1 4 . 6
2 3 . 8 2
5 . 1
3 0 . 2
3 3 . 8
Graphics 108
Pride Surveys Report: 2009-10 Irving Independent Schools

8/7/2019 DALLAS COUNTY - Irving ISD - 2010 Pride Survey
http://slidepdf.com/reader/full/dallas-county-irving-isd-2010-pride-survey 109/239
When Do You Use Marijuana
Source: Pride Surveys
Before School During School After School Week Night Weekend
6 7 8 9 10 11 6 7 8 9 10 11 6 7 8 9 10 11 6 7 8 9 10 11 6 7 8 9 10 11
1 . 0 1
. 2
3 . 8
5 . 4 5
. 9
5 . 7
0 . 9
0 . 7 1
. 3
3 . 1
3 . 8
3 . 4
1 . 8
3 . 7
6 . 9
8 . 2
9 . 0
8 . 4
1 . 6
2 . 8
6 . 7
8 . 3
9 . 0
8 . 4
3 . 7
7 . 6
1 4 . 5
1 5 . 7
1 7 .
0
1 8 . 6
Graphics 109
Pride Surveys Report: 2009-10 Irving Independent Schools
3.10 Drug Use by Gender

8/7/2019 DALLAS COUNTY - Irving ISD - 2010 Pride Survey
http://slidepdf.com/reader/full/dallas-county-irving-isd-2010-pride-survey 110/239
Graphics 110
Pride Surveys Report: 2009-10 Irving Independent Schools

8/7/2019 DALLAS COUNTY - Irving ISD - 2010 Pride Survey
http://slidepdf.com/reader/full/dallas-county-irving-isd-2010-pride-survey 111/239
Use of Any Tobacco by Gender
Source: Pride Surveys
6 7 8 9 10 11
Male Female
1 0 . 9
7 . 8
1 9 . 3
1 5 . 7
2 4 . 2
2 4 . 5
2 7 .
1
2 2 . 7
3 1
. 3
2 5 . 7
3 1 . 4
2 2 . 4
Graphics 111

8/7/2019 DALLAS COUNTY - Irving ISD - 2010 Pride Survey
http://slidepdf.com/reader/full/dallas-county-irving-isd-2010-pride-survey 112/239

8/7/2019 DALLAS COUNTY - Irving ISD - 2010 Pride Survey
http://slidepdf.com/reader/full/dallas-county-irving-isd-2010-pride-survey 113/239
Pride Surveys Report: 2009-10 Irving Independent Schools

8/7/2019 DALLAS COUNTY - Irving ISD - 2010 Pride Survey
http://slidepdf.com/reader/full/dallas-county-irving-isd-2010-pride-survey 114/239
Use of Cigarettes by Gender
Source: Pride Surveys
6 7 8 9 10 11
Male Female
9 . 9
6 . 6
1 6 . 1
1 3 . 6
2 2 . 8
2 2 . 5 2
3 . 7
1 9 . 9
2 8 . 8
2 2 . 2
2 9 . 3
1 9 . 9
Graphics 114
Pride Surveys Report: 2009-10 Irving Independent Schools

8/7/2019 DALLAS COUNTY - Irving ISD - 2010 Pride Survey
http://slidepdf.com/reader/full/dallas-county-irving-isd-2010-pride-survey 115/239
Use of Smokeless Tobacco by Gender
Source: Pride Surveys
6 7 8 9 10 11
Male Female
3 . 6
2 . 2
3 . 9
3 . 6
6 . 2
4 . 8
7 . 5
5 . 4
1
2 . 8
5 . 1
1 0 . 2
3 . 1
Graphics 115
Pride Surveys Report: 2009-10 Irving Independent Schools

8/7/2019 DALLAS COUNTY - Irving ISD - 2010 Pride Survey
http://slidepdf.com/reader/full/dallas-county-irving-isd-2010-pride-survey 116/239
Use of Cigars by Gender
Source: Pride Surveys
6 7 8 9 10 11
Male Female
6 . 6
4 . 5
1 0 . 8
8 . 1
1 5 .
0
1 4 . 1
1 6 . 8
1 2 . 7
2 1
. 1
1 4 . 2
1 6 . 8
1 0 . 7
Graphics 116

8/7/2019 DALLAS COUNTY - Irving ISD - 2010 Pride Survey
http://slidepdf.com/reader/full/dallas-county-irving-isd-2010-pride-survey 117/239
Pride Surveys Report: 2009-10 Irving Independent Schools

8/7/2019 DALLAS COUNTY - Irving ISD - 2010 Pride Survey
http://slidepdf.com/reader/full/dallas-county-irving-isd-2010-pride-survey 118/239
Use of Coolers, Breezers, etc. by Gender
Source: Pride Surveys
6 7 8 9 10 11
Male Female
1 4 . 5
1 3 . 4
2 0 . 0
2 6 . 3 2
8 . 6
4 1 . 3
2 9 . 8
3 9 . 7
3 6 . 3
4 6 . 0
3 6 . 9
5 0
. 6
Graphics 118
Pride Surveys Report: 2009-10 Irving Independent Schools

8/7/2019 DALLAS COUNTY - Irving ISD - 2010 Pride Survey
http://slidepdf.com/reader/full/dallas-county-irving-isd-2010-pride-survey 119/239
Use of Liquor by Gender
Source: Pride Surveys
6 7 8 9 10 11
Male Female
1 2 . 7
1 1 . 6
1 9 . 6
2 1 . 9
2 9 . 7
3 7 .
3
3 4 . 3 3
6 . 1
4 3 . 3 4
4 . 6 4
6 . 0
4
6 . 0
Graphics 119
Pride Surveys Report: 2009-10 Irving Independent Schools
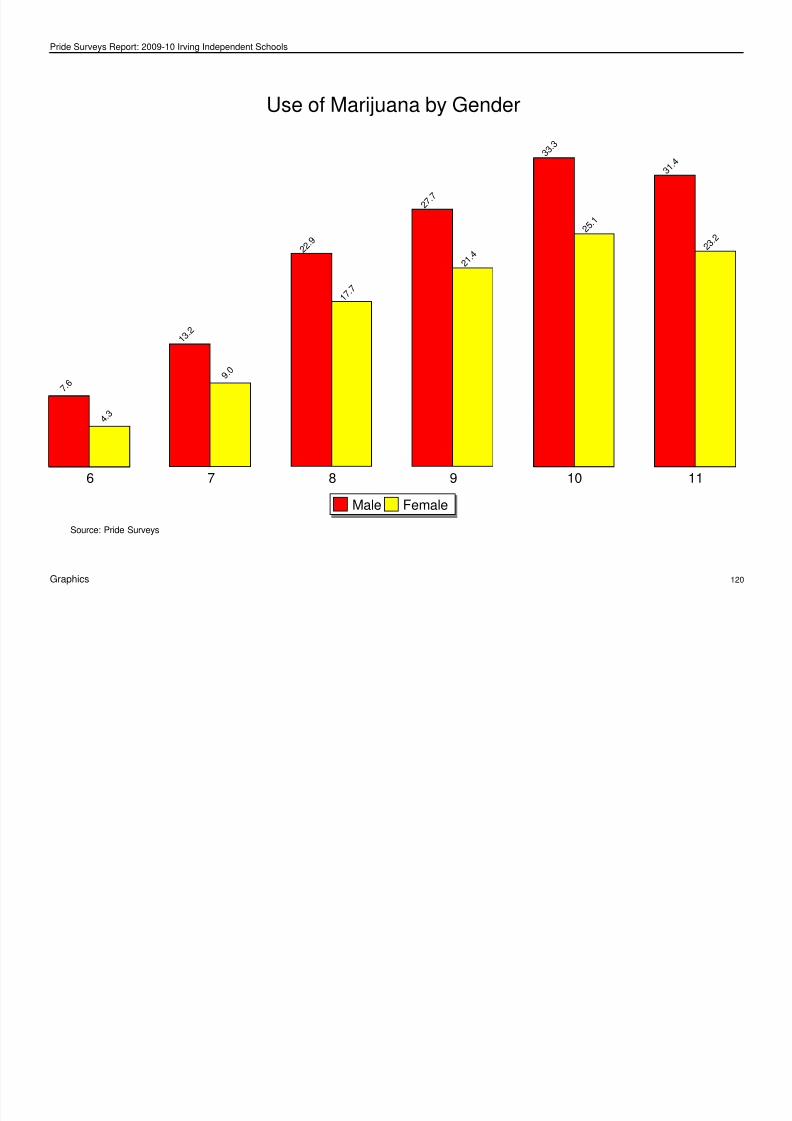
8/7/2019 DALLAS COUNTY - Irving ISD - 2010 Pride Survey
http://slidepdf.com/reader/full/dallas-county-irving-isd-2010-pride-survey 120/239
Use of Marijuana by Gender
Source: Pride Surveys
6 7 8 9 10 11
Male Female
7 . 6
4 . 3
1 3 . 2
9 . 0
2 2 . 9
1 7 . 7
2 7 . 7
2 1 . 4
3 3
. 3
2 5 .
1
3 1 . 4
2 3 . 2
Graphics 120
Pride Surveys Report: 2009-10 Irving Independent Schools

8/7/2019 DALLAS COUNTY - Irving ISD - 2010 Pride Survey
http://slidepdf.com/reader/full/dallas-county-irving-isd-2010-pride-survey 121/239
Use of Cocaine by Gender
Source: Pride Surveys
6 7 8 9 10 11
Male Female
3 . 5
2 . 6
3 . 7
3 . 4
5 . 2
6 . 1
8 . 2
7 . 0
1 3 . 8
6 . 8
1 1 . 1
5 . 1
Graphics 121
Pride Surveys Report: 2009-10 Irving Independent Schools

8/7/2019 DALLAS COUNTY - Irving ISD - 2010 Pride Survey
http://slidepdf.com/reader/full/dallas-county-irving-isd-2010-pride-survey 122/239
Use of Uppers by Gender
Source: Pride Surveys
6 7 8 9 10 11
Male Female
2 . 5
2 . 1
2 . 9
3 . 0
4 . 3
5 . 3
8 . 1
6 . 2
1
1 . 9
7 . 4
9 . 9
5 . 8
Graphics 122
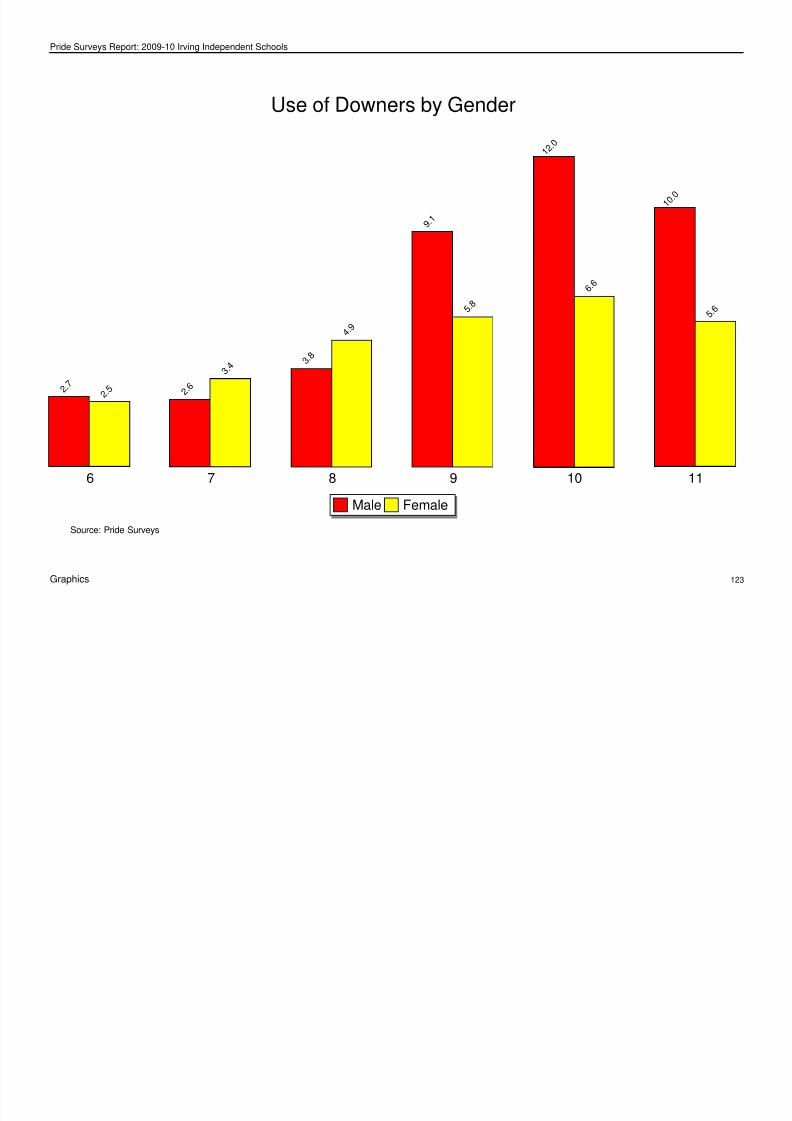
8/7/2019 DALLAS COUNTY - Irving ISD - 2010 Pride Survey
http://slidepdf.com/reader/full/dallas-county-irving-isd-2010-pride-survey 123/239

8/7/2019 DALLAS COUNTY - Irving ISD - 2010 Pride Survey
http://slidepdf.com/reader/full/dallas-county-irving-isd-2010-pride-survey 124/239
Pride Surveys Report: 2009-10 Irving Independent Schools

8/7/2019 DALLAS COUNTY - Irving ISD - 2010 Pride Survey
http://slidepdf.com/reader/full/dallas-county-irving-isd-2010-pride-survey 125/239
Use of Hallucinogens by Gender
Source: Pride Surveys
6 7 8 9 10 11
Male Female
2 . 4
1 . 9
1 . 9 2
. 2
3 . 3
2 . 9
7 . 2
3 . 7
1 1 . 2
5 . 1
9 . 5
3 . 2
Graphics 125
Pride Surveys Report: 2009-10 Irving Independent Schools

8/7/2019 DALLAS COUNTY - Irving ISD - 2010 Pride Survey
http://slidepdf.com/reader/full/dallas-county-irving-isd-2010-pride-survey 126/239
Use of Heroin by Gender
Source: Pride Surveys
6 7 8 9 10 11
Male Female
2 . 8
2 . 2
2 . 2 2
. 4
3 . 4
4 . 2
5 .
6
4 . 4
1 0 . 0
4 . 7
7 . 0
2 . 2
Graphics 126

8/7/2019 DALLAS COUNTY - Irving ISD - 2010 Pride Survey
http://slidepdf.com/reader/full/dallas-county-irving-isd-2010-pride-survey 127/239

8/7/2019 DALLAS COUNTY - Irving ISD - 2010 Pride Survey
http://slidepdf.com/reader/full/dallas-county-irving-isd-2010-pride-survey 128/239

8/7/2019 DALLAS COUNTY - Irving ISD - 2010 Pride Survey
http://slidepdf.com/reader/full/dallas-county-irving-isd-2010-pride-survey 129/239
Pride Surveys Report: 2009-10 Irving Independent Schools
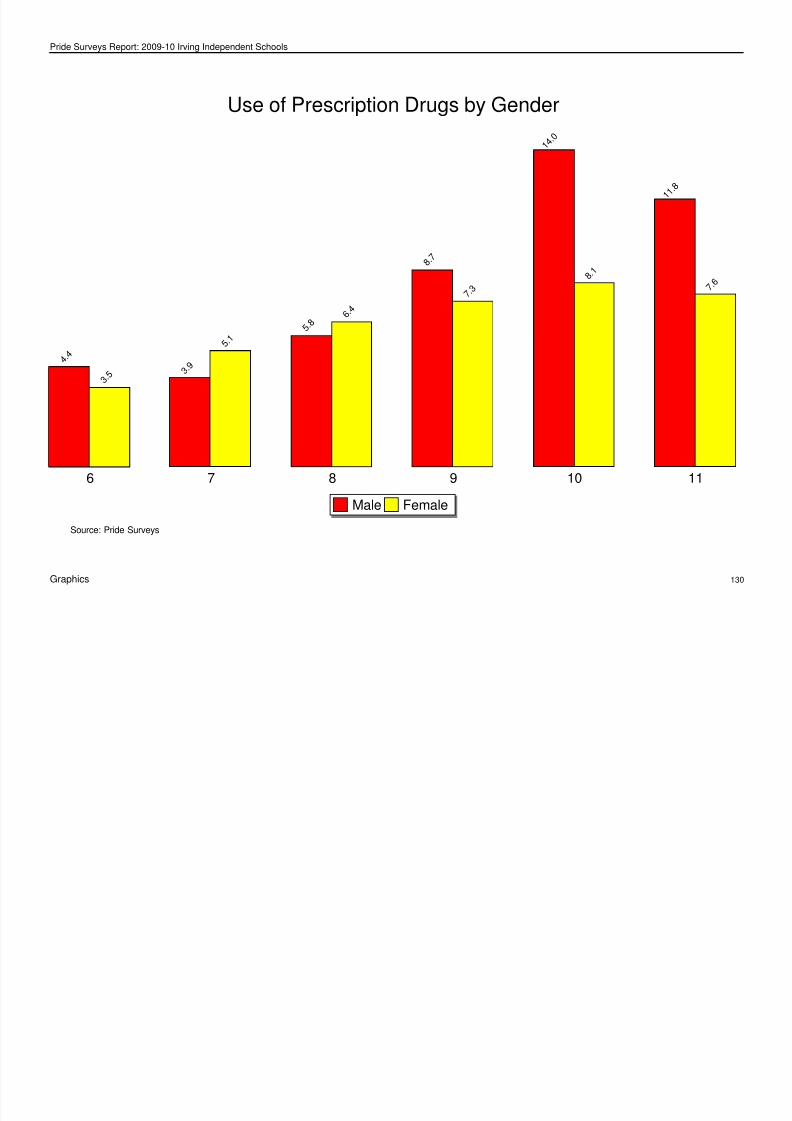
8/7/2019 DALLAS COUNTY - Irving ISD - 2010 Pride Survey
http://slidepdf.com/reader/full/dallas-county-irving-isd-2010-pride-survey 130/239
Use of Prescription Drugs by Gender
Source: Pride Surveys
6 7 8 9 10 11
Male Female
4 . 4
3 . 5 3
. 9
5 . 1
5 . 8
6 . 4
8 . 7
7 . 3
1 4 . 0
8 . 1
1 1 . 8
7 . 6
Graphics 130

8/7/2019 DALLAS COUNTY - Irving ISD - 2010 Pride Survey
http://slidepdf.com/reader/full/dallas-county-irving-isd-2010-pride-survey 131/239

8/7/2019 DALLAS COUNTY - Irving ISD - 2010 Pride Survey
http://slidepdf.com/reader/full/dallas-county-irving-isd-2010-pride-survey 132/239

8/7/2019 DALLAS COUNTY - Irving ISD - 2010 Pride Survey
http://slidepdf.com/reader/full/dallas-county-irving-isd-2010-pride-survey 133/239
Pride Surveys Report: 2009-10 Irving Independent Schools
3.11.3 Make Good Grades Students are grouped based on how they responded to the question and
the percent of illicit drug use in the past year is calculated for each group. For
example if the bar for Never is at 40% this means 40% of the students who

8/7/2019 DALLAS COUNTY - Irving ISD - 2010 Pride Survey
http://slidepdf.com/reader/full/dallas-county-irving-isd-2010-pride-survey 134/239
Students could respond to this question by marking Never, Seldom, Some-
times, Often or A Lot. The following table shows what percent of all students
responded Never, what percent responded Sometimes, etc.
Table 3.3: Make Good Grades
RESPONSE PCT
Never 1.6
Seldom 2.1
Sometimes 30.4
Often 41.2
A Lot 24.7
example, if the bar for Never is at 40% this means 40% of the students who
marked Never reported using an illicit drug.
Make Good Grades
Source: Pride Surveys
Never Seldom Sometimes Often A Lot
Percent of Annual Use of Any Illicit Drug
6 9 . 4
5 3 . 7
3 1 . 6
2 1 . 6
1 4 . 7
Graphics 134
Pride Surveys Report: 2009-10 Irving Independent Schools
3.11.4 Take Part in Sports Teams Students are grouped based on how they responded to the question and
the percent of illicit drug use in the past year is calculated for each group. For
example if the bar for Never is at 40% this means 40% of the students who

8/7/2019 DALLAS COUNTY - Irving ISD - 2010 Pride Survey
http://slidepdf.com/reader/full/dallas-county-irving-isd-2010-pride-survey 135/239
Students could respond to this question by marking Never, Seldom, Some-
times, Often or A Lot. The following table shows what percent of all students
responded Never, what percent responded Sometimes, etc.
Table 3.4: Take Part in Sports Teams
RESPONSE PCT
Never 43.8
Seldom 11.9
Sometimes 12.9
Often 9.9
A Lot 21.5
example, if the bar for Never is at 40% this means 40% of the students who
marked Never reported using an illicit drug.
Take Part in Sports Teams
Source: Pride Surveys
Never Seldom Sometimes Often A Lot
Percent of Annual Use of Any Illicit Drug
2 3 . 9
2 8 . 9
2 4 . 4
2 4 . 5
2 2 . 9
Graphics 135
Pride Surveys Report: 2009-10 Irving Independent Schools
3.11.5 Take Part in School Activities Students are grouped based on how they responded to the question and
the percent of illicit drug use in the past year is calculated for each group. For
example if the bar for Never is at 40% this means 40% of the students who

8/7/2019 DALLAS COUNTY - Irving ISD - 2010 Pride Survey
http://slidepdf.com/reader/full/dallas-county-irving-isd-2010-pride-survey 136/239
Students could respond to this question by marking Never, Seldom, Some-
times, Often or A Lot. The following table shows what percent of all students
responded Never, what percent responded Sometimes, etc.
Table 3.5: Take Part in School Activities
RESPONSE PCT
Never 39.7
Seldom 12.5
Sometimes 14.0
Often 11.6
A Lot 22.2
example, if the bar for Never is at 40% this means 40% of the students who
marked Never reported using an illicit drug.
Take Part in School Activities
Source: Pride Surveys
Never Seldom Sometimes Often A Lot
Percent of Annual Use of Any Illicit Drug
3 1 . 1
2 5 .
6
2 1 . 9
1 8 . 1
1 6 . 7
Graphics 136
Pride Surveys Report: 2009-10 Irving Independent Schools
3.11.6 Get Into Trouble at School Students are grouped based on how they responded to the question and
the percent of illicit drug use in the past year is calculated for each group. For
example, if the bar for Never is at 40% this means 40% of the students who

8/7/2019 DALLAS COUNTY - Irving ISD - 2010 Pride Survey
http://slidepdf.com/reader/full/dallas-county-irving-isd-2010-pride-survey 137/239
Students could respond to this question by marking Never, Seldom, Some-
times, Often or A Lot. The following table shows what percent of all students
responded Never, what percent responded Sometimes, etc.
Table 3.6: Get Into Trouble at School
RESPONSE PCT
Never 30.1
Seldom 34.2
Sometimes 25.8
Often 6.1
A Lot 3.8
example, if the bar for Never is at 40% this means 40% of the students who
marked Never reported using an illicit drug.
Get Into Trouble at School
Source: Pride Surveys
Never Seldom Sometimes Often A Lot
Percent of Annual Use of Any Illicit Drug
1 0 . 7
2 2 . 1
3 1 . 1
5 1 . 3
6 3 . 9
Graphics 137
Pride Surveys Report: 2009-10 Irving Independent Schools
3.11.7 Teachers Talk About Dangers of Drugs Students are grouped based on how they responded to the question and
the percent of illicit drug use in the past year is calculated for each group. For
example, if the bar for Never is at 40% this means 40% of the students who

8/7/2019 DALLAS COUNTY - Irving ISD - 2010 Pride Survey
http://slidepdf.com/reader/full/dallas-county-irving-isd-2010-pride-survey 138/239
Students could respond to this question by marking Never, Seldom, Some-
times, Often or A Lot. The following table shows what percent of all students
responded Never, what percent responded Sometimes, etc.
Table 3.7: Teachers Talk About Dangers of Drugs
RESPONSE PCT
Never 20.1
Seldom 21.8
Sometimes 30.9
Often 16.1
A Lot 11.1
p , e e
marked Never reported using an illicit drug.
Teachers Talk About Dangers of Drugs
Source: Pride Surveys
Never Seldom Sometimes Often A Lot
Percent of Annual Use of Any Illicit Drug
3 2 . 2
2 6 . 0
2 2 . 9
1 9 . 5
1 8 . 4
Graphics 138

8/7/2019 DALLAS COUNTY - Irving ISD - 2010 Pride Survey
http://slidepdf.com/reader/full/dallas-county-irving-isd-2010-pride-survey 139/239
Pride Surveys Report: 2009-10 Irving Independent Schools
3.11.9 Parents Set Clear Rules
St d t ld d t thi ti b ki N S ld S
Students are grouped based on how they responded to the question and
the percent of illicit drug use in the past year is calculated for each group. For
example, if the bar for Never is at 40% this means 40% of the students who

8/7/2019 DALLAS COUNTY - Irving ISD - 2010 Pride Survey
http://slidepdf.com/reader/full/dallas-county-irving-isd-2010-pride-survey 140/239
Students could respond to this question by marking Never, Seldom, Some-
times, Often or A Lot. The following table shows what percent of all students
responded Never, what percent responded Sometimes, etc.
Table 3.9: Parents Set Clear Rules
RESPONSE PCT
Never 5.5
Seldom 7.3
Sometimes 19.4
Often 22.6
A Lot 45.2
p
marked Never reported using an illicit drug.
Parents Set Clear Rules
Source: Pride Surveys
Never Seldom Sometimes Often A Lot
Percent of Annual Use of Any Illicit Drug
4 7 .
9
4 1 . 8
3 0 . 5
2 4 . 8
1 5 . 7
Graphics 140
Pride Surveys Report: 2009-10 Irving Independent Schools
3.11.10 Parents Punish for Breaking Rules
St dents co ld respond to this q estion b marking Ne er Seldom Some
Students are grouped based on how they responded to the question and
the percent of illicit drug use in the past year is calculated for each group. For
example, if the bar for Never is at 40% this means 40% of the students who

8/7/2019 DALLAS COUNTY - Irving ISD - 2010 Pride Survey
http://slidepdf.com/reader/full/dallas-county-irving-isd-2010-pride-survey 141/239
Students could respond to this question by marking Never, Seldom, Some-
times, Often or A Lot. The following table shows what percent of all students
responded Never, what percent responded Sometimes, etc.
Table 3.10: Parents Punish for Breaking Rules
RESPONSE PCT
Never 10.9
Seldom 15.9
Sometimes 30.9
Often 22.8
A Lot 19.5
marked Never reported using an illicit drug.
Parents Punish for Breaking Rules
Source: Pride Surveys
Never Seldom Sometimes Often A Lot
Percent of Annual Use of Any Illicit Drug
3 5 .
6
3 2 . 0
2 2 . 9
1 9 . 7
1 9 . 6
Graphics 141
Pride Surveys Report: 2009-10 Irving Independent Schools
3.12 Safety and Health – Cross Tabulations

8/7/2019 DALLAS COUNTY - Irving ISD - 2010 Pride Survey
http://slidepdf.com/reader/full/dallas-county-irving-isd-2010-pride-survey 142/239
The following graphs and tables summarize some of the Student Information
questions in regards to drug use. These data are calculated by examining
specific subsets of your population. For example, a percentage is calculated
for students who report carrying a gun and their liquor use. This percentage
is calculated as follows:
Number of those reporting carrying a
gun to school and claiming to use liquor
Number of those reporting carrying a gun and validly
responding to the question How Often Do You Use Liquor
The Ratio describes the relationship between the groups examined on
each graph. For example, in looking at Guns vs. No Guns if the cocaine ratio
were 5.3, this would mean the percentage of students who report cocaineuse was 5.3 times higher for students who report bringing a gun to school
compared to those who don’t.
Graphics 142

8/7/2019 DALLAS COUNTY - Irving ISD - 2010 Pride Survey
http://slidepdf.com/reader/full/dallas-county-irving-isd-2010-pride-survey 143/239
Pride Surveys Report: 2009-10 Irving Independent Schools
3.14 Involvement in Gangs
T l b f d d
Drug Use of Students Who Reported Involvement in Gangsvs. Students Who Did Not
6 5 .
9
7

8/7/2019 DALLAS COUNTY - Irving ISD - 2010 Pride Survey
http://slidepdf.com/reader/full/dallas-county-irving-isd-2010-pride-survey 144/239
Total number of students surveyed = 11317
Total number who responded to this question = 11004
1473 students reported involvement in gangs. (13.4% of total responding)
Of the 1473 students who reported involvement in gangs,
950 report using liquor (65.9%),
860 report using marijuana (59.7%),
428 report using cocaine (29.6%),
329 report using Meth (23.0%).
NOTE: Results based on students who reported any involvement with gangs
Source: Pride Surveys
Liquor Marijuana Cocaine Meth
Gang No Gang
2 4 . 7
5 9 . 7
1 2 . 1
2 9 . 6
2 . 3
2 3 . 0
1 . 6
Drug Gang No Gang Ratio
Liquor 65.9% 24.7% 2.7
Marijuana 59.7% 12.1% 4.9
Cocaine 29.6% 2.3% 12.9
Meth 23.0% 1.6% 14.4
N of Students 1473 9531
Graphics 144
Pride Surveys Report: 2009-10 Irving Independent Schools
3.15 Thinking About Suicide
T t l b f t d t d 11317
Drug Use of Students Who Reported Thinking About Suicidevs. Students Who Did Not
6 2 . 1
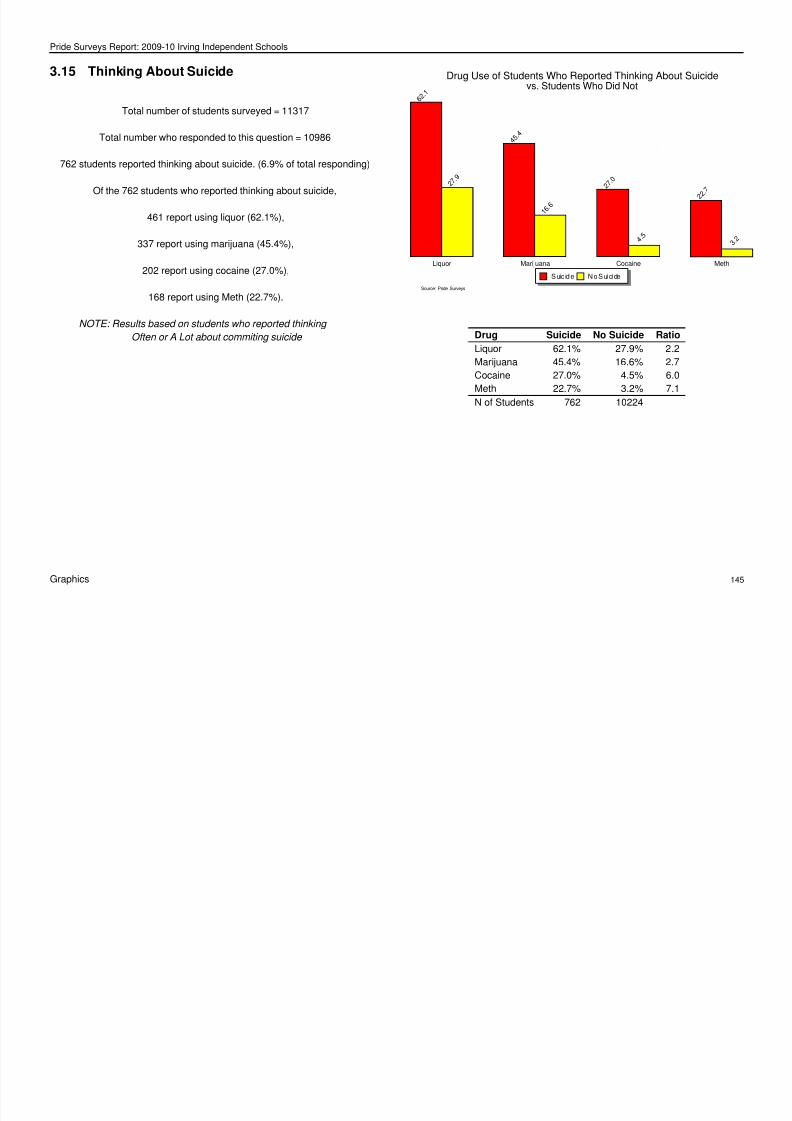
8/7/2019 DALLAS COUNTY - Irving ISD - 2010 Pride Survey
http://slidepdf.com/reader/full/dallas-county-irving-isd-2010-pride-survey 145/239
Total number of students surveyed = 11317
Total number who responded to this question = 10986
762 students reported thinking about suicide. (6.9% of total responding)
Of the 762 students who reported thinking about suicide,
461 report using liquor (62.1%),
337 report using marijuana (45.4%),
202 report using cocaine (27.0%),
168 report using Meth (22.7%).
NOTE: Results based on students who reported thinking
Often or A Lot about commiting suicide
Source: Pride Surveys
Liquor Marijuana Cocaine Meth
Suic ide N o Suicide
2 7 .
9
4 5 .
4
1 6 . 6
2 7 .
0
4 . 5
2 2 . 7
3 . 2
Drug Suicide No Suicide Ratio
Liquor 62.1% 27.9% 2.2
Marijuana 45.4% 16.6% 2.7
Cocaine 27.0% 4.5% 6.0
Meth 22.7% 3.2% 7.1
N of Students 762 10224
Graphics 145
Pride Surveys Report: 2009-10 Irving Independent Schools
3.16 Being Overweight
T t l b f t d t d 11317
Drug Use of Students Who Reported Being Overweightvs. Students Who Did Not
3 4 . 8

8/7/2019 DALLAS COUNTY - Irving ISD - 2010 Pride Survey
http://slidepdf.com/reader/full/dallas-county-irving-isd-2010-pride-survey 146/239
Total number of students surveyed = 11317
Total number who responded to this question = 10969
3196 students reported being overweight. (29.1% of total responding)
Of the 3196 students who reported being overweight,
1085 report using liquor (34.8%),
628 report using marijuana (20.1%),
227 report using cocaine (7.3%),
182 report using Meth (5.9%).
Source: Pride Surveys
Liquor Marijuana Cocaine Meth
Overweight No Overweight
2 8 . 7
2 0 . 1
1 8 . 1
7 . 3
5 . 5
5 . 9
4 . 0
D rug Overweight No Overweight R atio
Liquor 34.8% 28.7% 1.2
Marijuana 20.1% 18.1% 1.1
Cocaine 7.3% 5.5% 1.3
Meth 5.9% 4.0% 1.5
N of Students 3196 7773
Graphics 146
Pride Surveys Report: 2009-10 Irving Independent Schools
3.17 Threatening/Harmful Behaviors
Total number of students surveyed 11317
Drug Use of Students Who Reported Threatening/Harmful Behaviorsvs. Students Who Did Not
4 7 .
8

8/7/2019 DALLAS COUNTY - Irving ISD - 2010 Pride Survey
http://slidepdf.com/reader/full/dallas-county-irving-isd-2010-pride-survey 147/239
Total number of students surveyed = 11317
Total number who responded to this question = 10596
3412 students reported threatening/harmful behaviors. (32.2% of total
responding)
Of the 3412 students who reported threatening/harmful behaviors,
1601 report using liquor (47.8%),
1047 report using marijuana (31.3%),
417 report using cocaine (12.4%),
344 report using Meth (10.3%).
NOTE: Results based on students who reported either threatening
with a gun, knife or club or threatening to hit, slap or kick
Source: Pride Surveys
Liquor Marijuana Cocaine Meth
Threat No Threat
2 1 . 5
3 1 . 3
1 2 . 2
1 2 . 4
2 . 8
1 0 . 3
1 . 7
Drug Threat No Threat Ratio
Liquor 47.8% 21.5% 2.2
Marijuana 31.3% 12.2% 2.6
Cocaine 12.4% 2.8% 4.4
Meth 10.3% 1.7% 6.1
N of Students 3412 7184
Graphics 147
Pride Surveys Report: 2009-10 Irving Independent Schools
3.18 Trouble with Police
Total number of students surveyed 11317
Drug Use of Students Who Reported Trouble with Policevs. Students Who Did Not
5 1 . 9

8/7/2019 DALLAS COUNTY - Irving ISD - 2010 Pride Survey
http://slidepdf.com/reader/full/dallas-county-irving-isd-2010-pride-survey 148/239
Total number of students surveyed = 11317
Total number who responded to this question = 11078
3924 students reported trouble with police. (35.4% of total responding)
Of the 3924 students who reported trouble with police,
1982 report using liquor (51.9%),
1520 report using marijuana (39.9%),
548 report using cocaine (14.3%),
394 report using Meth (10.4%).
NOTE: Results based on students who reported
any trouble with police
Source: Pride Surveys
Liquor Marijuana Cocaine Meth
P olice No P olice
1 8 . 4
3 9 . 9
7 . 0
1 4 . 3
1 . 5
1 0 . 4
1 . 3
Drug Police No Police Ratio
Liquor 51.9% 18.4% 2.8
Marijuana 39.9% 7.0% 5.7
Cocaine 14.3% 1.5% 9.5
Meth 10.4% 1.3% 8.0
N of Students 3924 7154
Graphics 148
Pride Surveys Report: 2009-10 Irving Independent Schools
3.19 Personal Safety
Total number of students surveyed = 11317

8/7/2019 DALLAS COUNTY - Irving ISD - 2010 Pride Survey
http://slidepdf.com/reader/full/dallas-county-irving-isd-2010-pride-survey 149/239
Total number of students surveyed = 11317
2064 students report being afraid another student will hurt them at school.
(19.7% of total responding)
Of these 2064 students, 199 report carrying a gun to school (9.7%).
2339 students report getting hurt at school. (22.2% of total responding)
Of these 2339 students, 277 report carrying a gun to school (11.9%).
Graphics 149

8/7/2019 DALLAS COUNTY - Irving ISD - 2010 Pride Survey
http://slidepdf.com/reader/full/dallas-county-irving-isd-2010-pride-survey 150/239
Chapter 4
Percentage Tables
This chapter contains your school survey results in tabular form. Each
table corresponds to an item on the questionnaire. The tables contain per-
centage data by grade level, grades 6 through 8 combined, grades 9 through
12 combined, and all grades combined. The N of Valid column contains the
number of students who responded to the question and the N of Missing col-
umn contains the number of students who did not respond to the question.The remaining columns contain the percentages of students responding to
the particular response categories.
The percentage tables of the report appear in the same order as corre-
sponding questions on the questionnaire. The Table of Contents contains the
percentage tables by section and gives the page number where each section
is located. The List of Tables contains the location of each individual table.
The last section of tables presents the frequency of drug use How Often
Do You Use data with the categories collapsed as follows:
Daily Use – Every Day
Weekly Use – Once/Week + 3 Times/Week + Every Day
Monthly Use – Once/Month + Twice/Month + Once/Week +
3 Times/Week + Every Day
Annual Use – Once/Year + 6 Times/Year + Once/Month +
Twice/Month + Once/Week + 3 Times/Week + Every Day
Three additional drug use categories have been created for the question
How Often Do You Use by combining the existing data. A Tobacco Use cat-
egory was created by looking at the responses on each questionnaire on the
tobacco categories and taking the highest value as the value for Tobacco Use.
The Alcohol Use category was created by looking at the responses on each
questionnaire on the alcohol categories. The category of Illicit Drug Use wascreated in the same way by looking at the illicit drug categories. Therefore,
the Tobacco Use category represents any tobacco use regardless of the type
of tobacco, the Alcohol Use category represents any alcohol use regardless
of the type of alcohol and the Illicit Drug Use category represents any illicit
drug use regardless of the type of drug.
150
Pride Surveys Report: 2009-10 Irving Independent Schools
4.1 Personal & Family Information

8/7/2019 DALLAS COUNTY - Irving ISD - 2010 Pride Survey
http://slidepdf.com/reader/full/dallas-county-irving-isd-2010-pride-survey 151/239
Table 4.1: Ethnic Origin
RESPONSE 6th 7th 8th 9th 10th 11th 6-8th 9-12th TOTAL
White 12.3 11.8 10.1 13.0 15.9 16.7 11.4 14.9 12.9 -
African American 10.9 10.6 11.1 11.4 10.5 11.7 10.9 11.2 11.0 -Hispanic/Latino 61.5 63.5 64.3 62.3 58.1 59.7 63.1 60.3 61.9 -
Asian/PacIslndr 3.1 3.3 3.9 4.0 5.0 5.0 3.4 4.6 3.9 -
Native American 1.4 0.6 0.5 0.6 0.8 0.4 0.8 0.6 0.7 -
Mixed Origin 8.7 8.9 8.0 6.5 7.2 5.2 8.5 6.4 7.6 -
Other 2.1 1.3 2.1 2.2 2.5 1.3 1.9 2.1 1.9 -
N of Valid 2129 2052 2058 2032 1471 1371 6239 4874 11113
N of Miss 50 29 26 44 28 27 105 99 204
Table 4.2: Sex
RESPONSE 6th 7th 8th 9th 10th 11th 6-8th 9-12th TOTAL
Male 48.9 50.1 49.5 49.4 47.7 49.8 49.5 49.0 49.3 -
Female 51.1 49.9 50.5 50.6 52.3 50.2 50.5 51.0 50.7 -
N of Valid 2063 1979 1929 1857 1343 1230 5971 4430 10401
N of Miss 116 102 155 219 156 168 373 543 916
Percentage Tables 151
Pride Surveys Report: 2009-10 Irving Independent Schools
Table 4.3: Age
RESPONSE 6th 7th 8th 9th 10th 11th 6-8th 9-12th TOTAL
10 or under 0.4 0.0 0.0 0.0 0.2 0.0 0.1 0.1 0.1 -

8/7/2019 DALLAS COUNTY - Irving ISD - 2010 Pride Survey
http://slidepdf.com/reader/full/dallas-county-irving-isd-2010-pride-survey 152/239
11 34.4 0.1 0.0 0.0 0.1 0.1 11.8 0.0 6.7 -
12 54.0 34.1 0.2 0.0 0.0 0.0 29.8 0.0 16.7 -
13 10.1 55.1 36.4 0.1 0.1 0.0 33.5 0.1 18.8 -
14 0.3 10.0 52.5 28.2 0.3 0.1 20.6 11.9 16.8 -15 0.1 0.6 10.4 53.3 35.3 0.4 3.6 33.0 16.5 -
16 0.0 0.0 0.3 14.1 51.1 36.3 0.1 31.5 13.9 -
17 0.1 0.0 0.0 3.2 10.5 55.1 0.0 20.0 8.8 -
18 0.1 0.0 0.0 0.8 1.7 7.1 0.0 2.8 1.3 -
19+ 0.5 0.0 0.1 0.3 0.7 1.0 0.2 0.6 0.4 -
N of Valid 2171 2069 2073 2069 1494 1388 6313 4951 11264
N of Miss 8 12 11 7 5 10 31 22 53
Table 4.4: Do you live with...
RESPONSE 6th 7th 8th 9th 10th 11th 6-8th 9-12th TOTAL
Both Parents 58.9 56.5 52.2 52.2 52.8 52.8 55.9 52.6 54.5 -
Mother Only 20.0 20.4 23.6 23.8 23.7 25.4 21.3 24.2 22.6 -
Father Only 1.8 3.2 3.2 3.6 3.9 3.7 2.7 3.7 3.1 -
Mother & Stepfather 12.8 12.7 13.9 12.4 11.4 10.4 13.1 11.6 12.5 -
Father & Stepmother 1.7 2.0 1.9 2.5 1.7 1.7 1.9 2.0 1.9 -
Other 4.8 5.2 5.2 5.5 6.4 6.0 5.0 5.9 5.4 -
N of Valid 2158 2067 2073 2054 1480 1380 6298 4914 11212
N of Miss 21 14 11 22 19 18 46 59 105
Percentage Tables 152
Pride Surveys Report: 2009-10 Irving Independent Schools
Table 4.5: Do you have a job?
RESPONSE 6th 7th 8th 9th 10th 11th 6-8th 9-12th TOTAL
Yes, Full-time 1.3 0.5 0.9 1.5 1.6 1.3 0.9 1.5 1.1 -

8/7/2019 DALLAS COUNTY - Irving ISD - 2010 Pride Survey
http://slidepdf.com/reader/full/dallas-county-irving-isd-2010-pride-survey 153/239
Yes, Part-time 6.4 10.5 9.6 9.3 13.1 22.8 8.8 14.3 11.1 -
No 92.3 89.0 89.5 89.2 85.3 75.9 90.3 84.3 87.7 -
N of Valid 2108 2018 1993 1918 1403 1301 6119 4622 10741
N of Miss 71 63 91 158 96 97 225 351 576
Table 4.6: Does your father have a job?
RESPONSE 6th 7th 8th 9th 10th 11th 6-8th 9-12th TOTAL
Yes, Full-time 65.8 71.6 73.8 76.3 78.0 80.8 70.3 78.1 73.7 -
Yes, Par t-time 24.6 19.0 16.4 12.3 11.2 7.8 20.1 10.7 16.0 -
No 9.6 9.4 9.9 11.4 10.9 11.4 9.6 11.2 10.3 -
N of Valid 1905 1849 1806 1802 1316 1218 5560 4336 9896
N of Miss 274 232 278 274 183 180 784 637 1421
Table 4.7: Does your mother have a job?
RESPONSE 6th 7th 8th 9th 10th 11th 6-8th 9-12th TOTAL
Yes, Full-time 45.7 51.8 53.9 58.1 61.8 64.5 50.4 61.0 55.1 -
Yes, Par t-time 28.0 25.2 21.5 18.6 15.8 12.8 24.9 16.1 21.1 -
No 26.3 23.0 24.6 23.3 22.4 22.7 24.7 22.9 23.9 -
N of Valid 1993 1928 1934 1916 1364 1286 5855 4566 10421
N of Miss 186 153 150 160 135 112 489 407 896
Percentage Tables 153
Pride Surveys Report: 2009-10 Irving Independent Schools
Table 4.8: What is the educational level of your father?
RESPONSE 6th 7th 8th 9th 10th 11th 6-8th 9-12th TOTAL
Some High School 38.8 42.6 44.3 43.7 41.9 42.4 42.0 42.7 42.3 -

8/7/2019 DALLAS COUNTY - Irving ISD - 2010 Pride Survey
http://slidepdf.com/reader/full/dallas-county-irving-isd-2010-pride-survey 154/239
High School Graduate 25.2 23.2 25.4 25.9 25.8 25.3 24.6 25.7 25.1 -
Some College 13.8 14.1 14.2 13.5 13.2 14.1 14.1 13.6 13.8 -
College Graduate 22.2 20.1 16.1 16.9 19.2 18.3 19.4 18.0 18.8 -
N of Valid 1387 1533 1514 1507 1094 1067 4434 3668 8102N of Miss 792 548 570 569 405 331 1910 1305 3215
Table 4.9: What is the educational level of your mother?
RESPONSE 6th 7th 8th 9th 10th 11th 6-8th 9-12th TOTAL
Some High School 33.5 37.2 39.6 40.1 38.2 39.8 36.9 39.4 38.0 -
High School Graduate 24.4 22.8 23.7 24.2 24.1 24.5 23.6 24.3 23.9 -
Some College 16.2 17.2 17.9 17.2 17.8 18.1 17.1 17.6 17.4 -
College Graduate 25.9 22.7 18.8 18.5 19.9 17.6 22.4 18.7 20.7 -
N of Valid 1504 1668 1661 1635 1214 1166 4833 4015 8848
N of Miss 675 413 423 441 285 232 1511 958 2469
Percentage Tables 154
Pride Surveys Report: 2009-10 Irving Independent Schools
4.2 Student Information
Table 4 10: Do you make good grades?

8/7/2019 DALLAS COUNTY - Irving ISD - 2010 Pride Survey
http://slidepdf.com/reader/full/dallas-county-irving-isd-2010-pride-survey 155/239
Table 4.10: Do you make good grades?
RESPONSE 6th 7th 8th 9th 10th 11th 6-8th 9-12th TOTAL
Never 1.2 0.5 1.1 2.8 2.7 1.5 1.0 2.4 1.6 -
Seldom 1.4 1.8 1.6 2.8 3.4 1.9 1.6 2.7 2.1 -Sometimes 31.6 31.7 27.0 34.4 29.6 26.8 30.1 30.8 30.4 -
Often 40.3 41.0 42.5 39.0 40.2 45.6 41.2 41.2 41.2 -
A Lot 25.5 25.0 27.9 21.1 24.2 24.2 26.1 22.9 24.7 -
N of Valid 2161 2072 2077 2060 1489 1382 6310 4931 11241
N of Miss 18 9 7 16 10 16 34 42 76
Table 4.11: Do you get into trouble at school?
RESPONSE 6th 7th 8th 9th 10th 11th 6-8th 9-12th TOTAL
Never 27.7 25.5 24.3 29.3 37.5 42.8 25.9 35.5 30.1 -Seldom 28.1 32.2 35.4 37.5 36.2 37.5 31.8 37.1 34.2 -
Sometimes 31.9 30.6 30.2 24.1 17.6 14.1 30.9 19.3 25.8 -
Often 6.6 7.9 6.3 6.2 5.1 3.7 6.9 5.2 6.1 -
A Lot 5.8 3.8 3.7 2.9 3.7 2.0 4.5 2.9 3.8 -
N of Valid 2150 2068 2066 2050 1479 1380 6284 4909 11193
N of Miss 29 13 18 26 20 18 60 64 124
Table 4.12: Do you take part in school sports teams?
RESPONSE 6th 7th 8th 9th 10th 11th 6-8th 9-12th TOTAL
Never 66.7 36.0 36.3 38.4 40.4 44.1 46.4 40.6 43.8 -
Seldom 7.8 11.4 12.2 13.9 13.7 13.3 10.5 13.7 11.9 -
Sometimes 11.5 12.3 13.1 15.1 12.8 12.7 12.3 13.7 12.9 -
Often 5.9 12.8 11.8 10.4 10.7 6.9 10.2 9.5 9.9 -
A Lot 8.0 27.5 26.5 22.1 22.4 23.1 20.6 22.5 21.5 -
N of Valid 2020 1981 2024 2001 1449 1356 6025 4806 10831
N of Miss 159 100 60 75 50 42 319 167 486
Percentage Tables 155
Pride Surveys Report: 2009-10 Irving Independent Schools
Table 4.13: Do you take part in school activities such as band, clubs, etc.?
RESPONSE 6th 7th 8th 9th 10th 11th 6-8th 9-12th TOTAL
Never 28.4 33.6 42.2 46.2 45.9 46.2 34.6 46.1 39.7 -

8/7/2019 DALLAS COUNTY - Irving ISD - 2010 Pride Survey
http://slidepdf.com/reader/full/dallas-county-irving-isd-2010-pride-survey 156/239
Seldom 6.7 10.3 15.1 17.1 14.5 12.2 10.6 14.9 12.5 -
Sometimes 12.4 14.5 12.6 15.2 14.6 15.4 13.2 15.1 14.0 -
Often 14.6 13.5 12.1 8.1 10.6 9.5 13.4 9.2 11.6 -
A Lot 38.0 28.1 18.0 13.5 14.4 16.8 28.1 14.7 22.2 -N of Valid 2126 2058 2063 2043 1477 1374 6247 4894 11141
N of Miss 53 23 21 33 22 24 97 79 176
Table 4.14: Do you take part in community activities such as scouts, rec. teams, youth clubs, etc.?
RESPONSE 6th 7th 8th 9th 10th 11th 6-8th 9-12th TOTAL
Never 62.7 60.4 58.6 54.5 53.8 50.7 60.6 53.2 57.3 -
Seldom 8.4 11.8 13.7 15.3 14.2 15.2 11.3 14.9 12.9 -
Sometimes 10.1 11.1 12.1 12.5 14.1 14.9 11.1 13.6 12.2 -
Often 6.7 6.7 7.2 7.9 8.7 8.6 6.9 8.3 7.5 -
A Lot 12.2 10.0 8.4 9.8 9.3 10.6 10.2 9.9 10.1 -
N of Valid 2089 2030 2056 2040 1466 1368 6175 4874 11049
N of Miss 90 51 28 36 33 30 169 99 268
Table 4.15: Do you attend church, synagogue, etc.?
RESPONSE 6th 7th 8th 9th 10th 11th 6-8th 9-12th TOTAL
Never 15.6 13.8 16.8 18.5 21.4 19.7 15.4 19.7 17.3 -
Seldom 10.5 13.8 15.9 16.9 16.1 18.0 13.3 17.0 14.9 -Sometimes 24.7 24.0 23.7 24.6 22.9 23.7 24.2 23.9 24.0 -
Often 19.4 19.6 18.7 17.9 17.2 14.7 19.2 16.8 18.2 -
A Lot 29.8 28.8 24.9 22.2 22.3 23.8 27.9 22.7 25.6 -
N of Valid 2090 2013 2017 2011 1432 1352 6120 4795 10915
N of Miss 89 68 67 65 67 46 224 178 402
Percentage Tables 156
Pride Surveys Report: 2009-10 Irving Independent Schools
Table 4.16: Do your parents talk with you about the problems of tobacco, alcohol and drug use?
RESPONSE 6th 7th 8th 9th 10th 11th 6-8th 9-12th TOTAL
Never 16.9 14.9 16.5 18.0 21.6 19.6 16.1 19.6 17.6 -

8/7/2019 DALLAS COUNTY - Irving ISD - 2010 Pride Survey
http://slidepdf.com/reader/full/dallas-county-irving-isd-2010-pride-survey 157/239
Seldom 10.7 14.9 18.1 19.1 19.9 18.9 14.5 19.3 16.6 -
Sometimes 25.7 25.5 28.7 27.6 26.4 26.9 26.6 27.0 26.8 -
Often 20.1 19.4 17.3 18.0 16.4 18.1 19.0 17.5 18.3 -
A Lot 26.5 25.3 19.3 17.2 15.7 16.5 23.7 16.5 20.6 -N of Valid 2143 2054 2061 2039 1472 1373 6258 4884 11142
N of Miss 36 27 23 37 27 25 86 89 175
Table 4.17: Do your teachers talk with you about the problems of tobacco, alcohol and drug use?
RESPONSE 6th 7th 8th 9th 10th 11th 6-8th 9-12th TOTAL
Never 19.6 18.8 18.4 18.8 24.1 23.2 18.9 21.6 20.1 -
Seldom 14.9 20.0 22.2 24.5 25.2 26.8 19.0 25.3 21.8 -
Sometimes 29.4 30.6 31.8 33.3 29.5 30.5 30.6 31.4 30.9 -
Often 18.4 18.3 17.1 15.0 13.3 12.1 17.9 13.7 16.1 -
A Lot 17.7 12.3 10.5 8.4 7.9 7.4 13.6 8.0 11.1 -
N of Valid 2122 2045 2061 2038 1471 1374 6228 4883 11111
N of Miss 57 36 23 38 28 24 116 90 206
Table 4.18: Have you skipped school without your parents’ permission in the past year?
RESPONSE 6th 7th 8th 9th 10th 11th 6-8th 9-12th TOTAL
Never 89.0 83.4 76.5 63.0 59.5 57.8 83.1 60.5 73.2 -
Seldom 4.4 7.4 8.8 11.8 14.3 15.6 6.8 13.6 9.8 -Sometimes 3.2 4.5 8.6 13.8 13.5 14.6 5.4 14.0 9.1 -
Often 0.8 2.3 2.4 5.2 4.8 5.2 1.8 5.1 3.2 -
A Lot 2.6 2.3 3.7 6.3 7.9 6.8 2.9 6.9 4.7 -
N of Valid 2145 2060 2064 2044 1469 1374 6269 4887 11156
N of Miss 34 21 20 32 30 24 75 86 161
Percentage Tables 157
Pride Surveys Report: 2009-10 Irving Independent Schools
Table 4.19: Does your school set clear rules on using drugs at school?
RESPONSE 6th 7th 8th 9th 10th 11th 6-8th 9-12th TOTAL
Never 6.6 6.7 7.1 8.3 10.9 9.0 6.8 9.3 7.9 -

8/7/2019 DALLAS COUNTY - Irving ISD - 2010 Pride Survey
http://slidepdf.com/reader/full/dallas-county-irving-isd-2010-pride-survey 158/239
Seldom 3.5 6.8 8.5 10.2 9.8 11.4 6.3 10.4 8.1 -
Sometimes 7.8 10.5 14.2 19.0 19.2 18.7 10.8 19.0 14.4 -
Often 13.7 18.2 20.2 22.7 23.0 22.2 17.3 22.7 19.7 -
A Lot 68.3 57.8 50.0 39.7 37.0 38.7 58.8 38.6 49.9 -N of Valid 2090 2033 2033 2028 1471 1367 6156 4866 11022
N of Miss 89 48 51 48 28 31 188 107 295
Table 4.20: Does your school set clear rules on bullying or threatening other students at school?
RESPONSE 6th 7th 8th 9th 10th 11th 6-8th 9-12th TOTAL
Never 4.3 5.1 6.6 12.0 14.9 14.2 5.3 13.5 8.9 -
Seldom 2.9 6.2 8.0 15.4 17.0 17.5 5.7 16.5 10.4 -
Sometimes 7.7 12.5 15.7 23.7 24.2 25.2 11.9 24.3 17.3 -
Often 16.0 20.3 23.0 21.6 19.0 19.8 19.7 20.3 20.0 -
A Lot 69.1 56.0 46.7 27.4 24.8 23.3 57.4 25.4 43.4 -
N of Valid 2104 2040 2039 2024 1456 1363 6183 4843 11026
N of Miss 75 41 45 52 43 35 161 130 291
Table 4.21: Do your parents set clear rules for you?
RESPONSE 6th 7th 8th 9th 10th 11th 6-8th 9-12th TOTAL
Never 4.3 4.8 5.5 5.8 7.6 6.0 4.8 6.4 5.5 -
Seldom 4.4 6.7 7.9 9.3 8.0 7.9 6.3 8.5 7.3 -Sometimes 15.0 16.5 21.5 22.2 21.9 21.0 17.6 21.7 19.4 -
Often 19.3 22.1 23.9 22.5 23.7 25.1 21.7 23.6 22.6 -
A Lot 56.9 50.0 41.3 40.2 38.8 40.1 49.5 39.7 45.2 -
N of Valid 2122 2054 2053 2024 1462 1360 6229 4846 11075
N of Miss 57 27 31 52 37 38 115 127 242
Percentage Tables 158
Pride Surveys Report: 2009-10 Irving Independent Schools
Table 4.22: Do your parents punish you when you break the rules?
RESPONSE 6th 7th 8th 9th 10th 11th 6-8th 9-12th TOTAL
Never 8.8 8.5 10.9 12.3 14.5 11.4 9.4 12.7 10.9 -
S

8/7/2019 DALLAS COUNTY - Irving ISD - 2010 Pride Survey
http://slidepdf.com/reader/full/dallas-county-irving-isd-2010-pride-survey 159/239
Seldom 12.6 15.0 16.7 18.3 15.9 17.5 14.7 17.4 15.9 -
Sometimes 32.8 31.3 31.4 29.5 29.1 30.8 31.8 29.7 30.9 -
Often 21.7 23.9 21.3 23.6 23.3 23.5 22.3 23.5 22.8 -
A Lot 24.1 21.3 19.7 16.2 17.3 16.8 21.7 16.7 19.5 -N of Valid 2128 2050 2059 2022 1449 1360 6237 4831 11068
N of Miss 51 31 25 54 50 38 107 142 249
Table 4.23: Have you been in trouble with the police?
RESPONSE 6th 7th 8th 9th 10th 11th 6-8th 9-12th TOTAL
Never 75.9 68.0 59.0 57.5 61.1 64.2 67.7 60.5 64.6 -
Seldom 12.3 18.5 23.2 22.7 20.9 20.6 17.9 21.6 19.5 -
Sometimes 6.6 8.3 11.2 11.2 9.6 9.8 8.7 10.3 9.4 -
Often 2.0 2.6 3.3 4.3 3.5 2.7 2.6 3.6 3.1 -
A Lot 3.2 2.6 3.3 4.3 5.0 2.7 3.0 4.0 3.5 -
N of Valid 2137 2054 2056 2023 1453 1355 6247 4831 11078
N of Miss 42 27 28 53 46 43 97 142 239
Table 4.24: Do you take part in gang activities?
RESPONSE 6th 7th 8th 9th 10th 11th 6-8th 9-12th TOTAL
Never 89.3 87.2 84.0 84.7 85.4 89.5 86.9 86.3 86.6 -
Seldom 4.4 6.2 7.0 5.7 5.0 4.5 5.9 5.2 5.6 -Sometimes 3.3 2.9 4.4 4.2 3.7 2.2 3.5 3.5 3.5 -
Often 0.9 1.7 1.9 1.8 1.5 1.1 1.5 1.5 1.5 -
A Lot 2.0 2.0 2.7 3.5 4.4 2.7 2.3 3.5 2.8 -
N of Valid 2105 2041 2038 2013 1447 1360 6184 4820 11004
N of Miss 74 40 46 63 52 38 160 153 313
Percentage Tables 159

8/7/2019 DALLAS COUNTY - Irving ISD - 2010 Pride Survey
http://slidepdf.com/reader/full/dallas-county-irving-isd-2010-pride-survey 160/239
Pride Surveys Report: 2009-10 Irving Independent Schools
Table 4.28: Do your friends use marijuana (pot, hash, etc.)?
RESPONSE 6th 7th 8th 9th 10th 11th 6-8th 9-12th TOTAL
Never 84.2 67.1 48.5 37.6 32.9 31.4 66.8 34.4 52.6 -
S ld 4 2 10 2 12 1 13 3 12 3 15 2 8 8 13 6 10 9

8/7/2019 DALLAS COUNTY - Irving ISD - 2010 Pride Survey
http://slidepdf.com/reader/full/dallas-county-irving-isd-2010-pride-survey 161/239
Seldom 4.2 10.2 12.1 13.3 12.3 15.2 8.8 13.6 10.9 -
Sometimes 5.1 8.3 13.0 18.6 19.7 21.3 8.8 19.7 13.6 -
Often 2.3 5.8 10.8 11.6 12.8 12.4 6.3 12.2 8.9 -
A Lot 4.2 8.5 15.4 18.8 22.2 19.7 9.3 20.1 14.1 -N of Valid 2076 2015 2001 2000 1444 1332 6092 4776 10868
N of Miss 103 66 83 76 55 66 252 197 449
Table 4.29: Have you had 5 or more glasses of beer, coolers, breezers or liquor within a few hours?
RESPONSE 6th 7th 8th 9th 10th 11th 6-8th 9-12th TOTAL
Never 90.6 86.7 76.2 73.6 69.9 70.4 84.6 71.6 78.9 -
Seldom 3.9 5.4 9.4 9.7 9.4 10.3 6.2 9.8 7.8 -
Sometimes 2.3 4.1 7.0 7.1 9.5 9.5 4.4 8.5 6.2 -
Often 1.0 1.6 3.1 4.0 4.1 4.3 1.9 4.1 2.9 -
A Lot 2.2 2.2 4.2 5.7 7.1 5.5 2.9 6.1 4.2 -
N of Valid 2115 2049 2043 2017 1439 1352 6207 4808 11015
N of Miss 64 32 41 59 60 46 137 165 302
Table 4.30: Does your school ask any students to take a drug test?
RESPONSE 6th 7th 8th 9th 10th 11th 6-8th 9-12th TOTAL
Yes 15.7 13.8 13.8 29.3 33.4 33.2 14.4 31.6 22.1 -
No 84.3 86.2 86.2 70.7 66.6 66.8 85.6 68.4 77.9 -N of Valid 1986 1954 2002 1972 1417 1336 5942 4725 10667
N of Miss 193 127 82 104 82 62 402 248 650
Percentage Tables 161
Pride Surveys Report: 2009-10 Irving Independent Schools
Table 4.31: Do you think that you are overweight?
RESPONSE 6th 7th 8th 9th 10th 11th 6-8th 9-12th TOTAL
Yes 29.2 28.9 28.8 28.7 28.9 30.9 28.9 29.4 29.1 -
No 70 8 71 1 71 2 71 3 71 1 69 1 71 1 70 6 70 9

8/7/2019 DALLAS COUNTY - Irving ISD - 2010 Pride Survey
http://slidepdf.com/reader/full/dallas-county-irving-isd-2010-pride-survey 162/239
No 70.8 71.1 71.2 71.3 71.1 69.1 71.1 70.6 70.9 -
N of Valid 2088 2029 2044 2010 1444 1354 6161 4808 10969
N of Miss 91 52 40 66 55 44 183 165 348
Table 4.32: Has a doctor told you that you are overweight?
RESPONSE 6th 7th 8th 9th 10th 11th 6-8th 9-12th TOTAL
Yes 14.5 13.5 13.1 14.8 14.3 15.8 13.7 14.9 14.2 -
No 85.5 86.5 86.9 85.2 85.7 84.2 86.3 85.1 85.8 -
N of Valid 2083 2024 2042 2006 1440 1348 6149 4794 10943
N of Miss 96 57 42 70 59 50 195 179 374
Table 4.33: Have you bought or sold drugs AT school?
RESPONSE 6th 7th 8th 9th 10th 11th 6-8th 9-12th TOTAL
Yes 3.2 3.6 7.0 10.7 13.8 10.9 4.6 11.7 7.7 -
No 96.8 96.4 93.0 89.3 86.2 89.1 95.4 88.3 92.3 -
N of Valid 2099 2028 2033 2006 1432 1346 6160 4784 10944
N of Miss 80 53 51 70 67 52 184 189 373
Table 4.34: Have you bought or sold drugs when NOT at school?
RESPONSE 6th 7th 8th 9th 10th 11th 6-8th 9-12th TOTAL
Yes 4.4 7.7 13.9 15.1 19.7 18.9 8.6 17.5 12.5 -
No 95.6 92.3 86.1 84.9 80.3 81.1 91.4 82.5 87.5 -
N of Valid 2078 2020 2014 1972 1432 1342 6112 4746 10858
N of Miss 101 61 70 104 67 56 232 227 459
Percentage Tables 162

8/7/2019 DALLAS COUNTY - Irving ISD - 2010 Pride Survey
http://slidepdf.com/reader/full/dallas-county-irving-isd-2010-pride-survey 163/239
Pride Surveys Report: 2009-10 Irving Independent Schools
4.3 Within The Past Year How Often Have You...
Table 4.36: Within the past year how often have you smoked cigarettes?

8/7/2019 DALLAS COUNTY - Irving ISD - 2010 Pride Survey
http://slidepdf.com/reader/full/dallas-county-irving-isd-2010-pride-survey 164/239
RESPONSE 6th 7th 8th 9th 10th 11th 6-8th 9-12th TOTAL
Do not use 91.7 84.9 77.4 78.0 74.5 75.4 84.8 76.2 81.1 -
Once/year 3.6 7.9 9.2 7.5 7.7 8.6 6.9 7.9 7.3 -
6 times/year 0.8 1.6 3.1 2.7 2.8 3.5 1.8 3.0 2.3 -
Once/month 0.9 0.9 2.1 1.9 1.8 2.1 1.3 1.9 1.6 -
Twice/month 0.4 1.0 1.6 1.6 2.2 1.3 1.0 1.7 1.3 -
Once/week 0.6 1.8 2.5 1.9 2.1 1.6 1.6 1.9 1.7 -
3 times/week 0.6 1.1 2.3 2.6 2.4 2.3 1.3 2.4 1.8 -
Every day 1.4 0.7 1.8 3.7 6.5 5.2 1.3 5.0 2.9 -
N of Valid 2128 2039 2035 2008 1440 1342 6202 4790 10992
N of Miss 51 42 49 68 59 56 142 183 325
Table 4.37: Within the past year how often have you used smokeless tobacco?
RESPONSE 6th 7th 8th 9th 10th 11th 6-8th 9-12th TOTAL
Do not use 97.1 96.0 94.4 93.4 91.0 93.5 95.9 92.7 94.5 -
Once/year 0.7 1.8 2.0 1.8 2.4 1.6 1.5 1.9 1.7 -
6 times/year 0.2 0.2 0.5 0.7 0.8 0.6 0.3 0.7 0.5 -
Once/month 0.3 0.5 0.7 0.8 0.5 0.4 0.5 0.6 0.5 -
Twice/month 0.2 0.1 0.3 0.4 0.4 0.4 0.2 0.4 0.3 -
Once/week 0.2 0.6 0.6 0.5 0.8 0.7 0.5 0.6 0.5 -
3 times/week 0.1 0.2 0.4 0.6 0.8 1.0 0.3 0.8 0.5 -
Every day 1.1 0.5 1.0 1.6 3.3 1.8 0.9 2.1 1.4 -N of Valid 2124 2043 2043 2002 1446 1346 6210 4794 11004
N of Miss 55 38 41 74 53 52 134 179 313
Percentage Tables 164
Pride Surveys Report: 2009-10 Irving Independent Schools
Table 4.38: Within the past year how often have you smoked cigars?
RESPONSE 6th 7th 8th 9th 10th 11th 6-8th 9-12th TOTAL
Do not use 94.3 90.5 85.5 84.9 82.9 86.3 90.2 84.7 87.8 -
Once/year 2 7 5 3 5 8 5 3 5 2 5 0 4 6 5 2 4 8 -

8/7/2019 DALLAS COUNTY - Irving ISD - 2010 Pride Survey
http://slidepdf.com/reader/full/dallas-county-irving-isd-2010-pride-survey 165/239
Once/year 2.7 5.3 5.8 5.3 5.2 5.0 4.6 5.2 4.8 -
6 times/year 0.2 0.9 1.9 1.8 2.4 1.9 1.0 2.0 1.4 -
Once/month 0.5 0.5 1.4 1.8 1.7 1.1 0.8 1.5 1.1 -
Twice/month 0.3 0.6 1.3 1.3 1.2 1.0 0.7 1.2 0.9 -Once/week 0.4 0.9 1.7 1.4 1.5 1.5 1.0 1.5 1.2 -
3 times/week 0.3 0.4 1.2 1.6 1.3 1.2 0.7 1.4 1.0 -
Every day 1.2 0.7 1.2 2.1 3.8 1.9 1.1 2.6 1.7 -
N of Valid 2119 2033 2028 1997 1436 1342 6180 4775 10955
N of Miss 60 48 56 79 63 56 164 198 362
Table 4.39: Within the past year how often have you drunk beer?
RESPONSE 6th 7th 8th 9th 10th 11th 6-8th 9-12th TOTAL
Do not use 80.7 72.7 59.7 60.1 55.8 54.4 71.2 57.2 65.1 -
Once/year 12.1 14.3 16.9 14.7 13.9 14.4 14.4 14.4 14.4 -
6 times/year 2.6 4.5 7.2 7.2 7.6 8.9 4.7 7.8 6.1 -
Once/month 0.7 2.2 4.5 5.1 4.9 5.2 2.4 5.1 3.6 -
Twice/month 0.7 2.0 4.6 3.0 5.4 6.6 2.4 4.8 3.4 -
Once/week 1.1 1.9 4.1 4.6 6.1 5.8 2.4 5.4 3.7 -
3 times/week 0.5 1.2 1.8 2.6 2.9 2.7 1.2 2.7 1.8 -
Every day 1.6 1.2 1.2 2.5 3.3 2.0 1.3 2.6 1.9 -
N of Valid 2128 2035 2033 2002 1437 1338 6196 4777 10973
N of Miss 51 46 51 74 62 60 148 196 344
Percentage Tables 165
Pride Surveys Report: 2009-10 Irving Independent Schools
Table 4.40: Within the past year how often have you drunk coolers, breezers, etc.?
RESPONSE 6th 7th 8th 9th 10th 11th 6-8th 9-12th TOTAL
Do not use 86.2 76.7 65.2 65.1 59.4 56.8 76.2 61.0 69.6 -
Once/year 7 7 11 9 14 5 13 1 13 7 14 1 11 3 13 5 12 3 -

8/7/2019 DALLAS COUNTY - Irving ISD - 2010 Pride Survey
http://slidepdf.com/reader/full/dallas-county-irving-isd-2010-pride-survey 166/239
Once/year 7.7 11.9 14.5 13.1 13.7 14.1 11.3 13.5 12.3
6 times/year 1.9 4.2 6.4 6.4 8.2 9.2 4.1 7.7 5.7 -
Once/month 0.7 1.8 4.4 4.8 4.0 5.8 2.3 4.8 3.4 -
Twice/month 0.4 1.7 3.9 3.3 5.4 6.2 2.0 4.7 3.2 -Once/week 0.9 1.6 2.7 2.9 3.8 3.7 1.7 3.4 2.5 -
3 times/week 0.5 1.0 1.4 2.3 1.9 2.2 1.0 2.1 1.5 -
Every day 1.8 1.1 1.5 2.2 3.7 2.1 1.5 2.6 2.0 -
N of Valid 2104 2036 2030 1992 1442 1344 6170 4778 10948
N of Miss 75 45 54 84 57 54 174 195 369
Table 4.41: Within the past year how often have you drunk liquor?
RESPONSE 6th 7th 8th 9th 10th 11th 6-8th 9-12th TOTAL
Do not use 87.9 79.0 66.3 64.6 56.5 54.2 77.9 59.2 69.8 -
Once/year 7.1 12.1 16.1 13.5 14.0 14.8 11.7 14.0 12.7 -
6 times/year 1.4 3.2 5.5 5.7 7.2 9.7 3.3 7.3 5.0 -
Once/month 1.0 1.5 3.3 4.1 4.5 6.6 1.9 4.9 3.2 -
Twice/month 0.4 1.3 3.4 3.8 6.2 5.7 1.7 5.1 3.2 -
Once/week 0.5 1.0 3.0 3.2 5.1 4.5 1.5 4.1 2.6 -
3 times/week 0.3 0.7 1.2 2.6 2.7 2.2 0.7 2.5 1.5 -
Every day 1.4 1.1 1.3 2.6 3.8 2.4 1.3 2.9 2.0 -
N of Valid 2123 2035 2031 1997 1444 1345 6189 4786 10975
N of Miss 56 46 53 79 55 53 155 187 342
Percentage Tables 166
Pride Surveys Report: 2009-10 Irving Independent Schools
Table 4.42: Within the past year how often have you smoked marijuana?
RESPONSE 6th 7th 8th 9th 10th 11th 6-8th 9-12th TOTAL
Do not use 94.0 88.8 79.6 75.3 70.8 73.3 87.6 73.4 81.4 -
Once/year 2 4 2 9 5 5 5 4 5 5 6 6 3 6 5 8 4 5 -

8/7/2019 DALLAS COUNTY - Irving ISD - 2010 Pride Survey
http://slidepdf.com/reader/full/dallas-county-irving-isd-2010-pride-survey 167/239
Once/year 2.4 2.9 5.5 5.4 5.5 6.6 3.6 5.8 4.5
6 times/year 0.4 1.1 1.7 2.4 2.9 3.4 1.1 2.8 1.8 -
Once/month 0.6 1.2 2.2 2.9 2.2 2.1 1.3 2.5 1.8 -
Twice/month 0.4 1.3 2.2 1.8 3.4 2.8 1.3 2.6 1.8 -Once/week 0.4 1.1 2.9 2.8 3.0 2.7 1.4 2.9 2.1 -
3 times/week 0.4 1.9 2.6 3.8 4.6 3.7 1.6 4.0 2.7 -
Every day 1.5 1.7 3.3 5.3 7.6 5.5 2.2 6.1 3.9 -
N of Valid 2120 2034 2032 2003 1443 1339 6186 4785 10971
N of Miss 59 47 52 73 56 59 158 188 346
Table 4.43: Within the past year how often have you used cocaine?
RESPONSE 6th 7th 8th 9th 10th 11th 6-8th 9-12th TOTAL
Do not use 96.9 96.4 94.2 92.4 89.7 92.1 95.8 91.5 94.0 -
Once/year 1.2 1.7 2.0 2.2 2.2 2.5 1.6 2.3 1.9 -
6 times/year 0.2 0.2 0.7 0.6 1.0 0.6 0.4 0.7 0.5 -
Once/month 0.2 0.3 0.5 1.0 1.2 1.0 0.3 1.0 0.6 -
Twice/month 0.0 0.2 0.4 0.7 1.2 0.7 0.2 0.8 0.5 -
Once/week 0.0 0.3 0.6 0.9 0.9 0.7 0.3 0.8 0.5 -
3 times/week 0.1 0.4 0.7 0.9 0.8 0.8 0.4 0.8 0.6 -
Every day 1.2 0.5 0.9 1.5 3.0 1.6 0.9 1.9 1.3 -
N of Valid 2124 2037 2035 1997 1442 1342 6196 4781 10977
N of Miss 55 44 49 79 57 56 148 192 340
Percentage Tables 167
Pride Surveys Report: 2009-10 Irving Independent Schools
Table 4.44: Within the past year how often have you used uppers?
RESPONSE 6th 7th 8th 9th 10th 11th 6-8th 9-12th TOTAL
Do not use 97.6 96.9 95.1 92.9 90.1 92.6 96.6 92.0 94.6 -
Once/year 0.7 1.0 1.7 1.5 2.1 1.5 1.1 1.7 1.4 -

8/7/2019 DALLAS COUNTY - Irving ISD - 2010 Pride Survey
http://slidepdf.com/reader/full/dallas-county-irving-isd-2010-pride-survey 168/239
Once/year 0.7 1.0 1.7 1.5 2.1 1.5 1.1 1.7 1.4
6 times/year 0.2 0.3 0.6 0.8 1.2 0.7 0.4 0.9 0.6 -
Once/month 0.1 0.2 0.5 1.4 1.1 1.3 0.3 1.3 0.7 -
Twice/month 0.1 0.3 0.5 0.8 1.0 0.7 0.3 0.8 0.5 -Once/week 0.0 0.3 0.5 0.6 1.0 1.0 0.3 0.8 0.5 -
3 times/week 0.1 0.2 0.2 0.6 0.8 0.8 0.2 0.7 0.4 -
Every day 1.1 0.5 0.9 1.6 2.7 1.3 0.8 1.9 1.3 -
N of Valid 2085 2028 2037 1999 1440 1343 6150 4782 10932
N of Miss 94 53 47 77 59 55 194 191 385
Table 4.45: Within the past year how often have you used downers?
RESPONSE 6th 7th 8th 9th 10th 11th 6-8th 9-12th TOTAL
Do not use 97.4 96.9 95.6 92.6 90.4 92.1 96.6 91.8 94.5 -
Once/year 0.9 0.8 1.4 1.2 2.0 1.5 1.0 1.5 1.3 -
6 times/year 0.3 0.5 0.5 1.0 1.1 1.3 0.4 1.1 0.7 -
Once/month 0.1 0.2 0.3 0.8 1.2 1.0 0.2 1.0 0.5 -
Twice/month 0.0 0.2 0.3 1.0 0.9 1.0 0.2 1.0 0.6 -
Once/week 0.0 0.4 0.4 0.7 0.8 1.0 0.3 0.9 0.5 -
3 times/week 0.0 0.2 0.2 0.4 0.9 0.4 0.2 0.6 0.3 -
Every day 1.2 0.7 1.1 2.1 2.6 1.6 1.0 2.2 1.5 -
N of Valid 2078 2032 2037 2002 1440 1346 6147 4788 10935
N of Miss 101 49 47 74 59 52 197 185 382
Percentage Tables 168
Pride Surveys Report: 2009-10 Irving Independent Schools
Table 4.46: Within the past year how often have you used inhalants?
RESPONSE 6th 7th 8th 9th 10th 11th 6-8th 9-12th TOTAL
Do not use 93.1 93.4 92.6 93.6 91.8 95.3 93.0 93.5 93.2 -
Once/year 3.2 3.1 3.1 3.0 2.6 1.4 3.1 2.4 2.8 -

8/7/2019 DALLAS COUNTY - Irving ISD - 2010 Pride Survey
http://slidepdf.com/reader/full/dallas-county-irving-isd-2010-pride-survey 169/239
y
6 times/year 1.2 1.0 0.9 0.4 0.5 0.4 1.0 0.4 0.8 -
Once/month 0.4 1.0 0.6 0.4 1.0 0.5 0.7 0.6 0.6 -
Twice/month 0.4 0.3 0.5 0.6 0.4 0.7 0.4 0.6 0.5 -Once/week 0.0 0.3 0.7 0.3 0.6 0.0 0.3 0.3 0.3 -
3 times/week 0.3 0.1 0.3 0.5 0.6 0.4 0.3 0.5 0.3 -
Every day 1.5 0.7 1.2 1.3 2.6 1.2 1.2 1.7 1.4 -
N of Valid 2085 2031 2037 1999 1439 1346 6153 4784 10937
N of Miss 94 50 47 77 60 52 191 189 380
Table 4.47: Within the past year how often have you used hallucinogens?
RESPONSE 6th 7th 8th 9th 10th 11th 6-8th 9-12th TOTAL
Do not use 97.8 97.9 96.8 94.8 91.8 93.9 97.5 93.6 95.8 -
Once/year 0.6 0.8 0.8 1.2 1.5 1.5 0.7 1.4 1.0 -
6 times/year 0.2 0.2 0.4 0.6 0.9 0.5 0.3 0.6 0.4 -
Once/month 0.1 0.1 0.2 0.7 1.0 0.7 0.2 0.8 0.4 -
Twice/month 0.0 0.1 0.2 0.3 0.6 1.0 0.1 0.6 0.3 -
Once/week 0.0 0.3 0.5 0.6 0.9 0.6 0.3 0.7 0.5 -
3 times/week 0.0 0.2 0.2 0.4 0.6 0.3 0.2 0.4 0.3 -
Every day 1.2 0.3 0.8 1.4 2.6 1.5 0.8 1.8 1.2 -
N of Valid 2063 2029 2033 2000 1442 1345 6125 4787 10912
N of Miss 116 52 51 76 57 53 219 186 405
Percentage Tables 169
Pride Surveys Report: 2009-10 Irving Independent Schools
Table 4.48: Within the past year how often have you used heroin?
RESPONSE 6th 7th 8th 9th 10th 11th 6-8th 9-12th TOTAL
Do not use 97.4 97.6 96.0 94.9 92.6 95.5 97.0 94.4 95.9 -
Once/year 0.8 1.2 0.8 1.0 1.7 1.0 0.9 1.3 1.1 -

8/7/2019 DALLAS COUNTY - Irving ISD - 2010 Pride Survey
http://slidepdf.com/reader/full/dallas-county-irving-isd-2010-pride-survey 170/239
y
6 times/year 0.2 0.1 0.6 0.5 0.6 0.6 0.3 0.6 0.4 -
Once/month 0.2 0.1 0.5 0.6 0.6 0.2 0.3 0.5 0.4 -
Twice/month 0.1 0.1 0.2 0.5 0.4 0.3 0.1 0.4 0.3 -Once/week 0.1 0.1 0.4 0.4 0.7 0.4 0.2 0.5 0.3 -
3 times/week 0.1 0.3 0.4 0.3 0.8 0.7 0.3 0.6 0.4 -
Every day 1.1 0.4 0.9 1.5 2.6 1.3 0.8 1.8 1.2 -
N of Valid 2077 2033 2037 2002 1440 1344 6147 4786 10933
N of Miss 102 48 47 74 59 54 197 187 384
Table 4.49: Within the past year how often have you used anabolic steroids?
RESPONSE 6th 7th 8th 9th 10th 11th 6-8th 9-12th TOTAL
Do not use 97.3 98.2 97.5 96.9 94.8 96.6 97.6 96.2 97.0 -
Once/year 0.8 0.8 0.6 0.5 0.8 0.3 0.8 0.5 0.7 -
6 times/year 0.3 0.1 0.2 0.2 0.8 0.1 0.2 0.4 0.3 -
Once/month 0.1 0.1 0.4 0.2 0.2 0.4 0.2 0.3 0.2 -
Twice/month 0.2 0.1 0.1 0.2 0.2 0.4 0.1 0.3 0.2 -
Once/week 0.0 0.0 0.2 0.1 0.4 0.1 0.1 0.2 0.2 -
3 times/week 0.1 0.1 0.0 0.2 0.5 0.5 0.1 0.4 0.2 -
Every day 1.1 0.3 0.9 1.5 2.4 1.5 0.8 1.8 1.2 -
N of Valid 2096 2029 2042 2002 1441 1344 6167 4787 10954
N of Miss 83 52 42 74 58 54 177 186 363
Percentage Tables 170
Pride Surveys Report: 2009-10 Irving Independent Schools
Table 4.50: Within the past year how often have you used ecstasy?
RESPONSE 6th 7th 8th 9th 10th 11th 6-8th 9-12th TOTAL
Do not use 98.0 97.7 95.1 92.6 89.0 91.1 96.9 91.1 94.4 -
Once/year 0.4 0.9 2.2 2.1 2.5 1.9 1.2 2.2 1.6 -

8/7/2019 DALLAS COUNTY - Irving ISD - 2010 Pride Survey
http://slidepdf.com/reader/full/dallas-county-irving-isd-2010-pride-survey 171/239
y
6 times/year 0.1 0.1 0.3 1.0 1.7 1.7 0.2 1.4 0.7 -
Once/month 0.1 0.3 0.4 0.7 1.4 1.3 0.3 1.1 0.6 -
Twice/month 0.0 0.1 0.3 0.6 1.1 1.0 0.2 0.8 0.5 -Once/week 0.0 0.2 0.5 1.0 0.9 0.9 0.3 0.9 0.6 -
3 times/week 0.1 0.0 0.3 0.8 0.6 0.6 0.2 0.7 0.4 -
Every day 1.2 0.5 0.8 1.4 2.8 1.6 0.8 1.8 1.3 -
N of Valid 2055 2021 2028 1997 1441 1343 6104 4781 10885
N of Miss 124 60 56 79 58 55 240 192 432
Table 4.51: Within the past year how often have you used meth?
RESPONSE 6th 7th 8th 9th 10th 11th 6-8th 9-12th TOTAL
Do not use 96.4 96.5 95.2 95.0 93.7 95.3 96.0 94.7 95.4 -
Once/year 1.6 1.9 2.0 1.2 1.3 1.3 1.8 1.3 1.6 -
6 times/year 0.2 0.3 0.4 0.6 0.6 0.4 0.3 0.5 0.4 -
Once/month 0.1 0.1 0.4 0.5 0.7 0.4 0.2 0.5 0.4 -
Twice/month 0.0 0.1 0.1 0.4 0.2 0.4 0.1 0.3 0.2 -
Once/week 0.0 0.2 0.5 0.4 0.6 0.2 0.3 0.4 0.3 -
3 times/week 0.1 0.3 0.2 0.3 0.3 0.4 0.2 0.3 0.3 -
Every day 1.4 0.4 1.1 1.7 2.5 1.6 1.0 1.9 1.4 -
N of Valid 2058 2021 2023 1987 1436 1340 6102 4763 10865
N of Miss 121 60 61 89 63 58 242 210 452
Percentage Tables 171
Pride Surveys Report: 2009-10 Irving Independent Schools
Table 4.52: Within the past year how often have you used prescription drugs?
RESPONSE 6th 7th 8th 9th 10th 11th 6-8th 9-12th TOTAL
Do not use 95.9 95.4 93.9 92.0 88.9 90.5 95.1 90.6 93.1 -
Once/year 1.5 1.9 2.2 1.9 2.5 2.2 1.9 2.2 2.0 -

8/7/2019 DALLAS COUNTY - Irving ISD - 2010 Pride Survey
http://slidepdf.com/reader/full/dallas-county-irving-isd-2010-pride-survey 172/239
6 times/year 0.3 0.4 0.6 1.3 1.7 1.7 0.5 1.5 0.9 -
Once/month 0.4 0.2 0.6 0.9 1.0 0.7 0.4 0.9 0.6 -
Twice/month 0.2 0.4 0.6 1.1 0.9 1.3 0.4 1.1 0.7 -Once/week 0.2 0.3 0.6 0.7 1.4 1.1 0.4 1.0 0.6 -
3 times/week 0.2 0.6 0.4 0.7 0.8 0.7 0.4 0.7 0.5 -
Every day 1.2 0.7 1.1 1.6 2.8 1.8 1.0 2.0 1.4 -
N of Valid 2094 2030 2038 1991 1442 1345 6162 4778 10940
N of Miss 85 51 46 85 57 53 182 195 377
Table 4.53: Within the past year how often have you used pain killers?
RESPONSE 6th 7th 8th 9th 10th 11th 6-8th 9-12th TOTAL
Do not use 96.5 96.6 94.3 91.4 88.6 90.1 95.8 90.2 93.4 -
Once/year 1.3 1.1 2.2 2.2 2.4 2.1 1.5 2.2 1.8 -
6 times/year 0.2 0.3 0.4 1.1 2.3 1.6 0.3 1.6 0.9 -
Once/month 0.3 0.2 0.9 1.0 1.0 1.1 0.5 1.0 0.7 -
Twice/month 0.1 0.1 0.2 1.0 1.3 1.3 0.2 1.1 0.6 -
Once/week 0.1 0.3 0.6 1.2 1.1 1.3 0.4 1.2 0.7 -
3 times/week 0.2 0.4 0.3 0.8 0.6 0.7 0.3 0.7 0.5 -
Every day 1.2 0.7 1.1 1.5 2.6 1.7 1.0 1.9 1.4 -
N of Valid 2093 2028 2037 1989 1435 1346 6158 4770 10928
N of Miss 86 53 47 87 64 52 186 203 389
Percentage Tables 172
Pride Surveys Report: 2009-10 Irving Independent Schools
Table 4.54: Within the past year how often have you used over-the-counter drugs?
RESPONSE 6th 7th 8th 9th 10th 11th 6-8th 9-12th TOTAL
Do not use 95.8 94.9 93.4 92.3 89.9 91.7 94.7 91.4 93.3 -
Once/year 1.6 2.3 2.5 2.3 2.2 1.7 2.1 2.1 2.1 -
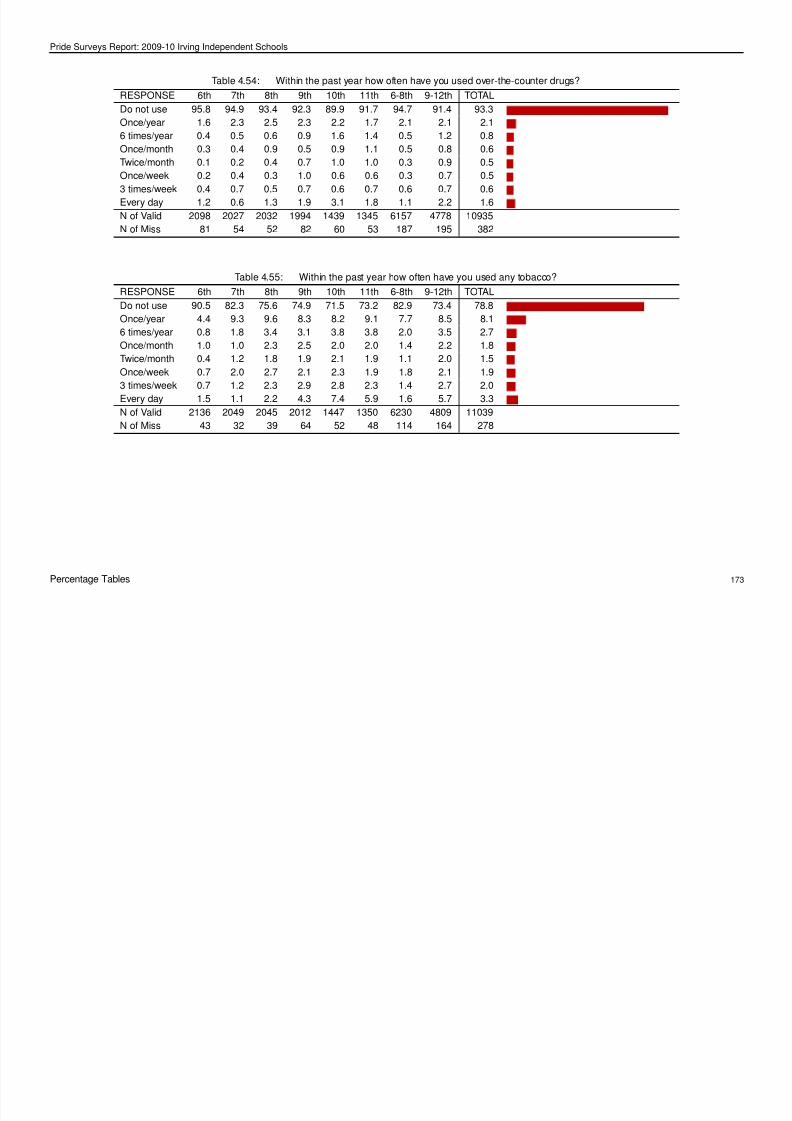
8/7/2019 DALLAS COUNTY - Irving ISD - 2010 Pride Survey
http://slidepdf.com/reader/full/dallas-county-irving-isd-2010-pride-survey 173/239
6 times/year 0.4 0.5 0.6 0.9 1.6 1.4 0.5 1.2 0.8 -
Once/month 0.3 0.4 0.9 0.5 0.9 1.1 0.5 0.8 0.6 -
Twice/month 0.1 0.2 0.4 0.7 1.0 1.0 0.3 0.9 0.5 -Once/week 0.2 0.4 0.3 1.0 0.6 0.6 0.3 0.7 0.5 -
3 times/week 0.4 0.7 0.5 0.7 0.6 0.7 0.6 0.7 0.6 -
Every day 1.2 0.6 1.3 1.9 3.1 1.8 1.1 2.2 1.6 -
N of Valid 2098 2027 2032 1994 1439 1345 6157 4778 10935
N of Miss 81 54 52 82 60 53 187 195 382
Table 4.55: Within the past year how often have you used any tobacco?
RESPONSE 6th 7th 8th 9th 10th 11th 6-8th 9-12th TOTAL
Do not use 90.5 82.3 75.6 74.9 71.5 73.2 82.9 73.4 78.8 -
Once/year 4.4 9.3 9.6 8.3 8.2 9.1 7.7 8.5 8.1 -
6 times/year 0.8 1.8 3.4 3.1 3.8 3.8 2.0 3.5 2.7 -
Once/month 1.0 1.0 2.3 2.5 2.0 2.0 1.4 2.2 1.8 -
Twice/month 0.4 1.2 1.8 1.9 2.1 1.9 1.1 2.0 1.5 -
Once/week 0.7 2.0 2.7 2.1 2.3 1.9 1.8 2.1 1.9 -
3 times/week 0.7 1.2 2.3 2.9 2.8 2.3 1.4 2.7 2.0 -
Every day 1.5 1.1 2.2 4.3 7.4 5.9 1.6 5.7 3.3 -
N of Valid 2136 2049 2045 2012 1447 1350 6230 4809 11039
N of Miss 43 32 39 64 52 48 114 164 278
Percentage Tables 173
Pride Surveys Report: 2009-10 Irving Independent Schools
Table 4.56: Within the past year how often have you used any alcohol?
RESPONSE 6th 7th 8th 9th 10th 11th 6-8th 9-12th TOTAL
Do not use 75.0 64.0 50.4 50.5 44.8 42.4 63.3 46.5 56.0 -
Once/year 15.9 18.7 20.3 17.9 17.7 18.0 18.2 17.9 18.1 -

8/7/2019 DALLAS COUNTY - Irving ISD - 2010 Pride Survey
http://slidepdf.com/reader/full/dallas-county-irving-isd-2010-pride-survey 174/239
6 times/year 2.9 6.3 9.2 9.5 9.8 11.8 6.1 10.2 7.9 -
Once/month 1.0 3.0 5.5 6.2 5.7 6.4 3.1 6.1 4.4 -
Twice/month 0.8 2.6 5.3 4.4 7.0 8.2 2.9 6.2 4.4 -Once/week 1.6 2.3 4.9 4.8 6.9 7.1 2.9 6.1 4.3 -
3 times/week 0.7 1.4 2.6 3.3 3.5 3.3 1.5 3.3 2.3 -
Every day 2.2 1.7 1.8 3.4 4.6 2.8 1.9 3.6 2.6 -
N of Valid 2135 2045 2044 2011 1446 1349 6224 4806 11030
N of Miss 44 36 40 65 53 49 120 167 287
Table 4.57: Within the past year how often have you used any illicit drug?
RESPONSE 6th 7th 8th 9th 10th 11th 6-8th 9-12th TOTAL
Do not use 86.2 81.2 73.5 71.0 67.4 69.7 80.4 69.5 75.7 -
Once/year 6.2 6.7 8.4 7.2 6.2 7.5 7.1 7.0 7.0 -
6 times/year 2.0 2.3 2.5 2.9 3.0 3.7 2.3 3.1 2.7 -
Once/month 1.0 1.4 2.8 2.8 2.3 2.5 1.7 2.6 2.1 -
Twice/month 0.6 1.6 2.4 2.2 3.7 2.7 1.5 2.8 2.1 -
Once/week 0.6 1.5 3.2 3.1 3.5 3.0 1.7 3.2 2.4 -
3 times/week 0.9 2.2 2.6 4.0 4.4 4.1 1.9 4.1 2.9 -
Every day 2.6 2.9 4.6 6.9 9.5 6.8 3.4 7.7 5.2 -
N of Valid 2133 2046 2047 2012 1446 1351 6226 4809 11035
N of Miss 46 35 37 64 53 47 118 164 282
Percentage Tables 174
Pride Surveys Report: 2009-10 Irving Independent Schools
4.4 What Effect Do You Most Often Get When You Use
Table 4.58: What effect do you most often get when you drink beer?
RESPONSE 6th 7th 8th 9th 10th 11th 6 8th 9 12th TOTAL

8/7/2019 DALLAS COUNTY - Irving ISD - 2010 Pride Survey
http://slidepdf.com/reader/full/dallas-county-irving-isd-2010-pride-survey 175/239
RESPONSE 6th 7th 8th 9th 10th 11th 6-8th 9-12th TOTAL
Do Not Use 82.9 74.4 61.4 62.6 57.5 56.1 73.0 59.2 67.0 -
No High 10.1 16.3 21.5 19.1 16.9 20.0 15.9 18.7 17.1 -
A Little High 4.7 6.7 12.6 12.2 16.8 17.0 8.0 14.9 11.0 -
Very High 0.9 1.5 2.4 3.4 3.9 3.6 1.6 3.6 2.5 -
Bombed/Stoned 1.4 1.1 2.1 2.6 4.8 3.3 1.6 3.5 2.4 -
N of Valid 2128 2049 2051 2002 1458 1353 6228 4813 11041
N of Miss 51 32 33 74 41 45 116 160 276
Table 4.59: What effect do you most often get when you drink wine coolers?
RESPONSE 6th 7th 8th 9th 10th 11th 6-8th 9-12th TOTAL
Do Not Use 88.7 80.0 66.8 66.5 60.0 56.1 78.6 61.6 71.2 -No High 6.8 13.5 20.1 19.8 22.9 24.2 13.4 22.0 17.1 -
A Little High 2.6 5.0 9.6 9.4 11.2 14.0 5.7 11.3 8.1 -
Very High 0.5 0.8 2.1 2.3 2.3 3.3 1.1 2.6 1.8 -
Bombed/Stoned 1.3 0.7 1.5 2.0 3.5 2.4 1.2 2.6 1.8 -
N of Valid 2114 2037 2040 2005 1453 1350 6191 4808 10999
N of Miss 65 44 44 71 46 48 153 165 318
Table 4.60: What effect do you most often get when you drink liquor?
RESPONSE 6th 7th 8th 9th 10th 11th 6-8th 9-12th TOTAL
Do Not Use 89.1 79.9 67.8 64.9 57.1 54.1 79.1 59.5 70.5 -
No High 5.4 10.5 13.1 11.8 11.3 13.3 9.6 12.1 10.7 -
A Little High 2.9 5.8 11.1 11.7 13.9 14.7 6.6 13.2 9.5 -
Very High 1.0 2.3 5.0 7.3 9.5 10.6 2.8 8.9 5.5 -
Bombed/Stoned 1.6 1.4 3.0 4.2 8.1 7.3 2.0 6.3 3.9 -
N of Valid 2122 2039 2043 2002 1456 1343 6204 4801 11005
N of Miss 57 42 41 74 43 55 140 172 312
Percentage Tables 175
Pride Surveys Report: 2009-10 Irving Independent Schools
Table 4.61: What effect do you most often get when you smoke marijuana?
RESPONSE 6th 7th 8th 9th 10th 11th 6-8th 9-12th TOTAL
Do Not Use 93.0 87.9 78.3 75.2 70.8 72.0 86.5 73.0 80.6 -
No High 1.4 1.6 1.7 2.4 2.5 2.6 1.5 2.5 2.0 -

8/7/2019 DALLAS COUNTY - Irving ISD - 2010 Pride Survey
http://slidepdf.com/reader/full/dallas-county-irving-isd-2010-pride-survey 176/239
A Little High 2.2 3.7 5.5 5.6 6.0 6.1 3.8 5.9 4.7 -
Very High 1.2 3.5 6.9 7.1 8.7 8.7 3.8 8.0 5.7 -
Bombed/Stoned 2.2 3.3 7.7 9.8 12.0 10.5 4.4 10.7 7.1 -N of Valid 2123 2042 2048 1998 1452 1350 6213 4800 11013
N of Miss 56 39 36 78 47 48 131 173 304
Percentage Tables 176
Pride Surveys Report: 2009-10 Irving Independent Schools
4.5 Do You Feel The Following Are Harmful To Your Health?
Table 4.62: Do you feel that using cigarettes is harmful to your health?
RESPONSE 6th 7th 8th 9th 10th 11th 6 8th 9 12th TOTAL

8/7/2019 DALLAS COUNTY - Irving ISD - 2010 Pride Survey
http://slidepdf.com/reader/full/dallas-county-irving-isd-2010-pride-survey 177/239
RESPONSE 6th 7th 8th 9th 10th 11th 6-8th 9-12th TOTAL
No harm 18.2 15.0 13.4 14.8 15.0 11.3 15.5 13.9 14.8 -
Some harm 10.0 12.6 15.2 13.1 12.7 10.7 12.6 12.3 12.5 -
Harmful 22.5 22.4 26.4 22.8 21.6 24.9 23.7 23.0 23.4 -
Very harmful 49.4 50.1 45.0 49.4 50.7 53.1 48.2 50.8 49.3 -
N of Valid 2076 2030 2035 2013 1451 1343 6141 4807 10948
N of Miss 103 51 49 63 48 55 203 166 369
Table 4.63: Do you feel that using smokeless tobacco is harmful to your health?
RESPONSE 6th 7th 8th 9th 10th 11th 6-8th 9-12th TOTAL
No harm 20.0 16.4 14.2 15.3 15.2 12.0 16.9 14.4 15.8 -
Some harm 10.6 12.1 13.1 11.3 11.8 10.5 11.9 11.2 11.6 -Harmful 20.2 20.8 24.7 22.4 23.2 25.4 21.9 23.5 22.6 -
Very harmful 49.2 50.8 47.9 50.9 49.8 52.1 49.3 50.9 50.0 -
N of Valid 2059 2021 2033 2010 1450 1346 6113 4806 10919
N of Miss 120 60 51 66 49 52 231 167 398
Table 4.64: Do you feel that using cigars is harmful to your health?
RESPONSE 6th 7th 8th 9th 10th 11th 6-8th 9-12th TOTAL
No harm 18.1 15.8 14.5 16.0 15.4 11.7 16.1 14.6 15.4 -
Some harm 11.2 14.3 17.8 14.5 14.0 13.3 14.4 14.0 14.2 -
Harmful 22.2 22.0 25.1 23.1 24.8 26.2 23.1 24.4 23.7 -
Very harmful 48.6 47.9 42.7 46.4 45.9 48.9 46.4 46.9 46.6 -
N of Valid 2044 2019 2030 2006 1446 1342 6093 4794 10887
N of Miss 135 62 54 70 53 56 251 179 430
Percentage Tables 177
Pride Surveys Report: 2009-10 Irving Independent Schools
Table 4.65: Do you feel that using beer is harmful to your health?
RESPONSE 6th 7th 8th 9th 10th 11th 6-8th 9-12th TOTAL
No harm 21.8 21.1 20.0 18.3 20.9 13.5 20.9 17.7 19.5 -
Some harm 22.9 27.1 34.1 30.5 31.2 34.7 28.0 31.9 29.7 -
H f l 20 3 20 0 19 2 21 9 21 8 23 9 19 8 22 5 21 0

8/7/2019 DALLAS COUNTY - Irving ISD - 2010 Pride Survey
http://slidepdf.com/reader/full/dallas-county-irving-isd-2010-pride-survey 178/239
Harmful 20.3 20.0 19.2 21.9 21.8 23.9 19.8 22.5 21.0 -
Very harmful 35.1 31.8 26.7 29.3 26.0 27.8 31.2 27.9 29.8 -
N of Valid 2059 2027 2028 2005 1444 1345 6114 4794 10908N of Miss 120 54 56 71 55 53 230 179 409
Table 4.66: Do you feel that using coolers, breezers, etc. is harmful to your health?
RESPONSE 6th 7th 8th 9th 10th 11th 6-8th 9-12th TOTAL
No harm 22.9 21.7 22.7 22.6 24.9 21.2 22.4 22.9 22.6 -
Some harm 17.7 25.2 30.1 30.0 31.3 31.3 24.3 30.7 27.2 -
Harmful 20.3 18.4 18.2 18.4 19.8 22.3 19.0 19.9 19.4 -
Very harmful 39.2 34.6 29.1 29.1 24.0 25.1 34.3 26.4 30.8 -
N of Valid 2038 2012 2026 2003 1446 1347 6076 4796 10872
N of Miss 141 69 58 73 53 51 268 177 445
Table 4.67: Do you feel that using liquor is harmful to your health?
RESPONSE 6th 7th 8th 9th 10th 11th 6-8th 9-12th TOTAL
No harm 20.1 17.4 17.7 16.9 18.6 12.3 18.4 16.1 17.4 -
Some harm 12.7 19.4 25.4 24.1 25.8 26.2 19.1 25.2 21.8 -
Harmful 22.3 23.5 23.9 23.0 23.6 28.4 23.2 24.7 23.9 -
Very harmful 45.0 39.8 33.1 35.9 31.9 33.0 39.3 33.9 36.9 -N of Valid 2055 2023 2031 2007 1447 1347 6109 4801 10910
N of Miss 124 58 53 69 52 51 235 172 407
Percentage Tables 178
Pride Surveys Report: 2009-10 Irving Independent Schools
Table 4.68: Do you feel that using marijuana is harmful to your health?
RESPONSE 6th 7th 8th 9th 10th 11th 6-8th 9-12th TOTAL
No harm 18.7 16.7 18.7 22.1 27.0 22.5 18.0 23.7 20.5 -
Some harm 3.5 6.7 11.2 14.8 15.2 16.7 7.1 15.5 10.8 -
Harmf l 9 6 11 2 14 8 15 2 16 0 17 0 11 9 16 0 13 7

8/7/2019 DALLAS COUNTY - Irving ISD - 2010 Pride Survey
http://slidepdf.com/reader/full/dallas-county-irving-isd-2010-pride-survey 179/239
Harmful 9.6 11.2 14.8 15.2 16.0 17.0 11.9 16.0 13.7 -
Very harmful 68.2 65.5 55.4 47.9 41.9 43.9 63.1 44.9 55.1 -
N of Valid 2055 2028 2025 2002 1445 1349 6108 4796 10904N of Miss 124 53 59 74 54 49 236 177 413
Table 4.69: Do you feel that using any tobacco is harmful to your health?
RESPONSE 6th 7th 8th 9th 10th 11th 6-8th 9-12th TOTAL
No harm 16.8 13.0 11.5 13.0 12.9 9.9 13.8 12.1 13.0 -
Some harm 5.8 8.2 9.7 8.4 8.3 7.1 7.9 8.0 7.9 -
Harmful 18.7 19.8 23.6 21.0 20.8 23.2 20.7 21.6 21.1 -
Very harmful 58.8 59.1 55.3 57.6 58.0 59.9 57.7 58.3 58.0 -
N of Valid 2083 2038 2042 2022 1454 1350 6163 4826 10989
N of Miss 96 43 42 54 45 48 181 147 328
Table 4.70: How much do you think people risk harming themselves (physically or in other ways) if they take one or two drinks of an alcoholic beverage (beer,
wine, liquor) nearly every day?
RESPONSE 6th 7th 8th 9th 10th 11th 6 -8th 9 -12th TOTAL
No Risk 7.8 8.1 7.1 9.0 10.1 7.2 7.7 8.8 8.2 -
Slight Risk 16.5 16.9 18.2 15.1 17.0 15.4 17.2 15.7 16.6 -
Moderate Risk 26.9 30.6 34.4 33.1 33.9 32.8 30.6 33.3 31.8 -Great Risk 48.8 44.4 40.3 42.8 39.0 44.6 44.5 42.1 43.4 -
N of Valid 1982 1982 1999 1959 1414 1327 5963 4700 10663
N of Miss 197 99 85 117 85 71 381 273 654
Percentage Tables 179
Pride Surveys Report: 2009-10 Irving Independent Schools
4.6 At What Age Did You First...
Table 4.71: At what age did you first smoke cigarettes?
RESPONSE 6th 7th 8th 9th 10th 11th 6-8th 9-12th TOTAL
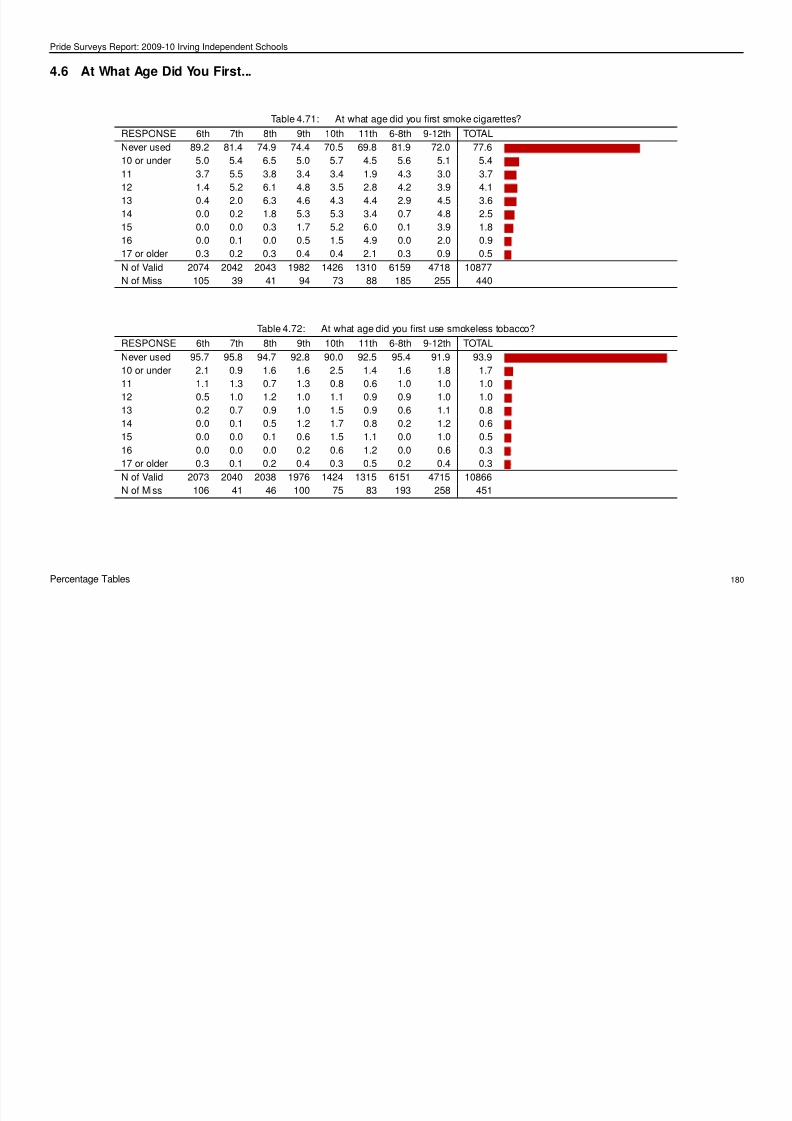
8/7/2019 DALLAS COUNTY - Irving ISD - 2010 Pride Survey
http://slidepdf.com/reader/full/dallas-county-irving-isd-2010-pride-survey 180/239
RESPONSE 6th 7th 8th 9th 10th 11th 6-8th 9-12th TOTAL
Never used 89.2 81.4 74.9 74.4 70.5 69.8 81.9 72.0 77.6 -
10 or under 5.0 5.4 6.5 5.0 5.7 4.5 5.6 5.1 5.4 -
11 3.7 5.5 3.8 3.4 3.4 1.9 4.3 3.0 3.7 -
12 1.4 5.2 6.1 4.8 3.5 2.8 4.2 3.9 4.1 -
13 0.4 2.0 6.3 4.6 4.3 4.4 2.9 4.5 3.6 -
14 0.0 0.2 1.8 5.3 5.3 3.4 0.7 4.8 2.5 -
15 0.0 0.0 0.3 1.7 5.2 6.0 0.1 3.9 1.8 -
16 0.0 0.1 0.0 0.5 1.5 4.9 0.0 2.0 0.9 -
17 or older 0.3 0.2 0.3 0.4 0.4 2.1 0.3 0.9 0.5 -
N of Valid 2074 2042 2043 1982 1426 1310 6159 4718 10877
N of Miss 105 39 41 94 73 88 185 255 440
Table 4.72: At what age did you first use smokeless tobacco?
RESPONSE 6th 7th 8th 9th 10th 11th 6-8th 9-12th TOTAL
Never used 95.7 95.8 94.7 92.8 90.0 92.5 95.4 91.9 93.9 -
10 or under 2.1 0.9 1.6 1.6 2.5 1.4 1.6 1.8 1.7 -
11 1.1 1.3 0.7 1.3 0.8 0.6 1.0 1.0 1.0 -
12 0.5 1.0 1.2 1.0 1.1 0.9 0.9 1.0 1.0 -
13 0.2 0.7 0.9 1.0 1.5 0.9 0.6 1.1 0.8 -
14 0.0 0.1 0.5 1.2 1.7 0.8 0.2 1.2 0.6 -
15 0.0 0.0 0.1 0.6 1.5 1.1 0.0 1.0 0.5 -16 0.0 0.0 0.0 0.2 0.6 1.2 0.0 0.6 0.3 -
17 or older 0.3 0.1 0.2 0.4 0.3 0.5 0.2 0.4 0.3 -
N of Valid 2073 2040 2038 1976 1424 1315 6151 4715 10866
N of Miss 106 41 46 100 75 83 193 258 451
Percentage Tables 180
Pride Surveys Report: 2009-10 Irving Independent Schools
Table 4.73: At what age did you first smoke cigars?
RESPONSE 6th 7th 8th 9th 10th 11th 6-8th 9-12th TOTAL
Never used 93.5 90.0 84.6 84.1 81.8 83.9 89.4 83.3 86.8 -
10 or under 3.0 2.2 3.5 2.7 2.7 1.4 2.9 2.3 2.6 -
11 1 8 3 4 2 3 1 8 1 9 1 3 2 5 1 7 2 1

8/7/2019 DALLAS COUNTY - Irving ISD - 2010 Pride Survey
http://slidepdf.com/reader/full/dallas-county-irving-isd-2010-pride-survey 181/239
11 1.8 3.4 2.3 1.8 1.9 1.3 2.5 1.7 2.1 -
12 1.1 2.8 4.1 3.1 2.8 1.7 2.6 2.6 2.6 -
13 0.3 1.0 3.8 2.9 2.6 2.6 1.7 2.8 2.2 -14 0.0 0.1 1.2 3.3 3.2 2.7 0.5 3.1 1.6 -
15 0.0 0.0 0.1 1.5 3.5 2.6 0.0 2.4 1.1 -
16 0.0 0.0 0.0 0.3 1.1 2.4 0.0 1.1 0.5 -
17 or older 0.3 0.4 0.3 0.4 0.4 1.5 0.3 0.7 0.5 -
N of Valid 2067 2030 2019 1968 1410 1309 6116 4687 10803
N of Miss 112 51 65 108 89 89 228 286 514
Table 4.74: At what age did you first drink beer?
RESPONSE 6th 7th 8th 9th 10th 11th 6-8th 9-12th TOTALNever used 77.8 70.2 56.9 58.0 51.2 49.2 68.4 53.5 61.9 -
10 or under 12.6 11.6 11.9 9.6 8.8 7.5 12.1 8.8 10.6 -
11 6.2 7.7 7.7 4.8 4.0 3.3 7.2 4.1 5.8 -
12 2.3 7.0 8.8 6.3 6.3 4.4 6.0 5.8 5.9 -
13 0.6 2.8 9.8 8.2 7.1 5.9 4.4 7.2 5.6 -
14 0.0 0.4 3.8 7.6 9.5 7.0 1.4 8.0 4.3 -
15 0.0 0.0 0.6 3.8 9.6 11.2 0.2 7.6 3.4 -
16 0.0 0.0 0.0 1.0 2.6 8.7 0.0 3.6 1.6 -
17 or older 0.4 0.2 0.4 0.7 0.8 2.8 0.4 1.3 0.8 -
N of Valid 2065 2032 2026 1972 1417 1309 6123 4698 10821N of Miss 114 49 58 104 82 89 221 275 496
Percentage Tables 181
Pride Surveys Report: 2009-10 Irving Independent Schools
Table 4.75: At what age did you first drink coolers, breezers, etc.?
RESPONSE 6th 7th 8th 9th 10th 11th 6-8th 9-12th TOTAL
Never used 86.6 78.2 66.6 65.7 57.2 53.7 77.2 59.8 69.6 -
10 or under 5.9 6.0 6.8 5.6 6.4 5.0 6.2 5.7 6.0 -
11 3 9 5 9 5 8 3 7 4 0 2 4 5 2 3 4 4 4 -

8/7/2019 DALLAS COUNTY - Irving ISD - 2010 Pride Survey
http://slidepdf.com/reader/full/dallas-county-irving-isd-2010-pride-survey 182/239
11 3.9 5.9 5.8 3.7 4.0 2.4 5.2 3.4 4.4 -
12 2.4 6.4 7.5 5.6 5.6 3.9 5.4 5.1 5.3 -
13 0.8 2.7 9.3 8.0 6.9 6.5 4.2 7.3 5.5 -14 0.0 0.5 3.3 7.3 7.0 7.7 1.2 7.3 3.9 -
15 0.0 0.0 0.5 2.9 9.5 10.3 0.2 6.9 3.1 -
16 0.0 0.0 0.0 0.8 2.8 7.9 0.0 3.4 1.5 -
17 or older 0.4 0.3 0.3 0.4 0.7 2.6 0.4 1.1 0.7 -
N of Valid 2063 2031 2030 1974 1417 1310 6124 4701 10825
N of Miss 116 50 54 102 82 88 220 272 492
Table 4.76: At what age did you first drink liquor?
RESPONSE 6th 7th 8th 9th 10th 11th 6-8th 9-12th TOTALNever used 87.6 78.9 66.8 63.7 56.4 50.8 77.8 57.9 69.2 -
10 or under 4.8 5.5 5.0 4.1 4.3 3.8 5.1 4.1 4.7 -
11 4.2 4.8 4.4 3.3 2.7 1.8 4.5 2.7 3.7 -
12 2.3 6.3 7.3 4.9 5.0 2.9 5.3 4.4 4.9 -
13 0.7 3.9 11.4 8.2 6.3 6.3 5.3 7.1 6.1 -
14 0.0 0.4 4.0 10.0 8.4 7.8 1.5 8.9 4.7 -
15 0.0 0.0 0.7 4.1 12.3 12.0 0.3 8.8 4.0 -
16 0.0 0.0 0.0 1.2 3.8 10.6 0.0 4.6 2.0 -
17 or older 0.3 0.2 0.2 0.5 0.8 3.9 0.3 1.5 0.8 -
N of Valid 2067 2035 2025 1976 1418 1304 6127 4698 10825N of Miss 112 46 59 100 81 94 217 275 492
Percentage Tables 182
Pride Surveys Report: 2009-10 Irving Independent Schools
Table 4.77: At what age did you first smoke marijuana?
RESPONSE 6th 7th 8th 9th 10th 11th 6-8th 9-12th TOTAL
Never used 93.3 88.7 79.0 74.8 70.3 69.4 87.0 71.9 80.5 -
10 or under 2.7 2.4 3.1 3.3 3.2 2.2 2.7 3.0 2.8 -
11 2 0 3 1 3 1 2 2 2 5 1 3 2 7 2 0 2 4 -

8/7/2019 DALLAS COUNTY - Irving ISD - 2010 Pride Survey
http://slidepdf.com/reader/full/dallas-county-irving-isd-2010-pride-survey 183/239
11 2.0 3.1 3.1 2.2 2.5 1.3 2.7 2.0 2.4
12 1.5 3.4 4.5 3.9 3.2 1.8 3.1 3.1 3.1 -
13 0.3 2.0 7.0 6.1 4.9 4.9 3.1 5.4 4.1 -14 0.0 0.2 2.6 6.2 6.3 4.3 0.9 5.7 3.0 -
15 0.0 0.0 0.5 2.8 6.4 8.3 0.2 5.4 2.5 -
16 0.0 0.0 0.0 0.3 2.5 6.1 0.0 2.6 1.1 -
17 or older 0.2 0.1 0.2 0.4 0.6 1.8 0.2 0.8 0.5 -
N of Valid 2061 2035 2035 1973 1420 1311 6131 4704 10835
N of Miss 118 46 49 103 79 87 213 269 482
Table 4.78: At what age did you first use cocaine?
RESPONSE 6th 7th 8th 9th 10th 11th 6-8th 9-12th TOTALNever used 96.6 96.4 94.7 92.9 89.6 90.9 95.9 91.3 93.9 -
10 or under 1.5 0.7 0.8 1.1 2.2 1.0 1.0 1.4 1.2 -
11 0.5 0.9 0.6 0.6 1.1 0.4 0.7 0.7 0.7 -
12 0.8 0.8 1.0 0.7 1.0 0.4 0.9 0.7 0.8 -
13 0.3 0.8 1.6 1.6 1.5 1.1 0.9 1.4 1.1 -
14 0.0 0.2 0.9 1.5 1.2 1.7 0.4 1.5 0.8 -
15 0.0 0.0 0.2 1.0 1.8 2.1 0.1 1.6 0.7 -
16 0.0 0.0 0.0 0.4 1.1 1.7 0.0 1.0 0.4 -
17 or older 0.2 0.1 0.1 0.3 0.6 0.6 0.2 0.5 0.3 -
N of Valid 2059 2038 2033 1978 1423 1315 6130 4716 10846N of Miss 120 43 51 98 76 83 214 257 471
Percentage Tables 183
Pride Surveys Report: 2009-10 Irving Independent Schools
Table 4.79: At what age did you first use uppers?
RESPONSE 6th 7th 8th 9th 10th 11th 6-8th 9-12th TOTAL
Never used 96.9 97.5 96.0 93.4 90.2 92.2 96.8 92.1 94.8 -
10 or under 1.5 0.6 0.7 1.2 2.0 1.1 1.0 1.4 1.1 -
11 0 5 0 7 0 7 0 5 0 8 0 7 0 6 0 6 0 6 -

8/7/2019 DALLAS COUNTY - Irving ISD - 2010 Pride Survey
http://slidepdf.com/reader/full/dallas-county-irving-isd-2010-pride-survey 184/239
11 0.5 0.7 0.7 0.5 0.8 0.7 0.6 0.6 0.6
12 0.5 0.6 0.8 1.1 0.8 0.4 0.6 0.8 0.7 -
13 0.2 0.4 1.0 1.2 1.3 0.7 0.5 1.1 0.8 -14 0.0 0.1 0.6 1.4 1.4 1.2 0.2 1.3 0.7 -
15 0.0 0.0 0.0 0.8 1.9 2.4 0.0 1.6 0.7 -
16 0.0 0.0 0.0 0.3 1.2 0.9 0.0 0.7 0.3 -
17 or older 0.2 0.1 0.1 0.4 0.5 0.4 0.2 0.4 0.3 -
N of Valid 2030 2033 2026 1986 1424 1316 6089 4726 10815
N of Miss 149 48 58 90 75 82 255 247 502
Table 4.80: At what age did you first use downers?
RESPONSE 6th 7th 8th 9th 10th 11th 6-8th 9-12th TOTALNever used 97.1 97.4 96.5 93.1 91.0 92.0 97.0 92.2 94.9 -
10 or under 1.7 0.5 0.7 1.4 1.8 1.0 1.0 1.4 1.2 -
11 0.3 0.7 0.6 0.4 0.9 0.6 0.6 0.6 0.6 -
12 0.3 0.7 0.7 1.1 1.1 0.4 0.6 0.9 0.7 -
13 0.2 0.3 0.9 1.1 0.8 1.1 0.5 1.0 0.7 -
14 0.0 0.0 0.3 1.4 1.7 1.1 0.1 1.4 0.7 -
15 0.0 0.0 0.0 0.9 1.5 2.0 0.0 1.4 0.6 -
16 0.0 0.0 0.0 0.5 1.1 1.6 0.0 1.0 0.4 -
17 or older 0.3 0.2 0.2 0.3 0.1 0.3 0.2 0.3 0.2 -
N of Valid 2021 2031 2027 1982 1421 1314 6079 4717 10796N of Miss 158 50 57 94 78 84 265 256 521
Percentage Tables 184
Pride Surveys Report: 2009-10 Irving Independent Schools
Table 4.81: At what age did you first use inhalants?
RESPONSE 6th 7th 8th 9th 10th 11th 6-8th 9-12th TOTAL
Never used 93.6 94.2 94.0 93.4 92.3 95.4 94.0 93.6 93.8 -
10 or under 3.6 2.0 1.9 1.6 2.2 1.3 2.5 1.7 2.1 -
11 1.5 1.7 1.1 0.6 1.1 0.5 1.4 0.7 1.1 -
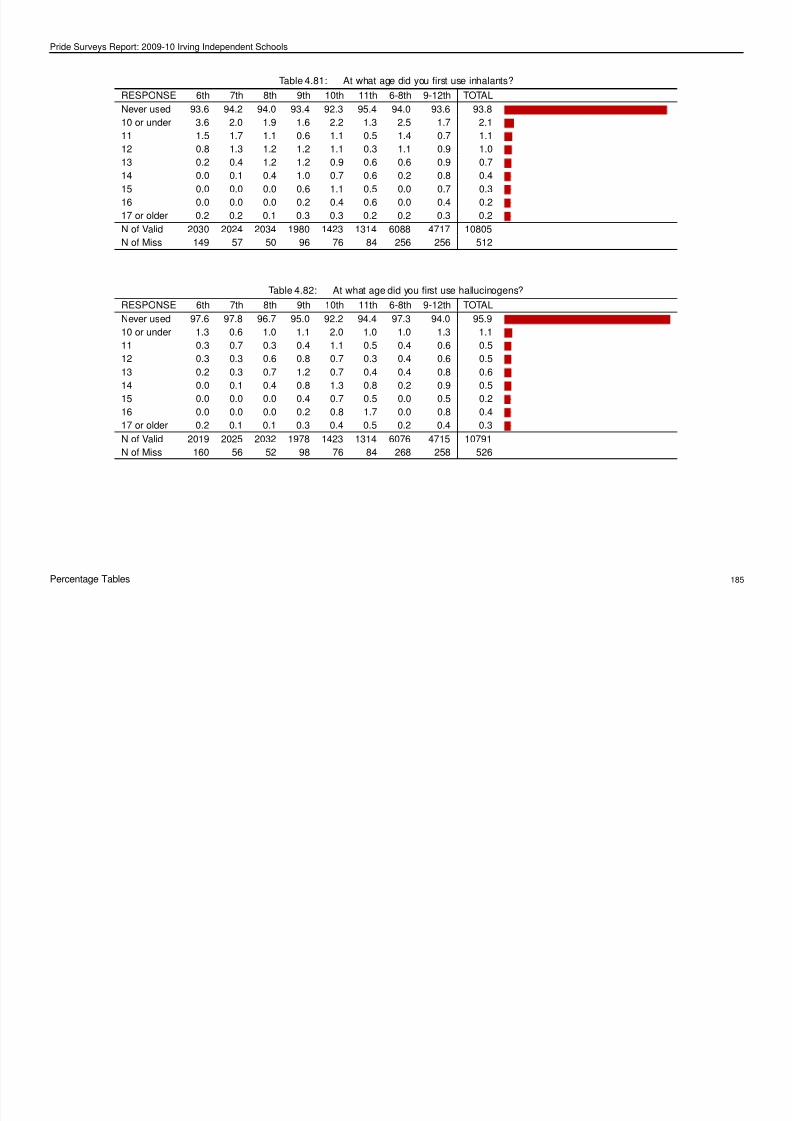
8/7/2019 DALLAS COUNTY - Irving ISD - 2010 Pride Survey
http://slidepdf.com/reader/full/dallas-county-irving-isd-2010-pride-survey 185/239
11 1.5 1.7 1.1 0.6 1.1 0.5 1.4 0.7 1.1
12 0.8 1.3 1.2 1.2 1.1 0.3 1.1 0.9 1.0 -
13 0.2 0.4 1.2 1.2 0.9 0.6 0.6 0.9 0.7 -
14 0.0 0.1 0.4 1.0 0.7 0.6 0.2 0.8 0.4 -
15 0.0 0.0 0.0 0.6 1.1 0.5 0.0 0.7 0.3 -
16 0.0 0.0 0.0 0.2 0.4 0.6 0.0 0.4 0.2 -
17 or older 0.2 0.2 0.1 0.3 0.3 0.2 0.2 0.3 0.2 -
N of Valid 2030 2024 2034 1980 1423 1314 6088 4717 10805
N of Miss 149 57 50 96 76 84 256 256 512
Table 4.82: At what age did you first use hallucinogens?
RESPONSE 6th 7th 8th 9th 10th 11th 6-8th 9-12th TOTALNever used 97.6 97.8 96.7 95.0 92.2 94.4 97.3 94.0 95.9 -
10 or under 1.3 0.6 1.0 1.1 2.0 1.0 1.0 1.3 1.1 -
11 0.3 0.7 0.3 0.4 1.1 0.5 0.4 0.6 0.5 -
12 0.3 0.3 0.6 0.8 0.7 0.3 0.4 0.6 0.5 -
13 0.2 0.3 0.7 1.2 0.7 0.4 0.4 0.8 0.6 -
14 0.0 0.1 0.4 0.8 1.3 0.8 0.2 0.9 0.5 -
15 0.0 0.0 0.0 0.4 0.7 0.5 0.0 0.5 0.2 -
16 0.0 0.0 0.0 0.2 0.8 1.7 0.0 0.8 0.4 -
17 or older 0.2 0.1 0.1 0.3 0.4 0.5 0.2 0.4 0.3 -
N of Valid 2019 2025 2032 1978 1423 1314 6076 4715 10791N of Miss 160 56 52 98 76 84 268 258 526
Percentage Tables 185
Pride Surveys Report: 2009-10 Irving Independent Schools
Table 4.83: At what age did you first use heroin?
RESPONSE 6th 7th 8th 9th 10th 11th 6-8th 9-12th TOTAL
Never used 97.3 98.0 96.7 95.0 92.6 95.7 97.3 94.5 96.1 -
10 or under 1.4 0.3 0.9 1.0 2.0 0.9 0.9 1.3 1.0 -
11 0.5 0.7 0.3 0.5 1.1 0.4 0.5 0.6 0.6 -

8/7/2019 DALLAS COUNTY - Irving ISD - 2010 Pride Survey
http://slidepdf.com/reader/full/dallas-county-irving-isd-2010-pride-survey 186/239
0 5 0 0 3 0 5 0 0 5 0 6 0 6
12 0.3 0.4 0.6 0.4 1.1 0.2 0.5 0.5 0.5 -
13 0.1 0.3 0.7 1.0 0.8 0.8 0.4 0.9 0.6 -
14 0.1 0.0 0.5 0.8 0.8 0.6 0.2 0.8 0.5 -
15 0.0 0.0 0.0 0.7 0.8 0.6 0.0 0.7 0.3 -
16 0.0 0.0 0.0 0.3 0.4 0.5 0.0 0.4 0.2 -
17 or older 0.2 0.1 0.1 0.5 0.4 0.2 0.1 0.4 0.2 -
N of Valid 2037 2026 2032 1981 1422 1314 6095 4717 10812
N of Miss 142 55 52 95 77 84 249 256 505
Table 4.84: At what age did you first use anabolic steroids?
RESPONSE 6th 7th 8th 9th 10th 11th 6-8th 9-12th TOTALNever used 97.0 98.2 97.8 96.7 94.4 96.9 97.7 96.0 97.0 -
10 or under 1.7 0.7 0.5 1.2 2.1 1.1 1.0 1.4 1.2 -
11 0.6 0.1 0.1 0.3 0.8 0.5 0.3 0.5 0.4 -
12 0.2 0.4 0.3 0.6 0.6 0.4 0.3 0.5 0.4 -
13 0.2 0.3 0.5 0.7 0.6 0.2 0.4 0.5 0.4 -
14 0.0 0.0 0.3 0.2 0.6 0.4 0.1 0.4 0.2 -
15 0.0 0.0 0.0 0.1 0.4 0.2 0.0 0.2 0.1 -
16 0.0 0.0 0.0 0.1 0.4 0.2 0.0 0.2 0.1 -
17 or older 0.2 0.1 0.2 0.3 0.3 0.2 0.2 0.3 0.2 -
N of Valid 2045 2028 2037 1976 1419 1312 6110 4707 10817N of Miss 134 53 47 100 80 86 234 266 500
Percentage Tables 186
Pride Surveys Report: 2009-10 Irving Independent Schools
Table 4.85: At what age did you first use ecstasy?
RESPONSE 6th 7th 8th 9th 10th 11th 6-8th 9-12th TOTAL
Never used 97.5 97.5 95.4 92.1 89.4 91.6 96.8 91.1 94.3 -
10 or under 1.4 0.5 0.7 1.2 2.3 1.2 0.9 1.5 1.1 -
11 0.3 0.5 0.6 0.5 0.8 0.3 0.5 0.5 0.5 -

8/7/2019 DALLAS COUNTY - Irving ISD - 2010 Pride Survey
http://slidepdf.com/reader/full/dallas-county-irving-isd-2010-pride-survey 187/239
12 0.3 0.5 0.7 0.7 0.6 0.5 0.5 0.6 0.5 -
13 0.2 0.8 1.5 1.9 1.1 0.6 0.8 1.3 1.0 -
14 0.0 0.0 0.8 1.6 1.6 1.1 0.3 1.4 0.8 -
15 0.0 0.0 0.1 1.3 2.4 1.5 0.1 1.7 0.8 -
16 0.0 0.0 0.0 0.4 1.3 2.1 0.0 1.1 0.5 -
17 or older 0.2 0.1 0.2 0.4 0.6 1.1 0.2 0.7 0.4 -
N of Valid 2017 2028 2031 1976 1419 1314 6076 4709 10785
N of Miss 162 53 53 100 80 84 268 264 532
Table 4.86: At what age did you first use meth?
RESPONSE 6th 7th 8th 9th 10th 11th 6-8th 9-12th TOTALNever used 96.3 96.7 95.7 95.1 93.5 95.8 96.2 94.8 95.6 -
10 or under 1.7 0.8 0.9 1.3 2.1 1.1 1.2 1.5 1.3 -
11 0.9 0.7 0.3 0.2 0.9 0.4 0.7 0.4 0.6 -
12 0.5 0.9 0.9 0.7 0.7 0.4 0.8 0.6 0.7 -
13 0.2 0.6 1.0 0.8 0.7 0.4 0.6 0.7 0.6 -
14 0.0 0.1 0.8 1.0 0.6 0.8 0.3 0.8 0.5 -
15 0.0 0.0 0.1 0.4 0.6 0.5 0.0 0.5 0.2 -
16 0.1 0.0 0.0 0.3 0.6 0.5 0.0 0.4 0.2 -
17 or older 0.2 0.1 0.2 0.3 0.3 0.2 0.2 0.3 0.2 -
N of Valid 2019 2019 2023 1977 1411 1313 6061 4701 10762N of Miss 160 62 61 99 88 85 283 272 555
Percentage Tables 187
Pride Surveys Report: 2009-10 Irving Independent Schools
Table 4.87: At what age did you first use prescription drugs?
RESPONSE 6th 7th 8th 9th 10th 11th 6-8th 9-12th TOTAL
Never used 96.3 96.3 94.2 91.8 89.6 90.9 95.6 90.8 93.5 -
10 or under 1.7 0.8 1.1 1.3 2.4 1.4 1.2 1.7 1.4 -
11 0.7 0.8 0.6 0.5 1.1 0.6 0.7 0.7 0.7 -

8/7/2019 DALLAS COUNTY - Irving ISD - 2010 Pride Survey
http://slidepdf.com/reader/full/dallas-county-irving-isd-2010-pride-survey 188/239
12 0.7 1.0 1.0 0.8 1.1 0.5 0.9 0.8 0.9 -
13 0.1 0.7 1.7 1.6 1.1 0.9 0.9 1.3 1.0 -
14 0.0 0.1 0.8 1.8 1.8 1.2 0.3 1.6 0.9 -
15 0.0 0.0 0.2 1.1 2.1 1.3 0.1 1.4 0.7 -
16 0.0 0.0 0.1 0.5 0.8 2.7 0.0 1.2 0.6 -
17 or older 0.2 0.2 0.1 0.6 0.2 0.5 0.2 0.5 0.3 -
N of Valid 2023 2027 2027 1978 1417 1314 6077 4709 10786
N of Miss 156 54 57 98 82 84 267 264 531
Table 4.88: At what age did you first use pain killers?
RESPONSE 6th 7th 8th 9th 10th 11th 6-8th 9-12th TOTALNever used 96.8 97.1 94.8 92.4 89.2 91.3 96.2 91.2 94.0 -
10 or under 1.6 0.6 0.7 1.2 2.1 0.9 1.0 1.4 1.2 -
11 0.6 0.8 0.8 0.6 1.1 0.8 0.7 0.8 0.8 -
12 0.4 0.7 0.8 0.8 1.1 0.5 0.6 0.8 0.7 -
13 0.1 0.5 1.6 1.3 1.2 0.8 0.7 1.1 0.9 -
14 0.0 0.1 0.8 1.8 1.6 1.4 0.3 1.7 0.9 -
15 0.0 0.0 0.2 1.1 2.1 1.7 0.1 1.6 0.8 -
16 0.0 0.0 0.0 0.4 1.0 2.1 0.0 1.0 0.5 -
17 or older 0.3 0.1 0.1 0.5 0.5 0.4 0.2 0.4 0.3 -
N of Valid 2019 2021 2022 1977 1413 1312 6062 4702 10764N of Miss 160 60 62 99 86 86 282 271 553
Percentage Tables 188
Pride Surveys Report: 2009-10 Irving Independent Schools
Table 4.89: At what age did you first use over-the-counter drugs?
RESPONSE 6th 7th 8th 9th 10th 11th 6-8th 9-12th TOTAL
Never used 95.7 95.3 93.8 92.6 90.2 92.6 94.9 91.9 93.6 -
10 or under 2.1 0.9 1.0 1.4 2.3 1.0 1.3 1.6 1.4 -
11 0.6 1.4 0.8 0.6 0.9 0.5 1.0 0.6 0.8 -
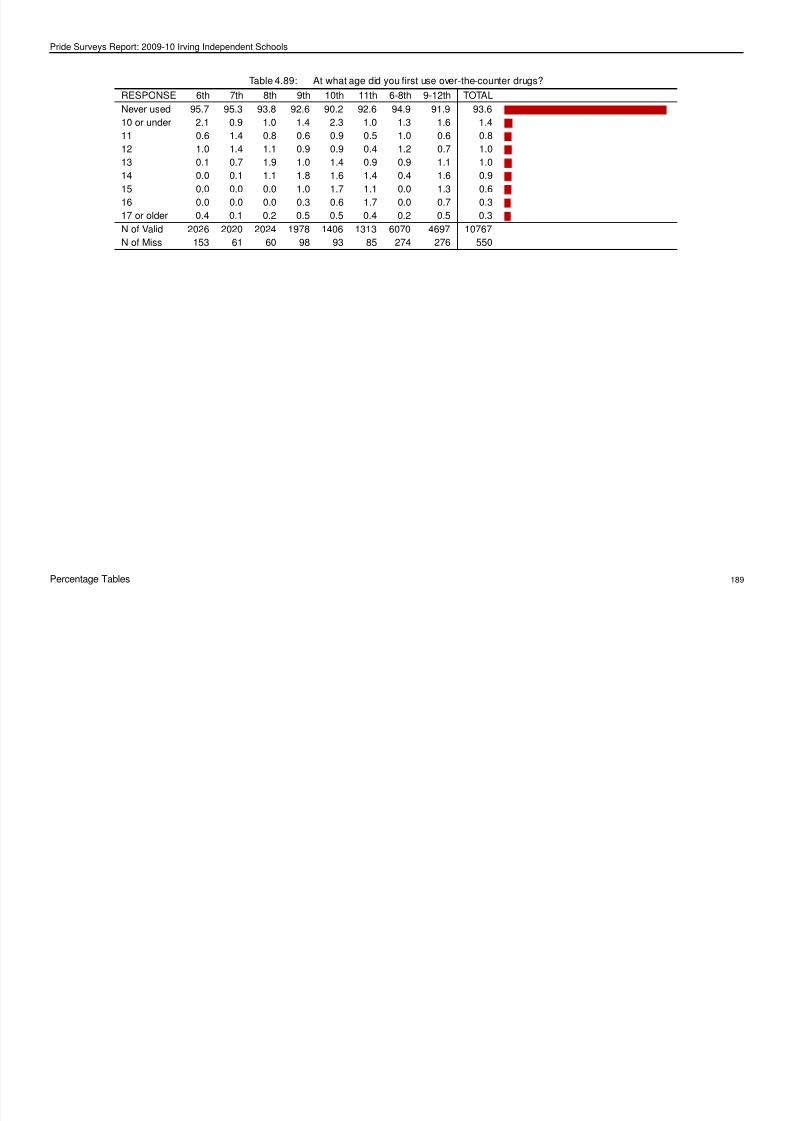
8/7/2019 DALLAS COUNTY - Irving ISD - 2010 Pride Survey
http://slidepdf.com/reader/full/dallas-county-irving-isd-2010-pride-survey 189/239
12 1.0 1.4 1.1 0.9 0.9 0.4 1.2 0.7 1.0 -
13 0.1 0.7 1.9 1.0 1.4 0.9 0.9 1.1 1.0 -
14 0.0 0.1 1.1 1.8 1.6 1.4 0.4 1.6 0.9 -
15 0.0 0.0 0.0 1.0 1.7 1.1 0.0 1.3 0.6 -
16 0.0 0.0 0.0 0.3 0.6 1.7 0.0 0.7 0.3 -
17 or older 0.4 0.1 0.2 0.5 0.5 0.4 0.2 0.5 0.3 -
N of Valid 2026 2020 2024 1978 1406 1313 6070 4697 10767
N of Miss 153 61 60 98 93 85 274 276 550
Percentage Tables 189
Pride Surveys Report: 2009-10 Irving Independent Schools
4.7 Where Do You Usually Use...
Table 4.90: Where do you usually smoke cigarettes?
RESPONSE 6th 7th 8th 9th 10th 11th 6 -8th 9 -12th TOTAL

8/7/2019 DALLAS COUNTY - Irving ISD - 2010 Pride Survey
http://slidepdf.com/reader/full/dallas-county-irving-isd-2010-pride-survey 190/239
Do not use 82.8 80.8 74.1 74.0 71.2 72.2 79.3 72.7 76.4 -
At home 2.0 3.4 5.9 6.2 7.9 6.9 3.7 6.9 5.1 -
At school 1.2 0.7 1.3 2.4 3.9 3.1 1.1 3.1 1.9 -
In a car 0.7 0.9 2.8 4.3 5.5 6.2 1.5 5.2 3.1 -
Friend’s house 3.2 7.1 10.6 8.8 10.5 10.2 6.9 9.7 8.1 -
Other 4.5 8.1 11.2 9.0 10.1 9.7 7.9 9.5 8.6 -
N of Valid 2179 2081 2084 2076 1499 1398 6344 4973 11317
N of Miss 0 0 0 0 0 0 0 0 0
Table 4.91: Where do you usually use smokeless tobacco?
RESPONSE 6th 7th 8th 9th 10th 11th 6 -8th 9 -12th TOTALDo not use 86.7 91.2 90.7 86.8 84.7 86.7 89.5 86.1 88.0 -
At home 1.1 0.9 1.0 1.5 3.2 2.4 1.0 2.3 1.5 -
At school 1.0 0.6 0.8 1.1 3.0 1.8 0.8 1.9 1.3 -
In a car 0.5 0.7 0.7 1.0 2.5 1.5 0.6 1.6 1.0 -
Friend’s house 1.2 2.0 2.4 1.9 3.7 1.9 1.9 2.5 2.1 -
Other 1.5 2.5 2.5 3.1 2.9 2.6 2.2 2.9 2.5 -
N of Valid 2179 2081 2084 2076 1499 1398 6344 4973 11317
N of Miss 0 0 0 0 0 0 0 0 0
Percentage Tables 190
Pride Surveys Report: 2009-10 Irving Independent Schools
Table 4.92: Where do you usually smoke cigars?
RESPONSE 6th 7th 8th 9th 10th 11th 6 -8th 9 -12th TOTAL
Do not use 84.4 86.3 81.7 79.2 77.7 80.6 84.1 79.2 81.9 -
At home 1.8 2.4 3.6 4.2 5.2 3.2 2.6 4.2 3.3 -
At school 0.9 0.4 0.9 2.1 2.9 1.9 0.7 2.3 1.4 -

8/7/2019 DALLAS COUNTY - Irving ISD - 2010 Pride Survey
http://slidepdf.com/reader/full/dallas-county-irving-isd-2010-pride-survey 191/239
In a car 0.6 0.8 1.8 2.3 3.8 3.1 1.1 3.0 1.9 -
Friend’s house 2.1 4.0 6.5 5.9 6.6 6.0 4.2 6.2 5.0 -
Other 2.7 4.6 6.8 5.7 6.1 5.7 4.7 5.8 5.2 -
N of Valid 2179 2081 2084 2076 1499 1398 6344 4973 11317
N of Miss 0 0 0 0 0 0 0 0 0
Table 4.93: Where do you usually drink beer?
RESPONSE 6th 7th 8th 9th 10th 11th 6 -8th 9 -12th TOTAL
Do not use 74.3 71.7 59.5 59.4 52.6 53.0 68.6 55.5 62.8 -
At home 8.6 12.5 16.8 14.6 17.5 15.3 12.6 15.7 13.9 -
At school 1.2 0.3 1.3 1.9 3.7 2.1 1.0 2.5 1.6 -In a car 1.1 1.6 3.3 3.6 6.0 3.6 2.0 4.3 3.0 -
Friend’s house 3.9 8.8 16.0 15.3 21.9 21.4 9.5 19.0 13.7 -
Other 6.5 10.1 16.1 13.6 14.6 17.0 10.8 14.9 12.6 -
N of Valid 2179 2081 2084 2076 1499 1398 6344 4973 11317
N of Miss 0 0 0 0 0 0 0 0 0
Table 4.94: Where do you usually drink coolers, breezers, etc.?
RESPONSE 6th 7th 8th 9th 10th 11th 6 -8th 9 -12th TOTAL
Do not use 79.1 75.8 65.8 63.5 55.8 54.2 73.7 58.6 67.0 -
At home 5.0 8.7 12.9 13.2 16.2 15.7 8.8 14.8 11.5 -
At school 0.9 0.4 1.2 1.4 3.2 2.1 0.8 2.2 1.4 -
In a car 0.8 0.9 2.4 2.5 4.4 2.6 1.4 3.1 2.1 -
Friend’s house 3.3 7.2 12.5 12.4 18.8 18.7 7.6 16.1 11.3 -
Other 4.3 8.4 12.7 11.6 13.5 14.6 8.4 13.0 10.4 -
N of Valid 2179 2081 2084 2076 1499 1398 6344 4973 11317
N of Miss 0 0 0 0 0 0 0 0 0
Percentage Tables 191
Pride Surveys Report: 2009-10 Irving Independent Schools
Table 4.95: Where do you usually drink liquor?
RESPONSE 6th 7th 8th 9th 10th 11th 6 -8th 9 -12th TOTAL
Do not use 80.1 77.5 66.5 62.5 54.0 52.1 74.8 57.0 67.0 -
At home 4.2 7.5 11.5 11.6 15.3 15.8 7.7 13.9 10.4 -
At school 1.0 0.4 1.2 1.6 3.3 2.8 0.9 2.5 1.6 -

8/7/2019 DALLAS COUNTY - Irving ISD - 2010 Pride Survey
http://slidepdf.com/reader/full/dallas-county-irving-isd-2010-pride-survey 192/239
In a car 0.6 1.0 2.2 2.9 4.8 3.1 1.2 3.5 2.3 -
Friend’s house 2.5 6.4 12.8 13.9 20.5 20.4 7.1 17.7 11.8 -
Other 4.9 8.5 12.9 12.8 13.3 16.7 8.7 14.1 11.0 -
N of Valid 2179 2081 2084 2076 1499 1398 6344 4973 11317
N of Miss 0 0 0 0 0 0 0 0 0
Table 4.96: Where do you usually smoke marijuana?
RESPONSE 6th 7th 8th 9th 10th 11th 6 -8th 9 -12th TOTAL
Do not use 84.1 84.8 76.3 70.8 67.2 68.2 81.8 69.0 76.2 -
At home 0.9 1.9 4.5 6.3 7.9 6.9 2.4 7.0 4.4 -
At school 1.1 0.7 2.0 3.7 5.3 3.9 1.2 4.2 2.6 -In a car 0.6 1.3 3.8 6.0 8.3 8.5 1.9 7.4 4.3 -
Friend’s house 2.4 6.2 11.6 13.2 15.1 15.5 6.7 14.4 10.1 -
Other 3.5 5.3 11.1 11.6 13.5 12.0 6.6 12.3 9.1 -
N of Valid 2179 2081 2084 2076 1499 1398 6344 4973 11317
N of Miss 0 0 0 0 0 0 0 0 0
Table 4.97: Where do you usually use tobacco?
RESPONSE 6th 7th 8th 9th 10th 11th 6 -8th 9 -12th TOTAL
Do not use 87.8 92.2 91.4 88.4 86.7 88.5 90.4 87.9 89.3 -
At home 3.3 4.8 7.0 8.4 10.3 8.2 5.0 8.9 6.7 -
At school 1.4 1.0 1.7 3.6 5.5 4.0 1.4 4.3 2.6 -
In a car 1.0 1.4 3.6 5.0 7.7 7.3 2.0 6.5 4.0 -
Friend’s house 3.8 8.4 12.4 11.1 13.2 12.2 8.1 12.0 9.8 -
Other 5.1 9.7 13.0 10.5 11.9 11.9 9.2 11.3 10.1 -
N of Valid 2179 2081 2084 2076 1499 1398 6344 4973 11317
N of Miss 0 0 0 0 0 0 0 0 0
Percentage Tables 192
Pride Surveys Report: 2009-10 Irving Independent Schools
Table 4.98: Where do you usually use alcohol?
RESPONSE 6th 7th 8th 9th 10th 11th 6 -8th 9 -12th TOTAL
Do not use 84.4 84.4 75.4 72.5 65.6 64.9 81.4 68.3 75.7 -
At home 12.0 16.8 22.2 20.1 23.7 22.4 16.9 21.8 19.1 -
At school 1.6 0.7 2.0 2.6 4.9 3.3 1.4 3.5 2.4 -

8/7/2019 DALLAS COUNTY - Irving ISD - 2010 Pride Survey
http://slidepdf.com/reader/full/dallas-county-irving-isd-2010-pride-survey 193/239
In a car 1.5 2.4 4.0 4.6 7.5 4.4 2.6 5.4 3.9 -
Friend’s house 5.4 12.0 20.4 19.6 26.9 27.4 12.5 24.0 17.5 -
Other 8.9 14.8 20.9 18.6 19.9 22.1 14.8 20.0 17.1 -
N of Valid 2179 2081 2084 2076 1499 1398 6344 4973 11317
N of Miss 0 0 0 0 0 0 0 0 0
Percentage Tables 193
Pride Surveys Report: 2009-10 Irving Independent Schools
4.8 When Do You Usually Use...
Table 4.99: When do you usually smoke cigarettes?
RESPONSE 6th 7th 8th 9th 10th 11th 6-8th 9-12th TOTAL
Do not se 82 5 82 3 75 9 75 1 73 3 72 9 80 3 74 0 77 5

8/7/2019 DALLAS COUNTY - Irving ISD - 2010 Pride Survey
http://slidepdf.com/reader/full/dallas-county-irving-isd-2010-pride-survey 194/239
Do not use 82.5 82.3 75.9 75.1 73.3 72.9 80.3 74.0 77.5 -
Before school 1.2 1.2 2.8 3.5 4.6 3.9 1.8 3.9 2.7 -
During school 1.0 0.4 0.9 2.0 2.7 1.6 0.8 2.1 1.4 -
After school 2.2 4.0 7.1 6.6 8.7 7.7 4.4 7.5 5.8 -
Week nights 2.3 3.4 6.1 5.4 6.1 5.6 3.9 5.7 4.7 -
Weekends 4.8 9.1 14.8 11.9 12.6 13.8 9.5 12.6 10.9 -
N of Valid 2179 2081 2084 2076 1499 1398 6344 4973 11317
N of Miss 0 0 0 0 0 0 0 0 0
Table 4.100: When do you usually use smokeless tobacco?
RESPONSE 6th 7th 8th 9th 10th 11th 6-8th 9-12th TOTALDo not use 86.6 91.5 91.1 87.4 85.7 86.1 89.7 86.5 88.3 -
Before school 0.7 0.6 1.0 1.2 2.3 1.1 0.8 1.5 1.1 -
During school 0.9 0.3 0.5 1.3 2.7 1.2 0.6 1.7 1.1 -
After school 1.1 1.2 1.5 1.6 2.8 1.7 1.3 2.0 1.6 -
Week nights 1.1 1.1 2.1 1.5 2.6 1.6 1.4 1.9 1.6 -
Weekends 1.5 2.3 3.1 3.0 3.6 3.1 2.3 3.2 2.7 -
N of Valid 2179 2081 2084 2076 1499 1398 6344 4973 11317
N of Miss 0 0 0 0 0 0 0 0 0
Percentage Tables 194
Pride Surveys Report: 2009-10 Irving Independent Schools
Table 4.101: When do you usually smoke cigars?
RESPONSE 6th 7th 8th 9th 10th 11th 6-8th 9-12th TOTAL
Do not use 84.4 87.2 83.3 80.9 79.3 80.0 85.0 80.2 82.8 -
Before school 0.7 1.0 1.8 2.2 2.6 1.5 1.1 2.1 1.6 -
During school 0.8 0.3 0.8 1.7 2.3 1.4 0.6 1.8 1.1 -
Aft h l 1 8 2 3 4 3 4 4 4 9 3 4 2 8 4 3 3 4

8/7/2019 DALLAS COUNTY - Irving ISD - 2010 Pride Survey
http://slidepdf.com/reader/full/dallas-county-irving-isd-2010-pride-survey 195/239
After school 1.8 2.3 4.3 4.4 4.9 3.4 2.8 4.3 3.4 -
Week nights 1.4 2.2 4.0 4.0 3.7 2.8 2.5 3.6 3.0 -
Weekends 3.4 5.7 8.3 7.9 8.5 8.2 5.7 8.1 6.8 -
N of Valid 2179 2081 2084 2076 1499 1398 6344 4973 11317
N of Miss 0 0 0 0 0 0 0 0 0
Table 4.102: When do you usually drink beer?
RESPONSE 6th 7th 8th 9th 10th 11th 6-8th 9-12th TOTAL
Do not use 75.6 73.5 62.2 61.1 56.0 54.8 70.5 57.8 64.9 -
Before school 1.2 0.9 1.3 1.5 2.7 1.5 1.2 1.8 1.5 -
During school 0.8 0.5 0.8 1.7 2.7 1.7 0.7 2.0 1.3 -After school 2.2 2.6 4.5 4.2 5.1 2.2 3.1 3.9 3.5 -
Week nights 3.6 5.4 8.7 6.8 7.6 5.9 5.9 6.8 6.3 -
Weekends 10.6 18.2 28.2 26.6 31.3 33.2 18.9 29.9 23.7 -
N of Valid 2179 2081 2084 2076 1499 1398 6344 4973 11317
N of Miss 0 0 0 0 0 0 0 0 0
Table 4.103: When do you usually drink coolers, breezers, etc.?
RESPONSE 6th 7th 8th 9th 10th 11th 6-8th 9-12th TOTAL
Do not use 79.4 77.7 67.4 65.3 58.5 55.8 74.9 60.6 68.6 -
Before school 1.1 0.7 1.2 1.4 2.3 1.3 1.0 1.7 1.3 -
During school 0.7 0.5 0.7 1.3 2.6 1.4 0.6 1.7 1.1 -
After school 1.6 2.4 4.0 3.3 3.4 2.0 2.6 3.0 2.8 -
Week nights 2.0 3.7 6.0 6.1 6.6 4.9 3.9 5.9 4.8 -
Weekends 7.7 14.9 24.1 23.0 29.0 31.9 15.4 27.3 20.7 -
N of Valid 2179 2081 2084 2076 1499 1398 6344 4973 11317
N of Miss 0 0 0 0 0 0 0 0 0
Percentage Tables 195
Pride Surveys Report: 2009-10 Irving Independent Schools
Table 4.104: When do you usually drink liquor?
RESPONSE 6th 7th 8th 9th 10th 11th 6-8th 9-12th TOTAL
Do not use 80.3 78.2 68.0 63.6 56.5 54.3 75.6 58.9 68.2 -
Before school 0.8 0.9 1.0 1.5 2.5 1.1 0.9 1.7 1.2 -
During school 0.9 0.4 0.8 1.8 2.9 1.8 0.7 2.1 1.3 -
Aft h l 1 5 2 1 3 2 3 2 3 7 2 1 2 2 3 1 2 6

8/7/2019 DALLAS COUNTY - Irving ISD - 2010 Pride Survey
http://slidepdf.com/reader/full/dallas-county-irving-isd-2010-pride-survey 196/239
After school 1.5 2.1 3.2 3.2 3.7 2.1 2.2 3.1 2.6 -
Week nights 2.3 3.4 6.2 6.0 7.2 4.9 4.0 6.0 4.9 -
Weekends 6.4 14.6 23.8 25.1 30.2 33.8 14.8 29.1 21.1 -
N of Valid 2179 2081 2084 2076 1499 1398 6344 4973 11317
N of Miss 0 0 0 0 0 0 0 0 0
Table 4.105: When do you usually smoke marijuana?
RESPONSE 6th 7th 8th 9th 10th 11th 6-8th 9-12th TOTAL
Do not use 83.9 84.7 77.5 71.3 68.8 68.5 82.1 69.8 76.7 -
Before school 1.0 1.2 3.8 5.4 5.9 5.7 2.0 5.7 3.6 -
During school 0.9 0.7 1.3 3.1 3.8 3.4 1.0 3.4 2.0 -After school 1.8 3.7 6.9 8.2 9.0 8.4 4.1 8.5 6.0 -
Week nights 1.6 2.8 6.7 8.3 9.0 8.4 3.7 8.5 5.8 -
Weekends 3.7 7.6 14.5 15.7 17.0 18.6 8.5 16.9 12.2 -
N of Valid 2179 2081 2084 2076 1499 1398 6344 4973 11317
N of Miss 0 0 0 0 0 0 0 0 0
Table 4.106: When do you usually use tobacco?
RESPONSE 6th 7th 8th 9th 10th 11th 6-8th 9-12th TOTAL
Do not use 87.4 92.4 92.0 88.9 87.5 87.4 90.5 88.0 89.4 -
Before school 1.5 1.6 3.3 4.5 6.0 4.4 2.1 4.9 3.3 -
During school 1.3 0.7 1.2 2.9 4.3 2.5 1.1 3.2 2.0 -
After school 2.9 5.0 8.0 7.7 10.3 8.9 5.3 8.8 6.8 -
Week nights 2.8 4.4 7.2 6.6 7.9 7.2 4.8 7.2 5.8 -
Weekends 5.9 11.0 16.3 13.7 15.1 16.2 11.0 14.9 12.7 -
N of Valid 2179 2081 2084 2076 1499 1398 6344 4973 11317
N of Miss 0 0 0 0 0 0 0 0 0
Percentage Tables 196
Pride Surveys Report: 2009-10 Irving Independent Schools
Table 4.107: When do you usually use alcohol?
RESPONSE 6th 7th 8th 9th 10th 11th 6-8th 9-12th TOTAL
Do not use 83.8 85.1 76.6 72.9 67.6 66.0 81.9 69.4 76.4 -
Before school 1.7 1.4 1.7 2.2 3.7 1.9 1.6 2.5 2.0 -
During school 1.1 1.0 1.2 2.5 3.8 2.2 1.1 2.8 1.8 -
After school 3 0 4 2 6 2 5 3 6 4 3 4 4 4 5 1 4 7

8/7/2019 DALLAS COUNTY - Irving ISD - 2010 Pride Survey
http://slidepdf.com/reader/full/dallas-county-irving-isd-2010-pride-survey 197/239
After school 3.0 4.2 6.2 5.3 6.4 3.4 4.4 5.1 4.7 -
Week nights 4.5 7.5 10.5 9.3 10.5 7.4 7.5 9.1 8.2 -
Weekends 13.9 24.2 34.9 33.3 39.2 42.3 24.1 37.6 30.1 -
N of Valid 2179 2081 2084 2076 1499 1398 6344 4973 11317
N of Miss 0 0 0 0 0 0 0 0 0
Percentage Tables 197

8/7/2019 DALLAS COUNTY - Irving ISD - 2010 Pride Survey
http://slidepdf.com/reader/full/dallas-county-irving-isd-2010-pride-survey 198/239
Pride Surveys Report: 2009-10 Irving Independent Schools
4.10 How Wrong Would Your Friends Feel It Would Be For You To...
Table 4.111: How wrong would your friends feel it would be for you to use tobacco?
RESPONSE 6th 7th 8th 9th 10th 11th 6-8th 9-12th TOTAL
Not wrong at all 11 0 13 6 17 7 19 6 25 0 22 2 14 2 21 9 17 6 -

8/7/2019 DALLAS COUNTY - Irving ISD - 2010 Pride Survey
http://slidepdf.com/reader/full/dallas-county-irving-isd-2010-pride-survey 199/239
Not wrong at all 11.0 13.6 17.7 19.6 25.0 22.2 14.2 21.9 17.6
A little bit wrong 11.2 17.0 19.9 21.6 21.0 23.8 16.2 22.0 18.7 -
Wrong 19.8 22.9 24.4 24.2 25.0 23.4 22.4 24.2 23.2 -
Very wrong 58.0 46.5 38.0 34.7 29.0 30.5 47.2 31.8 40.5 -
N of Valid 1827 1928 1947 1864 1354 1254 5702 4472 10174
N of Miss 352 153 137 212 145 144 642 501 1143
Table 4.112: How wrong would your friends feel it would be for you to use alcohol?
RESPONSE 6th 7th 8th 9th 10th 11th 6-8th 9-12th TOTAL
Not wrong at all 14.1 20.1 26.8 28.2 37.2 35.5 20.5 33.0 26.0 -
A little bit wrong 15.3 19.0 22.9 25.0 24.3 26.8 19.1 25.3 21.8 -Wrong 19.7 21.3 20.5 21.0 18.2 17.4 20.5 19.2 19.9 -
Very wrong 50.9 39.6 29.8 25.8 20.3 20.3 39.9 22.6 32.3 -
N of Valid 1818 1927 1938 1862 1348 1252 5683 4462 10145
N of Miss 361 154 146 214 151 146 661 511 1172
Table 4.113: How wrong would your friends feel it would be for you to use marijuana?
RESPONSE 6th 7th 8th 9th 10th 11th 6-8th 9-12th TOTAL
Not wrong at all 10.9 14.8 20.4 23.3 29.1 27.5 15.5 26.2 20.2 -
A little bit wrong 7.8 11.4 15.3 18.5 17.8 19.7 11.6 18.6 14.7 -
Wrong 16.2 18.4 19.1 19.7 20.3 18.7 17.9 19.6 18.6 -
Very wrong 65.1 55.5 45.2 38.6 32.8 34.2 55.0 35.6 46.5 -
N of Valid 1811 1929 1937 1864 1351 1253 5677 4468 10145
N of Miss 368 152 147 212 148 145 667 505 1172
Percentage Tables 199
Pride Surveys Report: 2009-10 Irving Independent Schools
4.11 How Easy Is It To Get...
Table 4.114: How easy is it to get cigarettes, smokeless tobacco, cigars, etc.?
RESPONSE 6th 7th 8th 9th 10th 11th 6-8th 9-12th TOTAL
Don’t Know/Can’t Get 74.1 62.2 52.1 49.3 42.3 37.7 62.7 43.9 54.5 -
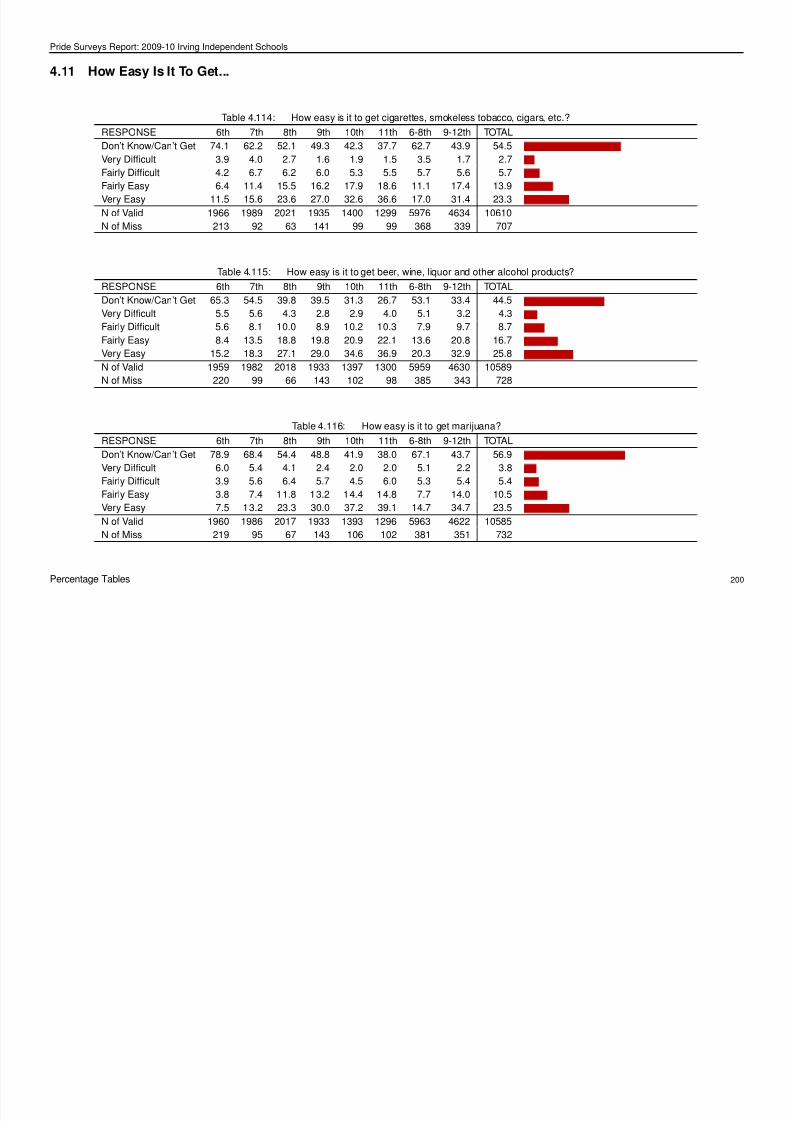
8/7/2019 DALLAS COUNTY - Irving ISD - 2010 Pride Survey
http://slidepdf.com/reader/full/dallas-county-irving-isd-2010-pride-survey 200/239
Very Difficult 3.9 4.0 2.7 1.6 1.9 1.5 3.5 1.7 2.7 -
Fairly Difficult 4.2 6.7 6.2 6.0 5.3 5.5 5.7 5.6 5.7 -Fairly Easy 6.4 11.4 15.5 16.2 17.9 18.6 11.1 17.4 13.9 -
Very Easy 11.5 15.6 23.6 27.0 32.6 36.6 17.0 31.4 23.3 -
N of Valid 1966 1989 2021 1935 1400 1299 5976 4634 10610
N of Miss 213 92 63 141 99 99 368 339 707
Table 4.115: How easy is it to get beer, wine, liquor and other alcohol products?
RESPONSE 6th 7th 8th 9th 10th 11th 6-8th 9-12th TOTAL
Don’t Know/Can’t Get 65.3 54.5 39.8 39.5 31.3 26.7 53.1 33.4 44.5 -
Very Difficult 5.5 5.6 4.3 2.8 2.9 4.0 5.1 3.2 4.3 -
Fairly Difficult 5.6 8.1 10.0 8.9 10.2 10.3 7.9 9.7 8.7 -
Fairly Easy 8.4 13.5 18.8 19.8 20.9 22.1 13.6 20.8 16.7 -
Very Easy 15.2 18.3 27.1 29.0 34.6 36.9 20.3 32.9 25.8 -
N of Valid 1959 1982 2018 1933 1397 1300 5959 4630 10589
N of Miss 220 99 66 143 102 98 385 343 728
Table 4.116: How easy is it to get marijuana?
RESPONSE 6th 7th 8th 9th 10th 11th 6-8th 9-12th TOTALDon’t Know/Can’t Get 78.9 68.4 54.4 48.8 41.9 38.0 67.1 43.7 56.9 -
Very Difficult 6.0 5.4 4.1 2.4 2.0 2.0 5.1 2.2 3.8 -
Fairly Difficult 3.9 5.6 6.4 5.7 4.5 6.0 5.3 5.4 5.4 -
Fairly Easy 3.8 7.4 11.8 13.2 14.4 14.8 7.7 14.0 10.5 -
Very Easy 7.5 13.2 23.3 30.0 37.2 39.1 14.7 34.7 23.5 -
N of Valid 1960 1986 2017 1933 1393 1296 5963 4622 10585
N of Miss 219 95 67 143 106 102 381 351 732
Percentage Tables 200
Pride Surveys Report: 2009-10 Irving Independent Schools
4.12 Vehicle Safety
Table 4.117: During the past 30 days, how many times did you drive a car or other vehicle when you had been drinking alcohol?
RESPONSE 6th 7th 8th 9th 10th 11th 6-8th 9-12th TOTAL
0 times 94.9 94.9 92.7 90.7 90.4 90.7 94.2 90.6 92.6 -
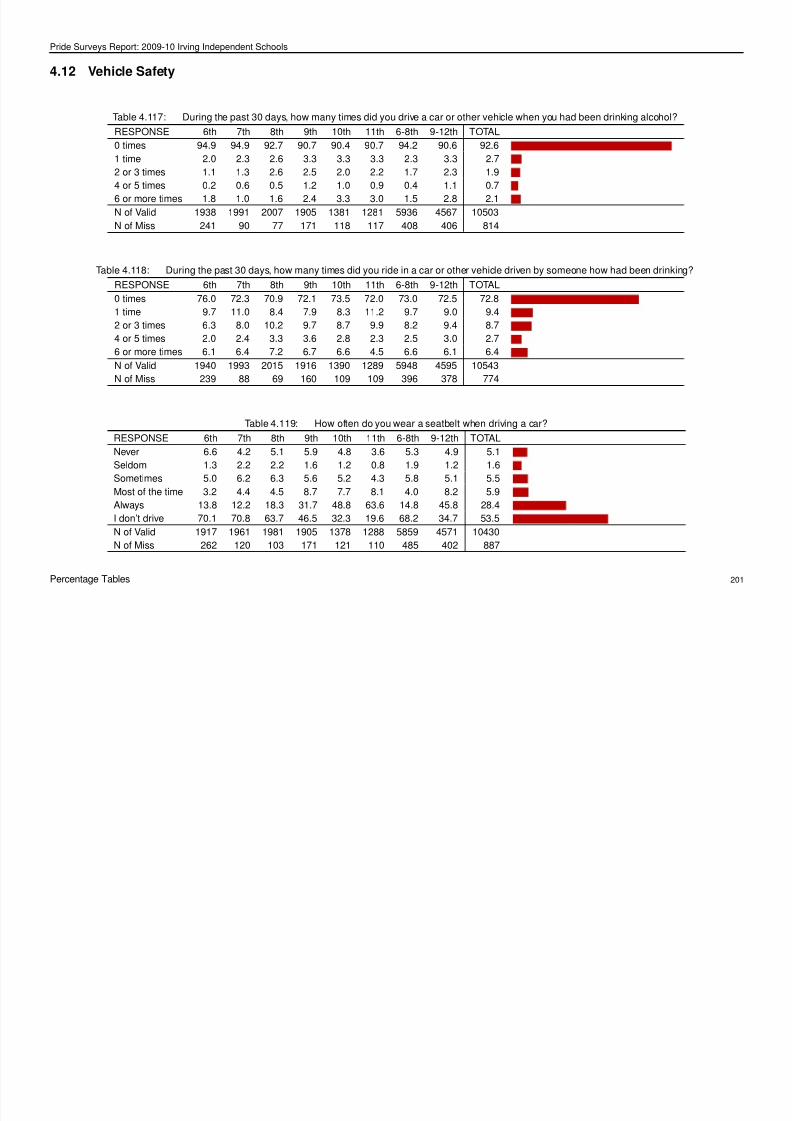
8/7/2019 DALLAS COUNTY - Irving ISD - 2010 Pride Survey
http://slidepdf.com/reader/full/dallas-county-irving-isd-2010-pride-survey 201/239
1 time 2.0 2.3 2.6 3.3 3.3 3.3 2.3 3.3 2.7 -
2 or 3 times 1.1 1.3 2.6 2.5 2.0 2.2 1.7 2.3 1.9 -4 or 5 times 0.2 0.6 0.5 1.2 1.0 0.9 0.4 1.1 0.7 -
6 or more times 1.8 1.0 1.6 2.4 3.3 3.0 1.5 2.8 2.1 -
N of Valid 1938 1991 2007 1905 1381 1281 5936 4567 10503
N of Miss 241 90 77 171 118 117 408 406 814
Table 4.118: During the past 30 days, how many times did you ride in a car or other vehicle driven by someone how had been drinking?
RESPONSE 6th 7th 8th 9th 10th 11th 6-8th 9-12th TOTAL
0 times 76.0 72.3 70.9 72.1 73.5 72.0 73.0 72.5 72.8 -
1 time 9.7 11.0 8.4 7.9 8.3 11.2 9.7 9.0 9.4 -
2 or 3 times 6.3 8.0 10.2 9.7 8.7 9.9 8.2 9.4 8.7 -
4 or 5 times 2.0 2.4 3.3 3.6 2.8 2.3 2.5 3.0 2.7 -
6 or more times 6.1 6.4 7.2 6.7 6.6 4.5 6.6 6.1 6.4 -
N of Valid 1940 1993 2015 1916 1390 1289 5948 4595 10543
N of Miss 239 88 69 160 109 109 396 378 774
Table 4.119: How often do you wear a seatbelt when driving a car?
RESPONSE 6th 7th 8th 9th 10th 11th 6-8th 9-12th TOTAL
Never 6.6 4.2 5.1 5.9 4.8 3.6 5.3 4.9 5.1 -
Seldom 1.3 2.2 2.2 1.6 1.2 0.8 1.9 1.2 1.6 -
Sometimes 5.0 6.2 6.3 5.6 5.2 4.3 5.8 5.1 5.5 -
Most of the time 3.2 4.4 4.5 8.7 7.7 8.1 4.0 8.2 5.9 -
Always 13.8 12.2 18.3 31.7 48.8 63.6 14.8 45.8 28.4 -
I don’t drive 70.1 70.8 63.7 46.5 32.3 19.6 68.2 34.7 53.5 -
N of Valid 1917 1961 1981 1905 1378 1288 5859 4571 10430
N of Miss 262 120 103 171 121 110 485 402 887
Percentage Tables 201
Pride Surveys Report: 2009-10 Irving Independent Schools
Table 4.120: How often do you wear a seatbelt when riding in a car driven by someone else?
RESPONSE 6th 7th 8th 9th 10th 11th 6-8th 9-12th TOTAL
Never 6.9 5.4 6.8 7.2 6.4 4.7 6.4 6.3 6.3 -
Seldom 3.2 6.4 5.9 4.3 3.5 3.4 5.2 3.8 4.6 -
Sometimes 14.8 14.3 16.2 13.7 12.1 11.2 15.1 12.5 14.0 -
Most of the time 17 8 23 2 23 2 23 6 21 7 18 9 21 5 21 7 21 6 -

8/7/2019 DALLAS COUNTY - Irving ISD - 2010 Pride Survey
http://slidepdf.com/reader/full/dallas-county-irving-isd-2010-pride-survey 202/239
Most of the time 17.8 23.2 23.2 23.6 21.7 18.9 21.5 21.7 21.6
Always 57.3 50.7 47.8 51.2 56.3 61.8 51.9 55.7 53.6 -
N of Valid 1922 1971 1992 1905 1375 1288 5885 4568 10453
N of Miss 257 110 92 171 124 110 459 405 864
Percentage Tables 202
Pride Surveys Report: 2009-10 Irving Independent Schools
4.13 While At School Have You...
Table 4.121: Carried a handgun?
RESPONSE 6th 7th 8th 9th 10th 11th 6-8th 9-12th TOTAL
Never 96.4 96.2 94.7 94.5 92.5 95.4 95.7 94.1 95.0 -
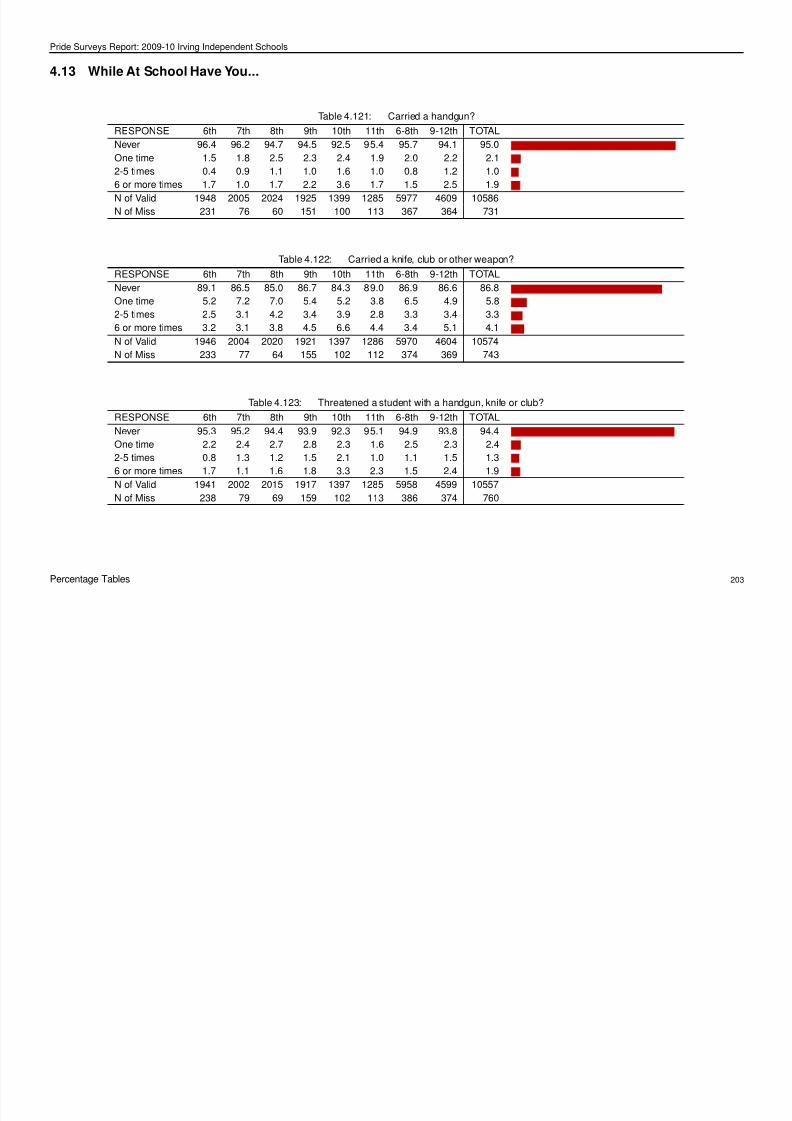
8/7/2019 DALLAS COUNTY - Irving ISD - 2010 Pride Survey
http://slidepdf.com/reader/full/dallas-county-irving-isd-2010-pride-survey 203/239
One time 1.5 1.8 2.5 2.3 2.4 1.9 2.0 2.2 2.1 -
2-5 times 0.4 0.9 1.1 1.0 1.6 1.0 0.8 1.2 1.0 -6 or more times 1.7 1.0 1.7 2.2 3.6 1.7 1.5 2.5 1.9 -
N of Valid 1948 2005 2024 1925 1399 1285 5977 4609 10586
N of Miss 231 76 60 151 100 113 367 364 731
Table 4.122: Carried a knife, club or other weapon?
RESPONSE 6th 7th 8th 9th 10th 11th 6-8th 9-12th TOTAL
Never 89.1 86.5 85.0 86.7 84.3 89.0 86.9 86.6 86.8 -
One time 5.2 7.2 7.0 5.4 5.2 3.8 6.5 4.9 5.8 -
2-5 times 2.5 3.1 4.2 3.4 3.9 2.8 3.3 3.4 3.3 -
6 or more times 3.2 3.1 3.8 4.5 6.6 4.4 3.4 5.1 4.1 -
N of Valid 1946 2004 2020 1921 1397 1286 5970 4604 10574
N of Miss 233 77 64 155 102 112 374 369 743
Table 4.123: Threatened a student with a handgun, knife or club?
RESPONSE 6th 7th 8th 9th 10th 11th 6-8th 9-12th TOTAL
Never 95.3 95.2 94.4 93.9 92.3 95.1 94.9 93.8 94.4 -
One time 2.2 2.4 2.7 2.8 2.3 1.6 2.5 2.3 2.4 -2-5 times 0.8 1.3 1.2 1.5 2.1 1.0 1.1 1.5 1.3 -
6 or more times 1.7 1.1 1.6 1.8 3.3 2.3 1.5 2.4 1.9 -
N of Valid 1941 2002 2015 1917 1397 1285 5958 4599 10557
N of Miss 238 79 69 159 102 113 386 374 760
Percentage Tables 203
Pride Surveys Report: 2009-10 Irving Independent Schools
Table 4.124: Threatened to hurt a student by hitting, slapping or kicking?
RESPONSE 6th 7th 8th 9th 10th 11th 6-8th 9-12th TOTAL
Never 69.4 64.0 62.2 70.6 72.4 76.0 65.2 72.6 68.4 -
One time 13.2 12.1 11.3 9.0 7.8 7.0 12.2 8.1 10.4 -
2-5 times 8.6 10.6 12.6 10.3 8.7 8.5 10.6 9.3 10.1 -
6 or more times 8.9 13.3 13.8 10.1 11.1 8.5 12.0 9.9 11.1 -

8/7/2019 DALLAS COUNTY - Irving ISD - 2010 Pride Survey
http://slidepdf.com/reader/full/dallas-county-irving-isd-2010-pride-survey 204/239
N of Valid 1939 2000 2010 1919 1393 1283 5949 4595 10544
N of Miss 240 81 74 157 106 115 395 378 773
Table 4.125: Hurt a student by using a handgun, knife or club?
RESPONSE 6th 7th 8th 9th 10th 11th 6-8th 9-12th TOTAL
Never 96.9 97.1 96.7 95.3 94.0 96.2 96.9 95.2 96.1 -
One time 1.2 1.4 1.6 1.9 1.4 1.4 1.4 1.6 1.5 -
2-5 times 0.3 0.7 0.3 1.3 1.4 0.7 0.5 1.2 0.8 -
6 or more times 1.7 0.8 1.3 1.4 3.2 1.7 1.3 2.0 1.6 -
N of Valid 1938 1997 2006 1913 1393 1279 5941 4585 10526N of Miss 241 84 78 163 106 119 403 388 791
Table 4.126: Hurt a student by hitting, slapping or kicking?
RESPONSE 6th 7th 8th 9th 10th 11th 6-8th 9-12th TOTAL
Never 68.0 62.8 62.8 73.2 74.9 80.0 64.5 75.6 69.3 -
One time 13.2 14.0 13.1 8.6 8.0 7.6 13.4 8.1 11.1 -
2-5 times 9.7 11.9 13.7 9.6 7.7 7.2 11.8 8.4 10.3 -
6 or more times 9.1 11.2 10.4 8.6 9.4 5.2 10.3 7.9 9.2 -
N of Valid 1930 1995 2003 1911 1395 1282 5928 4588 10516
N of Miss 249 86 81 165 104 116 416 385 801
Percentage Tables 204
Pride Surveys Report: 2009-10 Irving Independent Schools
Table 4.127: Been threatened with a handgun, knife or club by a student?
RESPONSE 6th 7th 8th 9th 10th 11th 6-8th 9-12th TOTAL
Never 90.4 91.3 90.9 90.5 89.4 93.0 90.9 90.9 90.9 -
One time 5.3 4.9 4.2 4.3 3.7 2.8 4.8 3.7 4.3 -
2-5 times 1.9 2.4 2.7 2.5 4.0 1.6 2.3 2.7 2.5 -
6 or more times 2.4 1.4 2.1 2.7 2.9 2.6 2.0 2.8 2.3 -

8/7/2019 DALLAS COUNTY - Irving ISD - 2010 Pride Survey
http://slidepdf.com/reader/full/dallas-county-irving-isd-2010-pride-survey 205/239
N of Valid 1927 1985 2010 1910 1390 1274 5922 4574 10496
N of Miss 252 96 74 166 109 124 422 399 821
Table 4.128: Had a student threaten to hit, slap or kick you?
RESPONSE 6th 7th 8th 9th 10th 11th 6-8th 9-12th TOTAL
Never 64.4 63.2 65.2 72.4 73.9 79.2 64.3 74.7 68.9 -
One time 15.3 16.4 14.8 11.6 9.3 8.7 15.5 10.1 13.1 -
2-5 times 10.9 10.8 11.0 8.9 8.4 6.3 10.9 8.0 9.7 -
6 or more times 9.3 9.6 9.0 7.1 8.5 5.7 9.3 7.1 8.4 -
N of Valid 1922 1983 2010 1912 1393 1281 5915 4586 10501N of Miss 257 98 74 164 106 117 429 387 816
Table 4.129: Been afraid a student may hurt you?
RESPONSE 6th 7th 8th 9th 10th 11th 6-8th 9-12th TOTAL
Never 71.8 75.9 80.3 84.4 84.6 89.5 76.1 85.9 80.3 -
One time 14.8 12.8 9.5 8.4 7.0 5.4 12.3 7.1 10.1 -
2-5 times 6.9 6.1 5.9 3.7 4.9 2.0 6.3 3.6 5.1 -
6 or more times 6.5 5.2 4.3 3.6 3.5 3.1 5.3 3.4 4.5 -
N of Valid 1925 1981 2011 1911 1394 1274 5917 4579 10496
N of Miss 254 100 73 165 105 124 427 394 821
Percentage Tables 205

8/7/2019 DALLAS COUNTY - Irving ISD - 2010 Pride Survey
http://slidepdf.com/reader/full/dallas-county-irving-isd-2010-pride-survey 206/239
Pride Surveys Report: 2009-10 Irving Independent Schools
4.14 In My School, I Feel Safe...
Table 4.132: In my school, I feel safe in the classroom.
RESPONSE 6th 7th 8th 9th 10th 11th 6-8th 9-12th TOTAL
Never 9.3 8.9 11.9 12.4 14.6 11.8 10.1 12.9 11.3 -

8/7/2019 DALLAS COUNTY - Irving ISD - 2010 Pride Survey
http://slidepdf.com/reader/full/dallas-county-irving-isd-2010-pride-survey 207/239
Seldom 4.9 7.2 6.0 8.0 6.5 6.0 6.1 7.0 6.5 -
Sometimes 17.5 17.5 17.0 18.7 15.5 16.9 17.3 17.2 17.3 -Often 18.4 21.7 25.0 26.2 27.5 26.8 21.8 26.8 23.9 -
A Lot 49.9 44.6 40.0 34.8 36.0 38.5 44.7 36.2 41.0 -
N of Valid 1923 1991 2017 1909 1385 1270 5931 4564 10495
N of Miss 256 90 67 167 114 128 413 409 822
Table 4.133: In my school, I feel safe in the cafeteria.
RESPONSE 6th 7th 8th 9th 10th 11th 6-8th 9-12th TOTAL
Never 14.4 14.7 15.6 15.5 16.7 14.2 14.9 15.5 15.2 -Seldom 9.6 10.3 8.6 9.1 9.8 9.2 9.5 9.3 9.4 -
Sometimes 17.9 19.2 18.4 20.8 19.0 20.6 18.5 20.2 19.3 -
Often 18.9 20.4 23.6 24.7 25.9 25.5 21.0 25.3 22.9 -
A Lot 39.2 35.3 33.8 30.0 28.6 30.6 36.1 29.7 33.3 -
N of Valid 1912 1981 2014 1913 1387 1270 5907 4570 10477
N of Miss 267 100 70 163 112 128 437 403 840
Table 4.134: In my school, I feel safe in the halls.
RESPONSE 6th 7th 8th 9th 10th 11th 6-8th 9-12th TOTALNever 22.5 19.0 18.9 17.3 18.6 16.1 20.1 17.4 18.9 -
Seldom 12.8 12.7 10.8 12.2 11.3 11.3 12.1 11.7 11.9 -
Sometimes 18.3 22.5 19.6 21.6 20.0 21.4 20.1 21.0 20.5 -
Often 16.7 17.2 21.7 22.6 23.8 23.4 18.6 23.2 20.6 -
A Lot 29.7 28.6 28.9 26.3 26.3 27.9 29.1 26.7 28.0 -
N of Valid 1905 1985 2011 1911 1387 1270 5901 4568 10469
N of Miss 274 96 73 165 112 128 443 405 848
Percentage Tables 207
Pride Surveys Report: 2009-10 Irving Independent Schools
Table 4.135: In my school, I feel safe in the bathroom.
RESPONSE 6th 7th 8th 9th 10th 11th 6-8th 9-12th TOTAL
Never 26.4 23.7 23.1 19.2 20.2 17.1 24.4 18.9 22.0 -
Seldom 12.6 13.9 12.5 13.1 11.2 11.6 13.0 12.1 12.6 -
Sometimes 17.4 19.5 18.3 21.5 19.0 20.3 18.4 20.4 19.3 -
Often 15.6 15.4 18.9 21.0 23.7 23.2 16.7 22.4 19.2 -

8/7/2019 DALLAS COUNTY - Irving ISD - 2010 Pride Survey
http://slidepdf.com/reader/full/dallas-county-irving-isd-2010-pride-survey 208/239
A Lot 28.1 27.5 27.2 25.2 25.9 27.9 27.6 26.2 27.0 -
N of Valid 1902 1975 2010 1903 1389 1269 5887 4561 10448
N of Miss 277 106 74 173 110 129 457 412 869
Table 4.136: In my school, I feel safe in the gym.
RESPONSE 6th 7th 8th 9th 10th 11th 6-8th 9-12th TOTAL
Never 16.4 15.5 16.5 16.5 17.7 15.2 16.1 16.5 16.3 -
Seldom 8.3 9.9 8.9 10.0 8.2 10.3 9.0 9.6 9.3 -
Sometimes 15.5 17.7 18.2 19.4 16.8 17.8 17.2 18.1 17.6 -
Often 17.9 19.1 22.3 23.4 26.0 23.7 19.8 24.3 21.8 -A Lot 41.8 37.9 34.1 30.6 31.3 33.1 37.9 31.5 35.1 -
N of Valid 1898 1977 2006 1904 1386 1267 5881 4557 10438
N of Miss 281 104 78 172 113 131 463 416 879
Table 4.137: In my school, I feel safe on the school bus.
RESPONSE 6th 7th 8th 9th 10th 11th 6-8th 9-12th TOTAL
Never 35.4 30.0 27.0 22.0 23.8 21.7 30.6 22.5 27.0 -
Seldom 10.1 10.0 8.6 11.3 9.9 10.4 9.5 10.6 10.0 -
Sometimes 13.1 15.5 18.5 18.7 17.3 18.0 15.8 18.1 16.8 -
Often 11.4 14.4 18.4 20.3 22.9 20.5 14.9 21.2 17.7 -
A Lot 30.0 30.2 27.5 27.6 26.1 29.4 29.2 27.6 28.5 -
N of Valid 1736 1858 1961 1889 1375 1253 5555 4517 10072
N of Miss 443 223 123 187 124 145 789 456 1245
Percentage Tables 208
Pride Surveys Report: 2009-10 Irving Independent Schools
Table 4.138: In my school, I feel safe at school events.
RESPONSE 6th 7th 8th 9th 10th 11th 6-8th 9-12th TOTAL
Never 22.3 19.8 19.5 16.9 18.2 16.7 20.5 17.2 19.1 -
Seldom 9.1 9.0 8.5 8.9 8.6 8.7 8.8 8.8 8.8 -
Sometimes 15.7 16.4 17.8 18.8 16.9 18.4 16.7 18.1 17.3 -
Often 15.1 18.9 20.9 23.9 25.3 23.6 18.4 24.2 21.0 -

8/7/2019 DALLAS COUNTY - Irving ISD - 2010 Pride Survey
http://slidepdf.com/reader/full/dallas-county-irving-isd-2010-pride-survey 209/239
A Lot 37.7 35.9 33.3 31.5 31.0 32.7 35.6 31.7 33.9 -
N of Valid 1842 1952 1996 1898 1382 1261 5790 4541 10331
N of Miss 337 129 88 178 117 137 554 432 986
Table 4.139: In my school, I feel safe on the playground.
RESPONSE 6th 7th 8th 9th 10th 11th 6-8th 9-12th TOTAL
Never 30.3 28.4 25.9 22.6 22.0 20.9 28.2 22.0 25.4 -
Seldom 10.9 11.4 9.5 10.8 8.9 8.3 10.6 9.5 10.1 -
Sometimes 15.6 14.8 18.4 17.5 16.8 18.4 16.3 17.5 16.9 -
Often 13.6 16.1 18.1 20.7 23.7 21.9 16.0 21.9 18.6 -A Lot 29.6 29.3 28.2 28.5 28.6 30.5 29.0 29.1 29.0 -
N of Valid 1813 1856 1957 1876 1368 1243 5626 4487 10113
N of Miss 366 225 127 200 131 155 718 486 1204
Table 4.140: In my school, I feel safe in the parking lot.
RESPONSE 6th 7th 8th 9th 10th 11th 6-8th 9-12th TOTAL
Never 38.8 32.7 30.1 23.2 22.8 20.6 33.8 22.4 28.8 -
Seldom 12.7 13.2 11.9 11.8 10.8 10.5 12.6 11.2 12.0 -
Sometimes 14.9 16.8 17.9 19.7 17.3 18.6 16.6 18.6 17.5 -
Often 11.9 14.9 16.5 20.0 23.0 21.8 14.5 21.4 17.5 -
A Lot 21.7 22.4 23.6 25.3 26.1 28.4 22.6 26.4 24.3 -
N of Valid 1877 1969 1993 1897 1385 1262 5839 4544 10383
N of Miss 302 112 91 179 114 136 505 429 934
Percentage Tables 209
Pride Surveys Report: 2009-10 Irving Independent Schools
4.15 Frequency of Use
Table 4.141: Frequency of use of cigarettes?
RESPONSE 6th 7th 8th 9th 10th 11th 6-8th 9-12th TOTAL
Daily 1.4 0.7 1.8 3.7 6.5 5.2 1.3 5.0 2.9 -
W kl 2 5 3 6 6 6 8 2 11 0 9 1 4 2 9 3 6 4

8/7/2019 DALLAS COUNTY - Irving ISD - 2010 Pride Survey
http://slidepdf.com/reader/full/dallas-county-irving-isd-2010-pride-survey 210/239
Weekly 2.5 3.6 6.6 8.2 11.0 9.1 4.2 9.3 6.4 -
Monthly 3.9 5.5 10.2 11.7 14.9 12.5 6.5 12.9 9.3 -Annual 8.3 15.1 22.6 22.0 25.5 24.6 15.2 23.8 18.9 -
N of Valid 2128 2039 2035 2008 1440 1342 6202 4790 10992
N of Miss 51 42 49 68 59 56 142 183 325
Table 4.142: Frequency of use of smokeless tobacco?
RESPONSE 6th 7th 8th 9th 10th 11th 6-8th 9-12th TOTAL
Daily 1.1 0.5 1.0 1.6 3.3 1.8 0.9 2.1 1.4 -
Weekly 1.5 1.3 2.1 2.7 4.9 3.5 1.6 3.6 2.5 -Monthly 2.0 2.0 3.1 4.0 5.8 4.3 2.4 4.6 3.3 -
Annual 2.9 4.0 5.6 6.6 9.0 6.5 4.1 7.3 5.5 -
N of Valid 2124 2043 2043 2002 1446 1346 6210 4794 11004
N of Miss 55 38 41 74 53 52 134 179 313
Table 4.143: Frequency of use of cigars?
RESPONSE 6th 7th 8th 9th 10th 11th 6-8th 9-12th TOTAL
Daily 1.2 0.7 1.2 2.1 3.8 1.9 1.1 2.6 1.7 -
Weekly 1.9 2.1 4.2 5.1 6.6 4.6 2.7 5.4 3.9 -Monthly 2.8 3.2 6.9 8.1 9.5 6.8 4.3 8.1 6.0 -
Annual 5.7 9.5 14.5 15.1 17.1 13.7 9.8 15.3 12.2 -
N of Valid 2119 2033 2028 1997 1436 1342 6180 4775 10955
N of Miss 60 48 56 79 63 56 164 198 362
Percentage Tables 210
Pride Surveys Report: 2009-10 Irving Independent Schools
Table 4.144: Frequency of use of beer?
RESPONSE 6th 7th 8th 9th 10th 11th 6-8th 9-12th TOTAL
Daily 1.6 1.2 1.2 2.5 3.3 2.0 1.3 2.6 1.9 -
Weekly 3.2 4.3 7.1 9.8 12.3 10.5 4.9 10.8 7.4 -
Monthly 4.6 8.5 16.2 18.0 22.7 22.3 9.7 20.6 14.4 -
Annual 19.3 27.3 40.3 39.9 44.2 45.6 28.8 42.8 34.9 -

8/7/2019 DALLAS COUNTY - Irving ISD - 2010 Pride Survey
http://slidepdf.com/reader/full/dallas-county-irving-isd-2010-pride-survey 211/239
N of Valid 2128 2035 2033 2002 1437 1338 6196 4777 10973
N of Miss 51 46 51 74 62 60 148 196 344
Table 4.145: Frequency of use of coolers, breezers, etc.?
RESPONSE 6th 7th 8th 9th 10th 11th 6-8th 9-12th TOTAL
Daily 1.8 1.1 1.5 2.2 3.7 2.1 1.5 2.6 2.0 -
Weekly 3.2 3.7 5.6 7.4 9.4 8.0 4.2 8.1 5.9 -
Monthly 4.3 7.2 13.9 15.4 18.7 19.9 8.4 17.7 12.5 -
Annual 13.8 23.3 34.8 34.9 40.6 43.2 23.8 39.0 30.4 -
N of Valid 2104 2036 2030 1992 1442 1344 6170 4778 10948N of Miss 75 45 54 84 57 54 174 195 369
Table 4.146: Frequency of use of liquor?
RESPONSE 6th 7th 8th 9th 10th 11th 6-8th 9-12th TOTAL
Daily 1.4 1.1 1.3 2.6 3.8 2.4 1.3 2.9 2.0 -
Weekly 2.2 2.8 5.4 8.4 11.6 9.0 3.5 9.5 6.1 -
Monthly 3.6 5.7 12.2 16.2 22.3 21.3 7.1 19.5 12.5 -
Annual 12.1 21.0 33.7 35.4 43.5 45.8 22.1 40.8 30.2 -
N of Valid 2123 2035 2031 1997 1444 1345 6189 4786 10975
N of Miss 56 46 53 79 55 53 155 187 342
Percentage Tables 211
Pride Surveys Report: 2009-10 Irving Independent Schools
Table 4.147: Frequency of use of marijuana?
RESPONSE 6th 7th 8th 9th 10th 11th 6-8th 9-12th TOTAL
Daily 1.5 1.7 3.3 5.3 7.6 5.5 2.2 6.1 3.9 -
Weekly 2.3 4.7 8.9 12.0 15.2 11.9 5.2 12.9 8.6 -
Monthly 3.3 7.2 13.2 16.8 20.9 16.8 7.8 18.0 12.3 -
Annual 6.0 11.2 20.4 24.7 29.2 26.7 12.4 26.6 18.6 -
N f V lid

8/7/2019 DALLAS COUNTY - Irving ISD - 2010 Pride Survey
http://slidepdf.com/reader/full/dallas-county-irving-isd-2010-pride-survey 212/239
N of Valid 2120 2034 2032 2003 1443 1339 6186 4785 10971
N of Miss 59 47 52 73 56 59 158 188 346
Table 4.148: Frequency of use of cocaine?
RESPONSE 6th 7th 8th 9th 10th 11th 6-8th 9-12th TOTAL
Daily 1.2 0.5 0.9 1.5 3.0 1.6 0.9 1.9 1.3 -
Weekly 1.4 1.2 2.2 3.2 4.6 3.1 1.6 3.6 2.5 -
Monthly 1.6 1.7 3.1 4.9 7.0 4.8 2.2 5.5 3.6 -
Annual 3.1 3.6 5.8 7.6 10.3 7.9 4.2 8.5 6.0 -
N of Valid 2124 2037 2035 1997 1442 1342 6196 4781 10977N of Miss 55 44 49 79 57 56 148 192 340
Table 4.149: Frequency of use of uppers?
RESPONSE 6th 7th 8th 9th 10th 11th 6-8th 9-12th TOTAL
Daily 1.1 0.5 0.9 1.6 2.7 1.3 0.8 1.9 1.3 -
Weekly 1.2 1.1 1.6 2.8 4.5 3.2 1.3 3.4 2.2 -
Monthly 1.4 1.7 2.6 4.9 6.6 5.3 1.9 5.5 3.5 -
Annual 2.4 3.1 4.9 7.1 9.9 7.4 3.4 8.0 5.4 -
N of Valid 2085 2028 2037 1999 1440 1343 6150 4782 10932
N of Miss 94 53 47 77 59 55 194 191 385
Percentage Tables 212
Pride Surveys Report: 2009-10 Irving Independent Schools
Table 4.150: Frequency of use of downers?
RESPONSE 6th 7th 8th 9th 10th 11th 6-8th 9-12th TOTAL
Daily 1.2 0.7 1.1 2.1 2.6 1.6 1.0 2.2 1.5 -
Weekly 1.3 1.3 1.8 3.3 4.4 3.0 1.4 3.6 2.4 -
Monthly 1.4 1.8 2.5 5.2 6.5 5.1 1.9 5.5 3.5 -
Annual 2.6 3.1 4.4 7.4 9.6 7.9 3.4 8.2 5.5 -
N f V lid 2078 2032 2037 2002 1440 1346 6147 4788 10935

8/7/2019 DALLAS COUNTY - Irving ISD - 2010 Pride Survey
http://slidepdf.com/reader/full/dallas-county-irving-isd-2010-pride-survey 213/239
N of Valid 2078 2032 2037 2002 1440 1346 6147 4788 10935
N of Miss 101 49 47 74 59 52 197 185 382
Table 4.151: Frequency of use of inhalants?
RESPONSE 6th 7th 8th 9th 10th 11th 6-8th 9-12th TOTAL
Daily 1.5 0.7 1.2 1.3 2.6 1.2 1.2 1.7 1.4 -
Weekly 1.8 1.2 2.3 2.1 3.7 1.6 1.8 2.4 2.0 -
Monthly 2.6 2.5 3.4 3.1 5.1 2.8 2.8 3.6 3.2 -
Annual 6.9 6.6 7.4 6.4 8.2 4.7 7.0 6.5 6.8 -
N of Valid 2085 2031 2037 1999 1439 1346 6153 4784 10937N of Miss 94 50 47 77 60 52 191 189 380
Table 4.152: Frequency of use of hallucinogens?
RESPONSE 6th 7th 8th 9th 10th 11th 6-8th 9-12th TOTAL
Daily 1.2 0.3 0.8 1.4 2.6 1.5 0.8 1.8 1.2 -
Weekly 1.3 0.8 1.6 2.4 4.1 2.4 1.2 2.9 2.0 -
Monthly 1.4 1.1 2.0 3.4 5.8 4.1 1.5 4.3 2.7 -
Annual 2.2 2.1 3.2 5.2 8.2 6.1 2.5 6.4 4.2 -
N of Valid 2063 2029 2033 2000 1442 1345 6125 4787 10912
N of Miss 116 52 51 76 57 53 219 186 405
Percentage Tables 213
Pride Surveys Report: 2009-10 Irving Independent Schools
Table 4.153: Frequency of use of heroin?
RESPONSE 6th 7th 8th 9th 10th 11th 6-8th 9-12th TOTAL
Daily 1.1 0.4 0.9 1.5 2.6 1.3 0.8 1.8 1.2 -
Weekly 1.3 0.8 1.8 2.3 4.0 2.4 1.3 2.9 2.0 -
Monthly 1.6 1.1 2.5 3.5 5.1 2.9 1.7 3.8 2.6 -
Annual 2.6 2.4 4.0 5.1 7.4 4.5 3.0 5.6 4.1 -
N f V lid 2077 2033 2037 2002 1440 1344 6147 4786 10933

8/7/2019 DALLAS COUNTY - Irving ISD - 2010 Pride Survey
http://slidepdf.com/reader/full/dallas-county-irving-isd-2010-pride-survey 214/239
N of Valid 2077 2033 2037 2002 1440 1344 6147 4786 10933
N of Miss 102 48 47 74 59 54 197 187 384
Table 4.154: Frequency of use of steroids?
RESPONSE 6th 7th 8th 9th 10th 11th 6-8th 9-12th TOTAL
Daily 1.1 0.3 0.9 1.5 2.4 1.5 0.8 1.8 1.2 -
Weekly 1.3 0.5 1.2 1.9 3.3 2.2 1.0 2.4 1.6 -
Monthly 1.6 0.8 1.7 2.4 3.7 3.0 1.4 2.9 2.1 -
Annual 2.7 1.8 2.5 3.1 5.2 3.4 2.4 3.8 3.0 -
N of Valid 2096 2029 2042 2002 1441 1344 6167 4787 10954N of Miss 83 52 42 74 58 54 177 186 363
Table 4.155: Frequency of use of ecstasy?
RESPONSE 6th 7th 8th 9th 10th 11th 6-8th 9-12th TOTAL
Daily 1.2 0.5 0.8 1.4 2.8 1.6 0.8 1.8 1.3 -
Weekly 1.4 0.8 1.7 3.1 4.3 3.1 1.3 3.5 2.2 -
Monthly 1.5 1.2 2.5 4.4 6.8 5.3 1.7 5.4 3.3 -
Annual 2.0 2.3 4.9 7.4 11.0 8.9 3.1 8.9 5.6 -
N of Valid 2055 2021 2028 1997 1441 1343 6104 4781 10885
N of Miss 124 60 56 79 58 55 240 192 432
Percentage Tables 214
Pride Surveys Report: 2009-10 Irving Independent Schools
Table 4.156: Frequency of use of meth?
RESPONSE 6th 7th 8th 9th 10th 11th 6-8th 9-12th TOTAL
Daily 1.4 0.4 1.1 1.7 2.5 1.6 1.0 1.9 1.4 -
Weekly 1.6 1.0 1.9 2.4 3.5 2.2 1.5 2.6 2.0 -
Monthly 1.8 1.2 2.4 3.2 4.4 3.0 1.8 3.5 2.6 -
Annual 3.6 3.5 4.8 5.0 6.3 4.7 4.0 5.3 4.6 -
N of Valid 2058 2021 2023 1987 1436 1340 6102 4763 10865

8/7/2019 DALLAS COUNTY - Irving ISD - 2010 Pride Survey
http://slidepdf.com/reader/full/dallas-county-irving-isd-2010-pride-survey 215/239
N of Valid 2058 2021 2023 1987 1436 1340 6102 4763 10865
N of Miss 121 60 61 89 63 58 242 210 452
Table 4.157: Frequency of use of prescriptions drugs?
RESPONSE 6th 7th 8th 9th 10th 11th 6-8th 9-12th TOTAL
Daily 1.2 0.7 1.1 1.6 2.8 1.8 1.0 2.0 1.4 -
Weekly 1.6 1.6 2.1 2.9 4.9 3.6 1.8 3.7 2.6 -
Monthly 2.3 2.3 3.3 4.8 6.9 5.6 2.6 5.7 3.9 -
Annual 4.1 4.6 6.1 8.0 11.1 9.5 4.9 9.4 6.9 -
N of Valid 2094 2030 2038 1991 1442 1345 6162 4778 10940N of Miss 85 51 46 85 57 53 182 195 377
Table 4.158: Frequency of use of pain killers?
RESPONSE 6th 7th 8th 9th 10th 11th 6-8th 9-12th TOTAL
Daily 1.2 0.7 1.1 1.5 2.6 1.7 1.0 1.9 1.4 -
Weekly 1.5 1.5 2.0 3.5 4.4 3.8 1.7 3.8 2.6 -
Monthly 2.0 1.9 3.2 5.4 6.7 6.2 2.3 6.0 3.9 -
Annual 3.5 3.4 5.7 8.6 11.4 9.9 4.2 9.8 6.6 -
N of Valid 2093 2028 2037 1989 1435 1346 6158 4770 10928
N of Miss 86 53 47 87 64 52 186 203 389
Percentage Tables 215
Pride Surveys Report: 2009-10 Irving Independent Schools
Table 4.159: Frequency of use of over-the-counter drugs?
RESPONSE 6th 7th 8th 9th 10th 11th 6-8th 9-12th TOTAL
Daily 1.2 0.6 1.3 1.9 3.1 1.8 1.1 2.2 1.6 -
Weekly 1.8 1.7 2.2 3.5 4.3 3.1 1.9 3.6 2.7 -
Monthly 2.2 2.4 3.5 4.6 6.3 5.2 2.7 5.3 3.8 -
Annual 4.2 5.1 6.6 7.7 10.1 8.3 5.3 8.6 6.7 -
N of Valid 2098 2027 2032 1994 1439 1345 6157 4778 10935

8/7/2019 DALLAS COUNTY - Irving ISD - 2010 Pride Survey
http://slidepdf.com/reader/full/dallas-county-irving-isd-2010-pride-survey 216/239
N of Valid 2098 2027 2032 1994 1439 1345 6157 4778 10935
N of Miss 81 54 52 82 60 53 187 195 382
Table 4.160: Frequency of use of any tobacco?
RESPONSE 6th 7th 8th 9th 10th 11th 6-8th 9-12th TOTAL
Daily 1.5 1.1 2.2 4.3 7.4 5.9 1.6 5.7 3.3 -
Weekly 2.9 4.3 7.2 9.2 12.4 10.1 4.8 10.4 7.2 -
Monthly 4.3 6.6 11.3 13.7 16.5 13.9 7.4 14.6 10.5 -
Annual 9.5 17.7 24.4 25.1 28.5 26.8 17.1 26.6 21.2 -
N of Valid 2136 2049 2045 2012 1447 1350 6230 4809 11039N of Miss 43 32 39 64 52 48 114 164 278
Percentage Tables 216
Pride Surveys Report: 2009-10 Irving Independent Schools
Table 4.161: Frequency of use of any alcohol?
RESPONSE 6th 7th 8th 9th 10th 11th 6-8th 9-12th TOTAL
Daily 2.2 1.7 1.8 3.4 4.6 2.8 1.9 3.6 2.6 -
Weekly 4.4 5.4 9.3 11.4 15.0 13.2 6.3 13.0 9.2 -
Monthly 6.3 11.1 20.1 22.1 27.7 27.8 12.4 25.4 18.0 -
Annual 25.0 36.0 49.6 49.5 55.2 57.6 36.7 53.5 44.0 -
N of Valid 2135 2045 2044 2011 1446 1349 6224 4806 11030

8/7/2019 DALLAS COUNTY - Irving ISD - 2010 Pride Survey
http://slidepdf.com/reader/full/dallas-county-irving-isd-2010-pride-survey 217/239
N of Valid 2135 2045 2044 2011 1446 1349 6224 4806 11030
N of Miss 44 36 40 65 53 49 120 167 287
Table 4.162: Frequency of use of any illicit drug?
RESPONSE 6th 7th 8th 9th 10th 11th 6-8th 9-12th TOTAL
Daily 2.6 2.9 4.6 6.9 9.5 6.8 3.4 7.7 5.2 -
Weekly 4.1 6.6 10.4 14.0 17.4 13.9 7.0 15.0 10.5 -
Monthly 5.6 9.7 15.6 19.0 23.4 19.2 10.2 20.4 14.6 -
Annual 13.8 18.8 26.5 29.0 32.6 30.3 19.6 30.5 24.3 -
N of Valid 2133 2046 2047 2012 1446 1351 6226 4809 11035N of Miss 46 35 37 64 53 47 118 164 282
Percentage Tables 217
Chapter 5

8/7/2019 DALLAS COUNTY - Irving ISD - 2010 Pride Survey
http://slidepdf.com/reader/full/dallas-county-irving-isd-2010-pride-survey 218/239
Narrative Report
5.1 Introduction
Tobacco, alcohol, drug use and violence continues to be a persistent problem
facing the youth of America. The use of mind-altering chemicals has proven
to be especially harmful to the adolescent growth and development process.
Psychoactive drugs interfere with physical, social, and emotional growth dur-ing the critical years of adolescent development.
An adolescent who uses intoxicants is not only at high risk of becoming
drug dependent but is also at an increased risk of dropping out of school,
getting involved in crime, attempting suicide, or becoming involved in an as-
sortment of unacceptable behaviors.
The prevention of adolescent drug and alcohol use, bullying and related
behaviors is most likely to occur when parents, teachers, faith leaders, other
individuals and community organizations, who are part of the child’s friend-
ship circle...
• are well informed of the harmful effects of drugs,
• understand potential danger from threatening behaviors,
• recognize behavioral changes that accompany drug use,
• and understand how drug use and violence is encouraged and ac-
cepted in the social world of the child.
Another key to successful prevention programming is the direct involve-
ment of youth in planning and implementing programs.
This report will help parents, school personnel, students, and other "youth
care givers" understand the extent of drug use and threatening (bullying) be-
haviors in your community.
Your questions concerning this report or information on other reports and
services of Pride Surveys may be obtained by calling the Pride Surveys
office at 1-800-279-6361.
5.1.1 The Pride Surveys Questionnaire
As with any type of meaningful survey, it is important that the data collected
are of high quality and utility. The Pride Surveys Questionnaire was de-
veloped to provide accurate, reliable and useful information about students
through their reported behaviors, perceptions and living environments. Ques-
tionnaire forms and administration procedures have undergone extensive re-
views by independent evaluators over the years. The survey provides users
218
Pride Surveys Report: 2009-10 Irving Independent Schools
with data of high quality and practical application. For more technical informa-
tion about the development of the questionnaire, see the Pride Technical Re-
port: The Pride Questionnaire for Grades 6-12 Developmental Study. These
studies are available on the Pride Surveys website at www.pridesurveys.com.
5.1.2 The Report
Note that all statistics compiled from your survey results are highlighted in
bold.
The 2008-09 Pride National Summary for Grades 6-12 is provided sepa-
rately on the Pride Surveys website. This national data can be compared to
local data contained in your tabular report.
It is important that your school survey be viewed as part of an ongo
8/7/2019 DALLAS COUNTY - Irving ISD - 2010 Pride Survey
http://slidepdf.com/reader/full/dallas-county-irving-isd-2010-pride-survey 219/239
This report was prepared to be used as part of a community-wide prevention
program. For maximum use of your school drug and violence survey, we
suggest that you review each section carefully, share the information with
school officials, teachers, students and parents, and prepare a press release
to inform your community of the results.
This narrative report contains five sections, including the introductory
Section 5.1. Section 5.2 contains information on Gateway Drugs (tobacco, al-
cohol, and marijuana). Section 5.3 contains information on Other Illicit Drugs
(cocaine, uppers, downers, inhalants, hallucinogens, heroin and steroids).The following information on each drug category has been selected for anal-
ysis in this report:
• perceived risk of drug use,
• frequency of drug use reported by students,
• when students reported using drugs,
• where students reported using drugs,
• friends’ use of drugs,
• age of onset of use of drugs,
• availability of drugs as reported by students.
Section 5.4 contains suggestions for community awareness activities uti-
lizing the media and presentations of survey findings to various audiences.
It is important that your school survey be viewed as part of an ongo-
ing process that provides needed information about the prevalence and pat-
terns of tobacco, alcohol and other drug use by students in your commu-
nity. By using the Pride Surveys in your assessment process, you can be
confident of high quality, consistent, and reliable information to assist you
in your drug prevention efforts. For additional assistance with questionnaire
data, call the Pride Surveys Office at 1-800-279-6361. For additional infor-
mation about the health impact of drugs visit the Pride Surveys website at
www.pridesurveys.com.
5.2 Gateway Drugs
The gateway drugs are defined in this report as tobacco, alcohol, and mari-
juana. In most states, alcohol and tobacco products are illegal when used by
minors, but are legal when used by adults. Nevertheless, they are generally
easy to obtain and are widely used by students. Use of alcohol and cigarettes
at early ages has been linked to later use of illicit drugs, thus the term gate-
way drugs . Marijuana is the illicit drug most widely used by the adolescent
population. Although marijuana is itself a dangerous illicit drug, it is also a
strong predictor for use of other addictive drugs. In this section, harmful ef-
fects, prevalence, and patterns of tobacco products (cigarettes, smokeless
tobacco, and cigars), alcohol (beer, wine coolers, and liquor), and marijuana
use are reported.
Narrative Report 219
Pride Surveys Report: 2009-10 Irving Independent Schools
5.2.1 Tobacco
Harmful Effects of Tobacco Products
The use of tobacco products was not always considered to be drug use. How-
ever, cigarette smoke contains more than 1,200 chemicals, none of which are
b fi i l t Wh i tt k i b b d i t th b d it d
Table 5.1: 30-Day Use of Tobacco
DRUG 6th 7th 8th 9th 10th 11th 12th
Any Tobacco 4.3 6.6 11.3 13.7 16.5 13.9 0.0
Cigarettes 3.9 5.5 10.2 11.7 14.9 12.5 0.0
Smokeless Tobacco 2.0 2.0 3.1 4.0 5.8 4.3 0.0
Cigars 2.8 3.2 6.9 8.1 9.5 6.8 0.0

8/7/2019 DALLAS COUNTY - Irving ISD - 2010 Pride Survey
http://slidepdf.com/reader/full/dallas-county-irving-isd-2010-pride-survey 220/239
beneficial to man. When cigarette smoke is absorbed into the body, it de-
creases the oxygen-carrying capacity of the blood and increases the clotting
rate. This reaction, combined with hardening of the arteries associated with
smoking, can cause a heart attack. Using tobacco products is a major cause
of emphysema, chronic bronchitis, lung cancer, heart disease and cancer of
the mouth.
Research indicates that mothers who smoke during pregnancy may dam-
age the unborn child. Women who take birth control pills should not smoke
because of increased risk of blood clots, stroke, heart attack and liver tumors.
It is important that students know the health consequences of tobacco
use, but they may be influenced more by the social stigma and the unattrac-
tive appearance using tobacco can cause. For example, young people may
choose not to smoke because cigarette smoke makes their hair smell bad,
turns their teeth and fingers yellow, and causes bad breath. These are im-
portant considerations for adolescents who are usually concerned about their
appearance.
Frequency and Effects of Tobacco Use
While millions of people in this country have quit smoking cigarettes, there
are still millions that continue to smoke despite warnings of detrimental health
effects. It is important to examine the use of cigarettes by students, for they
are engaging in an unhealthy practice. Also, students who start smoking
tobacco early are more prone to try other drugs, particularly marijuana, than
students who do not use tobacco products.
Additional information about frequency of cigarette smoking by your stu-
dents may be found in the Percentage Tables chapter of your Pride report.
Locations and Times of Tobacco Use
A knowledge of the patterns of adolescent tobacco use is important when
planning and implementing prevention programs. Two of the most important
questions that were asked on the Pride Surveys were Where and When vari-ous drugs are used. Students were asked to respond to various locations and
times they used tobacco products. Responses to Where students used gate-
way drugs included At Home, At School, In a Car, Friend’s House and Other
places in the community. Time of use responses consisted of B efore School,
During School, After School, Week Nights and W eekends. This information
is important in providing insight into the use patterns of tobacco products by
your students.
Although there was some variation, students who smoked cigarettes re-
ported smoking at most locations and times. This finding may be explainedby the highly addictive nature of the nicotine in tobacco, the non-intoxicating
effects of smoking tobacco (as opposed to the intoxicating effects of alcohol),
and adult tolerance for possession and use of tobacco products by minors.
However, as explained earlier, cigarette smoking does present health haz-
ards for the users and for those who share a common environment.
Narrative Report 220
Pride Surveys Report: 2009-10 Irving Independent Schools
Table 5.2: Reported Location of Any Tobacco Use For Your Students
LOCATION 6th 7th 8th 9th 10th 11th 12th
At Home 3.3 4.8 7.0 8.4 10.3 8.2 0.0
At School 1.4 1.0 1.7 3.6 5.5 4.0 0.0
In a Car 1.0 1.4 3.6 5.0 7.7 7.3 0.0
Fr iend’s House 3.8 8.4 12.4 11.1 13.2 12.2 0.0
Other 5.1 9.7 13.0 10.5 11.9 11.9 0.0
wine or wine coolers, and various forms of liquor. It is important for youth and
adults to understand that sources with lower percentages of alcohol, such
as beer and wine coolers, are equally as capable of causing intoxication and
dependency as liquor. However, there appears to be a progression of alcohol
use that begins with beer or wine coolers and on to liquor. Drinking liquor
produces higher levels of intoxication, probably due to its higher concentration
of alcohol.

8/7/2019 DALLAS COUNTY - Irving ISD - 2010 Pride Survey
http://slidepdf.com/reader/full/dallas-county-irving-isd-2010-pride-survey 221/239
Ot e 5 9 3 0 0 5 9 9 0 0
Table 5.3: Reported Times of Any Tobacco Use For Your Students
TIME 6th 7th 8th 9th 10th 11th 12th
Before School 1.5 1.6 3.3 4.5 6.0 4.4 0.0
During School 1.3 0.7 1.2 2.9 4.3 2.5 0.0
After School 2.9 5.0 8.0 7.7 10.3 8.9 0.0
Week Night 2.8 4.4 7.2 6.6 7.9 7.2 0.0
Weekend 5.9 11.0 16.3 13.7 15.1 16.2 0.0
5.2.2 Alcohol
Harmful Effects of Alcohol
Alcohol is a central nervous system depressant, which relaxes the inhibiting
and controlling mechanisms of the brain. The effects of drinking alcohol de-
pend on the amount consumed, body size, food intake, age, genetic suscepti-
bility, and tolerance. Alcohol is metabolized at the rate of about 1/2 ounce perhour, and coffee, tea, or cold showers will not speed up this process. The ef-
fects of drinking alcohol can range from mild intoxication, to mental confusion,
to aggression, to respiratory depression and death. Repeated or chronic use
of alcohol may cause damage to the liver, brain, stomach, skin, and other
systems of the body.
The sources of alcohol most available to youth for consumption are beer,
Since the human body builds a tolerance to alcohol, there is a potential
for addiction for those who drink. This risk of addiction is greater for the
developing adolescent than for mature adults. Junior and senior high students
who use alcohol run the risk of delaying or retarding their normal physical,
mental and social development. Drinking and driving is a popular practice
among teenagers, and alcohol-related accidents are a major cause of death
among 15- to 19-year-olds.
Frequency and Effects of Alcohol Use
Although drinking alcoholic beverages is illegal for minors, beer, wine coolers,
and liquor are popular intoxicants for students. It should be kept in mind that
these data are from 12- to 18-year-old students. Not only are they minors
under the law, and therefore violating the law when using alcohol, but they
are also young adolescents who are abusing alcohol at least once a month
or more often.
Table 5.4: 30-Day Use of Alcohol
DRUG 6th 7th 8th 9th 10th 11th 12th
Any Alcohol 6.3 11.1 20.1 22.1 27.7 27.8 0.0
Beer 4.6 8.5 16.2 18.0 22.7 22.3 0.0
Coolers, Breezers, etc. 4.3 7.2 13.9 15.4 18.7 19.9 0.0
Liquor 3.6 5.7 12.2 16.2 22.3 21.3 0.0
YOUR NOTES:
Narrative Report 221
Pride Surveys Report: 2009-10 Irving Independent Schools
30-Day Use of Any Alcohol, Beer, Coolers and Liquor
2 0 . 1
2 2 . 1
2 7 . 7
2 7 .
8
1 6 . 2
1 8 . 0
2 2 . 7
2 2 . 3
54
1 8 . 7 1
9 . 9
1 6 . 2
2 2 . 3
2 1 . 3
Location of Any Alcohol Use
1 6 . 8
2 2 . 2
2 0 . 1
2 3 . 7
2 2 . 4
2 0 . 4
1 9 . 6
2 6 . 9
2 7 .
4
8
2 0 . 9
1 8 . 6
1 9 . 9
2 2 . 1

8/7/2019 DALLAS COUNTY - Irving ISD - 2010 Pride Survey
http://slidepdf.com/reader/full/dallas-county-irving-isd-2010-pride-survey 222/239
Source: Pride Surveys
Any Alcohol Beer Coolers, Br eezers, etc. Liquor
6 7 8 9 10 11 6 7 8 9 10 11 6 7 8 9 10 11 6 7 8 9 10 11
6 . 3
1 1 . 1
4 . 6
8 . 5
1
4 . 3
7 . 2
1 3 . 9
1 5 .
4
3 . 6
5 . 7
1 2 . 2
1
Locations and Times of Alcohol Use
Drinking alcoholic beverages can produce a mind-altered or intoxicated state.
Given the impairment in thinking and judgement produced by alcohol intoxi-
cation, time of use is an important consideration for targeting prevention activ-
ities. Figures 5-3 through 5-4 contain percentage data for the times of alcohol
use as reported by junior and senior high students in your community.
It is important to note that past research indicates that At School is theleast popular location for use and During School is the least popular time of
use. Weekends tends to be the most popular time of use and At Home tends
to be the most popular with younger students while Friend’s House and Other
tends to be the most popular with older students. These data strongly support
the concept of parent and community involvement in reducing alcohol use by
youth.
Source: Pride Surveys
At Home At School In a Car Friend's House Other
6 7 8 9 10 11 6 7 8 9 10 11 6 7 8 9 10 11 6 7 8 9 10 11 6 7 8 9 10 11
1 2 . 0
1 . 6
0 . 7
2 . 0 2
. 6
4 . 9
3 . 3
1 . 5 2
. 4 4 . 0 4
. 6
7 . 5
4 . 4
5 . 4
1 2 . 0
8 . 9
1 4 . 8
Time of Any Alcohol Use
Source: Pride Surveys
Before School During School After School Weeknight Weekend
6 7 8 9 10 11 6 7 8 9 10 11 6 7 8 9 10 11 6 7 8 9 10 11 6 7 8 9 10 11
1 . 7
1 . 4
1 . 7 2
. 2 3 . 7
1 . 9
1 . 1
1 . 0
1 . 2 2
. 5 3 . 8
2 . 2 3
. 0 4 . 2
6 . 2
5 . 3 6
. 4
3 . 4 4
. 5
7 . 5
1 0 . 5
9 . 3 1
0 . 5
7 . 4
1 3 . 9
2 4 . 2
3 4 . 9
3 3 . 3
3 9 . 2
4 2 . 3
Narrative Report 222
Pride Surveys Report: 2009-10 Irving Independent Schools
Availability of Tobacco Products & Alcohol
The question of availability of tobacco products has been included on the
Pride Surveys . In many communities, cigarettes are purchased by minors
from vending machines in public places without fear of reprisal.
Students were asked to report how easy it was for them to get alcohol,

8/7/2019 DALLAS COUNTY - Irving ISD - 2010 Pride Survey
http://slidepdf.com/reader/full/dallas-county-irving-isd-2010-pride-survey 223/239
specifically in the forms of beer, coolers, breezers, etc. and liquor. Studentscould respond that they Cannot Get alcohol, or that alcohol was Very Difficult,
Fairly Difficult, Fairly Easy, or Very Easy to get. The following table provides
the percentages of students who responded to the Fairly Easy or Very Easy
categories for obtaining tobacco products as well as beer, wine coolers, liquor,
and marijuana.
Use of tobacco products and alcohol by minors is illegal, yetthey areread-
ily available to students. Popular culture condones and often encourages the
use of tobacco and alcohol. While it is important to discourage the illegal use
of tobacco and alcohol through formal education and community preventionprograms, it is also important to reduce the ease by which students may ob-
tain tobacco and alcohol products, whether from home or a neighbor’s home,
or from merchants that sell alcoholic beverages to minors. Cooperation of
parents, students, and educators with local, state, and federal law enforce-
ment agencies should play an important role in reducing the availability of
gateway drugs to students.
Table 5.5: Pct of Students Reporting Fairly Easy or Very Easy to Get To-
bacco and Alcohol
DRUG 6th 7th 8th 9th 10th 11th 12thAny Tobacco 17.9 27.0 39.0 43.2 50.6 55.3 0.0
Any Alcohol 23.6 31.8 45.9 48.8 55.5 59.0 0.0
YOUR NOTES:
Narrative Report 223
Pride Surveys Report: 2009-10 Irving Independent Schools
5.2.3 Marijuana
Harmful Effects of Marijuana
Marijuanais a crude drug madefromthe cannabis sativa plant, and it contains
more than 400 known chemicals. Seventy or more of these chemicals, called
"cannabinoids " are found only in the cannabis plant and in recent years
accumulation of fatty cells, such as the brain, heart, lungs and reproductive
systems. The effect of this drug is even more severe on developing adoles-
cents in junior and senior high school. Not surprisingly, recent research in-
dicates that regular marijuana use reduces the mental efficiency of students
and may increase their susceptability to infection and disease, by interfering
with their immune system.
Production and use of marijuana is illegal in the United States and most

8/7/2019 DALLAS COUNTY - Irving ISD - 2010 Pride Survey
http://slidepdf.com/reader/full/dallas-county-irving-isd-2010-pride-survey 224/239
cannabinoids, are found only in the cannabis plant, and in recent years
we have learned much about their effect on the human body. One of the
cannabinoids, THC (delta-9-tetrahydrocannabinol), is the major mind-altering
chemical in marijuana.
Street names for marijuana include pot, grass, and weed. Smoking pot
became popular with college age students during the late 60’s and early 70’s.
By the middle 70’s the age of users had dropped to junior high and even
elementary school levels.
The marijuana used in the 1960’s was often quite low in THC content,
ranging from .25 to 1 percent, and few health hazards were documented dur-
ing that period. In the early 1970’s, the Mexican marijuana coming into the
country averaged 1 to 2 percent THC content. After 1975, Colombian mar-
ijuana became more prominent, and it ranged from 3 to 6 percent in THC
content. Presently, we have marijuana (a variety called Sinsemilla ) being
grown in the U.S. with THC levels of more than 24 percent. Because of the
stronger, more potent varieties now available, the intoxicating and health ef-
fects of smoking marijuana have increased dramatically. More students are
receiving treatment for marijuana addiction than for alcohol addiction.
The THC and other cannabinoids are fat-soluble chemicals and accumu-late in the fatty linings of cells. They are metabolized very slowly, and may
stay in the body four to six weeks. Thus, the students who smoke pot only
on weekends will gradually accumulate THC content in their body cells. This
build-up of THC is unlike the effect of alcohol, which is water-soluble and
metabolized out of the body much more quickly (usually within 24 hours).
Accumulation of THC in the body affects those areas where there is an
Production and use of marijuana is illegal in the United States and most
other countries around the world. The following table contains data on your
students’ use of marijuana at least once a month or more often.
Monthly Use of Marijuana
Source: Pride Surveys
Percent of Use
6 7 8 9 10 11
3 . 3
7 . 2
1 3 . 2
1 6 . 8
2 0 . 9
1 6 . 8
Location and Time of Marijuana Use
Location and time of marijuana use followed a similar pattern to that of alcohol
use, although the percentage of students who reported smoking marijuana
was considerably less than the percentage who reported drinking alcohol.
Narrative Report 224
Pride Surveys Report: 2009-10 Irving Independent Schools
Location of Marijuana Use
83 8 .
5
1 1 . 6
1 3 . 2
1 5 .
1 1 5 . 5
1 1 . 1 1
1 . 6
1 3 . 5
1 2 . 0
Time of Any Marijuana Use
1 4 . 5
1 5 . 7
1 7 .
0
1 8 . 6

8/7/2019 DALLAS COUNTY - Irving ISD - 2010 Pride Survey
http://slidepdf.com/reader/full/dallas-county-irving-isd-2010-pride-survey 225/239
Source: Pride Surveys
At Home At School In a Car Friend's House Other
6 7 8 9 10 11 6 7 8 9 10 11 6 7 8 9 10 11 6 7 8 9 10 11 6 7 8 9 10 11
0 . 9
1 . 9
4 . 5
6 . 3
7 . 9
6 . 9
1 . 1
0 . 7
2 . 0
3 . 7
5 . 3
3 . 9
0 . 6
1 . 3
3 . 8
6 . 0
8 . 8
2 . 4
6 . 2
3 . 5
5 . 3
Friends’ Use & Age of Onset of Use of Marijuana
Often, marijuana and other illicit drug use will occur within a friendship circle
and those who report use among friends are more likely to use. Past analysis
shows that marijuana is by far the most commonly used of illicit drugs. The
following graphs presents percentage data on friends’ use of your students.
It is important to remember that early use is an indicator of increased risk
for addiction. Figure 5-8 presents data on age of onset of use of marijuanafor your students.
YOUR NOTES:
Source: Pride Surveys
Before School During School After School Weeknight Weekend
6 7 8 9 10 11 6 7 8 9 10 11 6 7 8 9 10 11 6 7 8 9 10 11 6 7 8 9 10 11
1 . 0 1
. 2
3 . 8
5 . 4 5
. 9
5 . 7
0 . 9
0 . 7 1
. 3
3 . 1
3 . 8
3 . 4
1 . 8
3 . 7
6 . 9
8 . 2
9 . 0
8 . 4
1 . 6
2 . 8
6 . 7
8 . 3
9 . 0
8 . 4
3 . 7
7 . 6
Friends' Use of Marijauna
Source: Pride Surveys
Never Seldom Sometimes Often A Lot
6 7 8 9 10 11
8 4 . 2
6 7 .
1
4 8 . 5
3 7 .
6
3 2 . 9
3 1
. 4
4 . 2
1 0 . 2 1
2 . 1
1 3 . 4
1 2 . 3 1 5
. 2
5 . 1
8 . 3
1 3 . 0
1 8 . 7
1 9 . 7
2 1 . 3
2 . 3
5 . 8
1 0 . 8
1 1 . 6
1 2 . 8
1 2 . 4
4 . 2
8 . 5
1 5 .
4 1 8 . 8 2
2 . 2
1 9 . 7
Narrative Report225
Pride Surveys Report: 2009-10 Irving Independent Schools
5.3 Other Illicit Drugs
As stated in the previous section, marijuana is the illicit drug most used by
junior and senior high students. However, many marijuana users become
multiple drug users. Knowledge of the nature and extent of such illicit drug
use is very important in gaining a perspective on the overall adolescent drug
problem in your community. It will also provide you with information on the
5.3.1 Cocaine, Uppers, and Downers
Harmful Effects of Cocaine, Uppers, and Downers
Use of illicit drugs by adolescents is extremely dangerous. The illicit drugs
discussed in this section are highly toxic, addictive, and often cause dramatic
and unpredictable changes in behavior Where gateway drugs may require a

8/7/2019 DALLAS COUNTY - Irving ISD - 2010 Pride Survey
http://slidepdf.com/reader/full/dallas-county-irving-isd-2010-pride-survey 226/239
percentages of your students who are drug dependent or who are at high risk
of becoming drug dependent and in need of professional help.
The other illicit drug categories included in The Pride Surveys Question-
naire for Grades 6-12 are as follows:
Cocaine including crack,
Uppers stimulants,
Downers depressants,
Inhalants such as glue or solventsHallucinogens including LSD and PCP
Heroin opiates
Steroids
Ecstasy MDMA
Meth ice, crank, etc.
Prescription drugs
Pain killers
Over-the-counter drugs
Additional information on all categories of drugs obtained from your sur-
vey may be found in the tabular report.
and unpredictable changes in behavior. Where gateway drugs may require a
period of months or years to cause physical or psychological damage, these
more toxic drugs may cause addiction, permanent damage, or even death
with their early use. Since most of these drugs are produced and distributed
illegally, their purity and chemical content are unknown. They are often con-
taminated with dangerous chemicals.
Much evidence suggests that drug abuse and addiction is a progres-
sive process that begins with gateway drugs (for example: tobacco products,
beer, wine coolers, liquor, and marijuana) and continues into the more unpre-
dictable forms of illicit drugs such as cocaine (including crack) and hallucino-
gens, such as PCP and LSD. Adolescents frequently use an assortment of
drugs such as alcohol, marijuana and cocaine, creating an even more dan-
gerous and unpredictable effect. Students who use these illicit drugs or com-
binations of drugs are at very high risk of dependency and are in need of
professional help. If left untreated, they are likely to suffer permanent physi-
cal damage to body systems and cause continued stress on the family unit.
In addition to the detrimental health and social effects, use of illicit drugs is
related to local criminal activity and is a major contributor to organized crime
and terrorism in the U.S. and abroad. Illicit drug use should not be tolerated.
One example of social movement against a drug is the growing intolerance ofcigarette and tobacco use. We should adopt this attitude and apply it to illicit
drugs as well.
Narrative Report 226
Pride Surveys Report: 2009-10 Irving Independent Schools
Harmful Effects of Cocaine
Cocaine is an alkaloid extracted from the leaf of the coca bush, which is culti-
vated at high altitudes in the Andes Mountains of South America. The alkaloid
is a powerful stimulant to the central nervous system with mind-altering and
energy-producing characteristics. Coca leaves contain only a small amount
of the mind-altering chemical, but the extraction and purification of cocaine
Uppers increase heart rate, breathing rate and blood pressure; dilate
pupils; and decrease appetite. The user can also experience headache,
sweating, blurred vision, dizziness, sleeplessness, and anxiety. People who
use large amounts of amphetamines over a long period of time also develop
hallucinations, delusions, and paranoia. They exhibit bizarre and sometimes
violent behavior. Withdrawal produces fatigue, irritability, paranoia, and de-
pression. Use of uppers, particularly amphetamines, can lead to physical
and psychological dependency.
8/7/2019 DALLAS COUNTY - Irving ISD - 2010 Pride Survey
http://slidepdf.com/reader/full/dallas-county-irving-isd-2010-pride-survey 227/239
produces a new and immensely more powerful drug.
Cocaine, sometimes called coke or snow, is usually snorted or inhaled
through a special pipe. An inexpensive form of cocaine called crack has be-
come very popular. Crack cocaine can be smoked and produces a more
immediate and powerful high than snorting. Cocaine acts directly on the lim-
bic system or old brain where the chemical centers for instinctive pleasure are
located. Use of cocaine produces a surge of energy, pleasure and sense of
confidence. After about a twenty-minute high, the drug withdraws rapidly from
the brain, making the user feel depressed, irritable and fatigued – a condition
called the coke crash.
Cocaine is both psychologically and physically addictive. In the early 70’s,
the small supply and low purity of cocaine available in the U.S. led many so-
called experts to claim that cocaine was non-addictive. Today, cocaine has
proven to be one of the most addictive drugs, if not the most addictive. The
crack form of the drug speeds up the process of addiction or dependence.
Harmful Effects of Uppers
The term "uppers" refers to a category of drugs broadly defined as central
nervous system stimulants. The stronger stimulants are drugs such as am-
phetamines with street names like speed, bennies, dexies, white crosses and
crystal. They are usually taken in capsule form, but may be sniffed or injected.
Milder forms of stimulants are caffeine, ephedrine and phenylpropanolamine.
Common over-the-counter and prescription forms of stimulants are diet pills
and stay-awake pills.
p y g p y
Harmful Effects of Downers
Downers refer to a category of drugs commonly known as depressants. These
drugs depress or slow down the body’s functions and when abused (i.e., their
non-medical use) can cause slurred speech, staggering, poor judgement, and
slow or uncertain reflexes (reactions similar to alcohol intoxication). Downers
include barbiturates, such as secobarbital or phenobarbital; benzodiazepines,
such as Valium, Librium and other drugs that have similar properties. Sleep-ing pills, tranquilizers, and muscle relaxants are examples of downers.
Mixing alcohol and downers poses a particularly dangerous drug use
combination. For example, the use of barbiturates and other depressants,
such as alcohol, multiplies the effects and increases the chance of alcoholism
and drug dependency. Moreover, combined use greatly increases the risk of
death by overdose, whether accidental or deliberate.
Frequency and Effects of Cocaine, Uppers and Downers
The illicit drugs in this section have been grouped for convenience and ef-
ficiency of discussion. Cocaine, uppers and downers will be discussed to-
gether, and inhalants, hallucinogens, heroin and steroids will be discussed
together. Although these drugs have differing effects (see preceding discus-
sion), they are often similar in their patterns of use.
Narrative Report 227
Pride Surveys Report: 2009-10 Irving Independent Schools
Although there is much media coverage about the use of cocaine (es-
pecially "crack" cocaine), the percentage of students who reported using co-
caine is low in comparison to the gateway drugs.
The percentage data for students who reported using cocaine, uppers
and downers within the past year is contained in Figure 5.9. The expected
pattern of higher drug use by senior high students than by junior high students
is evident from the tables in the tabular report. For more detailed data on
5.4 The Media and Data Presentation
Your school-based survey results can be utilized in many ways to promote
and support drug and alcohol abuse prevention in your community. The re-
sults of this survey should be made available to the public in a timely fashion.
Therefore, Section 4 of this chapter is devoted to assisting you in utilizing your
survey findings to make the community more aware of the extent and nature

8/7/2019 DALLAS COUNTY - Irving ISD - 2010 Pride Survey
http://slidepdf.com/reader/full/dallas-county-irving-isd-2010-pride-survey 228/239
frequency of use of cocaine, uppers, and downers by your students, refer to
the Percentage Tables chapter of your Pride Report.
Monthly Use of Cocaine, Uppers and Downers
Source: Pride Surveys
Cocaine Uppers Downers
6 7 8 9 10 11
1 . 6 1
. 7
3 . 1
4 . 9
7 . 0
4 . 8
1 . 4
1 . 7
2 . 6
4 . 9
6 . 6
5 . 3
1 . 4
1 . 8
2 . 5
5 . 2
6 . 5
5 . 1
YOUR NOTES:
of adolescent alcohol and other drug use.
5.4.1 Community Awareness
Community awareness that a drug problem exists is important when mobiliz-
ing the various components of a community in a planned, systematic process
to reduce alcohol and other drug use by youth. Unless the community is
convinced that the problem is serious, real, and local – i.e., a threat to their
children, families and friends – it is less likely that meaningful community in-volvement or support will occur. Community awareness involves informing
as many people as possible of the extent and nature of the adolescent drug
problem. Information collected by your survey of student drug use is very
important in community awareness. It is also important for members of the
community to understand the harmful nature of drug use. Both information
about the harmful affects of drug use and the extent of local drug use is con-
tained in Sections 2 and 3 of this chapter.
Two of the most effective means of conducting community awareness is
through electronic and print media and through presentations to community
groups such as parent and school groups, civic and business organizations,
community coalitions and church groups. Section 4 is designed to assist you
in these activities. Section 4.2. contains information about how you can work
with the media in releasing your survey data and Section 4.3. contains infor-
mation to assist you with presentations to various groups in your community.
Of course, these are suggestions and you may want to change or modify the
suggestions. For example, as you monitor the drug problem through mul-
tiple annual surveys, these data can be added to your press releases and
Narrative Report 228
Pride Surveys Report: 2009-10 Irving Independent Schools
presentations.
5.4.2 The Media
What is generally referred to as The Media includes the traditional print me-
dia (such as, newspapers, magazines, and newsletters), and electronic me-
1. Use standard-size 8 1/2 by 11 white paper, and type the release double
spaced on one side only. The first page should contain the name and
address of your school/organization (letterhead is fine). If special News
Release paper is available, use it.
2. Name a contact person and his/her office and home phone numbers in
the upper right hand corner of the first page. Ideally, this is the person
who prepared the news release. Make sure the contact person has

8/7/2019 DALLAS COUNTY - Irving ISD - 2010 Pride Survey
http://slidepdf.com/reader/full/dallas-county-irving-isd-2010-pride-survey 229/239
dia (such as, television, radio, wire services, and web sites). Non-traditionalsources may include billboards, t-shirts, posters, pay-roll stuffers, grocery
bags, hand bills, etc. The most common of these media used to commu-
nicate survey results have been local newspaper news articles and editorials,
local television and radio news casts, talk-shows, and interviews.
HOW TO GET STARTED!
You can set a date for the announcement of your school data. Choose
a slow news day when nothing major is scheduled in the community. Mid-
morning on Tuesday may be a good time, giving the reporters time to preparetheir stories for an afternoon or early morning edition of the newspaper, or an
early evening broadcast or telecast.
Develop a local news media profile, showing the names, addresses, phone
numbers and contact persons for each newspaper, station and type of pro-
gram. Keep up with times you contact each one, news releases or other ma-
terials you provide them, and what the next steps will be toward giving your
topic coverage. Good sources for help in developing your news media profile
are the yellow pages, locally-published media directories, or media profiles
already available from communications/public relations professionals.
HOW TO WRITE A NEWS RELEASE
Your next step is to prepare a news release on the survey results. A
sample news release is included in Appendix B. The following guidelines may
assist you in preparing a news release:
agreed to handle possible follow-up calls from the media.
3. Write FOR IMMEDIATE RELEASE in the upper left hand corner of the
first page unless you have planned a certain day and time to announce
the survey results, perhaps at a news conference or some other event.
If that is the case, write FOR RELEASE (DATE and TIME). The media
are accustomed to respecting your release time.
4. Give the news release a brief two or three line title, centered in all caps
and bold for emphasis.
5. Be brief with what you write – one to three pages, double spaced. Most
releases do not exceed two pages, but questionnaire data are hard tosummarize and may take an additional page.
6. Write in the active voice and use short sentences and paragraphs.
7. Write MORE at the bottom of each page except the last one to let the
reporter know there is more than one page to the release. Type -30- or
##
in the center of the last page below the last paragraph.
8. Proofread carefully. Reporters are wary of releases that contain typo-
graphical errors, misspellings, or crossouts.
TIPS FOR WRITING YOUR NEWS RELEASE
1. Traditionally, news releases are written in the "inverted pyramid style."
This means that the more important information comes first in case the
reporter doesn’t have space or time for the entire release and wants to
"cut" it from the bottom.
Narrative Report 229
Pride Surveys Report: 2009-10 Irving Independent Schools
2. Include at least two of the five W’s (Who, What, Where, When, and
Why) in the lead (first) paragraph. Your lead paragraph should grab the
reporter’s attention and make him/her want to read and report the news
the release contains.
3. The second paragraph should answer the other W’s.
4. Identify your spokesperson no later than the third paragraph.
include school and school system newsletters and other publications, com-
munity magazines, club and organization newsletters, and church bulletins.
Don’t forget to send them an original copy of your news release.
A News Conference gives your group the opportunity to release important
information to all the news media at once. Here are some tips for setting up
a news conference:

8/7/2019 DALLAS COUNTY - Irving ISD - 2010 Pride Survey
http://slidepdf.com/reader/full/dallas-county-irving-isd-2010-pride-survey 230/239
5. Use quotes to make an emotional point or state an opinion. A goodnews release contains two to four quotes. Remember to obtain the
quoted person’s permission, and let him/her know when the news will
be released so that he/she can be prepared to respond to any media
calls for additional details.
6. Thelast paragraphshould include background information on your school
or organization – a "commercial" for the work you are doing. Include
purpose, size, non-profit status or other pertinent information.
7. Double-check names, dates, places, numbers, and quotes for accuracy.
Your credibility as a source of information is jeopardized when detailsof a news release are inaccurate.
Send an original copy of the news release to all appropriate names on
your media list. Follow-up by phone is important to make sure the release
arrived, answer any questions, provide more information, and offer spokes-
people to be interviewed by phone or in person.
End your conversation by thanking the reporter or editor for his/her time
and interest. And, when the story appears in print or on the air, phone orwrite the reporter/editor a brief but sincere "thank you." Remember, a well
written news release containing valid and interesting data should receive wide
distribution in the news media.
SPECIALIZED PUBLICATIONS AND NEWS CONFERENCES
In addition to the news media in your community, there will be a number
of specialized publications that will be interested in your survey data. They
• Schedule the news conference for a slow news time. You will be more
likely to get a good turnout of reporters.
• Select a location appropriate for your announcement. In the case of a
student drug use report that has implications for the entire community,
you may want to consider the school, City Hall, or some youth oriented
site in the community.
• Develop a good presentation. Include your key spokespeople, but also
include parents and young people who represent the populations af-
fected by the survey announcement.
• Develop a Media Alert to let reporters/editors know about the confer-
ence, and notify them 5 to 7 days in advance.
• Phone the media to remind them to schedule the news conference on
their calendars.
• Develop an information packet to distribute to the media at the con-
ference and to others who are unable to attend. Include your news
release, fact sheets and brochures, and recent news clippings on the
drug problem. You may want to provide biographies of your leadersand/or spokespeople.
EDITORIALS, LETTERS TO THE EDITOR, AND PUBLIC SERVICE AN-
NOUNCEMENTS
Editorials in newspapers and on radio and television express definite opin-
ions on important issues that face the community. Editorials may be produced
Narrative Report 230
Pride Surveys Report: 2009-10 Irving Independent Schools
by the media from materials you provide to them, or you may be asked to read
your own editorial on radio or television as a "community comment." Opinion
pages in newspapers and letters to the editor are other good ways to express
your viewpoint on the problem of early adolescent alcohol and drug use in the
community.
Radio and television make time available to local nonprofit groups for free
announcements that benefit the community by providing needed information
will make the presentation more interesting and informative to the audience.
Necessary arrangements should be made with the organization’s program
chairman. Background information (perhaps a news release) could help the
group to promote your presentation among its membership.
GUIDELINES FOR PRESENTATION OF STUDENTDRUG USE RESULTS
Length of Presentation

8/7/2019 DALLAS COUNTY - Irving ISD - 2010 Pride Survey
http://slidepdf.com/reader/full/dallas-county-irving-isd-2010-pride-survey 231/239
or linking individuals with services. Your student drug use report will be of
interest to Public Service Directors of radio and television who may decide to
air public service announcements (PSA’s) to heighten the community aware-
ness about prevalence and patterns of elementary school students’ use of
gateway drugs.
5.4.3 Presentations to School/Community Groups
An excellent means of reaching the community leadership is through presen-tations to school, parent, civic, business, and religious groups. These groups
are concerned with community issues, particularly those related to the safety
and welfare of youth. Often these organizations will invite prevention leaders
to speak at their meetings. While media coverage will help to make known
your prevention efforts, you will want to contact appropriate groups and orga-
nizations in your community to offer a program on student drug and alcohol
abuse and strategies for combating it.
The interests, needs, and abilities of your audience should be kept in
mind when preparing your presentation. For example, parents are concerned
about drug use that may affect their children and their children’s friends; busi-
ness leaders are mindful of the need for a drug-free work force that includes
workers’ children and future workers.
Select a poised, articulate spokesperson who is thoroughly familiar with
the student data. The graphs, tables, and narrative discussion of the data
in this report should assist the speaker in presenting pertinent and mean-
ingful information. Such presentations are easy to prepare and deliver, and
An important consideration in preparing a presentation is the length of
time you are expected to address the group. Usually civic and business
groups have a limited time available for a program – as little as 5 or 10 min-
utes in some cases. This means only a fraction of the information may be
presented. Once again, concentrate on the type of audience and what you
think they will be interested in and need to hear. It is more important to leave
the audience wanting to know more than having them feeling uncomfortable
by exceeding your allotted time. If possible, leave a few minutes for questions
at the end of your presentation, and always promise to provide additional
information through print materials or a return appearance.
Matching Survey Results to the Audience
In structuring your presentation, keep in mind your audience. If the pre-
sentation is to teachers and administrators, you may want to emphasize stu-
dents’ perceptions of the harmful effects of gateway drug use. Teachers and
administrators will be interested in how often students say they talk to teach-
ers about the harmful effects of drug use. Elementary students’ perceptions
of where and how they get gateway drugs are important to determine if such
perceptions are realistic.
If the presentation is targeted to parents, frequency of use and availability
of drugs are important data to share. Help parents to realize their responsibil-
ity for their child’s actions regarding gateway drug use and the importance of
becoming involved in community drug prevention programs. Civic and busi-
ness groups, law enforcement officers, and court officials will be particularly
interested in the current use and availability of gateway drugs to minors.
Narrative Report 231
Pride Surveys Report: 2009-10 Irving Independent Schools
Organizing Survey Results
Graphs are very effective in communicating the meaning of data. They
enable audiences to "see" the relationship you are explaining. Bar graphs
located in this report can be utilized in describing gateway drug use. However,
you can lose the audience’s attention with too many graphs. Tables are also
effective if they are kept simple.
• relevant to the interests of the audience
• supportive of local drug efforts.
Using Visual Aids
When presenting statistical data, it is advisable to use some visual aids.

8/7/2019 DALLAS COUNTY - Irving ISD - 2010 Pride Survey
http://slidepdf.com/reader/full/dallas-county-irving-isd-2010-pride-survey 232/239
Short sentences or phrases called bullets are an excellent way to commu-
nicate your findings. Bullets can stand alone, be included in a list of findings,
or accompany a graph or table. The following are examples of bullets that
can be used in presentations:
• ONEIN FIVE STUDENTS IN GRADES SEVENAND EIGHT REPORTED
USING BEER AND/OR WINE COOLERS WITHIN THE PAST YEAR
• ONLY ONE PERCENT OF (–YOUR SCHOOL NAME–) STUDENTS
IN GRADES FOUR THROUGH SIX REPORTED USING MARIJUANA
WITHIN THE PAST YEAR
• OVER ONE-THIRD OF STUDENTS IN UPPER ELEMENTARY SCHOOL
REPORTED THAT BEER AND WINE COOLERS WERE EASY TO
GET BY THEIR PEERS AND NEARLY ONE-FOURTHINDICATED LIQUOR
WAS EASY TO GET
• ONE-FOURTHOF SEVENTH GRADE STUDENTS IN –YOUR SCHOOL
NAME– REPORTED MARIJUANA AS EASILY ACCESSIBLE TO THEIR
PEERS
A combination of graphics, tables and bullets are suggested in a presen-
tation to add variety and keep audience attention. It should be kept in mind
that a good presentation is:
• straightforward
• easy to understand
These may range from a simple handout to more elaborate aids, dependingupon the resources and time available to the school or other organizations
concerned with drug abuse prevention. A single visual aid may be used, or
combination aids may be chosen when preparing for a presentation. Often
the time parameters may determine what and how many visual aids can be
used. However, you should be cautious not to use too many visual aids or
rely too heavily on the aids so that the information presented and flow of the
presentation is diminished.
The following are types of presentation aids that you may want to con-
sider:
1. PowerPoint Presentations – have become popular, but require spe-
cial equipment, (i.e. laptop computer with projector). One of the advan-
tages of a PowerPoint Presentation is that handouts can be generated
directly from the presentation without the need to prepare them sepa-
rately;
2. Handouts – are useful in addition to other types of aids and are easy
to transport, and provide a take-home product, but can be expensive
to produce, may be difficult to utilize with large audiences, and maydistract attention from your presentation;
3. Overhead transparencies – are easy and inexpensive to make, can
be viewed by large audiences, but can be cumbersome to use and
require an on-site projector and screen;
4. Flip charts and poster boards – are easy to use, fairly easy to trans-
port, and require no special equipment, but are sometimes expensive
Narrative Report 232
Pride Surveys Report: 2009-10 Irving Independent Schools
and time consuming to make and can only be viewed by a relatively
small audience;
5. Slides – are easy to use and can be viewed by large audiences, but
are difficult and expensive to make, and require an on-site projector
and screen;
6. Video tapes – provide a canned, consistent approach to a topic, utilize
expertise of presenter(s) on tape, and are easy to use, but are very time

8/7/2019 DALLAS COUNTY - Irving ISD - 2010 Pride Survey
http://slidepdf.com/reader/full/dallas-county-irving-isd-2010-pride-survey 233/239
p p ( ) p y y
consuming and expensive to make, require technical expertise for qual-
ity product, require on-site play-back equipment, and may be difficult to
use with large audiences.
YOUR NOTES:
Narrative Report 233

8/7/2019 DALLAS COUNTY - Irving ISD - 2010 Pride Survey
http://slidepdf.com/reader/full/dallas-county-irving-isd-2010-pride-survey 234/239
Pride Surveys Report: 2009-10 Irving Independent Schools
** Page 3 **
____ percent of the junior high students.
When
The most popular times for marijuana use were: weekends, ____ percent;

8/7/2019 DALLAS COUNTY - Irving ISD - 2010 Pride Survey
http://slidepdf.com/reader/full/dallas-county-irving-isd-2010-pride-survey 235/239
week nights, ____ percent; and after school, ____ percent.
The Pride Questionnaire
The Pride Questionnaire has undergone continous development since
1982 and provides reliable and accurate information for monitoring adoles-
cent drug use. Pride Surveys is America’s largest survey of adolescent drug
use. It is based in Bowling Green, Ky (1-800-279-6361). For additional infor-
mationon national trends, visit the Pride Surveys website at www.pridesurveys.com.
##
Narrative Report 235
Chapter 6
D C S C

8/7/2019 DALLAS COUNTY - Irving ISD - 2010 Pride Survey
http://slidepdf.com/reader/full/dallas-county-irving-isd-2010-pride-survey 236/239
Drug-Free Communities Support Program Core Measures
The Drug-Free Communities Support Program, administered by the Cen-
ter for Substance Abuse Prevention, requests specific data which is typically
referred to as the Core Measures of which there are currently four (30 Day
Use, Perception of Risk, Parental Disapproval and Average Age of Onset).
The drug categories measured are tobacco, alcohol and marijuana. The first
set of four tables found on the following page examines these measures bro-
ken down by grade level. The second set of four tables examines these mea-sures broken down by gender. The meaning of the pct column will vary with
each table and is described below. The n column represents the number of
students who responded to the question (i.e. sample size).
30-Day Use The question How often do you use? is used to measure this
statistic by reporting the percentage of students who report using Once
a Month or more often.
Perception of Risk The question Do you feel the following drugs are harmful
to your health? is used to measure this statistic by reporting the per-
centage of students who report that using the drug is Harmful or Very
Harmful to their health. (Note: In order to comply with federal guidlines
an additional question was added to the questionnaire regarding use of
alcohol on a regular basis as opposed to any use of alcohol at all.
Respones to this question are analogous with the other harm questions
and include No Risk, Slight Risk, Moderate Risk and Great Risk. Per-
ception of risk results regarding alcohol are based on the new question
and report the percentage of students who regard regular alcohol use
as Moderate Risk or Great Risk.
Perception of Parental Disapproval The questions How wrong would your
parents feel it would be for you to use ...? is used to measure this
statistic by reporting the percentage of students who report that their
parents would feel it is Wrong or Very Wrong to use tobacco, alcohol
and marijuana.
Age of Onset The question At what age did you first use...? is used to mea-
sure this statistic. The possible responses to this question range from
10 or Under to 17 or Older or Never Used . The table shows the per-
centage of students who reporting having used a particular substance
at sometime in the past (pct), the sample size (n) and the average age
of onset of use (age) of those students who answered the question witha response other than Never Used .
236
Pride Surveys Report: 2009-10 Irving Independent Schools
Table 6.1: Core Measure for 30 Day Use by Grade
Grade Alcohol Tobacco Marijuana
pct n pct n pct n
Grade 6 6.3 2,135 4.3 2,136 3.3 2,120
Grade 7 11.1 2,045 6.6 2,049 7.2 2,034
Grade 8 20.1 2,044 11.3 2,045 13.2 2,032
Grade 9 22.1 2,011 13.7 2,012 16.8 2,003
Grade 10 27.7 1,446 16.5 1,447 20.9 1,443
G

8/7/2019 DALLAS COUNTY - Irving ISD - 2010 Pride Survey
http://slidepdf.com/reader/full/dallas-county-irving-isd-2010-pride-survey 237/239
Grade 11 27.8 1,349 13.9 1,350 16.8 1,339
Grade 12 0.0 0 0.0 0 0.0 0
Combined 18.0 11,030 10.5 11,039 12.3 10,971
Table 6.2: Core Measure of Perception of Risk by Grade
Grade Alcohol Tobacco Marijuana
pct n pct n pct n
Grade 6 75.7 1,982 77.4 2,083 77.9 2,055
Grade 7 75.0 1,982 78.9 2,038 76.7 2,028
Grade 8 74.7 1,999 78.8 2,042 70.2 2,025
Grade 9 75.9 1,959 78.6 2,022 63.1 2,002
Grade 10 72.9 1,414 78.8 1,454 57.9 1,445
Grade 11 77.4 1,327 83.0 1,350 60.9 1,349
Grade 12 0.0 0 0.0 0 0.0 0
Combined 75.3 10,663 79.0 10,989 68.7 10,904
Drug-Free Communities Support Program Core Measures 237
Pride Surveys Report: 2009-10 Irving Independent Schools
Table 6.3: Core Measure of Parental Disapproval by Grade
Grade Alcohol Tobacco Marijuana
pct n pct n pct n
Grade 6 86.0 1,907 90.8 1,920 92.1 1,900
Grade 7 85.3 1,978 93.4 1,984 93.8 1,979
Grade 8 80.4 1,993 91.9 2,000 92.5 1,990
Grade 9 76.9 1,921 87.9 1,921 89.1 1,919
Grade 10 74.4 1,396 85.2 1,396 87.1 1,397
G d 11 72 4 1 282 87 4 1 285 88 2 1 280

8/7/2019 DALLAS COUNTY - Irving ISD - 2010 Pride Survey
http://slidepdf.com/reader/full/dallas-county-irving-isd-2010-pride-survey 238/239
Grade 11 72.4 1,282 87.4 1,285 88.2 1,280
Grade 12 0.0 0 0.0 0 0.0 0
Combined 79.9 10,477 89.8 10,506 90.8 10,465
Table 6.4: Core Measure of Age of Onset by Grade
Grade Alcohol Cigarettes Marijuana
pct n age pct n age pct n age
Grade 6 27.3 2,058 10.7 12.2 2,064 10.8 6.7 2,061 11.1
Grade 7 37.7 2,033 11.1 20.5 2,034 11.3 11.3 2,035 11.6
Grade 8 50.7 2,030 11.8 26.9 2,029 11.8 21.0 2,035 12.3Grade 9 50.1 1,975 12.4 28.5 1,973 12.3 25.2 1,973 12.8
Grade 10 57.3 1,422 12.9 32.3 1,421 12.8 29.7 1,420 13.4
Grade 11 60.5 1,315 13.6 32.6 1,302 13.5 30.6 1,311 14.2
Grade 12 0.0 0 0.0 0.0 0 0.0 0.0 0 0.0
Combined 45.8 10,833 12.2 24.6 10,823 12.2 19.5 10,835 12.8
Table 6.5: Core Measure for 30 Day Use by Sex
Sex Alcohol Tobacco Marijuana
pct n pct n pct nMale 17.8 4,991 12.2 4,994 14.2 4,963
Female 17.6 5,169 8.4 5,174 9.8 5,143
Combined 17.7 10,160 10.3 10,168 12.0 10,106
Drug-Free Communities Support Program Core Measures 238
Pride Surveys Report: 2009-10 Irving Independent Schools
Table 6.6: Core Measure of Perception of Risk by Sex
Sex Alcohol Tobacco Marijuana
pct n pct n pct n
Male 72.1 4,826 77.7 4,971 65.0 4,937
Female 78.9 5,022 80.8 5,158 73.5 5,114
Combined 75.6 9,848 79.3 10,129 69.3 10,051
Table 6 7: Core Measure of Parental Disapproval by Sex

8/7/2019 DALLAS COUNTY - Irving ISD - 2010 Pride Survey
http://slidepdf.com/reader/full/dallas-county-irving-isd-2010-pride-survey 239/239
Table 6.7: Core Measure of Parental Disapproval by Sex
Sex Alcohol Tobacco Marijuana
pct n pct n pct n
Male 79.4 4,727 88.5 4,748 89.7 4,719
Female 81.0 4,934 91.9 4,944 92.4 4,937
C ombined 80.2 9,661 90.2 9,692 91.1 9,656
Table 6.8: Core Measure of Age of Onset by Sex
Sex Alcohol Cigarettes Marijuana
pct n age pct n age pct n age
Male 43.4 4,885 12.0 26.4 4,878 12.0 22.1 4,888 12.7
Female 48.2 5,103 12.3 22.1 5,103 12.3 16.8 5,099 13.1
C ombined 45.8 9,988 12.1 24.2 9,981 12.2 19.4 9,987 12.8