dallas-fort worth housing market update€¦ · –76% of us new home construction. 1q16...
TRANSCRIPT

Dallas-Fort WorthHousing Market Update
2016 Q1

1Q16 Dallas-Fort Worth Housing Market Update Copyright Metrostudy 2016 | April 27, 2016
THE METROSTUDY DIFFERENCE |
LOCAL MARKET FOCUS | NATIONAL COVERAGE
PAGE 2
• #1 residential data provider
• Largest US geographic footprint available
– 900 CBSAs | 2,483 Counties
• Metrostudy survey markets
– Top 25 construction CBSAs
– 30,000 active subdivisions
– 11,000 future subdivisions
– 76% of US new home construction

1Q16 Dallas-Fort Worth Housing Market Update Copyright Metrostudy 2016 | April 27, 2016
Dallas – Fort Worth MarketAnnual Job Growth – 20 year history
(160,000)
(140,000)
(120,000)
(100,000)
(80,000)
(60,000)
(40,000)
(20,000)
-
20,000
40,000
60,000
80,000
100,000
120,000
140,000
160,000
Ma
r-92
Ma
r-93
Ma
r-94
Ma
r-95
Ma
r-96
Ma
r-97
Ma
r-98
Ma
r-99
Ma
r-00
Ma
r-01
Ma
r-02
Ma
r-03
Ma
r-04
Ma
r-05
Ma
r-06
Ma
r-07
Ma
r-08
Ma
r-09
Ma
r-10
Ma
r-11
Ma
r-12
Ma
r-13
Ma
r-14
Ma
r-15
Ma
r-16
Dallas-Plano Division
Fort Worth-Arlington Division
Source: Texas Workforce Commission - CES, Not Seasonally Adjusted
3
Ft. Worth YOY Growth: 17,300
Dallas YOY Growth: 112,600
129,900

1Q16 Dallas-Fort Worth Housing Market Update Copyright Metrostudy 2016 | April 27, 2016
Dallas – Fort Worth MarketAnnual Job Growth – By Sector as of March 2016
(5,000)
-
5,000
10,000
15,000
20,000
25,000
30,000
35,000
40,000
45,000
Min
ing
& C
on
st.
Ma
nu
f
Tra
de
, Tra
nsp
.,Util.
Info
rma
tion
Fina
ncial
Pro
f. Se
rv.
Ed
uc. &
He
alth
Leis.&
Ho
sp
Oth
er S
erv
Go
vtSource: Texas Workforce Commission
4

1Q16 Dallas-Fort Worth Housing Market Update Copyright Metrostudy 2016 | April 27, 2016
Dallas – Fort Worth MarketUnemployment Rate – 15 year history
3.8%
7.0%
4.5%
8.6%
3.8%
0.0%
1.0%
2.0%
3.0%
4.0%
5.0%
6.0%
7.0%
8.0%
9.0%
10.0%
Mar-0
1
Mar-0
2
Mar-0
3
Mar-0
4
Mar-0
5
Mar-0
6
Mar-0
7
Mar-0
8
Mar-0
9
Mar-1
0
Mar-1
1
Mar-1
2
Mar-1
3
Mar-1
4
Mar-1
5
Mar-1
6U
nem
plo
yem
en
t R
ate
Source: Texas Workforce Commission
5

1Q16 Dallas-Fort Worth Housing Market Update Copyright Metrostudy 2016 | April 27, 2016
5-Year Mortgage Rate Trend
6
0%
1%
2%
3%
4%
5%
6%
7%
8%
9%
Key Interest Rate History, 1996-201630 Yr Rate 10 Year T-Bill Fed Funds Rate
3.69%
Source: Freddie Mac Primary Mortgage Market Survey®, Federal Reserve Bank of NY

1Q16 Dallas-Fort Worth Housing Market Update Copyright Metrostudy 2016 | April 27, 2016
National Economic Overview Top Job Growth Markets Ranked by Change in Emp. – February 2016
Source: Metrostudy - MetroUSA
7
Rank MSA
Total
Employment
Annual Job
Growth
Annual Job
Growth %
1 New York-Newark-Jersey City, NY-NJ-PA 9,296,300 181,700 2.0%
2 Los Angeles-Long Beach-Anaheim, CA 5,893,300 149,600 2.6%
3 Dallas-Fort Worth-Arlington, TX 3,447,800 116,800 3.5%
4 Chicago-Naperville-Elgin, IL-IN-WI 4,542,000 77,000 1.7%
5 San Francisco-Oakland-Hayward, CA 2,284,700 75,500 3.4%
6 Atlanta-Sandy Springs-Roswell, GA 2,606,500 72,500 2.9%
7 Washington-Arlington-Alexandria, DC-VA-MD-WV 3,180,500 68,800 2.2%
8 Miami-Fort Lauderdale-West Palm Beach, FL 2,554,800 67,800 2.7%
9 Phoenix-Mesa-Scottsdale, AZ 1,964,800 67,000 3.5%
10 Philadelphia-Camden-Wilmington, PA-NJ-DE-MD 2,826,900 60,000 2.2%
11 Seattle-Tacoma-Bellevue, WA 1,910,100 58,600 3.2%
12 Orlando-Kissimmee-Sanford, FL 1,183,800 47,900 4.2%
13 Riverside-San Bernardino-Ontario, CA 1,371,800 46,800 3.5%
14 Detroit-Warren-Dearborn, MI 1,936,800 39,800 2.1%
15 Austin-Round Rock, TX 978,000 39,800 4.2%
24 San Antonio-New Braunfels, TX 992,300 25,400 2.6%
47 Houston-The Woodlands-Sugar Land, TX 2,983,600 9,000 0.3%

1Q16 Dallas-Fort Worth Housing Market Update Copyright Metrostudy 2016 | April 27, 2016
National Economic Overview Top Metrostudy CBSAs – Ranked by Annual Starts
8
Rank Market Annual Starts Annual Change
1 Dallas/Ft.Worth 28,878 5,315
2 Houston 27,263 -3,089
3 Atlanta 19,967 2,987
4 Phoenix/Tucson 19,503 6,684
5 Central Florida 18,943 2,242
6 Southern California 17,356 2,233
7 Denver/Colorado Springs 16,671 3,040
8 Northern California 13,702 2,858
9 Austin 12,655 1,021
10 Charlotte 10,530 1,153
11 Raleigh/Durham 10,437 1,888
12 Philadelphia Region 9,843 370
13 Suburban Maryland 9,719 -127
14 San Antonio 9,696 345
15 Salt Lake City 9,625 1,964

Dallas/Fort Worth MarketMultifamily and Resale Market
2016 Q1

1Q16 Dallas-Fort Worth Housing Market Update Copyright Metrostudy 2016 | April 27, 2016
Dallas/Fort Worth Market Apartment Market Summary
Source: ALN Apartment Data, Inc.
10
1Q16 Dallas-Fort Worth Housing Market Update Copyright Metrostudy 2016 | April 27, 2016
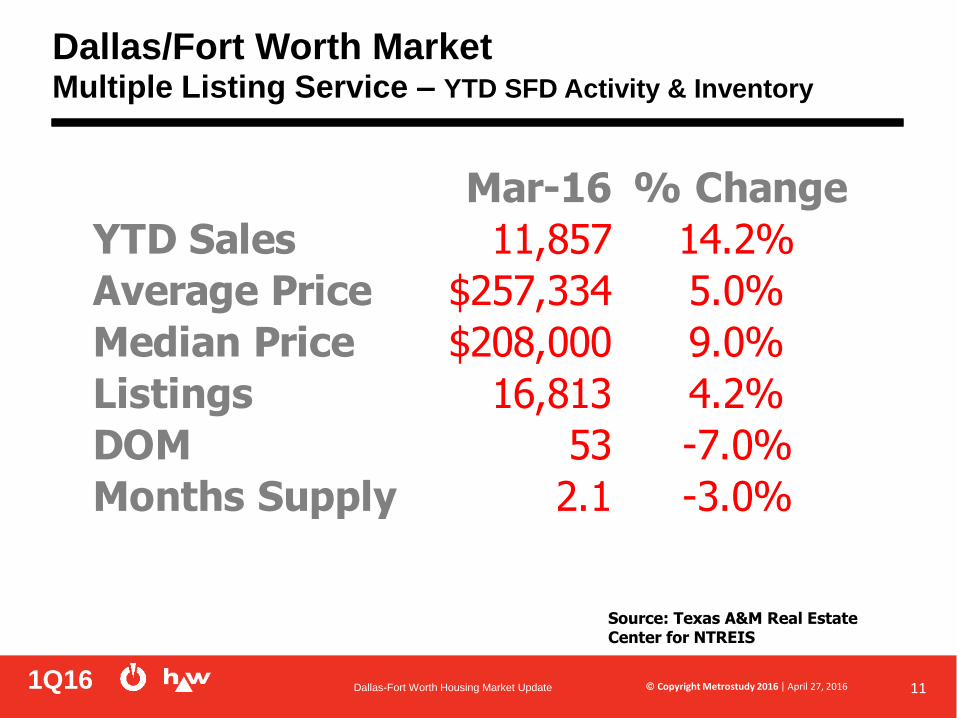
Dallas/Fort Worth MarketMultiple Listing Service – YTD SFD Activity & Inventory
Source: Texas A&M Real Estate Center for NTREIS
11
Mar-16 % Change
YTD Sales 11,857 14.2%
Average Price $257,334 5.0%
Median Price $208,000 9.0%
Listings 16,813 4.2%
DOM 53 -7.0%
Months Supply 2.1 -3.0%

1Q16 Dallas-Fort Worth Housing Market Update Copyright Metrostudy 2016 | April 27, 2016
Dallas/Fort Worth MarketMultiple Listing Service – Monthly New Listings
Source: Texas A&M Real Estate Center for NTREIS
3,000
5,000
7,000
9,000
11,000
13,000
15,000
Jan Feb Mar Apr May Jun Jul Aug Sep Oct Nov Dec
2015
2016
12

Dallas/Fort Worth MarketSFD & TH New Construction
2016 Q1

1Q16 Dallas-Fort Worth Housing Market Update Copyright Metrostudy 2016 | April 27, 2016
Dallas/Fort Worth Market SFD-TH – Starts and Closings
28,759
24,754
-
10,000
20,000
30,000
40,000
50,000
60,000
1Q06 1Q07 1Q08 1Q09 1Q10 1Q11 1Q12 1Q13 1Q14 1Q15 1Q16
An
nu
al
Sta
rts
& C
losi
ng
s
Annual Starts
Annual Closings
14

1Q16 Dallas-Fort Worth Housing Market Update Copyright Metrostudy 2016 | April 27, 2016
Dallas/Fort Worth Market SFD-TH – Quarterly Starts
-
1,000
2,000
3,000
4,000
5,000
6,000
7,000
8,000
9,000
2Q15 3Q15 4Q15 1Q16
6,935 7,015
6,033
5,044
Qu
art
erl
y S
tart
s
Two year earlier
Prior Year
Current Year
1Q4Q3Q2Q
15

Top 1Q16 DFW Communities Ranked by Annual Starts
#6 Castle Hills300 St., 274 Cl.
#1 Westridge548 St., 422 Cl.
#2 Paloma Creek 461 St., 396 Cl.
#5 Richwoods330 St., 329 Cl.
#8 Harvest266 St., 182 Cl.
#10 Hidden Cove254 St., 208 Cl.
#9 Frisco Lakes261 St., 201 Cl.
#4 Light Farms367 St., 251 Cl.
#7 Cross Oak Ranch267 St., 254 Cl.
#3 Phillips Creek Ranch382 St., 306 Cl.
16

1Q16 Dallas-Fort Worth Housing Market Update Copyright Metrostudy 2016 | April 27, 2016
Dallas/Fort Worth MarketTop 1Q16 SFD-TH Builders – Ranked by Annual Starts
*Excludes Custom Builder Sections
Rank Builder
Annual
Starts
Annual
Closings
1 D.R. Horton/Emerald/Express Homes 4,460 3,737
2 Highland/Huntington/Horizon/Sanders 1,539 1,309
3 Lennar/Villlage 1,331 1,168
4 Pulte/Centex/Del Webb 1,011 863
5 First Texas/Gallery 990 992
6 Bloomfield Homes 973 862
7 K. Hovnanian Homes 815 685
8 History Maker/Rendition 757 644
9 Megatel Homes 729 617
10 Beazer Homes 714 586
17

1Q16 Dallas-Fort Worth Housing Market Update Copyright Metrostudy 2016 | April 27, 2016
Dallas/Fort Worth MarketTop 1Q16 SFD-TH Builders – Ranked by Annual Starts
*Excludes Custom Builder Sections
Rank Builder
Annual
Starts
Annual
Closings
11 American Legend/Belclaire/Avanti 675 717
12 LGI Homes 663 494
13 CalAtlantic Homes 621 655
14 J Houston/John Houston Custom 512 508
15 Darling Homes 507 490
16 Meritage Homes 484 354
17 Grand Homes 449 348
18 Gehan Homes 429 378
19 David Weekley Homes 427 356
20 Landon Homes/Signature 419 451
18

1Q16 Dallas-Fort Worth Housing Market Update Copyright Metrostudy 2016 | April 27, 2016
Dallas/Fort Worth Market SFD-TH – Sales per Model Home
869
28.5
0.0
5.0
10.0
15.0
20.0
25.0
30.0
35.0
-
200
400
600
800
1,000
1,200
1,400
1,600
1,800
2,000
1Q06 1Q07 1Q08 1Q09 1Q10 1Q11 1Q12 1Q13 1Q14 1Q15 1Q16
Sales Per ModelM
odel
Hom
es
Models Sales Per Model
19

1Q16 Dallas-Fort Worth Housing Market Update Copyright Metrostudy 2016 | April 27, 2016
Dallas/Fort Worth Market SFD-TH – New Home Inventory & MOS
4,097
11,565
8.0
0.0
1.0
2.0
3.0
4.0
5.0
6.0
7.0
8.0
9.0
-
5,000
10,000
15,000
20,000
25,000
30,000
1Q06 1Q07 1Q08 1Q09 1Q10 1Q11 1Q12 1Q13 1Q14 1Q15 1Q16
Months of Supply
Hou
sing
Inv
ento
ry Under Construction
Finished Vacant
Models
Months of Supply
20

1Q16 Dallas-Fort Worth Housing Market Update Copyright Metrostudy 2016 | April 27, 2016
Dallas/Fort Worth Market SFD-TH – Finished Vacant Inventory
4,097
2.0
0.0
0.5
1.0
1.5
2.0
2.5
3.0
3.5
-
2,000
4,000
6,000
8,000
10,000
12,000
14,000
1Q06 1Q07 1Q08 1Q09 1Q10 1Q11 1Q12 1Q13 1Q14 1Q15 1Q16
Months of SupplyFi
nVac
Hom
es
Finished Vacant
FinVac MOS
21

1Q16 Dallas-Fort Worth Housing Market Update Copyright Metrostudy 2016 | April 27, 2016
0%
10%
20%
30%
40%
50%
60%
70%
80%
90%
100%
2Q13 3Q13 4Q13 1Q14 2Q14 3Q14 4Q14 1Q15 2Q15 3Q15 4Q15 1Q16
Percentage of Floorplans Price
Increased
Dallas/Fort Worth Market Product Price Changes
22

1Q16 Dallas-Fort Worth Housing Market Update Copyright Metrostudy 2016 | April 27, 2016
Dallas/Fort Worth Market Product Price Changes
0.0%
2.0%
4.0%
6.0%
8.0%
10.0%
12.0%
2Q13 3Q13 4Q13 1Q14 2Q14 3Q14 4Q14 1Q15 2Q15 3Q15 4Q15 1Q16
Annualized Average Price Change
23

1Q16 Dallas-Fort Worth Housing Market Update Copyright Metrostudy 2016 | April 27, 2016
Dallas/Fort Worth Market SFD-TH – Average Change by Price Range
0.0%
1.0%
2.0%
3.0%
4.0%
5.0%
6.0%
7.0%
$0 to $200 $200 to$250
$250 to$300
$300 to$350
$350 to$400
$400 to$500
$500 to$750
An
nu
ali
zed
Pri
ce C
han
ge
24

1Q16 Dallas-Fort Worth Housing Market Update Copyright Metrostudy 2016 | April 27, 2016
Dallas/Fort Worth Market SFD-TH – Year over Year Change in Starts & Closings
-14.6%
23.3%
51.8% 81.2%
39.2%
48.0%
50.3%
31.7%
-20.0%
0.0%
20.0%
40.0%
60.0%
80.0%
100.0%
0
200
400
600
800
1,000
1,200
1,400
$1-$199 $200-$249
$250-$299
$300-$349
$350-$399
$400-$499
$500-$749
$750-$99999
Quart
erly S
tarts
1Q15 1Q16
25
-31.0%
0.2% 16.0%46.4%
46.0%
38.1%
31.5%
19.1%
-40.0%
-30.0%
-20.0%
-10.0%
0.0%
10.0%
20.0%
30.0%
40.0%
50.0%
60.0%
0
200
400
600
800
1,000
1,200
$1-$199 $200-$249
$250-$299
$300-$349
$350-$399
$400-$499
$500-$749
$750-$99999
Quar
terly
Clo
sings
1Q15 1Q16
Starts
Closings

1Q16 Dallas-Fort Worth Housing Market Update Copyright Metrostudy 2016 | April 27, 2016
Dallas/Fort Worth Market SFD-TH – 5 Year History in Inventory by Price
0
500
1,000
1,500
2,000
2,500
3,000
$1-$199 $200-$249
$250-$299
$300-$349
$350-$399
$400-$499
$500-$749
$750-$99999
Ho
usi
ng
In
ven
tory
26

1Q16 Dallas-Fort Worth Housing Market Update Copyright Metrostudy 2016 | April 27, 2016
Dallas/Fort Worth Market SFD-TH – Housing Inventory & MOS by Price
4.7
5.4
7.4
8.8 8.7
9.610.2
14.7
0.0
2.0
4.0
6.0
8.0
10.0
12.0
14.0
16.0
-
500
1,000
1,500
2,000
2,500
3,000
$1-$199 $200-$249
$250-$299
$300-$349
$350-$399
$400-$499
$500-$749
$750-$99999
Mo
nth
s of S
up
ply
Ho
usi
ng
In
ven
tory
Under Construction
Finished Vacant
Models
Months of Supply
27

1Q16 Dallas-Fort Worth Housing Market Update Copyright Metrostudy 2016 | April 27, 2016
Dallas/Fort Worth Market SFD-TH – Finished Vacant Inventory & MOS by Price
1.3
1.5
1.8
2.02.2
2.5 2.6
2.9
0.0
0.5
1.0
1.5
2.0
2.5
3.0
3.5
4.0
-
100
200
300
400
500
600
700
800
$1-$199 $200-$249
$250-$299
$300-$349
$350-$399
$400-$499
$500-$749
$750-$99999
Mo
nth
s o
f S
up
ply
Fin
Vac
Ho
mes
Finished Vacant Inventory
Months of Supply
28

1Q16 Dallas-Fort Worth Housing Market Update Copyright Metrostudy 2016 | April 27, 2016
Dallas/Fort Worth Market SFD-TH – Lot Inventory
47,759
19.9
0.0
10.0
20.0
30.0
40.0
50.0
60.0
70.0
80.0
0
10,000
20,000
30,000
40,000
50,000
60,000
70,000
80,000
90,000
100,000
1Q06 1Q07 1Q08 1Q09 1Q10 1Q11 1Q12 1Q13 1Q14 1Q15 1Q16
Mo
nth
s of S
up
ply
Lots
/Sta
rts
Vacant Developed Lots
Annual Starts
VDL Months of Supply
29

1Q16 Dallas-Fort Worth Housing Market Update Copyright Metrostudy 2016 | April 27, 2016
19%
18%
15%
11%
9%
13%
10%
5%4%
15%
17%
15%
13%
17%
15%
5%
0%
5%
10%
15%
20%
25%
$1-$199 $200-$249
$250-$299
$300-$349
$350-$399
$400-$499
$500-$749
$750-$99999
Sh
are
Starts Lot Deliveries
Dallas/Fort Worth Market SFD-TH – Annual Lot Deliveries vs. Starts by Price
30

1Q16 Dallas-Fort Worth Housing Market Update Copyright Metrostudy 2016 | April 27, 2016
Dallas/Fort Worth Market SFD-TH – Lots under construction
Excavating Streets, 15,717, 74%
Paving Streets, 3,585, 17%
Streets in, 1,850, 9%
31

Dallas/Fort Worth MarketDevelopment Activity & Inventory by Area
2016 Q1

1Q16 Dallas-Fort Worth Housing Market Update Copyright Metrostudy 2016 | April 27, 2016
Dallas/Fort Worth Market SFD-TH – Lots under construction by submarket
-
500
1,000
1,500
2,000
2,500
3,000
Ho
usi
ng
In
ven
tory
Streets completed
Paving
Excavating Roads
33

1Q16 Dallas-Fort Worth Housing Market Update Copyright Metrostudy 2016 | April 27, 2016
Dallas/Fort Worth Market SFD-TH – Top Ten Submarkets by Starts
-
500
1,000
1,500
2,000
2,500
Ann
ual S
tart
s &
Clo
sing
s
Annual Starts Annual Closings
34

Dallas/Fort Worth MarketDevelopment Activity & Inv. by Price & Area
2016 Q1

1Q16 Dallas-Fort Worth Housing Market Update Copyright Metrostudy 2016 | April 27, 2016 36
Dallas/Fort Worth Market SFD-TH – Top 20 Submarkets at various price ranges
Rank Submarket Price Range
Annual
Starts
Annual
Closings
Finished
Vacant Months
Supply
Housing
Months Supply
VDL Months
Supply
1 Frisco $500-$749 893 776 1.9 9.1 16.7
2 Denton County $250-$299 808 661 1.2 6.8 15.0
3 Frisco $400-$499 697 670 1.7 7.1 14.3
4 N Fort Worth $200-$249 632 640 1.2 4.7 13.6
5 Mckinney $300-$349 595 531 1.5 7.5 14.9
7 N Fort Worth $1-$199 593 654 0.6 2.3 11.0
6 N Fort Worth $250-$299 531 460 1.4 5.9 13.1
8 Denton County $200-$249 509 442 0.7 4.3 7.9
9 Denton County $300-$349 464 434 1.7 7.7 21.8
10 Mckinney $350-$399 426 389 1.6 7.1 18.8
11 Mckinney $250-$299 403 309 1.6 7.9 12.9
12 SW Fort Worth $1-$199 346 284 2.1 7.0 18.4
13 Mckinney $400-$499 302 239 3.4 11.7 20.3
14 Prosper $400-$499 280 252 3.2 10.0 18.7
15 NW/NC Dallas $750-$99999 270 237 3.0 12.0 9.5
16 Denton $250-$299 266 218 2.3 8.0 9.1
17 Irving $500-$749 252 204 2.2 9.4 19.6
18 Denton $200-$249 250 261 1.4 4.2 2.9
19 Allen $400-$499 248 211 3.0 8.3 10.0
20 Lewisville $400-$499 224 189 2.2 5.7 19.0

Dallas/Fort Worth MarketConsumer Segmentation
2016 Q1

1Q16 Dallas-Fort Worth Housing Market Update Copyright Metrostudy 2016 | April 27, 2016 38
We Cannot Solve our Problems with the Same Thinking We used when
We Created Them- Albert Einstein

1Q16 Dallas-Fort Worth Housing Market Update Copyright Metrostudy 2016 | April 27, 2016
Targeted Consumer Marketing
39

1Q16 Dallas-Fort Worth Housing Market Update Copyright Metrostudy 2016 | April 27, 2016
Targeted Consumer Marketing
40
LIKE I-35, YOUR HOME
IS A WORK IN PROGRESS
YES! WE’RE OPEN

1Q16 Dallas-Fort Worth Housing Market Update Copyright Metrostudy 2016 | April 27, 2016
Approach
Consumers Through the Lens of Housing
41
Metrostudy Housing Consumer Groups
• Leverage over 30 years of research and home building experience
• Built on Neustar® ElementOne® segmentation system and best data available
• Segmentation and demographics applied to every home closing, new & resale, in the U.S.—over 100M houses

1Q16 Dallas-Fort Worth Housing Market Update Copyright Metrostudy 2016 | April 27, 2016
Dallas/Fort Worth Market Metrostudy Consumer Groups | Income & Age View
42
Elite
Entry Level
Active Adult Elite
Active Adult Entry Level
Family Life
Simple Life
Active Adult Feature & Location
YOUNG ADULT FAMILY MATUREH
IGH
MID
DLE
LOW
INC
OM
E (L
OW
–H
IGH
)
LIFESTAGES
Feature&
Location

1Q16 Dallas-Fort Worth Housing Market Update Copyright Metrostudy 2016 | April 27, 2016 43
Dallas/Fort Worth Market Active Adult – Feature & Location
76016
76012
76013
76015
76011
10% of all households in the U.S.
Well educated, middle to upper class adults nearing or in retirement with
fairly active lifestyles including travel and entertainment
Average age of 67
48% are still full time employed
Above average home ownership—75%
Home values mainly between $100,000 and $300,000
This consumer group ranks #1 out of all consumer groups in:
HH Income: $50,000 - $74,999
Served in Armed Forces
Expect a Grandchild to be Born in Next 12 Months
Registered Democrat
Hate Brand Names in TV Shows for Commercial Purposes
Primary Shopper Gender: Male

1Q16 Dallas-Fort Worth Housing Market Update Copyright Metrostudy 2016 | April 27, 2016 44
Dallas/Fort Worth Market Active Adult – Elite
76016
76012
76013
76015
76011
6% of all households in the U.S.
The wealthiest active adult households
Average age of 64
59% are still full time employed, mostly as professionals or in management
Average national income of $89,575
Households with the highest rate of home ownership—98%
Wide range of home values, most between $100,000 and $750,000
This consumer group ranks #1 out of all consumer groups in:
Household Income: $75,000 - $99,999
Member: Fraternal Orders (Elks, Masons, Eastern Star)
Retired or Took Early Retirement in Last 12 Months
Grandchild Was Born in Last 12 Months
Somewhat Conservative Political Outlook

1Q16 Dallas-Fort Worth Housing Market Update Copyright Metrostudy 2016 | April 27, 2016 45

1Q16 Dallas-Fort Worth Housing Market Update Copyright Metrostudy 2016 | April 27, 2016 46
Dallas/Fort Worth Market Active Adult Percentage by Zip Code
24.2%
17.9%
19.6%

1Q16 Dallas-Fort Worth Housing Market Update Copyright Metrostudy 2016 | April 27, 2016 47

1Q16 Dallas-Fort Worth Housing Market Update Copyright Metrostudy 2016 | April 27, 2016 48
Dallas/Fort Worth Market Active Adult Percentage by Zip Code
18.3%
17.1%
18.1%
21.8%19.1%

1Q16 Dallas-Fort Worth Housing Market Update Copyright Metrostudy 2016 | April 27, 2016 49

1Q16 Dallas-Fort Worth Housing Market Update Copyright Metrostudy 2016 | April 27, 2016 50
Dallas/Fort Worth Market Active Adult Percentage by Zip Code
19.1%
18.5%
16.1%
21.3%

1Q16 Dallas-Fort Worth Housing Market Update Copyright Metrostudy 2016 | April 27, 2016 51
Dallas/Fort Worth Market Active Adult Product Example
Trilogy at Verde River
Rio Verde, AZ
1,906 sq. ft.
2 Beds
2 Baths
2 Car Garage

1Q16 Dallas-Fort Worth Housing Market Update Copyright Metrostudy 2016 | April 27, 2016 52
Dallas/Fort Worth Market Active Adult Product Example
K. Hov Four Seasons
at Monmouth Woods
Howell, NJ
2,120 sq. ft.
2 Beds
2.5 Baths
2 Car Garage

1Q16 Dallas-Fort Worth Housing Market Update Copyright Metrostudy 2016 | April 27, 2016 53
Dallas/Fort Worth Market Active Adult Product Example
Taylor Morrison
Skyestone
Broomfield, CO
2,404 sq. ft.
2 Beds
2.5 Baths
3 Car Garage

Dallas/Fort Worth MarketExamples of Higher-Density Product
2016 Q1

1Q16 Dallas-Fort Worth Housing Market Update Copyright Metrostudy 2016 | April 27, 2016
Dallas/Fort Worth Market Midtown – Denver, CO
55

1Q16 Dallas-Fort Worth Housing Market Update Copyright Metrostudy 2016 | April 27, 2016
Dallas/Fort Worth Market Midtown – Denver, CO
56
• Developer: Brookfield Residential
• Builders: David Weekley, Brookfield, Century Communities, Infinity
• Location: Denver, CO
• Property: 181.8 Acres
• Product: 1,300 Single Family and Townhomes

1Q16 Dallas-Fort Worth Housing Market Update Copyright Metrostudy 2016 | April 27, 2016
Dallas/Fort Worth Market Midtown – Denver, CO
57
• Builder: David Weekley Homes
• SFD Density: 8.8 units/acre
• Lot Size: 32’ x 80’ (2,560 sq. ft.)
• House Size: 1,582 to 1,896 sq. ft.
• Product: SFD 2/3 Bed; 2.5 bath; 2 Car Garage

1Q16 Dallas-Fort Worth Housing Market Update Copyright Metrostudy 2016 | April 27, 2016
Dallas/Fort Worth Market Midtown – Denver, CO
58
Goldenrod
1,634 sq. ft.
3 Beds
2.5 Baths
2 Car Garage
First Floor Second Floor

1Q16 Dallas-Fort Worth Housing Market Update Copyright Metrostudy 2016 | April 27, 2016 59
Dallas/Fort Worth Market Basecamp SFH – Chicago, IL
1Q16 Dallas-Fort Worth Housing Market Update Copyright Metrostudy 2016 | April 27, 2016 60
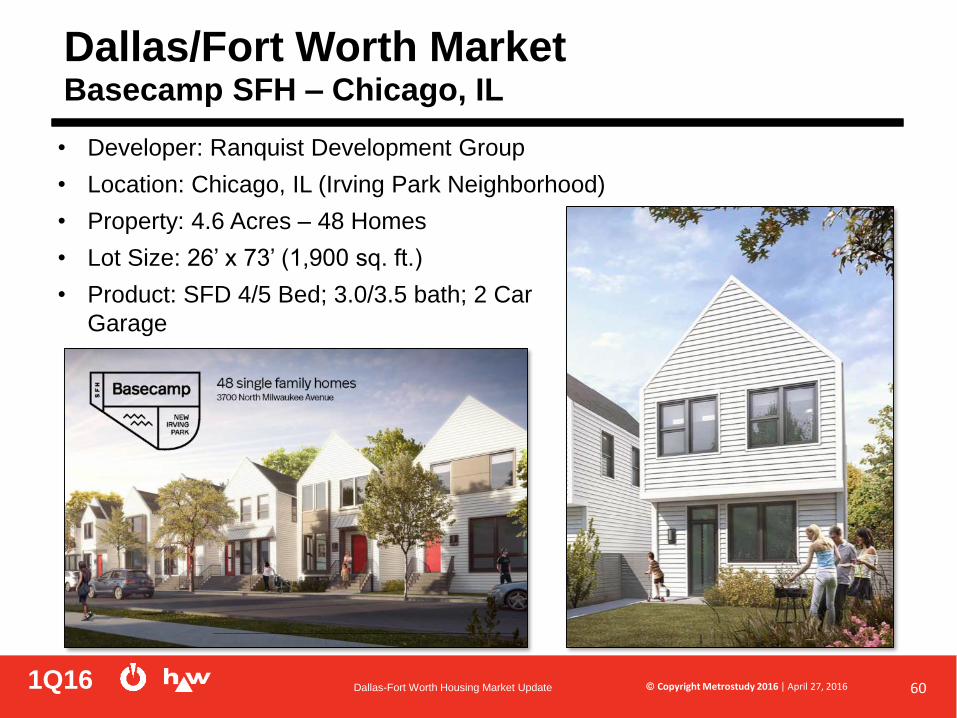
Dallas/Fort Worth Market Basecamp SFH – Chicago, IL
• Developer: Ranquist Development Group
• Location: Chicago, IL (Irving Park Neighborhood)
• Property: 4.6 Acres – 48 Homes
• Lot Size: 26’ x 73’ (1,900 sq. ft.)
• Product: SFD 4/5 Bed; 3.0/3.5 bath; 2 Car
Garage

1Q16 Dallas-Fort Worth Housing Market Update Copyright Metrostudy 2016 | April 27, 2016 61
Dallas/Fort Worth Market Basecamp SFH – Chicago, IL

1Q16 Dallas-Fort Worth Housing Market Update Copyright Metrostudy 2016 | April 27, 2016 62
Dallas/Fort Worth Market Basecamp SFH – Chicago, IL

1Q16 Dallas-Fort Worth Housing Market Update Copyright Metrostudy 2016 | April 27, 2016
Dallas/Fort Worth Market Apricot Station – Hayward, CA (Bay Area)
63

1Q16 Dallas-Fort Worth Housing Market Update Copyright Metrostudy 2016 | April 27, 2016
Dallas/Fort Worth Market Apricot Station – Hayward, CA (Bay Area)
1Q16 Dallas-Fort Worth Housing Market Update Copyright Metrostudy 2016 | April 27, 2016
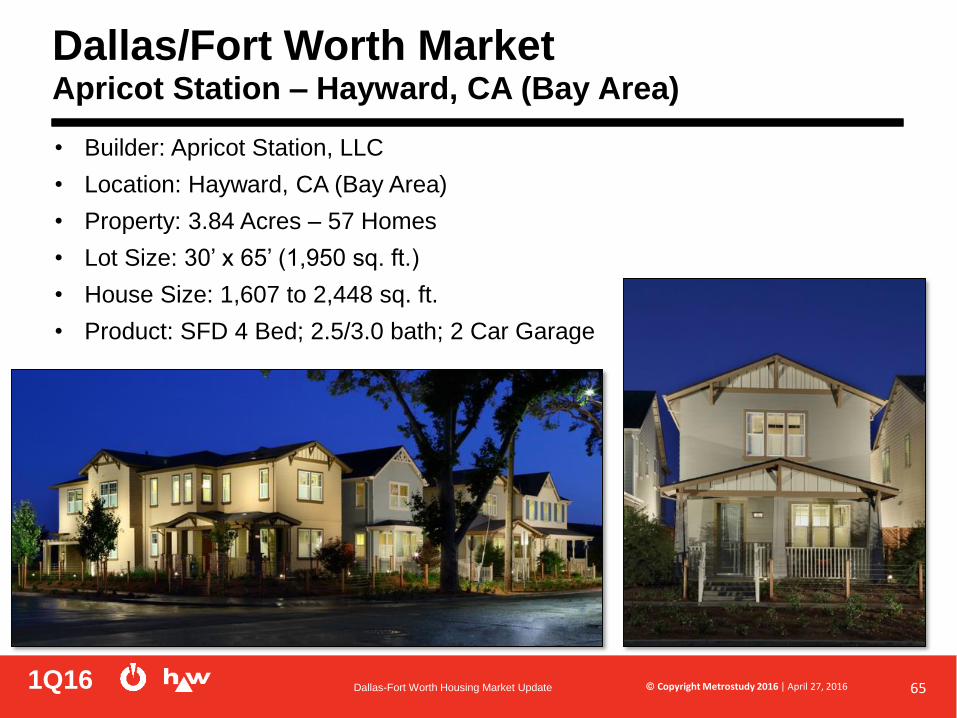
Dallas/Fort Worth Market Apricot Station – Hayward, CA (Bay Area)
65
• Builder: Apricot Station, LLC
• Location: Hayward, CA (Bay Area)
• Property: 3.84 Acres – 57 Homes
• Lot Size: 30’ x 65’ (1,950 sq. ft.)
• House Size: 1,607 to 2,448 sq. ft.
• Product: SFD 4 Bed; 2.5/3.0 bath; 2 Car Garage

1Q16 Dallas-Fort Worth Housing Market Update Copyright Metrostudy 2016 | April 27, 2016
Dallas/Fort Worth Market Apricot Station – Hayward, CA (Bay Area)
66

Dallas/Fort Worth MarketConclusions
2016 Q1
1Q16 Dallas-Fort Worth Housing Market Update Copyright Metrostudy 2016 | April 27, 2016
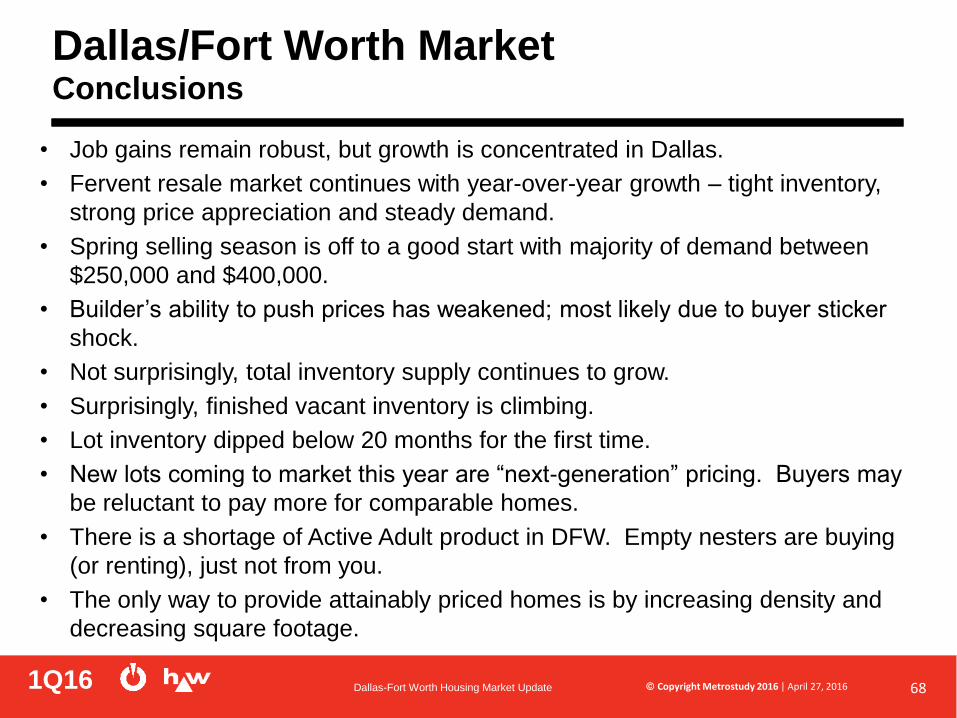
Dallas/Fort Worth Market Conclusions
68
• Job gains remain robust, but growth is concentrated in Dallas.
• Fervent resale market continues with year-over-year growth – tight inventory,
strong price appreciation and steady demand.
• Spring selling season is off to a good start with majority of demand between
$250,000 and $400,000.
• Builder’s ability to push prices has weakened; most likely due to buyer sticker
shock.
• Not surprisingly, total inventory supply continues to grow.
• Surprisingly, finished vacant inventory is climbing.
• Lot inventory dipped below 20 months for the first time.
• New lots coming to market this year are “next-generation” pricing. Buyers may
be reluctant to pay more for comparable homes.
• There is a shortage of Active Adult product in DFW. Empty nesters are buying
(or renting), just not from you.
• The only way to provide attainably priced homes is by increasing density and
decreasing square footage.

…now you know

Thank You to Our SponsorsThank You to Our Sponsors!